
Abstract
In light of issues such as increasing unit nonresponse in surveys, several studies argue that social media sources such as Twitter can be used as a viable alternative. However, there are also a number of shortcomings with Twitter data such as questions about its representativeness of the wider population and the inability to validate whose data you are collecting. A useful way forward could be to combine survey and Twitter data to supplement and improve both. To do so, consent within a survey is first needed. This study explores the consent decisions in three large representative surveys of the adult British population to link Twitter data to survey responses and the impact that demographics and survey mode have on these outcomes. Findings suggest that consent rates for data linkage are relatively low, and this is in part mediated by mode, where face-to-face surveys have higher consent rates than web versions. These findings are important to understand the potential for linking Twitter and survey data but also to the consent literature generally.
This article is part of the SSCR special issue on “Integrating Survey Data and Digital Trace Data” guest edited by Sebastian Stier, Johannes Breuer, Pascal Siegers (GESIS - Leibniz Institute for the Social Sciences) & Kjerstin Thorson (Michigan State University).
Surveys have suffered from a gradual decline in response rates (de Leeuw & de Heer, 2002; Groves et al., 2009). These problems affect longitudinal surveys as well, where initial response rates have fallen, and while wave-on-wave response rates have generally remained relatively high, cumulative attrition can lead to higher overall nonresponse (Jäckle, Al Baghal, Burton, Kaminska, & Lynn, 2018; Schoeni, Stafford, McGonagle, & Andreski, 2013). In addition to the problem of unit nonresponse, those that do participate may not respond to all items, which can be particularly problematic in panel studies, given the focus on studying trends.
In light of issues surveys face such as nonresponse, several studies argue that data sources such as Twitter can substitute or supplement surveys (DiGrazia, McKelvey, Bollen, & Rojas, 2013; O’Connor, Balasubramanyan, Routledge, & Smith, 2011). However, social media data also face issues, including understanding who is producing the data and the ability to explore data from specifically designed measures for a representative sample of the population. This may be particularly problematic for longitudinal studies where understanding microlevel change of key indicators is a significant goal. Given the increasing problems with nonresponse in surveys and the popularity and potential uses of data from social networking sites, adding social media and survey data together is an attractive, but to date, little used possibility (American Association for Public Opinion Research [AAPOR], 2014).
Obtaining and linking survey respondents’ social media to their survey responses could add to the richness of the data available and be used in improving measures and methods for nonresponse adjustment. For example, unit nonresponse may be improved in the instance where a respondent who agrees to link their social media data drops out of the study (other than explicit withdrawal or for reasons making them ineligible), and passive data collection from social media could be continued. This improvement is necessarily limited to those respondents having social media and consenting to link these data, however. This limited sample set is of concern, as nonresponse in surveys can limit the overall observed sample and those using platforms such as Twitter are a relatively small portion of the population. Both limitations suggest questions about generalizability, but one of the goals of linking the two data sources in the first instance is to test the extent that the different sources supplement the other and to identify and potentially reduce the limitations of both.
Before any linkage between survey and social media data can be done, respondents must consent to this linkage and provide their social media identifier. This study explores the feasibility of linking Twitter social media data to survey responses by analyzing this initial and crucial component. Most research that studies consent to link external data to surveys employ results from one study. In this study, we add to our understanding by employing three surveys representative of the British adult population: the Understanding Society Innovation Panel (IP), the NatCen Panel, and the British Social Attitudes (BSA) survey. The IP and NatCen Panel are panels that asked for consent to link Twitter data at a later than the first wave (both asked in 2017), while the BSA is a cross-sectional survey that asked for consent in 2015.
Background
Twitter in Research
Twitter provides researchers with access to a vast amount of data concerning attitudes, behaviors, and so on. that have been utilized for a wide range of applications including predicting elections (Burnap, Gibson, Sloan, Southern, & Williams, 2016) and user incomes (Preoţiuc-Pietro, Volkova, Lampos, Bachrach, & Aletras, 2015), investigating crime patterns (Williams, Burnap, & Sloan, 2016). However, on its own, Twitter data are a point of consternation for social scientists. Twitter use is not universal, but it is also not insignificant: The studies reported on in this article estimate Twitter usage in the UK adult population of 18.3% in 2015 (BSA) and 21.6% (USIP) or 25.6% (NatCen Panel) in 2017. Further, it is notoriously “data-light” (Gayo-Avello, 2012) with many of the key demographic variables used in social scientific analysis such as age, gender, occupation, and class missing—there is a lot of data, but we don’t know who is producing it (Sloan, 2017a).
In response to this challenge, researchers have endeavored to derive demographic data from the content and metadata of tweets to make the data more useful for academic research, including information on location and language (Graham, Hale, & Gaffney, 2014), gender (Sloan et al., 2013), occupation, social class, and age (Sloan, Morgan, Williams, Edwards, & Burnap, 2015). A difficulty with such derivations is that there is no way of evaluating the accuracy of this information through verification or cross-referencing with another source. Indeed, recent research profiling the British Twitter population using a national probability-based survey demonstrates that the demographic distribution indicated through derived proxies may be inaccurate (Sloan, 2017b).
Linking Twitter and survey data provides an opportunity to verify the accuracy of demographic categorizers and to understand where they are going wrong. We can refine scalable tools for efficient “big data” analysis tested against a gold standard, build improved classifiers, and in turn be more confident (or more realistic) in understanding the power of algorithms to make important social scientific distinctions between groups.
The mirror image of how surveys can enhance our ability to deal with Twitter data is how Twitter can help us to understand survey data. While surveys are often seen as the gold standard in social research, there are a number of possible limitations that can potentially be lessened through the use of social media data. For example, answers to survey questions can be predicted to an extent by social media data (Murphy, Landwehr, & Richards, 2013). This ability to predict suggests the potential for its use in understanding the possible extent of nonresponse bias (AAPOR, 2014) or for nonresponse adjustment, which has been done by other linked administrative data such as health records (Gray et al., 2013; Gorman et al., 2014).
Twitter data could also supplement the survey data through improved measurement or by providing stand-alone measures. Measurement error in surveys, such as the impact of social desirability bias (even for self-completion surveys), is well-documented. For example, underestimations regarding the right-wing vote in the UK stand in sharp contrast to Burnap, Gibson, Sloan, Southern, and Williams’s work (2016) showing significant support for right-wing parties (notably the United Kingdom Independence Party (UKIP)) being expressed on Twitter. Linking the two sources and operationalizing variables similar to those on the survey based on the social media data opens up the possibility of calibration, verification, or challenging of survey estimates. In a similar vein, it is the starkest differences between survey and Twitter data that could provide the most interesting methodological and substantive insights, particularly in longitudinal settings. The locomotive nature of Twitter (Edwards, Housley, Williams, Sloan, & Williams, 2013) and the way that it captures instant reactions to events can add richness to surveys that ask respondents to retrospectively evaluate happenings with the distortion of hindsight.
Consent to Linking External Data to Surveys
In order to collect data from Twitter (or other social media) and link to their survey responses, it is first necessary to obtain consent from the survey respondent, not only for ethical consideration but to obtain an identifier with which to access their data. Linking additional sources of data to survey responses is increasingly used to expand and enhance available information for analysis and address issues with nonresponse (e.g., Al Baghal, 2016; Eisnecker & Kroh, 2017; Korbmacher & Schroder, 2013; Sakshaug, Couper, Ofstedal, & Weir, 2012; Sala, Burton, & Knies, 2012). However, most previous research on consent has focused on administrative records (e.g., health or education records), and understanding consent to other data sources is needed if the use of those data is to be explored.
Generally, decisions on whether or not to give consent within a survey can be understood in frameworks similar to the decision to complete the survey in the first instance (Al Baghal, 2016; Korbmacher & Schroder, 2013). These frameworks suggest that multiple factors influence the decision to consent to a request or not, not only from the respondent but also the respondent’s environment and the survey features. Many studies asking for consent to link administrative records to survey data have found that, like the survey request itself, a substantial portion of the sample do not affirmatively respond, possibly introducing a consent bias. Reported rates of consent vary widely (see da Silva et al., 2012, Kho, Duffett, Willison, & Brouwers, 2009; Sakshaug et al., 2012, for reviews), from as low as 19.0% (McCarthy, Shatin, Drinkard, Kleinman, & Gardner, 1999) to as high as 96.5% (Rhoades & Fung, 2004). Further, consent rates apparently vary by which types of records are being requested (e.g., health, benefits, tax) and can vary by respondent characteristics, though not always in a consistent manner. For example, several studies have found women were less likely to consent (Knies, Burton, & Sala, 2012; Sala et al., 2012), others have found females were more likely to consent (Bryant, Robson, Ullman, Friedenreich, & Dawe, 2006; Dunn, Jordan, Lacey, Shapley, & Jinks, 2004), while others have found no differences between sexes (Korbmacher & Schroder, 2013; Sakshaug et al., 2012; Sakshaug, Tutz, & Kreuter, 2013).
Design features such as mode have been found to impact a number of survey outcomes, although less is known about the impact of mode on consent in surveys. One study has directly compared consent rates across modes, finding lower consent rates and higher consent bias in self-administered surveys compared to those administered by interviewers (Sakshaug, Hülle, Schmucker, & Liebig, 2017). While some respondent characteristics were found to be related to consent outcomes, none of these relationships were differentially impacted by survey mode. Similarly, recent qualitative evidence suggests that face-to-face interviews may lead to higher consent rates than web surveys (Thornby, Calderwood, Kotecha, Beninger, & Gaia, 2017). However, more evidence is needed to understand the impact of mode on consent rates, particularly in the context of social media data as different types of consent requests lead to different outcomes and may be affected by mode differentially.
In particular, there are theoretical considerations and empirical findings suggesting that requests to link social media such as Twitter to surveys may be influenced by the mode of completion differently than other requests. Respondents using an online survey mode are more likely to be more frequent and adept Internet users and as such may have greater preferences for response in that mode (Al Baghal & Kelley 2016; de Leeuw, 2005; Jäckle, Lynn & Burton, 2015). As more frequent Internet users, web respondents are more likely to be Twitter users than respondents in other modes, which may increase their comfort with and understanding of Twitter. Similarly, attitudes to data security and privacy concerns reflected in choosing to respond to a web survey may be associated with consent decisions regarding linking additional data to survey responses. Willingness to respond to a web survey is related to fewer security concerns (Manfreda et al., 2008; Wenz, Jäckle, & Couper 2017). Those consenting to link additional data to survey responses also have lower data privacy concerns (Sakshaug et al., 2012). To the extent that web respondents have lower data security concerns about Internet-based data such as those on social media, they may be expected to be more likely to consent to link their Twitter and survey data.
However, research has also found that those using social media to post personal activity and photographs and using the Internet more frequently are marginally more likely to have concerns regarding usage of their Twitter data for research purposes (Williams, Burnap, & Sloan, 2017). To the extent that greater social media and Internet use increases privacy concerns but increases the chance a person responds to the survey via the web, there should be a negative relationship between web survey response and consent to Twitter linkage.
Additionally, respondents may feel more comfortable or trusting of the survey in the presence of an interviewer, particularly in a longitudinal survey where the same interviewer can visit the same household or person several times (Eisnecker & Kroh, 2017). The impact of mode can be heightened in a longitudinal setting, where findings suggest asking the same consent request at different waves can lead to different outcomes (Sala, Knies, & Burton, 2014). Where mode of response changed across waves, the differences in outcome could be even greater. All of these factors further contribute to the possibility that web respondents will be less likely than those responding in other modes to consent to link their Twitter data to their survey responses.
To date, there is little understanding about the nature of consent to linkage of Twitter and survey data. This study has several research objectives. It is among the first to explore not only consent to Twitter linkage, but how mode impacts these consent outcomes within and across several studies. The study also explores differences of respondent characteristics beyond mode of survey response to identify how these mediate any impact of mode and to identify potential linkage biases.
Data and Method
Data come from three surveys: the 2015 BSA survey, the July 2017 wave of the NatCen Panel, and the 2017 tenth wave of the Understanding Society IP10.
BSA (2015)
The BSA is a cross-sectional survey designed to yield a representative sample of British adults aged 18 or over. The survey has been conducted since 1983, with new samples drawn every year. In its 2015 wave, households were selected in a three-stage design, using the Postcode Address File, a list of addresses (or postal delivery points) compiled by the UK Post Office. The achieved sample size was 4,328, with a response rate of 51.0% (for further technical details, see Curtice, Phillips, & Clery, 2016). All interviews were conducted face-to-face by an interviewer, through computer-assisted personal interviewing (CAPI). As part of this interview, all respondents were asked whether they had a personal Twitter account or not. If the respondent indicated they had a Twitter account, they were asked whether they would consent to link their Twitter data to their survey responses (see Appendix A located in the Online Supplement to this article for wording). If the respondent consented to this request, they were then asked to provide their Twitter username.
NatCen Panel (July 2017)
The NatCen Panel is a probability-based mixed-mode panel designed to be representative of the British adult (18+) population. Panel members were recruited from respondents completing BSA cross-sectional surveys, with the July 2017 wave using panel members recruited from the 2015 and 2016 waves. All respondents were invited to participate in the panel; hence, the sampling design is based on those of the BSA described above. The July 2017 wave was the ninth fieldwork wave of the NatCen Panel since November 2015, which had been held at irregular intervals (no more than one in any month) to address specific research issues.
The NatCen Panel employs a sequential mixed-mode design, where panel members are first invited to participate in the research online (using multiple points of contact by post, e-mail, and text) before being contacted by telephone, using computer-assisted telephone interviewing (CATI), if they had not yet completed the interview after 2 weeks (where telephone numbers were available). Respondents could complete the web survey via any device; however, device of completion data is not currently available. Fieldwork lasts about 1 month, and respondents can complete online during any point of the fieldwork (for further technical details, see Jessop, 2018).
For the July 2017 NatCen Panel, where the consent to Twitter linkage was asked, all panel members that had not left the panel in previous waves (through request, death, or moving out of the country) were asked to complete the survey. The achieved sample size was 2,184, with 1,796 completing on the web (82.2%) and the remaining 388 (17.8%) completing via the telephone. The survey response rate, that is, the proportion of participants invited to take part completing the survey, was 59.6%. The overall response rate, that is, the participation from the original sample frame using the proportion of participants eligible to be interviewed for the BSA, was 14.7%.
The questions used in the NatCen Panel were based on that used in the IP (which went to field slightly earlier). First, the survey asked if a respondent had a Twitter account or not. For those who did, they were then asked for consent to link their Twitter data to survey responses (see Appendix A located in the Online Supplement). In addition to this, help text was available to the interviewer on screen if questions were asked. This help text was also available to web respondents via hyperlinks. The additional text explained what data would be collected from the Twitter account, what the data would be used for, who would have access to the data, and information about how the data would be kept secure (full help text in Appendix A located in the Online Supplement). If the respondent consented to this request, they were then asked to provide their Twitter username.
Since members of the 2015 BSA were invited to join the NatCen Panel, some respondents were asked about having a Twitter account and for consent to link their Twitter data twice, albeit with different question wording and in different survey contexts. Even with reduced numbers, insight can be gained about how consent has changed between waves, only explored in one other identified study (Sala et al., 2014). No study identified has explored the possible change in consent across changes in mode, which is possible here given that all BSA respondents were completed via a face-to-face interview and all NatCen Panel responses were collected via an online telephone interview.
IP Wave 10 (2017)
The 10th wave of the IP began fieldwork in May 2017. The IP is part of Understanding Society: The United Kingdom Longitudinal Household Study. The IP is a vehicle for experimentation regarding aspects of survey design in a longitudinal survey context. It uses a multistage probability sample of persons and households in. At the fourth wave (IP4), seventh wave (IP7), and tenth wave (IP10), refreshment samples were also drawn. Waves are conducted annually, and interviews are attempted with all household members 16 years of age and older (University of Essex, 2018).
All interviews were initially conducted by interviewers, but some moved to sequential mixed-mode web and CAPI design at IP5. Two thirds of households were allocated to the mixed-mode design, while the other third were administered the standard single-mode CAPI design. In the mixed-mode treatment, if any household member did not respond to the web survey within 3 weeks, an interviewer was sent to attempt a face-to-face interview. This allocation has remained largely the same for the original and IP4 refreshment samples, while the IP7 refreshment was allocated to the mixed-mode design at the ninth wave (IP9). Being the first wave it was included in the study, the IP10 refreshment sample was conducted only via the CAPI-only design. For those responding via the web, respondents could access the survey by via PC, tablet, or smartphone. Paradata captured during the survey process show that 60.1% of web respondents completed via a PC (n = 623), 29.1% completed on a tablet (n = 291), and 11.9% did the survey on smartphone (n = 123).
Individual response rates for the IP are calculated as completion rates among those responding at their initial wave of interview. At the initial wave (IP1), conducted in 2008, the individual response rate by IP1 sample members was 52.4%. In 2011, for the IP4 refreshment sample, the initial response rate was 44.1%, and the initial IP7 individual response rate was 24.3% in 2014. The reinterview rates at IP10 for those interviewed at IP1 was 31.2%; for the IP4 refreshment sample, the reinterview rate at IP10 was 48.4%; and the reinterview rate for the IP7 refreshment sample at IP10 was 61.8%.
The question asking for consent to link Twitter data to survey responses was placed early in the survey, following findings in Sakshaug, Tutz, and Kreuter (2013) suggesting early placement increased consent rates. As in the BSA and NatCen Panel, the IP first asked if a respondent had a Twitter account or not. The consent question used was in the same form as the NatCen Panel (see Appendix A located in the Online Supplement).
As with the NatCen Panel, help text was available to the interviewer on screen if questions were asked. This help text was also available to web respondents via hyperlinks. The additional text covered the same areas of information and used similar wording as in the NatCen panel, regarding what data would be collected, data usage, access, and security (full help text in Appendix A located in the Online Supplement). If the respondent consented to this request, they were then asked to provide their Twitter username.
Analysis Methods
Due to security procedures to minimize risks of identification and harm, access to the BSA linkage data was limited to analysis within NatCen Social Research’s secure data facilities. This limited the analyses possible to crosstabulations and tests for differences in bivariate distributions due to software limitations. Consent rates in the BSA were compared across education levels, employment status, income, sex, and age. Education is indicated in three categories (precoded in the available data): higher education degree, professional degree/A levels, and anything lower. Those employed are compared to those who are not, females are compared to males, and age is indicated as a continuous measure in years. Income is categorized by monthly income and is dichotomized as more or less than £1,800 per month, the (precoded) categorization closest to the median earnings in the UK.
Due to similar security procedures, the number of variables available from the NatCen Panel is limited. However, access to NatCen Panel respondent-level data as well as full access to such data in the IP allow for more detailed exploration of consent rates, including through multivariate methods. In analyzing the IP, only the IP1, IP4, and IP7 samples are considered, as the IP10 sample had not been allocated to the mixed-mode design and not comparable in this way.
Besides possession of a Twitter account and consent decisions, data from the NatCen Panel include sex, age, education, employment, household income, and mode. The difference between income measurement in income between the BSA (at the respondent level) and NatCen Panel (household) is due to data availability in the NatCen Panel. Income in the NatCen Panel is divided into quartiles of the respondent distribution, for household income ranges of £0–1,300, £1,301–2,400, £2,401–4,200, and £4,201+. Employment, education, sex, and age are otherwise indicated in the same manner as the BSA. Mode of completion is also dichotomized for web or telephone response.
These variables and coding of NatCen Panel variables are replicated and used in analysis of Twitter consent in the IP, excepting mode includes face-to-face rather than telephone. The data include imputed data for respondents with missing income data, imputing using a number of techniques (Knies, 2016). The imputed data are included in the following analyses, so there are no missing values for income.
The additional variables available in the IP also allow for some control of self-selection into modes in the mixed-mode design, using significant correlates with mode of response in the IP identified in Jäckle, Lynn, and Burton (2015). Urban location and respondents saying there was definitely no chance of responding to a web survey were the only ones identified in Jäckle et al. as jointly significant in predicting web response. However, the chance of responding via the web measure was not included past IP6, and not available for the IP7 sample, so not included. Web use and provision of e-mails were also related to whether everyone in the household completed the survey or not and included in multivariate analyses. These variables also are indicative of Internet usage and are likely related to having a Twitter account or not.
Urban location is dichotomized, urban/nonurban, and Internet use is indicated as a dummy variable, with 1 for those saying they used the Internet every day, 0 for all else. Respondents who provided an e-mail address at any wave were coded 1 and coded 0 if not. Sample status (IP1, IP4, or IP7) is also included, to control for time in sample effects.
Results
BSA
There are 794 respondents in the 2015 BSA indicating they had a Twitter account (18.3%). Given most respondents do not have a Twitter account, an initial problem arises with potential selection bias regarding how well any additional data from these users could represent the overall population. Using the same BSA data, previous research has shown that Twitter users (in Great Britain) are disproportionally male, younger, and more likely to have a professional occupation (Sloan, 2017b). An extension of this problem is related to survey nonresponse, which impacts all data linkage research, as consent is only possible among survey responders. The BSA had a 51% response rate, suggesting that if all Twitter users consented to linkage, only 9.3% of the original sample would have linked data. However, nonresponse is an issue that impacts all surveys and that these types of new data and linkages are trying to address. Those having records or using a particular platform is largely out of researcher control, so the present concern is the possible extent of consent bias among potential observations, for example, survey responders who are Twitter users.
To initially assess this potential consent bias in the BSA, analyses presented in Table 1 show the overall consent rates, as well as by sex, income, employment status, and education for the 791 respondents answering the consent question. For the demographic breakdowns, the sample size for each categorization is presented; some sample sizes differ from the total due to missingness χ2 tests were conducted to identify differences in distributions, and the p values of these tests are also presented.
BSA Twitter Consent Rates, Total, and by Respondent Demographics.
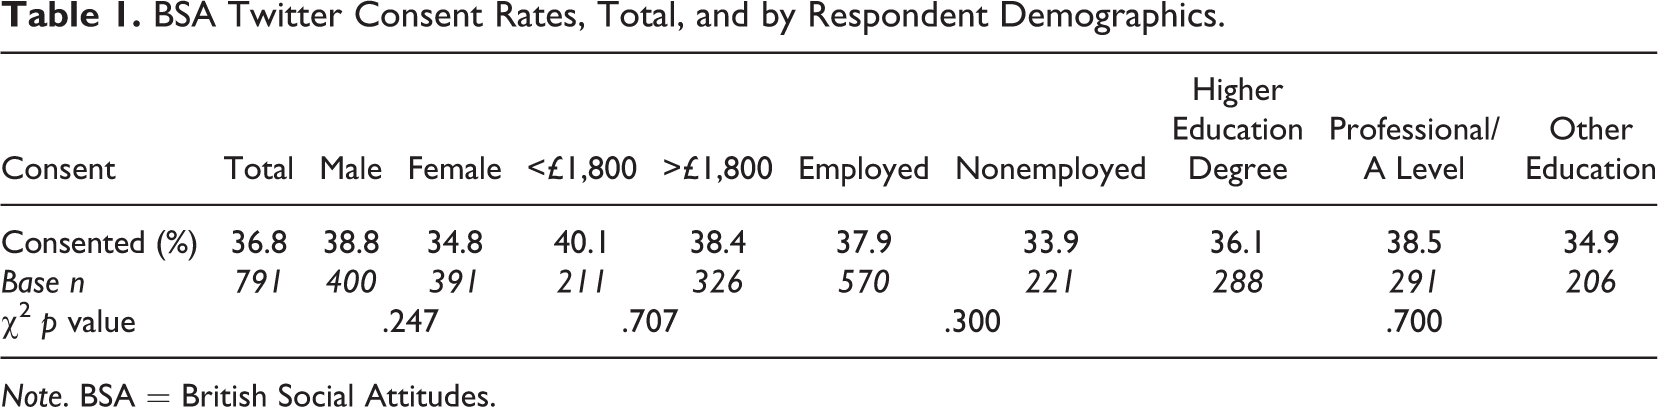
Note. BSA = British Social Attitudes.
The overall consent rate among Twitter users is 36.8% (equating to 291 respondents), and all of the presented demographic breakdowns have similar consent rates. None of the above breakdowns show any significant differences with demographic characteristics. Differences do appear for age: Consenters are significantly younger than nonconsenters, with consenters having a mean age of 37.3, while the mean age of nonconsenters is 41.1, t(789) = −3.64, p < .001.
The relatively low consent rate is problematic as it suggests that any final linked data set may be biased to the extent that Twitter usage differs between consenters and nonconsenters. However, with the exception of age, the lack of differences across demographics is suggestive that nonconsent bias across demographic groups may be minimized. To further understand if the BSA consent rates are similar to other studies and to explore the effects of survey mode, two additional data sets are used.
NatCen and IPs
As might be expected, in both panels, a significantly greater percentage of web respondents have a Twitter account than those interviewed by an interviewer. In the NatCen Panel, 27.8% (n = 497) of respondents reported having a Twitter account, compared to 15.7% (n = 61) of telephone respondents (
Consent to link their Twitter data to their survey responses was asked of the respondents indicating having an account in both the NatCen Panel and IP. Table 2 presents the consent rates overall and across mode of response for each of these two surveys. The table also presents how many cases consented, to show the possible size of a linked data set, and significance tests between modes for consent rates.
NatCen and IP Twitter Consent Rates, by Mode.
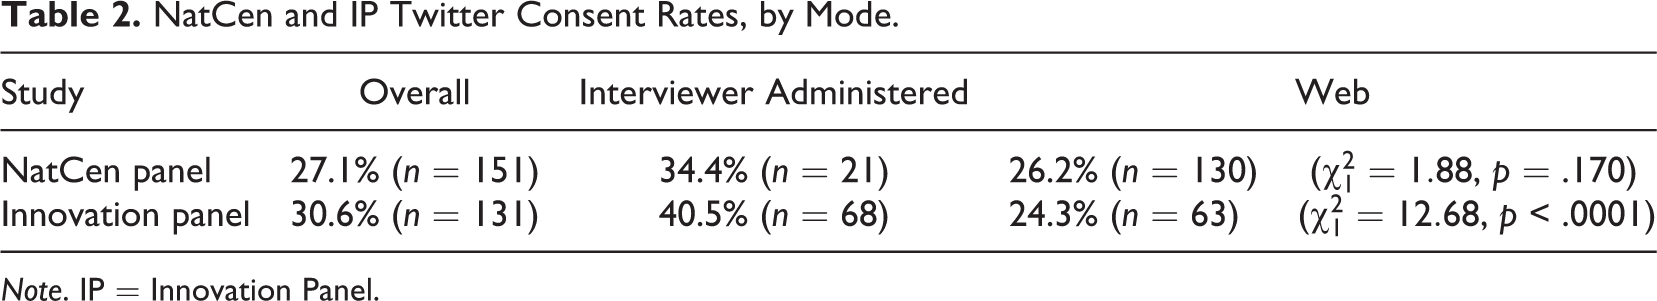
Note. IP = Innovation Panel.
Consent rates are similar across studies and are similar to those found in the 2015 BSA and the Murphy, Landwehr, and Richards’s (2013) study, which achieved a 26.8% consent rate. It seems apparent that Twitter users are generally not inclined to link their survey data to their Twitter information.
Table 2 also shows that the interviewer-administered designs produce higher consent rates than the web designs. The results across modes are quite similar to consent rates in single mode surveys of the same mode. Interviewer-administered versions of the IP and NatCen Panel have consent rates more similar to the CAPI-administered BSA (36.8%), while the Internet versions are more similar to the web-conducted study by Murphy et al. (2013; 26.8%). However, the observed differences across modes are not statistically significant in both studies. In particular, the CAPI design in the IP led to significantly higher consent rates, but the CATI design in the NatCen Panel led to directionally, but not significantly, higher consent. Part of this may be due to the small number of cases in the CATI design of the NatCen Panel. However, the difference is nearly twice as large between modes in the IP (16.2%) than found in the NatCen Panel (8.2%), which may also explain the lack of statistical significance in the latter. If consent decisions can be explained in similar frameworks as survey response (e.g. Al Baghal, 2016), then it follows that CAPI may achieve higher consent rates than CATI (Bowling, 2005). The impact of mode (or lack thereof) on consent may also be related to the impact of other variables.
To explore these relationships, logistic regression models were run predicting consent to Twitter linkage in both the IP and the NatCen Panel. The models use the same set of demographics of initial interest as well as mode; the IP also includes indicators found important in understanding possible selection into mode (Jäckle et al. 2015). Table 3 presents the odds ratios estimated by these models.
Odds Ratios for Consent to Twitter Linkage, NatCen, and Innovation Panels.
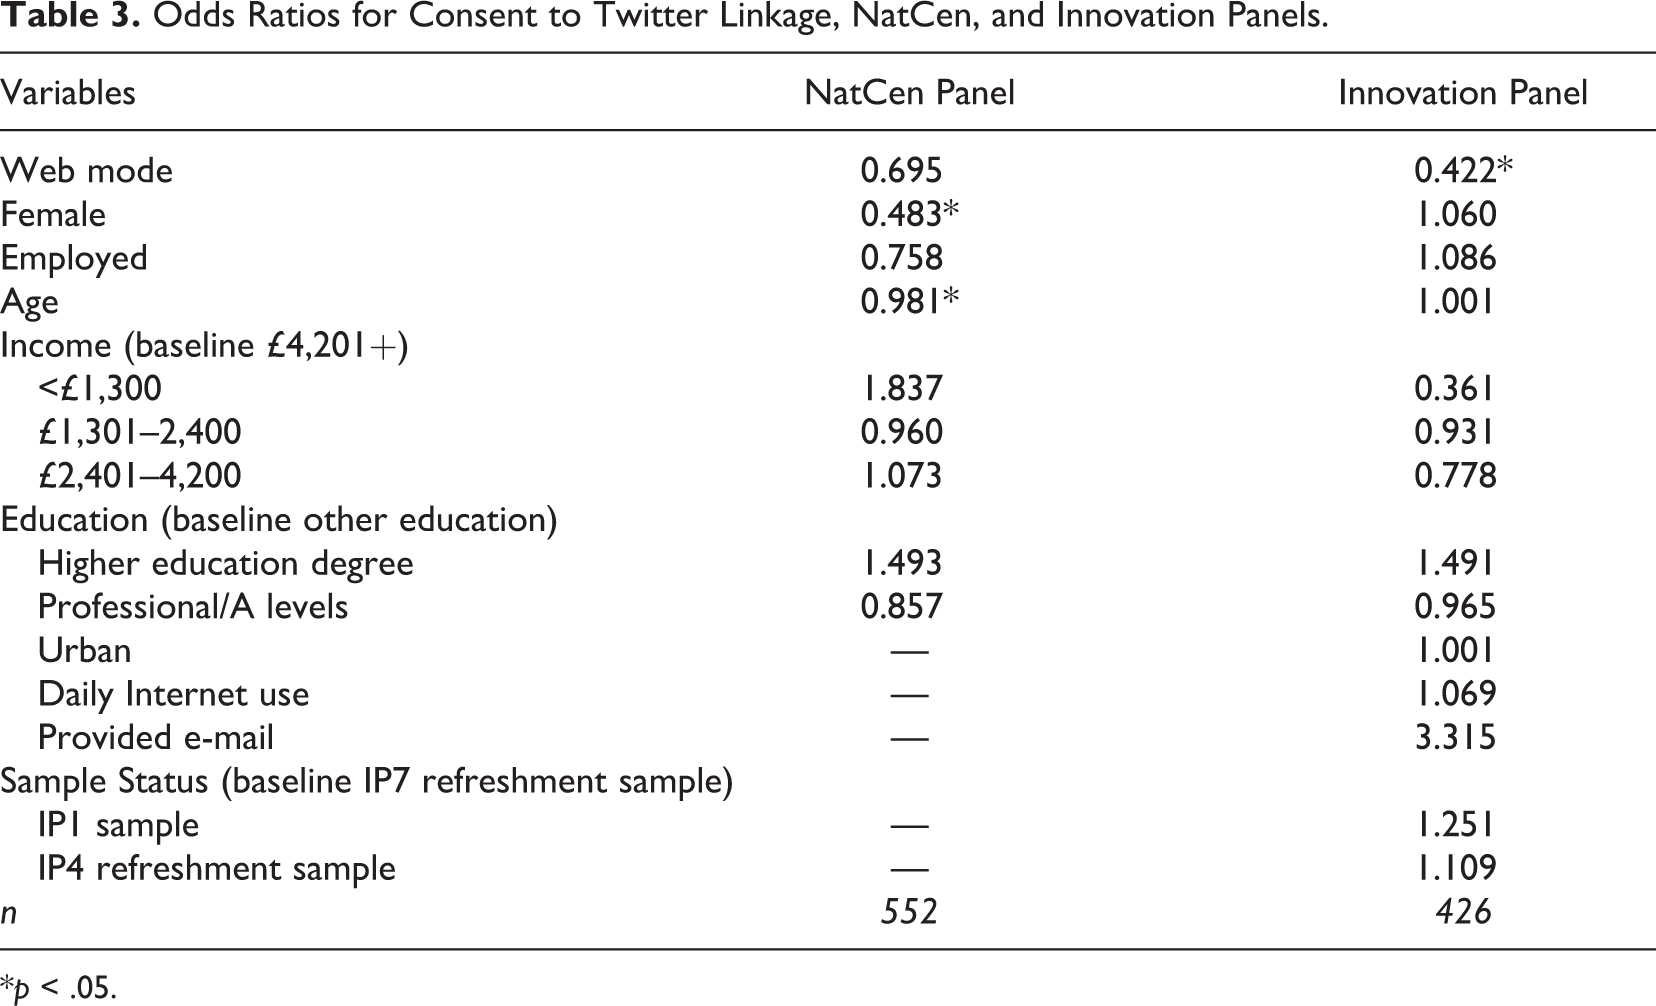
*p < .05.
The results of the multivariate analysis for both data sets mirror the findings the bivariate results. In the NatCen Panel, females and older respondents are significantly less likely to consent to link their Twitter data. No other indicators have statistically significant relationships with consent. Similarly, only one measure is significantly related to consent on the IP, with web respondents being significantly less likely to consent than CAPI respondents. This relationship persists even after adding controls intended in part to control for potential self-selection into survey modes.
The odds ratio for web response in the NatCen Panel directionally points in the same direction that web response reduces the likelihood of consenting to Twitter linkage even after controlling for other possibly related variables. It is possible that the lack of significance is to do with the relatively small cell sizes. Another possibility is that presence of an interviewer increases chances for consent, but as has been found for survey nonresponse, telephone acquiescence falls between face-to-face and web interviewing. The unique nature of the NatCen Panel where some respondents have been asked Twitter consent twice, always in different modes, allows for an initial exploration of this possibility.
Change Between BSA and NatCen Panel
As outlined above, the NatCen Panel recruited its sample partly from the 2015 BSA respondents; hence, the respondents were asked about having a Twitter account twice. Those who said they had a Twitter account at both time points were also asked for consent twice. BSA respondents who said they had a Twitter account at only one of the surveys were only asked to consent once, and so no change was indicated. As well as exploring changes in consent rates within respondents across surveys, it is also useful to measure the change in reporting having an account at both time points. The top portion of Table 4 presents the comparison of Twitter usage within respondents across surveys, while the bottom does the same for consent rates.
Change in Twitter Usage and Consent Between BSA and NatCen Panel.
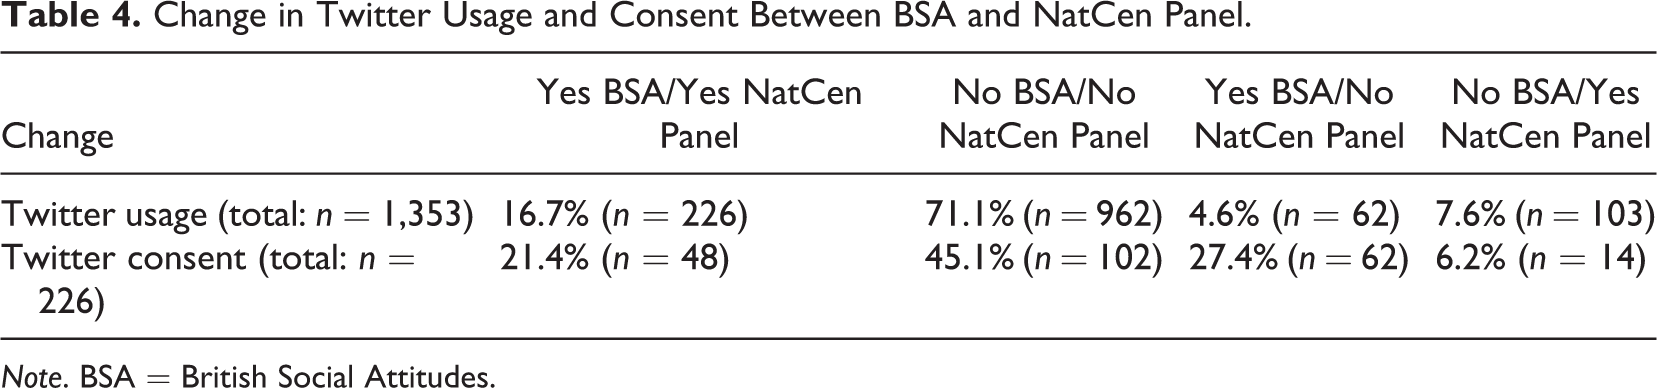
Note. BSA = British Social Attitudes.
In terms of usage, there is a net gain, as may be expected over time. However, it is interesting to note that of the people having a Twitter account in the BSA and taking the July 2017 NatCen survey (n = 288), 21.5% (n = 62) reported they did not use Twitter (see first and third columns of Twitter usage in Table 4). This finding is interesting because to date there have not been any quantitative indicators of cessation of Twitter use, although there has been speculation about this possibility.
There were 226 respondents (16.7%) interviewed at both points that indicated they had a Twitter account. These respondents were therefore asked consent to link their Twitter data in both surveys. The largest percentage declined consent both times, 45.1%, while another 21.4% consented at both times, meaning 66.5% of respondents who were asked both times gave the same decision. That also means that 33.5% of respondents gave different answers during the two surveys. This change mostly occurred with respondents changing their positive consent in the BSA to declining consent in the NatCen Panel. After those saying no at both surveys, the second largest outcome was saying yes at the BSA and no at the NatCen Panel, leading to a relatively large net loss in consents among those asked in both surveys.
Breaking down these changes in consent by mode is made somewhat difficult by the small number of telephone cases; of the 226 cases asked consent in both surveys, only 25 were asked by telephone in the NatCen Panel. Still, the limited available evidence does suggest that web respondents are more likely to change consent decisions and do so in the negative direction. Of the 201 web respondents at the NatCen Panel asked both consents, 29.4% (n = 59) consented in the BSA but declined in the NatCen Panel. Only 6.0% (n = 14) said no in the BSA and yes in the NatCen Panel, while 43.8% (n = 88) said no both times, and 20.9% (n = 42) said yes both times.
Comparatively (albeit with small numbers), 12.0% (n = 3) of telephone respondents changed their consent from positive in the BSA to negative in the NatCen Panel; 8.0% (n = 2) declined in the BSA but consented in the NatCen Panel; 56.0% (n = 14) said no at both surveys; and 24.0% (n = 6) said yes both times. Looking at change in response overall (in any direction), 20% (n = 5) of telephone respondents changed consent decisions over the two surveys. Web respondents provided a different consent decision from the BSA 35.3% (n = 71) of the time. This difference is marginally significant using a right-tailed Fisher exact test (p = .093), suggesting that web respondents may really be changing decisions at a significantly higher rate.
Discussion
Twitter is seen as a potentially useful source of data, and its linkage to survey data provides a number of interesting opportunities for researchers. However, before any of these opportunities can be explored, respondents must consent to link their Twitter data to their survey responses. The present research is the first to explore consent rates to this type of linkage in a systematic manner, over three separate data sets. The use of these data sets allowed for exploration of factors related to consent outcomes, potentially giving insight into the decision-making process but also indicating potential bias.
Results suggest that consent to link Twitter data to survey responses is relatively low, with consent rates ranging from 27.1% to 36.8%. Given that Twitter users account for about 20% of respondents, the linked data sets will be relatively small (depending on the sample sizes of the survey). However, these data can still be used in a variety of manners to enhance data. Not only can survey data be enhanced, but understanding how to use Twitter data as a stand-alone source will be greatly enhanced through this linking. Improving Twitter as a stand-alone source is important as there are fewer issues of numbers or, arguably, consent (if it is considered “public information”), but concerns about validity and generalizability remain.
Few sociodemographic characteristics consistently impacted consent outcomes across data sets, although in two of the data sets (BSA and the NatCen Panel), older respondents were less likely to consent than younger respondents. However, survey mode appears to have an important impact on Twitter consent. CAPI respondents in the BSA and the IP provide higher consent rates than telephone of web surveys. Those choosing to respond via the web are more likely to have a Twitter account but are less likely to consent, particularly compared to a CAPI survey. The NatCen Panel provide further suggestive evidence that mode can have an impact on consent decisions. First, the CATI survey produced higher levels of consent, although the differences are not statistically significant. This lack of significance may be due to the small number of telephone interviews but may also be a differential impact of the interviewer-administered designs. In face-to-face interviews, interviewers can get a “foot in the door,” provide greater motivation, and social norms indicate more of an acquiescent disposition (Bowling, 2005; Tourangeau, Rips, & Rasiniski, 2000). The presence of the interviewer on the telephone carries some of these effects compared to a self-completion survey but less so than in a CAPI survey. Our findings also confirm results from other studies on mode and consent (Sakshaug et al., 2017). Continued exploration of mode effects, whether due to mode of presentation or self-selection into mode of response, is needed in future research.
Second, although there is a net gain in Twitter users among sample members in both the BSA and NatCen Panel, there is a striking net loss in the percentage of consenters among those who reported having a Twitter account at both waves. While not directly testable, this is potentially due to the change in mode for all respondents from face-to-to face in the BSA to web or telephone in the NatCen Panel. That change in consent decisions within respondents appears even stronger for those switching to web mode than telephone mode and provides additional support to the above discussion. However, it cannot be dismissed that this net loss is due to other reasons; for example, respondents’ understanding and concern for data security may have changed between 2015 and 2017. It is also important to note that some respondents stop using Twitter over time, and for this group, the information to link to a longitudinal study will cease. Conversely, given the greater number of new users over time, these results also suggest that consent needs to be asked multiple times (for new users) in a longitudinal study to ensure capturing these potential new data sources.
Any linkage consent requests made in surveys and the subsequent linkage processes have ethical issues to be considered, but how these issues apply to Twitter (or other social media) data are not well explored. The public nature of social media data that makes it accessible to researchers also means that, in their raw form, individuals are identifiable from the data collected. This is problematic as if directly linked to their survey responses, Twitter data would deanonymize the survey responses. Any identifying information, such as Twitter handles and tweet text, would need to be stripped to make the linked data anonymous, but this may in turn limit the utility of the data.
The question arises of how to provide access to linked raw social media data to analysts when anonymization techniques will otherwise negate its usefulness. A number of possibilities exist: secure on-site locations, secure remote access, researcher accreditation/training, and limiting linkage to a data controller, so that no other researcher has access to raw Twitter data and survey responses simultaneously, or the provision of variables derived securely by the field agency may all contribute to enabling ethical and secure data access. Additionally, how these data will be archived and shared with other researchers (e.g., to enable the replication of results or further analysis) without breaking the social media platform’s terms and conditions and the consent agreed to by the respondent needs to be ensured.
An additional note should be made about the finding that there was substantial change in consent across the two requests, including those newly joining the platform over time. It seems desirable to make new consent requests periodically, to ensure better coverage and larger numbers in the data set in a longitudinal study. However, it is not clear whether it is possible or ethical to only ask new users or whether all users be asked. If all users are asked, and a number consented at the first instance but declined at some later instance, the question arises to the status of their data. Can data collected between the two contradicting decisions still be used, or does that mean the data can longer be linked? Clearly, there are numerous possibilities in the usage of linked Twitter and survey data, but many questions remain to be answered.
Finally, several limitations to the present research need to be pointed out and addressed in future research. The largest limitation is one affecting all consent to data linkage research: the issues of survey nonresponse and the existence of the desired linked data. Consent to data linkage is limited to only survey responders, and data may only exist for some subset of these responders. In this particular research, initial nonresponse and panel attrition and the relatively small percentage of Twitter users mean that low consent rates suggest the eventual linked data will be limited in overall numbers and representation of the initial sample. For the reasons outlined above, we still believe that such linkage is worthwhile and useful, especially given that data linkage is partly done to help address nonresponse in survey research (Sakshaug et al., 2012) and is potentially useful even when records are limited to subset of the population (such as education records; Al Baghal, 2016). Our results regarding mode impacts are also limited by potential selection into mode in the sequential mode designs; however, this is an issue facing much of the mixed-mode research (Al Baghal, 2017).
Supplemental Material
Supplemental Material, Albaghal_Online_Supplement - Linking Twitter and Survey Data: The Impact of Survey Mode and Demographics on Consent Rates Across Three UK Studies
Supplemental Material, Albaghal_Online_Supplement for Linking Twitter and Survey Data: The Impact of Survey Mode and Demographics on Consent Rates Across Three UK Studies by Tarek Al Baghal, Luke Sloan, Curtis Jessop, Matthew L. Williams and Pete Burnap in Social Science Computer Review
Footnotes
Authors’ Note
Declaration of Conflicting Interests
The authors declared no potential conflicts of interest with respect to the research, authorship, and/or publication of this article.
Funding
The authors disclosed receipt of the following financial support for the research, authorship, and/or publication of this article: The first author is funded by a research award from the UK Economic and Social Research Council (award no. ES/N00812X/1) for “Understanding Society: the UK Household Longitudinal Study, Waves 9-11.” The remaining authors received no financial support for the research, authorship, and/or publication of this article.
Authors’ Note
Analyses of the BSA data were conducted using a limited license SPSS version as part of NatCen’s secure data access location. The drop-down menus were utilized, and code not written. Analyses of the IP and NatCen Panel data were all analyzed via SAS 9.4. These SAS code for data coding and analyses are located in Appendix B (located in the Online Supplement to this article).
Supplemental Material
Supplemental material for this article is available online.
References
Supplementary Material
Please find the following supplemental material available below.
For Open Access articles published under a Creative Commons License, all supplemental material carries the same license as the article it is associated with.
For non-Open Access articles published, all supplemental material carries a non-exclusive license, and permission requests for re-use of supplemental material or any part of supplemental material shall be sent directly to the copyright owner as specified in the copyright notice associated with the article.