
Abstract
With the rise of mobile surveys comes the need for shorter questionnaires. We investigate the modularization of an existing questionnaire in the Longitudinal Internet Study for the Social Sciences (LISS) Panel in the Netherlands. We randomly divided respondents into a normal length survey condition, a condition where the same survey was split into 3 parts, and a condition where the survey was split into 10 parts. Respondents received the parts consecutively at regular intervals over a 1-month period. We discuss response rates, data quality measures, and respondents’ evaluation of the questionnaire. Our results indicate higher start rates when the survey is cut into smaller parts but also higher dropout rates. However, the fraction of missing information is lower in the 3- and 10-part conditions. More respondents use their mobile phone for survey completion when the survey is shorter. We find fewer item missings and satisficing in shorter surveys. We find no effect on neutral and extreme responding nor on estimates of the validity of answers. People with low and high education and young and old evaluate shorter surveys better than the normal length survey.
Mobile phones are rapidly replacing key tasks formally done on personal computers and laptops. People use mobile phones typically for short messaging, and their use is different compared to communication in other modes of survey administration. Survey practitioners should therefore move to mobile or mobile-friendly surveys and find ways to shorten questionnaires. Most surveys are simply too long for mobiles, resulting in lower data quality (Johnson, 2015), more dropout (Mavletova, 2013), and lower satisfaction with the survey (Lugtig & Toepoel, 2016).
Earlier studies showed that longer surveys lead to decreasing response rates (Galesic & Bosnjak, 2009; Heberlein & Baumgartner, 1978; Yammarino, Skinner, & Childers, 1991), although this finding does not always hold (Bogen, 1996; Lynn 2014). There is also evidence that the longer questionnaires take, the lower data quality becomes (Roberts, Eva, Allum, & Lynn, 2010). Modular surveys have the potential to reduce breakoffs given that each additional question in a web survey has been shown to increase the likelihood of breakoffs (Peytchev, 2009). In addition, modular designs using mobile phones have the potential to increase data quality from the point of view of shortening the survey task and eliminating context effects (West, Ghimire, & Axinn, 2015). Modular survey design is a way to cutdown long survey questionnaires. While modularization is not new to the survey world (Johnson, Kelly, & Stevens, 2012), there is no systematic research on how data chunking is related to mobile and mixed-device surveys. Specifically, there are several ways to modularize: “between respondents,” in which different respondents take each piece, and “within respondent,” in which the same respondent is permitted to take pieces of a survey at different times.
In this article, we modularize an existing questionnaire about Politics and Values in the Dutch LISS Panel. We experimentally assign respondents to a condition in which they receive the questionnaire in 1, 3, or 10 modules. We investigate response rates, dropout, data quality, and respondents’ evaluation of the survey. We end with specific suggestions on when it is a good idea to cut the survey into smaller pieces to make it easier to complete a survey via mobile phones.
Background
Mobile-Friendly Design
An increasing proportion of web surveys are completed on mobile devices. This finding is replicated across countries and type of study. Johnson (2015) shows that around 25% of respondents to an online survey use a mobile device (tablet or phone). De Bruijne and Wijnant (2014a) report about 15% in the Dutch probability-based CentER and LISS Panel. Struminskaya, Weyandt, and Bosnjak (2015) report about 18% using a mobile device in the German Social Science Infrastructure Services (GESIS) Panel. Lugtig, Toepoel, and Amin (2016) show that about 30% of respondents sometimes complete surveys on a mobile device, and about 12% always use a mobile device in the American Life Panel. Toepoel and Lugtig (2015) argue that because of the increased proportion of mobile survey respondents, web surveys should now be thought of as mixed-device surveys. This implies that survey researchers have to design web surveys to be mobile friendly (see, e.g., Revilla, Toninelli, Ochoa, & Loewe, 2016). Although there is increasing interest in how to do this, most of the existing studies have focused on the visual design of mobile-friendly surveys.
A user-friendly design typically uses large buttons or tiles (Arn, Klug, & Kolodziejski, 2015), no scrolling or only down scroll (Johnson, 2015), graphics (Johnson, 2015), no grids (De Bruijne & Wijnant, 2014b), and design for varying screen sizes (see also Couper, Antoun, & Mavletova, 2017). Drop-down menus are a problem in mobile web browsers since they are rendered differently across platforms. They turn into scrolling wheels on iOS and as lists on Android devices. Toepoel and Funke (forthcoming) found no differences between devices for different formats (radio buttons, tiles, sliders, and visual analogue scales). They found that slider bars and visual analogue scales are favored by respondents on mobile phones and tablets. Lugtig and Toepoel (2016) found significant more item missings for mobile phone respondents (12%) compared to tablet (7%) and PC (4%) in the non-optimized Dutch LISS Panel. Toepoel and Lugtig (2014) found no differences between mobile and desktop users with regard to breakoffs, item nonresponse, time to complete the survey, or response effects such as length of answers to an open-ended question and the number of responses in a check-all-that-apply question in the MarketResponse Panel using a mobile-optimized design.
Breakoff rates are typically higher in mobile surveys than in PC web surveys. This goes for mobile-optimized (Buskirk & Andrus 2014; Mavletova 2013), nonoptimized (Poggio, Bosnjak, & Weyandt 2015), and mobile-app surveys (Wells, Bailey, & Link, 2013). Mavletova and Couper (2015) found a 10-min survey increases the odds of breakoffs by 1.09 and a 30-min survey by 1.42 compared to a 5-min mobile web survey in their meta-analysis based on 14 studies (39 independent samples). From earlier studies using web surveys, we also know that survey length affects dropout. Peytchev (2009) argues that each additional question in a web survey increases the likelihood of breakoffs. Galesic and Bosnjak (2009) show that fewer respondents started and completed the questionnaire the longer the stated length of the survey. In addition, answers to questions positioned later in the questionnaire were faster, shorter, and more uniform than answers to questions positioned near the beginning. In conclusion, there is evidence that data quality decreases with survey length, that dropout rates increase with survey length and are higher when respondents complete the survey on a mobile phone, and that an optimized visual design does not solve this issue. Few studies have focused on the possibility of shortening web surveys as a way to make web surveys more mobile friendly. One way to reduce survey length is to use a modular survey design, where the full survey is cut into smaller modules.
Modularization
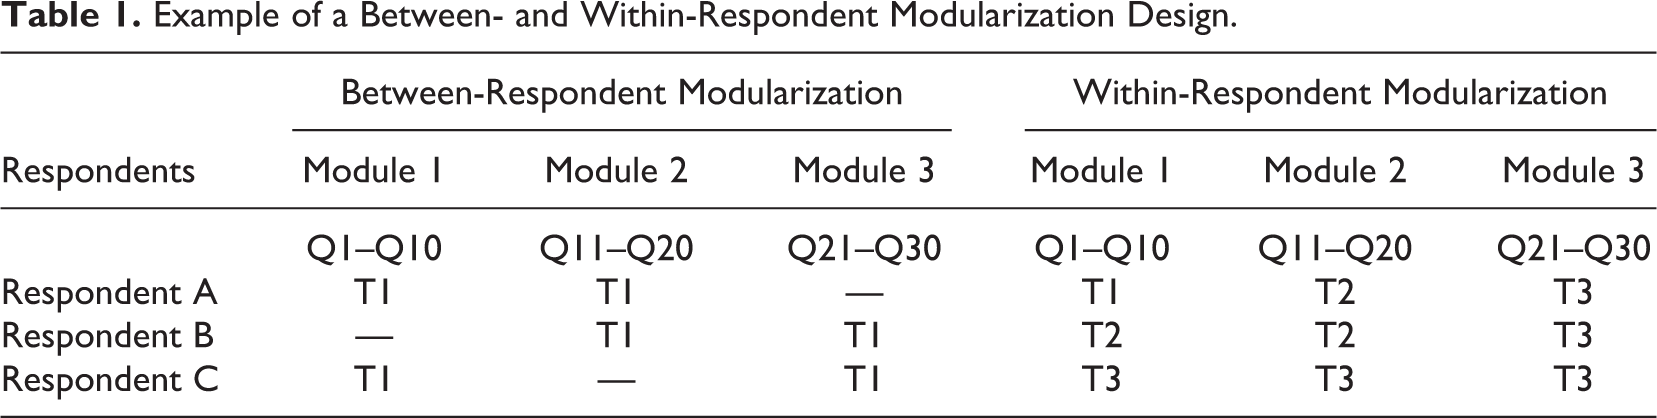
Modularization refers to cutting existing surveys in to smaller parts, chunks, or pieces. There are two general ways to do the modularization: “within respondent,” where the same respondent is permitted to take pieces of a survey at different times and “between respondents,” whereby different respondents take each piece and a larger normal sample size is used to compensate for the missing data (Johnson, Kelly, & Stevens, 2012; Kelly, Johnson, & Stevens, 2013). Table 1 shows an example of a between- and within-respondent modularization design. In the between-respondent modularization, each respondent gets two of the three modules of questions all administered at the same time. In the within-respondent modularization, each respondent answers all questions. Respondent A answers the three modules of questions at three different points in time. Respondent B answers the first two modules at the same point in time, but the last module at another time. Respondent C answers all modules of questions at the same time. Survey researchers can force people into taking the survey at different points in time, for example, by sending out invitations for every module for 3 subsequent days, closing the fieldwork for the first module at the second day, and the second module at the third day. Or, survey researchers can allow respondents to save up the modules and complete them all at the same time (see Respondent C).
Example of a Between- and Within-Respondent Modularization Design.
“Between-respondent” modularization is also known as split questionnaire design. It refers to different sets of items to be collected from different sampling units. The full questionnaire consists of the union of all these split questionnaires. A set of basic (often sociodemographic) questions is posed to all respondents, irrespective of the modules they take, in order to perform the analysis and to have some grounds for imputation or statistical matching. A split questionnaire design is optimal when information loss is minimized without compromising the advantages of completing a comprehensive but lengthy questionnaire (Halder, Bansal, Knowles, Eldridge, & Murray, 2016). Raghunathan and Grizzle (1995) use a Bayesian approach for split questionnaire design, while Chipperfield and Steel (2009) focus on a design-based approach. Ioannidis et al. (2016) propose an optimization involving minimization of respondent burden and data collection cost, while respecting certain design constrains usually encountered in practice such as the level of precision required and dependencies between variables. Difficulties in split questionnaire design arise in the timing and frequency of different surveys, or how to implement rotating panels overlapping in time. A module structure is typically used to generate split questionnaire design. The split design may be generated between modules (each split consisting of selected modules and respondents answer all questions in the module) or within modules (splits are composed of selected questions from each module and respondents answer only those questions; Halder et al., 2016). Adiguzel and Wedel (2008) conclude that the between-module design performs better in terms of reduced completion time and respondent fatigue. Smith, Kotzev, Millar, and Kachhi (2012) find dropout rates to be smaller and enjoyment higher for the split questionnaire design compared to the normal survey. Pollien, Ersnst Stahli, Milbert, Ochsner, and Joye (2018) find no significant differences in representativeness between a split questionnaire design and a normal web version. Missing data can be filled with data imputation (mean imputation, hot decking, multiple regression, expectation maximization, and random forest) or respondent matching (nearest neighbor, cluster analysis). Adiguzel and Wedel (2008) demonstrate that reduced participant burden improves data quality when split questionnaire design is implemented. Halder, Bansal, Knowles, Eldridge, and Murray (2016) show that dropout rates are slightly lower than a full survey and average completion time is approximately 35% shorter compared to the full survey.
The within-respondent approach simply allows respondents to return to a survey at a later point in time, spreading out the burden of the response task over different points in time. It can be difficult to identify appropriate pause points in existing surveys. This depends on the number of questions, modules, and routing in the survey. Within-respondent modularization may hold potential to adapt to the use of mobile devices and the way people use mobile phones for short messaging. Little is known on how within-respondent modularization relates to Total Survey Error (Biemer, 2010). Within-respondent modular design assumes that survey answer do not change substantially over a short period of time. Although “modular” designs may refer to many different types of study designs in different fields, we use West, Ghimire and Axinn’s (2015) definition in that we focus on breaking the survey response task into distinct parts over a short period of time rather than requiring participants to answer the entire survey in one sitting. In this definition of modular design, all respondents eventually have the opportunity to answer all questions, just not in a single sitting.
West et al. (2015) experimented with a long-standing panel survey based on a probability sample in Nepal and cut the standard onetime telephone interview in several chunks offering one question on a given day for 15 consecutive days. Respondents in the modular design found the survey to be significantly easier. Giving survey practitioners continuing effort to battle declining response rates and respondents engagement in surveys, this can be an important advantage of modular survey design. They did not find large differences in response rates between the normal and modular design, due to the highly cooperative character of the Nepalese population (99% in the normal length survey and 94.7% in the modular design). West et al. also experimented with text messages and argue that the recruitment of underrepresented and/or hard-to-reach groups using text messages may be easier than attempting to convince these groups to take longer and more complex web-based or paper surveys. West et al. (2015) call for future research on other modes of data collection (e.g., web surveys) with longer surveys with more content, using a more diverse groups of individuals and different “doses” of questions.
Johnson (2015) shows that desktop and mobile modular design show lower levels of straightlining compared to the full-length survey. The modular desktop version did not show any significant difference for the substantive questions compared to the full-length survey, while the mobile modular design showed some significant differences compared to the full-length survey.
We hypothesize that modular design reduces the burden of the survey task resulting in higher response rates, better data quality, and a more positive evaluation of the questionnaire by respondents. The next section describes how we experimentally test these hypotheses.
Method
The data for our study were collected in the LISS Panel that started in 2007 and is administered by CentERdata (Tilburg University). The LISS Panel consists of almost 8,000 individuals who complete online questionnaires every month. Panel members were recruited based on a simple random sample of addresses from community registers, in cooperation with Statistics Netherlands. Potential respondents were contacted by letter, telephone, or visit; and after an initial interview (recruitment stage), they were asked to become a member of the online panel (which they start with a “profile interview”). Although the LISS Panel is Internet based, it was not necessary to own a personal computer with an Internet connection to participate in the panel, as CentERdata provided the equipment if required. Using the response metrics of Callegaro and Disogra (2008), the recruitment rate (similar to American Association for Public Opinion Research Response Rate 3 (AAPOR RR3), defined as the number of people that agree to join the panel, relative to all people invited) for the LISS Panel is 63%. The profile rate (defined as the number of people who complete the profile interview, relative to all people invited) is 48%. Retention is about 90% a year (Binswanger, Schunk, & Toepoel, 2013). It is noteworthy that respondents in the LISS Panel are paid 15 euros per hour for completing questionnaires (payments are based on an estimate of interview time, needed to fill in the questionnaires). For a more detailed description of the panel, the sample, recruitment, and response, see the website (http://www.lissdata.nl).
We conducted our experiment in the eighth wave of the annual survey Politics and Values. We chose this survey because it consists of all types of questions, grids that might be sensitive to satisficing behavior, and contains little routing, which simplifies the design of separate modules. The codebook of the survey and the data are available at www.lissdata.nl
Three thousand eight hundred and seven LISS Panel members who own a mobile phone with Internet connection were invited to our survey and randomly assigned to: normal-length survey with 1 invitation, survey cut into 3 pieces with 3 separate invitations, and survey cut into 10 pieces with 10 separate invitations.
The order of the modules was kept the same in all conditions. In addition, we experiment with notifications via e-mail and SMS/text. Panel members were, as is usual, invited to the survey by e-mail. In our experiment, we sent a random half of the sample additional invitations and reminders via text messages. The e-mail invitation notified respondents in the modularized conditions that the survey was cut. The following text was added to the experimental conditions: “Note: the questionnaire ‘Politics and Values’ is part of an experiment to investigate how you like the length of the survey. Therefore, this survey is cut into three/ten parts. You will receive a new part next week/the day after tomorrow.” In the next modules, respondents in the experimental conditions received the following introduction text: “The next part of the questionnaire ‘Politics and Values’ is available to you.” Because of the modularization, respondents in the experimental condition received more invitations than the control condition (two more in the 3-part condition and nine more in the 10-part condition). Every module remained available on the website during the entire fieldwork period, so respondents could fill out previous parts of the survey at any moment.
The initial invitation was sent on Monday (November 30, 2015). Subsequent invitations were sent every week (3 pieces condition) and every second weekday (10 piece condition). A reminder was sent to all respondents with uncompleted questions on December 23 (2 days after the last invitation in the 10-piece condition).
Results
Response Rate Across Experimental Conditions
Table 2 shows that cutting the survey in smaller parts increases the number of respondents that started the survey. A logistic regression with questionnaire started as dependent variable and number of parts, additional text message, and their interaction as independent variables shows a significant effect of number of parts (B = .30, p < .01) but no effect of text message (B = .12, p = .60) nor the interaction (B = −.01, p = .95). The start rate for the 1-part condition is 78.6% compared to 82.6% for the 3-part condition and 87.1% for the 10-part condition (χ2 = 31.99, p < .01).
Percentage of Respondent Who Started the Survey, Dropped Out of the Survey, and Completed the Survey.
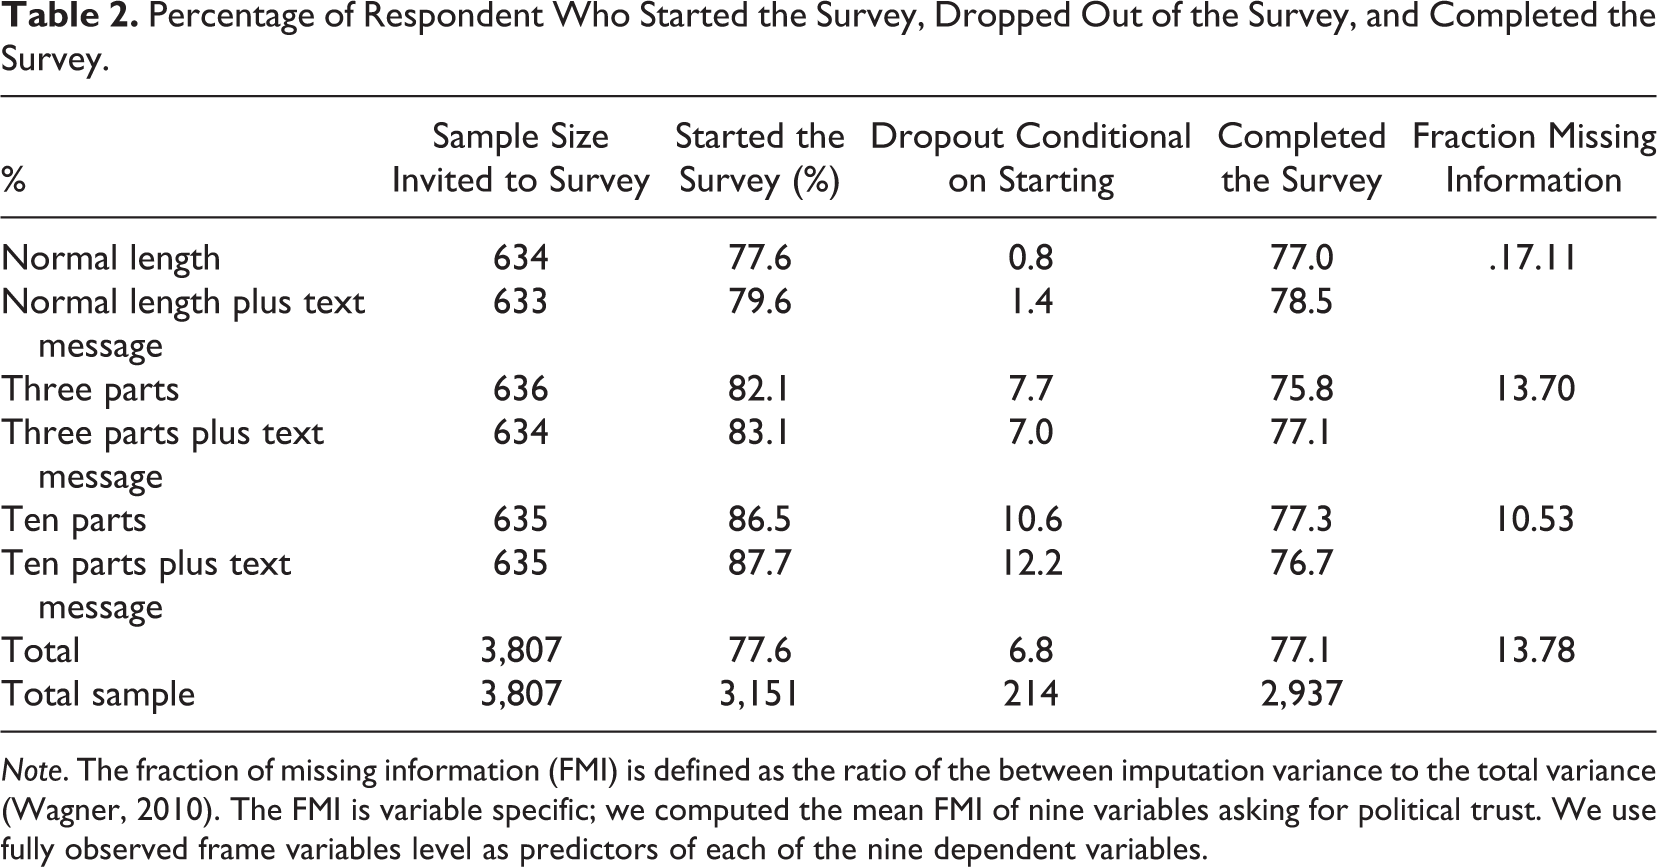
Note. The fraction of missing information (FMI) is defined as the ratio of the between imputation variance to the total variance (Wagner, 2010). The FMI is variable specific; we computed the mean FMI of nine variables asking for political trust. We use fully observed frame variables level as predictors of each of the nine dependent variables.
Table 2 also shows that the dropout rate; the number of respondents that started the survey but did not complete all parts of it, increases with the number of parts. Dropout is 1.1% in the 1-part condition compared to 7.3% in the 3-part condition and 11.4% in the 10-part condition, χ2(df = 2) = 88.37, p < .01.
When we look at the number of completes questionnaires, we see that response rates are similar. The percentage of complete responses for the 1-part survey is 77.7% compared to 76.5% for the 3-part survey and 77.0% for the 10-part survey, χ2(df = 2) = .60, p = .74. Detailed numbers including the text message conditions are available in Table 2. Although we do not find more complete responses across conditions, we still obtain more partial completes available on respondents when the survey is modularized in 10 parts, however. This is reflected in the fraction of missing information (FMI; Wagner, 2010), which indicates the effective proportion of missing data. To calculate FMI, we first imputed all data, accounting for both unit-nonresponse and item-nonresponse by multiple imputation with chained equations (van Buuren, 2012). We used a set of 50 predictor variables that should all relate to political trust and imputed five data sets. Then, we computed FMI for nine possible key dependent variables from our survey, all asking about political trust. As predictors in the calculation of FMI, we used the covariates age, gender, living with a partner, educational level (six categories), and level of urbanicity. This results in 45 FMI coefficients. Across these, the average FMI is about 20% lower in the 10-part condition as compared to the 3 part, and 38% lower than the usual survey (1 part).
Device Used to Complete the Survey
Table 3 presents the device respondents used to complete (parts of the) survey. About 10% completed the normal length survey on a mobile phone, while 12.5% used tablet and 77.3% personal computer. For the 3-part condition, slightly more respondents use their mobile phone for the second and third part of the survey. In the 10-part condition, the percentage of respondents that use their mobile phone increases with every next part of the survey, although the differences are not large. No significant differences are found for the use of tablets or personal computers.
Device Used to Complete (Parts of the) Survey.
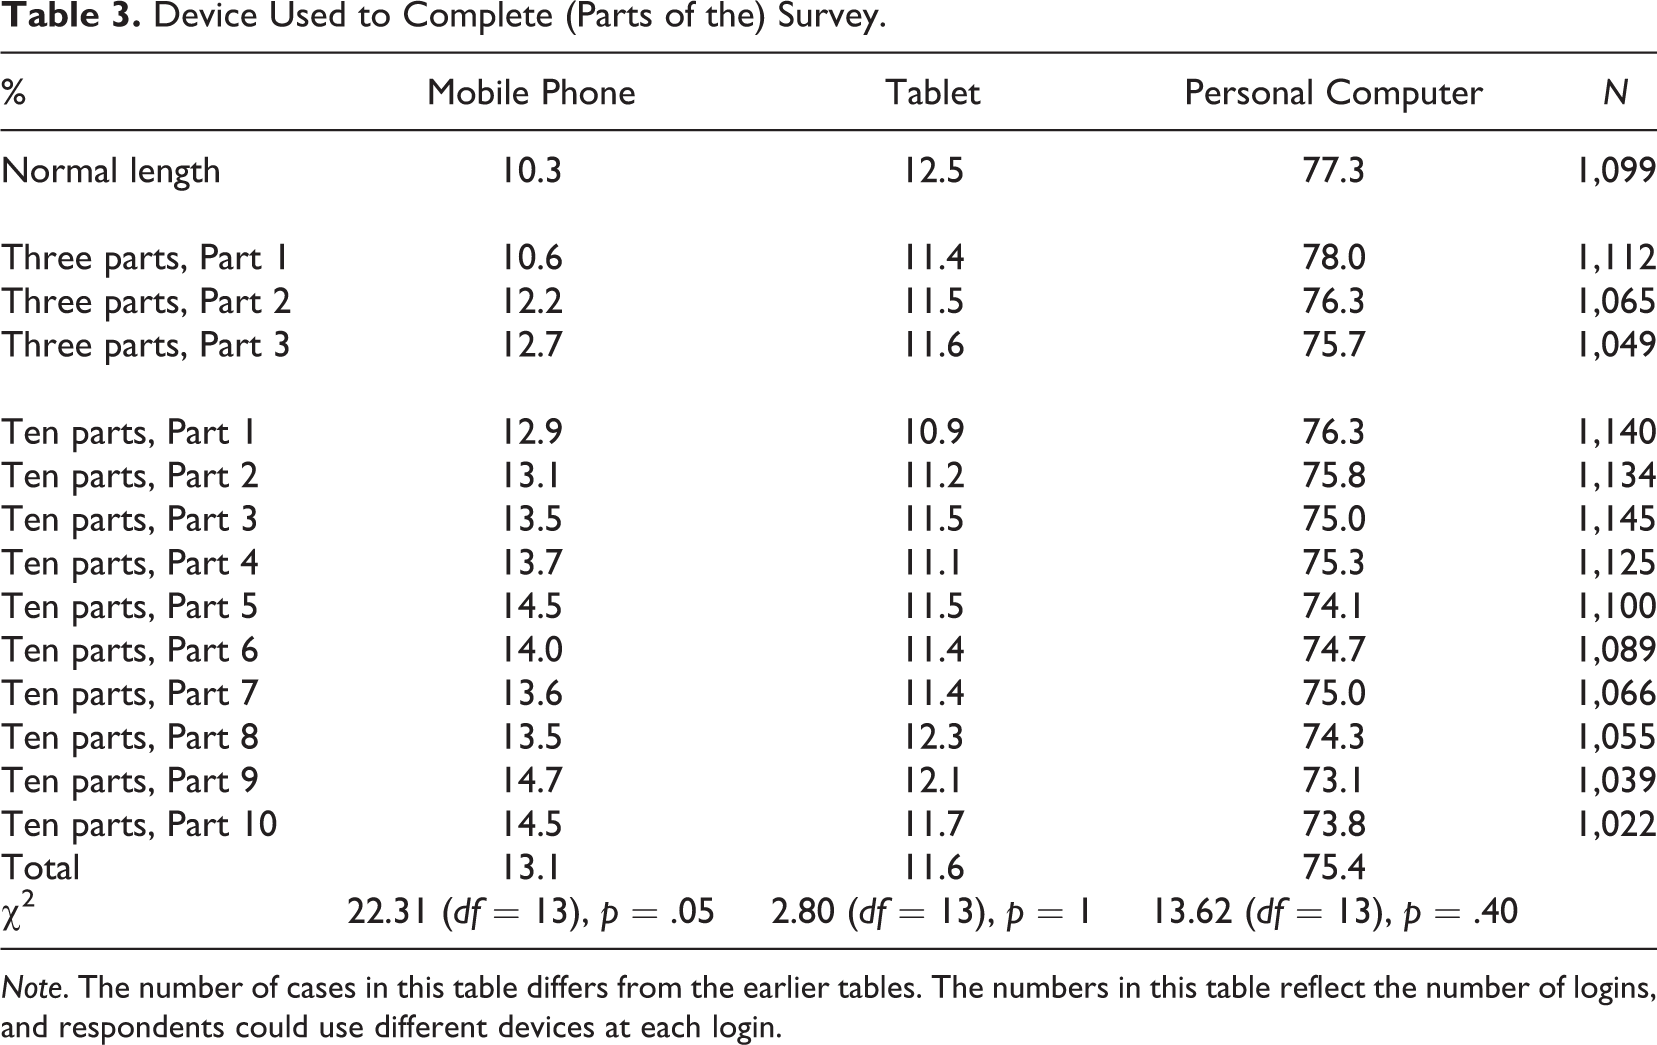
Note. The number of cases in this table differs from the earlier tables. The numbers in this table reflect the number of logins, and respondents could use different devices at each login.
Number of Login Attempts
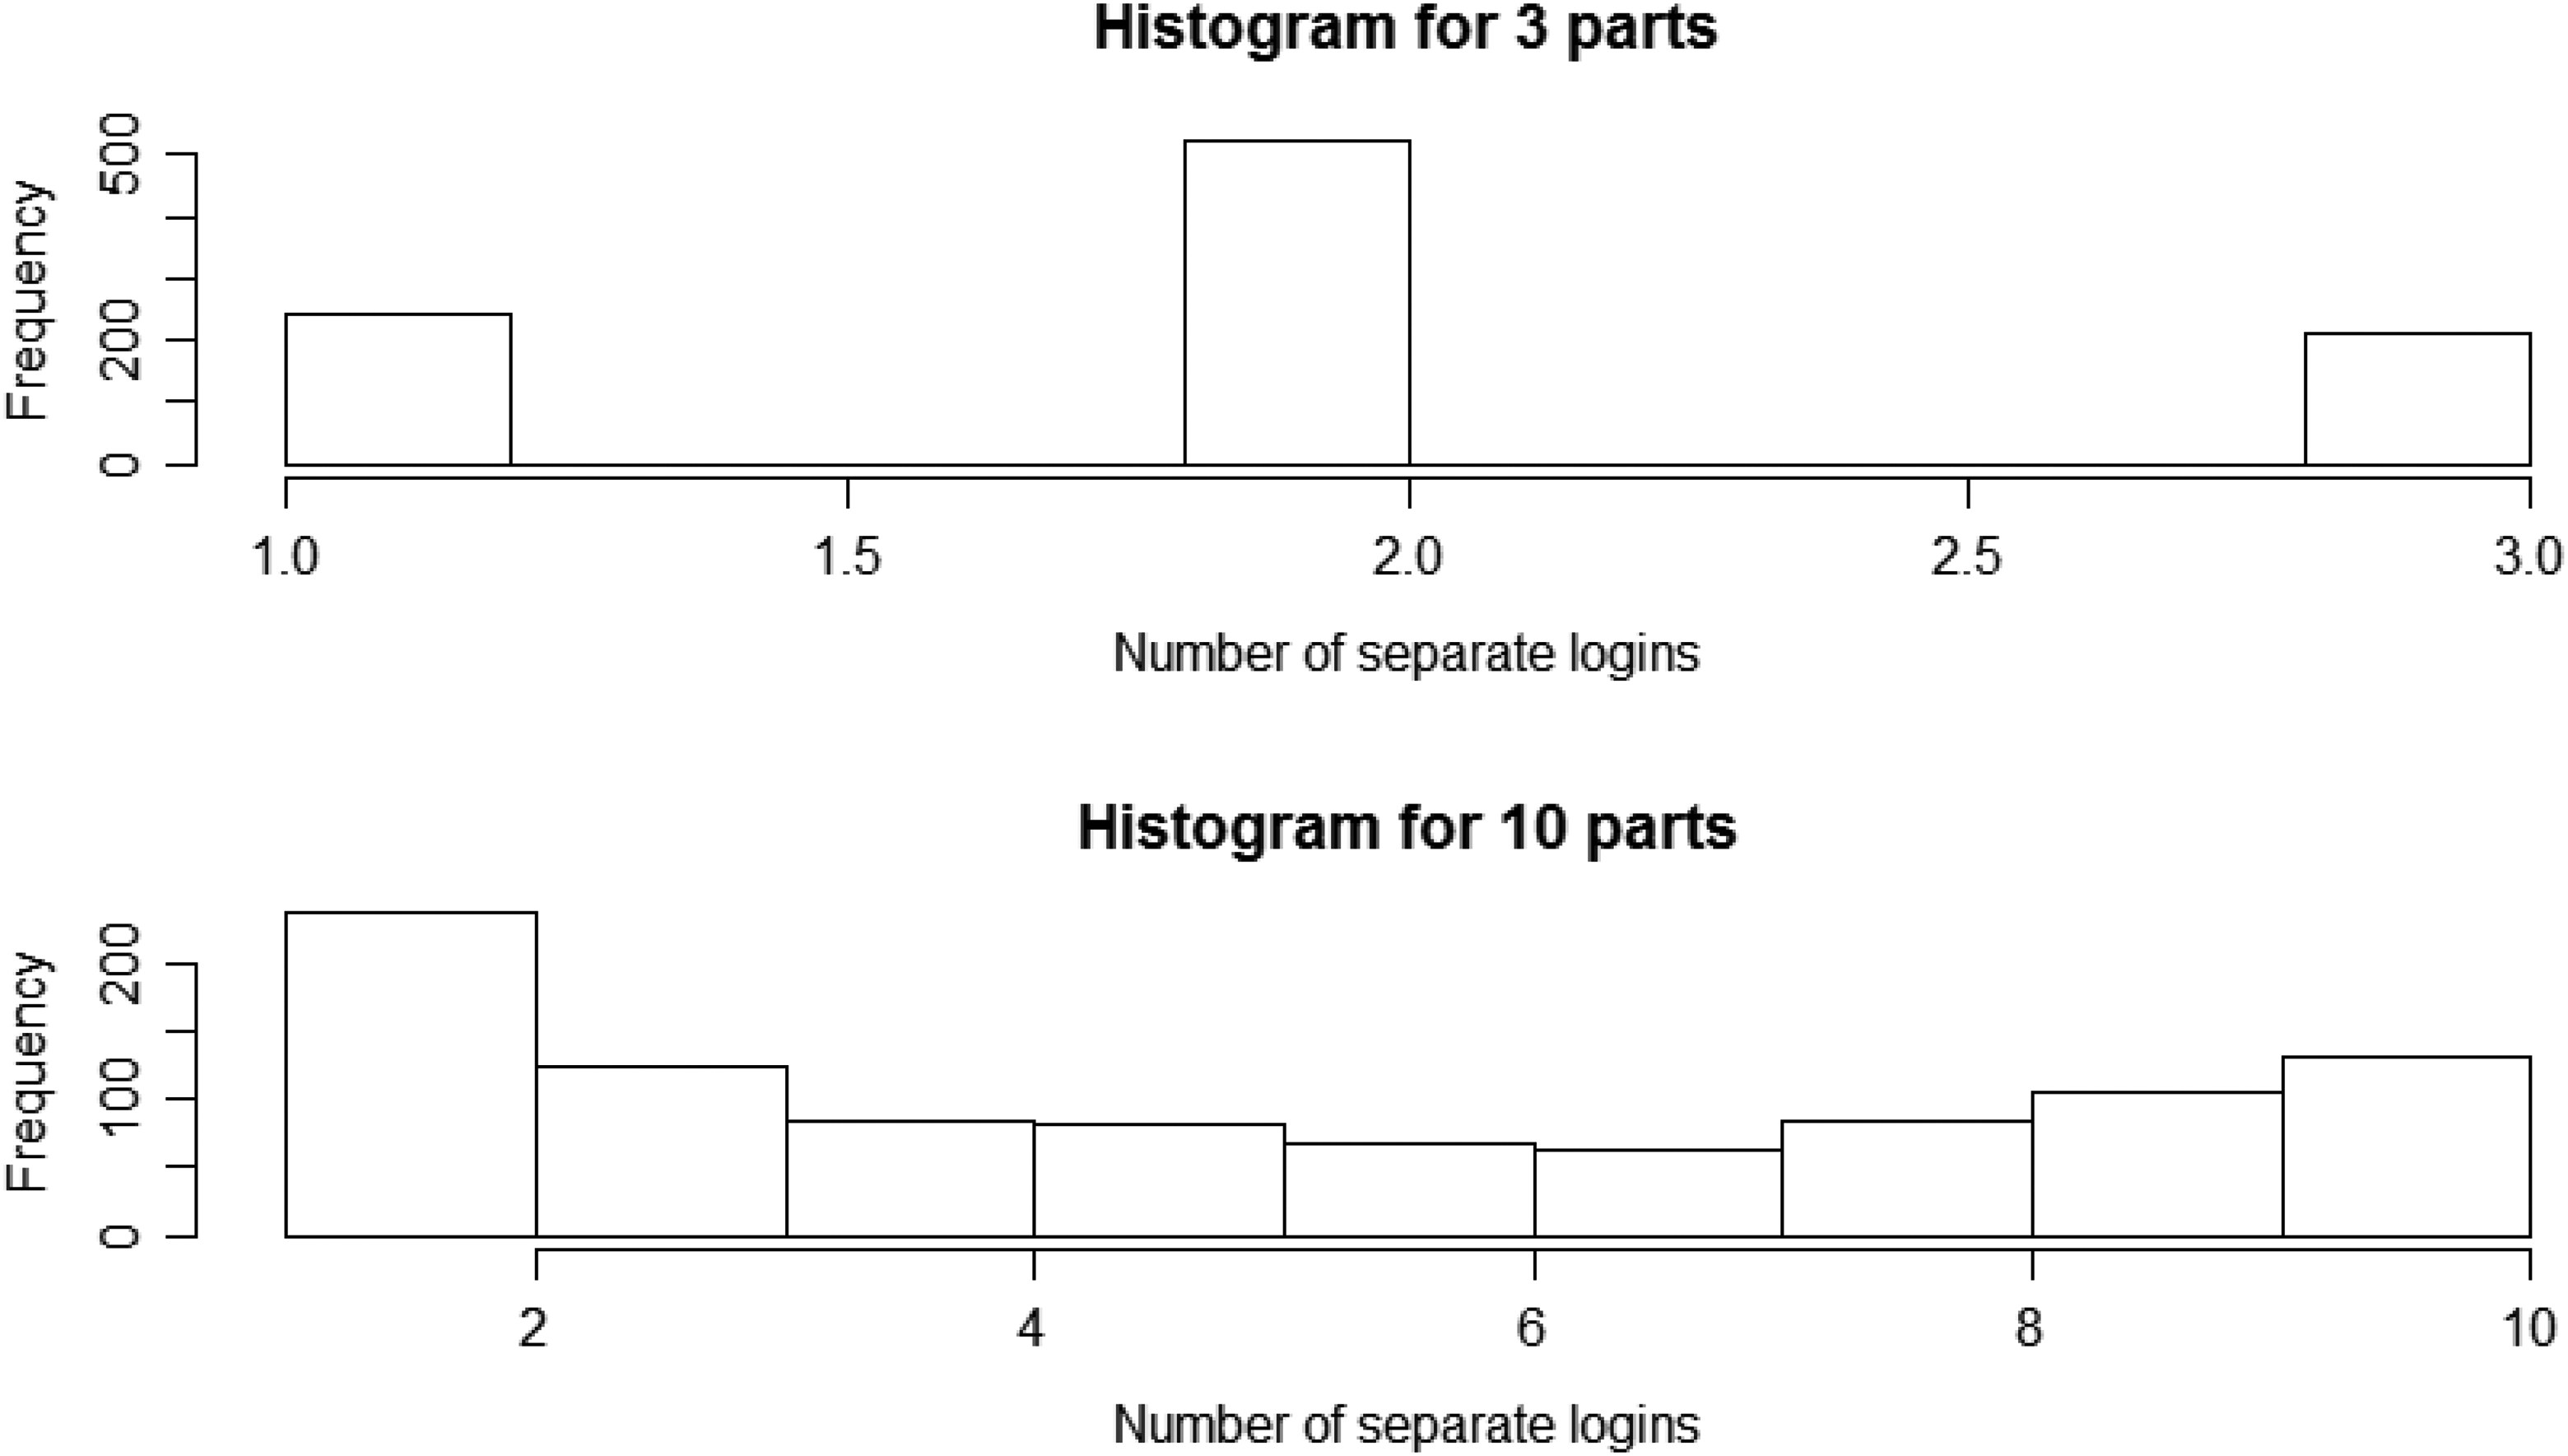
In the LISS Panel, questionnaire invitations remain open until the end of the fieldwork period. Therefore, respondents in the 3- and 10-part condition could often choose how many parts they want to complete at a certain point in time. For example, a respondent in the 10-part condition could decide to save up all parts and complete all 10 parts in a single sitting at the end of the fieldwork period. We look at the number of login attempts to investigate how many respondents adhere to the request to complete the survey in 3 or 10 parts.
Figure 1 shows that most respondents in the 3-part condition complete the survey in 2 logins (sittings). In the 10-part condition, we see a somewhat equal distribution among the 10 possible login attempts, with one contact attempt being the most frequent. These respondents chose to complete the 10-part survey in a single sitting. These findings imply that most respondents did not adhere to our experimental manipulation. Many respondents “save up” parts of the survey and complete them in one go. Therefore, for our further analyses into the effects on data quality, we separate respondents who adhered to our experimental manipulation from those who don’t. Respondents who adhered to the experiment are defined as using at least two logins for the 3-part condition and at least five logins for the 10-item condition. It is important to remember that respondents “choose” themselves whether to adhere to our experimental manipulations and that there are reasons to believe that adhering respondents may also exhibit better answer behavior in general. So the split effects we present below are not necessarily causal effects.
Time (in min) to complete the total survey (completes only), in relation to the number of logins and the within-modularization condition (1, 3, or 10 parts).
Indicators for Data Quality
In this section, we look at survey duration, item missings, extreme and neutral responding, satisficing behavior, validity, and respondents’ evaluation of the survey as indicators for data quality.
Survey duration
We trimmed the total response times of respondents who needed more than 1.5 hr to complete the survey (n = 154) to 1.5 hr. The mean completion times are 1,240 s (1 part), 1,264 s (3 parts), and 1,422 s (10 parts). This difference is significant, F(2, 3150) = 8.11, p < .01.
Item missings
Table 4 shows in the second column that there are no significant differences in the mean number of item missings (“don’t know,” “refusal,” and “system missings”) across the number of survey parts. However, when we take a closer look at the respondents who have at least 1 item missing, we see that the mean number of item missings decreases with the number of survey parts. The last two columns also show that there is a decrease in the mean number of missing items for respondents who adhered to the experimental condition and completed the survey in several parts. Hence, the shorter the survey, the fewer item missings we observe.
Item Missings.
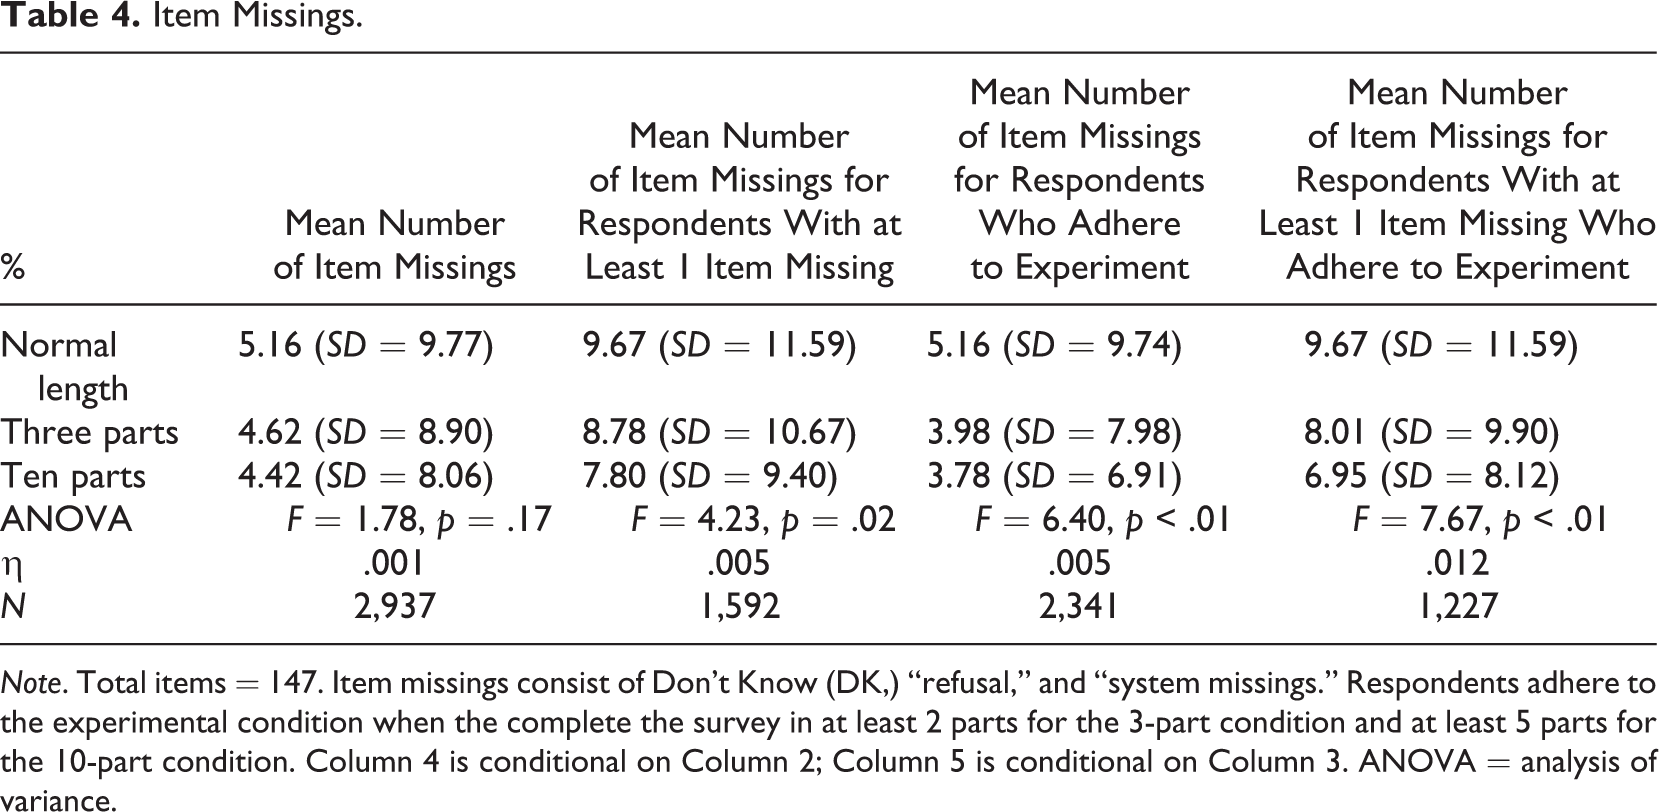
Note. Total items = 147. Item missings consist of Don't Know (DK,) “refusal,” and “system missings.” Respondents adhere to the experimental condition when the complete the survey in at least 2 parts for the 3-part condition and at least 5 parts for the 10-part condition. Column 4 is conditional on Column 2; Column 5 is conditional on Column 3. ANOVA = analysis of variance.
Extreme and neutral responding
We defined extreme responding as choosing either the first or last response option of several questions which use an 11-point response scale. The fifth option is defined as neutral being the midpoint of the scale. We find no significant differences in the mean number of extreme and neutral responses between the number of survey parts (F = 1.20, p = .30), nor if we focus on the mean number of extreme and neutral responses for respondents who adhere to the experimental condition of taking the survey in several parts (F = 1.44, p = .24).
Satisficing behavior
Table 5 shows that satisficing behavior decreases when the survey is cut into multiple modules. The effect is slightly larger for respondents who adhere to the experimental condition and complete the survey in several parts.
Satisficing Behavior.
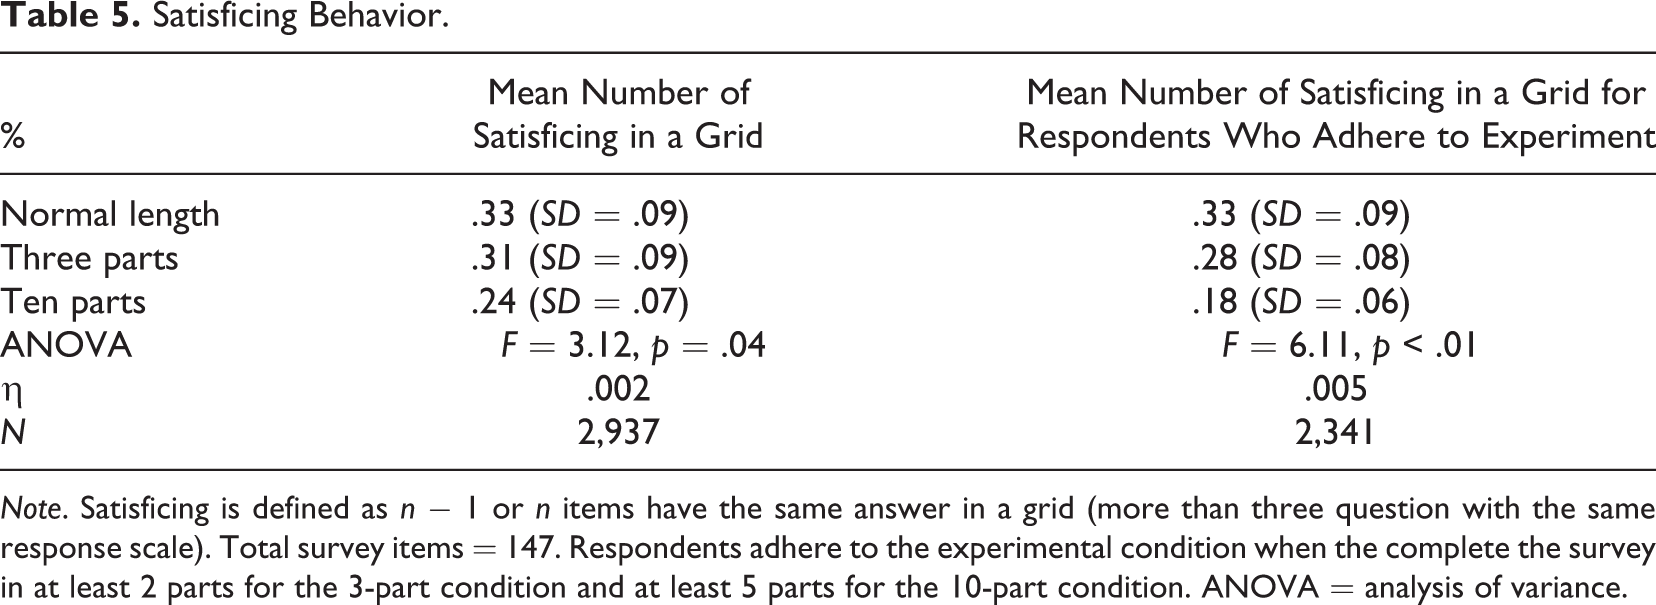
Note. Satisficing is defined as n − 1 or n items have the same answer in a grid (more than three question with the same response scale). Total survey items = 147. Respondents adhere to the experimental condition when the complete the survey in at least 2 parts for the 3-part condition and at least 5 parts for the 10-part condition. ANOVA = analysis of variance.
Validity
Due to the chunking of the survey, some scales were divided into separate modules. For example, two scales measuring gender equalities with, respectively, 3 and 7 items were in the same survey module for the 3-item condition but spread over two modules in the 10-item condition. We investigate factor loadings among the normal length, 3-, and 10-part conditions to investigate the validity of this scale (see Table 6). A Wald test for equality, Wald (df = 16) = 18.67, p = .32, shows no significant differences between the three conditions. This means that both the factor loadings, but more importantly the factor correlation is the same in all three conditions, implying the absence of a context effect when the scale was split over two separate modules.
Standardized Factor Loadings for Two Scales in the Survey.
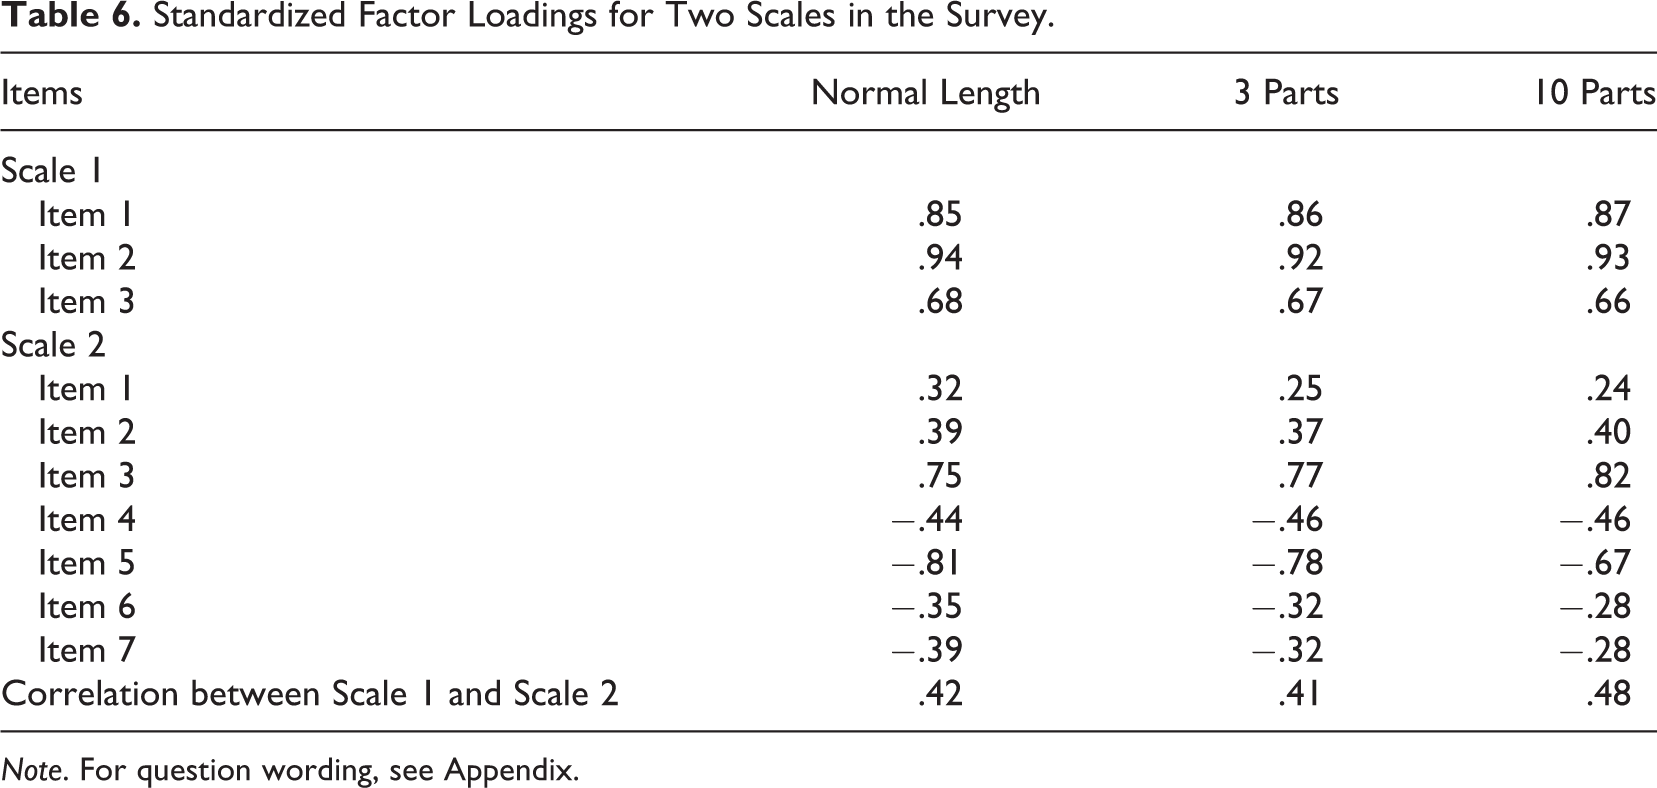
Note. For question wording, see Appendix.
Evaluation of the questionnaire
At the end of the survey, respondents answered five evaluation questions:
(1) How difficult was the questionnaire? (2) How clear were the questions? (3) Did the questionnaire make you think about issues? (4) Did you think the questionnaire was interesting? (5) Was it fun to complete the survey? Each questions included a response scale ranging from (1) certainly not, (2), (3), (4) to (5) certainly yes.
We regressed these evaluation questions on the experimental condition but also on the experimental variable with text invitations, sociodemographics, and interaction terms between these (see Table 7). We find that older respondents who got the questionnaire in 3 or 10 parts reported lower ratings on Item 3 (whether the questionnaire made them think about certain issues). Respondents with high levels of education found the questionnaire less difficult and more fun in the 3-part condition, while respondents with low education found the questionnaire more interesting, fun, and made them think. Respondents with high education found the questionnaire less difficult in the 10-part condition.
β (Standard Coefficients) of the Evaluation of the Questionnaire.
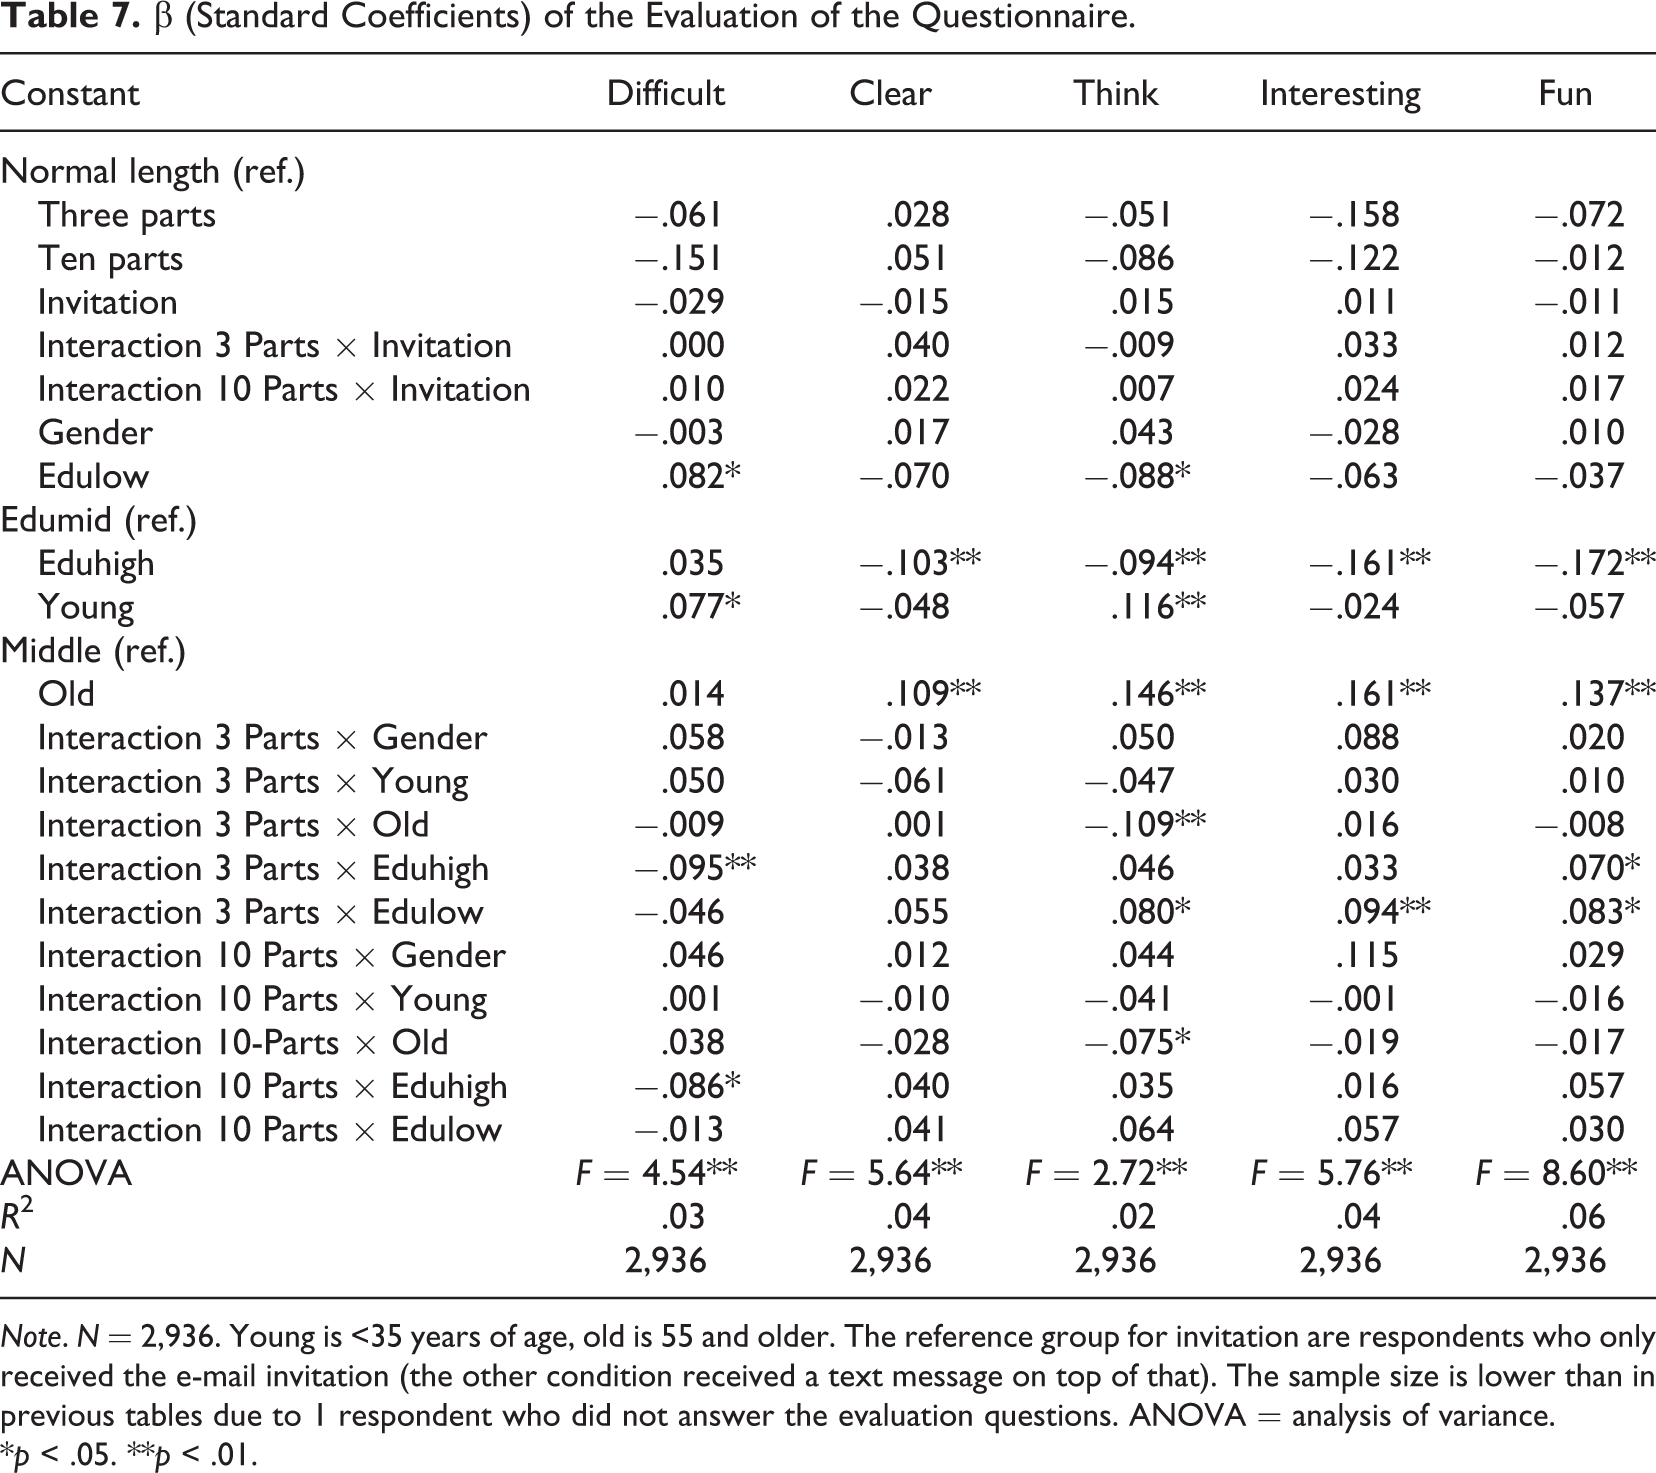
Note. N = 2,936. Young is <35 years of age, old is 55 and older. The reference group for invitation are respondents who only received the e-mail invitation (the other condition received a text message on top of that). The sample size is lower than in previous tables due to 1 respondent who did not answer the evaluation questions. ANOVA = analysis of variance.
*p < .05. **p < .01.
Discussion and Conclusion
In this article, we have investigated cutting an existing survey in smaller modules. Data come from the LISS Panel, an online probability-based panel. We used the eighth wave of the module Politics and Values. Panel members who own a mobile phone with Internet connection were randomly assigned to the regular survey, survey cut into three pieces, or survey cut into 10 pieces. In addition, we experimented with extra notifications via SMS/text compared to the control condition who received only e-mail (standard procedure in the panel).
Our results indicate both higher response and dropout rates when the survey is cut into 3 or 10 pieces. The higher response and dropout rates are about equal. However, the FMI is lower when the survey is cut into more modules. A practical implication of the modularization is the need to analyze missing data patterns.
More respondents use their mobile phone for survey completion when the survey is modularized, although the difference is small. Investigating the device effects for the quality indicators is beyond the scope of this article. However, future research could shed more light into the relationship between device effects, personal effects, and data quality indicators.
We find fewer item missings and satisficing in the modularized conditions. We find no effect on neutral and extreme responding, nor validity. People with low and high education and young and old evaluate shorter surveys better than the normal length survey. A better evaluation can result in increased response rates in the future, especially in panel studies. Our results hint at better data quality in modular surveys without a loss in missing information due to several parts of the survey.
Fieldwork remained open during the release of the chunks. Respondents could therefore wait for the different chunks to become available and complete them all at the end. Many respondents completed the survey in several chunks. However, there are also people who completed all or several chunks in one go. We chose to only release chunks at later moments, to encourage respondents to actually complete the survey in more sessions. One could however also experiment with a design where all chunks are available from the beginning or ask the respondent after every chunk whether he or she is ready to complete another one. Further, we did not experiment with the timing of the availability of the chunks, nor with the timing of reminders. These are areas that require further study. An alternative design to within-respondent chunking is a between-respondent design. Although such planned missingness designs have been used more often, it remains unclear what the comparative benefits are of a within- and between-respondents missingness design in the context of smartphone completion, as well as total survey error.
With the rise of the use of mobile phones for survey completion, questionnaire design should be reevaluated. Shortening surveys can be an effective way to increase response rates, reduce dropout, and increase data quality. In panel studies, an adaptive design can be used in which the length of the survey is adjusted to individual panel members’ wishes. However, data publishing becomes more complex because of different missing data patterns. In addition, in surveys with complex routing, data modularization can be quite difficult. This article demonstrates potential benefit for splitting surveys into smaller pieces. There are only a few papers on data modularization in an era of mobile web. Much is still to be learned from data modularization in mobile surveys.
Footnotes
Appendix
Declaration of Conflicting Interests
The author(s) declared no potential conflicts of interest with respect to the research, authorship, and/or publication of this article.
Funding
The author(s) received no financial support for the research, authorship, and/or publication of this article.