
Abstract
Sampling of migrants in cross-national survey research is challenging. Established techniques such as random-route sampling or random-digit-dialing are associated with high monetary costs, in particular when small migrant groups are targeted. The use of onomastic (name based) telephone sampling is a relatively cost-efficient alternative, but it relies on a number of conditions (e.g., existence of telephone directories in the respective countries and inclusion of the target population). As the use of social networking sites (SNSs) has spread around the globe in the last 20 years, the present paper investigates whether a specific SNS, Facebook, can be used to sample migrants, with the ultimate goal to supplement other approaches. This article is based on data collected as part of a survey that used Facebook advertisements to sample Polish migrants in Austria, Ireland, Switzerland, and the United Kingdom. The study succeeded in sampling a total of 1,103 individuals who completed the relatively extensive questionnaire within the field period of 8 weeks (1,100 within the 4 weeks the advertisements were placed). In contrast to most of the few other studies that tried to sample respondents with the help of Facebook advertisements, no incentives were used. With nearly all (96%) of the respondents belonging to the target population and a total sampling budget of €500 (US$557), the method can be considered both accurate and cost efficient in recruiting people from the target population. Furthermore, our results suggest that the vast majority of the sample would not have been reached if onomastic sampling had been employed.
Introduction: The Problems of Migrant Sampling
Recruiting migrants into surveys is a comparatively complicated endeavor, especially in a cross-national context. While there are a number of established techniques to achieve this aim, they all have certain shortcomings that are even more relevant in cross-national studies than in research conducted within a single country.
With respect to population registers, for example, it has been pointed out that these do not exist in all countries and even where they exist, researchers are not always granted (unrestricted) access. Furthermore, such registers do not necessarily contain the variables needed to identify migrants (Groenewold & Lessard-Phillips, 2012). Another possibility, at times employed in migration research, is random-route sampling in which inhabitants of a given geographic area (usually a specific urban district) are contacted by interviewers according to a predetermined routing pattern. However, this approach, firstly, implies a restriction of the sampling to specific areas. Secondly, it is likely to be relatively cost-intensive if carried out in several countries due to the interviewers needed “on the ground” in each location. Finally, it becomes increasingly ineffective the smaller a target population is compared to the overall population (Salentin, 2014).
Telephone samples are in part used to circumvent the aforementioned restrictions. However, random-digit-dialing (RDD), which is commonly used to sample members of the general population for telephone surveys, is ineffective if specific subpopulations such as migrants from a specific country are targeted. This is due to the fact that their identification would require expensive screening, possibly conducted by multilingual interviewers.
Instead of using RDD, telephone surveys of migrants therefore often identify potential participants via the linguistic screening of names in telephone directories, the so-called onomastic procedure. This procedure identifies combinations of given and family names which pertain, with a certain probability, to a member of a specific ethnic group (Humpert & Schneiderheinze, 2000; Schnell et al., 2013). However, this procedure has the obvious disadvantage that a person can only be identified as a potential member of the target population if he or she is included in the telephone directory. If the number is registered to another household member, the first person can only be sampled if the actual “owner” of the number is identified as a member of the target group, too, and if the number is subsequently drawn for the sample. Hence, due to the nature of the procedure and its limitations several subgroups are likely to be underrepresented in such a sample. This holds for members of the target population who (1) have taken on another family name, for example, due to marriage, (2) live in shared housing or, (3) engage in circular migration and therefore lack a landline telephone. An additional problem is posed by the fact that this procedure can only be applied in countries for which comprehensive telephone registries are available. The latter can turn into a problem even if the research is restricted to the European Union (for a recent example see: Pötzschke, Ciornei, & Apaydin vom Hau, 2014). A more general weakness of all telephone-based sampling approaches is that, by definition, they can only reach people who possess a telephone and use a telephone number which falls into the sampling frame.
In conclusion, all of the mentioned approaches have certain strengths but they also suffer from weaknesses that complicate the sampling of migrants in a given country and even more so in the context of cross-national research. The main goal of this study is to inquire whether social networking sites (SNSs) can be used as a sampling frame to balance some known weaknesses of established sampling procedures in migration research (e.g., of telephone registry-based onomastic sampling). If successful, these new sampling frames could be used to complement other sampling techniques.
SNSs as a Sampling Frame
The use of SNS has seen a rapid growth since the start of the 21st century. Just to take two of the more prominent examples: The SNS Facebook was founded only in 2004 and had, according to the company’s annual report, 1.39 billion active users per month worldwide by the end of 2014 (Facebook, 2015b). LinkedIn, an SNS oriented toward the professional life, which went first online in 2003, reported 347 million users around the world in 2014 (LinkedIn, 2015). These figures indicate that the use of SNS is widespread. Furthermore, it stands to reason that these and countless other SNS are not just used by national but also by migrant populations. Earlier research, for example, showed how migrants use new communication technologies to maintain social relations over long distances (Benítez, 2012; Dekker & Engbersen, 2014) and to organize diaspora activities (Oiarzabal, 2012). In light of the above described difficulties which the sampling of migrants is faced with, it seems therefore worth considering whether and how SNS could be used to sample migrants in order to supplement more established techniques.
Until now, the majority of social science studies which employed SNS as a frame to sample different populations (i.e., not only migrants) used groups that individual users formed within these networks as an entry point. In most cases, researchers invited members of existing groups to participate in their surveys (Baltar & Brunet, 2012; Crush et al., 2012; Oiarzabal, 2012; Ranieri, Manca, & Fini, 2012; Valdez et al., 2014). Others created subject-related groups on their own and then surveyed those who joined them (Brickman Bhutta, 2012; Valdez et al., 2014). In some cases, the recruitment of group members was combined with snowball sampling (Baltar & Brunet, 2012; Brickman Bhutta, 2012; Crush et al., 2012), that is, known members of the target population were asked to facilitate the participation of other members of the target population they were acquainted with.
In the present study, we wanted to use a different approach that would not depend on any connection of potential respondents to a specific topic or user group. More precisely, we used Facebook advertisements to test whether these could be applied to sample migrants and convert them into survey participants. To our knowledge, this method has so far only been applied by a limited number of studies that were all conducted in the area of medical and health research (Arcia, 2014; Chu & Snider, 2013; Fenner et al., 2012; Kapp, Peters, & Oliver, 2013; Lohse, 2013; Ramo & Prochaska, 2012) or to recruit participants for cognitive pretests for which monetary incentives were offered (Head, Dean, Flanigan, Swicegood, & Keating, 2016). 1 All of these studies were furthermore restricted to a specific country and none of them was carried out in Europe or targeted residents of European countries. Finally, the topics of these medical and health surveys can mostly be considered to be sensitive, ranging from pregnancy-related issues (Arcia, 2014) and smoking among young adults (Ramo & Prochaska, 2012) to post-traumatic stress disorders (Chu & Snider, 2013).
Target Population
In contrast to the aforementioned research, the present study included a much less sensitive topic and a broader target population, defined as Polish migrants, aged 18 or older, living in Austria, Ireland, Switzerland, and the United Kingdom. The decision to sample Polish migrants was taken because they constitute subpopulations of several thousand members in various European countries. Since the end of socialism in Poland and, more importantly, since the country’s admission to the European Union, the United Kingdom and Ireland have been the primary destinations of Polish migration. This was not least due to the fact that both granted Polish workers unrestricted mobility as soon as their country joined the EU (Engbersen, Okólski, Black, & Pantîru, 2010). According to the statistical office of the European Union, 869,061 Polish nationals lived in the United Kingdom and 117,918 in Ireland in 2015. Austria and Switzerland, where 54,010 and 21,612 Polish nationals lived in 2015 (EUROSTAT, 2016), were included to this study so that it could be judged how the sampling results would differ in countries in which the target population varied significantly in size. 2
Design and Structure of Facebook Advertisements
This study used a marketing tool (Facebook Adverts) based on which Facebook offers the possibility to place advertisements on its SNS. The first step of launching an advertisement campaign on Facebook is to decide on a campaign objective. Campaign objectives describe the user behavior that the display of an ad should trigger. The goal of the advertisements used in our study was to generate clicks on an external link. Facebook calls this campaign objective “Send people to your website.” Other possible objectives include the engagement with or installation of a Facebook app or the tagging of promoted content with a “like” by the targeted users (Facebook, 2016a). The link that was used in the ads led the respective users to the start screen of our online survey.
Facebook advertisement campaigns can be restricted to either computers or mobile devices or be displayed on both. In order to reach as many members of the target population as possible, it was decided to run the advertisements both on mobile devices and on computers. Furthermore, an important decision regarding advertisements is their placement, since only users who actually see an ad can read it and (possibly) react to it. However, the appearance of advertisements changes, depending on the way in which users access their Facebook profile. While mobile ads display only the so-called news column on the screen, the desktop view on computers also includes two margins, splitting the screen in three vertical areas. On computer screens, in addition to the news column, the right margin can equally be used to display advertisements, whereas this is not the case in mobile ads.
In order to keep the stimulus for all individuals as constant as possible, ads in our study were only displayed in the news column. Admittedly, this option was preferable anyway, since it meant that the ads would appear in between user-generated content, such as private postings and pictures, which promised higher exposure. The appearance of a Facebook advertisement that is intended to be displayed in the news column consists of different elements. Figure 1 shows these elements using the design employed in this study.
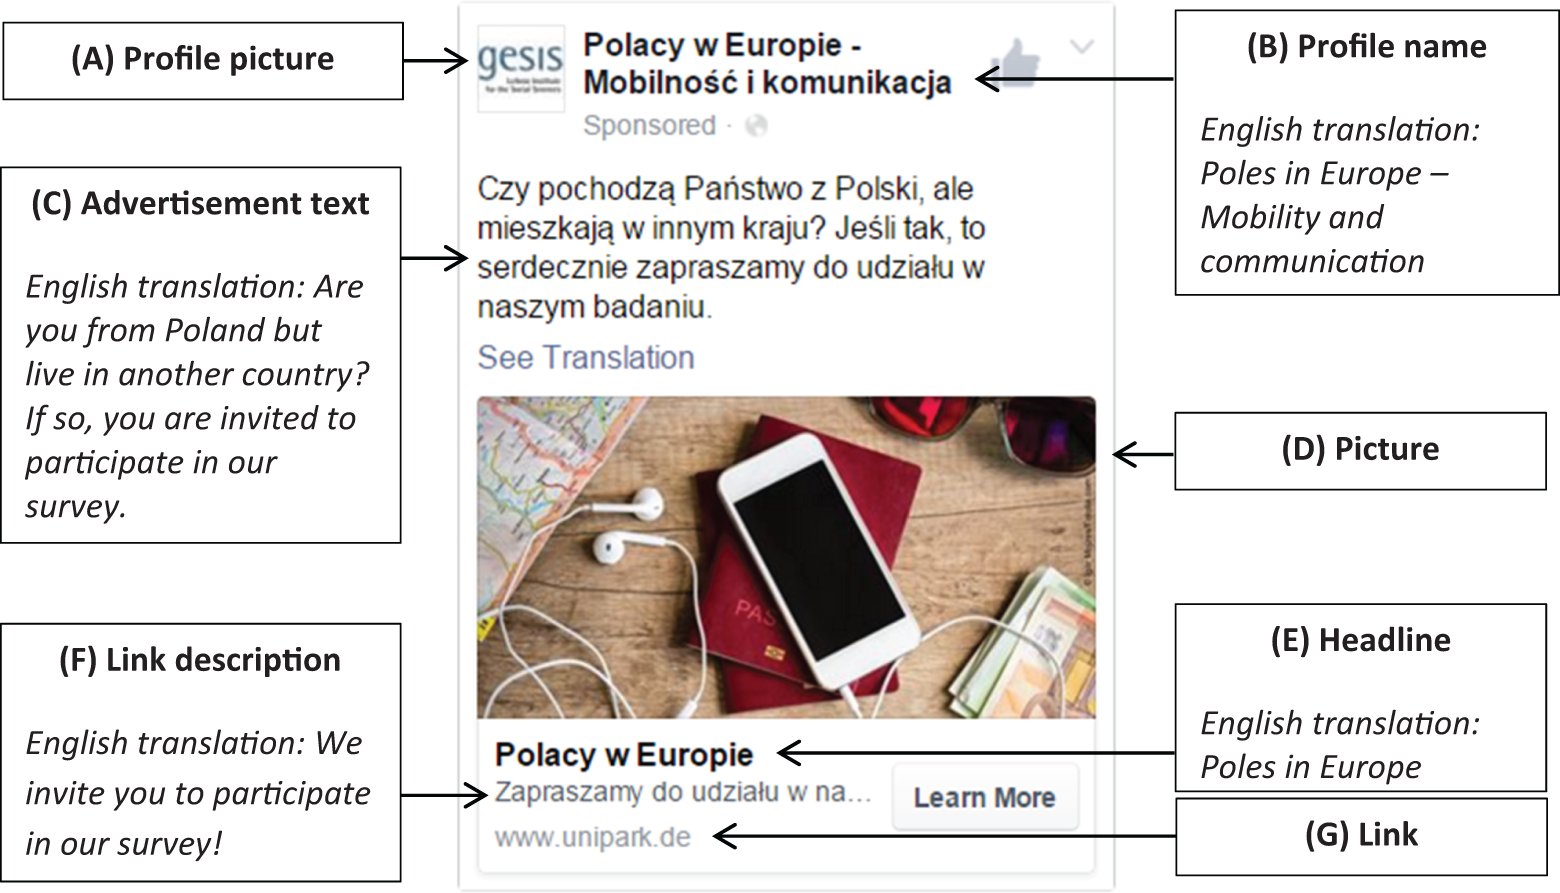
Composition of a Facebook advertisement with the objective “send people to your website.” Copyright of the picture: Igor Mojzes/ Fotolia.com.
The first important elements are the profile picture (A) and the profile name (B), which are displayed at the top of the ad. Both elements are taken directly from the Facebook account which places the advertisement. This means that they can be used strategically. If the ad were placed directly from the main account of the institution conducting a survey, the name of this account and its profile picture would be used. However, this would have the consequence that the most prominent place remaining to display the title of the survey would be underneath the description of the survey and the used picture, as a so-called headline (E). In order to avoid this “low profile” heading, a new Facebook profile page was created using the title of the survey “Polacy w Europie—Mobilność i komunikacja” (Poles in Europe—Mobility and communication) as the account name and a compact logo of our research institute as the account picture. With this design, we followed the recommendation made by Dillman, Smyth, and Christian (2014) to focus on the target population instead of the surveying institution when designing a web survey. Thus, by using the survey title as the name of the Facebook profile page, potential respondents get a rough idea of the survey topic and their interest can be piqued.
The creation of a specific survey page in Facebook also had the advantage that it could be used to communicate further information regarding the survey and our host institution, reassuring potential participants of the legitimacy of the survey. This was especially helpful because the website of our research institute itself does not have a Polish language version. The project page and all texts used during the advertisement campaign were published in Polish only. The decision to use only Polish materials served, on the one hand, as an additional screening mechanism, since Polish is not widely spoken as a foreign language in the targeted countries. On the other hand, it also limited the sample of the study to those migrants fluent in Polish, excluding, for example, individuals who were born in Poland but had never learned the language due to migration at an early age.
The space that Facebook ads offer for the inclusion of text is very limited. Indeed, the ads are in this respect similar to classified advertisements in newspapers. As it was also intended that users could read the whole main advertisement text (C) without clicking on a “see more” link, only approximately 100 characters could be used. In an early study on the effectiveness of banner advertisements as a recruiting mechanism for online surveys, Tuten, Bosnjak, and Bandilla (1999) had found that carefully worded advertisement texts, which informed potential participants about a survey’s goal and its scientific nature, yielded even higher click-through rates than ads that offered incentives. Therefore, the wording of each text element was considered carefully as they were intended to directly motivate potential participants to take part in the survey. No monetary or other incentives were offered.
Besides the text, pictures are a vital element of Facebook ads as the network itself is a visual medium. Therefore, the decision for a picture or a group of pictures (it is possible to include up to five pictures in one ad) should not be made lightly. The study used a total of five pictures that were included alternately in order to appeal to an audience as diverse as possible in terms of sociodemographic characteristics. To better understand the logic behind this approach, it is helpful to examine the way advertisement campaigns are structured in Facebook.
As Figure 2 shows, advertisement campaigns in Facebook comprise three levels: a campaign, which consists of one or more ad sets, and each ad set consists of one or more ads. The study of Ramo and Prochaska (2012) showed that ads that were identical with the exception of the pictures used differed substantially regarding their performance (i.e., the clicks to the target website produced by them). One reason for this is the fact that certain pictures appeal more to the target population than others. Furthermore, it is probable that different strata of the target population vary in their respective preferences. As these effects could hardly be quantified before our study without extensive pretests, we decided to use five different pictures in the project’s advertisement campaign (see Appendix A). Therefore, five ads were created in which only the picture varied while all other aspects—including all text components—remained identical. The first picture featured a single woman with a Polish national flag (Figure A1), two pictures showed couples (Figures A2 and A3), one picture showed a family waving at a notebook screen (Figure A4), and one picture displayed a smartphone, passports, and other travel-related items (Figure A5).
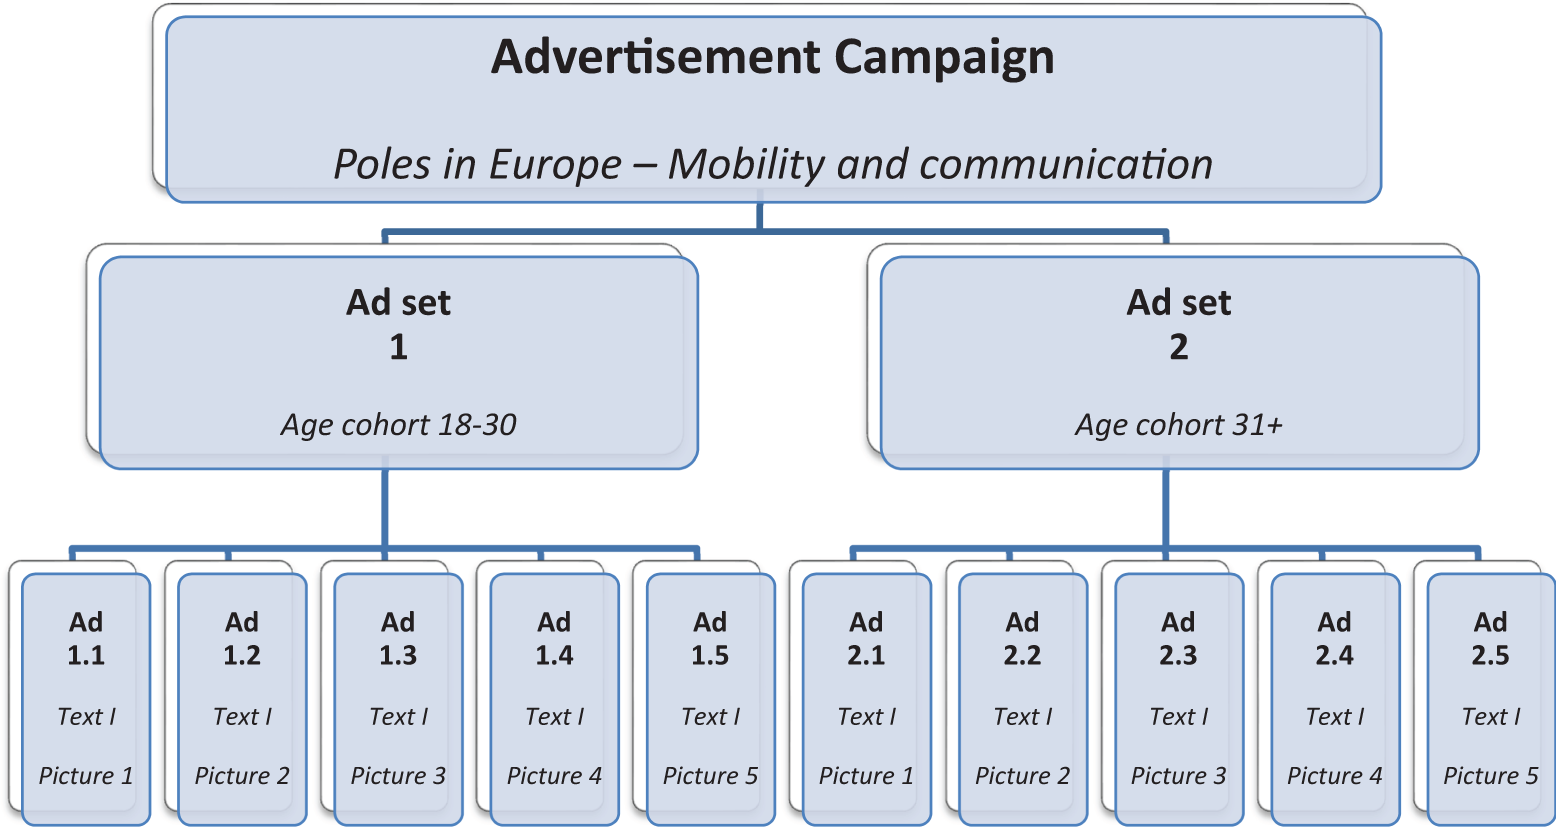
Structure of advertisement campaigns in Facebook (details pertaining to the present study in italics). Adapted from Facebook (2014).
The second reason for the performance difference of pictures is that Facebook has implemented an algorithm that pushes those ads within a given ad set that perform the best with regard to the specified campaign objective. This means that, if the objective is to generate clicks to a website, Facebook will start to increasingly display those ads that receive the most clicks over the lifetime of a campaign. As Arcia (2014) points out, this can lead to a biased sample if users who share certain traits (e.g., of a socioeconomic, political or cultural nature) are more inclined to click on Facebook ads than others and if they tend to prefer a specific picture. Arcia therefore proposed to target strata for which differences are anticipated with specific and separate ads sets. For the present study, we suspected that members of different age cohorts display differences in their willingness to interact with the study, depending on which picture they see. Our assumption was that younger users might be more inclined to do so than older ones. Hence, in order to avoid ending up with a largely age-biased sample it was decided to create two subsamples by splitting the target population in two even groups according to Facebook’s estimate regarding the size of the parent population (Table 1). The cutting point was set at age 30, resulting in the two ad sets as shown in Figure 2. Both ad sets included the same five ads.
Facebook’s Assessment of the Potential Reach of Advertisements for Polish Migrants in Austria, Ireland, Switzerland, and the United Kingdom.a
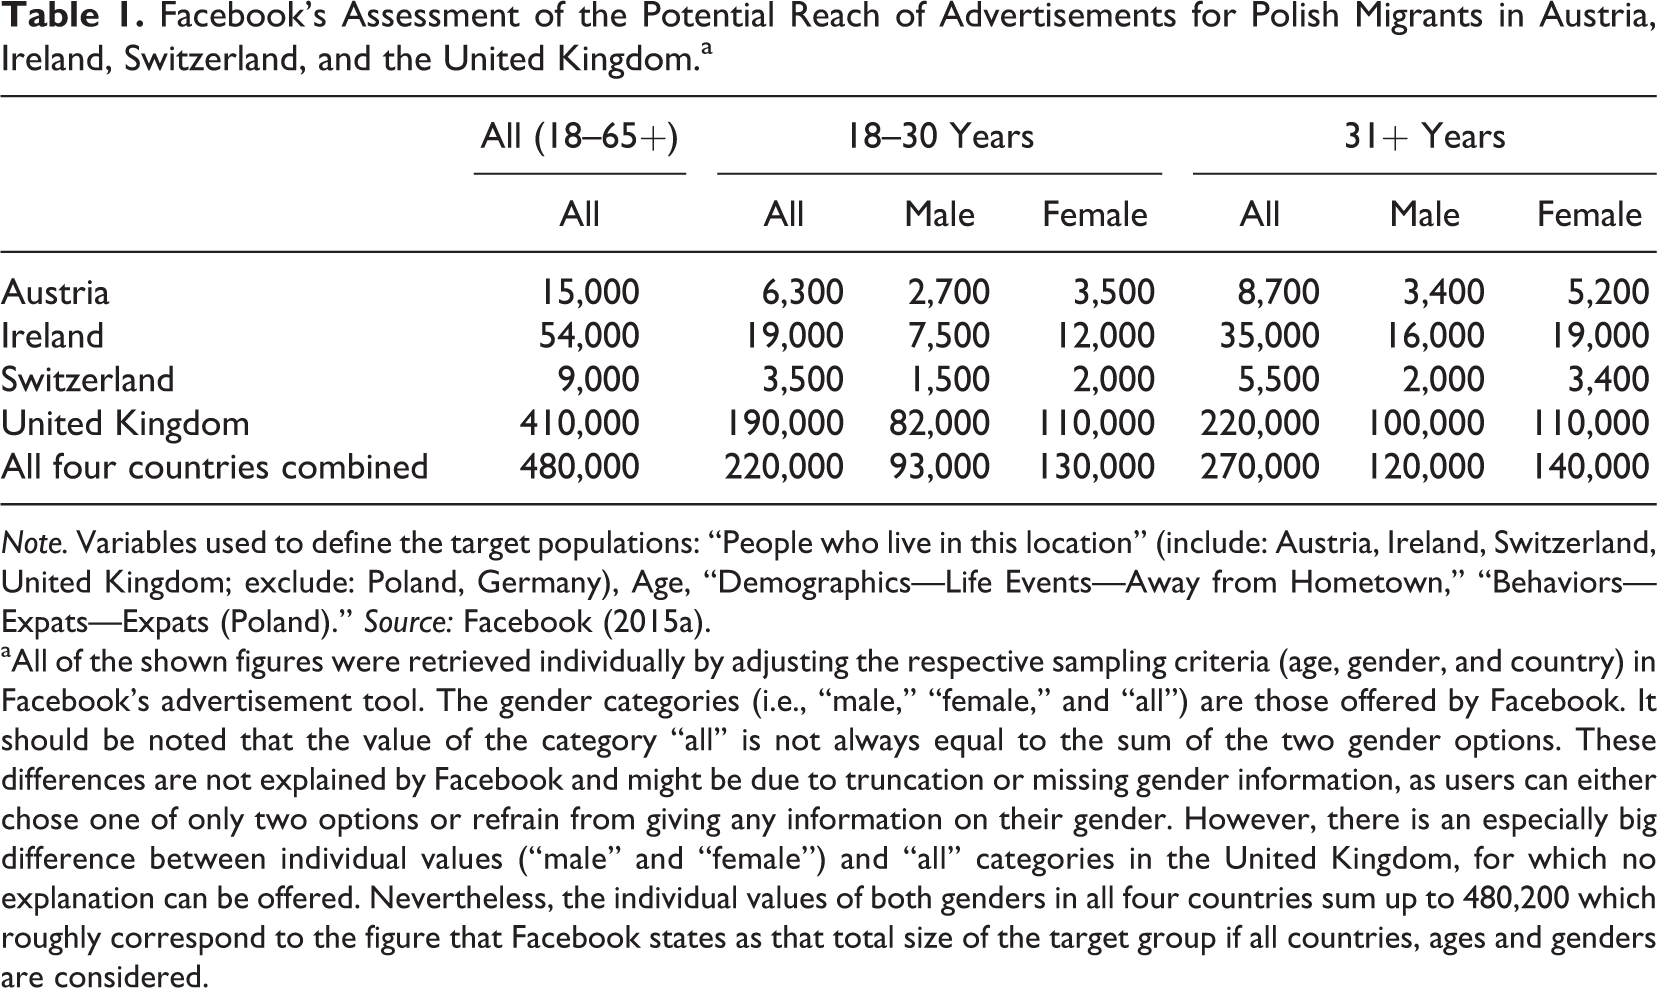
Note. Variables used to define the target populations: “People who live in this location” (include: Austria, Ireland, Switzerland, United Kingdom; exclude: Poland, Germany), Age, “Demographics—Life Events—Away from Hometown,” “Behaviors—Expats—Expats (Poland).” Source: Facebook (2015a).
aAll of the shown figures were retrieved individually by adjusting the respective sampling criteria (age, gender, and country) in Facebook’s advertisement tool. The gender categories (i.e., “male,” “female,” and “all”) are those offered by Facebook. It should be noted that the value of the category “all” is not always equal to the sum of the two gender options. These differences are not explained by Facebook and might be due to truncation or missing gender information, as users can either chose one of only two options or refrain from giving any information on their gender. However, there is an especially big difference between individual values (“male” and “female”) and “all” categories in the United Kingdom, for which no explanation can be offered. Nevertheless, the individual values of both genders in all four countries sum up to 480,200 which roughly correspond to the figure that Facebook states as that total size of the target group if all countries, ages and genders are considered.
Campaign Settings, Reach, and Costs
An important feature of Facebook ads is that they can be used to target specific subpopulations within the users of the network. In order to do so, the marketing tool allows choosing predefined characteristics, such as interests (sports, music, etc.) or connections to specific countries. The following describes the variables used to define the target population of this study.
Age was used to distinguish the two subsamples (= ad sets). The minimum age available is 13 while 65+ is offered as the highest age category. As previously described, the study targeted individuals who were at least 18 years old. As mentioned, two age cohorts were used, that contained comparable numbers of Facebook users, based on Facebook’s estimates. The target age of the first ad set was specified as ranging from 18 to 30 years, and 31 or older was chosen for the second. All other options, besides the age variable, were specified in exactly the same manner for both ad sets.
Regarding the sex of targeted users, Facebook allows choosing between the options “men,” “women,” and “all,” the latter of which was used in this study.
Facebook also allows specifying locations and how users should be related to them. Basic units that can be chosen as locations are countries. Depending on the country, locations can then be further specified to cities, zip code areas or even a radius of one mile/kilometer or more around a specific address. The chosen locations can be combined with the general options “include” and “exclude,” as well as with the specific options “everyone in this location,” “people who live in this location,” “people recently in this location,” and “people traveling in this location.” For the purpose of our study, Austria, Ireland, Switzerland, and the United Kingdom were included with the option “people who live in this location.”
In the category behaviors, Facebook offers the option “expats (Poland)” which is defined as “People from Poland living abroad” (Facebook, 2015a); this option was chosen in order to limit the target population to Polish migrants. Furthermore, it was specified that the ads should only be displayed to individuals who were “away from hometown.” 3
Based on these calibrations, Facebook automatically computed the potential reach of the advertisements, that is, the number of Facebook users which matched the defined criteria. The respective figures are shown in Table 1.
Advertisements in Facebook do not have a fixed price; instead, the costs are determined by an auctioning procedure. Once the objective (here: to generate website clicks) and the target population of an ad are defined, the buyer engages in a bidding competition with other advertisers who target the same group with the same objective. It is possible to either place a bid on a single click (Cost per click, CPC) or on 1,000 impressions of the advertisement (Cost per 1,000 Impressions, CPM). An impression is defined as the first time an ad is displayed on a user’s screen during a given session (Facebook, 2016c).
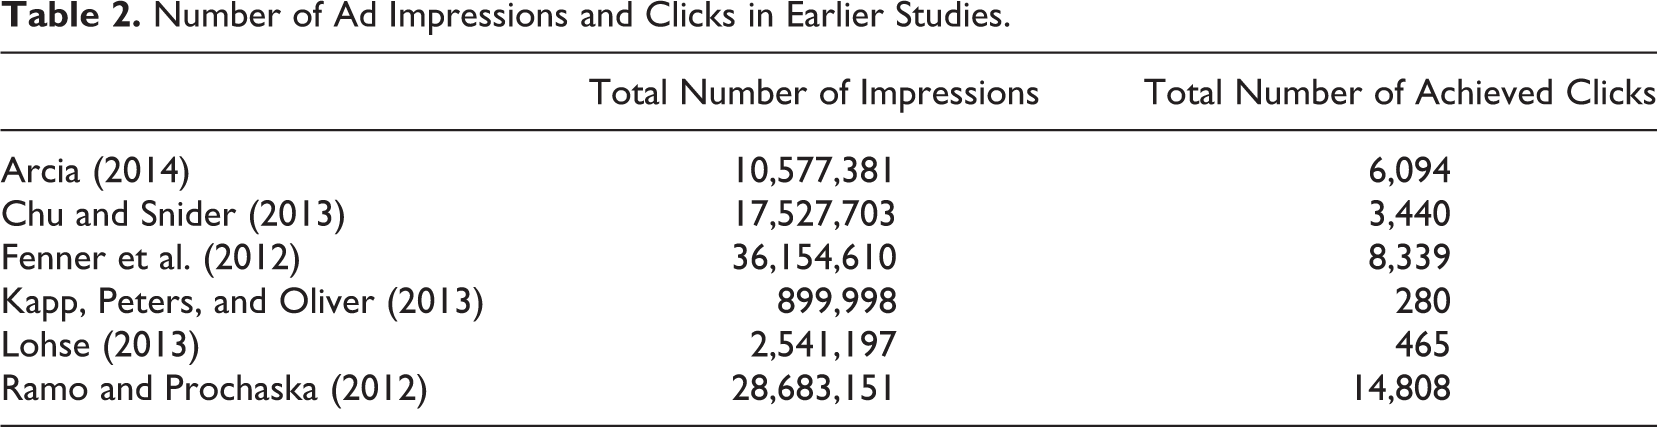
CPC (i.e., payment per click) was chosen as pricing model. This decision was to a large extent due to the pilot character of the present study, which made the constitution of a baseline for comparison with future applications of this sampling technique in migration studies one of its central goals. Furthermore, it had to be considered that, in the above mentioned medical and health related studies, the number of users who were shown an ad surpassed by far the number of clicks which those advertisements received (Table 2). In Arcia (2014), who was the most efficient in this regard, the impression-click-ratio was still 1,736 to 1. If the CPM pricing model had been applied in that case, it would have meant that the researcher would have had to pay for nearly 2,000 impressions just to receive one click. Therefore and in light of limited resources, we judged CPC more appropriate for our study as it allowed the exposure of a higher number of Facebook users to the advertisements.
Number of Ad Impressions and Clicks in Earlier Studies.
While the buyer has to specify the maximum amount he or she is willing to pay, the auction which determines the price runs on an entirely automated basis. This means, the system will place bids on behalf of the buyer and go as high as the specified amount. However, an ad wins the auction as soon as the highest competitor for a target group is overbid. This means that the actual winning bid might be far lower than the specified maximum amount.
The present study used a total budget of €500 (US$557). As payment and budgeting of Facebook advertisements is realized on an ad set basis (see Figure 2), this amount was evenly divided between the two ad sets (i.e., the 18–30 and 31+ cohorts). The prices eventually billed for clicks were—on average—€0.22 (US$0.25) for the 18–30 cohort (ad set 1) and €0.12 (US$0.13) for the 31+ cohort (ad set 2). These amounts are substantially lower than those which Facebook suggested as minimum bids beforehand (the system had, e.g., suggested to bid at least €0.75 (US$0.84) per click for ad set 1).
Finally, besides bidding options advertisers also have to decide between three “optimizations” offered by Facebook. These are “link clicks,” which means that the ads will be shown to people who are likely to click on them, “impressions,” which means that Facebook displays the ads as often as possible, and “daily unique reach,” which means that individual users do not see the ad more than once a day (Facebook, 2016b). Keeping once more the pilot character of the present study and the above mentioned impression-click ratios (Table 2) in mind, the first option, link clicks, was chosen. Nevertheless, it has to be acknowledged that this decision carried the risk to introduce some bias into the sample, as it was neither known to us why the respective users were more likely to click on ads nor whether and how they differed from other users.
Structure and Content of the Questionnaire
After two introductory questions, the questionnaire consisted of three parts: The first section contained 12 questions regarding the usage of Facebook, additional SNSs, other ways of communication and social networks in the country of residence. The second part included 15 questions concentrating on the respondent’s migration experience, mobility, language knowledge, and social networks in the country of origin. The last section consisted of 11 questions collecting socioeconomic background variables. All sections included filters and roughly a quarter of the questions consisted of multiple items. The questionnaire used the “responsive layout” option of the survey software (EFS/Unipark). This means, for example, that grid questions were presented item by item on smaller screens, such as those of smartphones.
Results
Performance of the Advertisements
Within the 4 weeks of advertisement period, the study’s ads were displayed 173,084 times to a total of 90,436 Facebook users. The first of these figures represents the amount of “impressions”; the latter figure, called “reach” in Facebook’s own statistics, means that the advertisements were delivered to slightly less than one fifth of the calculated total target population (Table 1). Most of these individuals were located in the United Kingdom (56%), followed by Ireland (31%), Austria (9%), and Switzerland (4%). Slightly more than half of them were in the 31+ sample. A total of 3,721 individuals clicked on the advertisements. This measure is called “unique clicks” as it includes only one click per user (the total number of clicks was 5,080). Nevertheless, it is misleading if the goal is to judge the performance of an ad campaign. The reason for this is the fact that this number, which appears to be the one reported in most of the previous articles, includes not only clicks on the provided link but all clicks on any component of the ad. This comprises clicks performed in order to expand descriptions, to read comments or to like the ad (Loomer, 2014). A very probable confounding factor increasing the total number of clicks in the case of the present study might have been clicks on the profile name (B in Figure 1) by users who wanted to get additional information on the survey before visiting the survey website.
Hence, in order to judge the performance of an advertisement a different parameter, called link clicks, seems more relevant. This figure corresponds to the number of clicks on the link that is included in an ad and leads the user to the website which said ad is promoting (Facebook, 2016a). Consequently, this is also the figure that Facebook uses for billing if the campaign objective is set to website clicks. The ads used in this study produced 3,194 of such link clicks. At first glance, the huge difference between impressions, total number of reached users, and users who actually clicked on the link is apparent: Only 3.5% of the individuals who were shown our advertisements actually clicked on the corresponding link. However, this figure should not be judged too rapidly, since some users might not have perceived the advertisement at all (e.g., when scrolling down the profile swiftly). The number of impressions just indicates how often an ad is placed on the profile page of users and not how often they perceive it (Facebook, 2016a). Consequently, the ratio of impressions or users reached and link clicks cannot directly be compared to contact rates in other sampling modes, e.g. via telephone, in which a potential respondent consciously interacts with an interviewer, even if he or she eventually decides not to participate in the survey. Hence, the absence of interactions with the ad should not be understood as a refusal.
The results furthermore suggest that the study fared very well in comparison to earlier applications of this recruitment technique. While existing studies frequently report click numbers, they do not specify whether these are unique clicks or link clicks; therefore, the above mentioned figure cannot be compared with the results of other researchers. As Facebook has been continuously adding new features and functionalities, this may also be due to the fact that the distinction was not present at the time the other studies were conducted. However, Facebook statistics provide two measures which are frequently cited. These are called “total click through rate” (link clicks divided by impressions) and “unique click through rate” (unique clicks divided by reach). As shown in Table 3, our advertisements produced better results on both benchmarks than those of all other studies cited. It did so despite the fact that, in contrast to five of the six other projects cited, no incentives were used.
Furthermore, our study performed very well regarding the cost–benefit ratio: While the costs per completed questionnaire amounted to US$4.28 (Ramo & Prochaska, 2012), US$7.37 (Lohse, 2013), and US$16.61 (Arcia, 2014) in other studies, they were only US$0.52 (€0.47) in the present project. If we include the 39 respondents who reached our survey via the projects Facebook page these costs even drop to US$0.50 (€0.45).
Performance of the Survey at Large
As mentioned before, the data collection of our survey was realized on a separate website, i.e. outside the Facebook environment. During the field period ranging from November 18, 2015 to January 13, 2016, the start screen of the survey was viewed 4,752 times. The first question on the subsequent screen was displayed to 1,519 individuals, of which 1,103 completed the online questionnaire. Most of them participated during the lifetime of the advertisement campaign, which lasted only for the first 30 days of the entire survey field period. After its end only three additional persons completed the questionnaire.
In general, the participants had two possibilities to reach the project’s online questionnaire: Firstly, they could directly click on the link that was included in the Facebook advertisement. Secondly, they could visit the project’s Facebook page and click on a participation link which was provided there. The results show, however, that only 39 questionnaires (3.5%) were completed by respondents who took the latter, that is, the indirect way to our survey. Even though this is a small number, we subtracted these 39 respondents when comparing our results with those of other studies (e.g., in Table 3).
Comparison of Key Features and Figures of Studies Using Facebook Advertisements.a
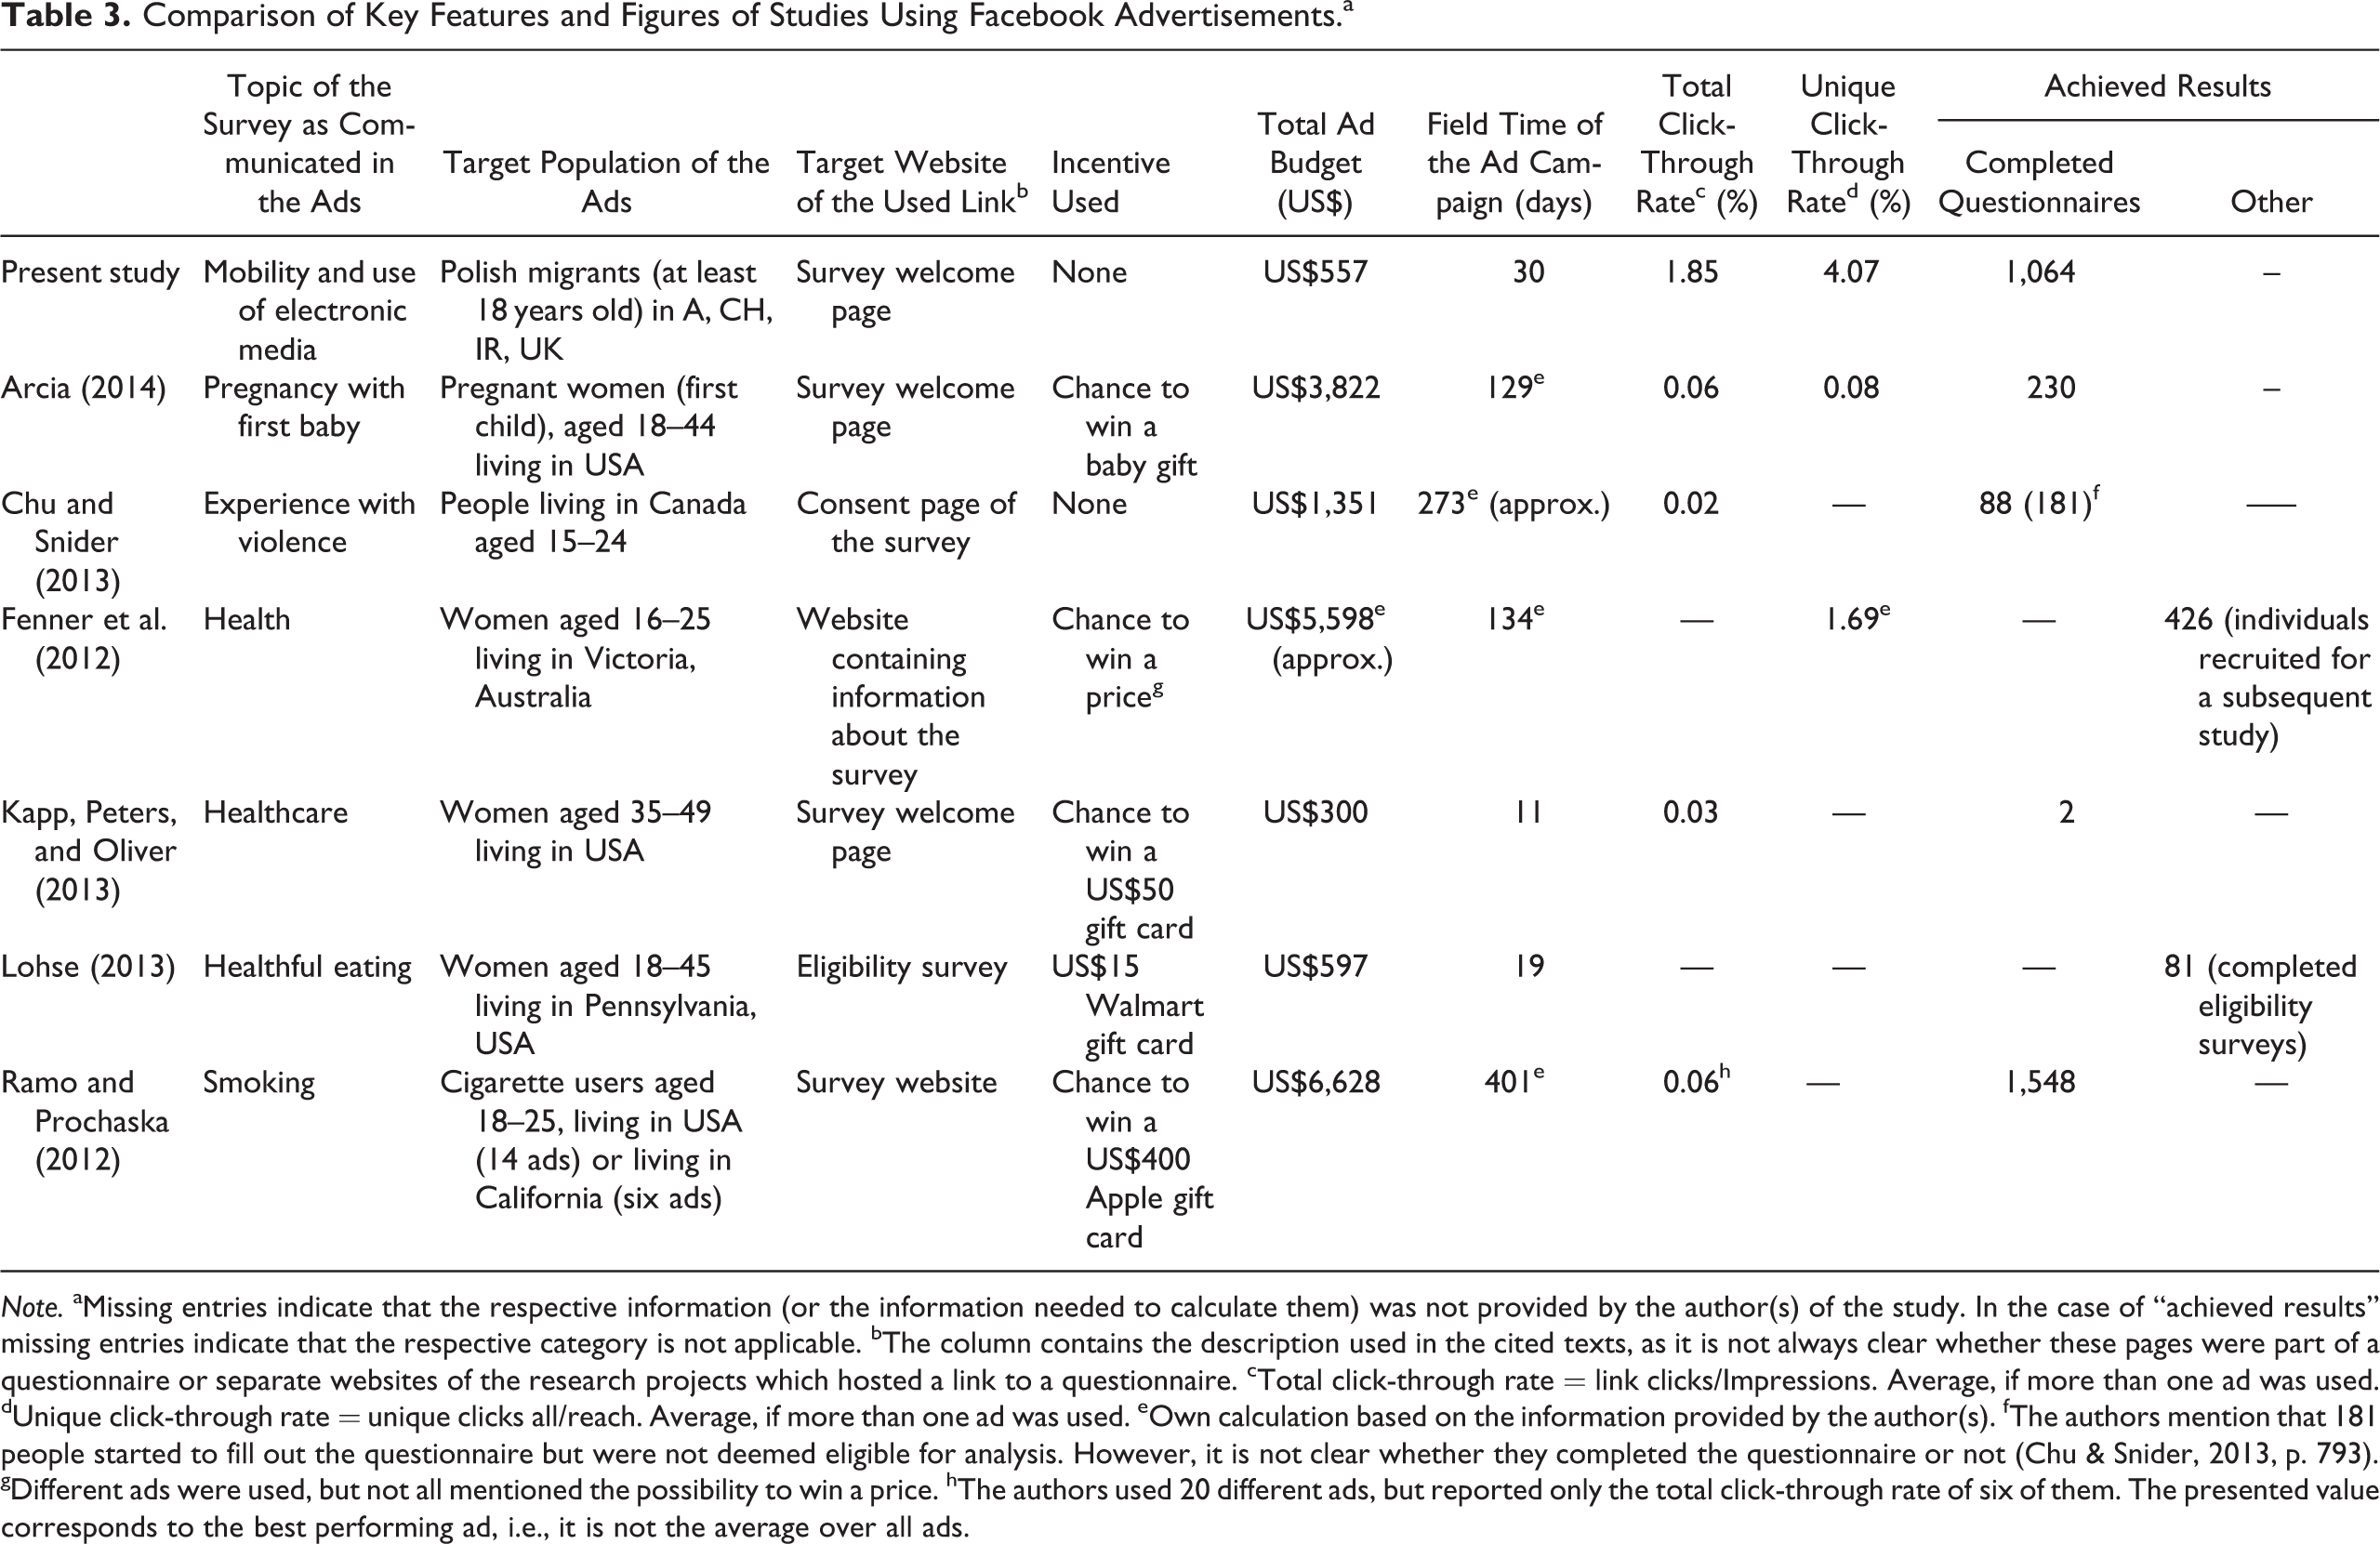
Note. aMissing entries indicate that the respective information (or the information needed to calculate them) was not provided by the author(s) of the study. In the case of “achieved results” missing entries indicate that the respective category is not applicable. bThe column contains the description used in the cited texts, as it is not always clear whether these pages were part of a questionnaire or separate websites of the research projects which hosted a link to a questionnaire. cTotal click-through rate = link clicks/Impressions. Average, if more than one ad was used. dUnique click-through rate = unique clicks all/reach. Average, if more than one ad was used. eOwn calculation based on the information provided by the author(s). fThe authors mention that 181 people started to fill out the questionnaire but were not deemed eligible for analysis. However, it is not clear whether they completed the questionnaire or not (Chu & Snider, 2013, p. 793). gDifferent ads were used, but not all mentioned the possibility to win a price. hThe authors used 20 different ads, but reported only the total click-through rate of six of them. The presented value corresponds to the best performing ad, i.e., it is not the average over all ads.
With a value slightly higher than 72%, the survey yielded an acceptable completion rate (ratio of started and completed questionnaires). However, it is not possible to calculate response rates due to the absence of a clearly defined initial sample. While we know that Facebook displayed the advertisements to a total of 90,436 users, we neither know whether all of them belonged to the target population nor whether they actually saw and read the ads. Especially the latter aspect can be expected to lead to a severe underestimation of the response rate if this figure would be used. Another possibility would be to consider those Facebook users who interacted with the advertisements (i.e., who clicked on them, n = 3,721) as initial sample. However, this approach is equally inappropriate, since this figure excludes all users who actually did read the advertisement but decided not to react to it (i.e., refusals). Hence, the use of this figure would overestimate the response rate. The same holds true if the number of respondents who clicked on the survey link (n = 3,194) would be considered instead.
A closer examination of relative figures at different stages of the survey process (presented in Table 4) reveals interesting similarities between some of the campaign outcomes.
Comparison of Sample Sizes at Different Stages of the Sampling and Survey Process.
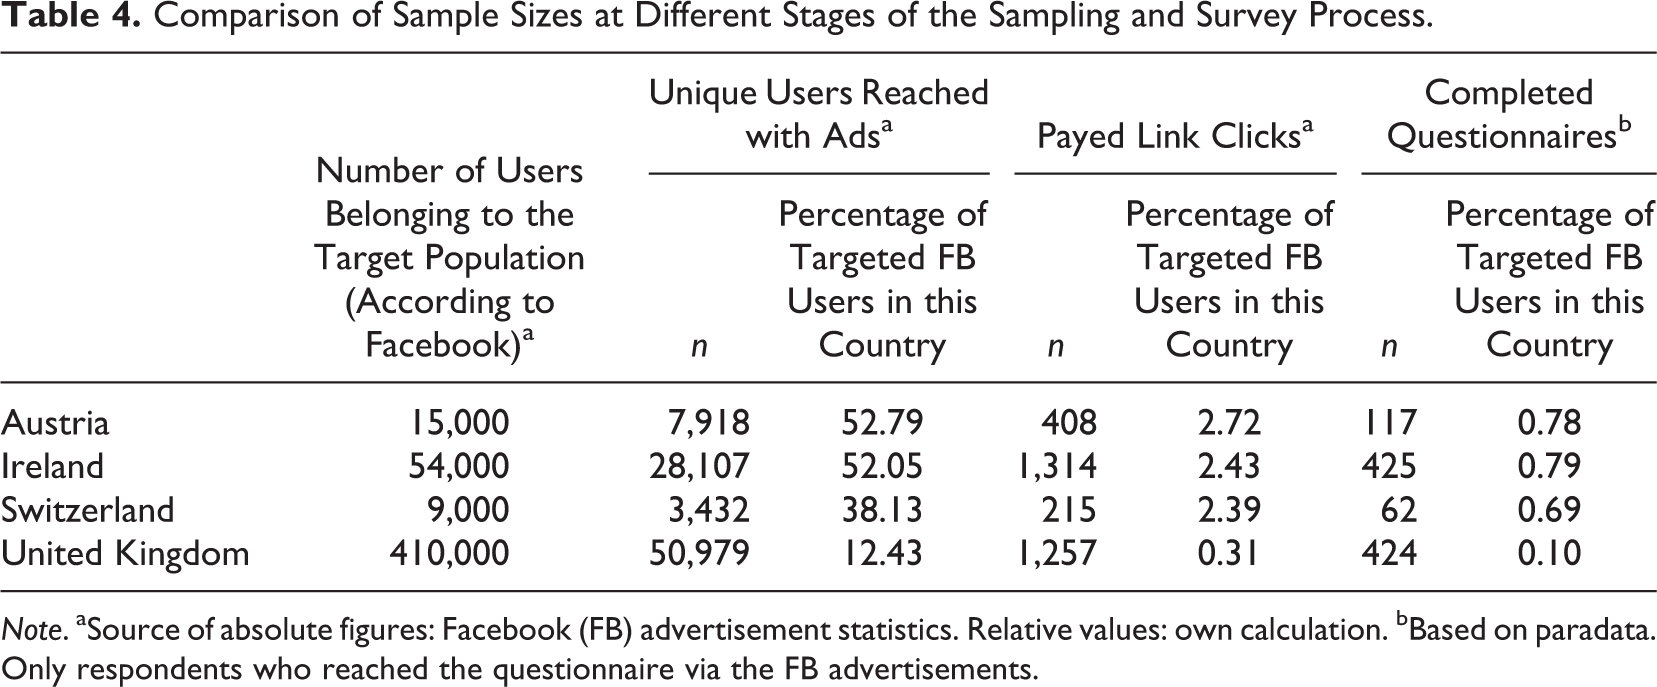
Note. aSource of absolute figures: Facebook (FB) advertisement statistics. Relative values: own calculation. bBased on paradata. Only respondents who reached the questionnaire via the FB advertisements.
The absolute figures presented in the “completed questionnaires” column of Table 4 represent those respondents who reached the online questionnaire by clicking on the advertisement link and for whom the collected paradata showed that they did so from one of the targeted countries. If these figures are compared against Facebook’s estimate of the target population’s total size in each country, it appears that nearly the same share of the overall population participated in our survey in Austria, Ireland, and Switzerland. The same applies to the percentage of members of the target population who clicked on the study’s advertisement. Interestingly, the United Kingdom breaks with this pattern in both instances. However, it also should be considered that the size of the basic population Facebook reported for the United Kingdom exceeds by far those in the other three countries. This resulted in the fact that only slightly more than one out of ten targeted users were exposed to the advertisements in the United Kingdom, while it were nearly four out of ten in Switzerland and more than half in Austria and Ireland.
Devices Used and Completion Time
Nearly, two thirds (64%) of those respondents who completed the survey used smartphones, followed by exactly one fifth who used desktop computers and 9% using tablets. For 7% of the respondents the software could not identify the type of device used. The circumstance that most respondents completed the survey on a mobile device has partly to be seen as a direct result of the fact that most of the reached users were exposed to the advertisements on such devices, too. Facebook provided information on the type of devices on which the advertisements were displayed for 90,108 users. According to these figures, the overwhelming majority of users saw the advertisement on smartphones (87%), while another 3% were using Facebook on tablets when they received the advertisement. Finally, 14% of those exposed to the ads used desktop computers. These figures sum up to more than 100% due to the fact that the ads were displayed to some users on more than one device. In any case, it is important to note that Facebook, by default, does neither split advertisement targets evenly across device types nor across targeted countries (as can be seen in Table 4 and is further discussed below). Finally, it is worth mentioning that the share of users who completed the survey on a desktop computer is, with 20%, considerably higher—in relative terms—than the share among Facebook users who clicked on the ad link on a desktop computer (14%).
The mean completion time of the questionnaire was 13.6 min (median 11.2 min). While it differed by nearly 4 min between tablet and desktop users, median completion times are much closer to each other with 10.7 min on tablets, 11.3 min on smartphones, and 11.5 min on desktop computers. It is worth mentioning that the result of this superficial comparison of overall survey completion time is contrary to what was observed in a number of other surveys cited by Couper and Peterson (2016), which mostly found that survey completion took longest on smartphones and was achieved quickest on desktop computers, with tablets being in between the other two device types.
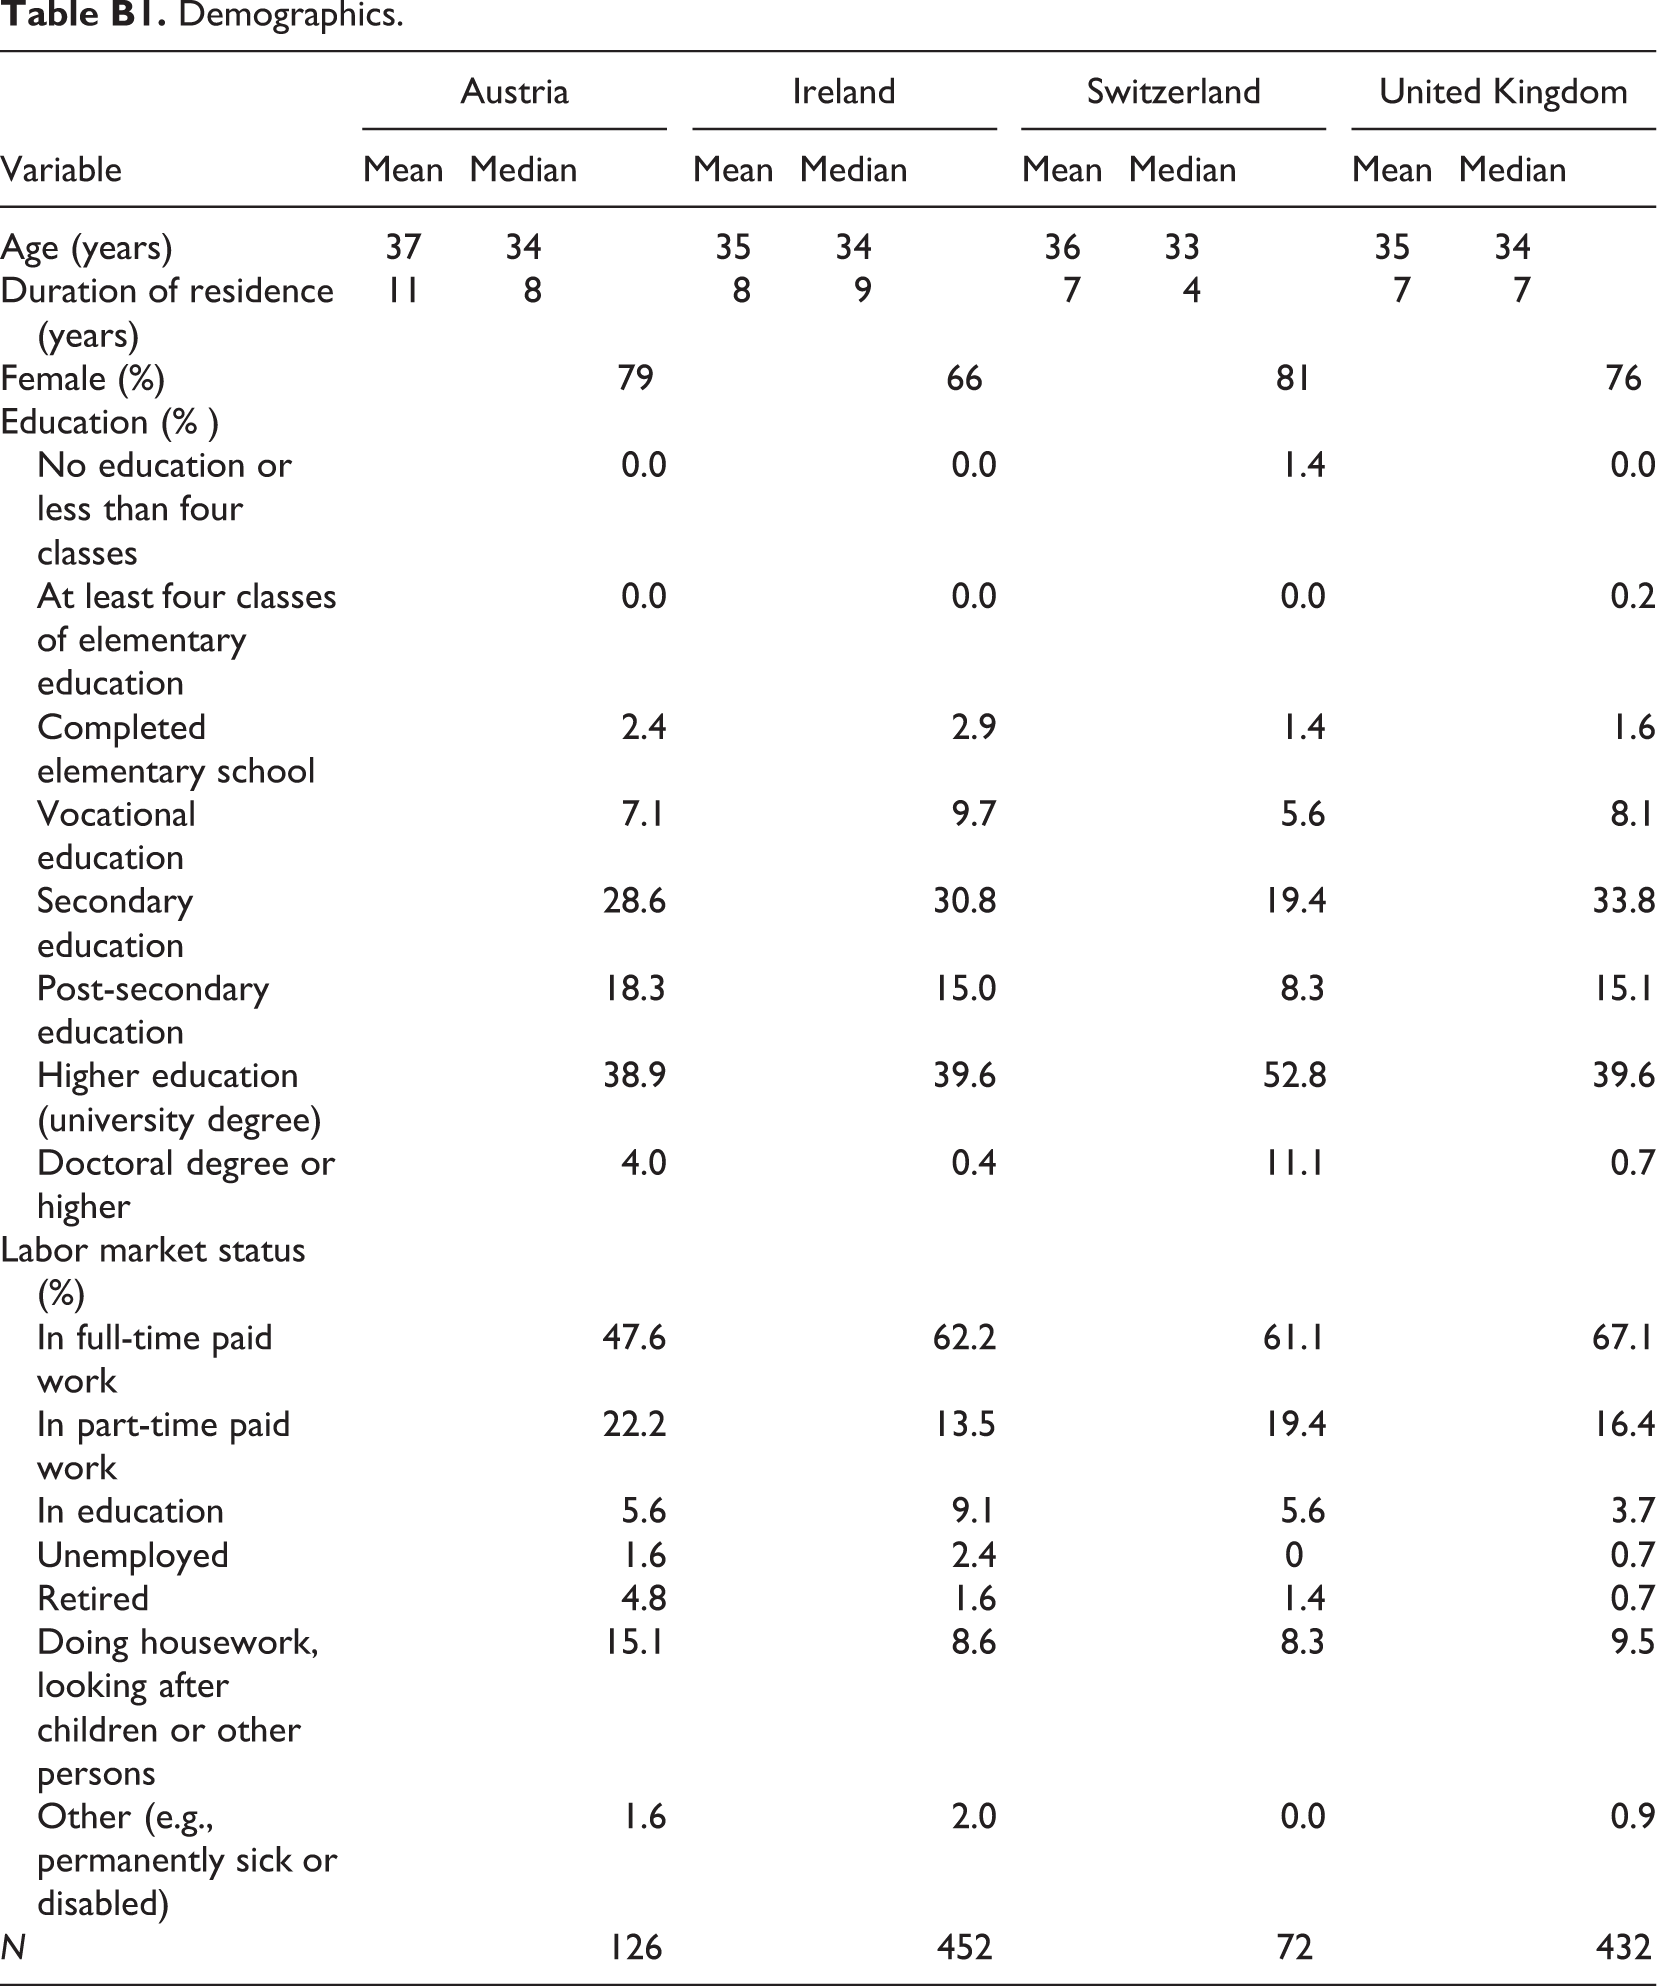
Description of the Realized Sample
On a general note, it can be said that the participants who completed this study were on average 35 years old, with the youngest being 16 and the oldest 81. They were, furthermore, predominantly female (72%), comparatively well educated (88% received at least secondary education and 42% held a university degree), and the overwhelming majority (78%) participated in the labor market (either full or part time) at the time of the survey. While Appendix B1 offers a short overview regarding these characteristics on a country level, the following section will concentrate on some of the key variables that were used to define the target population of the advertisements. This is especially relevant since the aim of the study was to test whether a specific target population could be sampled with the help of such Facebook ads. To evaluate this aspect, three questions are of special interest: (1) Were the respondents living in Austria, Ireland, Switzerland or the United Kingdom at the time of the survey? (2) Are the respondents indeed originally from Poland and can hence be described as Polish migrants? and (3) Were the respondents at least 18 years old at the time of the survey?
Data which can be used to answer the first question come, in fact, from two different sources. Firstly, during the survey respondents were asked to state the country they were living in. A clarification comment was provided that defined this country as the one where respondents spend most days of a month. The second data source consists of location data derived from the IP addresses of respondents. Of the total sample (n = 1,103), only 21 respondents stated that they were not living in one of the targeted countries. Fifteen of them reached the questionnaire via the link provided in the advertisement, among them were the only three respondents who identified Poland as their country of residence. This means that, according to their own account, more than 98% of those respondents who used the advertisement link to participate in the survey lived in one of the target countries. The same holds true if the overall sample is considered, that is, for 1,082 out of 1,103 respondents. The available paradata show that 1,040 of them did also access the questionnaire from said country. This means that the paradata are congruent with the given answers for 96% of the respondents who stated that they were located in one of the target countries (it is the same percentage if only those are considered who reached the survey through the advertisement link). However, regarding the small percentage for whom this is not the case it should also be considered that an IP address can only serve as a proxy for a respondent’s location (as the person might use a virtual private network) and, in addition, the individual might well live in the specified country but fill in the questionnaire while being on vacation or on a business trip.
Most of the respondents resided either in Ireland or in the United Kingdom, whereas only smaller portions lived in Austria and Switzerland (Table 4). Moreover, of the 4,752 clicks to the welcoming page 4,565 clicks (i.e., 96%) came from the targeted countries. Overall, these results show that the geographic targeting of Facebook advertisement worked quite well and that it is possible to target Facebook users in specific countries for sampling purposes using this tool. However, it can also be observed that the reached absolute sample sizes vary considerably between countries. It can be assumed that these differences were in part caused by the aforementioned Facebook algorithms which push well performing ads. This means, the more people clicked on an ad in a specific country the more this ad was likely to be displayed in said country. Taken together with the previously reported observations it can be concluded that researchers should use separate ad sets if they want to realize a particular distribution along device types or countries.
In order to identify and target Polish migrants, this study applied the targeting option “expats (Poland).” It seems that Facebook uses the term expat as a synonym of migrant, possibly in order to avoid the latter, as this option is advertised as “Helping Marketers Reach People Living Abroad” (Facebook, 2015c). However, the definition of the term expat offered by Facebook is very vague. As mentioned above, it consists only of the sentence “People from Poland living abroad” (Facebook, 2015a) and leaves open which variables are used to characterize them. Since no further explanation is offered, two very basic variables will be used—in conjunction with the country of residence discussed above—to review whether the respondents actually were migrants. These two variables are country of birth and nationality. Hence, a migrant is defined as a person who does not live in Poland but was born there or holds Polish nationality.
The survey data show that three persons actually considered Poland their country of residence. Of the 1,100 respondents who did not live in Poland, 1,088 stated that they were born in this country. Furthermore, 1,078 mentioned that they held Polish nationality. A comparison of the given answers showed that only four respondents did not say that either applied to them.
In conclusion: of the 1,103 respondents who completed the survey only seven cannot with certainty be described as Polish migrants. This means that more than 99.4% of all respondents who completed the survey were Polish migrants (broadly defined). However, it is not possible to disentangle completely the effects of the sampling procedure and of the information given on the welcome page of the questionnaire, which clearly stated that the survey targeted Polish nationals living abroad. Furthermore, 97.7% were Polish migrants according to the more narrow definition presented to potential respondents (i.e., holding Polish nationality).
A total of 23 respondents did not provide (valid) information regarding their age. Hence, the study collected information on the age of 1,080 respondents. Of those, two respondents were 16 years old and therefore did not fall in the sampling frame defined within the Facebook advertisement manager. They might have introduced a wrong age either while registering for Facebook or in our survey. It is also possible that they have seen and clicked on our advertisement on the profile page of an acquaintance. In any case, 1,078 respondents (97.7% of the sample) belonged to the target population according to their age.
Finally, a total of 1,055 (96%) of the 1,103 respondents who completed the survey fulfilled all sampling criteria, meaning, according to the answers they provided, they were born in Poland and/or held Polish nationality, lived in one of the four targeted countries, and were at least 18 years old. This result shows that studies which apply this sampling approach should include questions that can be used to verify the sampling results in their questionnaires. More importantly, however, it underlines that the targeting mechanism of Facebook advertisements did work well in identifying users which belonged to the specified population.
Findings With Respect to the Reachability of Our Respondents via Telephone-Based Sampling
Besides assessing in general whether and how migrants could be sampled using Facebook advertisements, another important goal of this study was to investigate whether these migrants could also have been reached with telephone-based sampling methods. Given that the two mainly used procedures for the latter are RDD and onomastic sampling, the questionnaire included specific items with regard to the telephone connections of the respondents.
The data show that nearly all (97%) of the 1,100 respondents outside Poland had a mobile phone at their disposal and used it with a telephone number of the country they were living in. However, only 42% lived in a household which had a landline connection. The respective value varied on the country level, being lowest in Austria (28%) and highest in the United Kingdom (53%), with Ireland (34%) and Switzerland (44%) in between. Taken together, a total of 1,080 respondents (98%) could, theoretically, be reached with RDD if mobile and landline numbers would be used. However, as previously mentioned, such sampling would be very costly since it would have to include a screening procedure realized by the interviewers.
To reduce the costs caused by such interviewer screenings, migrant studies often use name-based (i.e., onomastic) sampling procedures, as explained above. As mentioned, this method only works well if the members of the target group are themselves included in a telephone registry. Therefore, we use the question whether a given landline is registered to the respondent as a proxy for the possibility of reaching him or her by onomastic sampling. With slightly over 16% the subsample in the United Kingdom also had the highest share of respondents included in a telephone directory (11–12% in the other three countries). Taken together, only 14% of the respondents in our survey stated that they were included in the telephone book of their country of residence as owners of a landline number. Moreover, even if those respondents who were not sure whether this applied to them are added to this group, the result would indicate that 78% of the respondents were very unlikely to be reached with onomastic sampling as their names were not included in telephone registries.
Hence, we can conclude that it is very likely that more than three quarters of our study’s sample would not have been reached if onomastic sampling had been applied. Furthermore, nearly 58% of the sample would not have been reached with an RDD procedure limited to landline numbers.
Conclusion
This article presented first results of an innovative sampling procedure, which, hitherto, had been tested only in a few instances and, to the best of our knowledge, never in the context of migration studies or cross-national research. We showed that Facebook advertisements can successfully be employed to sample usually hard-to-reach populations in this setting. Within the four weeks in which the advertisements were running, 1,100 individuals completed the survey. The overwhelming majority (96%) of the total sample (n = 1,103) belonged to the target population. The sampling method also proved to be very cost efficient as no incentives had to be used and the total costs of the advertisement campaign was €500 (US$557), which corresponds to €0.45 (US$0.50) per completed questionnaire.
As most of the respondents were indeed Polish migrants, it can be concluded that the targeting mechanism of Facebook advertisements works very well. Our findings suggest that future researchers who wish to reach comparable sample sizes in different countries should use separate advertisement campaigns in each of them. In this study, samples sizes varied greatly in the four targeted countries as a country-specific approach had not been employed. Partially responsible for this outcome were the algorithms employed by Facebook which, on the one hand, push particularly successful ads and, on the other hand, do not distribute the advertisements evenly across countries.
Nevertheless, even under these conditions a considerable share of the sample was located in Switzerland, which houses a much smaller Polish community than the other three countries. This suggests that the presented approach might be successfully used to sample smaller and scattered migrant groups in a given country, which are especially hard to reach with more traditional approaches.
As discussed above, our study also performed very well in direct comparison to the few other studies which employed the same sampling technique. However, this might partially be due to the fact that these studies investigated more sensitive topics. Furthermore, feelings such as pride in national origin or nostalgia might have worked in favor of the present study and enhanced the willingness to participate.
The presented results suggest that more than three-quarters of the migrants would probably not have been reached with onomastic sampling, as they did not have a landline telephone number registered to their name. Furthermore, more than half would not have been reached if RDD had been applied only to landline numbers. Hence, it is safe to assume that most of the respondents would not have been sampled into a telephone sample if standard procedures in this area had been applied.
Additional research is needed to determine whether migrants sampled by the presented technique differ from those who are sampled using more traditional approaches. More generally speaking, the results of this study encourage further research into the use of SNS as sampling frames in migration research and other cross-national studies. This research should include, but not be limited to, the improvement of the presented approach. It should, furthermore, be investigated how the same or a very similar sampling procedure could be used simultaneously in more than one SNS in order to increase the reach of a given study and to diversify its sample.
Footnotes
Appendix A
Appendix B
Demographics.
| Variable | Austria | Ireland | Switzerland | United Kingdom | ||||||||
|---|---|---|---|---|---|---|---|---|---|---|---|---|
| Mean | Median | Mean | Median | Mean | Median | Mean | Median | |||||
| Age (years) | 37 | 34 | 35 | 34 | 36 | 33 | 35 | 34 | ||||
| Duration of residence (years) | 11 | 8 | 8 | 9 | 7 | 4 | 7 | 7 | ||||
| Female (%) | 79 | 66 | 81 | 76 | ||||||||
| Education (% ) | ||||||||||||
| No education or less than four classes | 0.0 | 0.0 | 1.4 | 0.0 | ||||||||
| At least four classes of elementary education | 0.0 | 0.0 | 0.0 | 0.2 | ||||||||
| Completed elementary school | 2.4 | 2.9 | 1.4 | 1.6 | ||||||||
| Vocational education | 7.1 | 9.7 | 5.6 | 8.1 | ||||||||
| Secondary education | 28.6 | 30.8 | 19.4 | 33.8 | ||||||||
| Post-secondary education | 18.3 | 15.0 | 8.3 | 15.1 | ||||||||
| Higher education (university degree) | 38.9 | 39.6 | 52.8 | 39.6 | ||||||||
| Doctoral degree or higher | 4.0 | 0.4 | 11.1 | 0.7 | ||||||||
| Labor market status (%) | ||||||||||||
| In full-time paid work | 47.6 | 62.2 | 61.1 | 67.1 | ||||||||
| In part-time paid work | 22.2 | 13.5 | 19.4 | 16.4 | ||||||||
| In education | 5.6 | 9.1 | 5.6 | 3.7 | ||||||||
| Unemployed | 1.6 | 2.4 | 0 | 0.7 | ||||||||
| Retired | 4.8 | 1.6 | 1.4 | 0.7 | ||||||||
| Doing housework, looking after children or other persons | 15.1 | 8.6 | 8.3 | 9.5 | ||||||||
| Other (e.g., permanently sick or disabled) | 1.6 | 2.0 | 0.0 | 0.9 | ||||||||
| N | 126 | 452 | 72 | 432 | ||||||||
Declaration of Conflicting Interests
The authors declared no potential conflicts of interest with respect to the research, authorship, and/or publication of this article.
Funding
The authors received no financial support for the research, authorship, and/or publication of this article.