
Abstract
The use of progress indicators seems to be standard in many online surveys. Researchers include them in surveys in the hope they will help reduce drop-off rates. However, there is no consensus in the literature regarding their effects. In this meta-analysis, we analyzed 32 randomized experiments comparing drop-off rates of an experimental group who completed an online survey in which a progress indicator was shown to drop-off rates of a control group to whom the progress indicator was not shown. In all the studies, a drop-off was defined as a discontinuance of the survey (at any point) after it has begun, resulting in failure to complete the survey. Three types of progress indicators were analyzed: constant, fast-to-slow, and slow-to-fast. Our results show that, overall, using a constant progress indicator does not significantly help reduce drop-offs and that effectiveness of the progress indicator varies depending on the speed of indicator: Fast-to-slow indicators reduced drop-offs, whereas slow-to-fast indicators increased drop-offs. We also found that among the studies in which a small incentive was promised, showing a constant progress indicator increased the drop-off rate. These findings question the common belief that progress indicators help reduce drop-off rates.
Introduction
A decline in response rates in surveys is a problem that occurs in all modes of data collection. Researchers try to manipulate different aspects of survey design to increase response rates, such as by offering incentives for participating or by increasing the number of contacts with the sample unit. Some of these strategies can be used similarly across modes (e.g., the use of incentives), whereas others are specific to one mode and need to be adapted for other modes (e.g., varying time of interviewer visits vs. varying the type of envelope used in a mail survey invitation).
Strategies to increase response rates depend also on the component of nonresponse that a researcher intends to decrease: noncontacts, refusals, or incomplete interviews, such as those resulting from drop-offs. A survey drop-off refers to the situation in which a respondent fails to complete a survey after starting it. Drop-offs can result in loss of data for some questions (item nonresponse) or even the entire survey unit (unit nonresponse) if the drop-off happens in the early stages of the survey-taking process. Both item and unit nonresponse may lead to biased or imprecise estimates and inferences if those who drop off differ systematically with respect to the variables of interest from those who complete the survey. This study focuses on evaluating the effects of using progress indicators as a strategy to reduce survey drop-offs.
Although drop-offs are a potential threat to all surveys modes, especially self-administered ones, there is a concern that as the number of web surveys increase so too will the problem of drop-offs. Dillman, Smyth, and Christian (2009) warn us that the survey experience “is now highly impersonal and is increasingly controlled by respondents who feel less obligated to provide requested information and for whom refusing is now more socially acceptable” (p. 10). With interviewer-administered surveys, the presence of an interviewer allows for strategies to be implemented to keep respondents motivated throughout the survey, potentially reducing drop-offs and, hopefully, maintaining the respondent’s engagement in the task at an optimal level. Interviewers can address questions and hesitations from respondents and can attempt to maintain engagement when respondents show signs of decreased motivation. For example, when a fatigued respondent asks how much longer the interview will last, the interviewer can provide positive feedback (“thank you very much for your answers”), try to reschedule the interview for another time, or remind the respondent that there are only a few questions left. The presence of interviewers in face-to-face and telephone surveys, thus, can help decrease drop-offs in ways that are not immediately available to self-administered (such as mail or web).
Progress feedback may still be present in self-administered surveys. In mail and in web surveys that use a scrolling design in which the entire questionnaire content is presented on one “page,” respondents may simply look through the remaining pages or questions to get an idea about how much more of their task remains. However, presenting questions on different “pages” (“page-design”) is considerably more common than the scrolling design in web surveys (see Couper, 2008). With a multiple-page design, a respondent’s progress is no longer apparent; although at the start of each survey, respondents are typically informed of its approximate duration, there is no immediate information given on their progress made at any given point with respect to the total effort necessary to complete the task. Thus, the use of computer-based progress indicators in these page-design web surveys attempts to provide respondents with feedback about how much of the task remains in a way that mimics what interviewers do during the interview process.
Survey researchers, thus, have adopted computer-based progress indicators to display progress feedback in online surveys—to provide respondents with information about how much more time they need to invest. The hope or belief is that providing such information will encourage respondents who start a survey to complete it (Conrad, Couper, Tourangeau, & Peytchev, 2010; Heerwegh & Loosveldt, 2006). An underlying assumption is that increasing the number of respondents who finish the survey will increase response rates and, in turn, reduce total survey error; however, it is possible that some respondents who would have dropped off had the progress indicator not been there are overall less motivated, thus likely providing data of lower quality than other respondents. If data quality among low-motivated respondents is indeed lower, this might result in higher measurement error and thus increase total survey error in spite of the lower nonresponse error. This assumption, unfortunately, has to our knowledge not been tested, as no study addressing this issue was found in the literature.
Additional benefits of using a progress indicator have been suggested, such as improving
respondents’ satisfaction with the survey experience (Conrad et al., 2010; Matzat, Snijders, & van der Horst, 2009). In
the 2005 “Guidelines on Conducting Market and Opinion Research Using the Internet,” the
European Society for Opinion and Marketing Research (ESOMAR) suggested that For surveys completed online, respondents must be told about the length of time
the questionnaire is likely to take to complete under normal circumstances (e.g.,
assuming connection is maintained). The use of some form of metering device so
that respondents can track their progress through the questionnaire is
recommended. (ESOMAR,
2005, p. 7)
1
Despite the popularity of progress indicators, it is unclear whether they actually help reduce drop-offs or increase satisfaction with the survey experience (Couper, 2008). This is not to say research has not been carried out. We have located a moderate number of published and unpublished experimental studies that investigated the impact of using progress indicators on respondents’ likelihood of dropping off. However, findings from these studies regarding the effect of progress indicators appear to be mixed, where some studies found that progress indicators reduced drop-offs, some concluded that they increased drop-offs, and yet others found that they had no effect on drop-off rates. As in any empirical research, inconsistencies in the findings could be the result of sampling errors or other artifacts associated with individual studies. At the same time, inconsistencies may also reflect systematic effects attributable to substantively meaningful factors. Because the existing studies also differed in terms of their designs and implementations, it is unclear whether the observed differences in the effects of progress indicators were due to artifacts or to other varying design features.
The goal of our study is to synthesize findings across these studies in order to discover a generalizable pattern regarding the effect of progress indicators on survey drop-offs in web surveys. To achieve this goal, we adopted a meta-analytic approach. Meta-analysis is a statistical method that provides estimates of the relationship between variables from the combination of results of a number of studies, after accounting for the impact of sampling errors and/or other artifacts. It also tests whether any observed relationship is generalizable across conditions (in our case, different progress indicator designs) by evaluating whether there are true systematic variations in the relationship. If systematic variations are found, meta-analyses allow for the investigation of what systematic factors (moderators) might account for such variations. In sum, we have used meta-analysis to summarize findings of the effect of progress indicators across studies (allowing us to distill true effects from artifacts) and to identify potential moderating factors that may explain systematic and meaningful variations in the progress indicator research findings.
Background and Literature
Survey researchers know that during interviewer-administered surveys people ask for feedback on the remaining survey duration and that respondents have the ability to try to predict the duration in mail surveys by checking the number of pages. Anticipating that respondents would want progress feedback when completing web surveys, it seemed only logical to provide such feedback by using existing tools that communicate task progress to computer users, that is, progress indicators.
Progress Indicators in the Human–Computer Interaction (HCI) Literature
Progress indicators were first studied in the HCI literature (Myers, 1983, 1985). HCI research focused on studying the perception of task duration in comparison to the speed of a progress indicator. Research in this area has shown that, for computer tasks, users prefer having a progress indicator in comparison to not having one when waiting for an operation to be completed (Myers, 1985). In addition, HCI research has found that perceived task duration is affected by how fast or slow the progress indicator is toward the end of the task: The duration of a progress bar (and hence, of the related task) is perceived shorter if the speed of the progress indicator is faster toward the end of the task (Enomoto, Ohnishi, & Yoshida, 2006; Harrison, Amento, Kuznetsov, & Bell, 2007). 2
However, the nature of the interaction between computer and human in a web survey has notable differences when compared to other computer tasks. First, progress indicators in computer functions often convey progress on tasks that last a few seconds or minutes, and even if they last longer, the user (a) has no control over the speed of the task and (b) has the option to perform other tasks while the long process takes place. In other words, progress in such computer tasks typically does not depend on the behavior of the human and the progress indicator simply informs them of whether progress is being made. Second, the task that progress bars describe has a clear goal, and users expect to obtain the desired result from the device at the end (e.g., transfer a file, see a website, or install a program). So presumably the reward in that context can be considerably larger than the reward obtained by completing a survey (unless incentives are offered). Third, progress indicators in web surveys are placed in areas where visual focus rarely goes (most commonly on the top right corner), whereas, in computer tasks, progress indicators are presented in pop-ups that are highly visible. As a result, some survey respondents may not even be aware of the presence of a progress indicator, especially at the beginning, when they are getting familiar with the survey topic and the task at hand. In contrast, computer users almost inevitably see the action of the progress indicators at least during the first seconds of a computer task. In research regarding computer functions, moreover, participants are studied in lab contexts where they focus their attention mainly on the task at hand (comparing or judging progress indicators) and therefore will probably look at them from beginning to end. Finally, progress indicators used in some of the HCI studies reviewed did not offer prior information regarding the total time the task would take to complete, but in the survey studies we analyzed in this article and in surveys in general, respondents are informed about the duration of the task before it is started. Therefore, we should not be too surprised if findings from the HCI literature do not generalize to the effect of progress indicators in survey experiences.
Progress Indicators in the Survey Research Literature
In this section, we discuss the rationale behind the use of progress indicators in survey research and the theoretical explanations that have been proposed to account for the effect of progress indicators in online surveys. Additional hypotheses that have not been explored by existing literature are examined in the discussion section of the article. A detailed description of the findings regarding the effect of progress indicators on drop-off rates is presented in the Results section.
Researchers have offered varying explanations as to how progress indicators may affect respondents’ behaviors. These explanations by and large relate to the social exchange theory framework (see, e.g., Heerwegh & Loosveldt, 2006). When applied to survey participation, social exchange theory suggests that people participate in voluntary surveys if they believe that what they will gain from the activity (rewards) outweighs what they will expend to obtain the gain (costs; see, e.g., Dillman, Smyth, & Christian, 2009). It further states that such cost–reward analysis is based on the trust that the survey provider will follow through with the provided information regarding those aspects that are evaluated in the reward–cost analysis.
Respondents may be repeatedly engaging in cost–reward analysis during the course of a survey. For such analyses, respondents may include various pieces of information in their calculation, such as the promised incentive, their interest in the topic, and the pleasantness and ease of the task. Progress indicators, when present, can provide one such piece of information: They convey feedback to the respondent on their progress relative to the beginning as well as to the end of the activity—displaying the completed amount in the context of the total amount that is required. Thus, progress indicators serve as “cost forecasters,” giving information that can be used to assess how much more investment needs to be made to complete the survey and obtain the reward. The respondent can use this information to reassess whether such investment is worthwhile. However, it is reasonable to expect that not all respondents will use the information; therefore, not all respondents will be affected by progress indicators in the same way (much like most survey features). Nevertheless it is important to find out whether a manipulation has, overall, an effect (positive or negative) on important survey outcomes, such as response rates, even if the effect is not constant for all potential respondents.
Another proposed explanation for the effectiveness of progress indicators is based on
the idea that “knowledge is pleasing” (Conrad et al., 2010; Crawford, Couper, & Lamias,
2001; Myers,
1985), and thus simply providing knowledge about progress may motivate
respondents to continue. A similar notion is the “light at the end of the tunnel”
analogy used by Conrad, Couper,
Tourangeau, and Peytchev (2003, 2005, 2010) and Jacobs (2007). Or, as Sue and Ritter put it, [G]etting lost when taking a survey is frustrating and can cause respondents to
drop out before completing the survey [ … ] It is helpful for the reader to
have an understanding of the location and how far he or she is from the
destination point, which is the end of the survey. (2012, p. 93)
Other factors may also contribute to making progress indicators more or less effective. First, respondent characteristics may affect how the progress indicator is understood and used. Their onset level of motivation, the time that they initially set aside for the survey, where they are, and what device they are using to take the survey may all influence whether the progress indicator helps them stay motivated or not.
Second, when the progress indicator is offered and/or checked by respondents might affect the way it influences drop-offs. Two competing perspectives have been offered on this topic. The first impression hypothesis suggests that it is important to provide encouraging messages about progress early in the survey when it may have the greatest effect on respondents (Conrad et al., 2005; Matzat et al., 2009). The surfacing hypothesis suggests that respondents may need to be reminded or “remotivated” throughout the course of a survey, especially in the later part, by receiving encouraging feedback about their progress (Matzat et al., 2009). Whether the feedback respondents receive is encouraging or discouraging will depend on their expectation of how much progress they have made and whether the feedback matches that expectation.
Third, the actual design of the progress indicator may affect its impact on drop-off rates. Different designs might convey different messages or be more or less visible (Conrad et al., 2003). Progress indicators differ in terms of their visual display styles (where they are placed, how large they are, the font used, their color, etc.), the information conveyed (e.g., how many questions have been answered, the percentage of questions answered, or a drawn bar without numbers or words), and their “speed” or rate of progress (see next section for a description). Variations in the design of the progress indicator used may be another reason why results across studies have differed.
Other design features of the surveys in which progress indicators are used may interact with its effects. One particular aspect of a survey that might be likely to interact with the effect of progress indicators is the expected survey duration, which is affected by the time estimate communicated to the respondent. When surveys provide estimations of duration upfront, respondents may set up a baseline commitment of costs. This may, in turn, interact with the perceived cost during the course of the survey. When a respondent’s adjusted assessment of cost is larger than their baseline estimate, they may abandon the survey; whereas, if a respondent’s perception falls within the range of the initial time commitment anticipated, this may encourage continuation of the survey. Similarly, how the survey duration message is presented (vague vs. specific) and actual survey duration may also have an impact. For example, Yan, Conrad, Couper, and Tourangeau (2011) argued that people who have already engaged in a long survey might be subject to the “sunk cost bias” in their decision making and continue on despite feeling that the process has already cost them a lot.
In our meta-analytical study, we performed subgroup analysis to explore possible interactions with design features —when data on such features were available for a sufficient number of studies. However, due to limitations in the number and characteristics of the available studies, we were not able to explore a number of factors that theoretically would be interesting to study.
Styles and Types of Speed in Progress Indicators
Although the basic concept of a progress indicator may be simple and straightforward, in practice, there is variation in how progress is displayed and conveyed. The advent of computer-based surveys and psychological and educational testing further invites creativity in designing and deploying progress indicators. Still, varying shapes and forms of progress indicators may be classified along two aspects, namely, their visual presentation style and their speed design.
Styles of Progress Indicators
Various styles of progress indicators have been described in the survey literature and offered by different survey software vendors. They can be classified into three groups: textual, graphic only, and graphic and text (Kaczmirek, 2009). Examples of these types of progress indicators can be found in the online Supplementary Appendix (Figures A1–A5).
Textual progress indicators describe progress using words, for example, presenting the number of screens or questions completed and also those remaining (Figure A1).
Graphic-only progress indicators do no attach any percentage or number of pages (which makes them less specific than textual indicators) but give respondents an idea of where they are in the survey by “filling up” a container as progress is made (Figure A2). Although horizontal bars are the most commonly used form of graphic progress indicator, other designs are also available. For example, the survey platform Snap showed a glass that got fuller as respondents answered more questions (Figure A3).
Finally, textual-and-graphic progress indicators show some textual information (e.g., percentages of completion, number of pages) together with a graphic visualization of progress. A typical example of textual-and-graphic indicator is the progress bar (Figure A4). In another type of textual-and-graphic progress indicator, a table is used to show the subtopics or sections of the survey, and color-coding indicates the completed and remaining sections (Figure A5). This type of indicator was used, for example, in the 2007 National study of Living Learning Program (Sakshaug & Crawford, 2010). Of course, many variations are possible as a result of combinations of different textual or graphic designs.
Even though the design of progress indicators vary in some aspects across surveys, size, position, and visibility are kept within a “sensible” range of values; therefore, progress indicators are quite homogeneous with respect to the variables that matter most.
Speed of Progress Indicators
In the studies considered for this meta-analysis, authors manipulated the speed in progress indicators to investigate the mechanism behind the effects of these devices on drop-off rates. Three types of speed were used: constant or linear speed, fast-to-slow (or “fast-first-then-slow”), and slow-to-fast (or “slow-first-then-fast”; Conrad et al., 2003). In the constant speed design, the progress shown is equal to the number of pages (or questions) presented to that point divided by the total number of pages (or questions) in the survey instrument. In the fast-to-slow case, the speed of the progress decelerates across the questionnaire, moving fast during the first screens and slowing down toward the end. The slow-to-fast progress indicator is just the opposite: The progress is slow during the first screens and speeds up toward the end.
It is worth noting that progress indicators with variable speed are not commonly used in survey research and, to our knowledge, they are not readily available in online survey platforms. Moreover, if the progress of these nonlinear indicators intentionally misrepresents the actual progress respondents have made, this would raise important ethical questions, and we do not recommend this deceptive type of use. It should be noted, however, that constant progress indicators are not necessarily accurate reflections of progress in terms of time or effort, given that some questions will inevitably take longer to answer than others and that respondents might start going faster toward the end of the questionnaire because of training and fatigue. Therefore, some forms of variable speed progress indicators may be valid and ethical as long as they reflect actual progress.
On Meta-Analysis
Over the past decade, a moderate number of studies about the effect of progress indicators on survey drop-off rates have been carried out. These studies, on the surface, do not always show consistent findings. As mentioned previously, they also differ in terms of design features and analytical methods. The seemingly inconsistent findings, together with the idiosyncrasies of individual studies, make it difficult to arrive at a concise and clear understanding of the state of affairs about this topic. This, in turn, leads to difficulties for practitioners who are looking for general guidance on whether to adopt progress indicators and what may be expected from using them.
At the same time, the number of studies has reached a point that, we believe, allows a meta-analysis to be conducted. Meta-analysis is the statistical combination of results produced by different studies. When applied to experimental studies, meta-analysis focuses on pairwise comparisons between one group, generally called the control group, and one or more treatment groups (Deeks, Higgins, & Altman, 2008).
Conducting a meta-analysis involves first systematically delineating the similarities and differences across various studies in terms of their design. This effort by itself helps us to understand the literature. Moreover, meta-analyses provide generalizable estimates of the effect size of the manipulated variable, in our case, of the impact of progress indicators on drop-off rates. Finally, it allows for the study of moderating variables, testing whether effects differ across different types of progress indicators or by some other factors.
Method
Selection of Studies for Meta-Analysis
Literature Search
The search took place between 2011 and 2012, 3 and included multiple databases, such as WebSM, Sociological Abstract, EBSCO, WARC, MarketResearch.com, CHI-ACM, MEDLINE, Social Science Research Network, JSTOR, Joint Statistical Meeting Proceedings of the Survey Research Methods Section, Ingenta, and Quirks magazine. We also searched the archives of the past 10 years of conferences of the American Association for Public Opinion Research (AAPOR), ESOMAR, and the General Online Research conferences. Google and Google Scholar were also used especially to find gray literature (e.g., white papers, technical reports, and preprints) and dissertations. Finally, we consulted section 5.8 on progress indicators in Couper’s (2008) book on web surveys.
The following key words were used in the search in various combinations: progress bar, progress indicator(s), progress feedback, survey duration, questionnaire length, online survey, web survey, response rate, and drop-off.
Once an article was found, cited references were checked for additional studies. To avoid publication bias and English language bias (Dickersin, 2005), we also sent a call for unpublished or forthcoming articles and for non-English language articles to the following mailing lists: AAPORnet, SRMSnet, and WAPORnet.
The search resulted in 10 articles that could be used for the meta-analysis (see eligibility criteria below), including 7 journal publications, 1 book chapter, and 2 unpublished dissertations. Nine articles were published in English and one was in German. The dates of the articles ranged from 2001 to 2010, with the majority (6 of the 10) dated between 2009 and 2011. Five of the 10 articles included multiple studies, resulting in a total of 19 studies. These studies involved 32 experiments: 18 experiments tested constant speed progress indicators, 7 experiments tested fast-to-slow progress indicators, and 7 experiments tested slow-to-fast progress indicators.
Eligibility Criteria
A study was included in the meta-analysis if it met all four criteria below:
Respondents were randomly assigned to the control and experimental condition.
Either a constant, fast-to-slow, or slow-to-fast progress indicator was compared against a no progress indicator condition.
The progress indicator was always shown on each page of the survey.
The respondent had no way to hide or to request the progress indicator.
Reasons for Exclusion
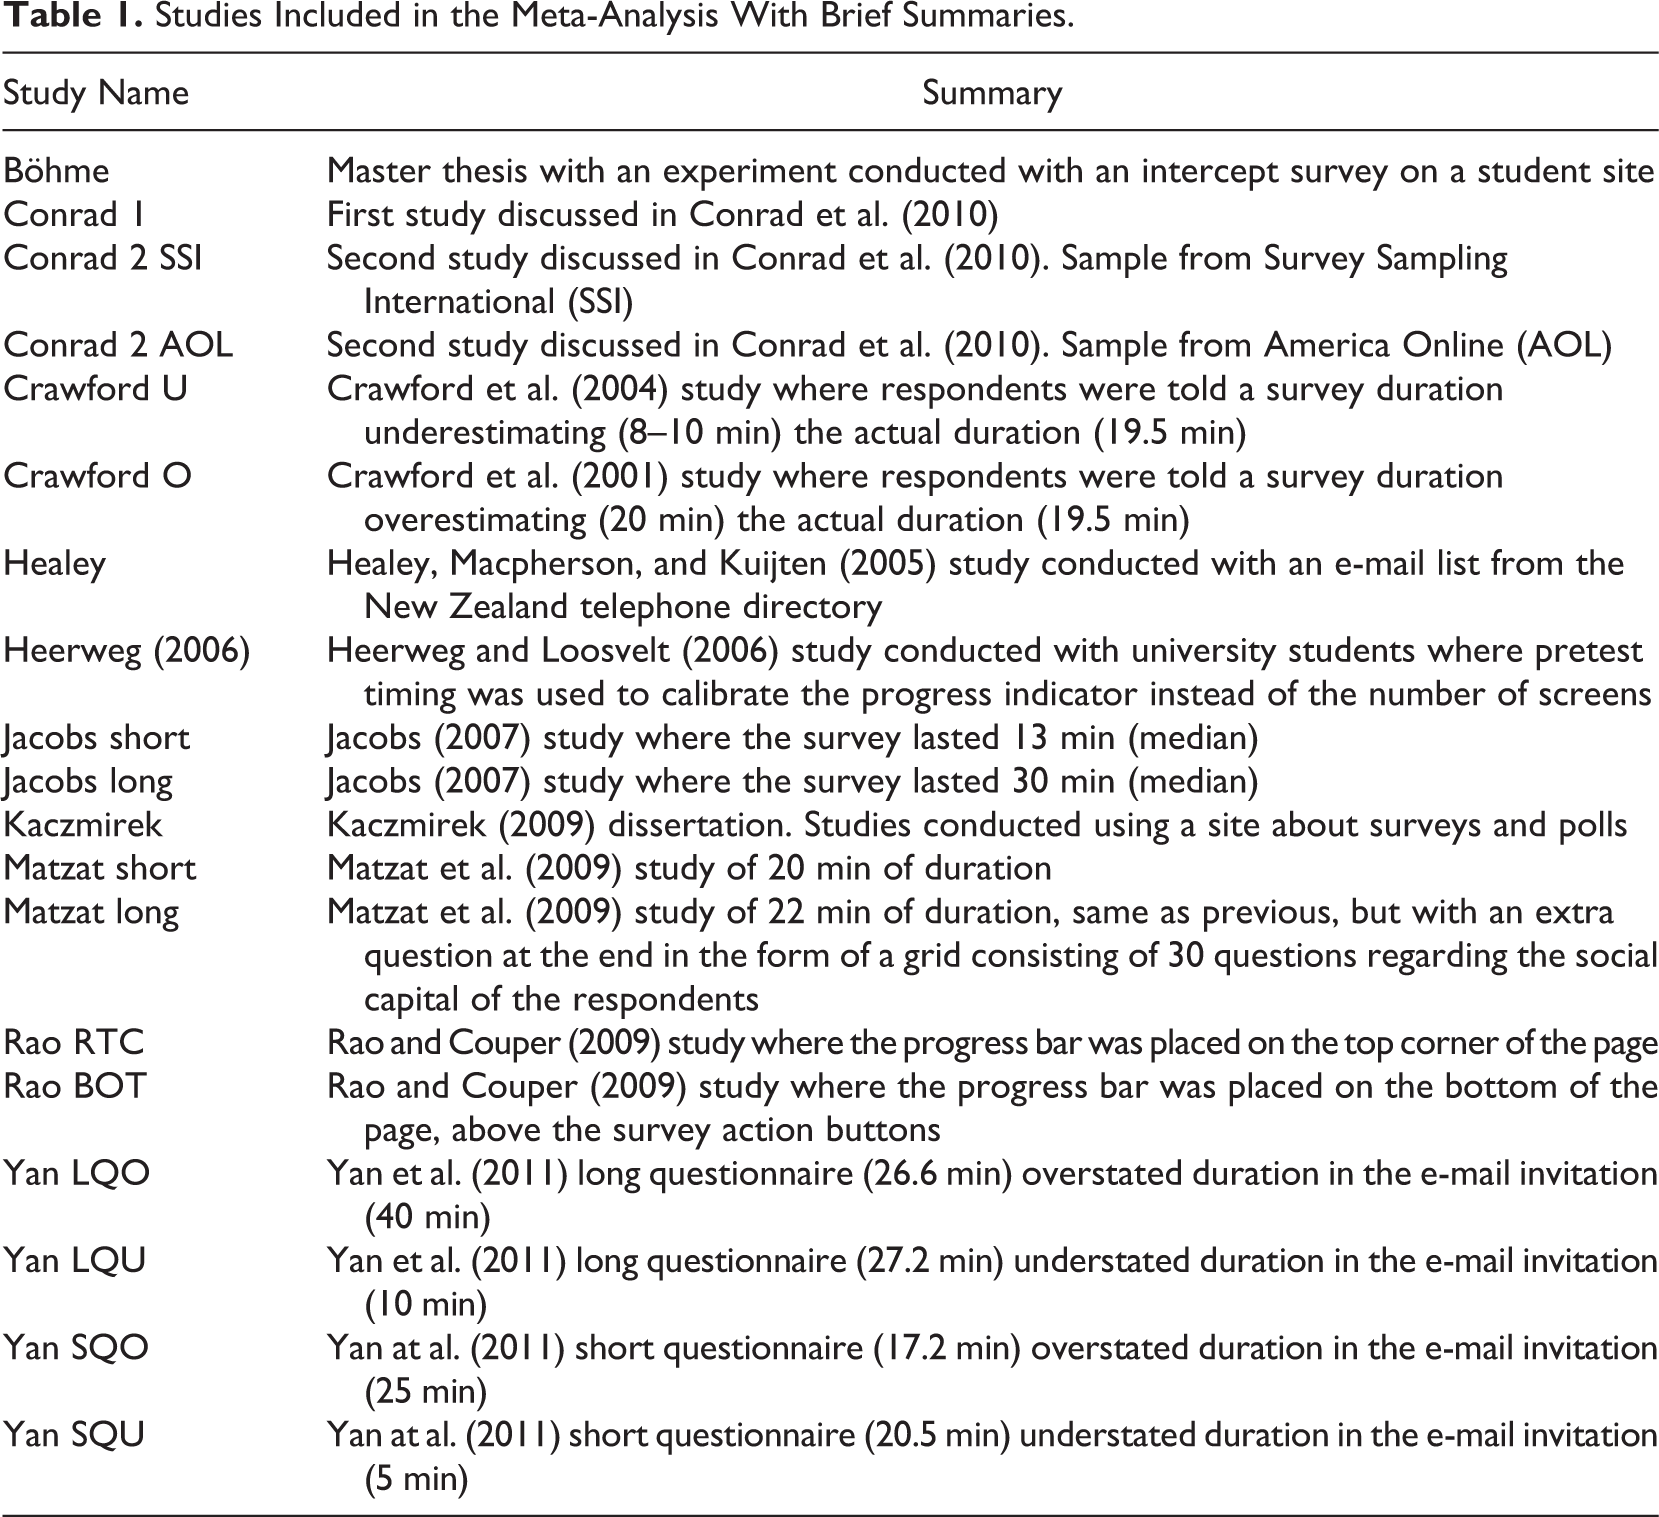
Seven additional articles were excluded from the meta-analysis for the following reasons: There was not enough detail about the experiments (Braun Hamilton, n.d.), the progress indicator included a summary screen that indicated the sections remaining in the questionnaire (Spicer & Dowling, 2012), or there were confounding factors in the experiment, namely, time to load a page in the progress bar condition took longer for dial-up users in comparison to the control condition (Couper, Traugott, & Lamias, 2001; Forsman & Varedian, 2002). Studies presented in more than one publication were only used once (Conrad et al., 2003, 2005; Heerwegh, 2004). The 19 studies from the 10 articles included in the analysis are listed in Table 1 with a short description of their design.
Studies Included in the Meta-Analysis With Brief Summaries.
Coding of Study Features
To understand what study features contribute to the conflicting findings on the effect of the progress indicators on drop-off rates, we coded various study features, as reported in Table A of the Supplementary Appendix.
Computing Effect Sizes
In meta-analyses using experimental data, the effect size indicates the magnitude
of the treatment effect—in our case, the effect of using a progress indicator on
drop-off rates. In all the studies, the authors reported (in different ways) the
number of respondents who started the survey and the number who did not finish the
survey. It is possible to determine the drop-off rate for each condition of each
study, which is computed as the number of respondents who dropped off at any stage
of the study (i.e., who did not entirely finish the survey) divided by the number
of respondents who started the study (survey).
Wherever this information was not readily available or when our calculations did not match the data from the published article, we contacted the original authors for clarification. Authors were also contacted when the published data did not have the level of detail necessary for the meta-analysis or to request additional information of survey characteristics used for subgroup analyses in this study.
The effect size is expressed in terms of the logarithm of odds ratio (log odds ratio [LOR]) because of two analytical advantages: First, LORs are conceptually unbounded and symmetric around 0; second, they allow for easy graphical representation using forest plots of the effect sizes.
LORs are defined as:
where D is the number of respondents who dropped off and N is the total number of respondents who started the survey. The subscript Exp stands for experimental group (progress indicator shown) and the subscript Con stands for control group (no progress indicator shown).
LOR is normally distributed with a known sampling variance given by the following:
A positive LOR signifies a higher drop-off rate for the experimental group, while a negative LOR signifies a higher drop-off rate for the control group, where no progress bar was shown. LOR are the key dependence measures we are discussing throughout the article.
Software Used in the Analysis
Data analysis was performed primarily with Meta-Analyst (Wallace, Schmid, Lau, & Trikalinos, 2009), with Comprehensive Meta-Analysis (Borenstein, Hedges, Higgins, & Rothstein, 2011), and with Mix (Bax, Yu, Ikeda, Tsuruta, & Moons, 2006). We used different programs to take advantage of unique features (especially graphics) of each software package (Bax, Yu, Ikeda, & Moons, 2007; Wallace et al., 2009).
Results
Unweighted Descriptive Analysis
Table 2 presents a summary of descriptive statistics for sample size, drop-off rates, and survey duration of all 32 experiments included in the meta-analysis.
Unweighted Descriptive Statistics by Type of Progress Indicator.
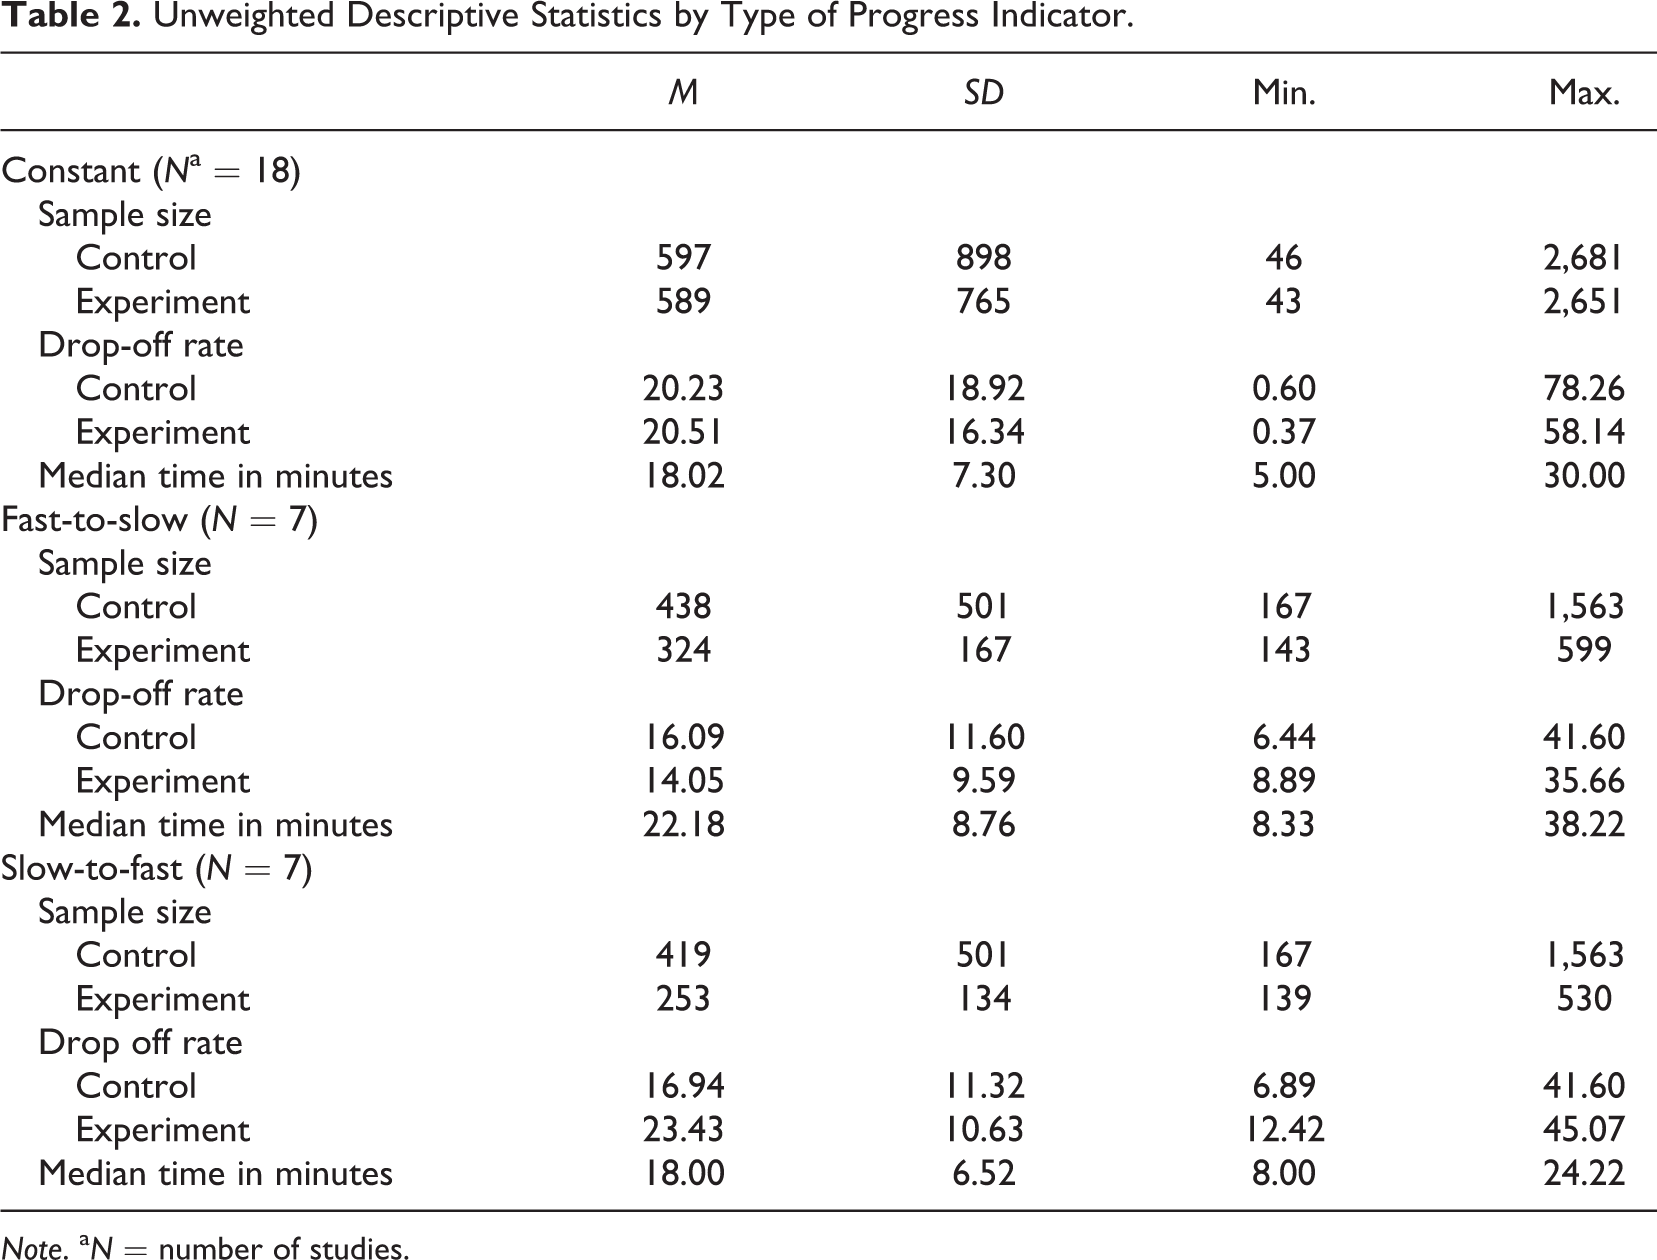
Note. a N = number of studies.
The averages of the actual median survey duration were 18 min for studies testing the constant or slow-to-fast progress indicators and 22 min for studies testing the fast-to-slow indicator. Sample size was larger for studies that tested the constant progress indicator than for the other two types of studies, and more importantly, the standard deviation of those studies’ sample sizes is larger. The same pattern is found for drop-off rates. Control groups in the slow-to-fast and fast-to-slow conditions also show high standard deviations for sample size.
It is also interesting to note the minimum values for the drop-off rate in the constant progress indicator condition. These values come from the Gallup panel study (Rao & Couper, 2009). We interpret these low drop-off rates as indication of high motivation among Gallup panel respondents, perhaps because of topic saliency, perhaps because of Gallup’s name as a credible polling institution.
Weighted Effect Sizes and Graphical Display of Results
Description of the Analyses
A random-effects model was computed for each type of progress indicator. This model, rather than a fixed-effects model, was chosen because the assumption underlying the random-effects model is more justifiable. Specifically, fixed-effects models produce appropriate summaries of effect size only when one knows for a fact that the effect is truly invariant (constant) across studies and that observed variations in effect sizes are solely due to artifacts. For this reason, fixed-effects models cannot evaluate meaningful variations due to moderators. Because the assumption required by a fixed-effects model is typically unrealistic, its use has been discouraged (Borenstein, Hedges, Higgins, & Rothstein, 2010; Hunter & Schmidt, 2004). In contrast, a random-effects model does not assume effect sizes to be equal across studies. Instead, it allows for the evaluation of whether this indeed is the case. This way, random-effects models provide an accurate summary of the effect sizes regardless of whether or not the true effect varied across studies. It also partitions the variations into random and systematic components, thus allowing for the evaluations of moderator effects (Borenstein et al., 2010; Hunter & Schmidt, 2004). A random-effects model was chosen because the assumption of a single effect (across varying studies) cannot be justified. In fact, analysis of heterogeneity (reported below) showed that the studies were not functionally identical. It should be noted that the choice of a random-effects model also has implications regarding the weight given to each study. In such models, the weight assigned to each study is related to the variance of the estimate and computed as 1/(within-study variance + between-study variance; Borenstein et al., 2010). The within-study variance is estimated using the method of moments, also known as DerSimonian and Laird (1986) method. This weighting mechanism tends to reduce the influence of large studies on the estimates, increasing the influence of small studies.
For each comparison, we computed the test of homogeneity statistic Q, which is the weighted sum of squared differences between individual study effects and the pooled effect across studies (Borenstein, Hedges, Higgins, & Rothstein, 2009, p. 109). If Q is statistically significant, then there is heterogeneity among the studies analyzed. A second measure of homogeneity, the I 2 index, was also computed. This index, which may range from 0 to 100, represents the proportion of observed variance that reflects real differences in effect size (Higgins, Thompson, Deeks, & Altman, 2003), thus providing a quantification of the degree of heterogeneity in the meta-analysis. The same authors, using a survey of the Cochrane Database of Systematic Reviews, looked at the distributions of I 2 and suggested that a value of 25% should be considered low, 50% moderate, and 75% high. In addition, outlier analyses were performed by inspecting the Galbraith (1988) plot, also known as radial plot (Bax et al., 2009). The results and a detailed explanation are in the Supplementary Appendix.
Finally, the results of each meta-analysis are presented using forest plots (Figure 1; and Figures C, D, F, and H in the Supplementary Appendix), which are the most frequently used plots to present summary results in meta-analysis (Bax et al., 2009). In the forest plot, the LOR for each study and its 95% confidence interval are displayed. Each study is represented by a square with size proportional to the study weight. The diamond shape at the bottom of the plot 4 represents the pooled LORs for all the studies considered. If a study is shown to the left of the zero vertical line (no effect), it means that there is a higher drop-off rate for the control group (no progress indicator shown) than for the treatment group (progress indicator shown)—in other words, it means that the progress indicator worked as intended. If a study is shown to the right of the no-effect line, it means that there is a higher drop-off rate in the experimental group (progress indicator shown), that is, the use of a progress indicator backfired.
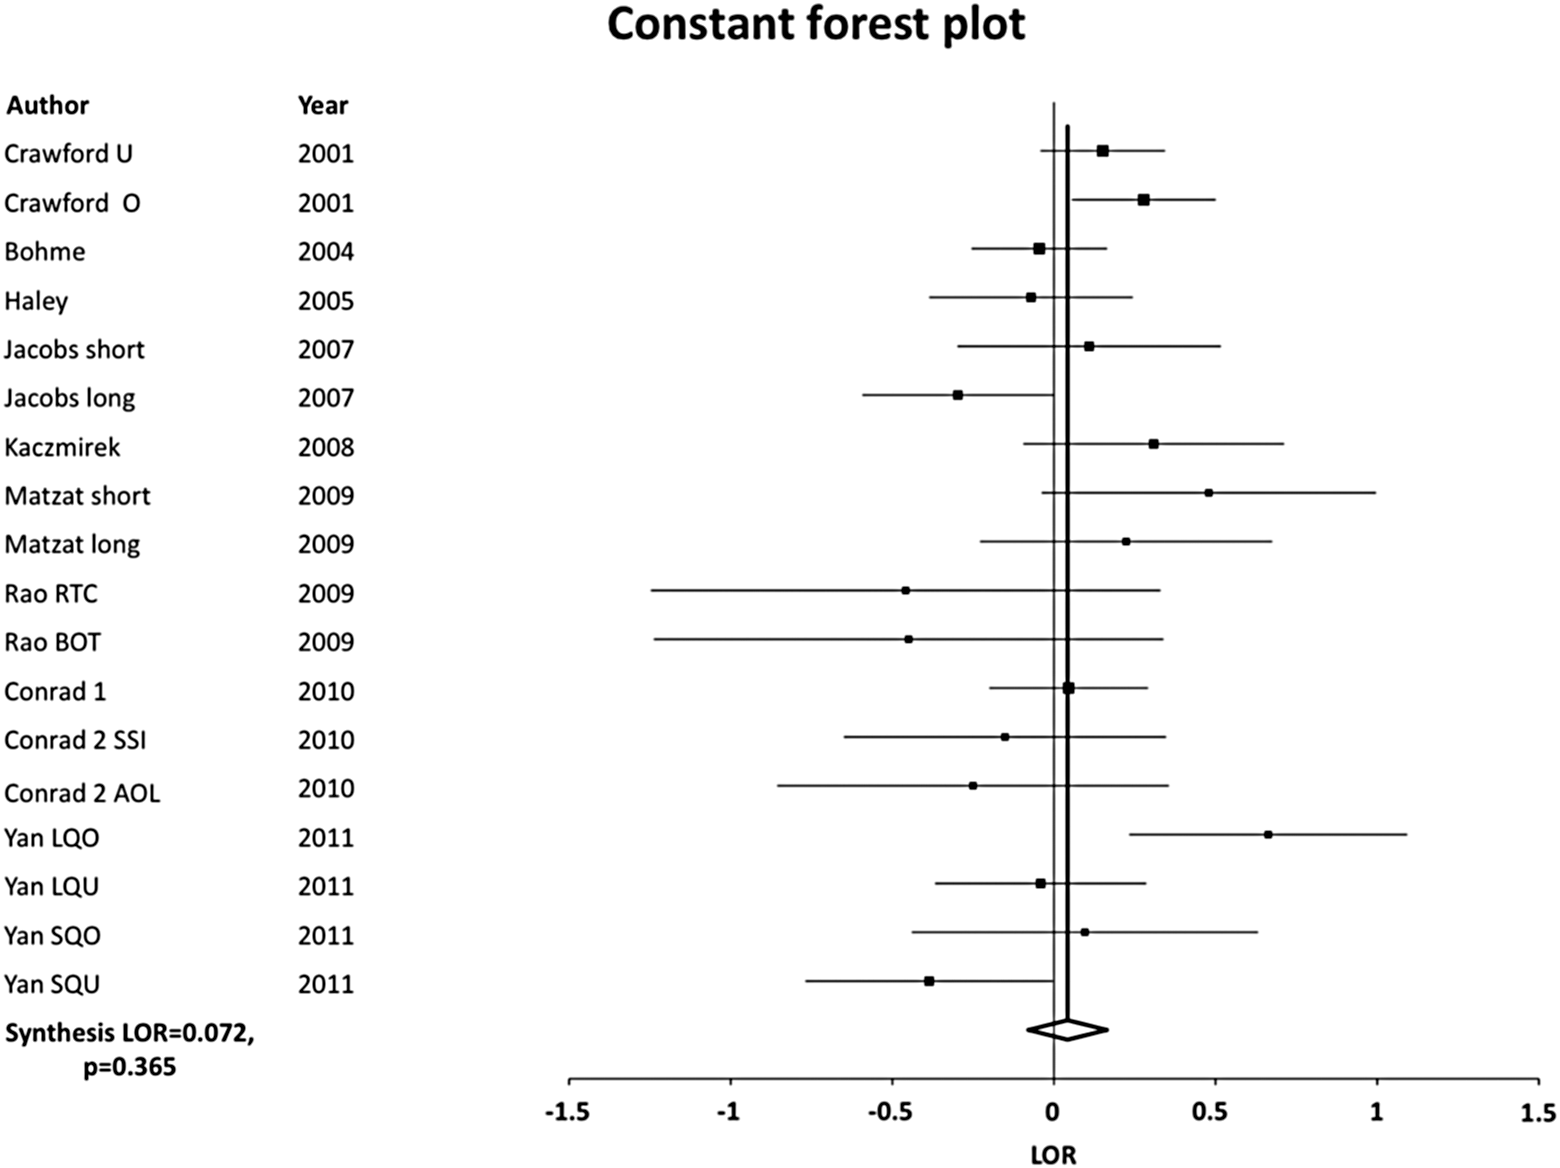
Constant speed progress indicator forest plot.
Effect of the Constant Progress Indicator
Contrary to what researchers expect when they use progress indicators, we found a small but nonsignificant tendency for higher drop-off rates among respondents presented with the constant progress indicator as compared to the control group (LOR = 0.072, p = .365). This effect was statistically significant for only 2 of the 18 studies (see forest plot in Figure 1).
The heterogeneity analysis suggests that the studies are not homogeneous (Q = 33.203, p = .011; I 2 = 48.799), indicating that further subgroup analysis is needed.
As discussed previously, the studies varied in a number of survey design features that could affect the impact that indicators had on drop-off rates. We found two survey features that were likely to have an impact on the effect of progress indicators on drop-off rates and were available for most studies: the discrepancy between the respondent’s expected survey duration (as communicated by the researcher) and the actual survey duration and whether an incentive had been offered. The next two sections present these analyses.
Subgroup Analysis: Discrepancy Between Expected Duration and Actual Duration
Data were available for most of the studies (14 of the 18) to assess whether the survey duration researchers communicated to the respondent (either in the e-mail invitation or in a message at the beginning of the survey) was an overestimation or an underestimation of actual survey duration. This was determined by comparing the reported survey duration to the median time for completion.
The effect of the constant progress indicator is similar and not significant both in the surveys where duration was overestimated (LOR = 0.121, p = .492) and in surveys where it was underestimated (LOR = 0.030, p = .755). (See Figure C in the Supplementary Appendix.) For both groups, the relationship between progress indicator and drop-off rates is not significant; therefore, overestimating or underestimating survey duration does not seem to moderate the effect of progress indicators on drop-off rates. Outlier analysis (Figure B in the Supplementary Appendix) revealed an outlier in the overestimation group (Yan LQO) and one outlier in the underestimation group (Yan SQU). Removing such outliers, however, the results remain the same; the effect of constant progress indicators is still not significant in surveys where duration is overestimated (LOR = 0.006, p = .969) as well as in surveys where it is underestimated (LOR = 0.106, p = .166).
Subgroup Analysis: Presence or Absence of an Incentive Upon Completion
In studies where no incentive was offered upon completion of the survey, 5 there is a small but nonsignificant effect of progress indicator on drop-off rates in the expected direction (LOR = −0.065, p = .637); whereas, for respondents who did receive incentives, the small effect goes in the opposite direction, that is, the presence of a constant progress indicator led to a larger yet nonsignificant number of drop-offs (LOR = 0.137, p = .159). (see Figure D in the Supplementary Appendix)
Outlier analysis (not shown) in the nonincentive studies did not identify any anomalies. Outlier analysis (Figure E in the Supplementary Appendix) of the incentive-upon-completion studies, however, revealed two outliers. The two outliers represent unusual cases in online surveys. In “Yan LQO” survey duration was overstated: Survey duration was said to be 40 min, but it was actually about 30 min. The other outlier, “Yan SQU,” largely understated the actual duration of a “short” questionnaire (20 min), communicating to respondents that it would last 5 min. 6 If we remove these two studies from the analysis, the effect of constant progress indicator on drop-off rates becomes significant (LOR = 0.157, p = .025). In other words, for studies where a small incentive is given upon completion, showing the progress indicator increases the drop-off rate by a factor of 1.17, in comparison to the control group.
Effect of Survey Duration on Effect Size of Constant Progress Indicators
As explained before, one might argue that the effect of progress indicators depends on survey duration; information about progress in the survey may be discouraging rather than motivating if such progress is slow. Conversely, progress indicators may work especially well when surveys are short and thus progress is fast. We tested this hypothesis by meta-regressing effect size on survey duration (measured as the median time in seconds of each study). Contrary to our expectation, results from the meta-regression showed that survey duration did not have a significant effect on effect size. It is possible that this lack of effect is related to the restricted, high range of survey duration across studies, where the median survey duration was quite large (18–22 min) and the minimum value was 5 for the constant progress indicator and 8 for the other two groups. Perhaps, if surveys shorter than 5 min were included in the analysis, an effect would be present.
Effect of the Fast-to-Slow Progress Indicators
The overall effect of fast-to-slow progress indicators is not significant although respondents who were shown the progress indicator were slightly less likely to drop off than respondents in the control group where no progress indicator was shown (see forest plot results in Figure F in the Supplementary Appendix). The study of heterogeneity showed a low to moderate level of heterogeneity among these seven studies (Q = 8.662; p = .194; I 2 = 30.73).
The outlier analysis (Figure G of the Supplementary Appendix) showed that the first study of Matzat short was an outlier. After excluding this study from the analysis, the effect of progress indicator on drop-off rates becomes statistically significant (LOR = −0.212, p = .02). The odds ratios showed that when using a fast-to-slow progress indicator drop-off rate decreased by a factor of 0.80, on average, in comparison to the control group.
Effect of the Slow-to-Fast Progress Indicator
Respondents who were presented with a progress indicator that showed slow progress at the beginning of the survey were more likely to drop off than respondents who were not shown a progress indicator (LOR = 0.447, p = .001). (See forest plot results in Figure H of the Supplementary Appendix.) The odds for respondents dropping off when presented with a slow-to-fast progress indicator were 1.56 times larger than the odds for those in the control group dropping off where no progress indicator was shown.
Heterogeneity among these seven studies is considerably high (Q = 14.494, p = .023; I 2 = 59.17). Based on the outlier analysis (not shown), the first study by Matzat (Matzat short) was again an outlier. However, after excluding this study from the analysis, the effect remains significant and in the same direction (LOR = 0.372, p = .002).
Discussion
Our findings show that the effect of progress indicators on drop-off rates varies depending on the speed design. Fast-to-slow indicators reduced drop-off rates (even though the average survey duration was longer than for the other two groups, 22 min vs. 18 min) and slow-to-fast progress indicators increased drop-off rates. Therefore, these findings support the notions that (a) respondents do pay some attention to progress indicators and (b) “knowledge can cut both ways” and are consistent with the surfacing hypothesis.
The fast-to-slow progress indicator may decrease drop-offs because it gives the respondent during the process the impression that they already completed a vast part of the survey. So, even if the indicator shows a slowing down at the end the investment, the effort put into answering the first part of the survey can be a motivating factor not to “give up,” and therefore the respondent completes the survey. Conversely, in slow-to-fast indicators, early feedback suggests the need for high investment. As previously mentioned, the respondent evaluates time spent during the survey process; therefore, the sooner respondents feel like the task is going slower than expected, the sooner the effort will seem excessive.
In practice, constant indicators and slow-to-fast indicators will probably not yield the desired effect on drop-off rates, whereas the fast-to-slow design has the potential to reduce drop-offs. However, the current design of fast-to-slow progress indicators is questionable in its ethics due to its deceptive nature. 7 At the same time, other authors have argued that respondents might seek feedback and encouragement especially at the beginning of a survey, when the amount of effort required might still be uncertain, and that fast-to-slow progress indicators can provide the encouragement respondents need (Conrad et al., 2003). However, the positive effect of fast-to-slow progress indicators on reducing drop-offs should stimulate research to further explore methods of providing progress feedback that provides positive reinforcement to the respondents and is truthful to their actual subjective experience. The reinforcement could have the form of a simple encouragement message such as displaying “thank you for your answers and your continued participation” after the first questions have been completed.
Results show that the use of a constant progress indicator did not decrease drop-off rates for the studies currently available for meta-analysis. And even if a small incentive had been offered to respondents as compensation for their participation in the survey, the effect of the progress indicator was negative on drop-off rates. Because of a number of characteristics from our data, these results should be taken with caution. Heterogeneity was present and outliers existed for most of the analyses performed, and other variables may have introduced noise and confounding real effects (although our selection of analytical tools took this heterogeneity into account). Unfortunately, some of the potential moderating variables, such as survey topic or sample origin, could not be coded for all studies, limiting the effects that could be discovered. Other variables were present but had restricted ranges of values, such as survey duration. Surveys of less than 5 min were not used for the study of progress indicators; therefore, we cannot estimate the effect progress indicators may have in shorter surveys.
To overcome these limitations, further studies are necessary that compare constant progress indicators to no indicator at all, keeping as many of the other survey features constant as possible. New studies should systematically vary or control for potential moderators, such as actual survey duration, duration statements, survey topic, sample origin, incentive, respondent motivation, and some visual design features. For these studies to have practical implications, it is also important to include experimental conditions that are realistic in practice.
Along this line, survey researchers may also benefit from reviewing relevant HCI literature. For example, the framework proposed by Conn (1995) that describes eight progress indicator task properties could be a starting point in designing experiments that manipulate those properties in survey research. Future studies may also benefit from an enriched theoretical understanding of the functioning of progress feedback in a survey context. The inconsistent effect of progress indicators on drop-offs suggests that we may not yet fully understand the mental processes underlying respondents’ judgment about cost and reward and their decisions about whether to continue or to quit the survey. For example, psychological research has shown that people’s perception and judgment about duration may differ across types of tasks as well as between completed versus prospective tasks (Avni-Babad & Ritov, 2003; Block & Zakay, 1997; Fraisse, 1963; Zakay & Block, 2004). Conrad and colleagues (2010) also noted research that showed a relationship between task experience and duration judgment (London & Monello, 1974; Sackett, Meyvis, Nelson, Converse, & Sackett, 2010) and between frequency of feedback and such judgment (Polkosky & Lewis, 2002). Research using eye-tracking movement devices could analyze how often and when respondents seek feedback and help us understand how that affects decisions to drop off or to continue a survey. Eye-tracking research combined with cognitive interviews and think-aloud techniques could shed more light on the cognitive processes of respondents when doing a survey with a progress bar and the expectations they set.
Furthermore, judgments about costs and rewards and the resulting decision making may not be entirely “rational” and are subject to cognitive bias and heuristics. Conrad and colleagues (2010) made reference to a loss-aversion bias, and Yan and colleagues (2011) noted the sunk cost bias as one possible explanation for the effect of progress indicators on survey taking. Because our interests is to find ways to improve survey completion and response quality, future research on progress indicators should take these psychological theories into account.
Finally, from a total survey error perspective, there is a lack of research on the effect of progress indicators on measurement error. Would the use of progress indicators reduce drop-off rates by having respondents with low engagement in the task complete the survey, thus increasing response rates but possibly increasing measurement error? Of course, given that most studies have found either no effect or a negative effect of progress indicators on drop-offs, there has been little opportunity for such analysis. However, in those studies where drop-offs decreased with progress indicators, it might be worthwhile to analyze the quality of answers provided by those who would have dropped out had there been no feedback to indicate their progress.
Footnotes
Authors’ Note
We would like to thank the authors of the studies included in this meta-analysis article for answering our numerous questions regarding their experiments as well as Professor Don Dillman and the Political Psychology Research Group at Stanford University for valuable comments.
Declaration of Conflicting Interests
The author(s) declared no potential conflicts of interest with respect to the research, authorship, and/or publication of this article.
Funding
The author(s) received no financial support for the research, authorship, and/or publication of this article.