
Abstract
Introduction:
Urine oxalate excretion influences the risk of calcium oxalate kidney stone formation and has been reported to positively correlate with body mass index (BMI) and body weight. The two major sources of urine oxalate are dietary oxalate absorption and endogenous oxalate synthesis (EOS). In this study, we investigated the association between EOS, as estimated by oxalate content of 24-hour urine collected while consuming an ultra-low oxalate diet, and measures of body size and composition.
Methods:
An analysis of prospectively performed studies conducted on adults consuming ultra-low oxalate diets between January 2018 and January 2025 at the University of Alabama at Birmingham was undertaken. All participants (n = 88) were healthy and had no history of kidney stone disease, hypertension, or diabetes. Participants underwent anthropomorphic measurements, and body composition was measured by bioelectrical impedance analysis. Urinary oxalate was measured by ion chromatography coupled to mass spectrometry.
Results:
Total urinary oxalate was positively correlated with body weight, BMI, lean body muscle mass, appendicular lean muscle mass, waist-to-hip ratio, and urinary creatinine excretion. There was no significant correlation between urinary oxalate excretion and body fat or age. Urinary oxalate excretion was different in males and females, even after adjusting for measures of lean body composition.
Discussion:
This analysis of low oxalate controlled diet studies in healthy participants suggests lean body mass, not body fat, is the major driver of EOS. This study also highlights that oxalate synthesis in lean body compartments is different in males and females.
Introduction
Urinary oxalate excretion has been demonstrated to positively correlate with the risk of developing kidney stones as well as progression of chronic kidney disease. 1,2 Endogenous oxalate synthesis (EOS) contributes ∼50% to the urinary oxalate pool depending on the composition of the diet. 3 Endogenous oxalate production is primarily driven by the oxidation of glyoxylate to oxalate, which is catalyzed by lactate dehydrogenase (LDH), and the nonenzymatic breakdown of ascorbate to oxalate. 4 Urinary oxalate excretion has been reported to positively correlate with body weight and body mass index (BMI) 5 ; however, it has not been determined to what extent these correlations are driven by EOS. In addition, the impact of body composition including lean mass and fat mass has previously not been investigated.
Twenty-four-hour urine oxalate excretion collected while consuming a controlled ultra-low oxalate diet has been demonstrated to positively correlate with the classical method for measuring EOS via a primed, steady-state intravenous stable isotope infusion (13C2-oxalate) in the fasted state. 6 This study investigated if EOS, as estimated by 24-hour urine oxalate excretion collected by participants consuming ultra-low oxalate controlled diets, is influenced by anthropometric parameters.
Materials and Methods
Study participants and design
An analysis of six different low oxalate controlled diet studies conducted between January 2018 and January 2025 at the University of Alabama at Birmingham was undertaken (Table 1). Two of these studies, “OXI” 6 and “OXF,” 7 have previously been published (Table 1). Inclusion criteria included age 19–65 years, BMI 18.5–45 kg/m2, and a normal serum comprehensive metabolic profile. Exclusionary criteria included documented liver disease, chronic kidney disease (estimated glomerular filtration rate <60 mL/min/1.73 m2), diabetes (treated or with HbA1c > 6.5%), hypertension, renal tubular acidosis, primary hyperparathyroidism, nephrotic syndrome, primary hyperoxaluria, neurogenic bladder, urinary diversion, pregnancy, breast feeding/nursing, malignancy treated within the past 12 months, utilization of immunosuppressive medications, history of bariatric surgery, gastrointestinal disorders that could impact oxalate transport including those associated with enteric hyperoxaluria and chronic diarrhea, incomplete 24-hour urine collections as determined by urinary creatinine values not within 20% of appropriate ratio of creatinine (mg)/body weight (kg) for gender, and creatinine values that were not consistent between collections (>30% of each other).
Details of Low Oxalate Diet Human Studies Involving Healthy Nonkidney Stone Forming Adults Conducted at the University of Alabama at Birmingham Between 2018 and January 2025
Demographics (gender, race, and ethnicity) were self-reported as mandated by funding agencies. Participants underwent anthropomorphic measurements in the University of Alabama at Birmingham Clinical Research Unit (CRU) including weight, height, BMI, and waist and hip circumference. Segmental body composition was measured by bioelectrical impedance analysis (TANITA). Participants were administered a controlled caloric, ultra-low oxalate (<60 mg/day), normal calcium diet composed of approximately 20% protein, 50% carbohydrates, and 30% fat for 3–5 days (Supplementary Table S1) that was prepared in the CRU Bionutrition metabolic kitchen. Other macro- and micronutrients were also controlled. Dietary supplements were stopped 2 weeks before and during the low oxalate controlled dietary period. Participants collected two to three 24-hour urine specimens after 2 days of dietary equilibration, except for the OBE study where it was after a 1-day equilibration, and the averages of urinary oxalate excretion were used for analysis. For participants who enrolled in multiple studies, the most recent or most complete dataset was used. All studies were approved by the University of Alabama at Birmingham Institutional Review Board. Written informed consent was obtained from all, and procedures were performed in accordance with 1964 Declaration of Helsinki.
Assays
Urinary oxalate and glycolate were measured by ion chromatography coupled to mass spectrometry, as previously described. 6 Urinary creatinine was measured on an EasyRA analyzer. Participants were asked to provide stool specimens to assess for Oxalobacter formigenes (O.f.) colonization using a previously published culture technique. 7
Statistical analysis
Descriptive statistics, including mean ± standard deviation, were obtained for study variables. Comparisons of means of continuous variables, including urine oxalate and urine glycolate, between females and males were performed using the two-group t-test. Correlation coefficients between continuous variables were obtained using Pearson correlation analysis (Spearman correlation analysis was used for correlations involving categorical variables). Linear regression analyses were used to examine potential predictors of urine oxalate and urine glycolate, and multiple linear regression analyses were used to examine potential predictors while considering covariates of interest, such as gender. Some continuous variables were determined to be normally distributed through graphical techniques and tests of normality; however, analyses for all continuous variables were also performed using log-transformed values and yielded results that are nearly the same as those obtained using variables on their original scales (as such, we present results using the original scales). Statistical tests were two-sided and were performed using a significance level of 0.05. Statistical analyses were performed using SAS software, version 9.4 (SAS Institute, Cary, NC). Plots were generated with GraphPad Prism v. 10.
Results
One hundred and eleven adult individuals without a history of kidney stones had participated in at least 1 of these 6 low oxalate diet studies, of which 88 were eligible for further analysis (see Materials and Methods for eligibility criteria). The demographic and anthropometric parameters (Table 2 and individual data in Supplementary Table S2) of the 88 participants reflected those of the local Greater Birmingham area. Absence of obesity, insulin resistance, and dyslipidemia were found in a third of the participants (n = 32), whereas at least one component of metabolic syndrome (BMI >30 kg/m2, HbA1c > 5.7% or dyslipidemia) was found in the remaining participants. Colonization with O.f. was found in 43% of the 68 who provided stool specimens. Urinary oxalate excretion varied 5-fold between participants (mean 23 mg), despite all consuming an ultra-low oxalate diet (Table 3, Supplementary Table S2–S3). Glycolate, a precursor of oxalate synthesis, was also measured in urine and varied 10-fold (mean 33 mg; Table 3, Supplementary Table S2–S3).
Demographics, Anthropomorphic Measurements, and Baseline Laboratory Results
Blood was collected in the fasted state. Participants were consuming self-selected diets. eGFR was calculated using the CKD-EPI creatinine equation (2021) without race adjustment N: total. Male and female group comparison performed by the two-group t-test (or the Sattherthwaite t-test for unequal variances, if needed), statistial significance is marked by (*).
BMI = body mass index; eGFR = estimated glomerular filtration rate; Fat % = percentage of fat in the body in comparison with the overall body weight; HOMA IR = homeostatic model assessment of insulin resistance.
Urinary Excretions on Low Oxalate Diet
Mean 24-hour urinary excretions were collected after 1–2 days of dietary equilibration on low oxalate (<60 mg/day) diets. Anthropometric parameters were determined by impedance (TANITA). Excretions for males and females were compared using two-group t-test.
SD = standard deviation.
Urinary oxalate was positively associated with several markers related to lean mass, including urinary creatinine, predicted total lean muscle mass, predicted appendicular muscle mass, body weight, BMI, and waist-to-hip ratio. However, urinary oxalate did not correlate with body fat (Figs 1, 2, Supplementary Table S4). The strong association between urinary oxalate excretion and total lean muscle mass and appendicular muscle mass remained significant even after adjusting for gender (p < 0.001, both).
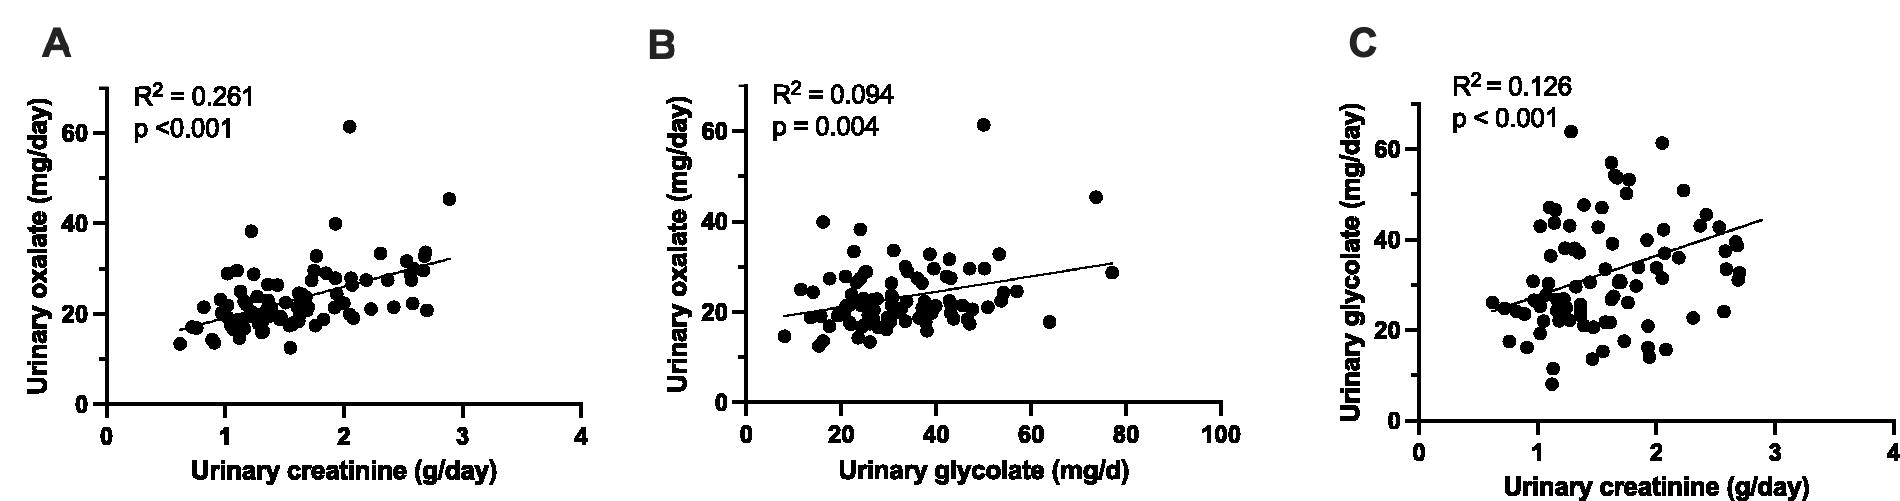
Associations between 24-hour urinary oxalate, glycolate, and creatinine. Urinary oxalate is positively associated with urinary creatinine
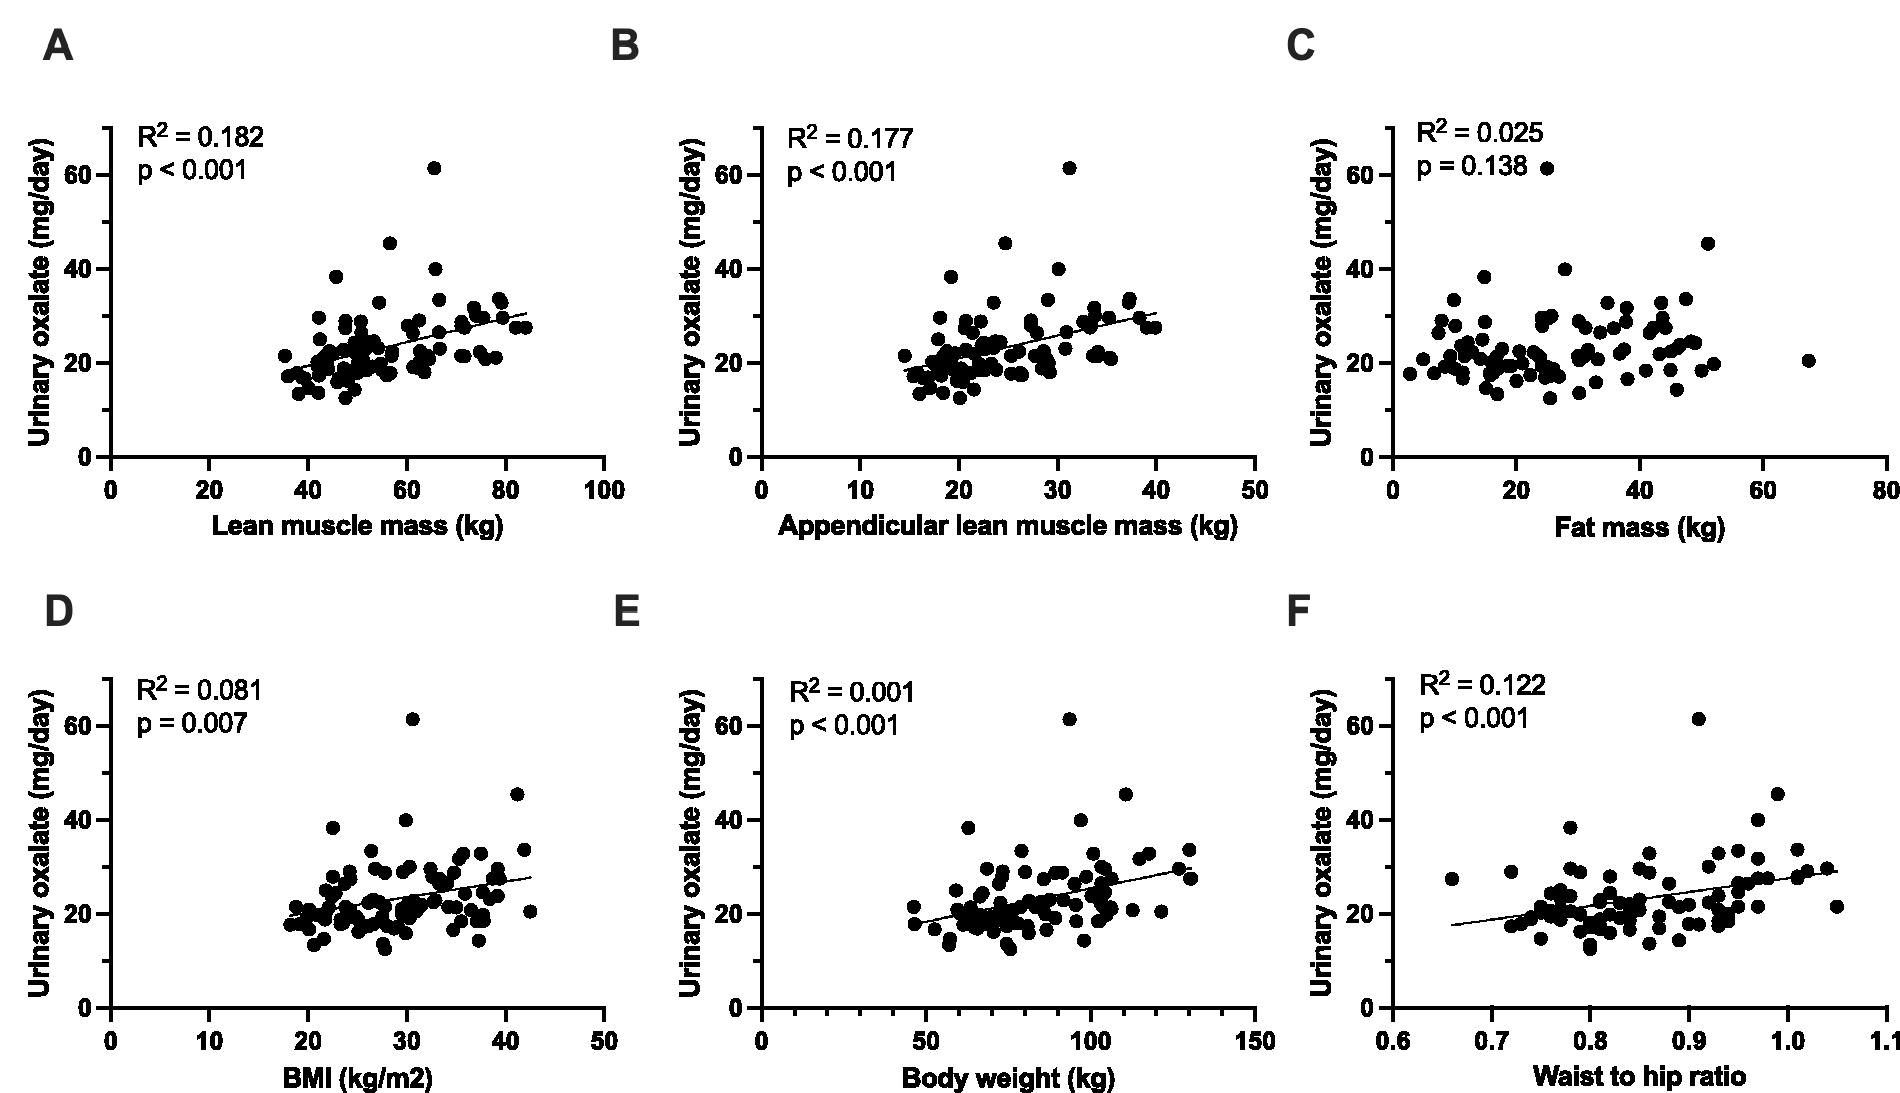
Associations between 24-hour urinary oxalate excretion and anthropomorphic parameters. The association between urinary oxalate and predicted lean muscle mass
Similar correlations were seen for urinary glycolate and these parameters, except total body fat (Supplementary Fig. S1, Supplementary Table S4). Urinary oxalate and glycolate were also positively associated (p = 0.004).
There was no association between urinary oxalate and O.f. colonization status (O.f. Negative 23 ± 9 mg oxalate/day vs. O.f. Positive 22 mg ± 6 mg oxalate/day, p = 0.7). Age (p = 0.7) and race (p = 0.5) were not associated with urinary oxalate excretion. Urinary glycolate also did not correlate with age, race, or O.f. status (Supplementary Table S4).
Total urinary oxalate excretion was significantly higher in males but lower when indexed to urinary creatinine, total lean muscle mass, and appendicular lean muscle mass (Table 3, Fig. 3, Supplementary Table S4).
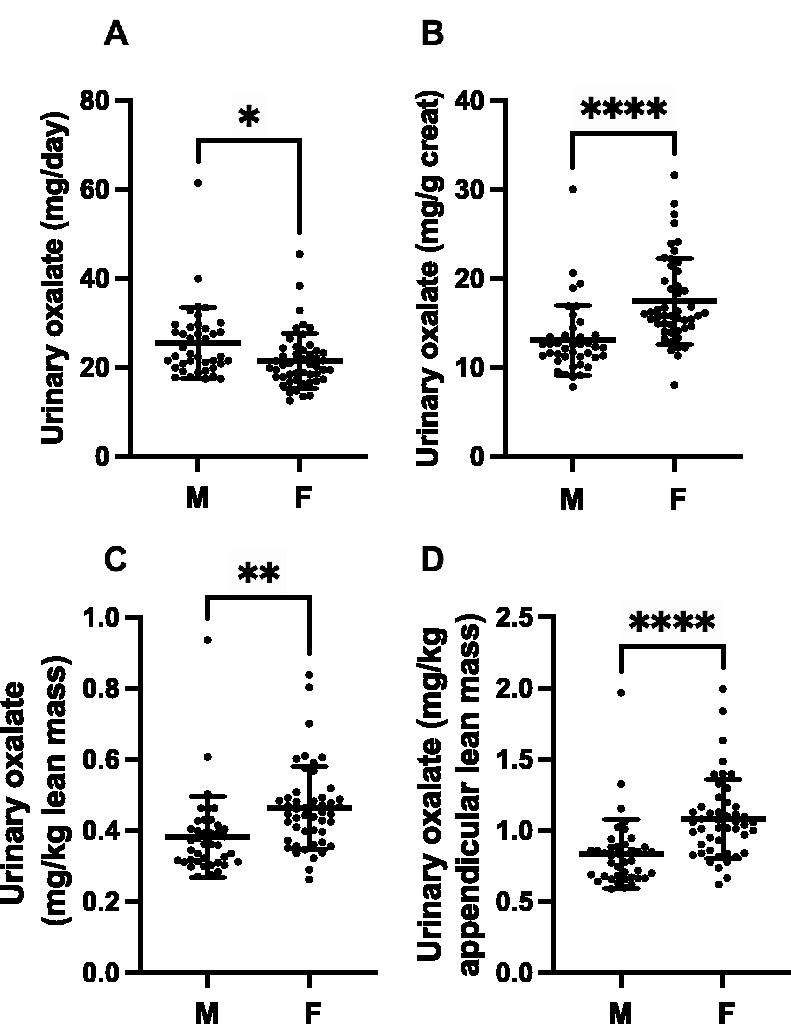
Urinary oxalate excretion in males and females. Twenty-four-hour urinary oxalate excretion is different in males and females
Discussion
There is ample evidence that urinary oxalate excretion is influenced by body weight and BMI. Lemann et al. first reported that urinary oxalate excretion was positively correlated with both body weight and body surface area in healthy adults. 5 We reported a significant positive association between urinary oxalate excretion and BMI based on an analysis of 589 adult kidney stone formers consuming self-selected diets. 8 A positive association between BMI and urinary oxalate excretion was also demonstrated in the analysis of three large epidemiological cohorts (Health Professionals Follow-Up Study, Nurses’ Health Study I, and Nurses’ Health Study II), which found a higher incidence of kidney stone disease with higher BMI. 9 However, participants consuming self-selected diets in all these prior studies preclude any interpretation regarding the origin of the elevation in urinary oxalate excretion. EOS contributes between 30% and 70% to the urinary oxalate pool depending on the composition of the diet. 3,10 The contribution of fat versus lean mass to EOS has not been studied in the past. In this analysis, the measurement of 24-hour oxalate excretion in participants consuming ultra-low oxalate diets (limiting the contribution of dietary oxalate to urinary oxalate) allowed us to assess the influences of various factors on EOS.
The positive associations between urinary oxalate excretion and lean body mass, appendicular lean muscle mass, and urinary creatinine suggest that oxalate excretion may be influenced by EOS in the musculoskeletal and visceral compartments. These findings corroborate those of a smaller study that was performed in 20 healthy individuals using constant intravenous infusion of 13C-oxalate 6 to measure EOS and point to a potential role of ascorbate breakdown in skeletal muscle where its concentrations are high or to collagen turnover in lean mass. Collagen is a rich source of hydroxyproline, which is metabolized in the mitochondrial compartments of the liver and kidney to glyoxylate, the immediate precursor of oxalate. Thus, collagen turnover could influence EOS. We have previously demonstrated the important contribution of hydroxyproline to EOS using intravenous infusion of hydroxyproline in humans. 11,12
The liver is thought to be a key source of EOS via ascorbate breakdown and conversion of glyoxylate to oxalate catalyzed by LDH, a metabolic process influenced by alanine glyoxylate aminotransferase (AGT), an enzyme whose deficiency causes the rare kidney stone disease primary hyperoxaluria type 1. Fatty liver disease, which has been redefined as metabolic dysfunction-associated steatotic liver disease (MASLD), has been associated with both kidney stones and kidney stone risk factors. 13 It has been proposed that steatotic liver disease increases oxalate synthesis from glyoxylate oxidation by repressing the expression of AGT. 14,15 Hepatic fat content was not measured in our study, and no systematic assessment of liver steatosis was performed.
Several studies have suggested a potential link between calcium oxalate kidney stone disease and obesity, body fat distribution, and visceral adipose tissue. 5,8,9,16 –21 Pigna and associates reported that body fat (total mass, percentage, and trunk fat) measured with dual-energy absorptiometry was correlated with urinary oxalate excretion in nonstone formers consuming a controlled metabolic diet, but the oxalate content of these diets was not ultra-low and thus may reflect both EOS and gut absorption of dietary oxalate. 21
We found an association between urinary glycolate, a precursor of oxalate, and total body fat content. Sources of glycolate are not very well understood and include the metabolism of glyoxal, glycolaldehyde, and hydroxyproline. 4 It is conceivable that lipid peroxidation could induce glycolate synthesis from glyoxal in fat tissues and underlie this relationship, 22 but this remains to be determined. Urinary glycolate also significantly positively correlated with urinary oxalate, consistent with glycolate being a source of urinary oxalate in healthy individuals; however, the correlation coefficient R was 0.30 suggesting a relatively weak association between these two parameters. This is consistent with the recent report by Garrelfs and colleagues who found the contribution of glycolate metabolism to EOS, as determined by a 13C2-glycolate steady-state continuous intravenous infusion, was <3%. 23
The results indicate that oxalate synthesis is significantly different in males and females, which in part may be driven by differences in oxalate synthesis in lean body compartments. The 95 percentiles for estimated EOS were 32 and 34 mg/day in females and males, respectively. These data will be useful to identify patients with calcium oxalate kidney stones and increased EOS who may benefit from specific therapy. Conditions such as kidney stones, obesity, diabetes, MASLD, and potential CKD progression are associated with increased urinary oxalate excretion. Considering the gender differences in EOS in our study, it would be interesting to investigate if they exist in these cohorts. In addition, a search for gender differences in the metabolism of oxalate precursors, such as glycolate, hydroxyproline, and ascorbic acid in various tissues, warrants consideration.
We did not find a difference in oxalate excretion between those colonized and those not colonized with O.f. There may be several reasons for this including the extremely low oxalate diet which was administered to estimate EOS. While gastrointestinal oxalate secretion has been demonstrated to be stimulated in rodents colonized with this organism, this was not assessed in this study or previously measured in humans. 24 Demographics were not matched, which could have had an influence. However, Kelly and associates found no association between O.f. colonization and age, gender, and BMI. 25
We recognize that our study has certain limitations. EOS was estimated by collecting 24-hour urines on an ultra-low oxalate diet. In our previous study where this was compared with the gold standard for assessing EOS (intravenous infusion of 13C2-oxalate), urinary oxalate excretion was higher by 3 mg/day on the ultra-low oxalate diet. Anthropomorphic measurements were assessed with bioimpedance, an approach used by others, 26,27 and not the gold standard method, dual energy X-ray absorptiometry (DEXA). We are aware of only one study assessing the utilization of DEXA to assess the impact of body composition on urinary risk factors in nonkidney stone formers. 21 An analysis of the fecal microbiome including the oxalobiome (O.f. and other oxalate degrading organisms) was not undertaken, which could have influenced results. Dietary compliance was not confirmed. This is best done by having participants housed in a metabolic unit where diets are administrated by trained staff, which was not performed in these studies.
In conclusion, the utilization of ultra-low oxalate diets as an estimate of EOS demonstrated gender differences in this parameter, which to our knowledge has not been reported. Lean body mass has a significant influence on EOS. This may be because of EOS occurring in skeletal muscle or differences in hepatic oxalate synthesis. Further investigations in kidney stone forming cohorts and those with other comorbidities are needed to determine if these relationships are influenced by these conditions.
Footnotes
Acknowledgments
The authors thank Demond Wiley and Lisa Harvey for coordinating study recruitment and retention, and Tamara Keenum and Michelle Bui for their technical assistance. The authors are grateful for the help of the CRUs at the University of Alabama at Birmingham.
Authors’ Contributions
S.F., J.K., N.M.M., D.G.A., J.J.C., and K.D.W. designed the studies; S.F. and J.K. carried out the experiments; all authors analyzed the data; all authors drafted, revised, and approved the final version of the article.
Data Sharing
Individual deidentified participant data reported in this article are available in Supplementary Data.
Author Disclosure Statement
No competing financial interests exist.
Funding Information
This work was funded by National Institutes of Health grants K08DK115833, R01DK126774, R01DK087967, R03DK129497, P20DK119788, K01DK114332, UL1TR003096, R01DK121689, and R01DK137784. ClinicalTrials.gov identifiers: NCT03808090, NCT04603898, NCT03752684, NCT05229952, NCT03704350, NCT04437225.
Supplementary Material
Supplementary Data
Abbreviations Used
References
Supplementary Material
Please find the following supplemental material available below.
For Open Access articles published under a Creative Commons License, all supplemental material carries the same license as the article it is associated with.
For non-Open Access articles published, all supplemental material carries a non-exclusive license, and permission requests for re-use of supplemental material or any part of supplemental material shall be sent directly to the copyright owner as specified in the copyright notice associated with the article.