
Abstract
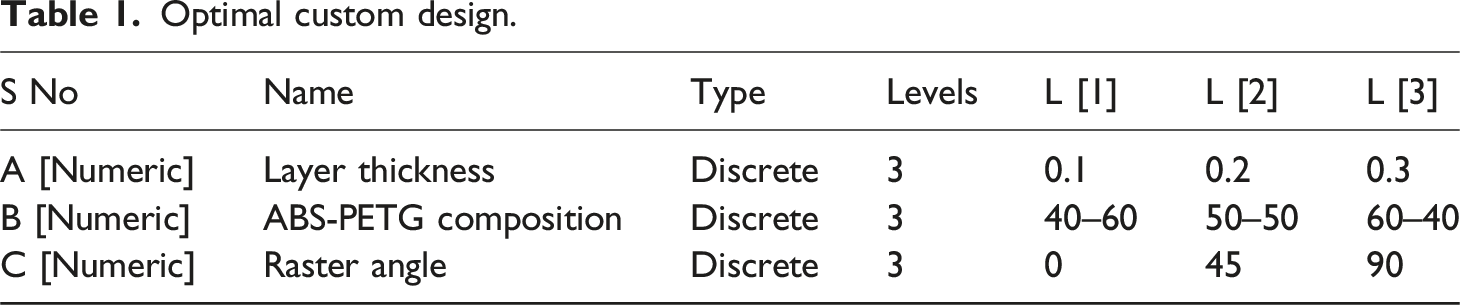
The Acrylonitrile Butadiene Styrene (ABS) and Polyethylene Terephthalate Glycol (PETG) are widely used polymers in industrial applications and employed as functional parts which undergo cyclic loading. Bilayer fabrication i.e. ABS-PETG via Fused Filament Fabrication (FFF) uses the benefits of both polymers and is utilized in automotive, aerospace, biomedical and consumer sector. In the present work, 20 ABS-PETG bilayer specimens (runs) retrieved through optimal custom design (OCD) have been fabricated using FFF to investigate their fatigue behaviour by selecting three most important process parameters with three levels i.e. layer thickness (0.1 mm, 0.2 mm, 0.3 mm), material composition of ABS-PETG (40:60, 50:50, 60:40) and raster angle
Introduction
The layer-by-layer production method in FFF allows innovative designs, less material usage and faster production rate among additive manufacturing technology enabling the direct translation of CAD models into sophisticated 3D structures.1,2 It allows industries to rapid prototype designs, 3 manufacture functional components and respond to on demand production requirements in aerospace, 4 automotive, 5 health monitoring application6,7 and construction. 8 In layer wise deposition process, an inadequate fusion between successive layers and directional anisotropy causes microstructural discontinuities, promote early crack and fracture during mechanical loading. 9 This fracture occurs when a cyclic load reaches its fatigue threshold. 10 In various sectors, polymers during service goes into various static and fatigue loads which is cyclic in nature that initiates various types of fatigue damage. ABS and PETG are inherently isotropic and the use of FFF introduces the anisotropic behaviour.11,12 The mechanical response of these FFF parts can be varied by process parameters which affects internal porosity, interlayer adhesion, stress localisation and dimensional distortion. 13 Process parameters exert a decisive influence on the fatigue strength of FFF fabricated parts particularly layer thickness and infill density identified as the primary contributors to performance variability. 14 In ABS, Infill density has been identified as most significant impact on fatigue resistance, 15 whereas PETG fatigue behaviour was markedly influenced by raster angle and applied stress magnitude. 16 Multi-material configuration of various thermoplastics was observed feasible for functional prototypes and improvement of mechanical properties.17–19 Through optimization tools, best set of configurations of process parameters can be achieved for enhancing the mechanical properties.5,20–23 Compared with conventionally moulded ABS, 3D Printed specimens demonstrate reduced fatigue performance. 24 FEA helps identifying the mechanical behaviour of FFF fabricated specimens under different loading conditions through simulation with boundary conditions.25,26 Existing literature on tension-tension fatigue of bilayer thermoplastic is very limited. Many studies have examined the effect of process parameter on fatigue strength in individual material, highlighting, PETG endured significantly longer low cycle fatigue (LCF) strength than ABS at the same applied strain amplitude. 27 This dependency of process parameter plays a big role in affecting mechanical properties that can be enhanced via optimization tools.18,28,29
Most existing studies have investigated the fatigue behaviour of FFF-fabricated parts using monolithic polymers where fatigue performance was limited by anisotropic interlayer bonding and raster-controlled crack propagation, whereas for multimaterial it’s been limited to static tensile and flexural properties.30–32 In the proposed work, bi-material layering technique has been implemented to improve the fatigue strength that combined contrasting strength of ABS and PETG to achieve better performance. A bilayer architecture introduced an additional load-sharing interface that enhanced interfacial mechanical integrity and promoted crack deflection, thereby offering a new pathway for improving fatigue resistance beyond single-material parameter optimization alone.
In contrast to monolithic FFF polymers, where fatigue performance is limited by anisotropic interlayer bonding and raster-controlled crack propagation, a bilayer polymer architecture introduces an additional load-sharing interface that enhances interfacial mechanical integrity and promotes crack deflection, thereby offering a new pathway for improving fatigue resistance beyond single-material parameter optimization alone.
A total of 20 different configurations has been fabricated by FFF in accordance with ASTM D638 Type IV and evaluated by ASTM D7719-22 procedure for UATTFT. As the integration of experimental fatigue analysis with FEA and NN-GA optimization for bilayer systems remained sparse, this study analysed experimental fatigue test data using FEA, RSM and enhanced by machine learning-optimization technique i.e. NN-GA. The optimized configuration determined by NN-GA yielded improved fatigue strength which exceeds both RSM and experimental matrix. This study of bilayer composition of material for improving fatigue strength will act as a guide for other combination of polymers.
Research methodology
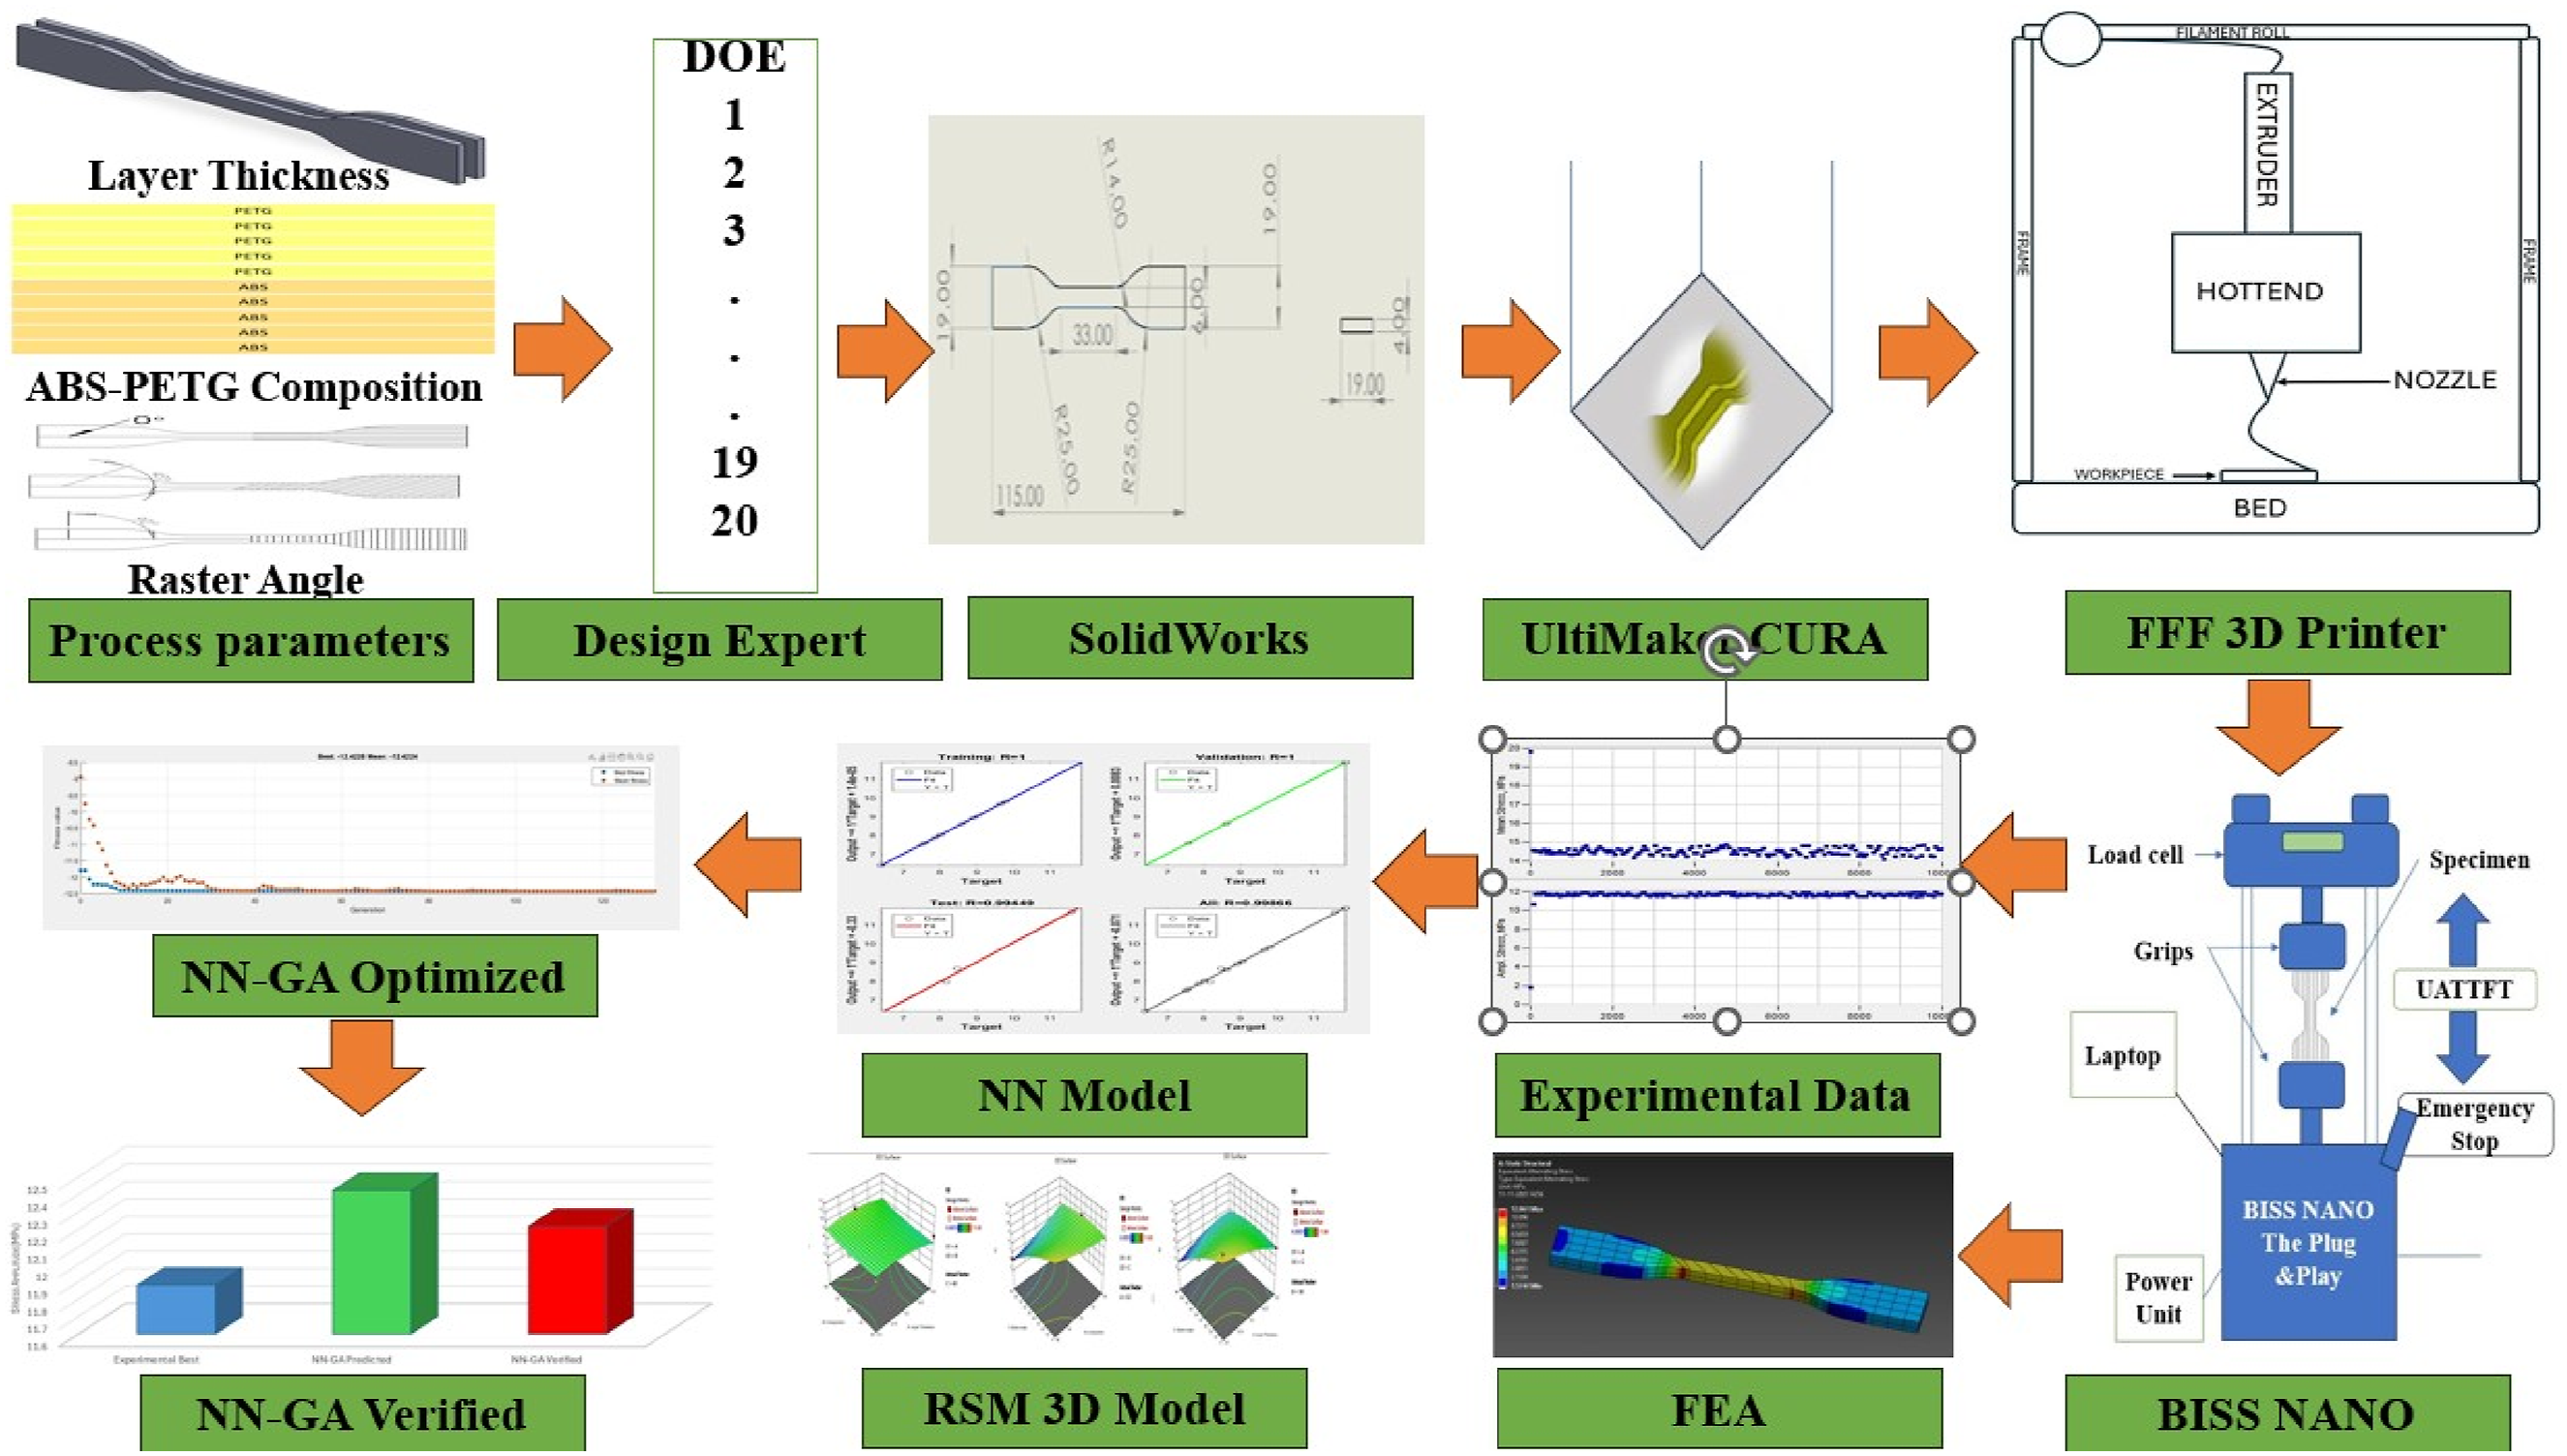
A comprehensive methodology combining experimental design and predictive modelling has been used to systematically investigate and enhance the fatigue strength of ABS-PETG bilayer specimen. Specimens have been designed in SolidWorks, 3D printed via FFF using Creality Ender 3 V2 printer and tested using BISS Nano servo hydraulic machine. The FEA simulation of bilayer specimen under UATTFT have been performed and validated experimentally. The experimental runs have been designed using OCD and results were employed to develop NN model in MATLAB, which has been further used for optimization through GA, thus designing NN-GA. The combined use of RSM and NN-GA allowed a better understanding of parameters-material interactions and improved of fatigue strength with high predictive accuracy.
Design of experiments (DOE)
Optimal custom design.
Specimen fabrication
The specimens have been designed in CAD software (SolidWorks) according to ASTM D638 type -IV as illustrated in Figure 1. ASTM D638 type IV.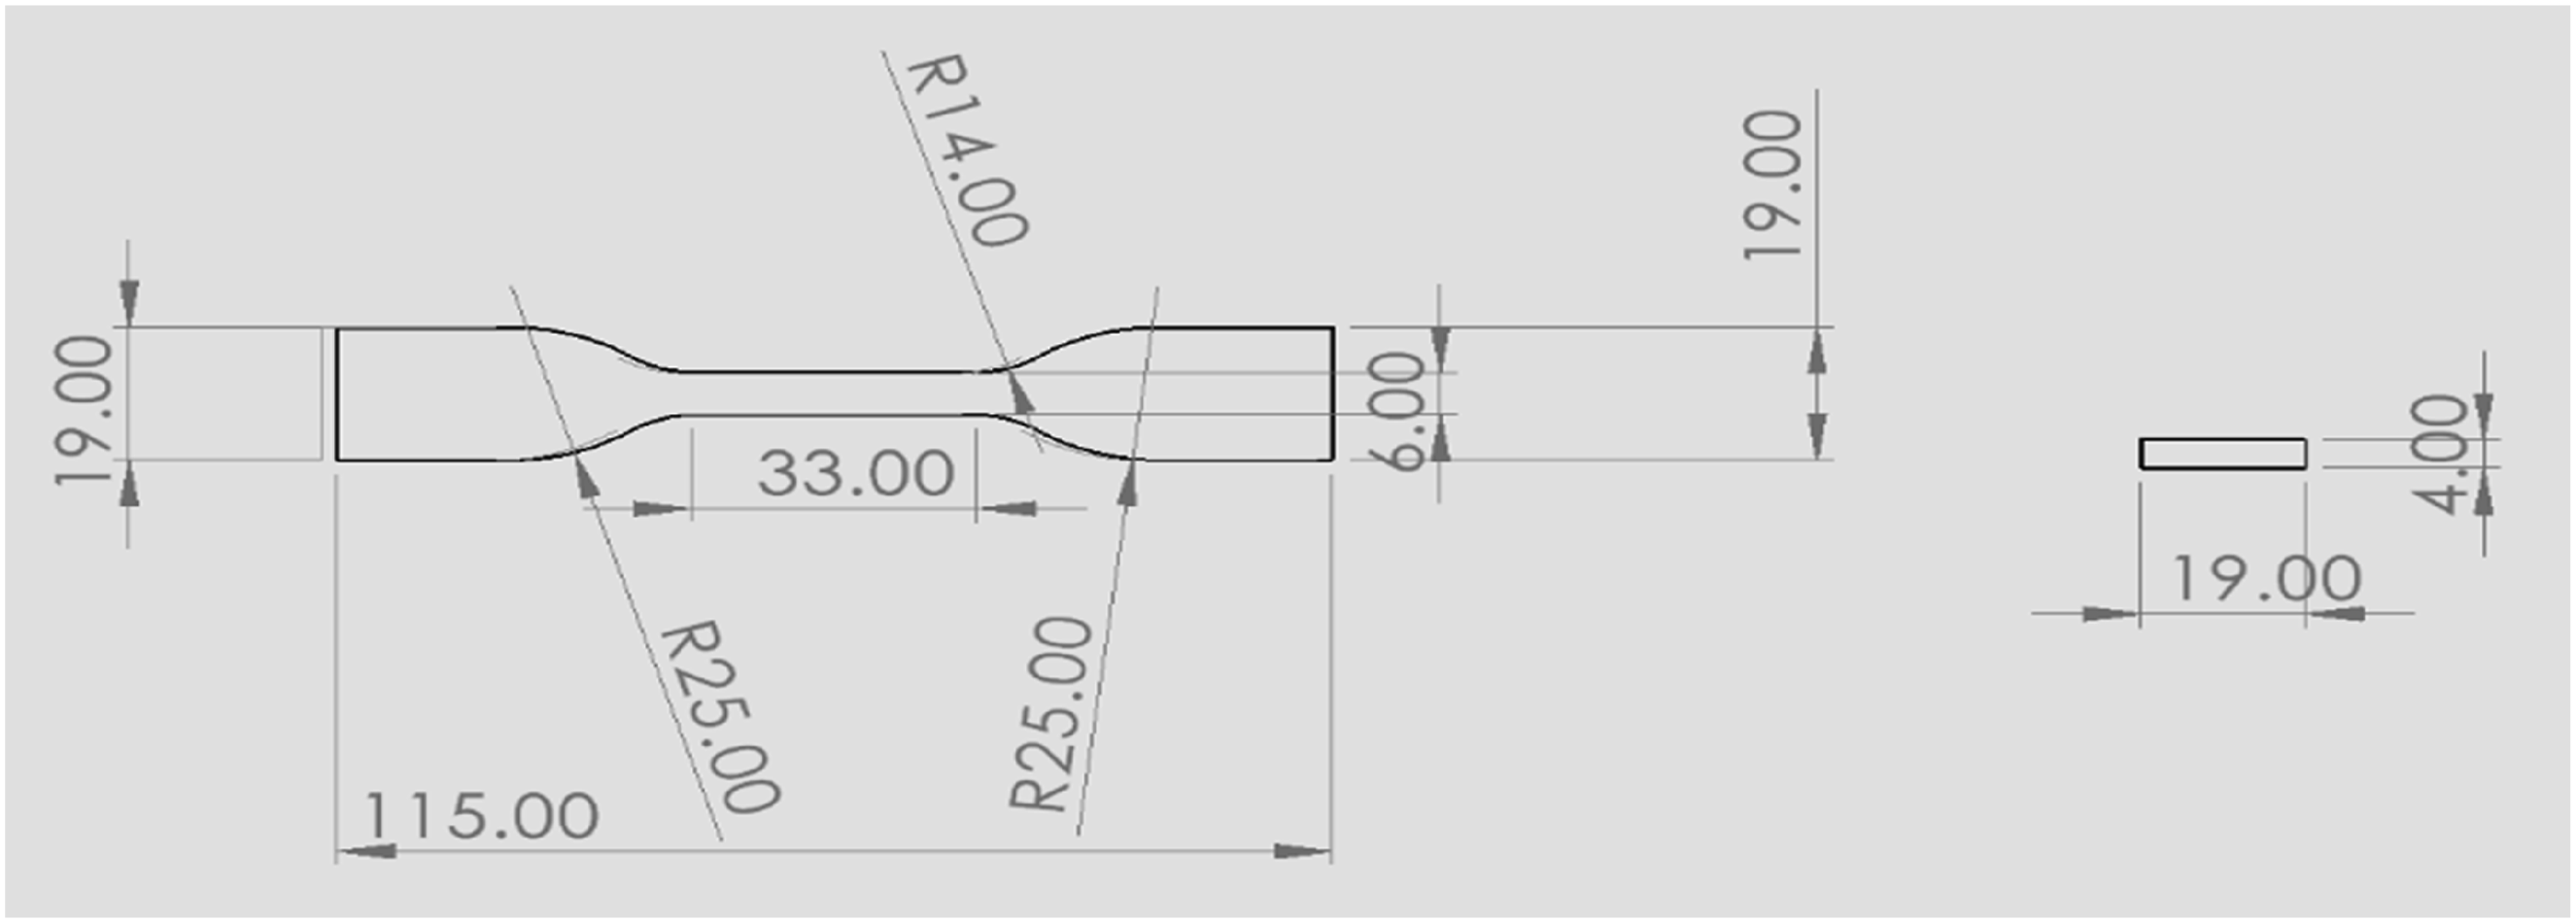
The file was saved in STL format and further converted into G-code using slicing software (Ulti-maker CURA) and exported to Creality Ender 3 V2 FFF printer (Figure 2). Creality ender 3 V2.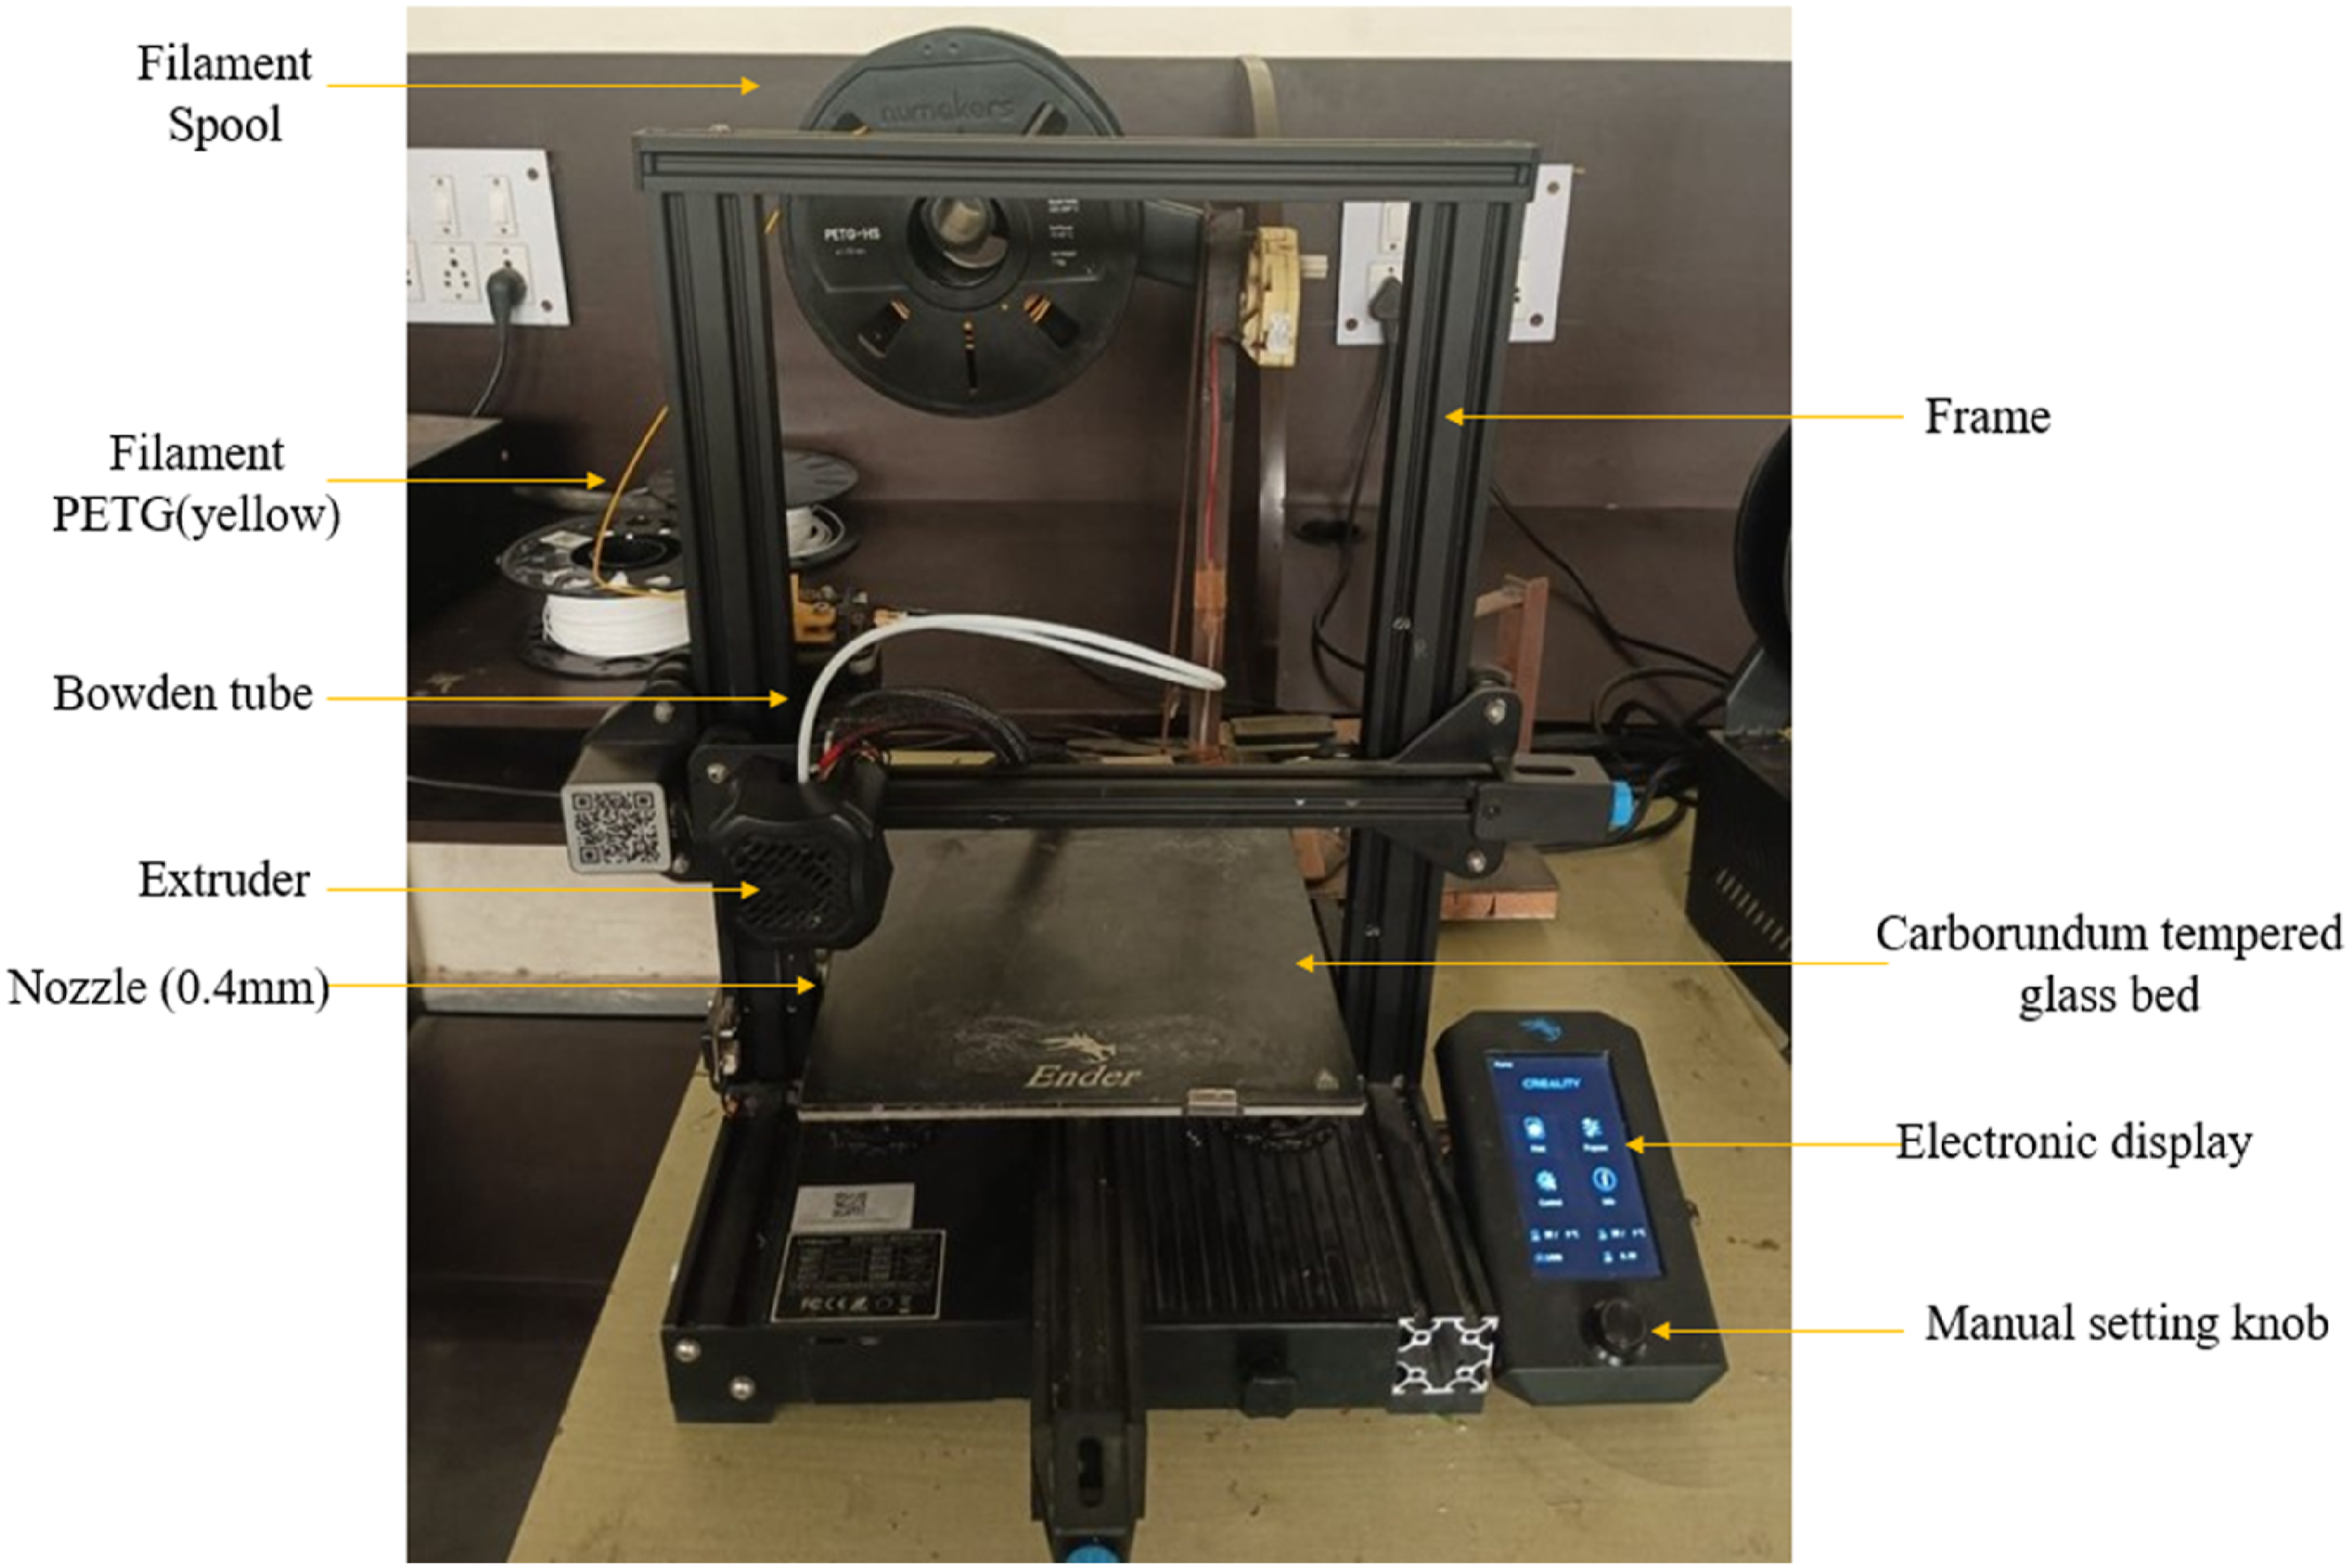
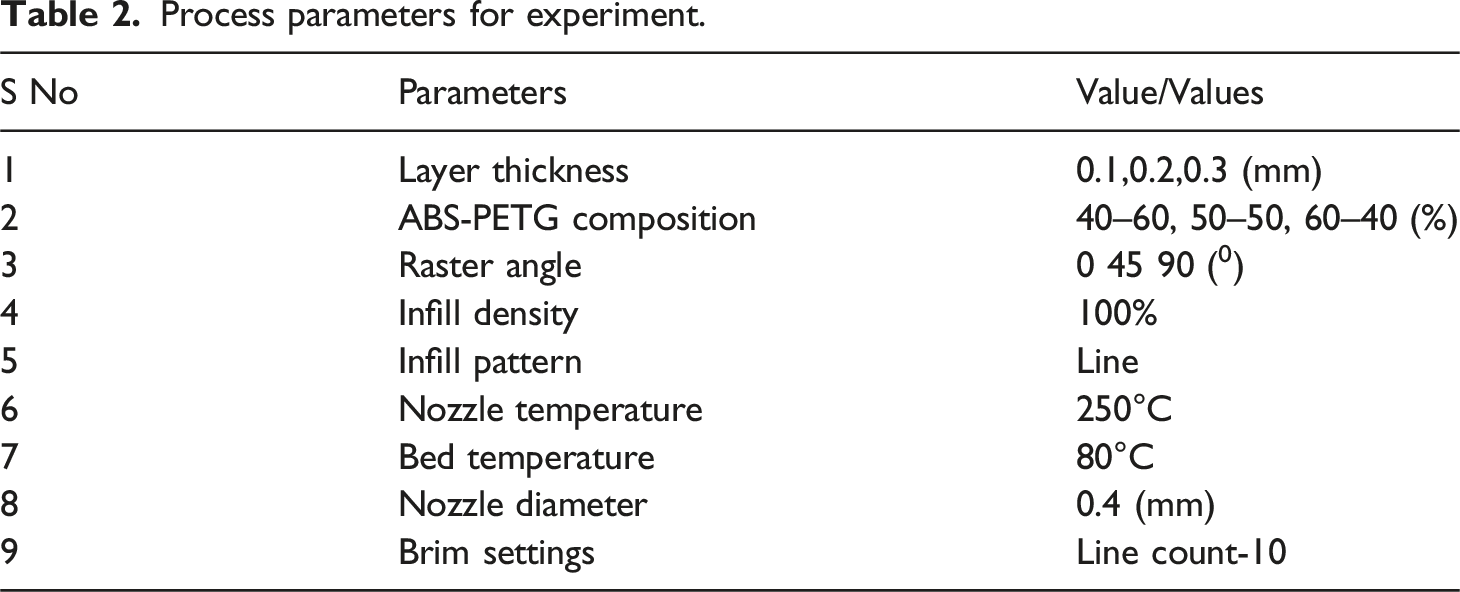
Process parameters for experiment.
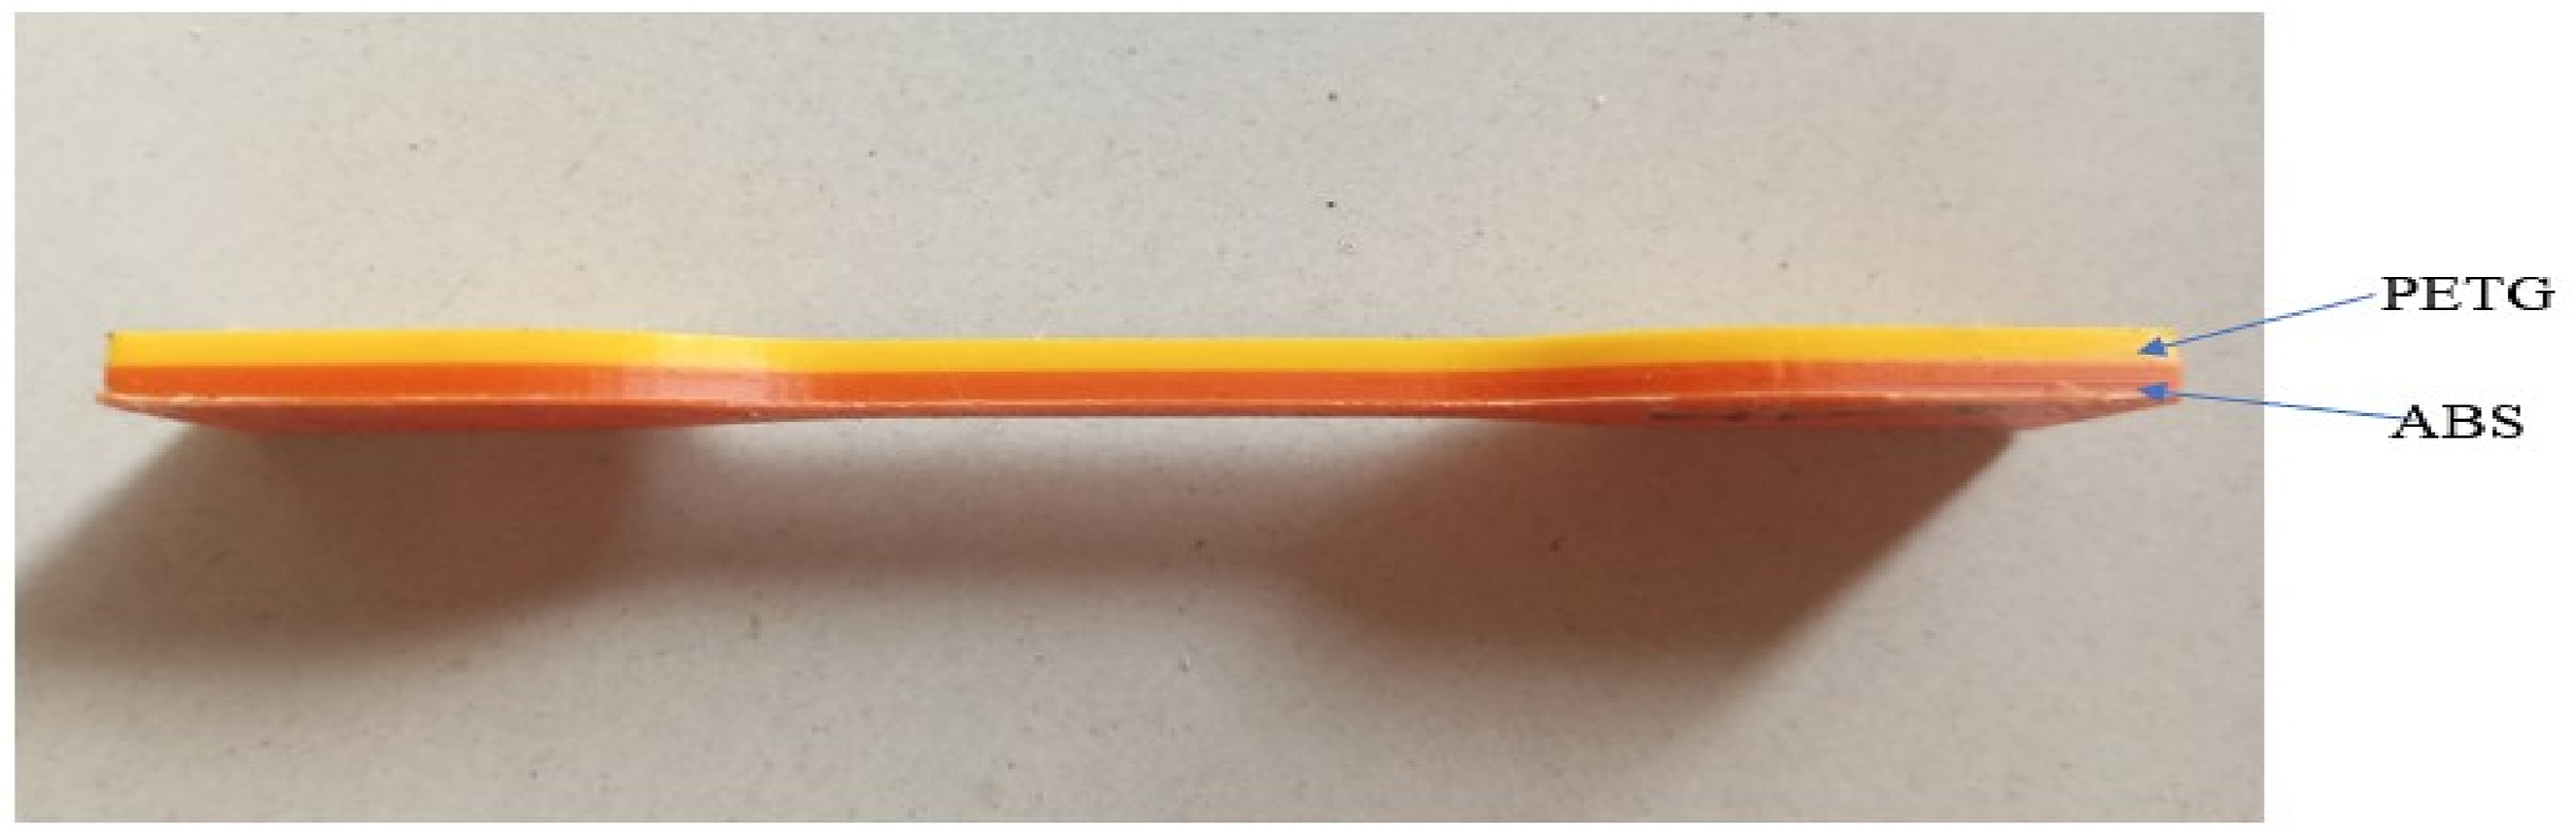
Bilayer composition of ABS (base-orange)- PETG (top-yellow).
The ABS (base)–PETG (top) bilayer configuration was investigated to assess its influence on fatigue behaviour. Modest interfacial chemical interactions between ABS and PETG, interfacial bonding is expected to be primarily mechanical, making fabrication parameters critical to stress transfer and fatigue performance. The samples fabricated based on DOE configurations were shown in Figure 4. 20 runs fabricated specimens.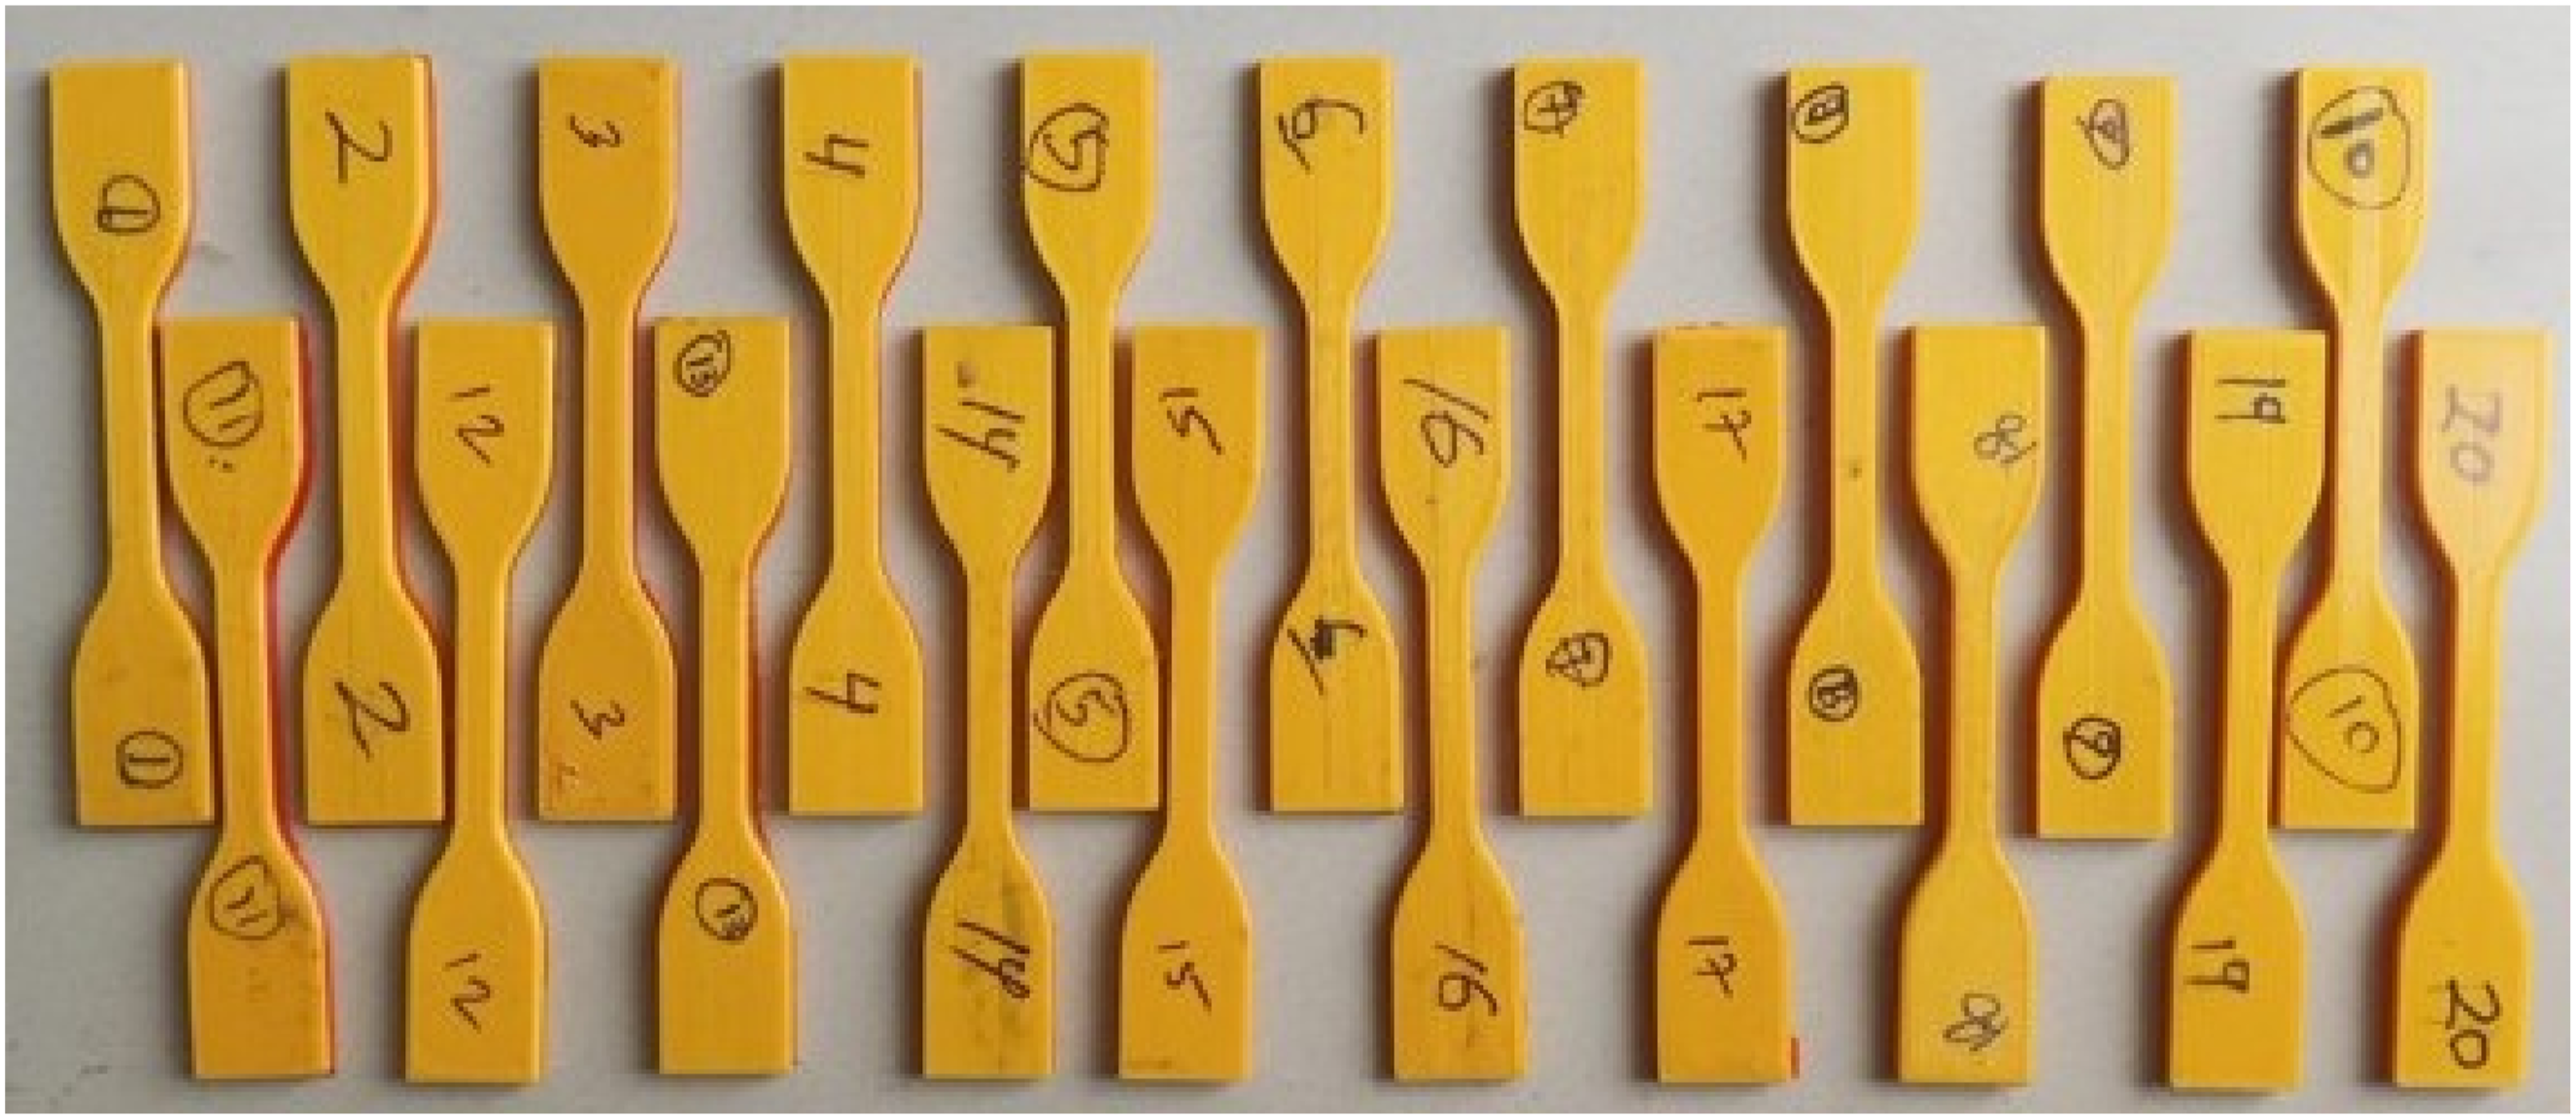
Experimental setup of UATTFT
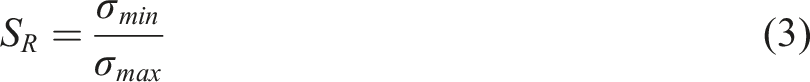
UATTFT was performed under load-controlled mode by BISS NANO the servo-hydraulic testing machine displayed in Figure 5 in compliance with ASTM D7791-22. The stress ratio (S
R
) = 0.1 was maintained throughout the tests and specimen surpassing more than 10,000 cycles at a given stress amplitude has been considered as infinite cycles. Under LCF, specimens were tested at 1 Hz frequency with varying stress and mean amplitude for four different stress levels on all 20 runs of DOE. The stress amplitude and mean stress have been calculated by equations (1) and (2) respectively: BISS nano servo-hydraulic testing system.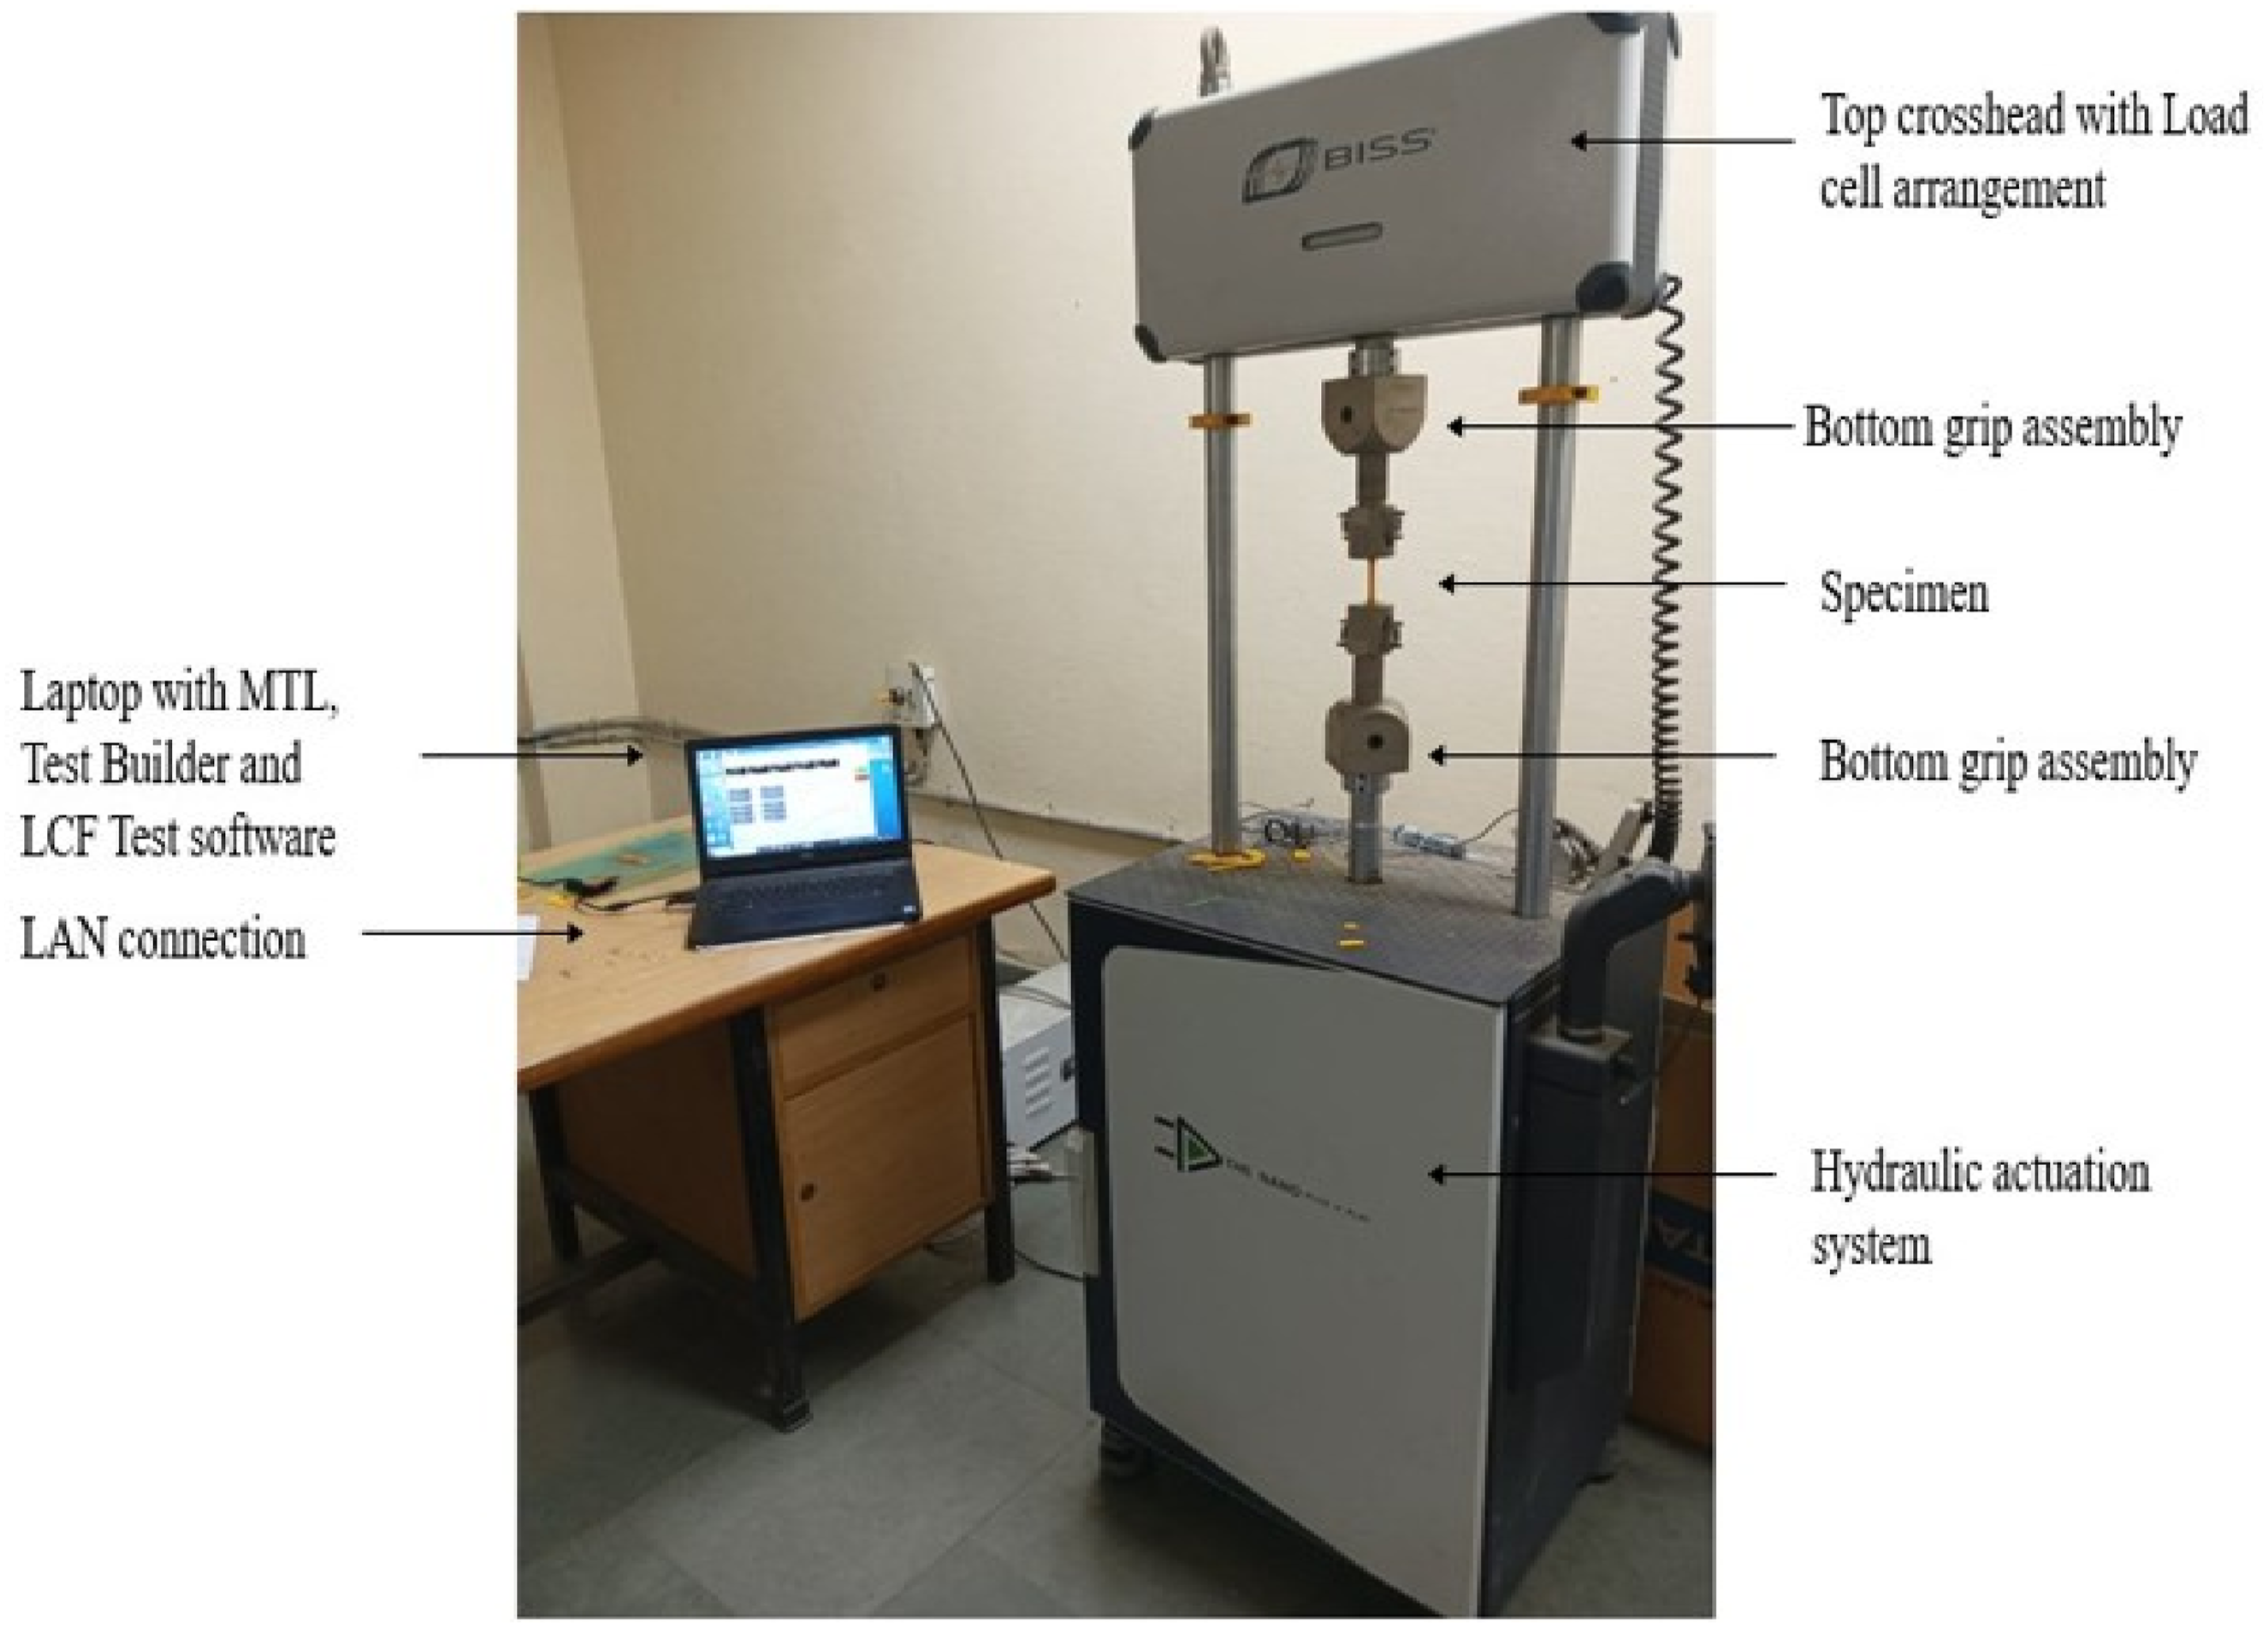
Stress Amplitude (σ
a
):
Mean Stress (σ
m
):
A test was deemed completed when it reaches infinite cycle. Overall, a total of 240 samples has been tested (20 runs × 4 stress levels × 3 replicates for each stress level) according to ASTM standard for fatigue testing.
Modelling & analysis using RSM and NN-GA
The experimental data obtained from the fatigue tests were employed to develop regression model. The RSM captured the complex, non-linear relationship through polynomial equation. The effect of process parameters of FFF with respect to the fatigue strength of specimen have been evaluated using 3D surface plot.
An ML (NN-GA) approach has been implemented in which a feedforward neural network (FNN) acted as a surrogate model for GA execution to maximise the fatigue strength. It was developed using a feedforward backpropagation Levenberg-Marquardt algorithm to train its performance, using a coefficient of determination (R2) and a minimal Mean Squared Error (MSE), reflecting accurate prediction with minimal deviation. This model was constructed and stored in a file .mat format with data percentage of 70%, 15% and 15% for training, validation and testing respectively. In GA, the stored network file integrated as a fitness function which predicted the optimized parameters.
FEA
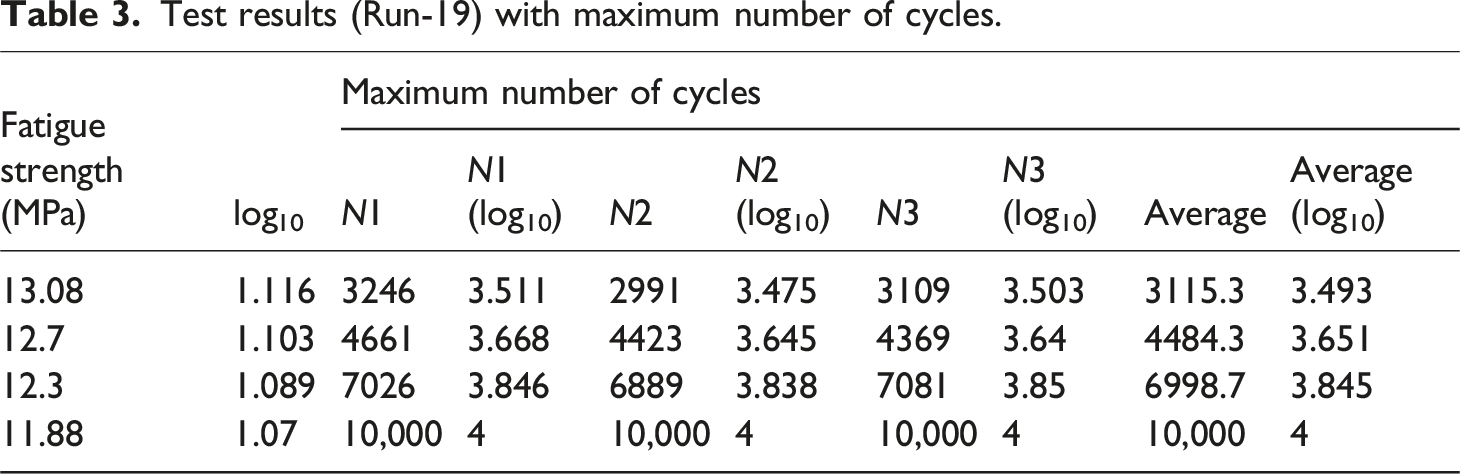
Test results (Run-19) with maximum number of cycles.
Results and discussions
The 240 (20 × 4 × 3) specimens have been fabricated using Creality Ender 3 V2 printer based on experimental design matrix. The fatigue test on 240 samples has been performed as per ASTM standard. Samples were subjected to repeated tensile stress at a fixed frequency (1 Hz) and stress ratio (S
R
= 0.1) until failure. The run-19 was the best fatigue value specimen with stress amplitude of 11.88 MPa and mean stress of 14.52 MPa as shown in Table 5. Corresponding to the best run 19, the mean stress fluctuated narrowly between 14 MPa and 15 MPa and the amplitude stress remained consistent near 12 MPa as shown in Figure 6(a). The maximum stress of around 26 MPa and minimum stress of 2.6 MPa up to 10,000 cycle maintains S
R
= 0.1 as shown in Figure 6(b). (a) Mean and amplitude stress (b) maximum and minimum stress.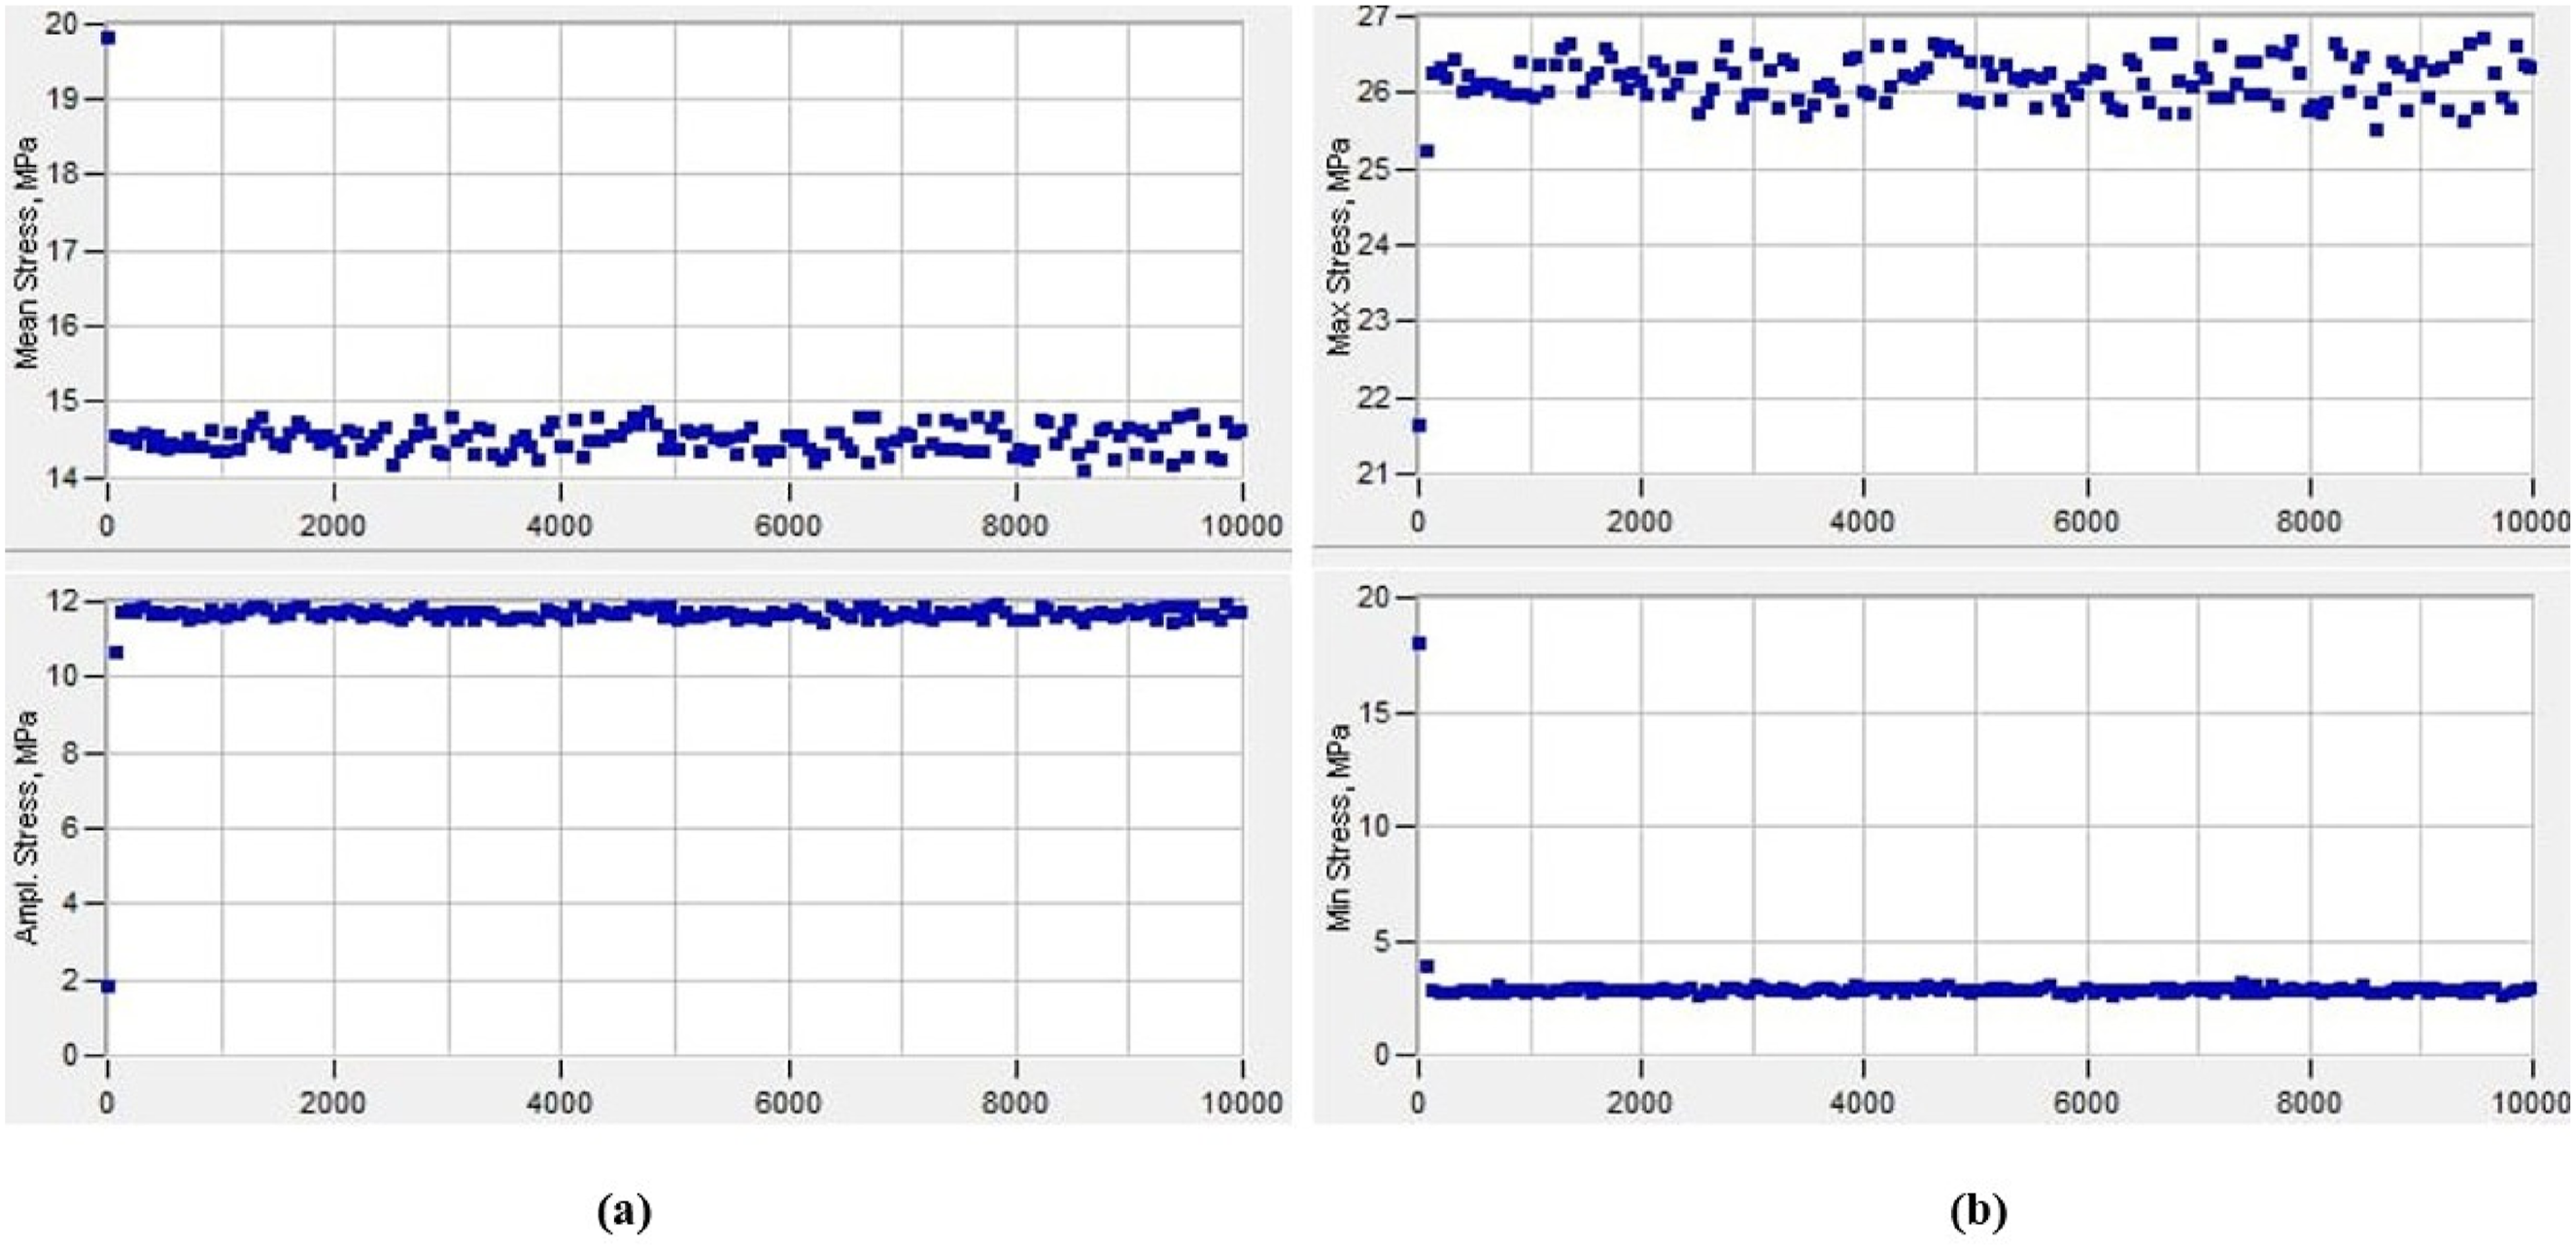
Figure 7 showed the fatigue induced fractured bilayer specimen of ABS-PETG under UATTFT. A reduction in layer thickness resulted in delayed crack initiation by enhancing filament contact area and reducing internal voids to increased fatigue strength. Additionally, Reduced stress concentration at the interface was achieved at raster angles close to 0° that promoted more effective load transfer along the filament direction. The use of an elevated bed temperature of 80°C together with a nozzle temperature of 250°C further strengthened interlayer adhesion by increasing polymer chain mobility and interfacial diffusion. These mechanisms collectively delay crack initiation, reduce stress localization, and slow fatigue crack propagation under cyclic loading. Fatigue Induced failure of Bilayer ABS–PETG Specimen.
Log S-Log N curve analysis
The logarithmic form of the S-N curve equation used in fatigue analysis has been derived from experimental fatigue datasets of run-19 as presented in Table 3.
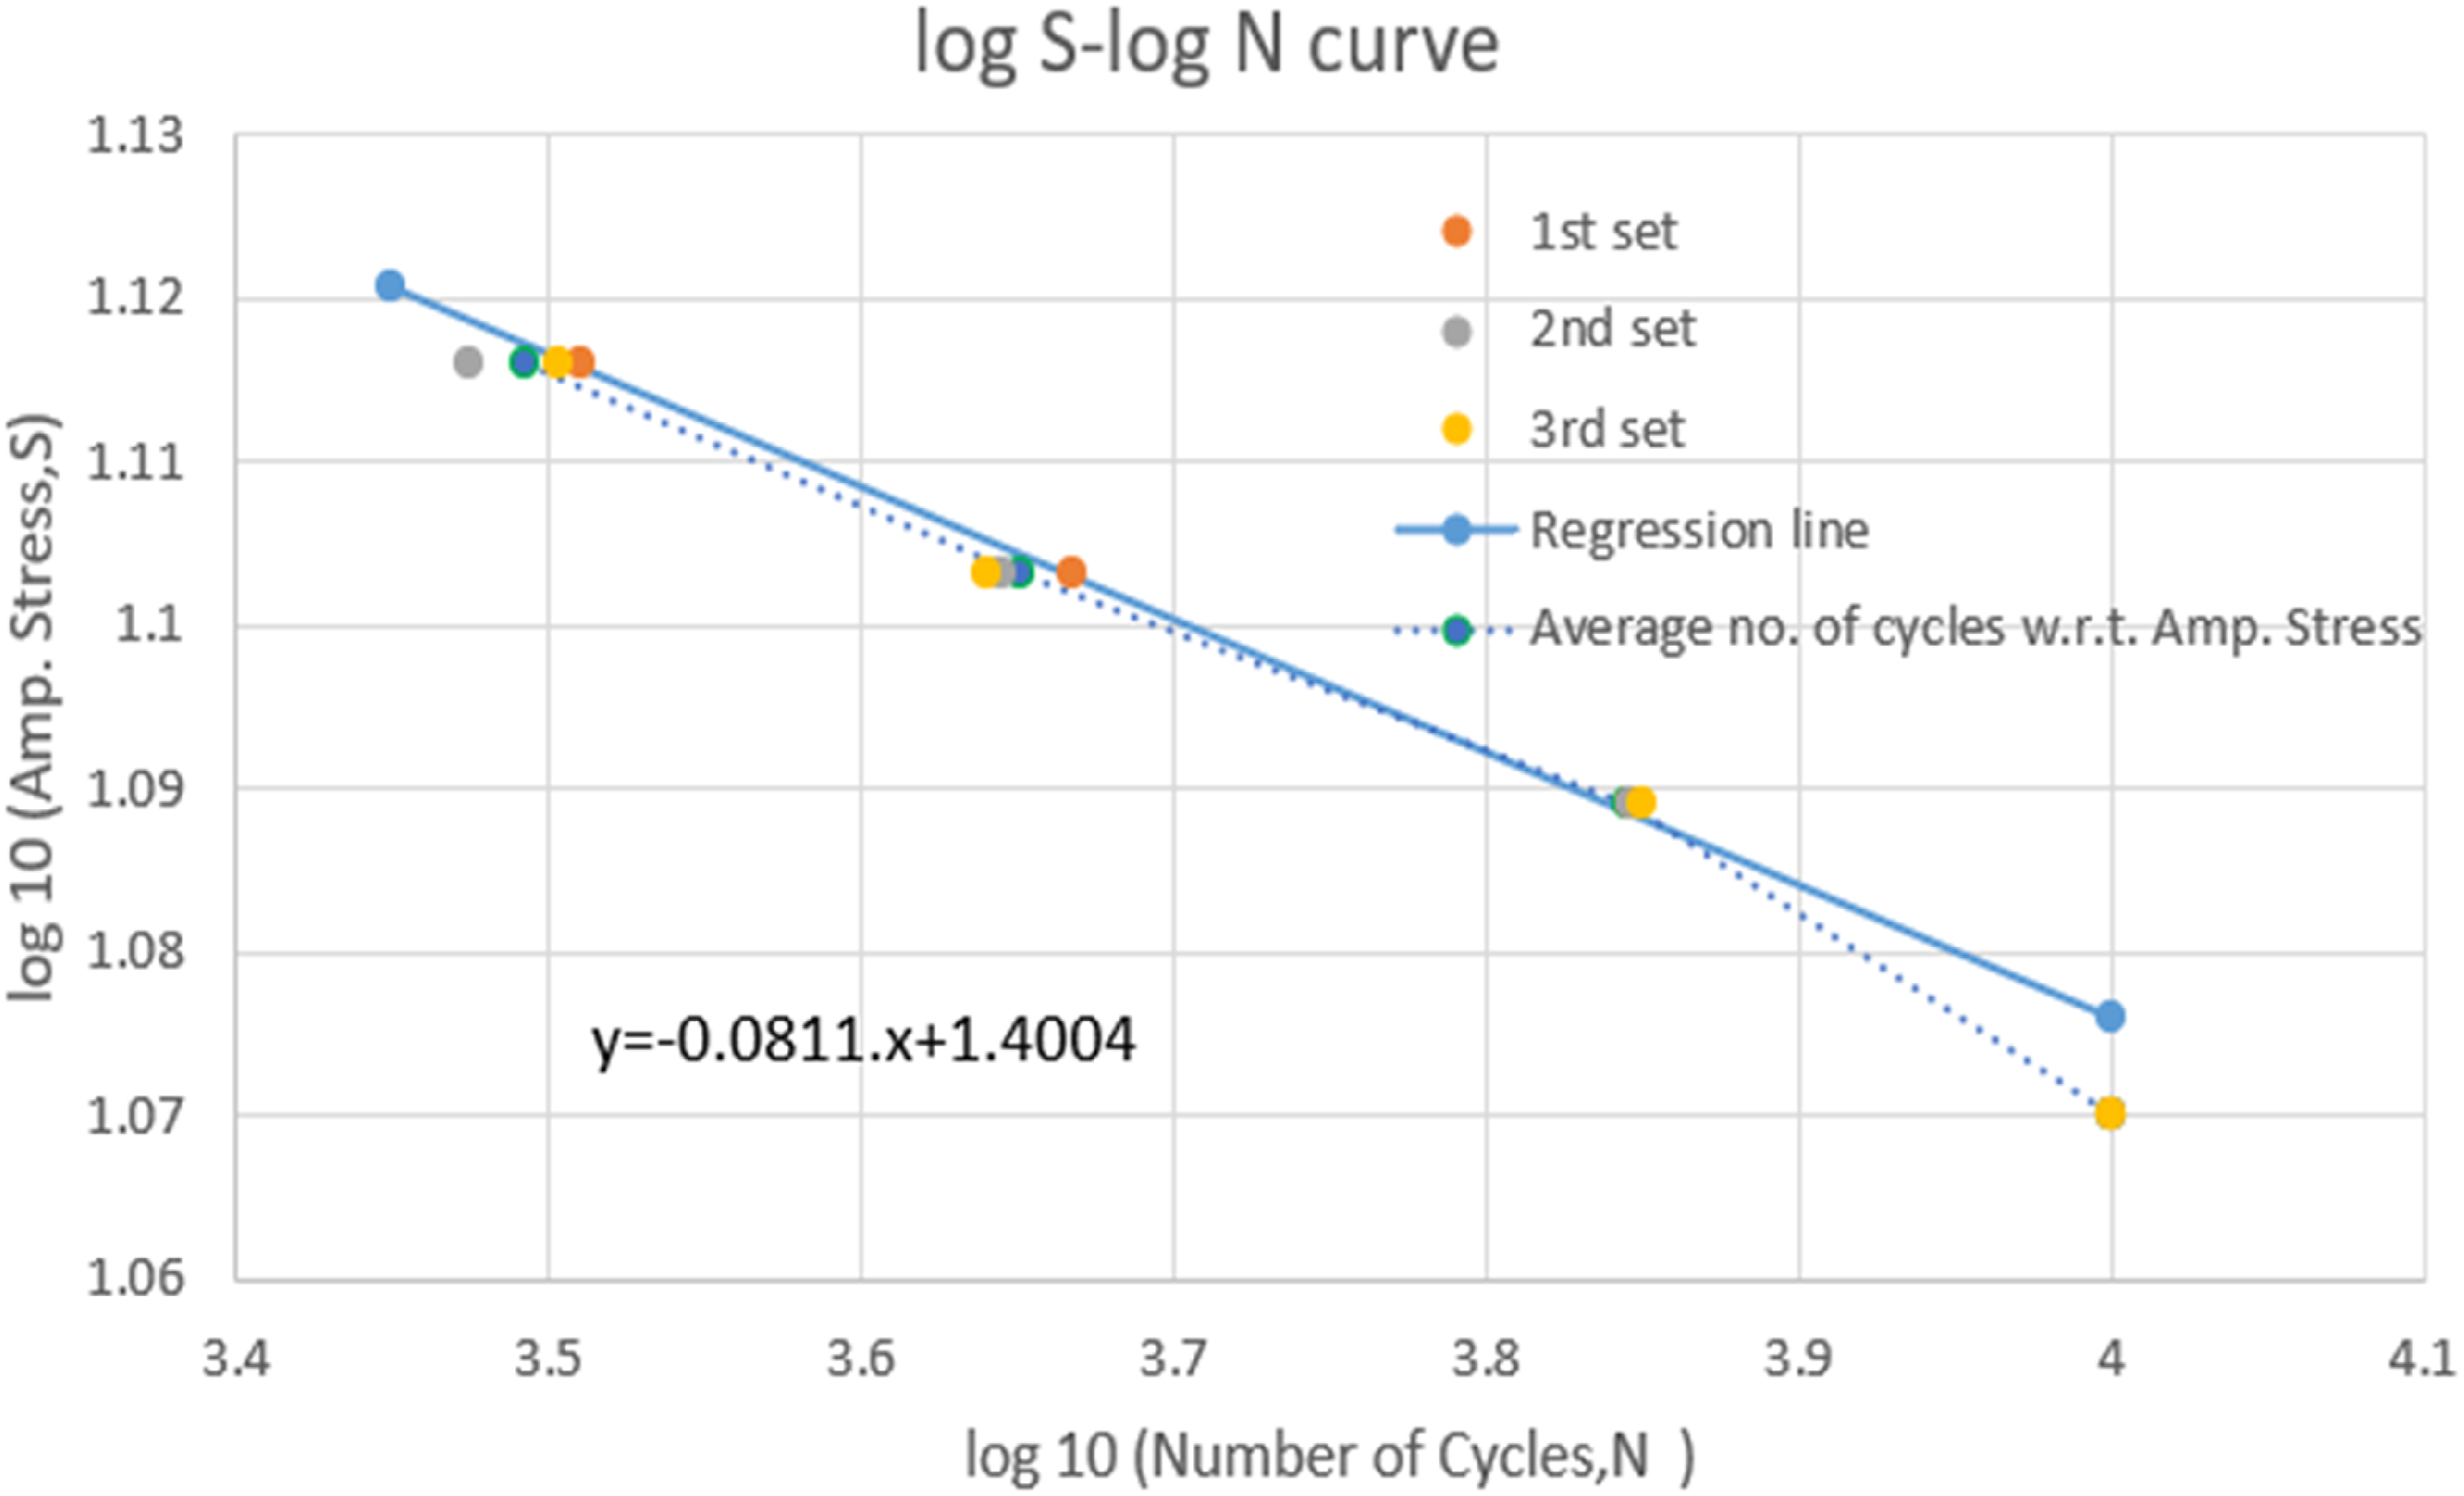
The Basquin’s equation for fatigue strength analysis uses the logarithmic form (equation (4)) that defines the linear correlation between the values of stress amplitude (S) and the number of cycle (N).
Linear regression of Test (run-19) result with logarithmic average from four stress level and maximum number of cycles was plotted and illustrated in Figure 8 using the equations (4) and (5): The log S-log N Curve for Run Number 19.
Simulation by FEA
The FEA analysis of bilayer specimen has been performed and the maximum Von Mises stress was concentrated close to the transition radius between the grip and gauge sections, according to the results of the FEA simulation. This location exactly matched the fracture initiation zones that has been observed during fatigue testing. Throughout the gauge section, the overall distribution of stress stayed constant. The maximum amplitude stress as equivalent alternating stress was shown in Figure 9(a) 12.061 MPa with an 1.8% deviation from 11.88 MPa experimental test results. The specimen performed the 10,000-cycle count at this stress level at node 785 a stress concertation shown in Figure 9(b) was observed. (a) Equivalent alternating stress & (b) fatigue life.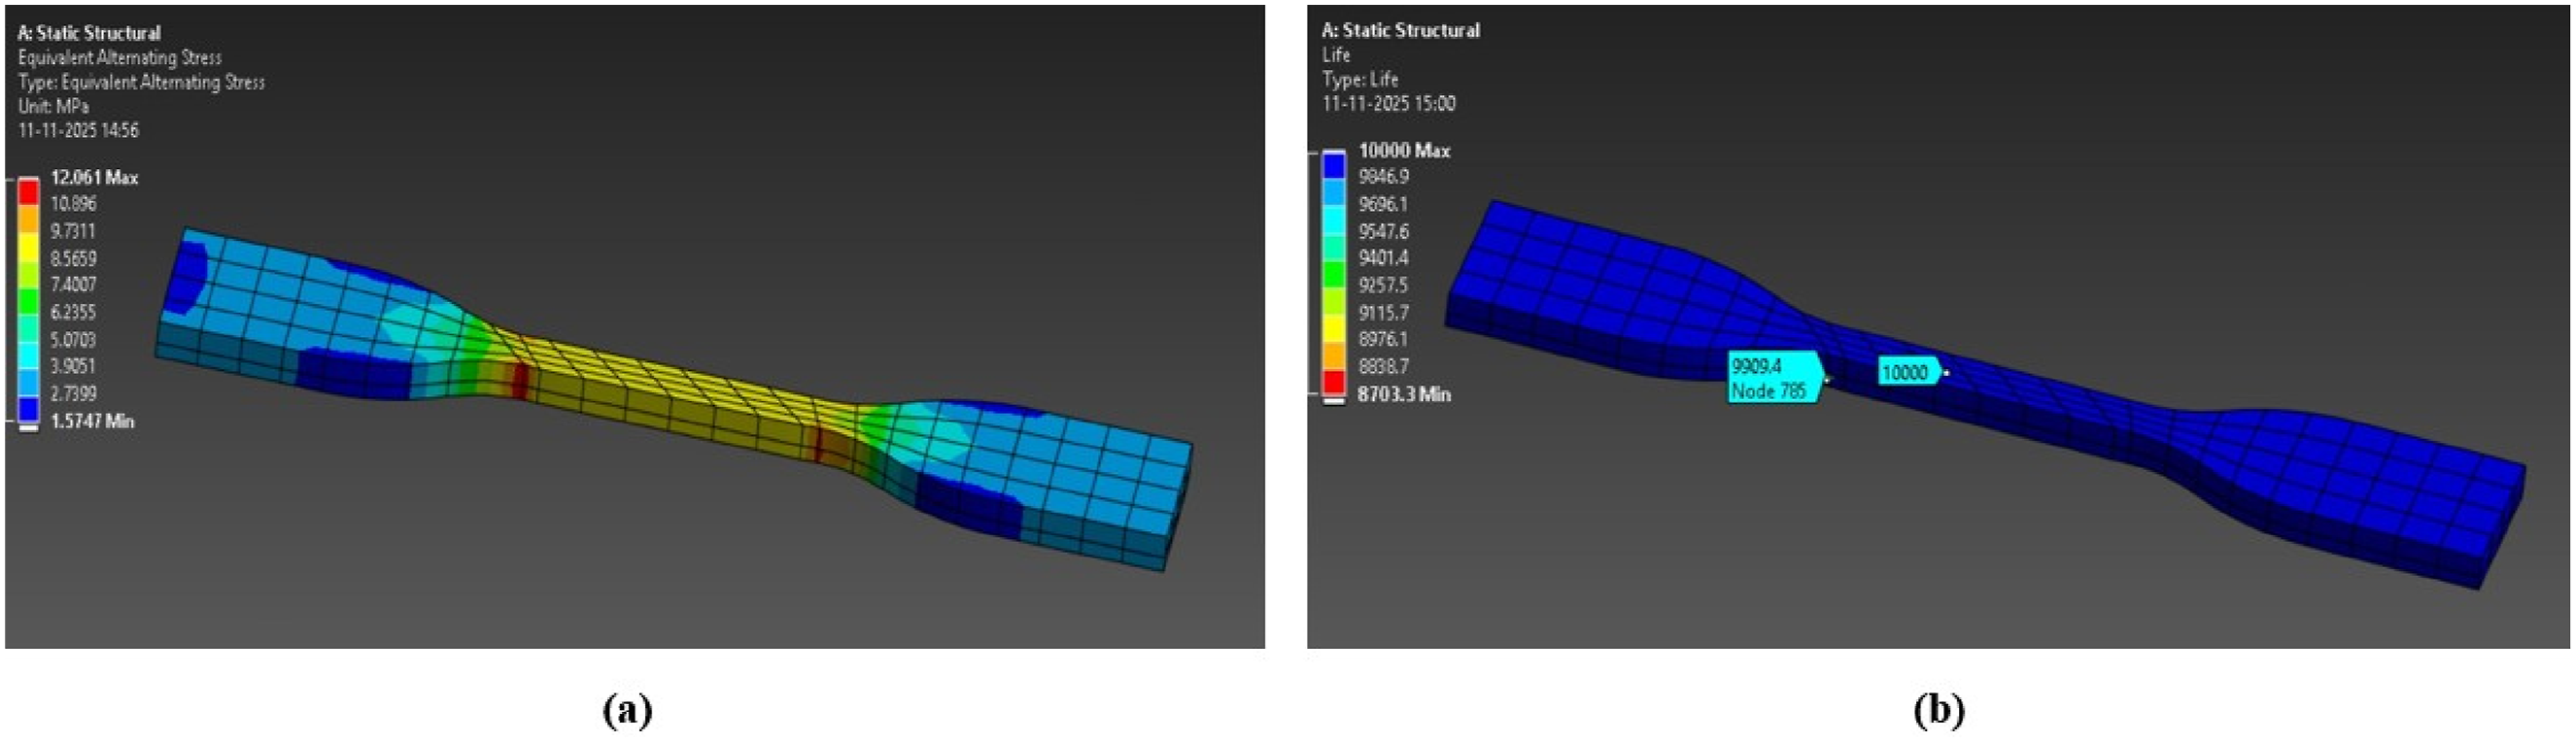
RSM
Fit statistics.
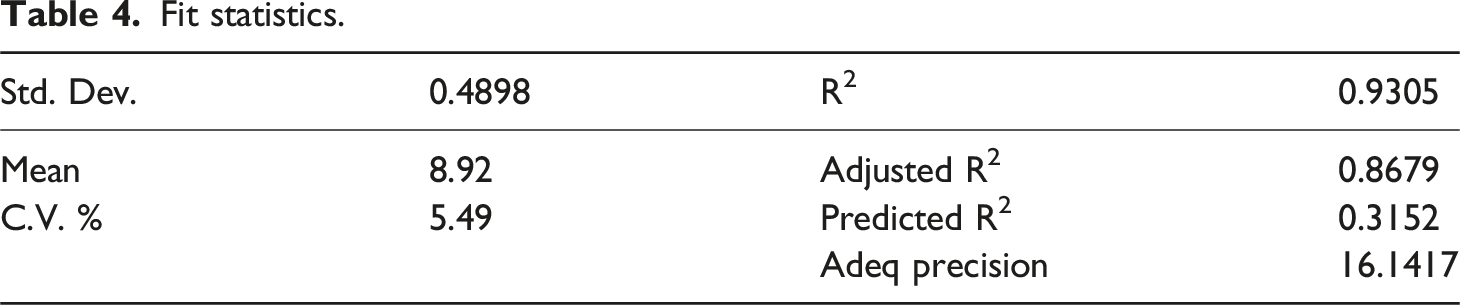
The equation of process parameters generated by RSM for fatigue strength (R1) is given below: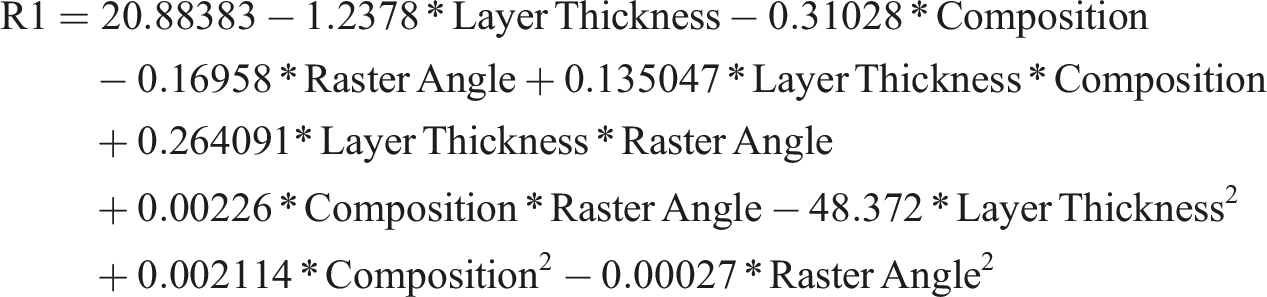
The influence of interaction between layer thickness and raster angle (AC) was highly significant (F = 40.20, p < .0001) indicating strong dependability to each other. The combined effect of bead geometry and filament alignment on interlayer adhesion quality and stress transfer efficiency was physically reflected with this interaction. Three key parameter pairs were depicted to visualize the relation through 3D surface plot: composition versus layer thickness, raster angle versus layer thickness, and raster angle versus composition, as shown in Figure 9(a)–(c) respectively.
Figure 10(a) showed a fatigue strength around 8 MPa at a layer thickness of 0.2 mm and 50% ABS composition. As the composition of ABS increases up to 60% the fatigue strength also increases. The fatigue strength of maximum at 0.1 mm layer thickness and 0° raster angle. As both layer thickness and raster angle increases the fatigue strength decrease as shown in Figure 10(b) and (c) showed that at 0° raster angle and 60% ABS composition; the fatigue strength was maximum. As the raster angle goes on increasing the fatigue strength will decrease. 3D model graphs.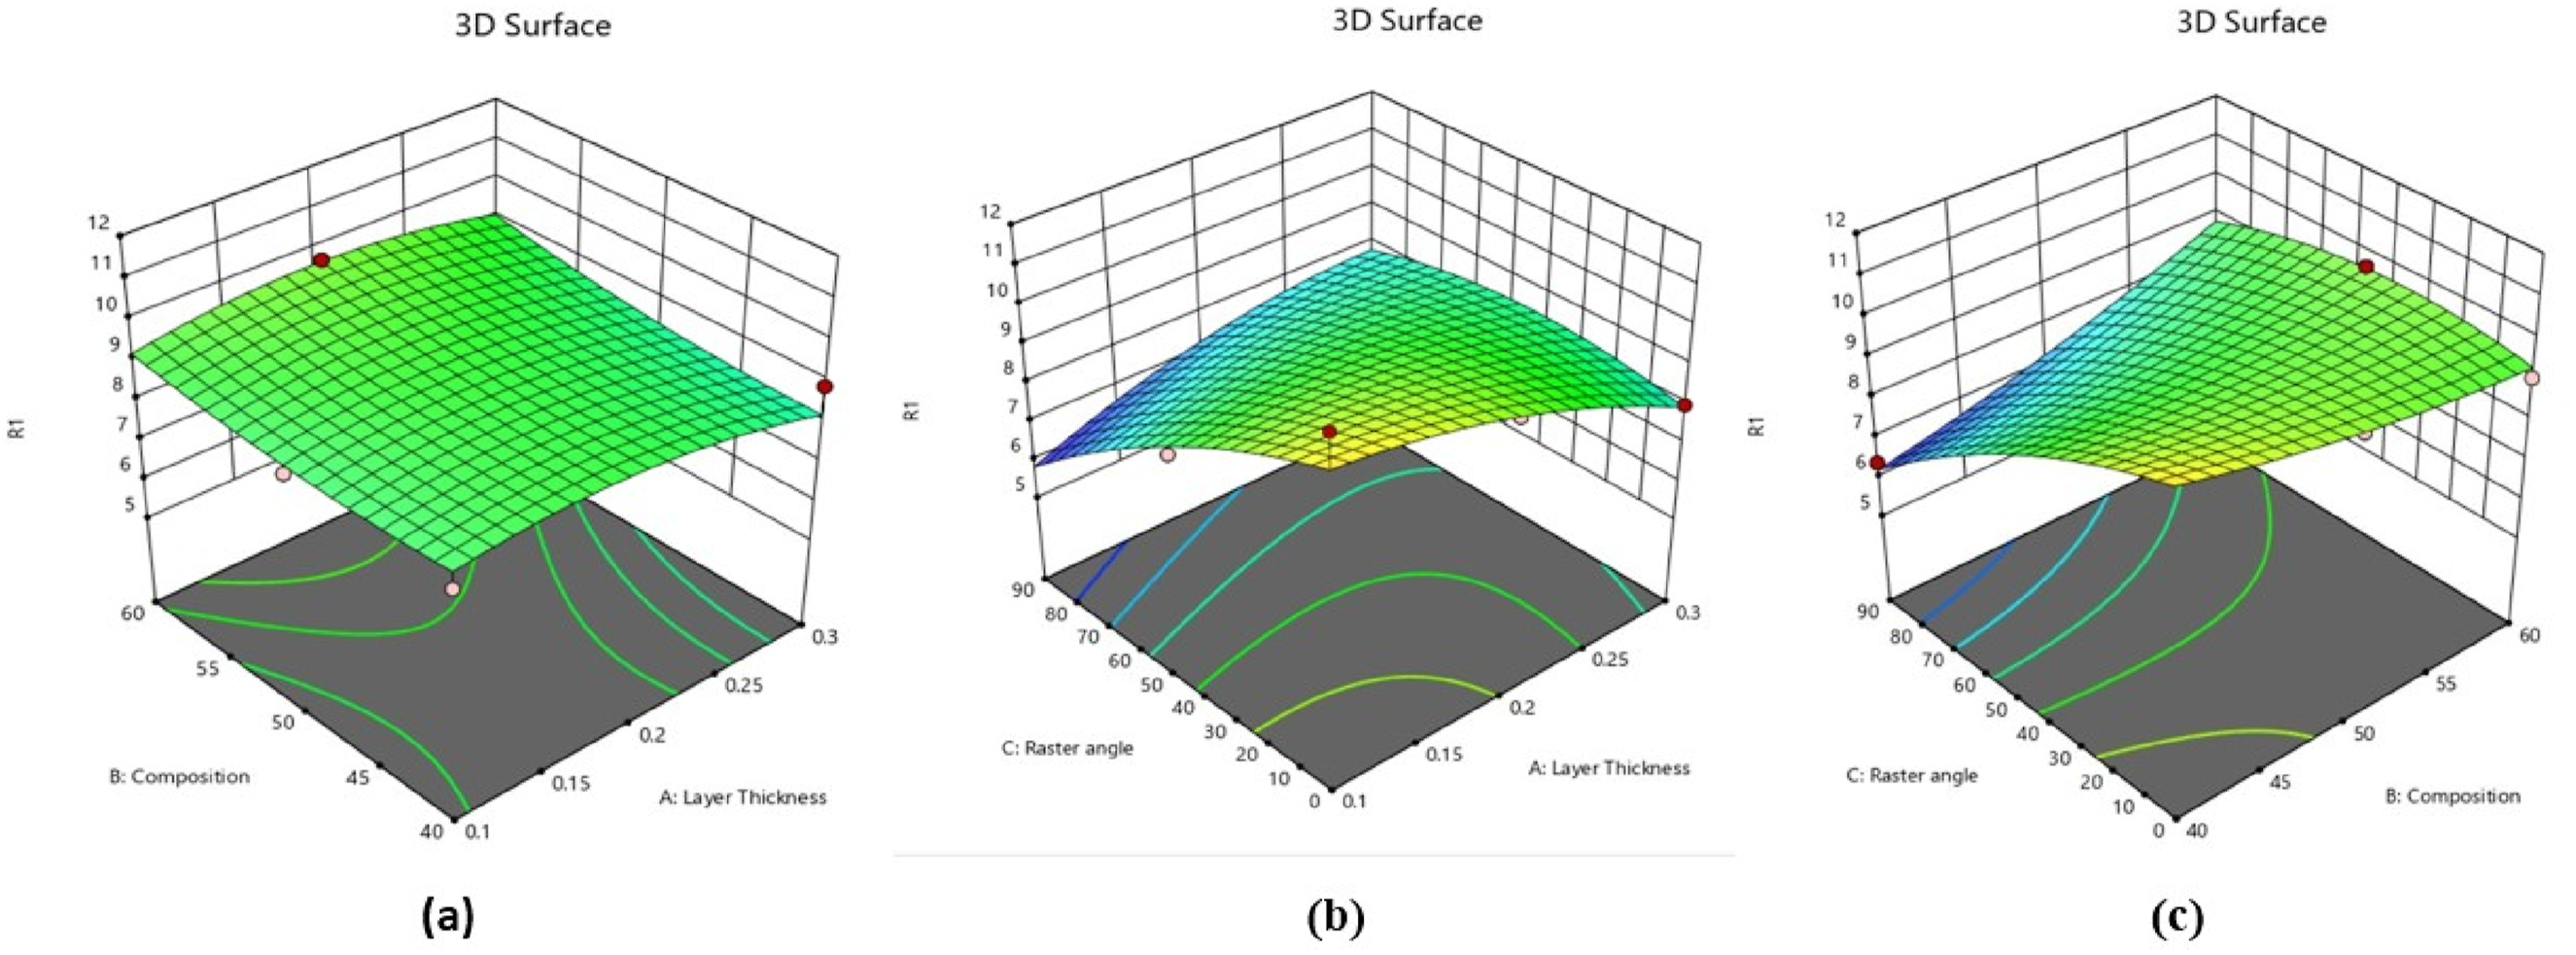
NN modelling
Levenberg-Marquardt algorithm in FNN model using 10 neurons in the hidden layer was implemented with MATLAB. Figure 11(a) showed the architecture and training setup of the FNN trained using the Levenberg–Marquardt optimization algorithm with MSE as the performance metric. Figure 11(b) showed the convergence behaviour of the training, validation, and test MSE over 845 epochs, where the training error decreased monotonically while the validation error stabilizes, reaching a minimum value of 5.7274 × 10⁻⁶ at epoch 845. Early stopping ensured by close monitoring of validation performance indicated stable learning with acceptable generalization capability. (a) Neural network architecture (b) neural network best validation performance plot.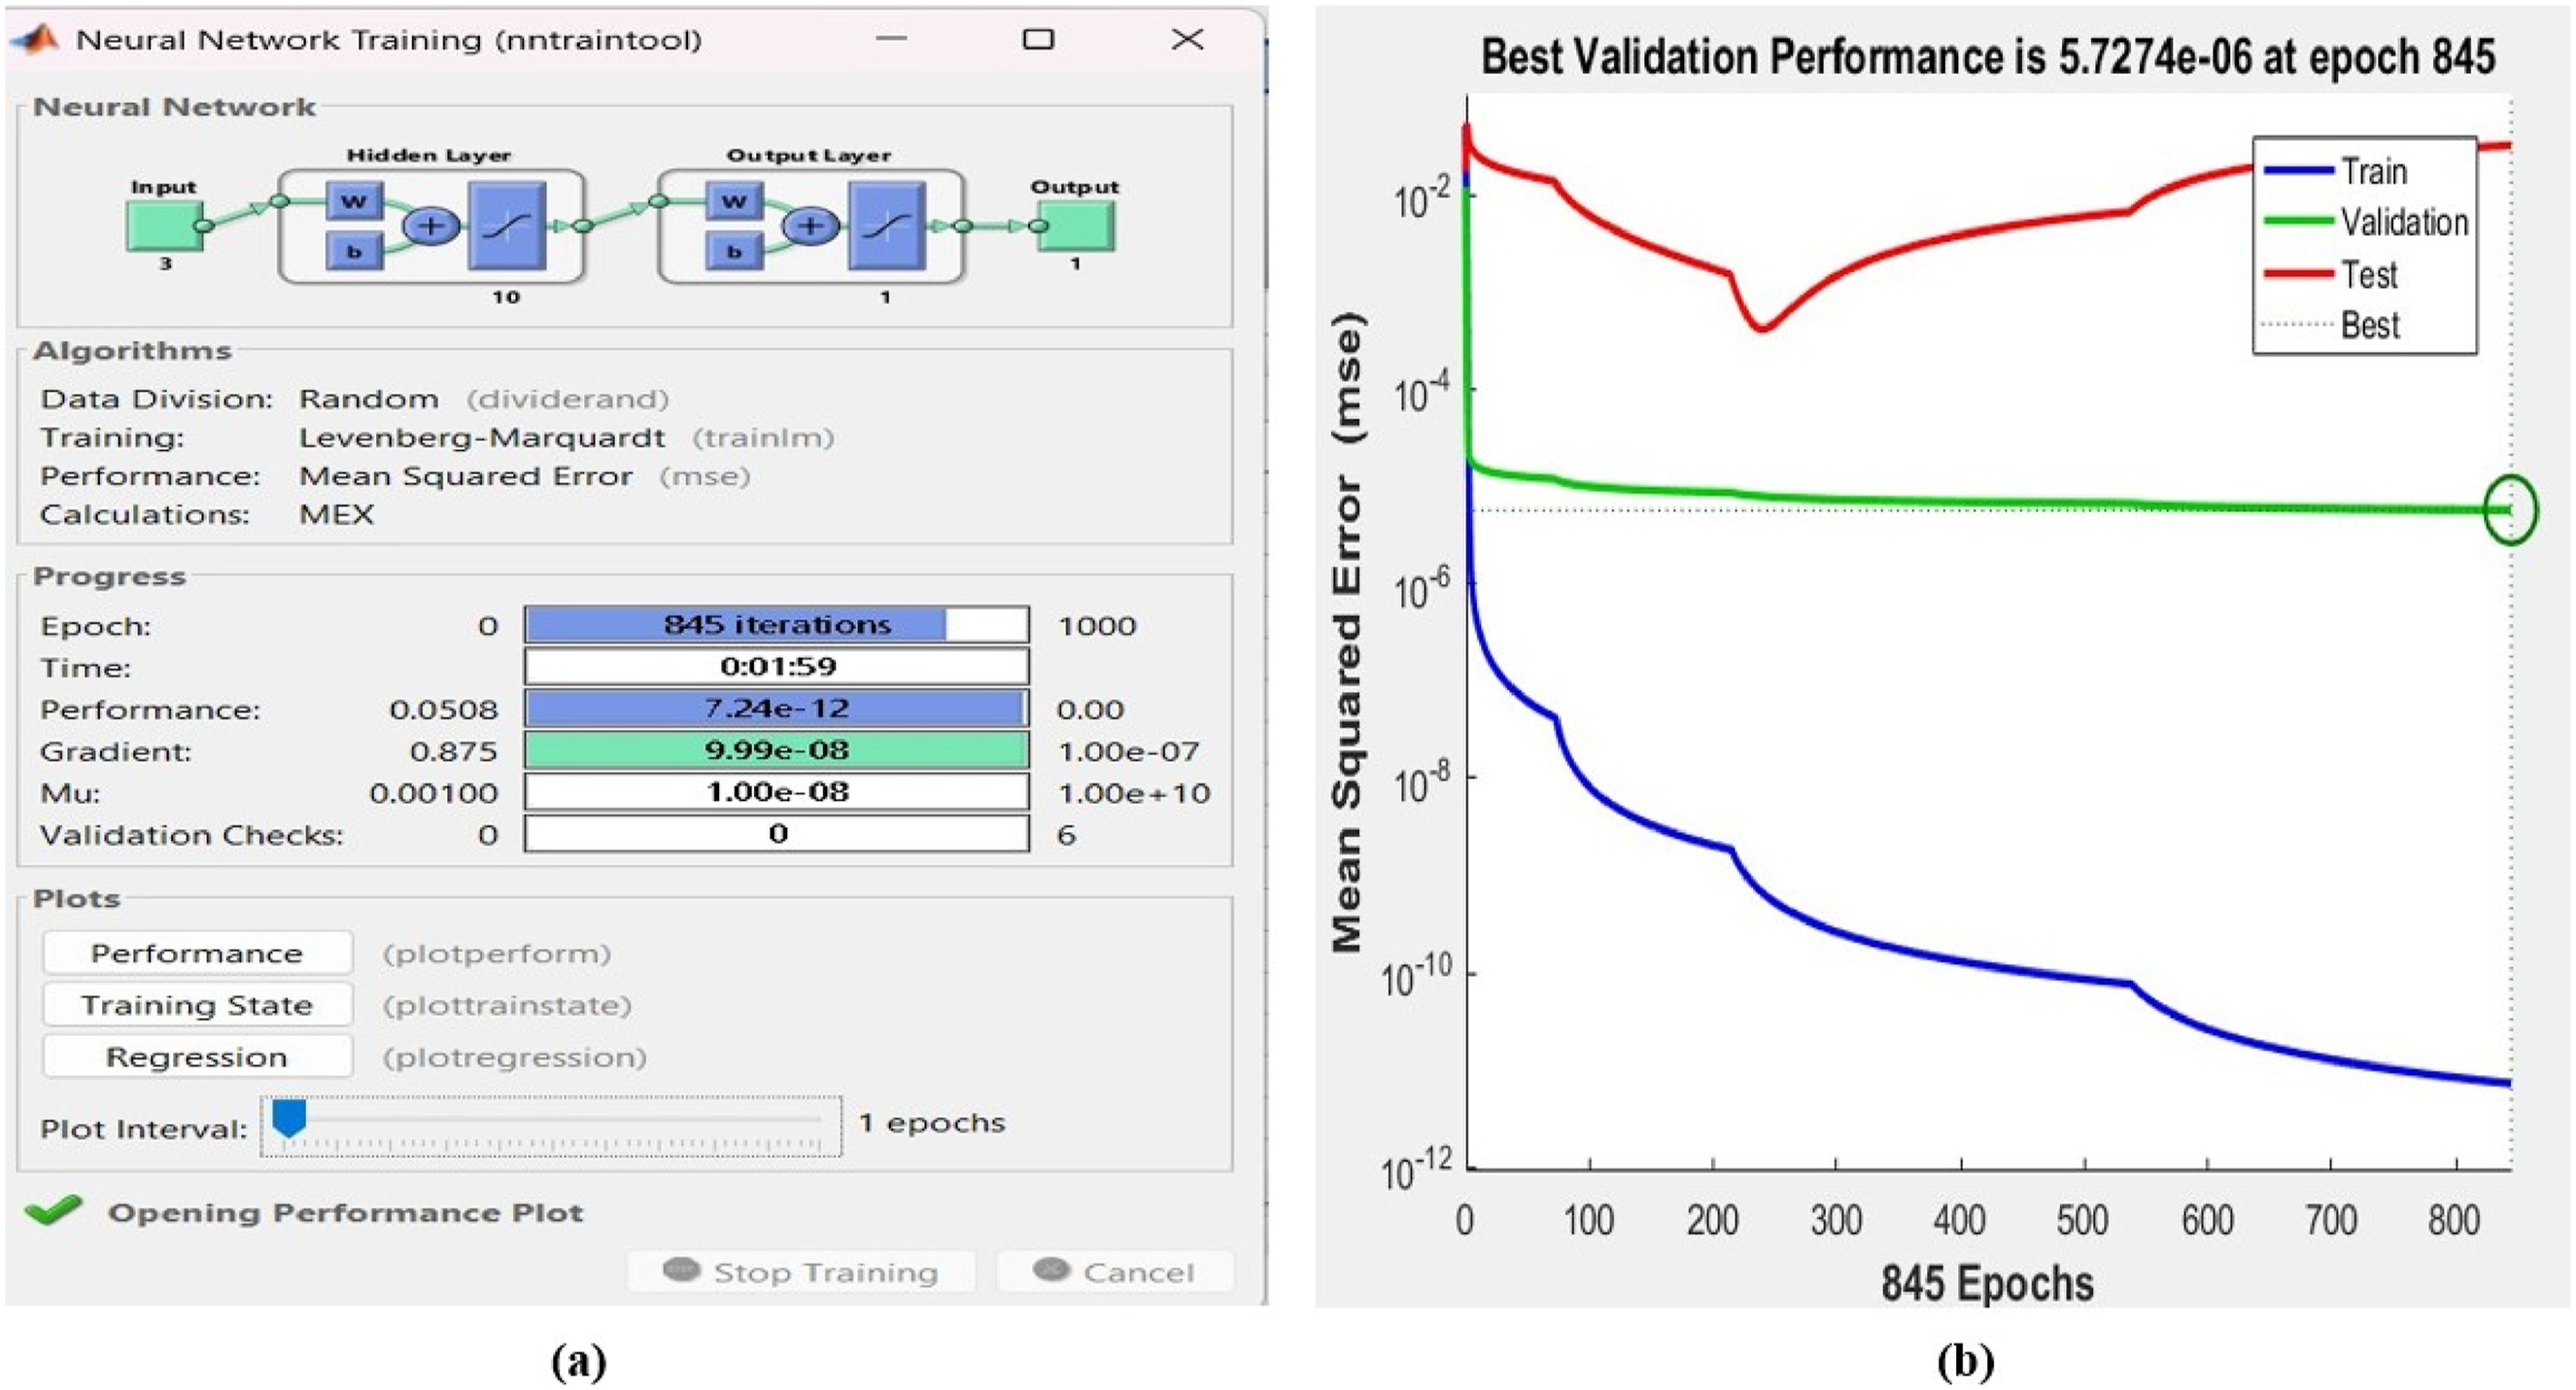
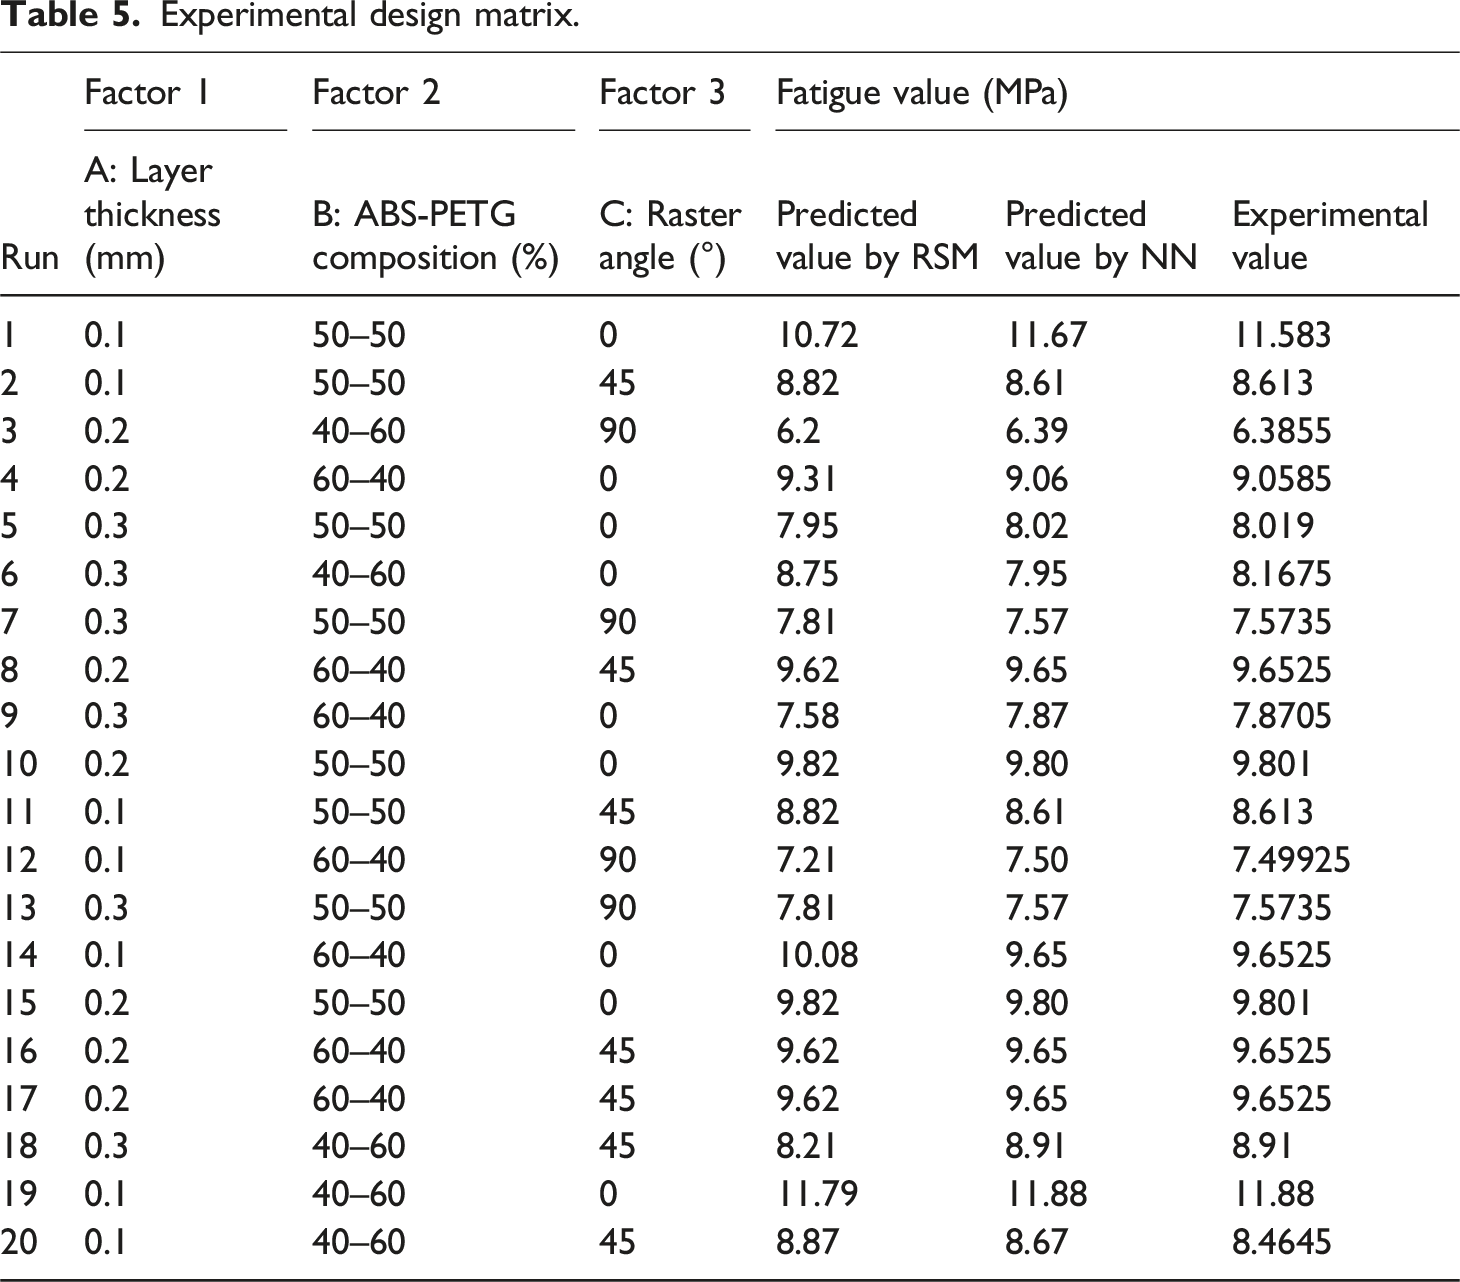
The model demonstrated excellent convergence, as the R2 approaching unity and MSE of 7.27 × 10⁻¹² illustrated in Figure 12. The NN model showed better predictive accuracy than RSM as shown in Table 5. The risk of overfitting was mitigated by restricting the model inputs to statistically significant parameters and by validating the network using independent data subsets. Regression performance plots of NN. Experimental design matrix.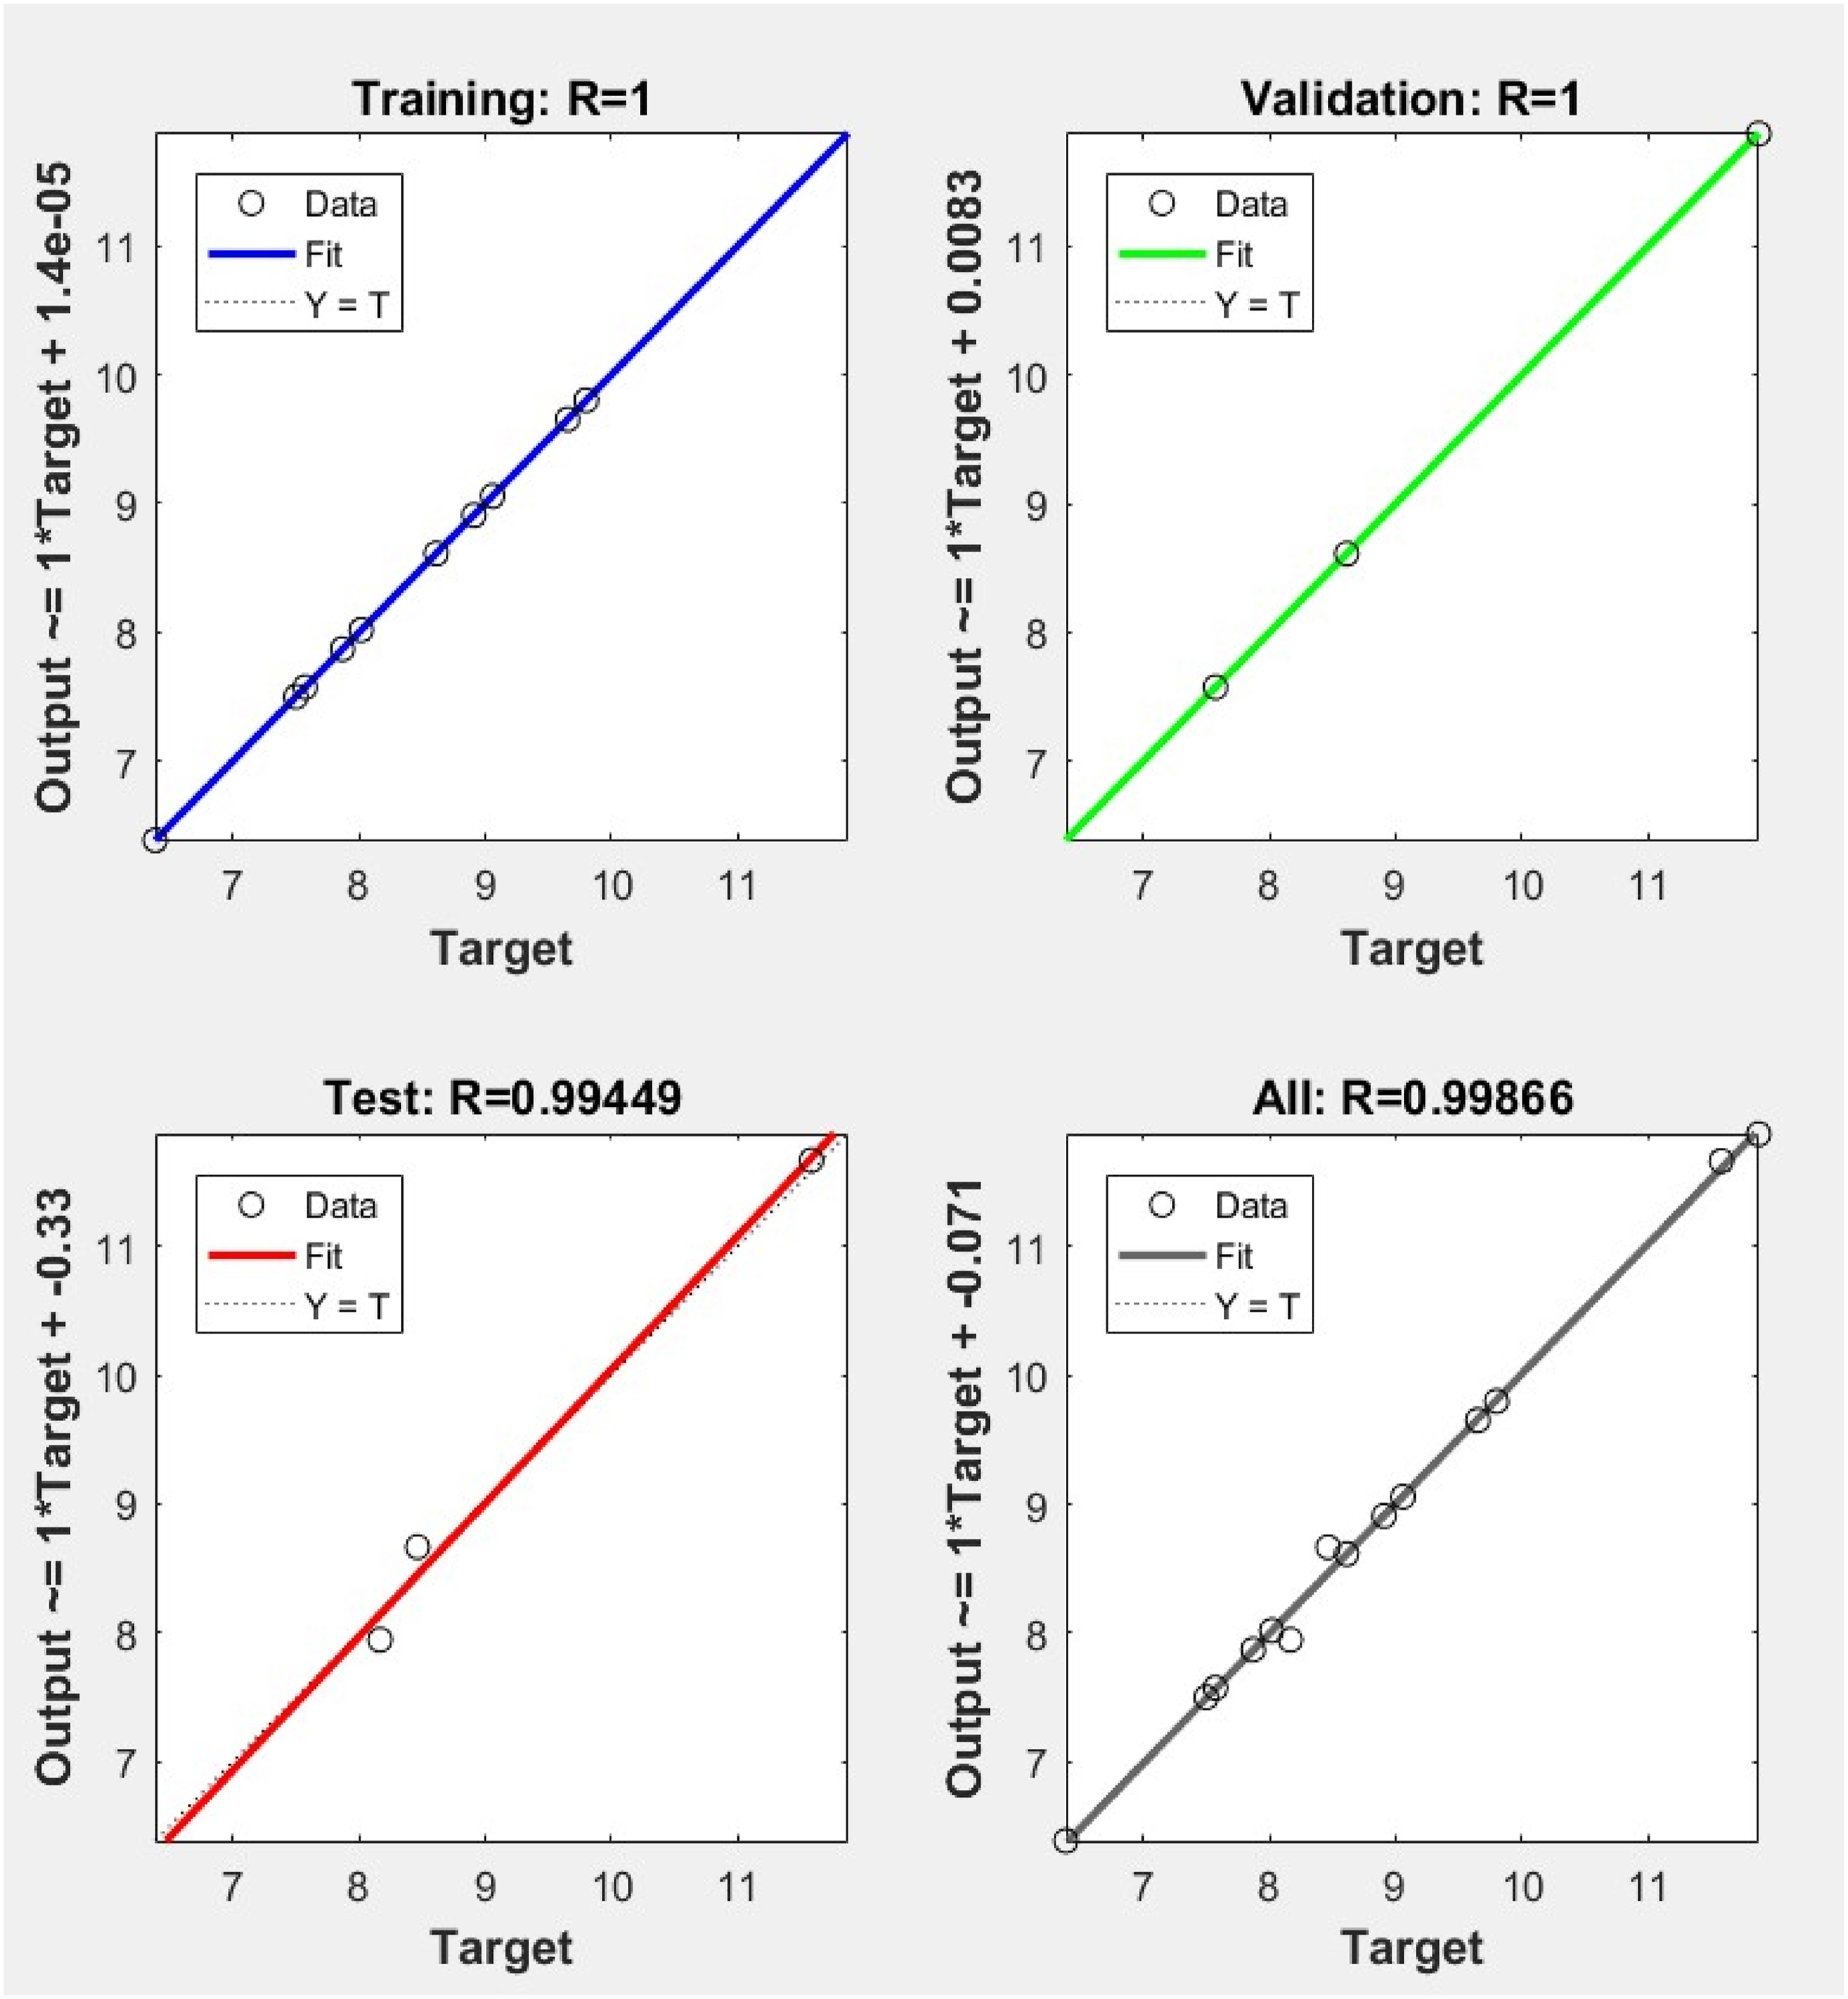
NN-GA
The R2 of the NN model was 0.99,732, which was higher than RSM that displayed R2 of 0.9305. The best performing NN model served as a fitness evaluator, predicting fatigue strength on which GA has been implemented for optimization. The optimized parameters identified by integrating the resulting model with GA framework were 0.15 mm Layer thickness, 45-55% composition of ABS-PETG and 0.025° Raster angle. The optimized raster angle of 0.025° was effectively equivalent to 0° and represented a numerical artifact, the NN-GA searched for the point (numerically smallest gradient) where the predicted fatigue response was maximized
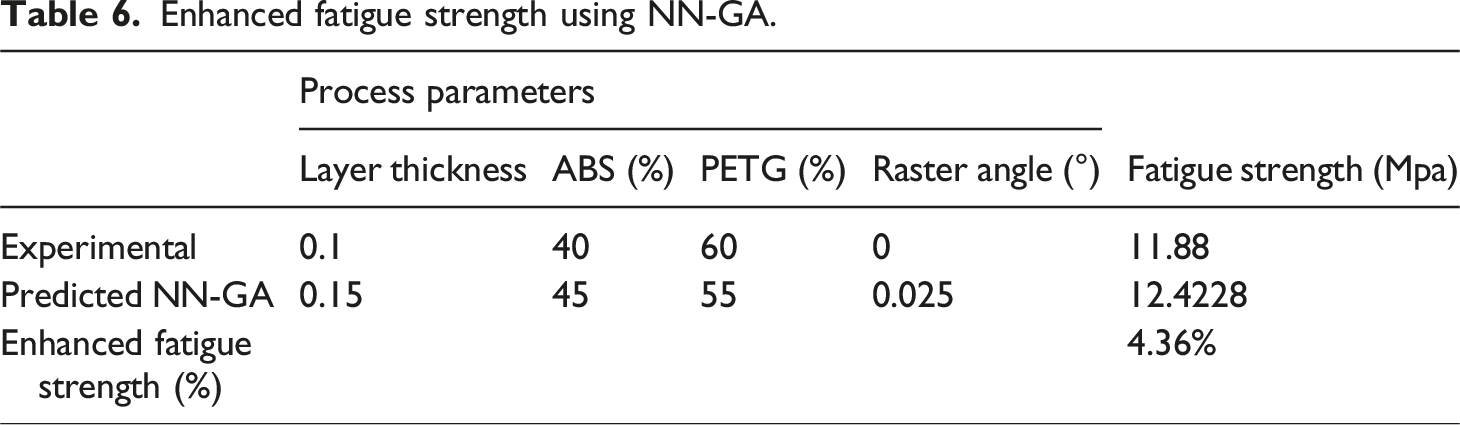
A graph plotted fitness values, presented in Figure 13, against generations showed both the predicted fatigue strength of 12.4228 MPa and mean fitness values of 12.4224 MPa. The NN-GA enhanced the fatigue strength from experimental value of 11.88 MPa to predicted value of 12.4228 MPa by 4.36% displayed in Table 6. GA evolution of best and mean fitness values. Enhanced fatigue strength using NN-GA.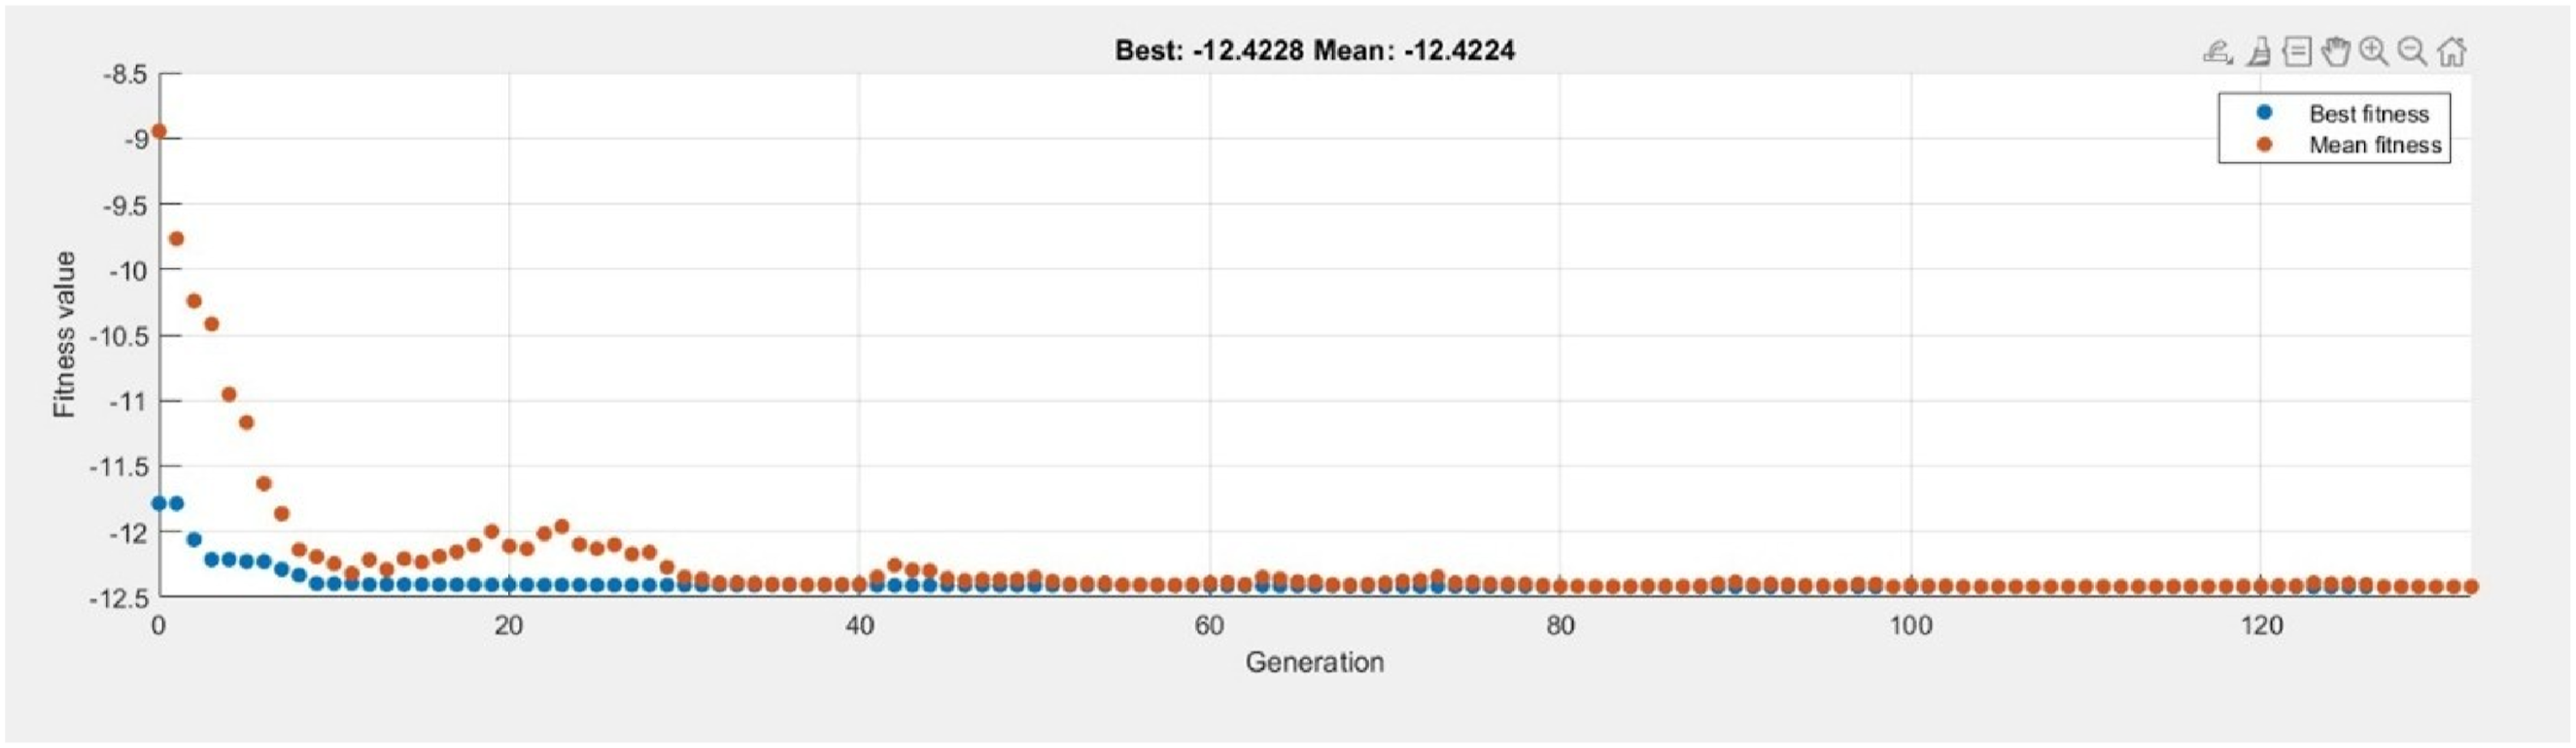
Validation of NN-GA
The specimen has been fabricated with a layer thickness of 0.15 mm, an ABS–PETG composition of 45:55, and a raster angle of 0.025° which is effectively equivalent to true optimum 0° represents a numerical artifact of continuous NN–GA optimization rather than a physically distinct printing condition. Overfitting was mitigated through parameter significance screening and independent validation, ensuring the robustness of the optimized solution. The fatigue strength of the fabricated specimen has been investigated and resulted as 12.2175 MPa as shown in Figure 14(a). Experimental validation of NN-GA gave 12.2175 MPa with an error of 1.6% from the predicted value i.e.12.4228 MPa. These results confirmed the NN-GA model’s capability to improve fatigue strength and provides a reliable predictive framework compared in Figure 14(b). (a) Mean and amplitude stress at NN-GA parameters and (b) validation of NN-GA.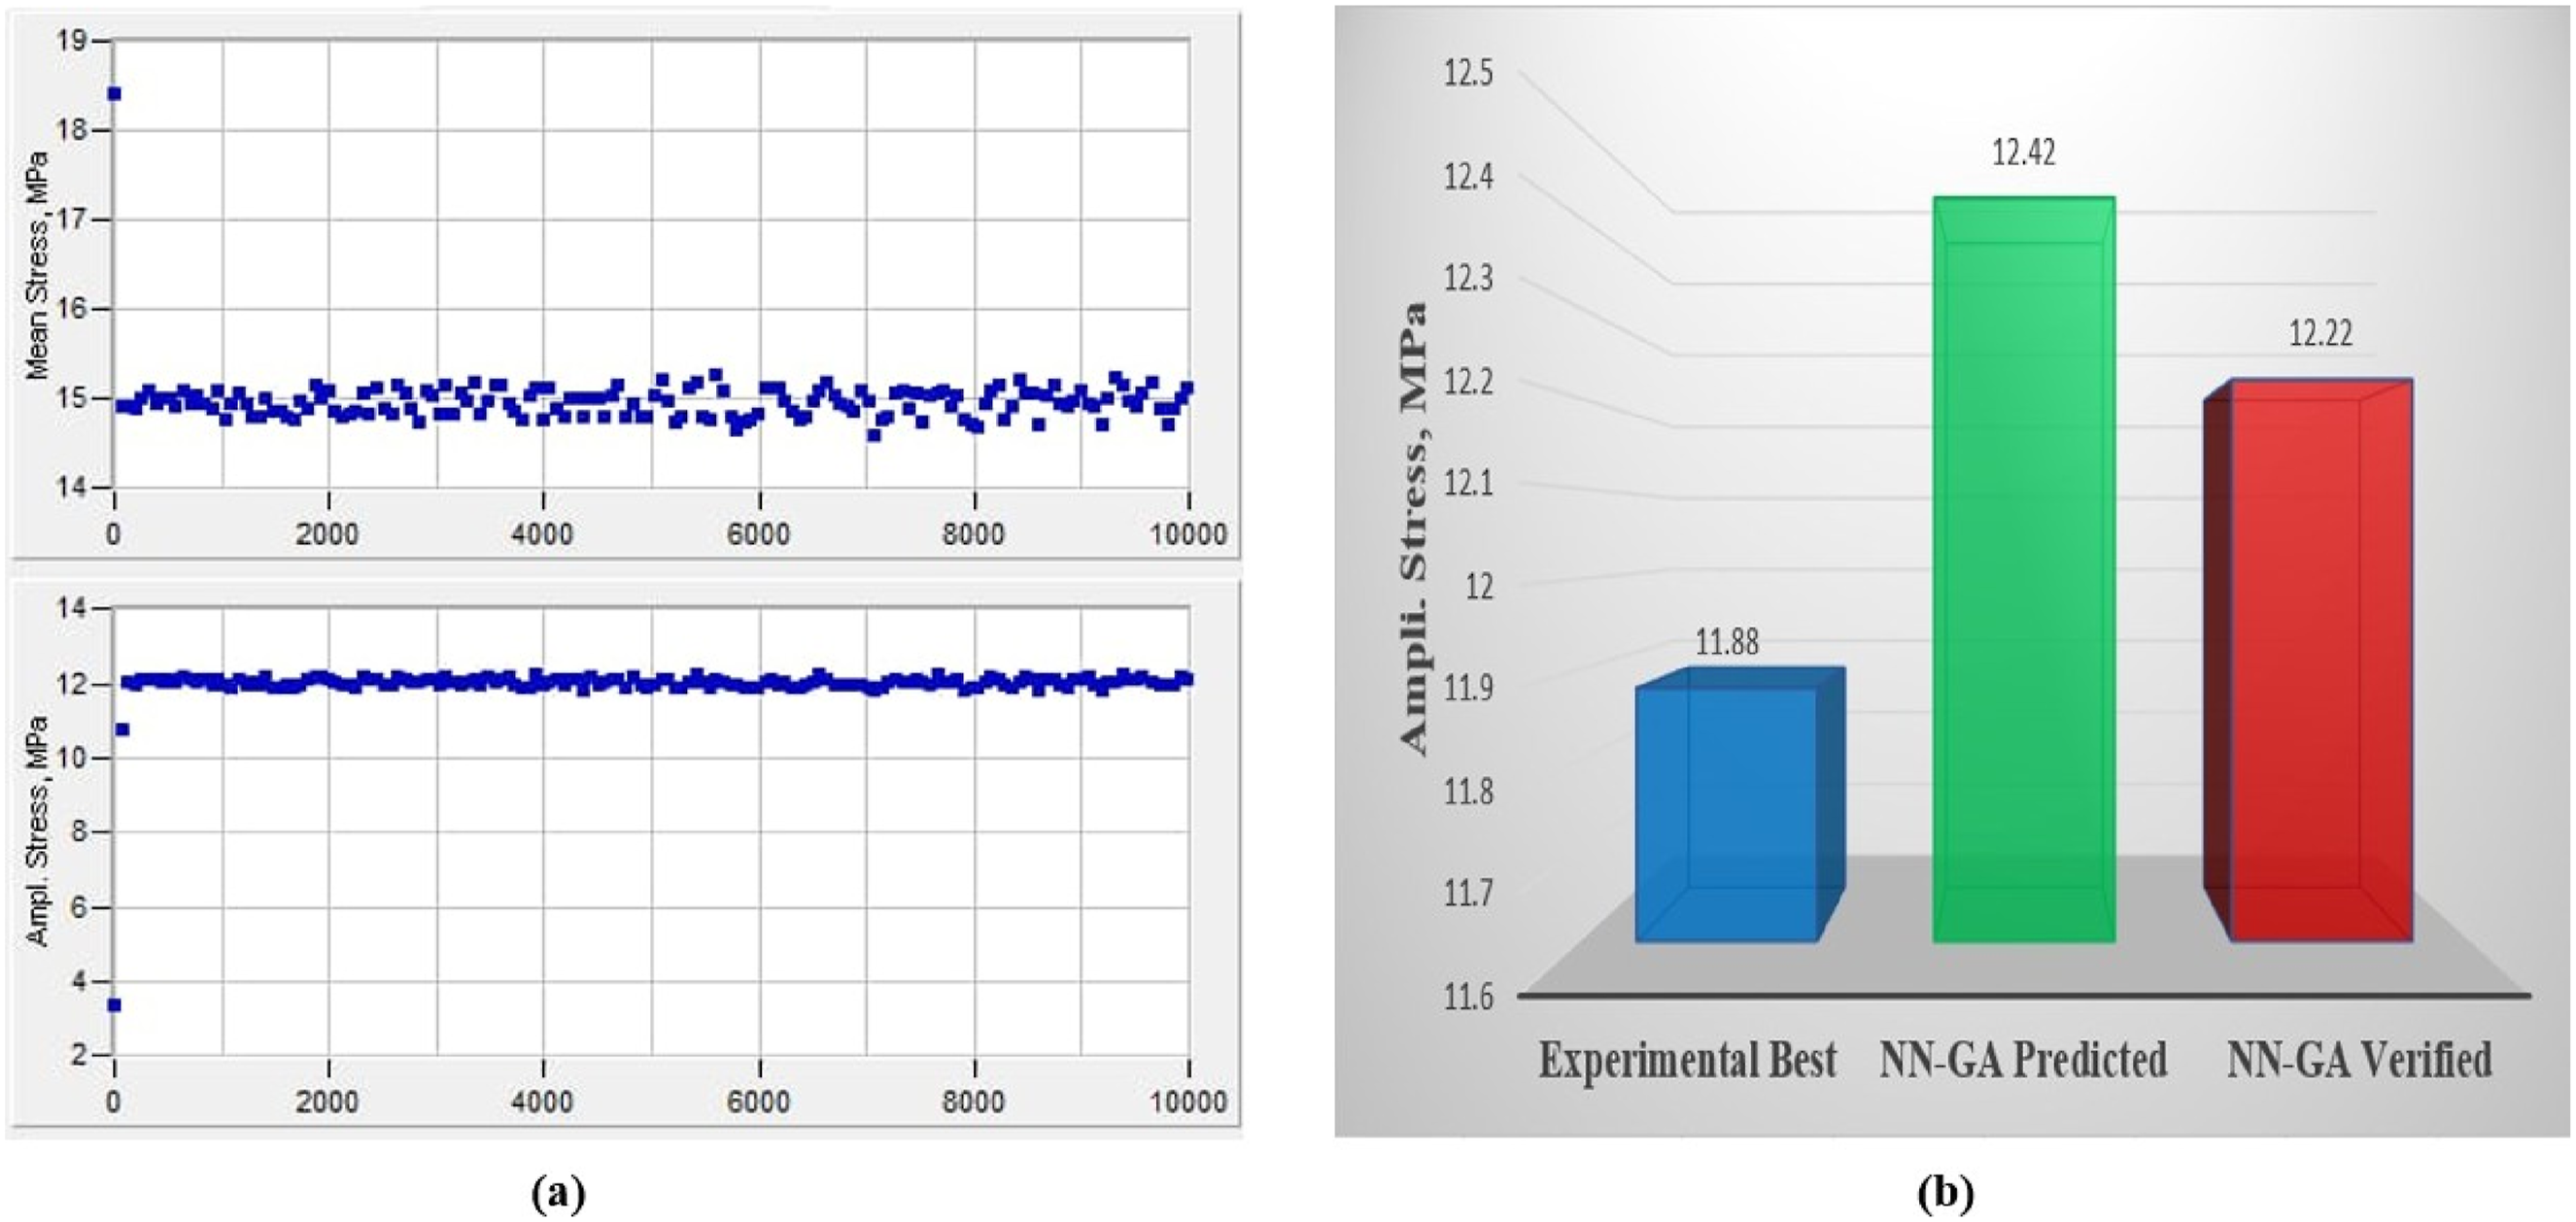
Conclusions
The bilayer specimens of different composition of ABS-PETG have been efficiently fabricated using FFF printer. UATTFT has been successfully performed on FFF fabricated specimen as per ASTM D7719-22. A total number of 240 samples have been fabricated and their fatigue strength have been evaluated using BISS nano servo hydraulic testing machine. The maximum fatigue strength of 11.88 MPa has been retrieved at 0.1 mm layer thickness, percentage composition of ABS-PETG (40-60) and 0° raster angle as per experimental design. Further, RSM and NN-GA have been proficiently designed for the proposed work. The effects of significant process parameters on fatigue strength have been displayed using 3D surface plots. The NN-GA further predicted and enhanced the fatigue strength to 12.4228 MPa on 0.15 mm layer thickness, 45-55% composition of ABS-PETG, and 0.025° raster angle which is 4.36% increase from experimental design.
The FEA & NN-GA results were validated experimentally where both results hold good agreement. The proposed approach can be used in engineering, packaging and consumer products where integration of mechanical strength of ABS and mechanical durability of PETG is important.
Footnotes
Acknowledgements
The authors sincerely acknowledge Maharshi Dayanand University (MDU), Rohtak India, for providing access to the infrastructure and laboratory resources essential for conducting material testing.
Declaration of conflicting interests
The authors declared no potential conflicts of interest with respect to the research, authorship, and/or publication of this article.
Funding
The authors received no financial support for the research, authorship, and/or publication of this article.
Data Availability Statement
Data will be made available on request.