
Abstract
This work reports the fabrication and comprehensive characterization of polyvinyl alcohol–chitosan/graphene oxide (PVA–CS/GO) nanocomposite films with different graphene oxide (GO) nanoparticle concentrations (0–6 wt%). The nanocomposites were prepared using a simple solution casting technique and systematically investigated to understand the influence of GO incorporation on the structural, optical, dielectric, and sensing properties of the polymer matrix. FTIR analysis confirmed strong interfacial interactions between PVA–CS chains and GO nanoparticles through hydrogen bonding, while optical microscopy revealed a homogeneous dispersion of GO within the polymer network. The optical analysis demonstrated a significant enhancement in light–matter interaction after GO incorporation. The optical band gap decreased from 5.49 to 4.60 eV for allowed indirect transitions and from 5.12 to 4.19 eV for forbidden transitions with increasing GO content, indicating the formation of localized energy states within the polymer matrix. Additionally, key optical parameters such as the refractive index, dielectric constants (ε′ and ε″), and optical conductivity increased with GO loading, whereas transmittance decreased due to enhanced photon absorption. Nonlinear optical parameters including linear susceptibility χ (1), third-order susceptibility χ (3), and nonlinear refractive index (n2) exhibited noticeable improvement, suggesting enhanced optical polarizability of the nanocomposite films. Furthermore, dielectric analysis showed that the dielectric constant, dielectric loss, and AC electrical conductivity increase with nanoparticle concentration due to enhanced charge carrier mobility and interfacial polarization. The Urbach energy also increased, confirming the creation of additional defect states in the electronic structure. Pressure sensing measurements revealed improved mechanical flexibility, environmental stability, and high-pressure sensitivity compared with conventional polymer sensors. These results demonstrate that the incorporation of graphene oxide significantly tailors the optical and electrical properties of PVA–CS matrices, highlighting the novelty of this nanocomposite system as a promising material for flexible pressure sensors, optoelectronic devices, and nonlinear optical nanodevices.
Introduction
Nanotechnology is a rapidly emerging interdisciplinary technology that has exploded in popularity in a number of fields in over the last ten years in the fields the materials sciences, mechanics, electronics, optics, medicine, oil and airspace. Its social effect has been acknowledged as a major catalyst. The prefix “nano” was derived from the Greek word which means “dwarf”. The word “nano” means very small. One nanometer (nm) is one billionth of a meter, and it is equivalent to ten angstroms. As such, a nanometer is 10-9 m, and it is 10,000 times smaller than the diameter of a human hair. A human hair diameter is about 50 microns in size.1,2
Nanotechnology will enable the development of novel materials providing the basis for the design and development of new properties and structures, which will result in increased performance, reduced cost of maintenance, and enhanced functionality. 3 Materials known as polymers are molecules with a long chain with a structural unit repeat. The structural units are called monomers, which are bound by covalent bonds to each other.4,5
A polymer is made up of large organic molecules (macromolecules) with small structural repeating units. In a method called polymerization, monomers are joined together. Thousands of atoms joined by covalent chemical bonds are comprised of each molecule. 6 In a polymer, molecules attract each other by forces that depend on the polymer’s form. Polymers consist of crystalline and non-crystalline regions within the solid state.7,8 The researchers found, however that they did not appreciate many of the interactions between the chemical structures and the corresponding physical properties. The Polymer blends may also be used as high-performance fabrics because the reinforcement properties differ significantly from the matrix properties.9,10 Metal oxides are used in a number of fields, including technology, environmental remediation, photocatalysis, solar energy transfer, and electronics. 11
Graphene Oxide (GO) is a carbon-based nanomaterial obtained by the chemical oxidation of natural graphite or carbon nanofibers by strong oxidants. This material was known much before pristine grapheme. 12 and it is considered as one of the most important materials precursors of graphene.13,14 Due to the presence of oxygen functional groups, GO must be reduced by thermal or chemical procedures.15,16
However, these procedures do not completely restore the structure of graphene and some O-groups remain attached at the basal plane modifying the properties of graphene oxide.17,18 This new material, referred as reduced graphene oxide, rGO, can be used as component of conductive electrodes, light emitting diodes,19,20,21 and photovoltaic cells. 22 In applications such as biosensing,23,24,25 design of inks,7,26,27 drug delivery vectors,28,29 or bioimaging,30,31 graphene oxide presents several advantages because the oxygen groups can bind polymers, nanoparticles or other molecules to tune the properties of new materials according to the needs of the different applications. Furthermore, the O-groups provide aqueous dispersibility to graphene oxide, which is an important property in biomedical applications.32,33,34 Graphene oxide/Chitosan composite nanofibers (CNs) are attractive to researchers because of noticeable features related with CS and Go nanofibers individually. The combination of these nanofibers may be appropriately designed to yield unique processes in the fields of energy, sensor, engineering, and chemical sciences.35,36,37
CS is derived from chitin, and has recently attracted increasing interest both in research and developmental aspects. Because of its excellent properties, CS has several applications including filtration, removal of heavy metal ions, pressure sensors and biomedical engineering, food preservation, environmental applications, and adsorption processes.38,39
The main objective of the present study is to prepare and characterize a novel nanocomposite material based on graphene oxide nanoparticles and chitosan polymer. This nanocomposite is designed to combine the distinctive mechanical, electrical, and chemical properties of both GO and CS, enabling the development of advanced multifunctional materials. The study aims to investigate the structural, morphological, and functional features of the GO/CS nanocomposite and to evaluate its potential performance in various applications, including pressure sensors, energy storage, environmental remediation, and other emerging technological fields. Such a material is expected to offer enhanced efficiency, improved mechanical stability, and superior functional responsiveness, making it a promising candidate for next-generation nanotechnology-based devices.
Materials and methods
Medium molecular weight (MMW) chitosan with an MW of 190,000–310,000, degree of deacetylation of 75–85%, acetic acid (assay
Fabrication of (PVA-CS/GO) nanocomposite film
To prepare the PVA-CS/GO nanocomposite, a specific weight amount (90 wt%) of PVA was dissolved in 30 mL of distilled water using a mixer at 80°C until the solution was completely dissolved. Cs powder (10 wt%) was then dissolved in distilled water containing 1 v/v% acetic acid at 80°C to obtain a homogeneous solution. Graphene oxide nanoparticles were then added to the CS-PVA powder in varying weight ratios (2, 4, 6) wt.%. All samples were ultrasonically processed, the mixture was subjected to ultrasonication for 30 min at room temperature to ensure homogeneous dispersion of the GO nanoparticles within the PVA–CS polymer matrix and to prevent nanoparticle agglomeration before casting and the resulting solution was poured into a Peter dish and allowed to dry at room temperature for two days. The mixture was then quietly removed from the template (as shown in Figure 1), and the requisite tests were conducted using a micrometer to measure thickness. The structural properties, optical properties, electrical properties, and surface morphology were investigated using the following instruments: The optical microscope (OM), Fourier transform infrared spectrometer (FTIR), (UV-spectrophotometer), and LCR meter (HIOKI-3532-50, LCR High Tester). The solution casting procedure is both cost-effective and user-friendly. For the preparation of (PVA-CS/GO) nanocomposite, the casting procedure was utilized to fabricate the (PVA-CS/GO) nanocomposite film material. The process is illustrated in Figure 1, depicting the blending of Graphene oxide particles with the chitosan polymer and the in-situ development of Graphene oxide nanoparticles inside the PVA-CS polymer blend. Schematic diagram of the process of preparation (PVA-CS/GO) NCs.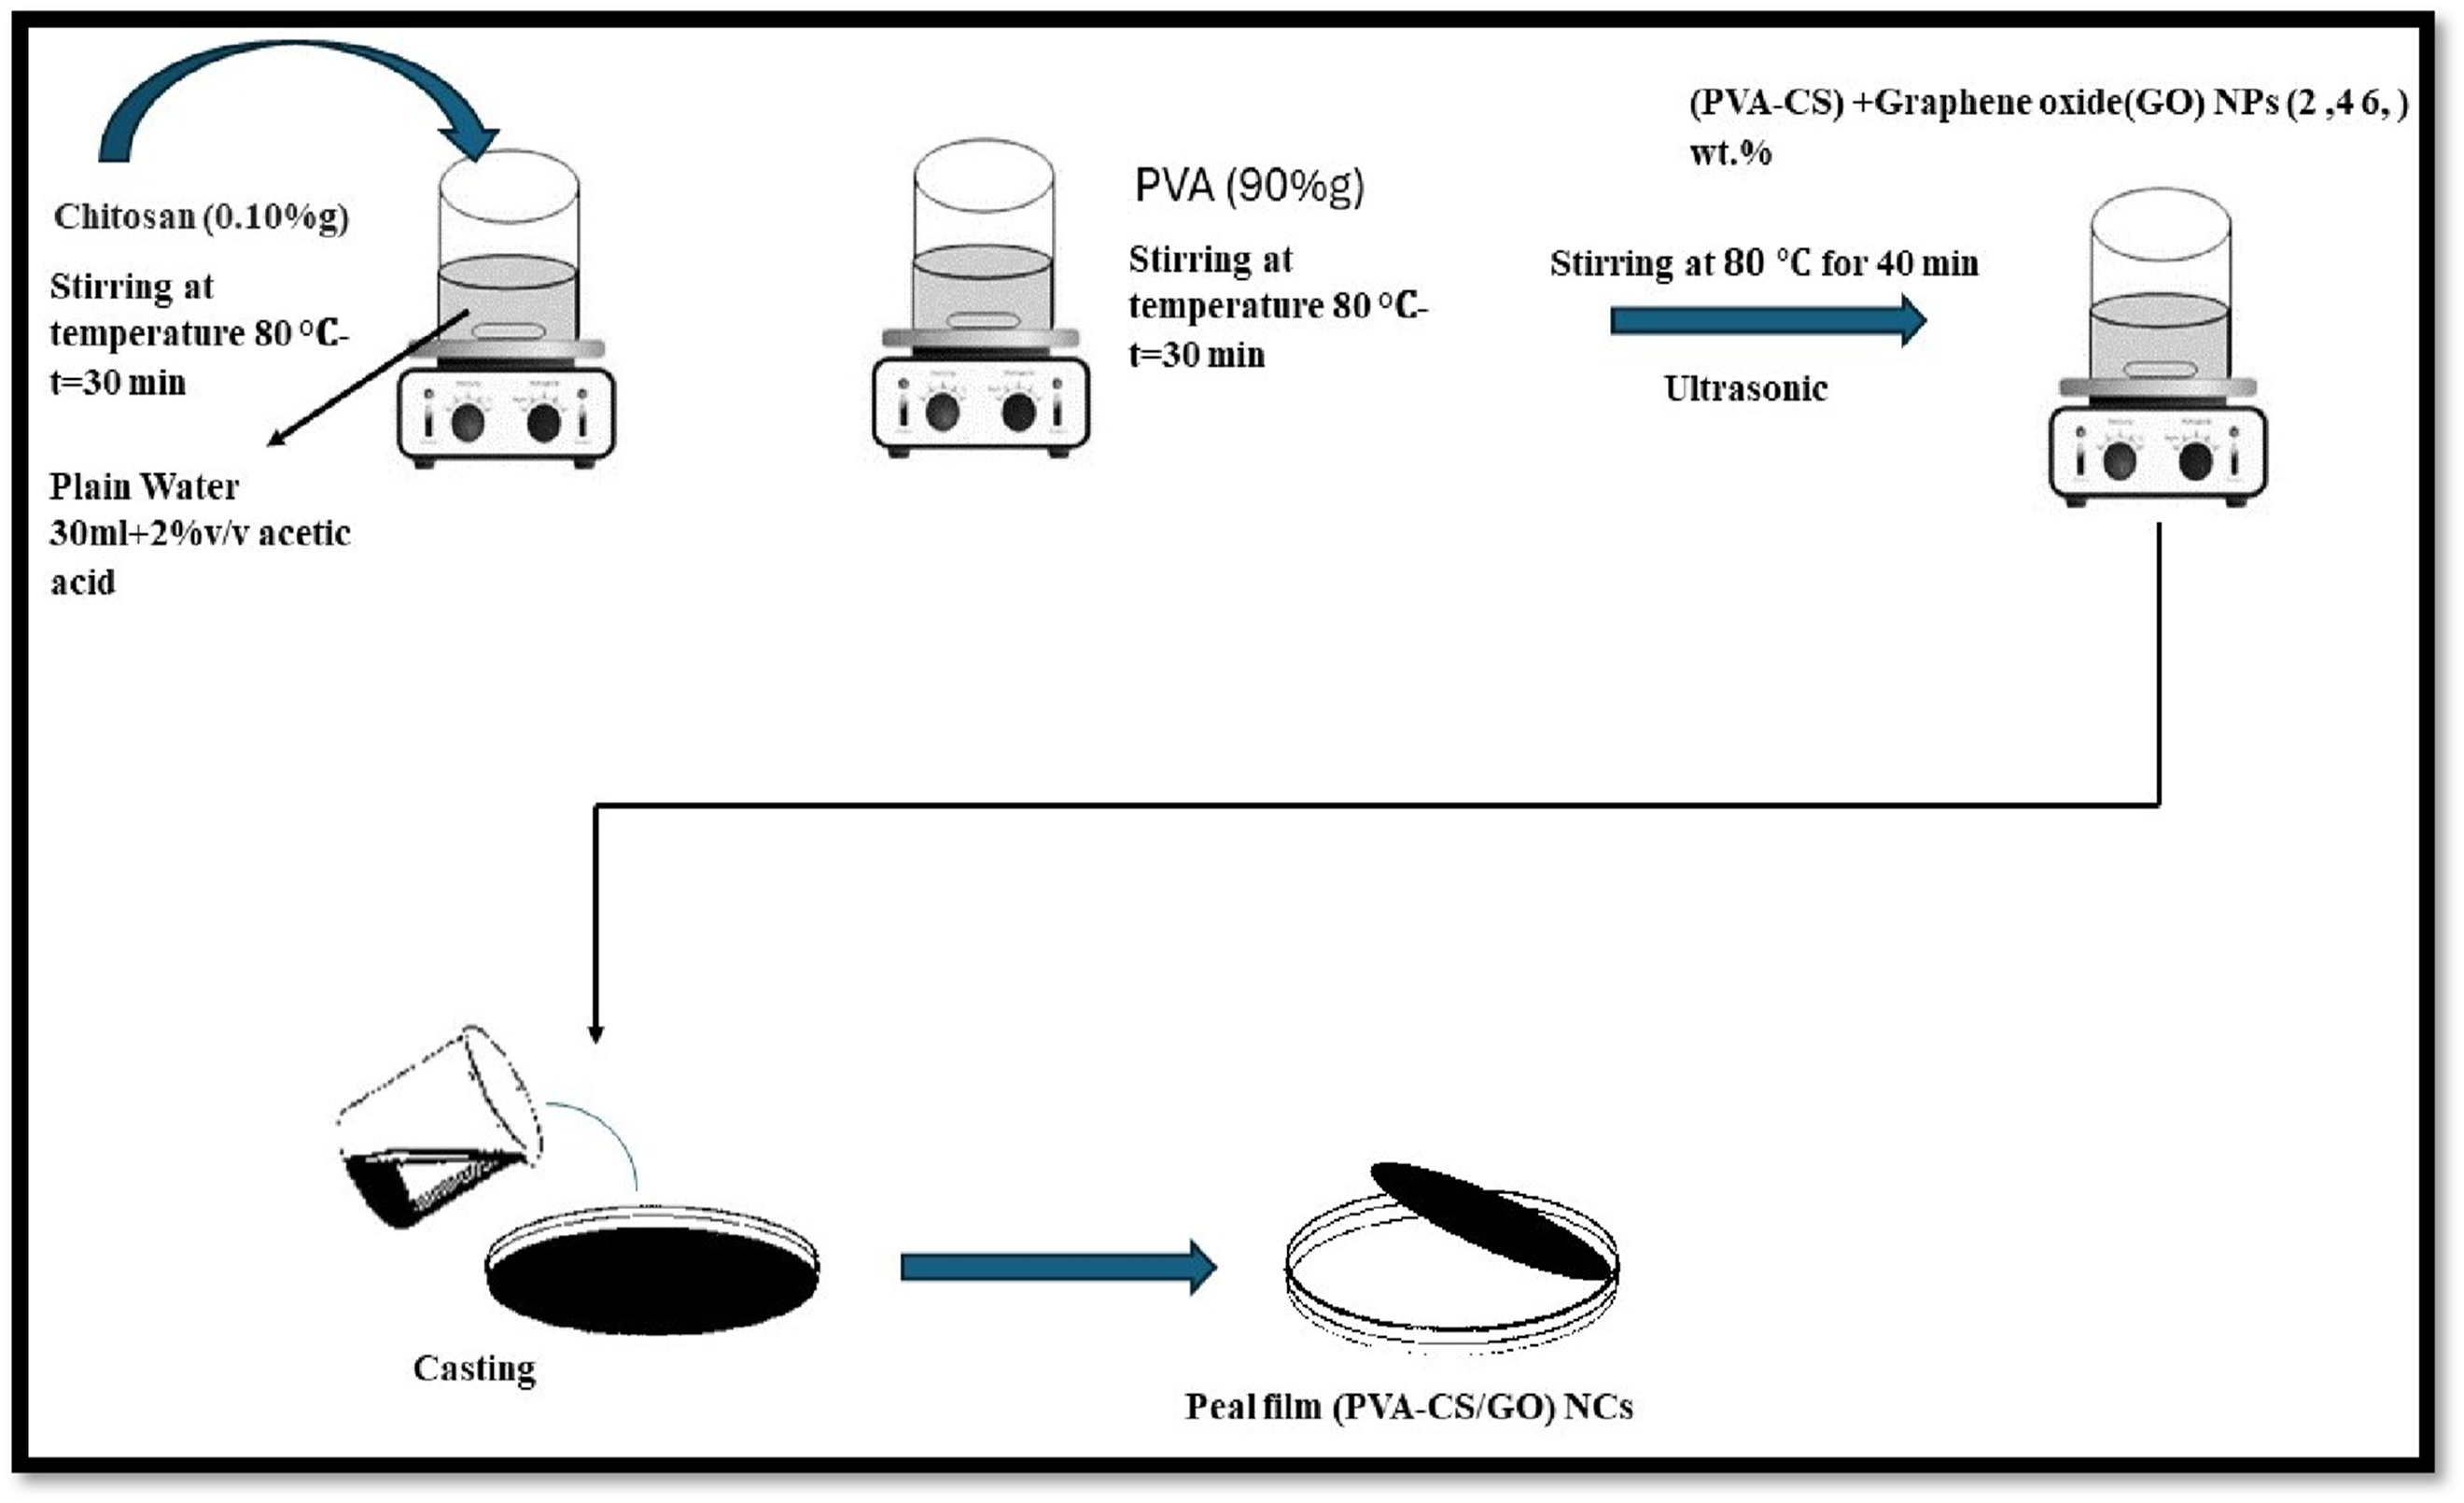
The determination of absorbance (A) and transmittance is achieved by employing a relationship.
40
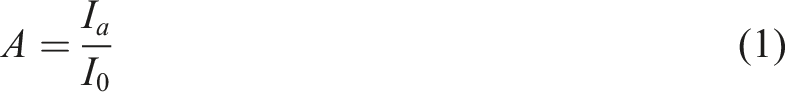
Ia Refers to the amount of light a material can absorb, while
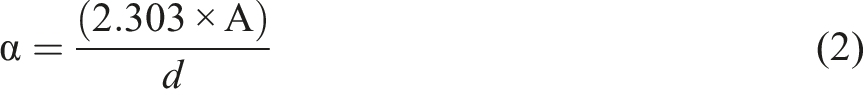

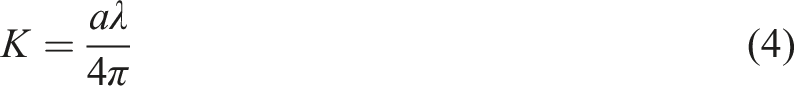
The wavelength is denoted as (λ), and the absorption coefficient is represented as (α). Calculated the refractive index (n) via the equation.
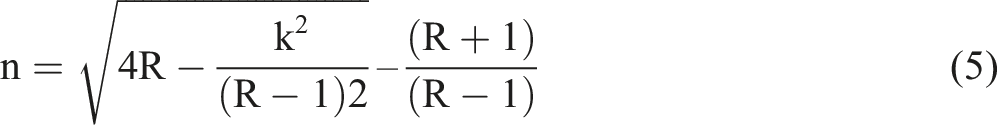
While the reflection is denoted as (R), the reflectivity values utilized in the refractive index equation No. 5 were derived using the following connection.

The dielectric constant comprises the imaginary and real portions (ԑ1 and ԑ1). We may be determined by the following equation.
42


The optical conductivity (σ) can be determined using the following formula.
43

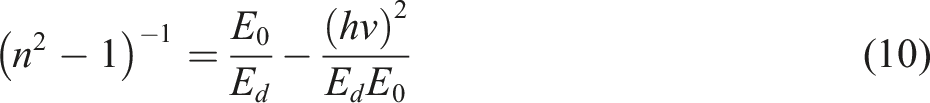
The single effective oscillator model of Wimble and Di-Domenico is a practical approach to explaining the differences between refractive index and photon energy, while maintaining accuracy in the physical proportions of this relationship.
44
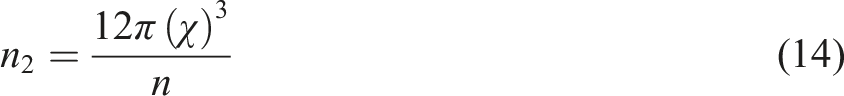
Miller’s rule is a mainly straightforward experimental relationship grounded in basic ideas that presents a technique for assessing the nonlinear refractive index (

The AC electrical conductivity (σa.c), the true dielectric constant (ε′), and the dielectric loss (ε″) are all determined by dedicated functions that describe their behavior with frequency.
47

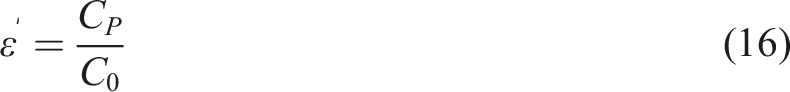
Electrical capacitance is symbolized by (CP), while the capacitance of a capacitor in vacuum is symbolized by (C0). The dielectric loss (ε”) can be found using the following formula.47,48 Here, displacement is denoted by (D)

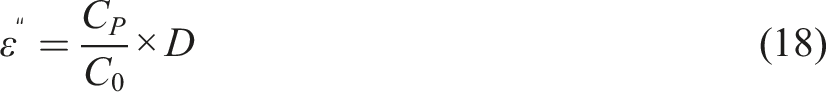
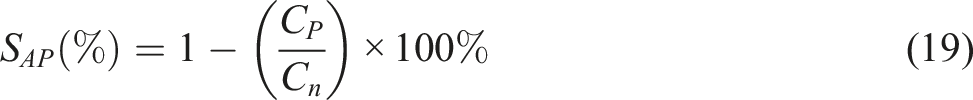
Where the angular frequency is denoted by (ω). Pressure sensor sensitivity may be described as follows.
32
Results and discussion
FTIR Analysis of (PVA-CS/GO) PNCs
The interactions between atoms or ions in (PVA-CS/GO) nanocomposites were analyzed using FTIR. These interactions may include modifications to the vibrational modes of nanocomposites. Figure 2 display the (FTIR) transmittance spectra of (PVA-CS/GO) nanocomposites films with varied ratios of graphene oxide (GO) nanoparticles recorded at room temperature in the range (600–4500 cm-1). Based on the graphical representation, it can be inferred that the broad spectral bands observed at 3287 cm−1 be attributed to the presence of hydroxyl (O.H.) groups. The vibrational frequency associated with the asymmetric stretching of the CH2 group is approximately 2918 cm−1. The observed peaks at a wavenumber of 1733 cm−1 have been ascribed to the stretching mode of the C = O bond. The peak observed at approximately 1242 cm−1 is attributed to the symmetric bending motion of the C-H group, which exhibits significant absorbance. The spectral peak at approximately 1086 cm−1 indicates the C–O bond. In comparison to the pure (CS) polymer, the FTIR spectrum reveals a shift in peak location, as well as a change in peak shape and intensity, this suggests that the vibrations of polymer with GO nanoparticles are decoupled.49,50 The peaks observed for pure GO, pure PVA-CS and for the prepared PVA-CS/GO nanocomposites are summarized in Table 1. FTIR spectra for (PVA-CS/GO) PNCs. Functional groups present in pure CS and PVA-CS/GO PNCs.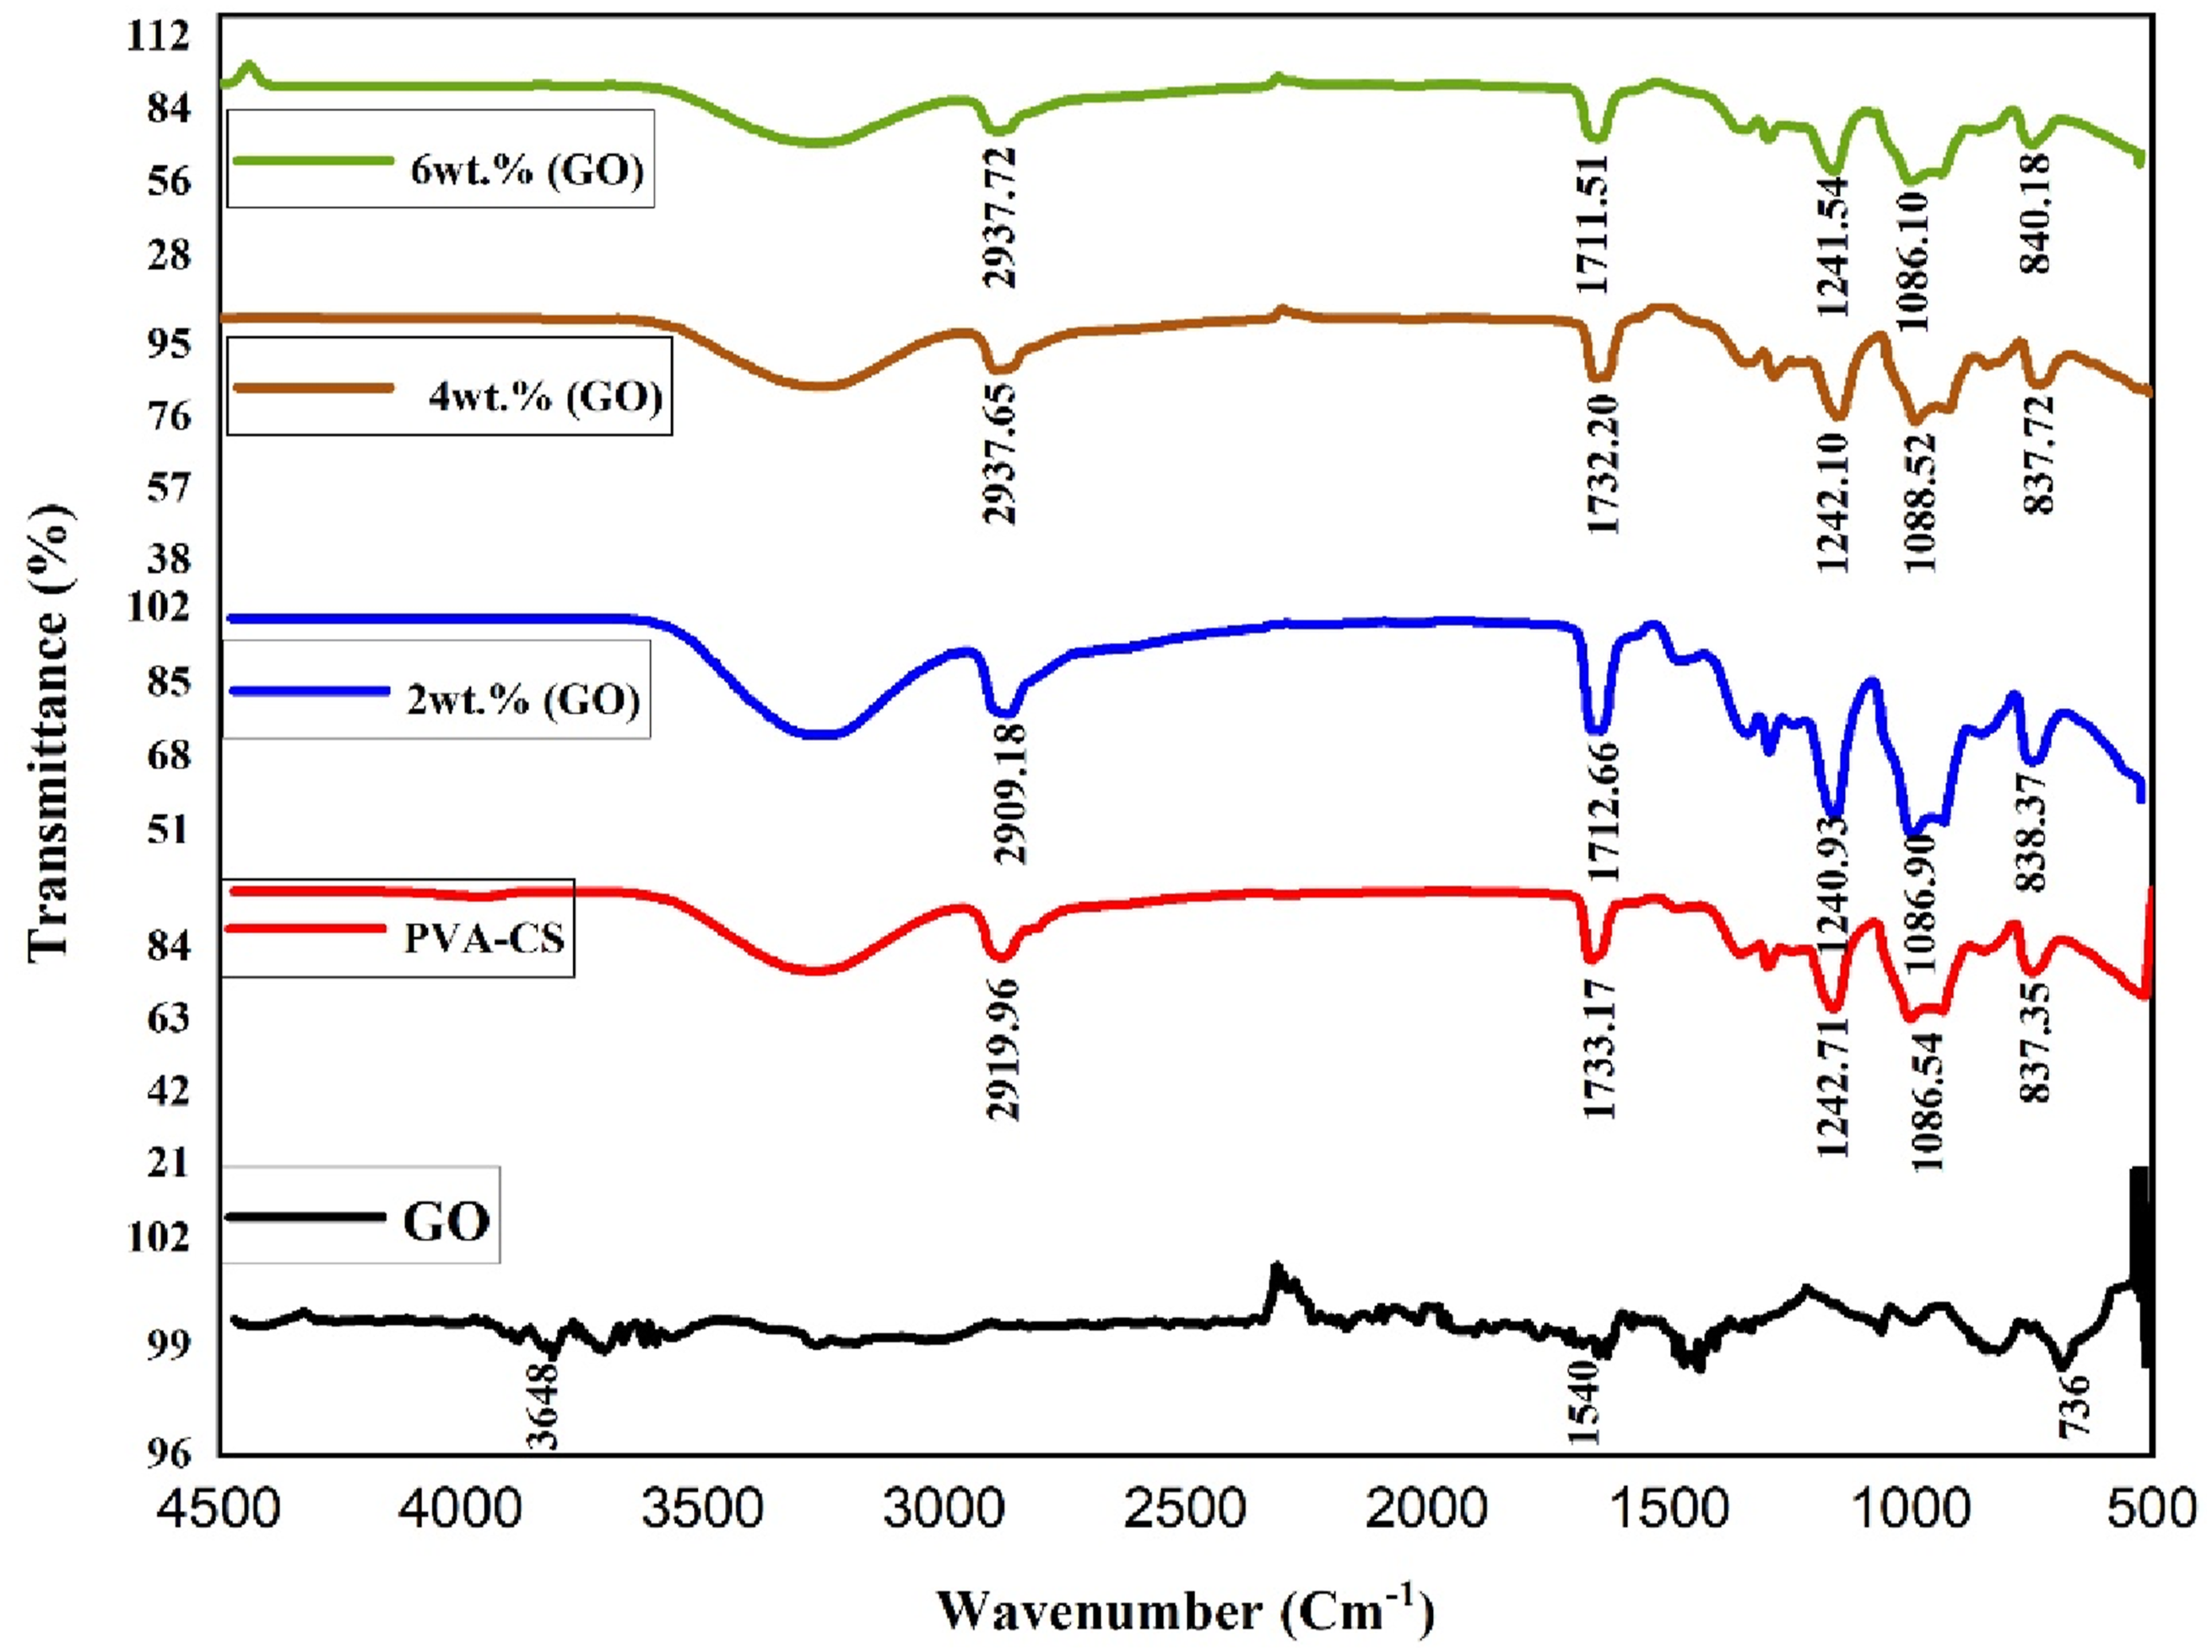
Optical Microscope of (PVA-CS/GO) PNCs
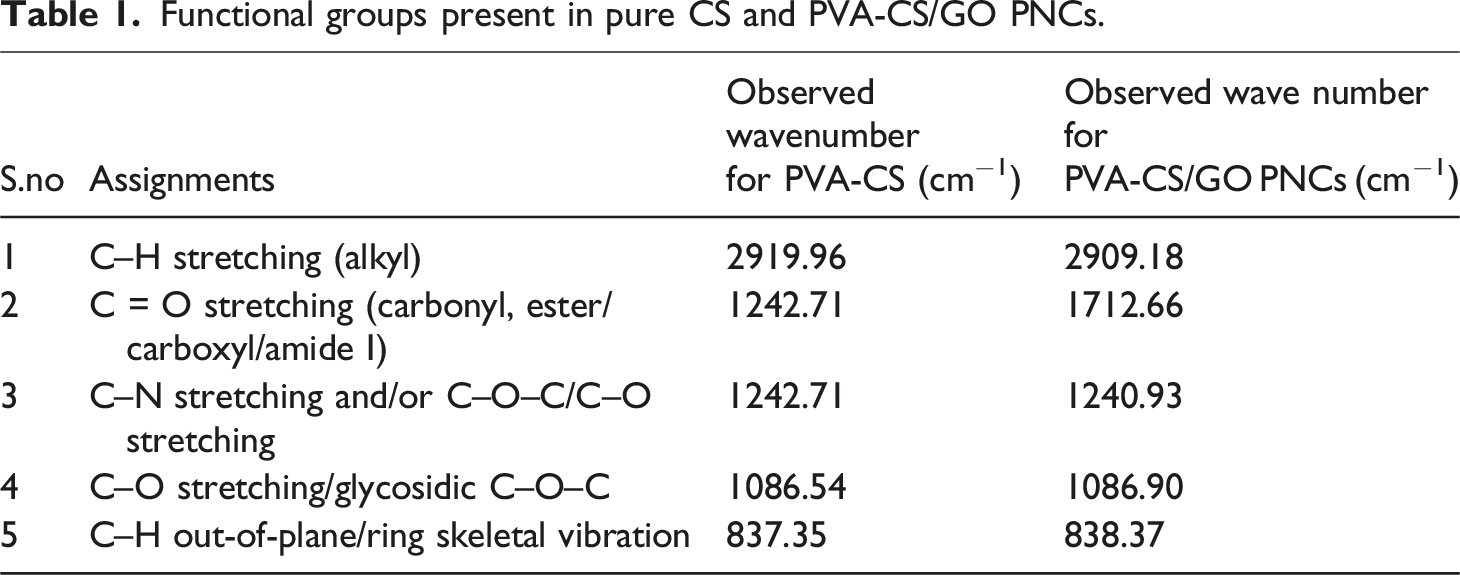
The optical microscope (OM) photographs of PVA-CS polymer blend combined with (GO) NPs films are shown in Figure 3 at a magnification of 20x. The images show different ratios of 0, 2, 4, and 6 wt% percent of (GO) NPs. Corresponding to the OM, the blended film containing 2%, 4%, and 6% by weight of the (GO) NMs has a plane surface of the CS polymer and a uniform distribution of (GO) particles. At an amount of 6 wt% percent (GO) NPs, the small particles form an ongoing structure inside the NCs, which contains nano pathways that improve the movement of charges.
51
The optical microscope image for (PVA-CS/GO) PNCs: A-pure CS, B-2 wt% (GO), C-4 wt% (GO), D-6wt% (GO).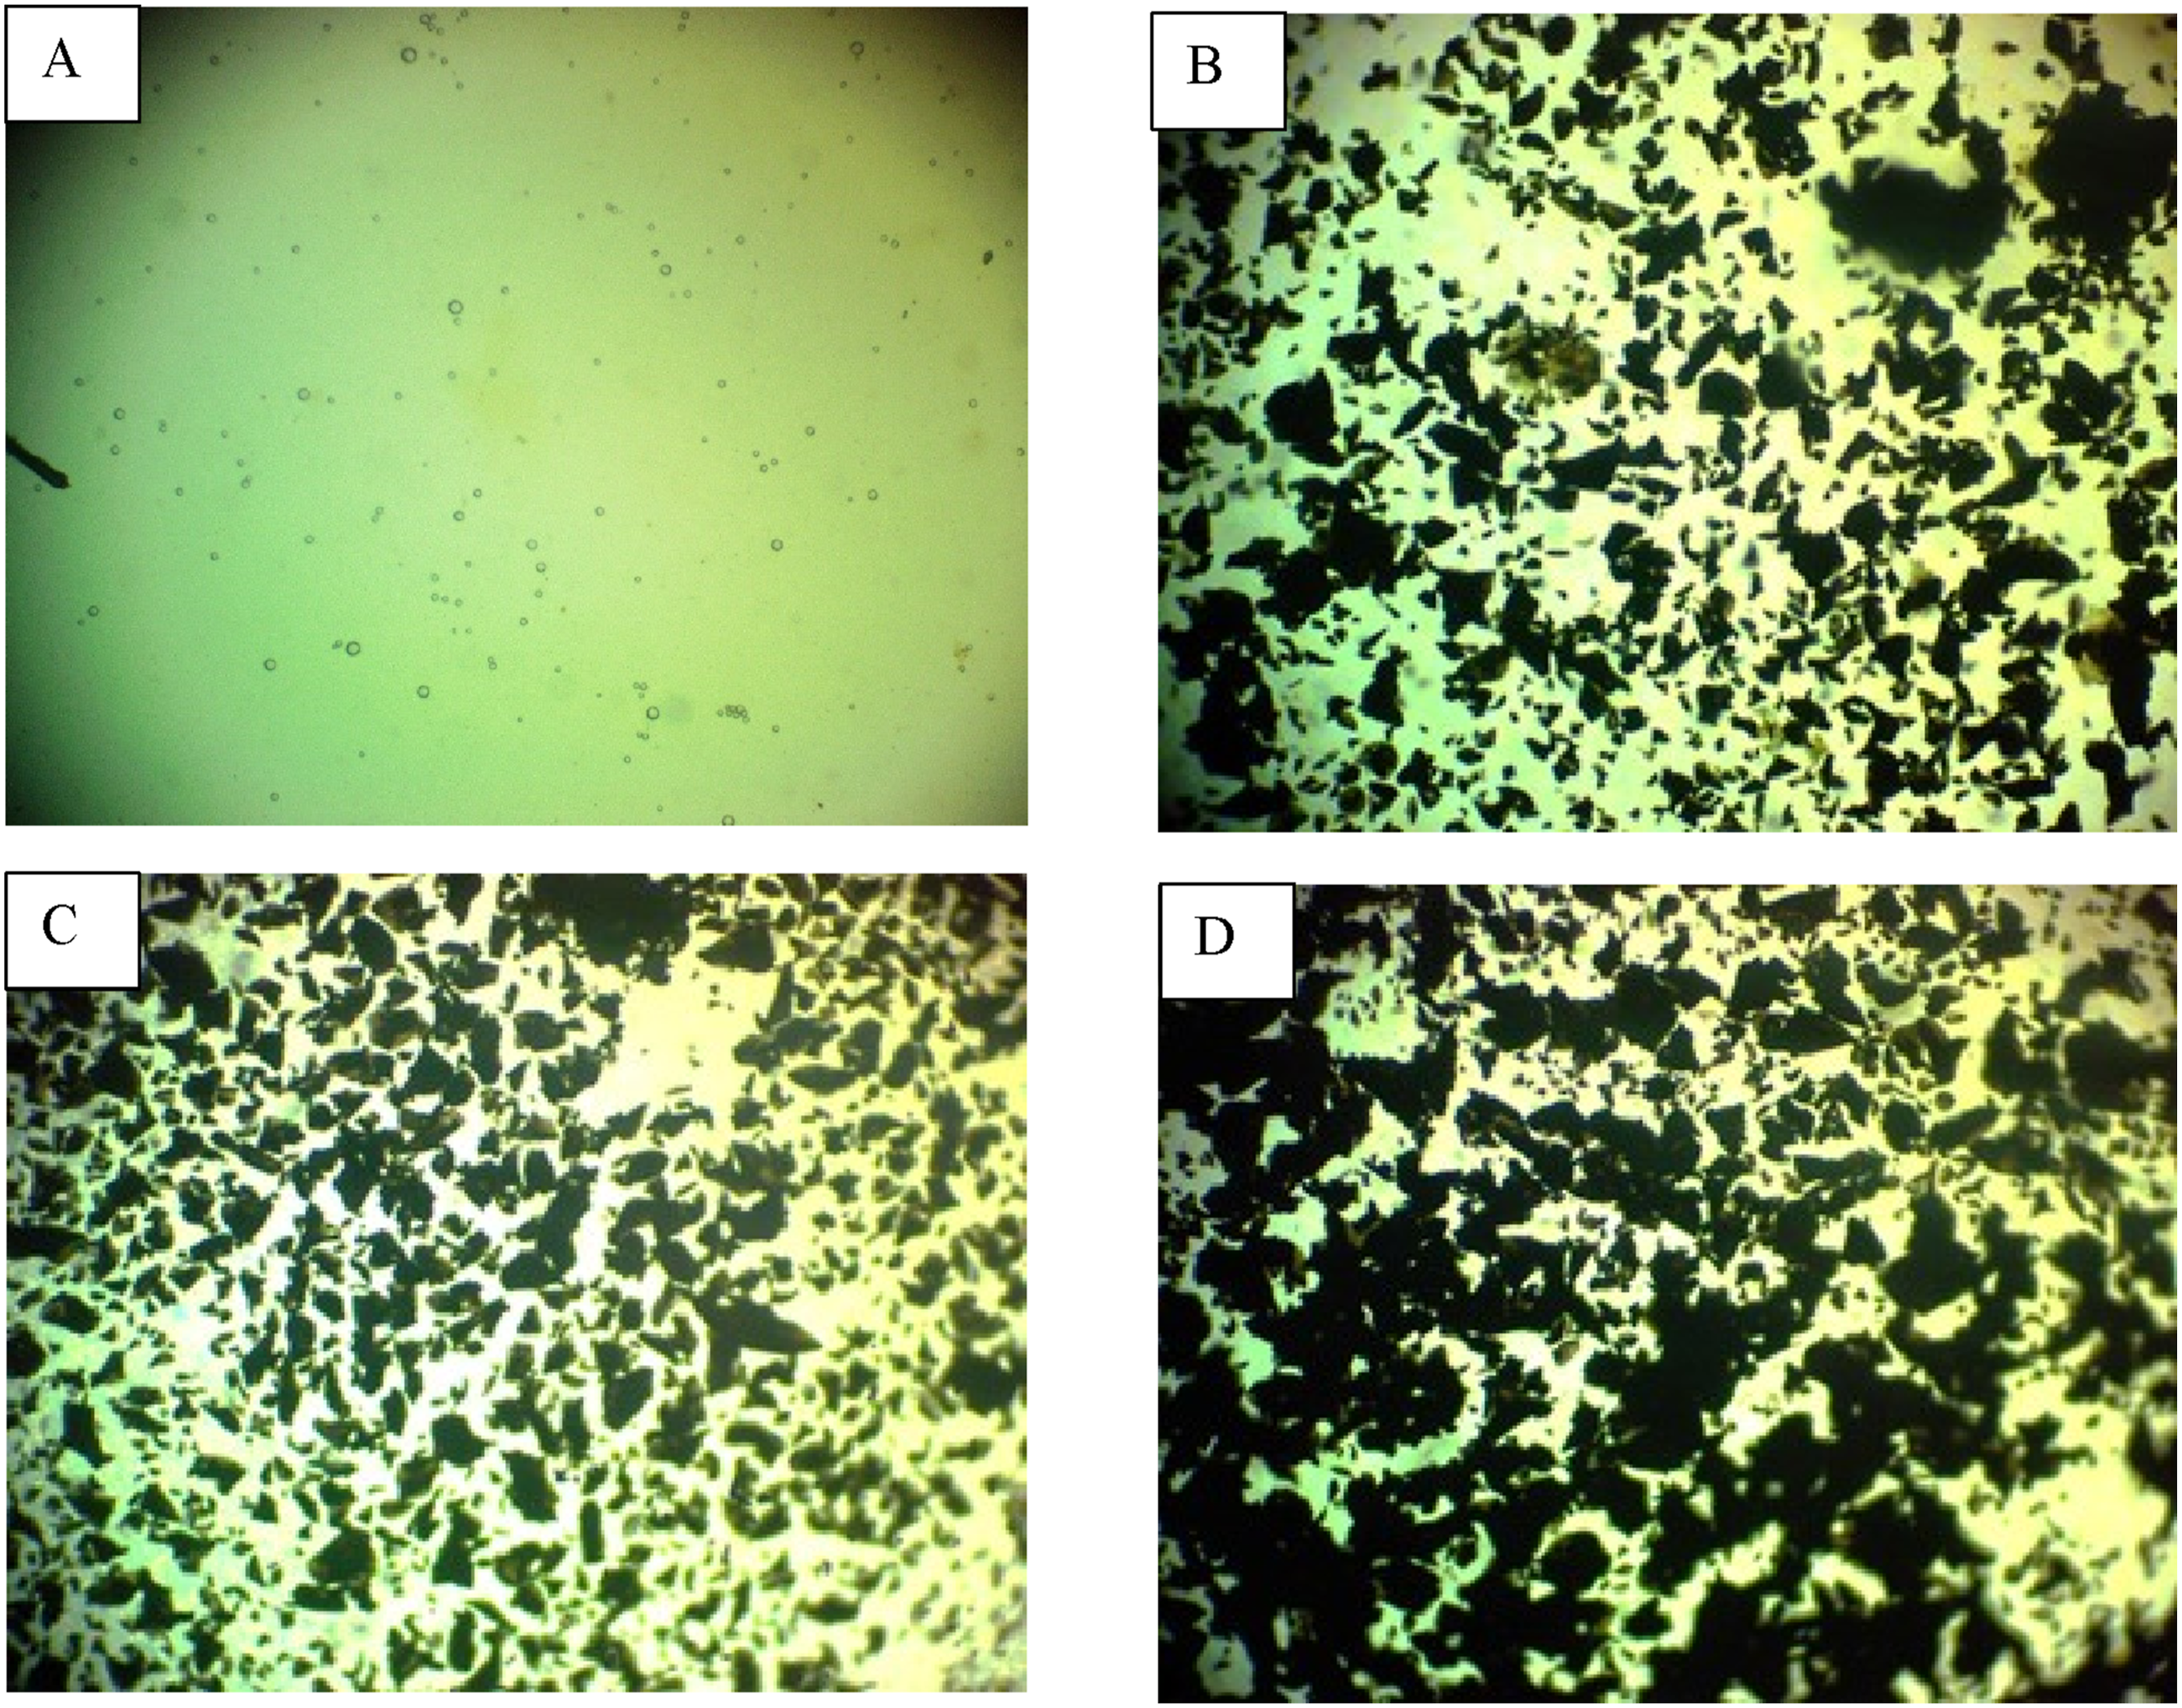
The Linear optical Properties of (PVA-CS/GO) Oxide PNCs
Figure 4(a) and (b) demonstrate the optical transmittance and absorbance spectra of the PVA-CS polymer blend which involves GO, which span a wavelength range of 200–1100 nm. All nanocomposite samples exhibit substantial UV absorption, as seen in Figure 4(a) and (b). This behavior can be explained by the photons’ high energy, which allows them to interact with atoms and excite electrons from lower to higher energy levels. Due to the low energy of the input photons, which are insufficient to interact with the atoms, nanocomposite samples exhibit very little absorption in the visible and near-infrared spectrums. Films absorb light more intensely at shorter wavelengths and less intensely as the wavelength increases. As the number of (GO) nanoparticles increases, absorption also rises, which in turn increases the quantity of charge carriers present. Impurity atoms located between the conduction and valence bands control the number of locations levels, which explains the observed impact. When these levels are present, electrons can more easily flow and absorb photons with energy below the incoming photons’ optical energy gap.52,53 Optical properties of (PVA-CS/GO) NCs: (a) absorption, (b) transmission and (c) absorption coefficient.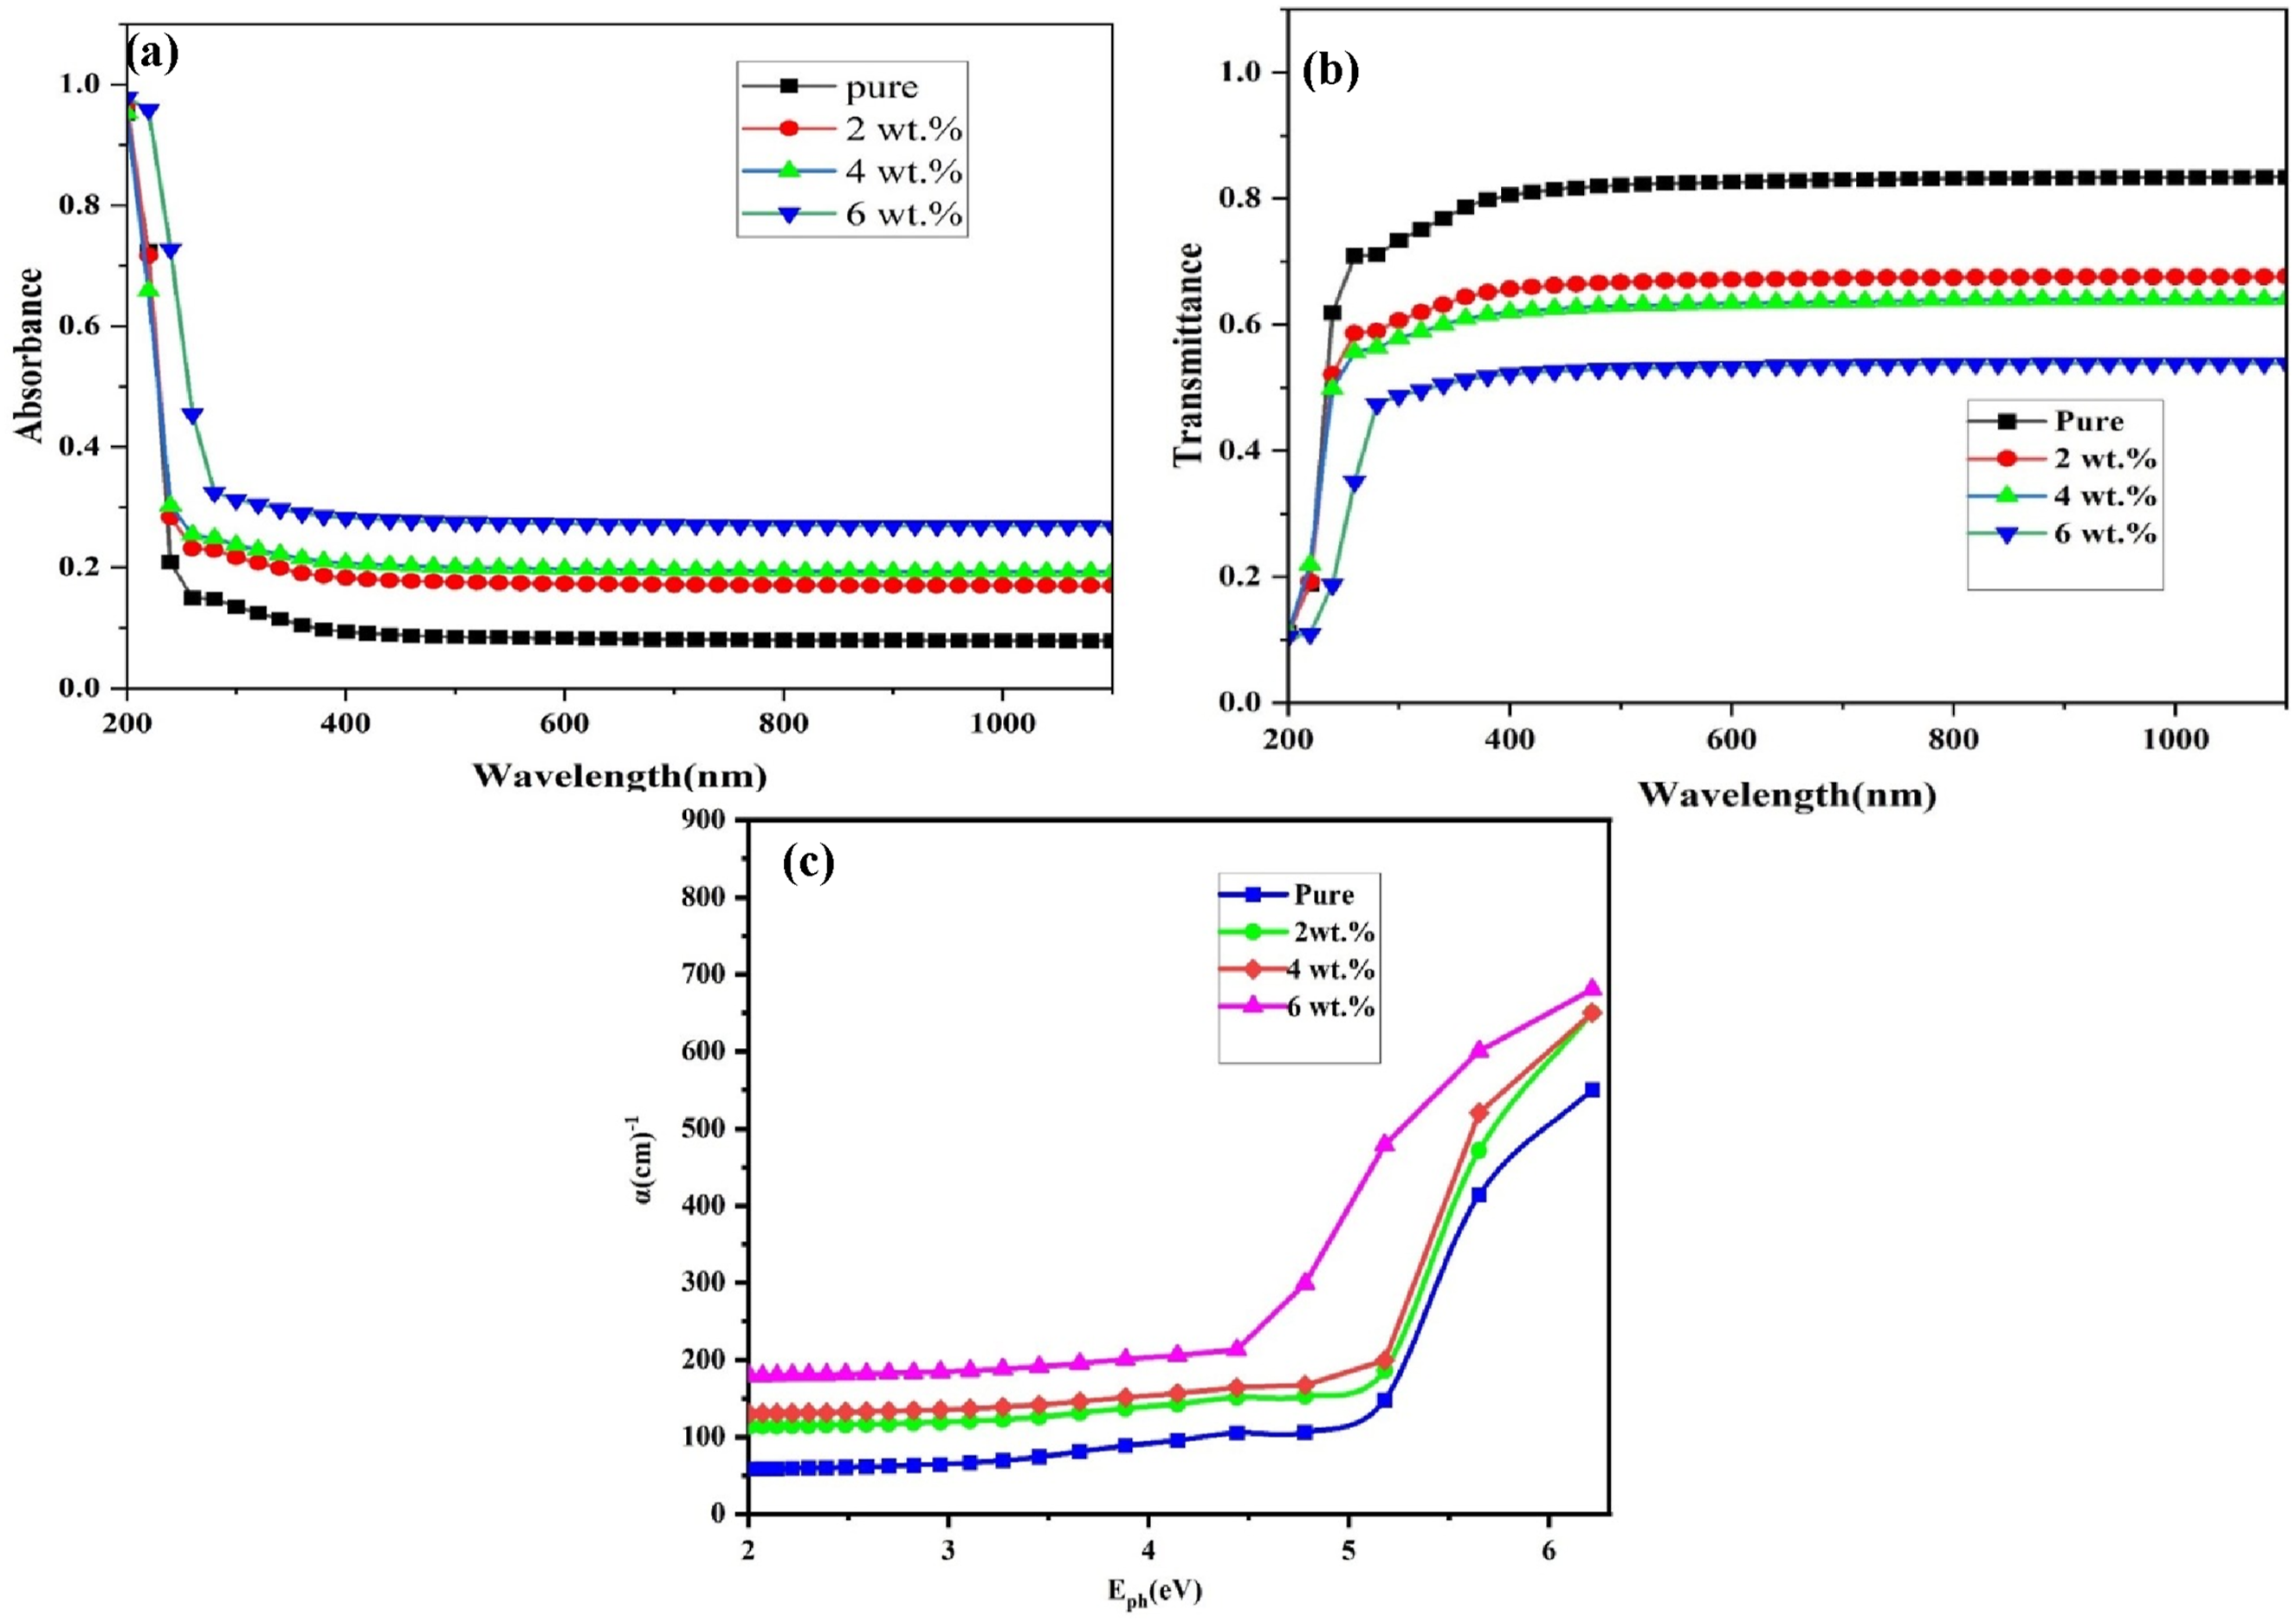
The absorption coefficient (α) is depicted in Figure 4(c) as a function of the photon energy of the incident light. The figure illustrates that the absorbance coefficient of the nanocomposite samples exhibits a decrease at lower energies. This means that the power is low and insufficient for the electron to move from the valence band to the conduction band, but at higher energies the absorption is high, which indicates a high probability of the electron moving from the valence band to the conduction band. Conduction is observed when the energy of the incident photon surpasses the forbidden energy gap. The concentration of nanoparticles has a direct impact on the absorption coefficient of nanocomposites, resulting in an increase as the concentration increases, and this is due to the formation of positional levels within the energy gap near the conduction band, which leads to an increase in the absorption from the incident photons.54,55
Figure 5(a) depicts the variation of the absorbance edge (αhυ)1/2 as a function of photon energy for (PVA-CS/GO) NCs. By drawing a straight line from the curve’s peak to the x-axis at the point where (αhυ)1/2 = 0 (allowed), an indirect energy gap transition can be obtained. The absorbance edge is decreased with the increase in the (GO) nanoparticles concentrations, as shown in Table 2; band gap refers to the energy difference between lowest unoccupied molecular orbital and highest occupied molecular orbital according to the Koopmans theorem. The energy gap values decrease with increasing (GO) nanoparticles concentration, and this shows that the doping process led to a decrease in the value of the energy gap. This phenomenon can be attributed to the emergence of energy levels within the gap, facilitating the transition of electrons. Specifically, the transition occurred in two distinct stages: first, from the valence band to the localized energy levels within the gap and then to the conductivity band.56,57 The reduction in the optical band gap with increasing GO content is due to the formation of localized energy states in the polymer matrix that facilitate electronic transitions. Optical properties of (PVA-CS/GO) NCs: (a) allowed energy gap, (b) forbidden energy gap, (c) direct transition and (d) both direct and indirect optical band gaps as a function of GO nanoparticle concentration. Demonstrates the energy gaps for the indirect (both allowed and forbidden) and direct transition for (PVA-CS/GO) NCs.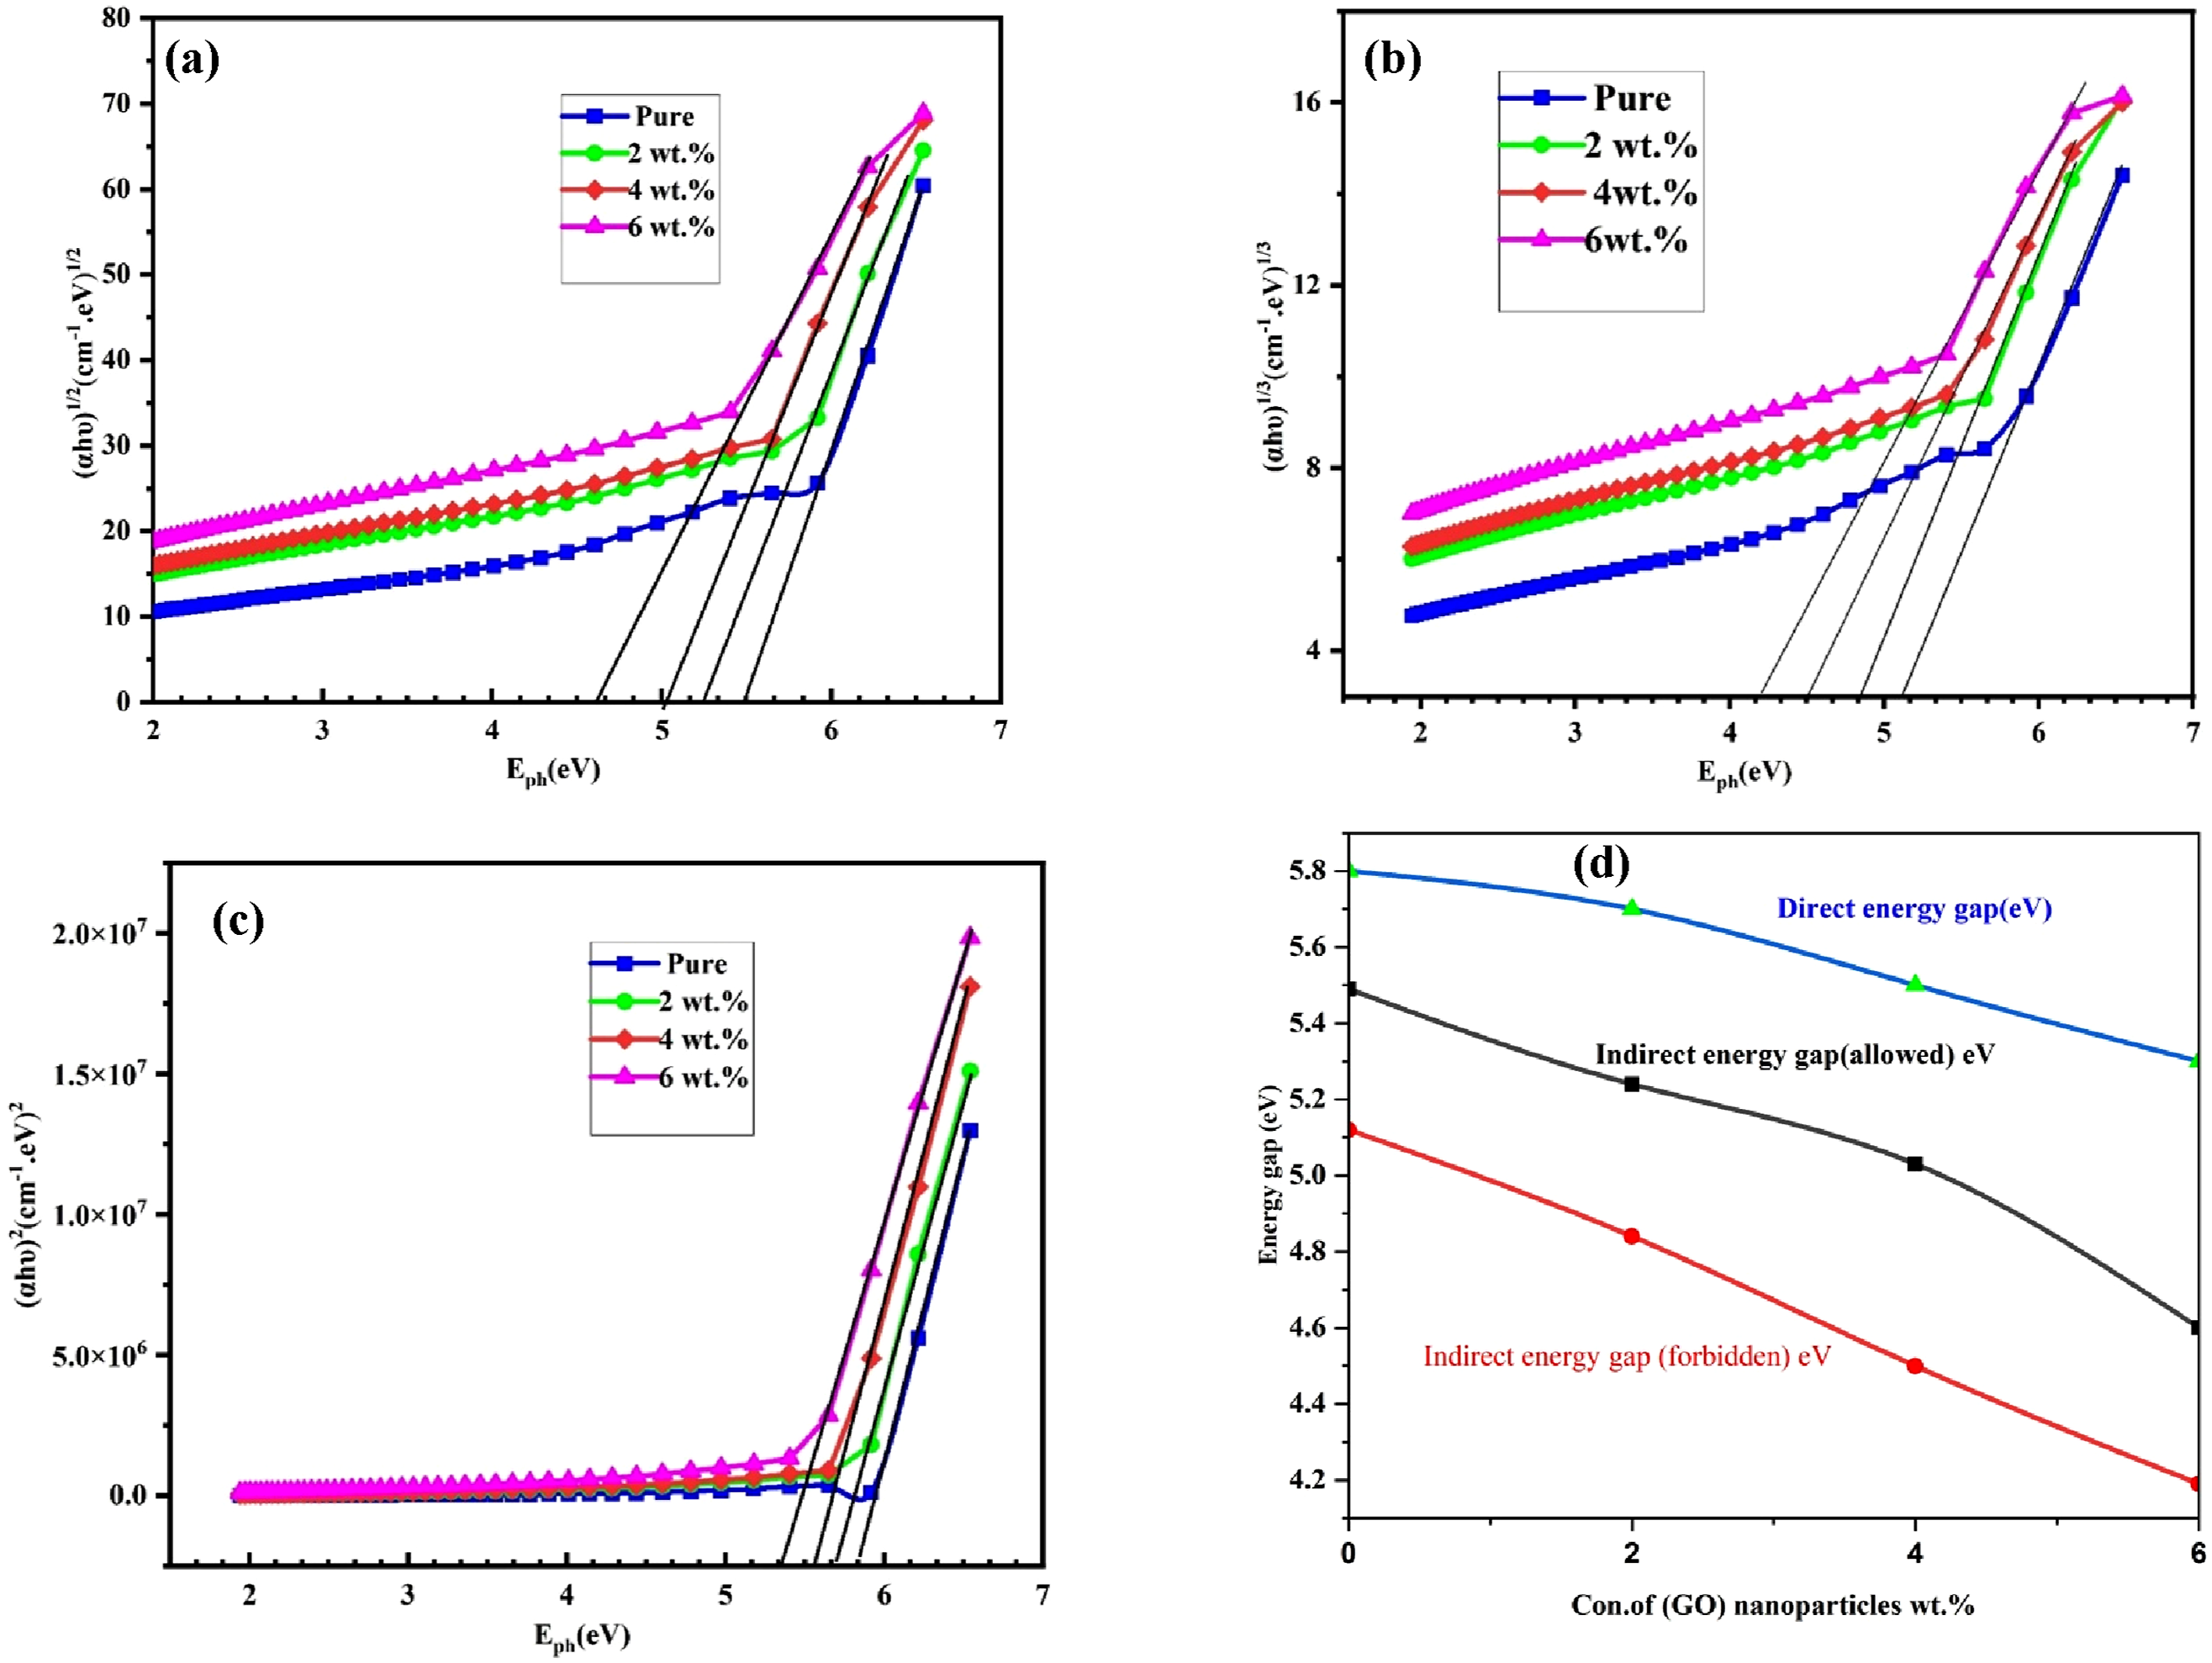
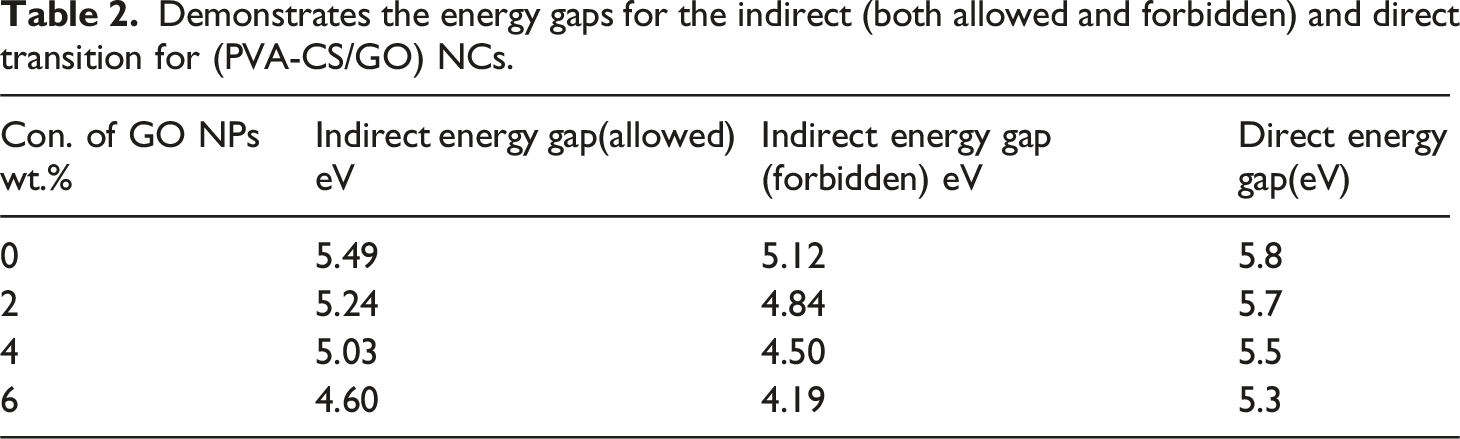
Figure 5(b) shows the relationship between (αhυ)1/3 (cm−1 eV)1/3 and photon energy of nanocomposites. The figure demonstrates that the energy gap values for forbidden indirect transition exhibit a decreasing trend with an increase in the concentration of (GO) nanoparticles. Additionally, the values of forbidden indirect transition are comparatively lower than those of allowed indirect transition. Figure 9 illustrates the variation of (αhν)2 as a function of photon energy (hν) for (PVA-CS/GO) nanocomposites.58,59 The plot represents the Tauc relation for direct allowed transitions, seen as Figure 5(c). The direct optical band gap values were determined by extrapolating the linear portion of the curves to the photon energy axis at (αhν)2 = 0. The results show that the direct band gap values decrease with increasing GO nanoparticle concentration, similar to the behavior observed for the indirect transitions. However, the obtained direct band gap values are higher than the indirect ones, indicating that the optical transitions in the nanocomposites are predominantly indirect in nature. Figure 5(d) presents the variation of both direct and indirect optical band gaps as a function of GO nanoparticle concentration. The direct band gap values were determined from the plots of (αhv)2 versus hv, while the indirect allowed and forbidden band gaps were obtained from (αhv)1/2 and (αhv)1/3 plots, respectively, as shown in Figures (a–c). It can be observed that the band gap decreases gradually with increasing GO content. This reduction may be attributed to the formation of localized states within the band structure and the increased disorder in the polymer matrix caused by the incorporation of GO nanoparticles, which facilitates electronic transitions and narrows the energy gap.60,61
Figure 6(a) depicts the extinction coefficient’s variation as a function of wavelength. This graph demonstrates that the extinction coefficient rises as the number of (GO) nanoparticles increases; this is due to the increase in optical absorption and photon dispersion in the polymer matrix. The extinction coefficient depends on the absorption coefficient and has high values in the UV region, and it increases with increasing wavelength in the visible spectrum region and continues to the near infrared spectrum region.62,63 These results agree with the researcher’s results.64,65 Optical properties of (PVA-CS/GO) NCs: (a) extinction coefficient (b) refractive index, (c) real dielectric constant and (c) imaginary dielectric constant.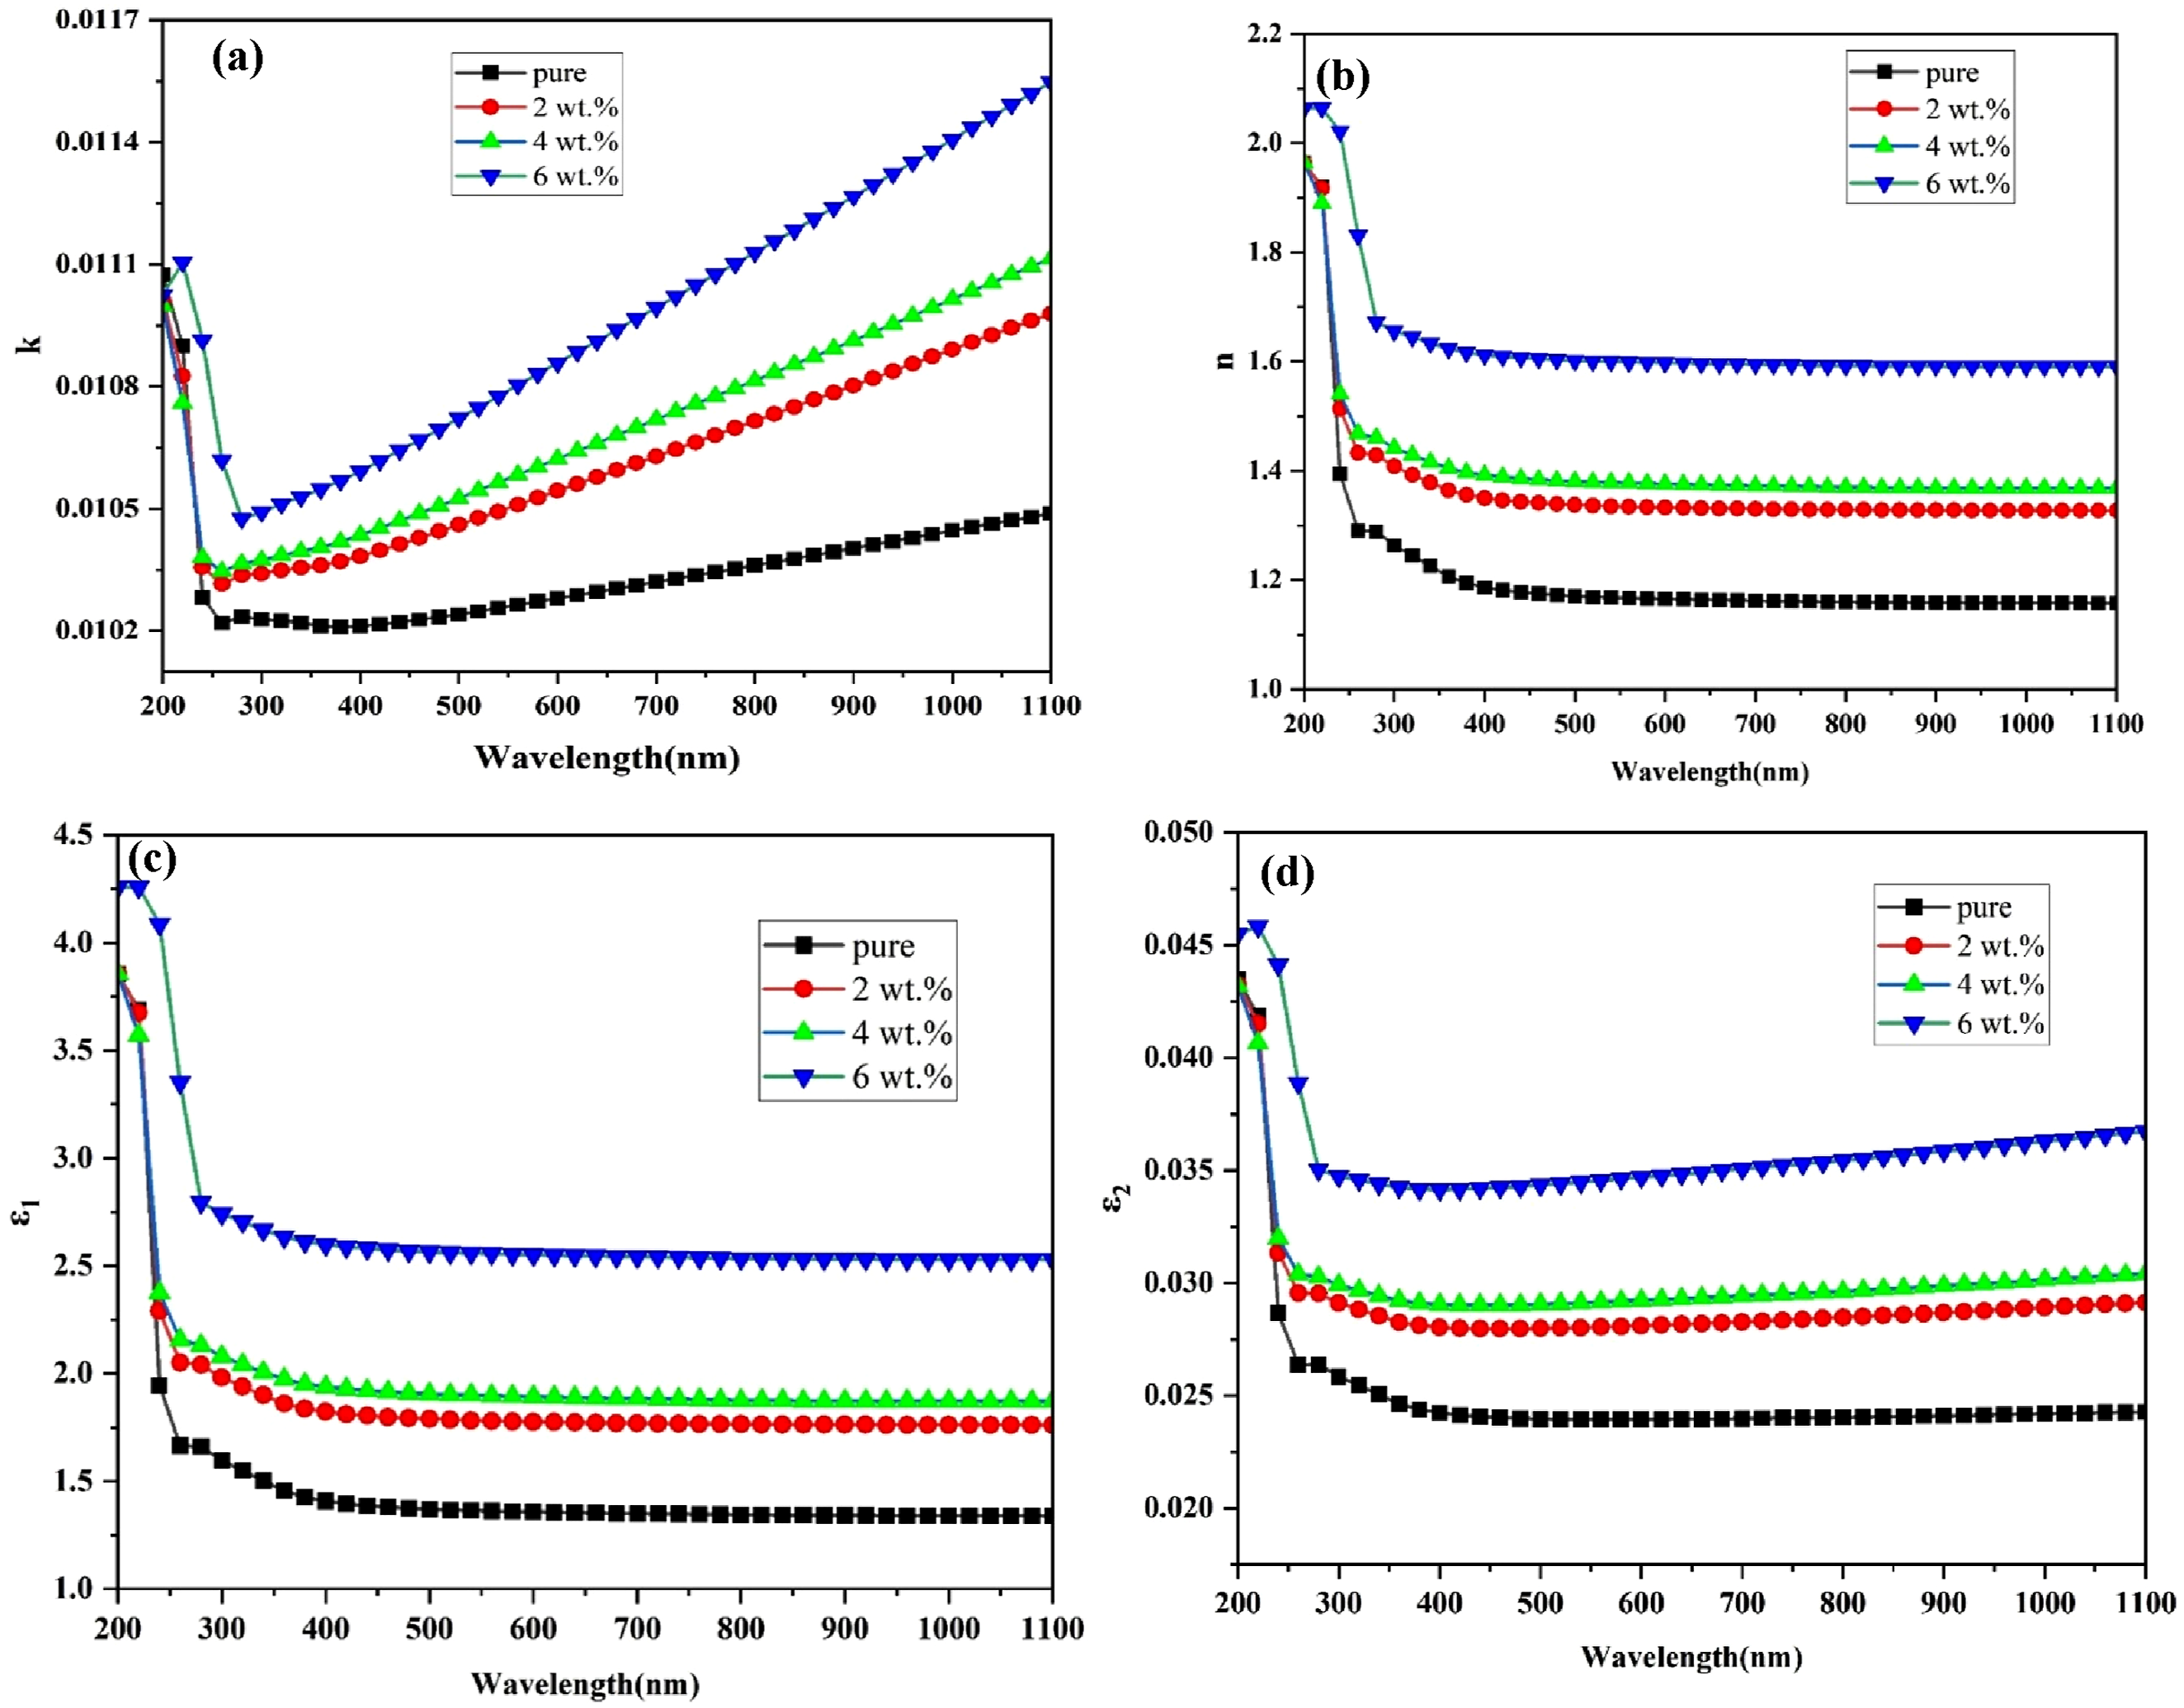
Figure 6(a) shows variation the refractive index (n) of (PVA-CS/GO) nanocomposites with wavelength. The refractive index of (PVA-CS/GO) nanocomposites exhibit an upward trend with increasing concentrations of (GO) nanoparticles. On the other hand, it can be observed that the refractive index undergoes a reduction as the wavelength increases, a phenomenon that can be explained by the increased density of the nanocomposites.66,67 Upon exposure to incident light, a sample exhibiting high refractivity in the UV region will demonstrate a proportional elevation in its refractive index values.68,69
The real and imaginary dielectric constants for (PVA-CS/GO) nanocomposites vary with wavelength, as seen in Figure 6(c) and (d). The results demonstrate that when the concentration of (GO) nanoparticles increases, so do the (ε1, ε2). This behavior is explained by the nanoparticles’ enhanced electric polarization, which raises the dielectric constant and results in a higher dipole density.70,71 According to the connection shown in equation (7), Figure 6(c) shows how the actual dielectric constant curves and the refractive index curves behave similarly. The apparent closeness results from the fact that the real dielectric constant depends more on n2 values than k2 values, given that k values are significantly less than refractive index values, particularly after squaring.72,73 Figure 6(d) illustrates when the imaginary dielectric constant varies with wavelength. The imaginary component of the dielectric constant is influenced by the dissipation coefficient, particularly in the infrared area and near visual radiation. In this range, the extinction coefficient (k) increases with wavelength, while the refractive index (n) remains largely unchanged.74,75
The nonlinear optical Properties of (PVA-CS/GO) Oxide PNCs
The interaction of the incident electromagnetic radiation with the electrons of the PNCs either at the surface or within the bulk can be interpreted using the surface and volume energy loss functions (SELF and VELF). The spectral behavior of these functions is depicted in Figure 7(a) and (b). In all investigated samples, VELF values exceed those of SELF. Furthermore, both VELF and SELF increase progressively with higher GO nanoparticle content. This enhancement is consistent with the rise in absorption coefficient and scattering processes, which are also linked to the increases observed in ε1 and ε2.76,77 Modifications in the real part of the dielectric constant reflect alterations in the band structure of the polymer matrix, as nanofiller incorporation introduces additional states within the forbidden band. The presence of different nanofillers also induces polarization variations in the host polymer blend, leading to increased dielectric loss.78,79 Nonlinear optical properties of (PVA-CS/GO) NCs: (a) SELF (b) VELF, (c) Ln(α) versus hν used for the evaluation of Urbach energy and (c) (n2 − 1) −1 on (hν) 2 (d).
Optical parameters (linear and nonlinear) of (PVA-CS/GO) PNCs.
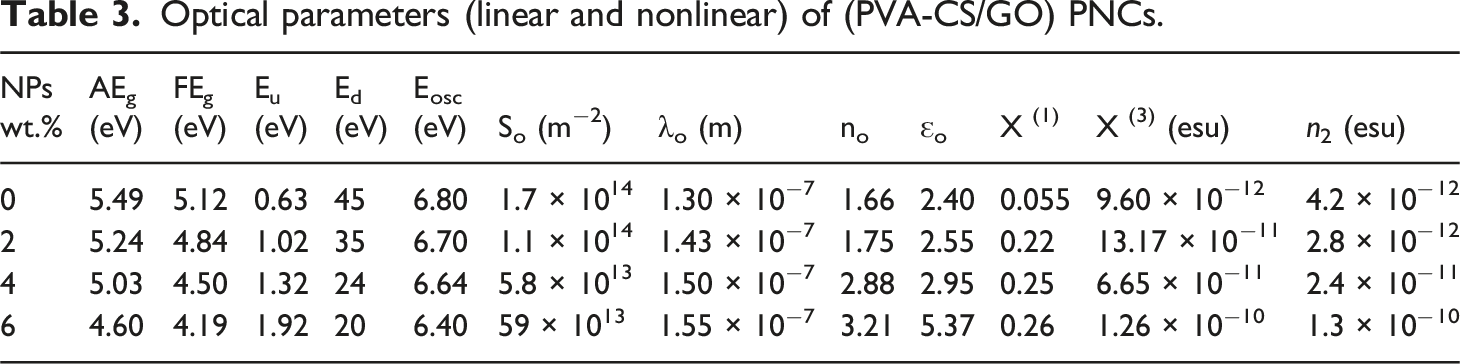
Figure 7(d) shows that plotting (n2 – 1) −1 versus (hν) 2 yields a linear relationship, where the intercept corresponds to EoEd, and the slope equals 1/(EdEo). As the nanoparticle concentration increases, the values of Eo decrease, likely due to enhanced scattering centers and the associated reduction in optical band gap. The simultaneous decline in both Eo and Ed with increasing nanomaterial loading indicates modifications in the refractive and scattering behavior of the films. Understanding these parameters is crucial for analyzing light–matter interactions in photovoltaic applications. A lower Eo suggests a greater sensitivity to low-energy photons, enabling broader absorption. Meanwhile, Ed is associated with the material’s response to external electric fields, which can potentially improve photo-conversion efficiency.82,83
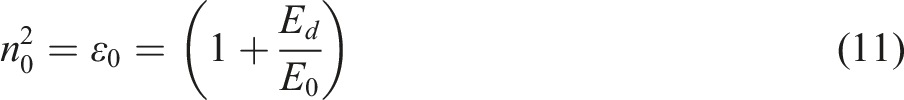
The incorporation of GO nanoparticles into the nanocomposite structure enhances its polarizability, as reflected by the gradual increase in both the dielectric constant (ε0) and the zero-frequency refractive index (n0). With increasing nanoparticle loading, n0 increases from 2.009 to 2.053, while ε0 increases from 4.03 to 4.21, indicating that the optical density of the material becomes higher with greater filler content.84,85 These values are also summarized in Table 3.
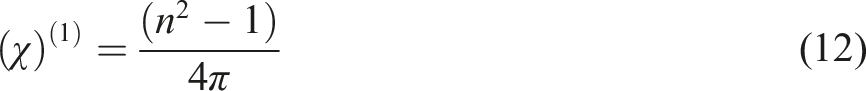
The wavelength dependence of the linear and nonlinear optical susceptibilities of the (PVA-CS/GO) PNCs is illustrated in Figure 8(a) and (b). Based on the material’s linear susceptibility χ(1), the third-order nonlinear susceptibility χ(3) can be estimated, particularly using Miller’s rule, which is highly applicable in the visible and near-infrared regions. In this study, GO nanoparticles were introduced into the CS matrix to enhance its nonlinear optical (NLO) response and to evaluate its potential use in NLO applications. Such applications include optical frequency conversion, optical data storage, photonic devices, and ultrafast optical switching systems.
86
Wavelength-dependent variation of (a) χ(1) and χ(3) for the (PVA-CS/GO) PNCs.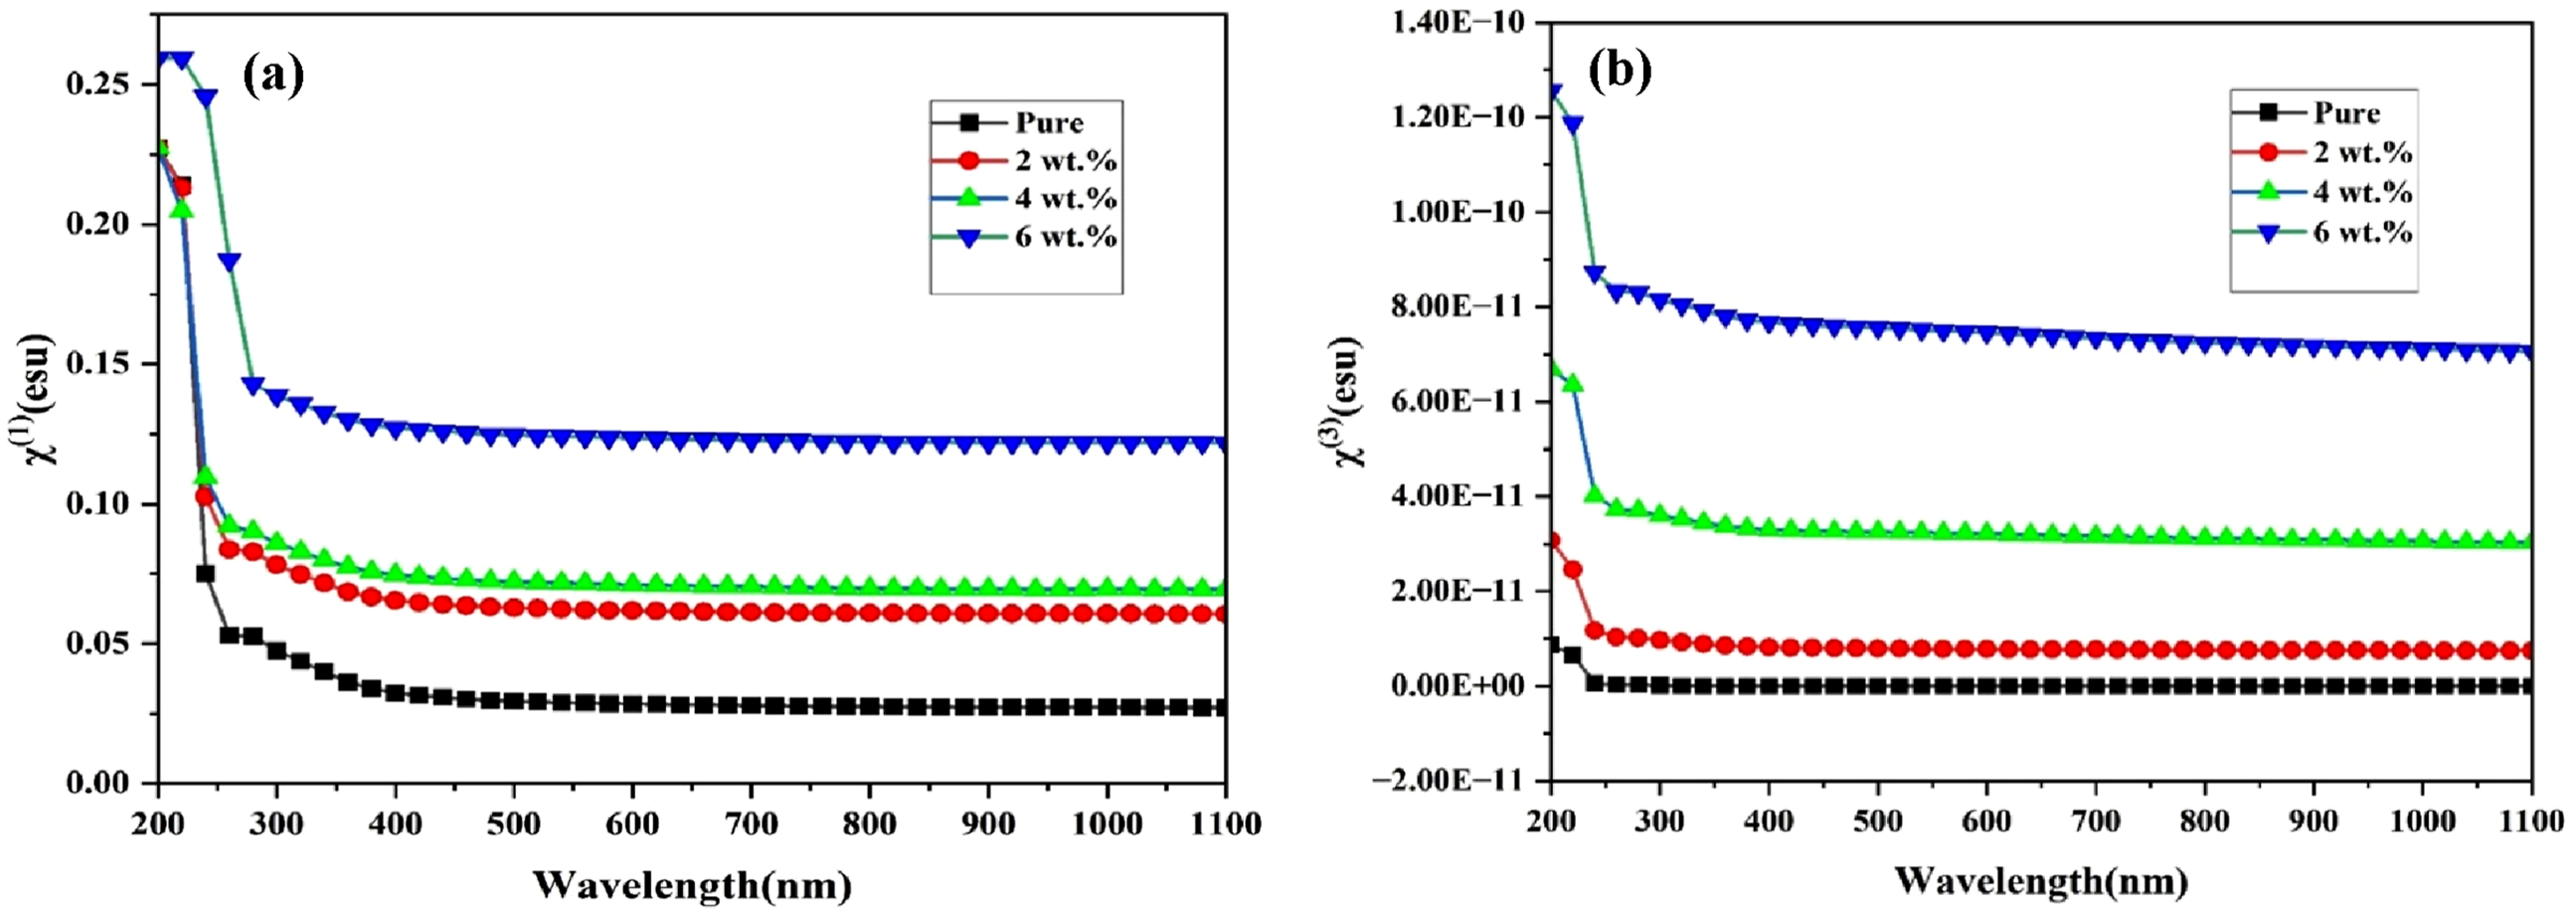
Investigating parameters such as χ(1), χ(3), and the nonlinear refractive index n2 is essential for understanding the nonlinear interactions between the material and incident light. As the GO nanoparticle concentration increased, the NLO parameters exhibited a non-uniform enhancement. The sample containing 6 wt% GO demonstrated the highest nonlinear optical performance. These variations in NLO behavior are likely associated with structural modifications in the polymer matrix induced by GO incorporation, which introduce additional defect states. Such defects influence the values of χ(1), χ(3), and n2 by altering the density and mobility of free charge carriers within the material.
The electrical Properties of (PVA-CS/GO) Oxide PNCs
Figure 9(a) presents the variation of the dielectric constant of the (PVA-CS/GO) nanocomposites as a function of frequency. The figure reveals a noticeable decrease in the dielectric constant with increasing frequency, which can be attributed to the reduction in space-charge polarization relative to the overall polarization. Since ionic polarization responds more slowly to changes in the applied field frequency than electronic polarization due to the larger mass of ions compared to electrons the electronic component remains effective even at high frequencies. At elevated frequencies, the dielectric constant values for all samples converge, as the low electron mass allows rapid response while preventing the formation of additional polarization mechanisms.
47
Electrical properties of (PVA-CS/GO) NCs: (a) ε’ with frequency, (b) ε’ with concentration of (GO) NPs, (c) ε” with frequency and ε” with concentration of (GO) NPs.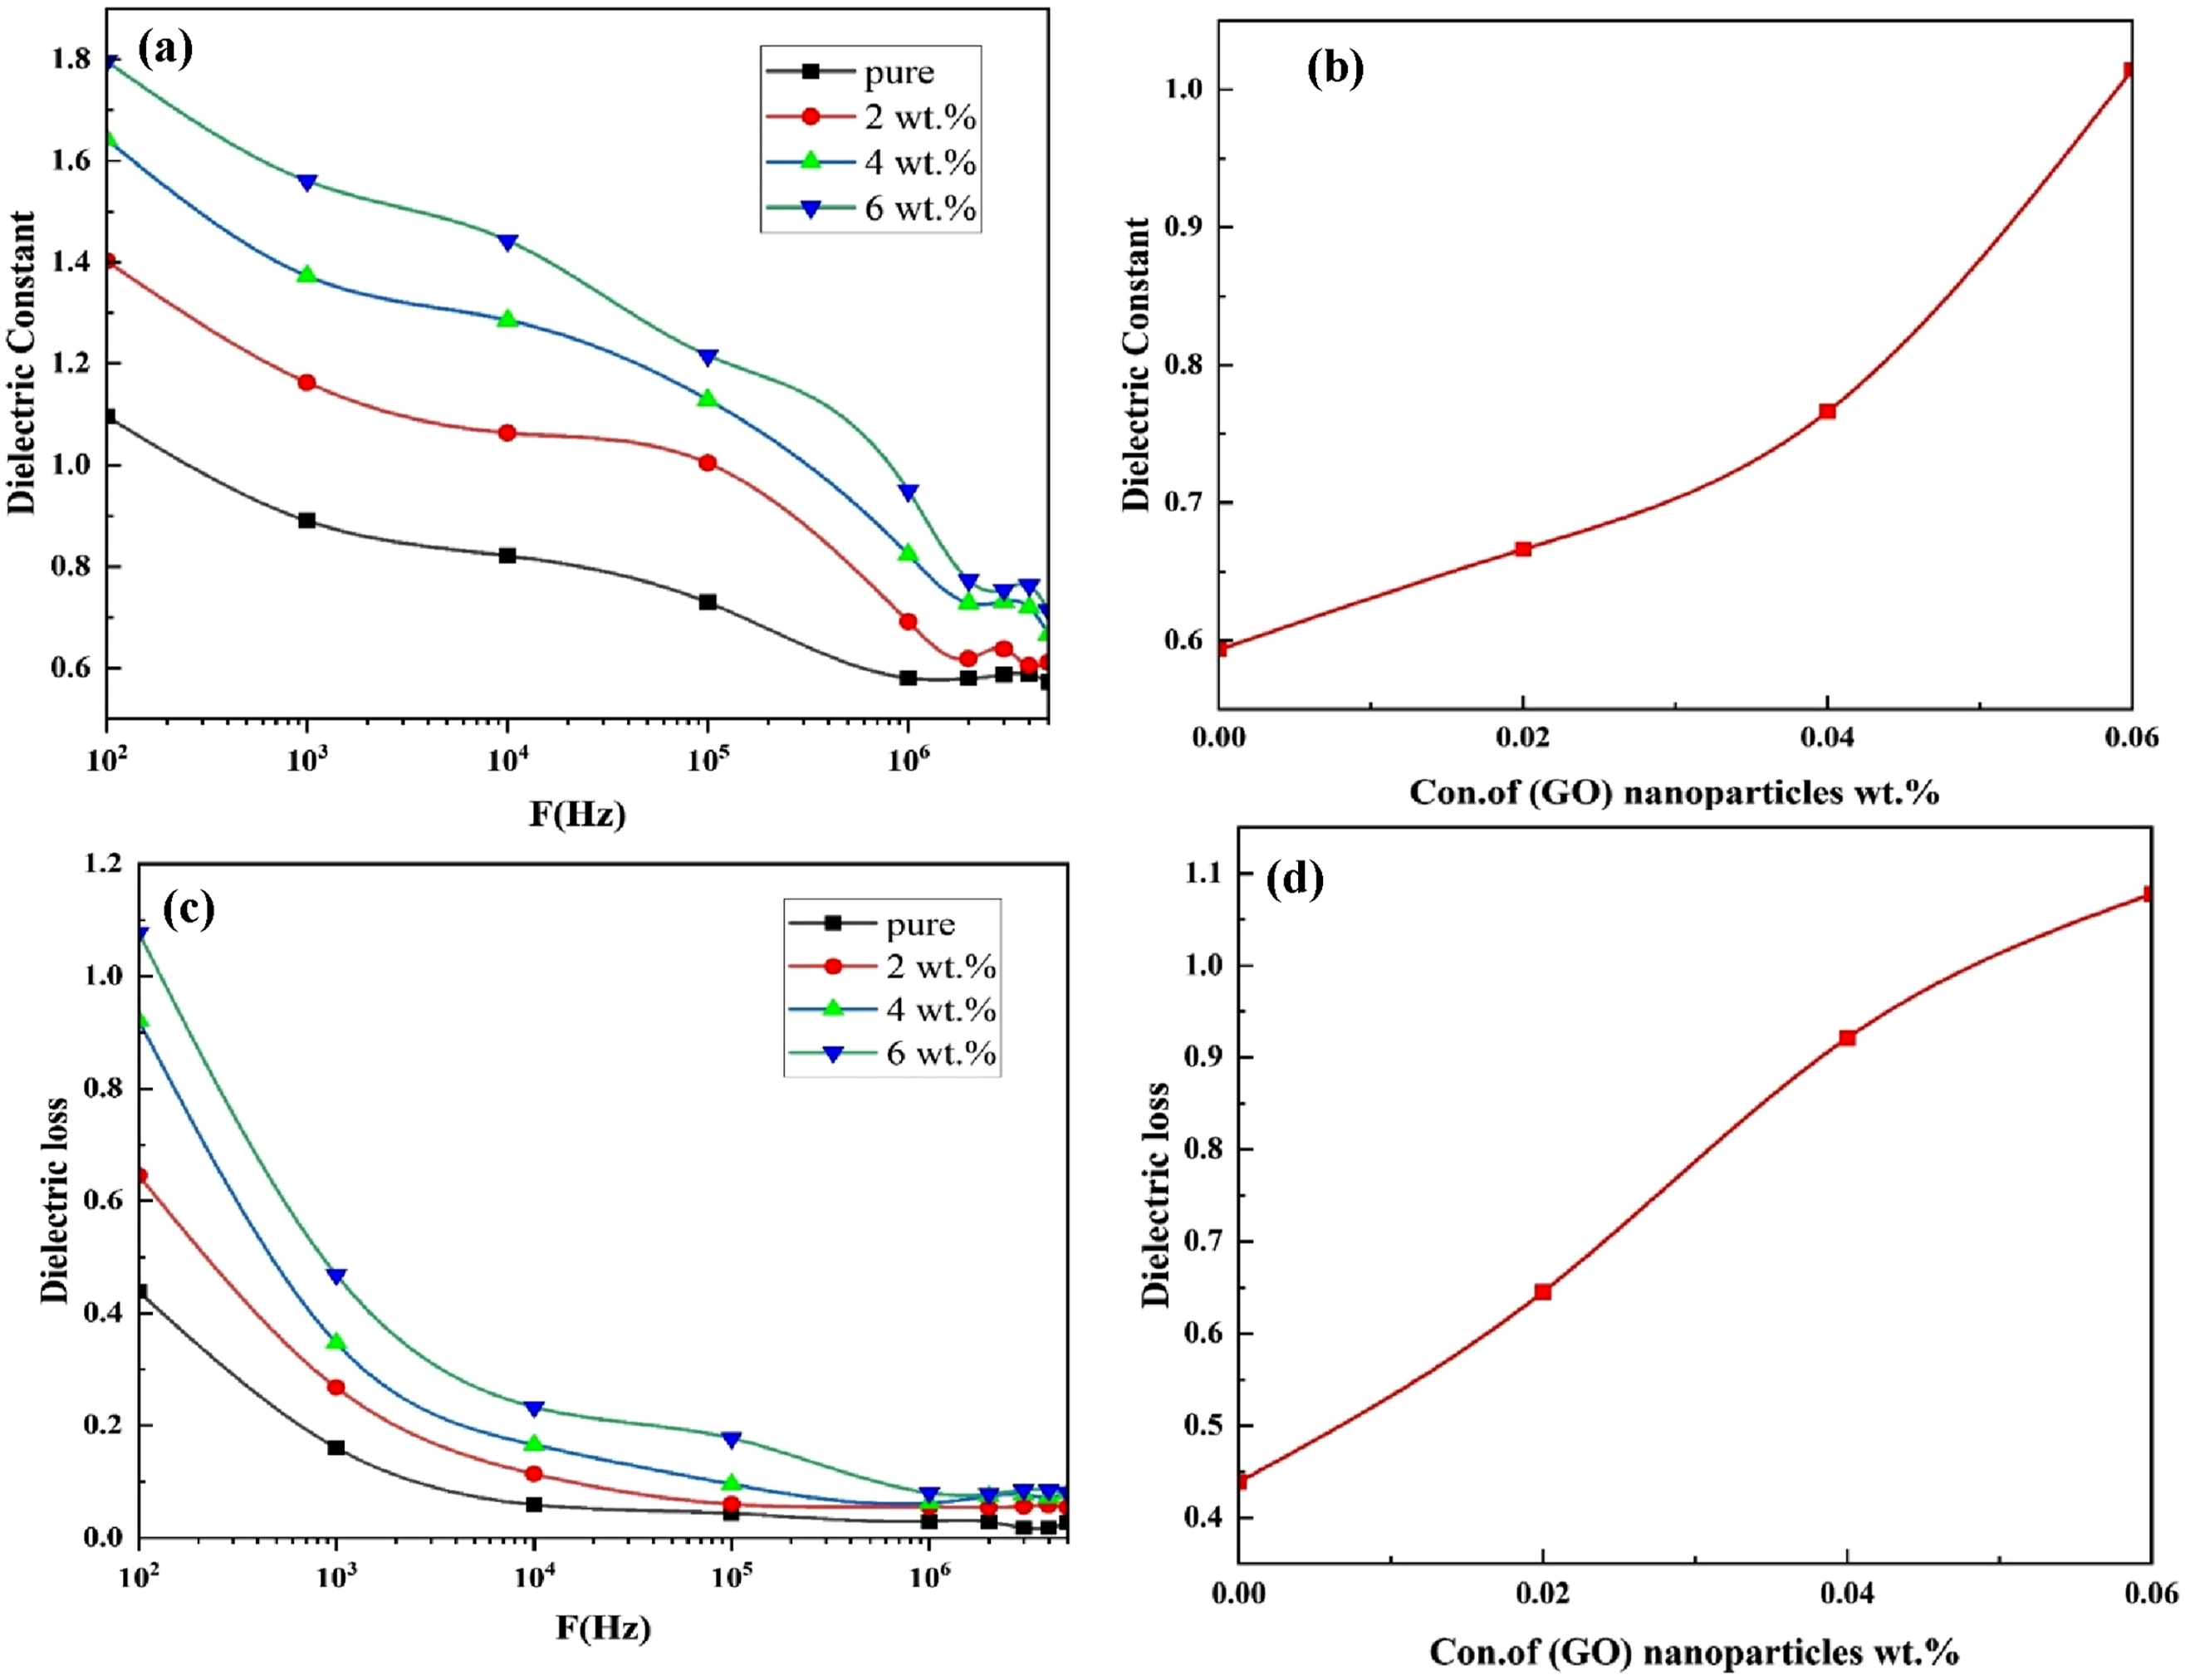
Figure 9(b) further demonstrates that the dielectric constant increases with higher GO nanoparticle loadings. Nanocomposites can exhibit several forms of polarization, including orientational (dipolar) polarization, which arises when an applied electric field aligns molecular dipoles with its direction. Likewise, ionic polarization occurs when oppositely charged ions shift relative to each other under the influence of an external electric field. These combined effects account for the observed dependence of the dielectric constant on both frequency and nanoparticle concentration.
Figure 9(c) presents the variation of dielectric loss for the (PVA-CS/GO) nanocomposites as a function of frequency. The plotted curve reveals a noticeable reduction in dielectric loss with increasing frequency. This behavior is attributed to the mobile charge carriers distributed within the polymer backbone. As the number of electrons participating in the nanocomposite structure increases, the contribution of space-charge polarization diminishes at higher frequencies. The frequency-dependent dielectric loss is primarily influenced by dielectric polarization mechanisms, particularly interfacial polarization resulting from material inhomogeneities and dipolar polarization associated with polar molecular groups. 87 Furthermore, the (PVA-CS/GO) nanocomposites exhibit relatively high dielectric loss in the mid-frequency region, which decreases progressively as the frequency increases. As illustrated in Figure 9(d), increasing the concentration of GO nanoparticles within the nanocomposite leads to an enhancement in dielectric loss.
Figure 10(a) displays the A.C. electrical conductivity’s dependency on the (GO) NPs content for (CS) films at (R.T.), as well as the electrical field frequency between 102–5 × 10⁶ Hz. The A.C. conductivity of all samples improves significantly as the electric field frequency rises; this is due to charge carrier jumping motion and the polarization of space charges, which happens at the lowest frequencies.
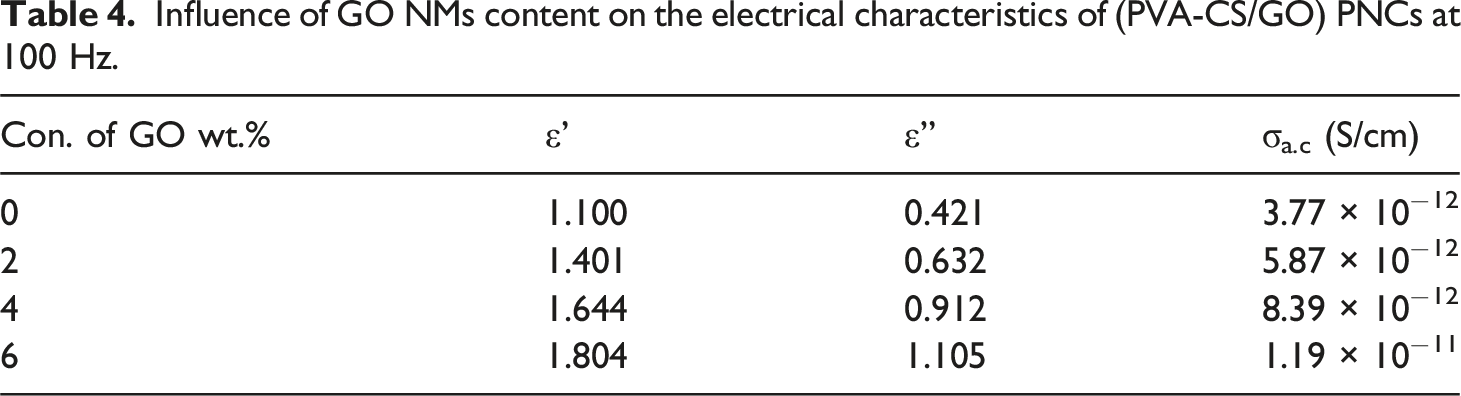
88
The conductivity grows when the weight percentage of (GO) NPs increases, as Figure 10(b) illustrates. Since charge carriers are more prevalent in the polymer matrix due to their normal distribution, this behavior can be attributed to the action of space charge. Table 4 presents the dielectric (constant, loss) and A. C. electrical conductivity values for (PVA-CS/GO) nanocomposites at (100 Hz). Electrical properties of (PVA-CS/GO) NCs: (a) conductivity with frequency and (b) conductivity with concentration of (GO) NPs. Influence of GO NMs content on the electrical characteristics of (PVA-CS/GO) PNCs at 100 Hz.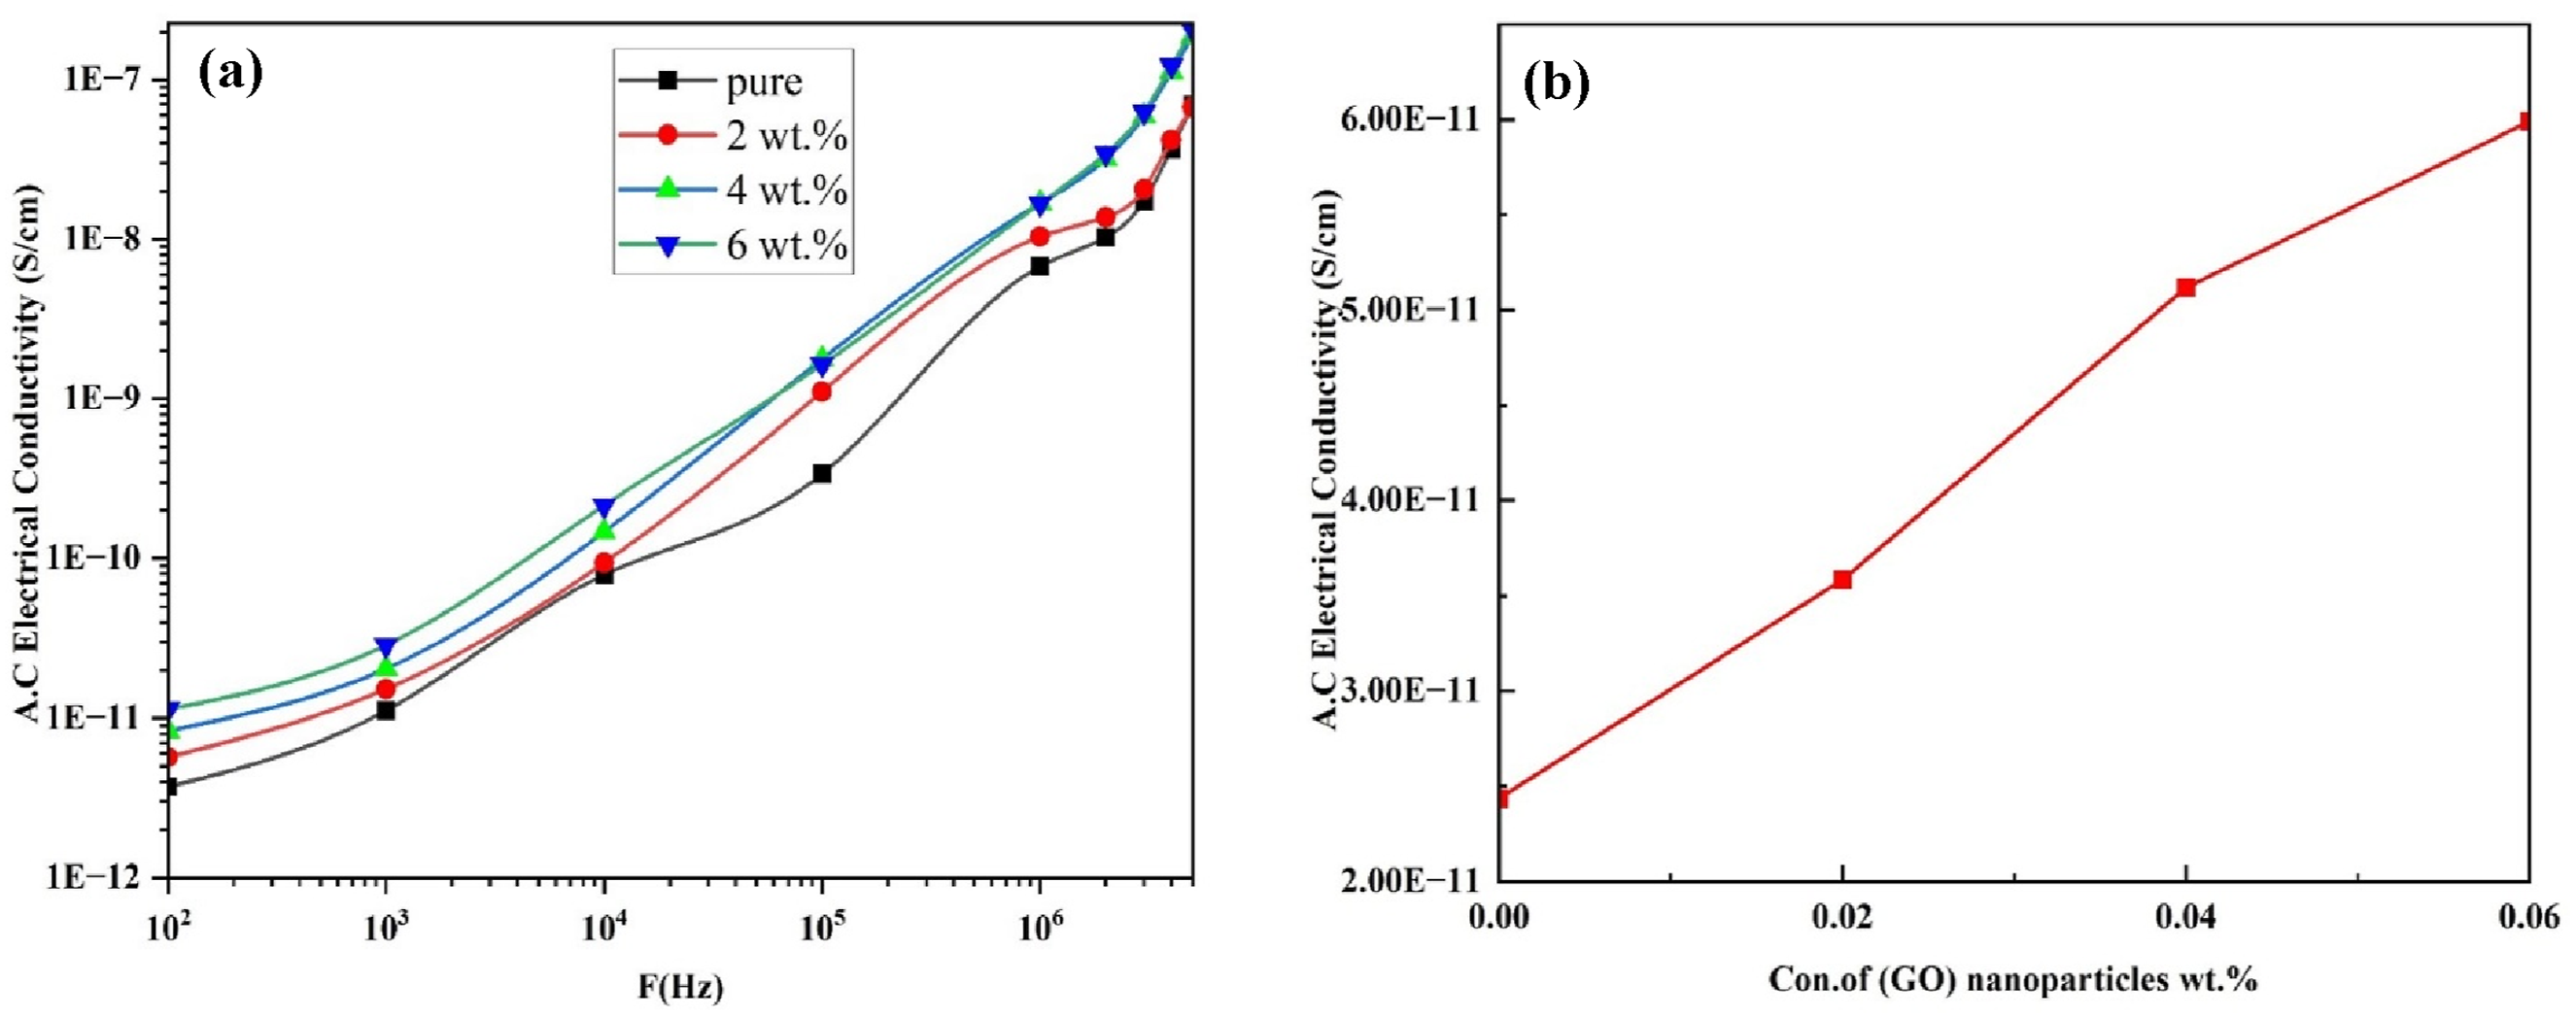
Application of (PVA-CS/GO) NCs as pressure Sensor
The concept of parallel capacitance refers to a material’s ability to store electrical charges, and this property varies with the applied pressure. Figure 11 presents the variation in parallel capacitance of (PVA-CS/GO) nanostructures as the applied pressure increases. The graph shows a progressive rise in capacitance with increasing pressure, which is attributed to the presence of multiple interconnected crystalline domains capable of retaining both positive and negative charges. Under normal conditions, these symmetric domains yield no net internal charge; however, when mechanical stress is applied, this symmetry becomes distorted. To compensate for this distortion, the domains undergo realignment, generating an induced current and consequently enhancing the capacitance through this mechanism.
89
Variation of parallel capacitance comparative with pressure for (PVA-CS/GO) NCs.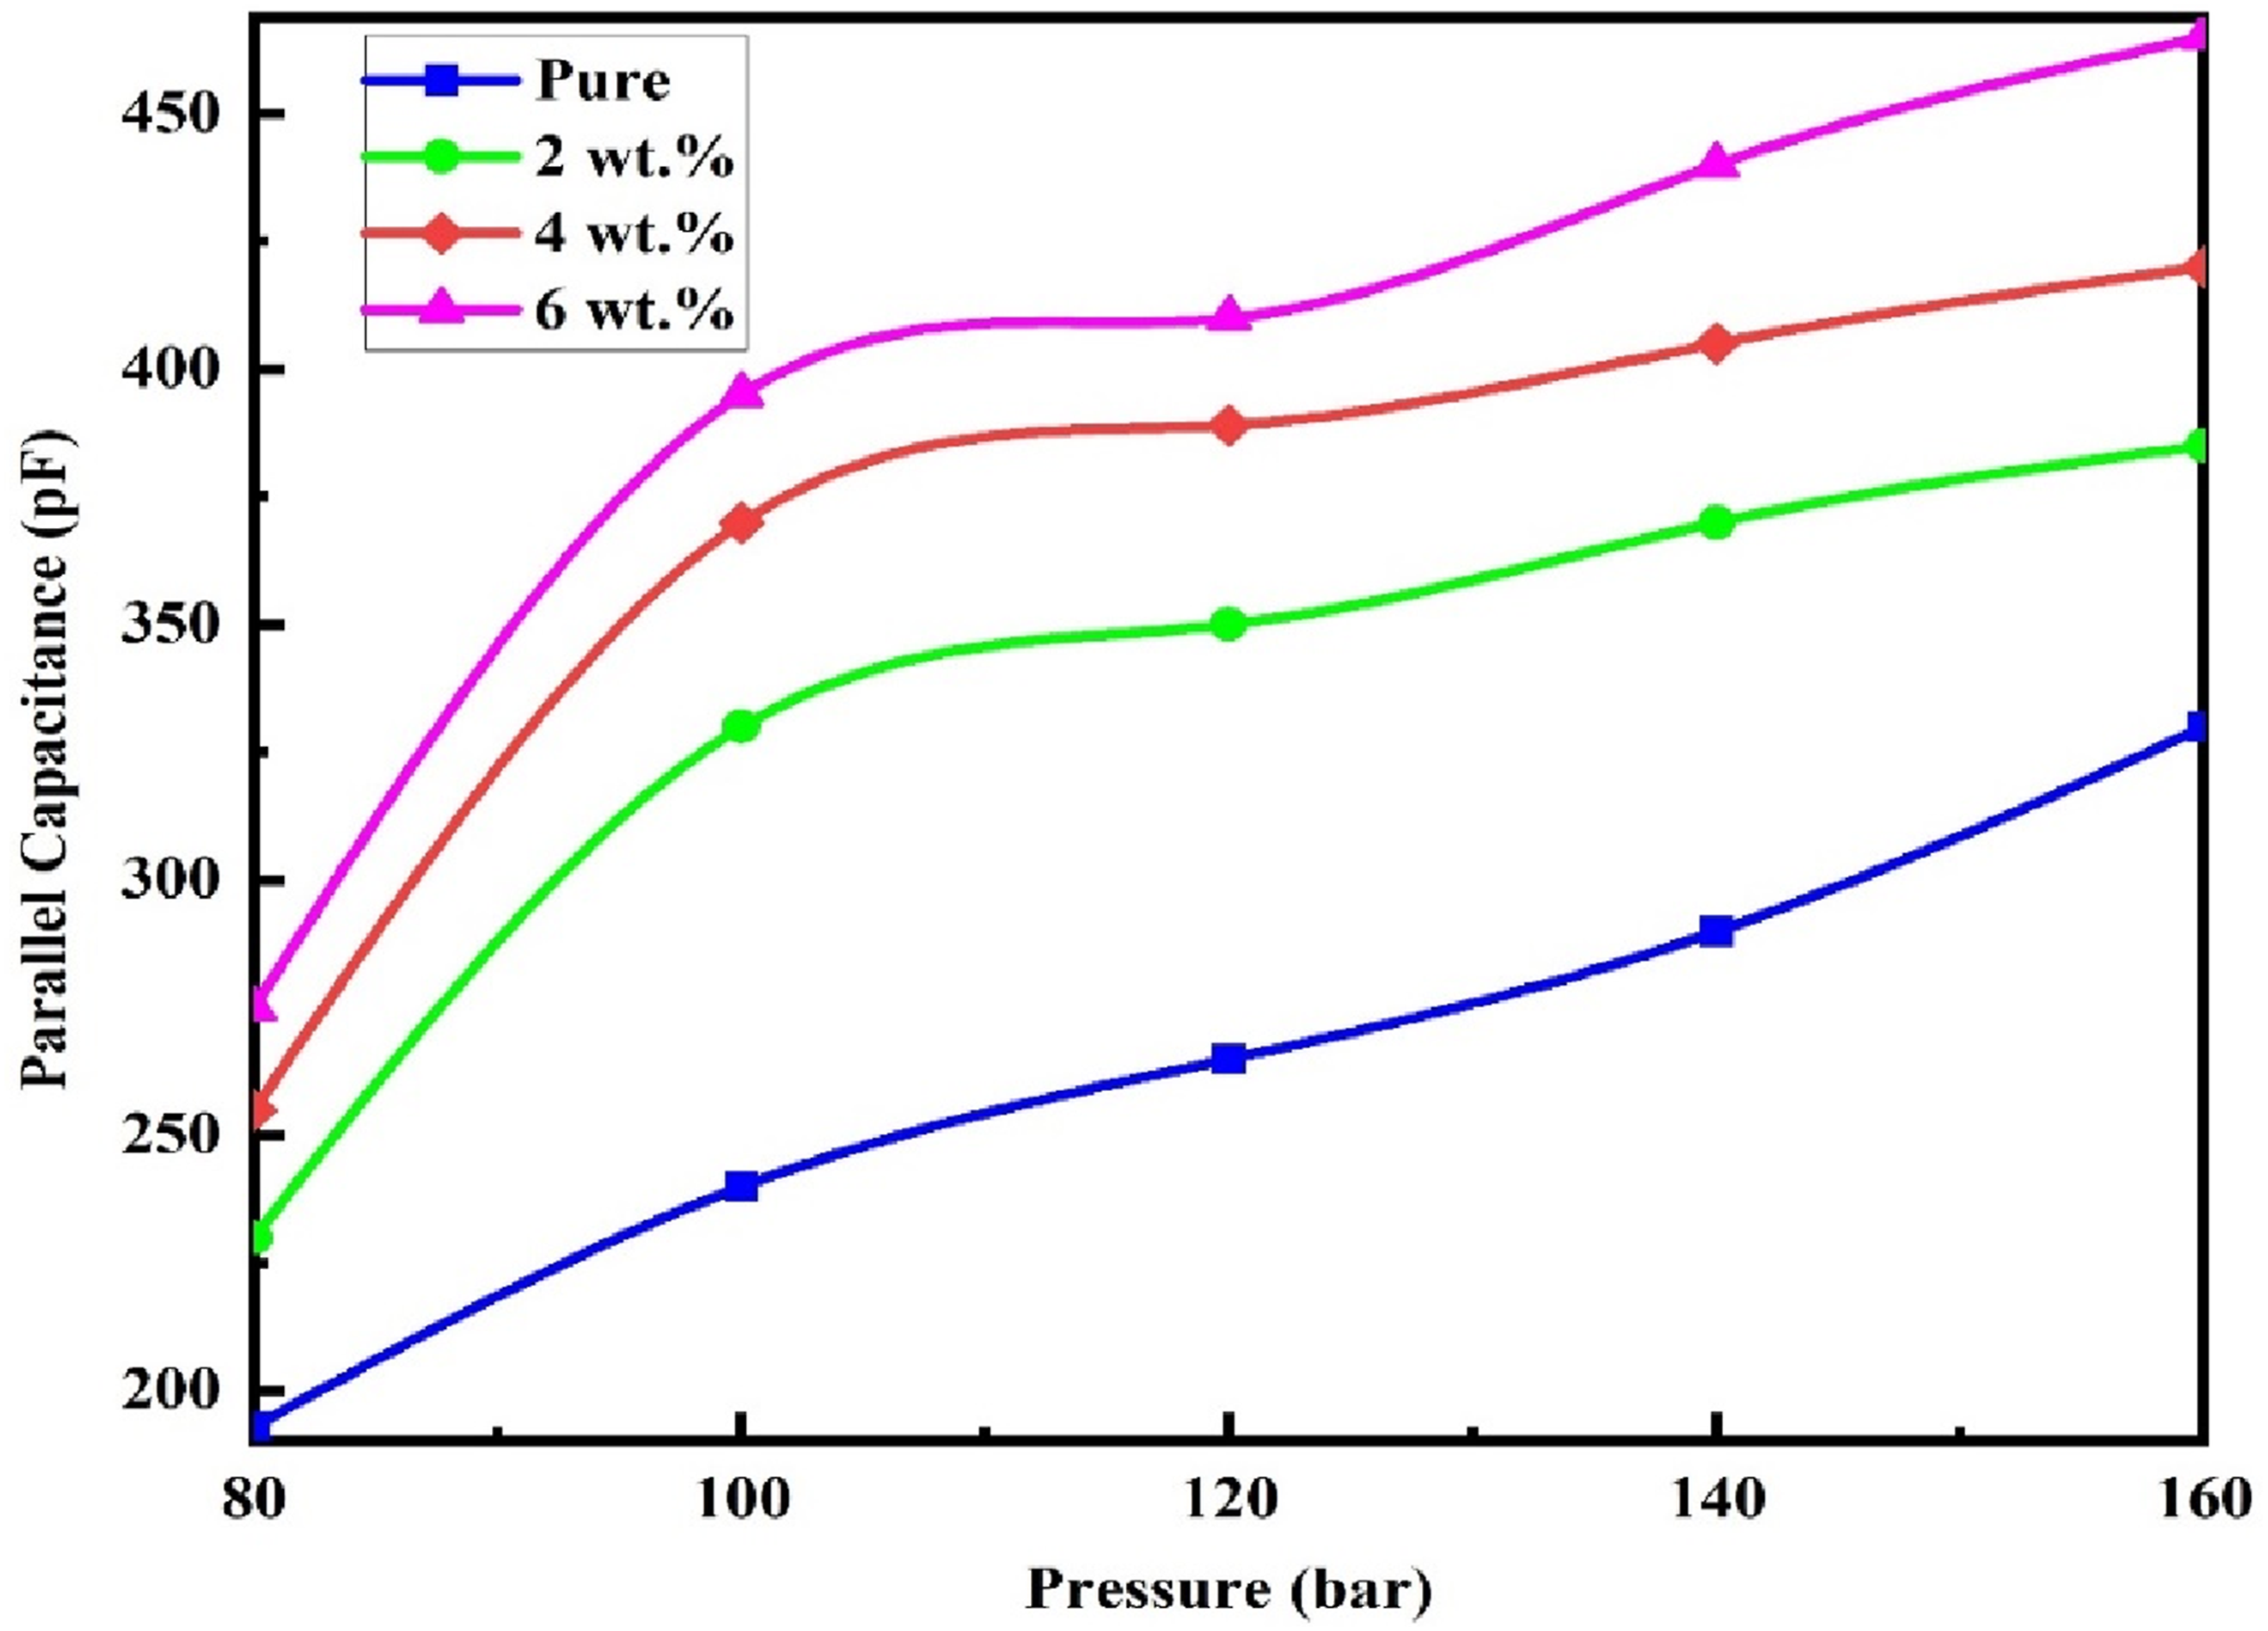
Figure 12 illustrates the influence of (GO) nanoparticles on the parallel capacitance (Cp) of (PVA-CS/GO) nanocomposites at an applied pressure of 80 bar. The results demonstrate that increasing the concentration of (GO) nanoparticles leads to a noticeable enhancement in the electrical capacitance of the nanocomposites. This improvement is likely associated with an increase in the density of charge carriers within the nanocomposite matrix.
90
The amount of (GO) nanoparticles incorporated into the sensitive layer plays a crucial role in determining the performance of (PVA-CS/GO) nanostructures, particularly the operational pressure range of the sensor, making them suitable for applications requiring high-pressure endurance. Effect of (GO) NPs weight ratios on the parallel capacitance of (PVA-CS/GO) films.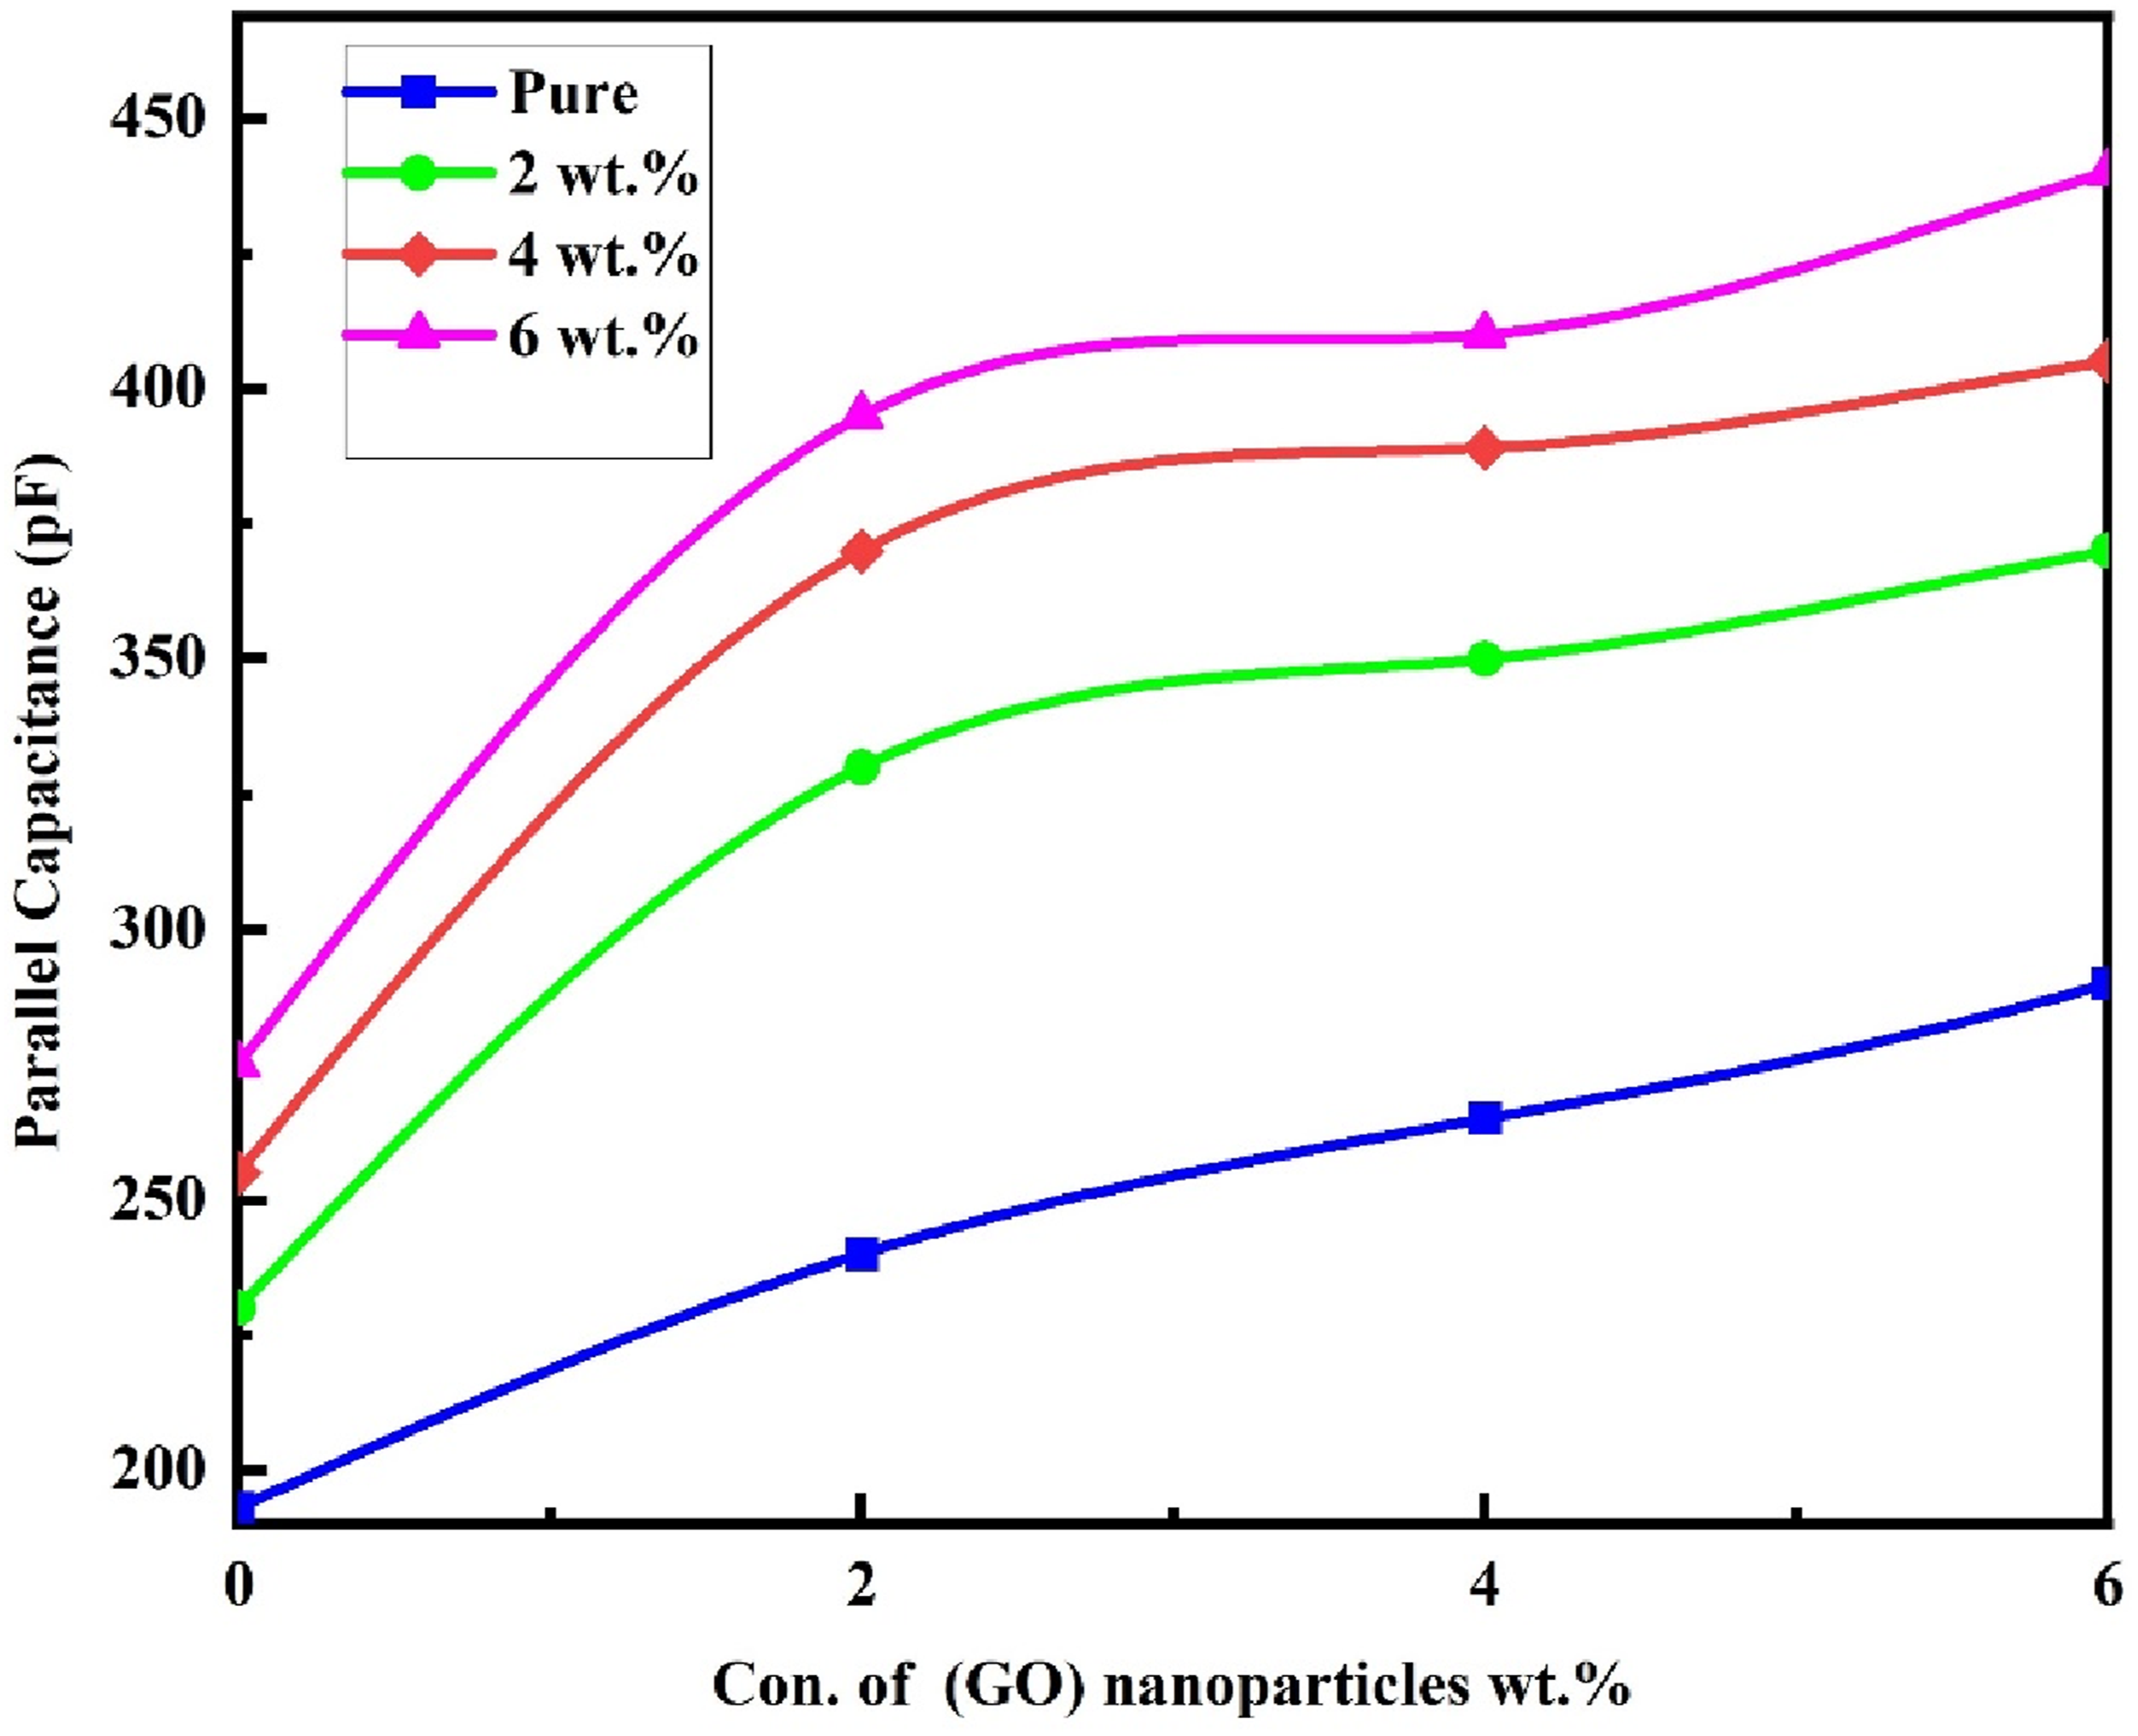
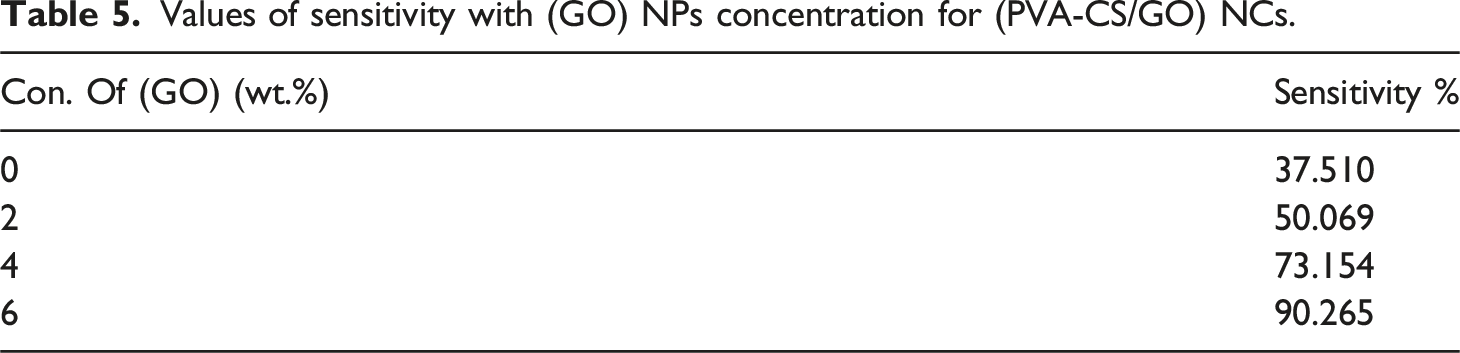
Figure 13 shows the effect of (GO) nanoparticles on the sensitivity of (PVA-CS/GO) nanocomposites. The plotted data clearly indicate that the sensitivity increases with the rise in (PVA-CS) nanoparticle content, as detailed in Table 5. This behavior is attributed to the presence of an internal dipole moment within the material structure.
91
Effect of (GO) NPs weight ratios on the sensitivity of (PVA-CS/GO) under a pressure of 80 bar. Values of sensitivity with (GO) NPs concentration for (PVA-CS/GO) NCs.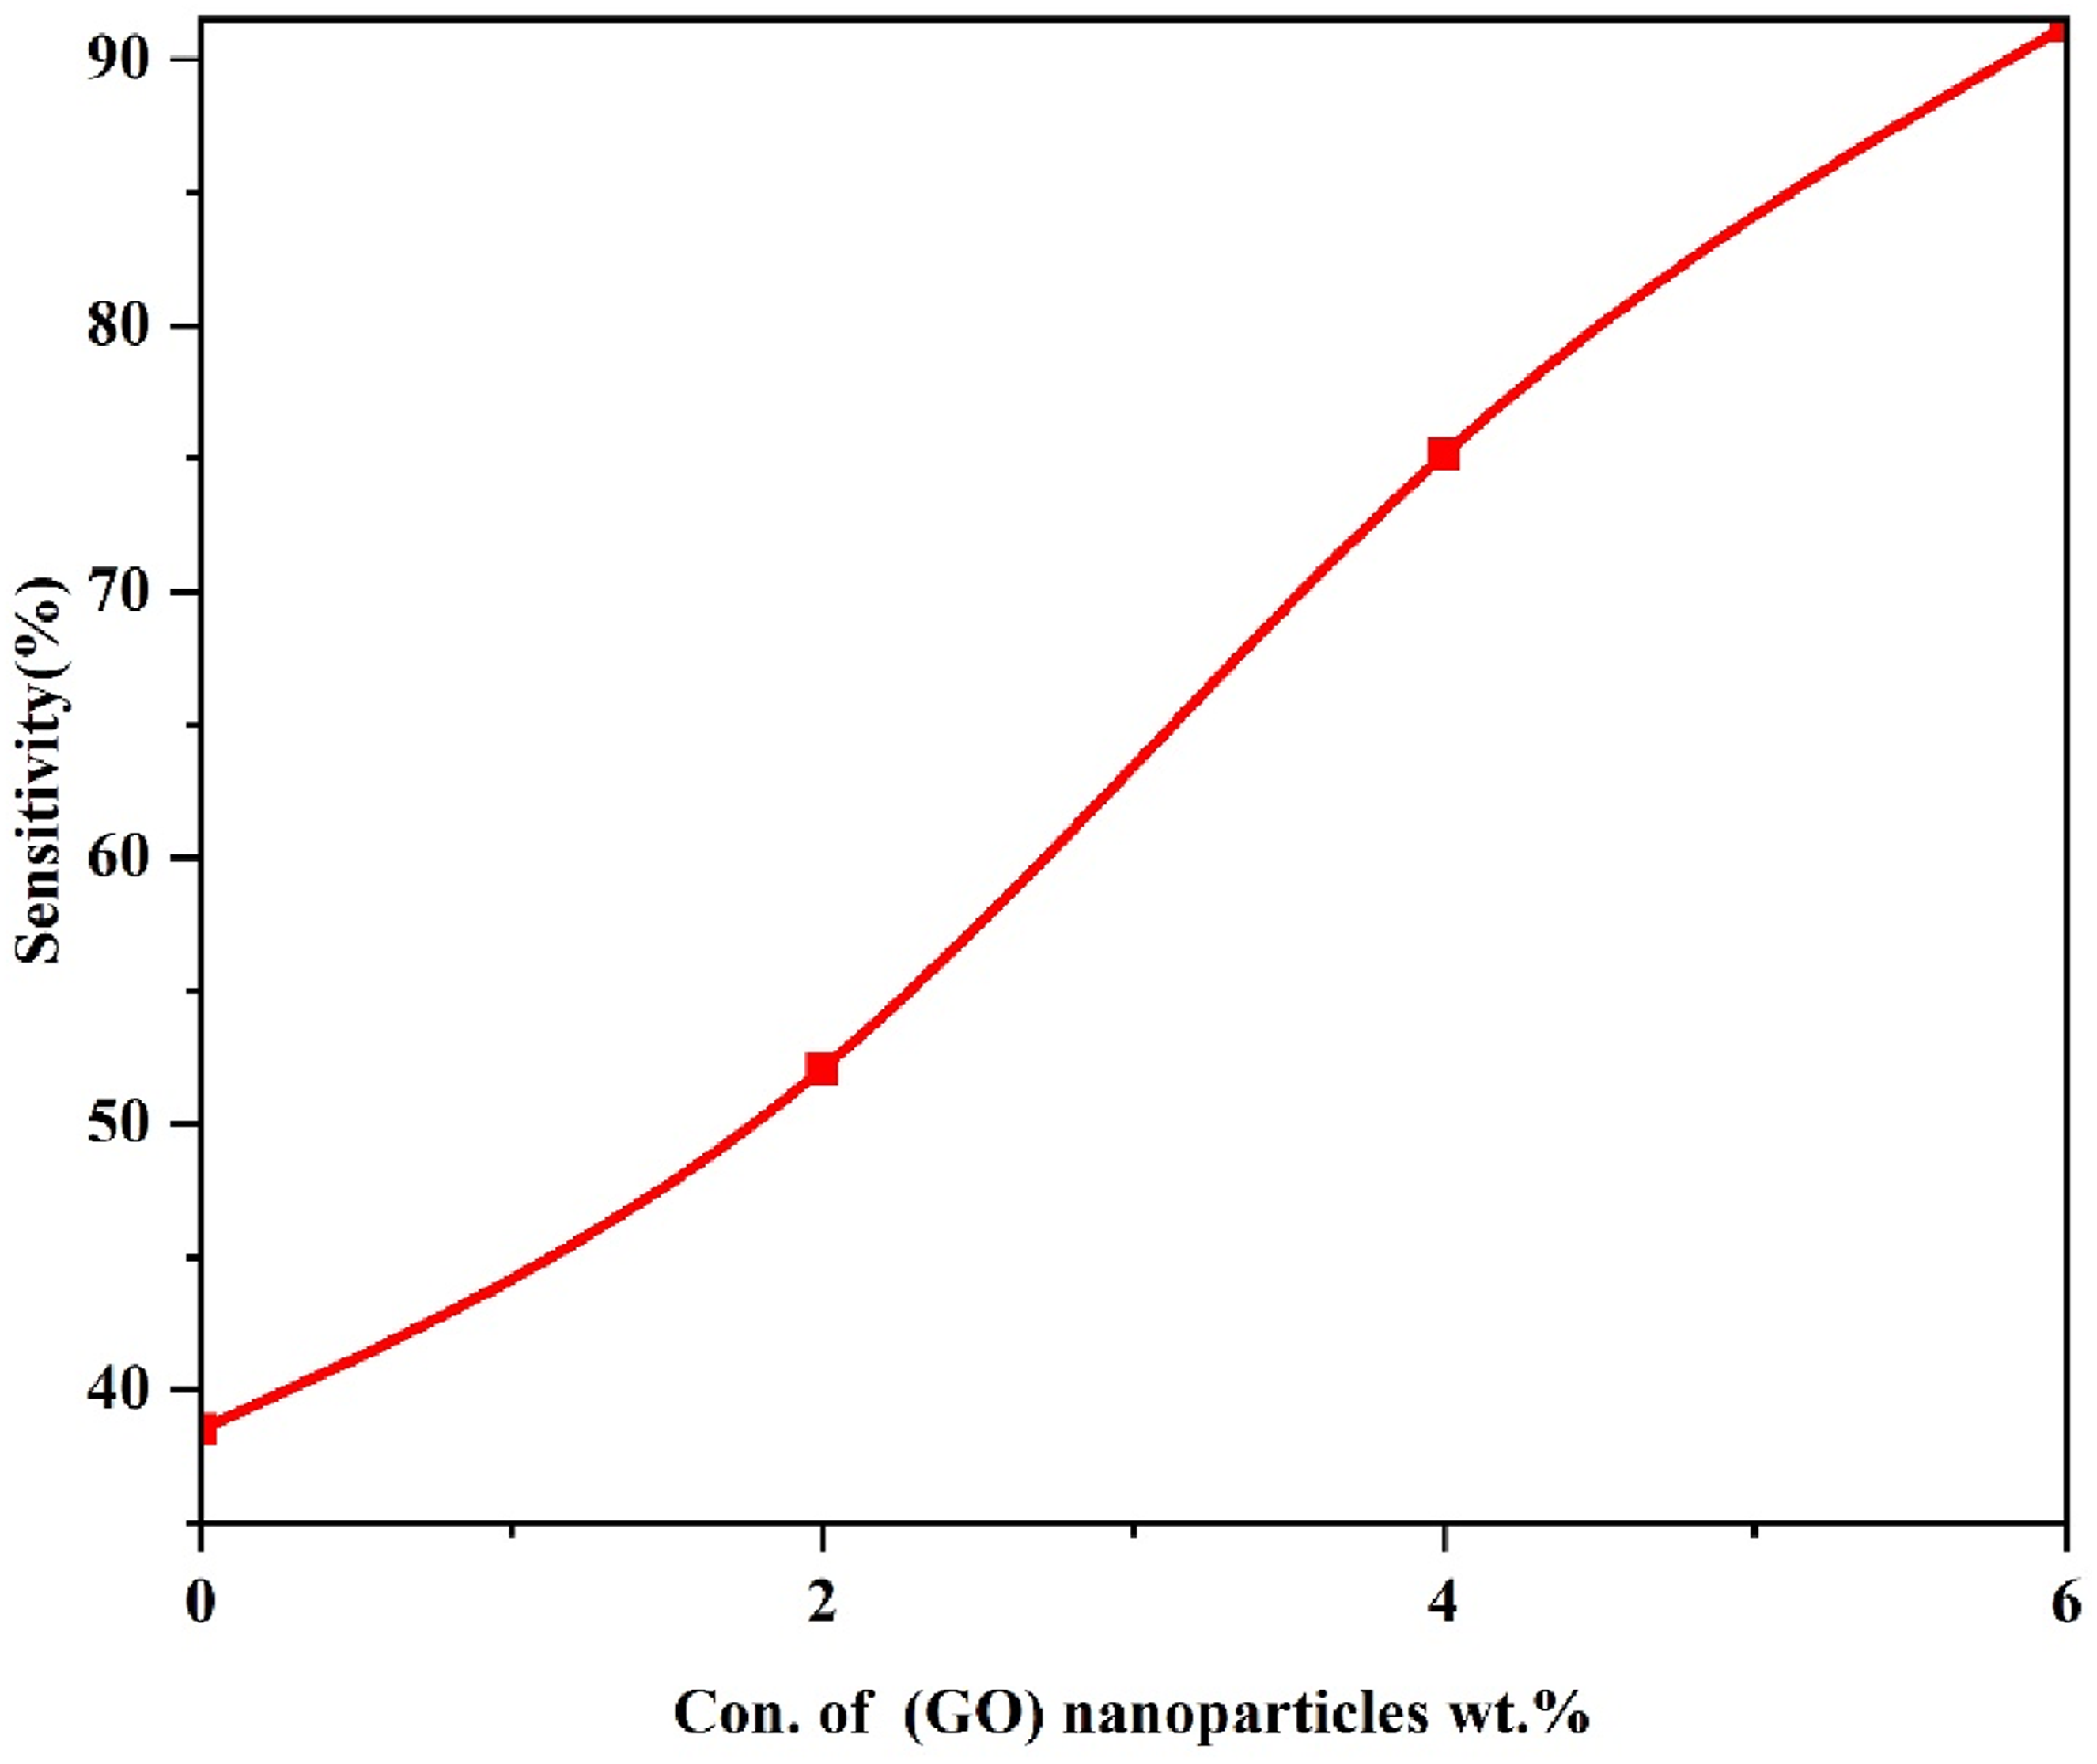
This work manufactured flexible nanocomposite films composed of (PVA-CS) blend and (GO) nanoparticles using the casting solution technique. FTIR spectra show a displacement in some bands and changes in the intensity of other bands. In addition, no chemical interaction exists between (GO) nanoparticles and pure PVA-CS. The optical microscope photos demonstrate a cohesive network of (GO) nanoparticles inside the PVA-CS polymer. The optical characteristics, such as absorbance, extinction coefficient, absorption coefficient, real and imaginary dielectric constants, and optical conductivity, correlate positively with more excellent ratios of (GO) nanoparticles. Adding 8 wt% (GO) nanoparticles to pure PVA-CS leads to a significant increase in absorbance, reaching around 2100% at a wavelength of 300 nm. The band gaps of (PVA-CS/GO) polymer nanocomposites reduced as the amount of nanofiller increased. The Urbach energy Eu,(χ(1)), (χ(3)), (n2) linear susceptibility, nonlinear susceptibility, and nonlinear refractive index, respectively, λo, εo, and no, show an enhancement with the incorporation of nanoparticles. Conversely, the energy associated with a single oscillator, Eoso, dispersion energy, Ed, and the mean oscillator strength demonstrate a reduction. The dielectric loss and dielectric constant decrease as the frequency increases, but the electrical conductivity increases. The dielectric constant, dielectric loss, and AC electrical conductivity rise when the (GO) concentration increases. Specifically, the dielectric constant grows from 1.100 to 1.804, dielectric loss rises from 0.421 to 1.105, and the AC electrical conductivity increases from 3.77 × 10⁻¹² to 1.91 × 10⁻¹¹ S/cm. At a filler concentration of 6 wt%, the Cs/Go nanocomposite films showed a remarkable increase in absorption of about 2100%, with pressure sensitivity reaching about 90%, highlighting their strong potential for flexible nanoelectronics and sensing applications.
Footnotes
Acknowledgements
Acknowledgements to University of Babylon.
Author contributions
All authors contributed to the study’s conception and design. Material preparation, data collection and analysis were performed by, Majeed Ali Habeeb, Jassim M. AL-Issawe, Haider J. Abd, Mamoun Fellah and Noureddine Elboughdiri. The first draft of the manuscript was written by Majeed Ali Habeeb and all authors commented on previous versions of the manuscript. All authors read and approved the final manuscript.
Declaration of conflicting interests
The authors declared no potential conflicts of interest with respect to the research, authorship, and/or publication of this article.
Funding
The authors received no financial support for the research, authorship, and/or publication of this article.
Ethical considerations
The research is not involving the studies on human or their data.
Data Availability Statement
Available.