
Abstract
The aim of the study is to investigate the physico-mechanical and flammability performance of a 3D-printed functionally graded composite (FGC) developed using iterated layer deposition of polyamide-carbon fibre (PA-CF) and polyamide-glass fibre (PA-GF) composite. The samples were fabricated with varying PA-CF and PA-GF iteration layers, starting with a unary layer (1 layer) and ending with a quaternion layer (4 layers). The shore D hardness and shrinkage test revealed that samples with 1 and 2 iterations of PA-CF and PA-GF layers exhibited the highest hardness of 71.3 ± 2 SHD and 71 ± 1.8 SHD, respectively, with the lowest shrinkage of 11.9 ± 1.01% and 11.9 ± 0.8%, respectively. Similarly, the same FGC exhibited the highest flexural stress (Fs) 31.2 ± 1.4 MPa and 32.9 ± 1.5 MPa and ultimate tensile stress (UTS) values of 28.70 ± 1.0 MPa and 27.37 ± 0.4 MPa, respectively. The selection of up to 3 iteratively applied layers of PA-CF and PA-GF was found to be optimal for developing FGC. The flammability analysis revealed that all the samples exhibited an HB rating, indicating comparable baseline flammability behaviour. Based on the obtained response, the study successfully addresses the existing research gap in PA-based multi-fibre 3D printing by systematically correlating the layer alternation strategy with interfacial performance and structural efficiency. The developed composite has strong potential for lightweight semi-structural applications, such as UAV structures, automobile interiors, customized tools, and load-bearing fixtures.
Introduction
Material extrusion (MEX)-based 3D printing has emerged as a prominent additive manufacturing (AM) method for fabricating complex geometries with higher material efficiency and precision. 1 In this context, Fused Deposition Modelling (FDM)/Fused Filament Fabrication (FFF) belongs to the category of MEX AM processes, which utilizes thermoplastics such as polylactic acid (PLA),2,3 acrylonitrile butadiene styrene (ABS), 4 polyethylene terephthalate (glycol modified) (PETG), 5 polycarbonate (PC), 6 polypropylene (PP), nylon/polyamide-6/12 (PA 6/12), Polyether ether ketone (PEEK), 7 high-density polyethylene (HDPE) 8 etc., in their neat, recycled or composite state to develop high-performance structures to be used for advanced applications. Among thermoplastic composites, fibre-reinforced composites are well-suited for 3D printing due to their superior properties, including a high strength-to-weight ratio, improved stiffness, and load-bearing capacity. These properties enable the composites to be a highly demanding material for structural and functional applications. The commonly used fibres that are reinforced in thermoplastics, either in chopped or continuous form, for 3D printing include carbon fibre (CF), 9 Aramid/Kevlar fibre (KF), 10 glass fibre (GF), 11 basalt fibre (BF), 12 and natural/plant-based fibres such as flax, jute, hemp, kenaf, and bamboo.13–15 These fibres are predominantly reinforced with PLA thermoplastic and have been extensively explored for their mechanical, thermal, and other properties due to their ease of processing with PLA. Additionally, these fibre reinforcements have undoubtedly provided PLA with superior properties. However, due to advancements in FDM 3D printing and the use of high-temperature service materials such as PA, PEEK, PETG, and PC, the potential of fibre reinforcement with these thermoplastics remains comparatively underexplored. This necessitates a systematic study on high-temperature thermoplastics reinforced with fibres to explore the structural and functional needs of industries. Furthermore, advances in multi-material AM have enabled the fabrication of structures/components using a single or multi-thermoplastic matrix reinforced with different types of fibres, allowing spatial tailoring of functional properties within the fabricated component. Such an approach offers a favourable path to strategically optimize material performance, minimizing material usage while maximizing structural efficiency.
Polyamide (PA) is a commonly used thermoplastic in many engineering applications due to its toughness, fatigue resistance, and chemical resistance, making it an ideal material for advanced high-performance composites. 16 When polyamide is reinforced with fibres, the resulting composite material exhibits improved stiffness, tensile strength, dimensional stability, and thermal resistance properties.17,18 Among the various fibre-reinforced PA composites, the CF-reinforced PA composite has emerged as a high-performance composite due to CF possesses high specific strength and modulus, while having a relatively low specific weight. At the same time, PA-GF composite is another PA-based composite that exhibited excellent stiffness, improved dimensional stability, enhanced thermal resistance, and superior cost-effectiveness compared to CF-based systems. Additionally, numerous studies have been conducted on the use of PA6 and PA12 as matrix materials, with different fibre variants as reinforcements, to explore the performance of 3D-printed composites. Yilmaz et al. 19 studied the thermal, thermomechanical, mechanical, and wear properties of 3D-printed PA6.6 reinforced with short CF and GF. The yield strength (YS) of neat PA6.6 decreased by 48% at 40°C and 73% at 60°C. In comparison, PA6.6-SCF showed reductions in YS by 40% and 60% at 40°C and 60°C, respectively, while PA6.6-SGF exhibited lower decreases of 33% and 48%, respectively. Radzuan et al. 20 investigated the printability of PA (Grade: PA2200) reinforced with 20 wt.% and 40 wt.% of CF powder (CFP). Higher CFP loading led to sample warpage and delamination. The sample with 20 wt.% of CFP loading exhibited a superior storage modulus in the range of 450 MPa-700 MPa. Additionally, the sample showed improvements in impact strength (IS) and shear strength (SS) by 500% and 50%, respectively, due to enhanced layer adhesion. Similarly, another study investigated the mechanical properties of 3D-printed PA6-CF (9% CF) composites at layer heights (LH) of 0.1 mm, 0.125 mm, and 0.2 mm and compared them with those of injection-molded (IMed) samples. It was found that the tensile properties of 3D printed PA6-CF samples were lower than those of IMed samples. 21 Su et al. 22 conducted a comprehensive investigation on the use of recycled/reclaimed CF (rCF) (10, 20, 30 and 40 wt.%) with PA6 to develop a filament for FDM 3D printing. It was found that samples containing 20% and 30% rCF exhibited enhanced mechanical properties. The PA6-20% rCF samples exhibited enhanced tensile strength (TS) and Young’s modulus (E) of 175% and 329%, respectively, due to a high degree of rCF alignment. Additionally, compared with neat PA, this composite exhibited a higher degree of crystallinity and lower porosity. Töllner and Seitz 23 used PA6 pellets reinforced with 30 wt.% GF for the 3D printing of the composite using the fused granular fabrication (FGF) technique. FGF is a pellet-based MEX 3D printing process that directly utilizes thermoplastic granules for part fabrication, rather than converting them into feedstock filament. It was found that the selection of optimum 3D printing parameters resulted in enhanced tensile properties of the composite, with the composite exhibiting E and ultimate tensile strength (UTS) values of 9 GPa and 139 MPa, respectively, which are comparable to those of the IMed samples, which exhibited E and UTS values of 9.5 GPa and 170 MPa, respectively. Similarly, another study explored the FDM 3D printing of nylon 6 reinforced with 20% of GF and found an improvement in TS by 45% compared to neat nylon 6 samples. 24 Alarifi 25 evaluated the comparative flexural and dynamic mechanical performance of PA-CF and PA-GF samples fabricated at various raster angles (RAs) of 0°, 45°, and 90°. It was observed that the PA-CF and PA-GF samples fabricated at 0° RA exhibited the highest flexural strengths (Fs) of 50.1 MPa and 145.8 MPa, respectively, with E values of 3914 MPa and 2837.9 MPa, respectively. PA-GF exhibited improved DMA properties compared to PA-CF, owing to the excellent interface between PA and GF. Ghabezi et al. 26 investigated the mechanical performance of a 3D-printed PA6 composite using PA6/chopped CF as the matrix material, reinforced with continuous carbon fibre (CCF), Kevlar fibre (KF), and high-strength, high-temperature (HSHT) GF. The samples were aged to characterize the effect of long-term exposure to salt water on their mechanical properties. After 1 year of saltwater aging, the unreinforced PA6/CF sample exhibited the highest mechanical degradation, with reductions in TS and Fs of 33.54% and 63.47%, respectively. The PA6/CF/CCF sample exhibited improved durability with a reduction in TS and Fs by 28.46% and 18.73%, respectively.
The observed advantages of PA-CF and PA-GF could form the basis for a novel hypothesis to develop a functionally graded composite (FGCs). In a broader context, researchers have explored multi-material composite (MMC) 3D printing using various 3D printing thermoplastics and their composites, demonstrating the feasibility of spatially combining distinct reinforcements to develop FGCs. These studies consistently report improvements in load transfer, damage tolerance, and application-specific performance through hybrid materialization. Nasution et al. 27 investigated the flexural performance of 3D-printed PLA/ABS/HIPS MMC via a multi-nozzle system. The MMCs were fabricated at a different set of 3D printing process parameters, including LH, RA, raster width (RW), build orientation, printing speed (v), infill density (ρ) and material sequence. It was found that the ABS configuration exhibited the highest Fs of 64.96 MPa, whereas PLA-faced laminates, such as PAP, displayed brittle fracture and lower strain-to-failure. Kumar et al. 28 developed MMC using PLA and bio-compatible PA reinforced with titanium dioxide (TiO2) for biomedical applications. Mishra and P Senthil 29 predicted the in-plane stiffness of PLA/PLA-Carbon black (CB) (PLA/PLA-CB) MMC developed at different RA using classical laminated theory (CLT). It was found that the MMC developed at the CLT model exhibited better mechanical performance, with in-plane E of 1807.64 MPa and a mean UTS of 32.65 MPa. Similarly, another study explored the mechanical and tribological performance of 3D-printed PLA and PLA-Cu MMCs (PLA-Cu) doped with copper powder. The developed MMC was further post-processed using a novel salt remelting strategy. The results revealed that the MMC achieved a 14% improvement in TS, which increased to 16% after post-processing. 30 Utz et al. 31 investigated the tensile and flexural properties of 3D-printed sandwich-type composites made of polypropylene (PP) and GF-filled PP (PP-GF). It was found that the developed MMC exhibited the E and TS values between 500-2910 MPa and 18-43 MPa, respectively. Additionally, the MMC exhibited the flexural moduli (Ef) and Fs between 680 and 3180 MPa and 25 and 65 MPa, respectively. Despite the excellent outcomes reported for FGC 3D printing, the development and systematic investigation of PA-based FGCs, especially integrating PA-CF and PA-GF within a single printed architecture, remain extremely limited in the existing literature, thereby underscoring a critical research gap that this study seeks to address.
Furthermore, from the literatures it haven be inferred that the 3D printing of MMC has gained attention due to its ability to spatially tailor material properties within a single component. Unlike single-material fabrication, MMC 3D printing enables localized reinforcement with functionally graded architectures, and performance-driven material usage, which are highly beneficial for lightweight structural applications. However, the incorporation of multiple fibre reinforced thermoplastic within a single structure possesses several critical challenges including poor interfacial bonding between dissimilar materials, mismatch in thermal expansion coefficients during cooling, residual stress accumulation, weak interlayer fusion at transition zones, and the formation of voids or unfused regions during the print-pause-print process. These factors significantly influence dimensional stability, load transfer efficiency, and long-term mechanical reliability. Therefore, systematic investigation into the interfacial behaviour, optimal layer alternation strategy, and structure–property relationship of multi-material PA-based composites remains essential.
Therefore, this study addresses the above-mentioned challenges by systematically evaluating the effect of iterative PA-CF and PA-GF layer deposition on the physico-mechanical and flammability performance, with the objective of identifying an optimal reinforcement configuration that enhances structural efficiency while minimizing interfacial defects. Furthermore, the use of PA6 as a common polymer matrix for both CF and GF reinforcements provides a distinct advantage in multi-material printing, as the chemical compatibility and similar melt-processing behaviour promote improved interfacial adhesion, reduced thermal mismatch during cooling, and enhanced interlayer consolidation. The proposed PA-CF/PA-GF hybrid architecture strategically integrates the high specific strength and modulus of CF with the superior stiffness, dimensional stability, thermal resistance, and cost-effectiveness of GF. This approach enables functionally aligned, localized reinforcement, leading to an optimized strength-to-weight ratio, efficient material utilization, and improved structural performance. At last, the work addresses a critical research gap in PA-based multi-fibre additive manufacturing and demonstrates the potential of multi-material MEX-based 3D printing for developing high-performance, application-oriented composite structures. Since fibre-reinforced PA composite is widely used in lightweight semi-structural applications such as UAV mounting brackets, drone frame connectors, automotive interior supports, and customized tooling fixtures, which require moderate TS and FS, along with good dimensional stability, rather than ultra-high structural performance. Therefore, the present PA-CF/PA-GF functionally graded architecture is also evaluated with reference to such application-oriented mechanical requirements.
Materials and Methodology
Materials
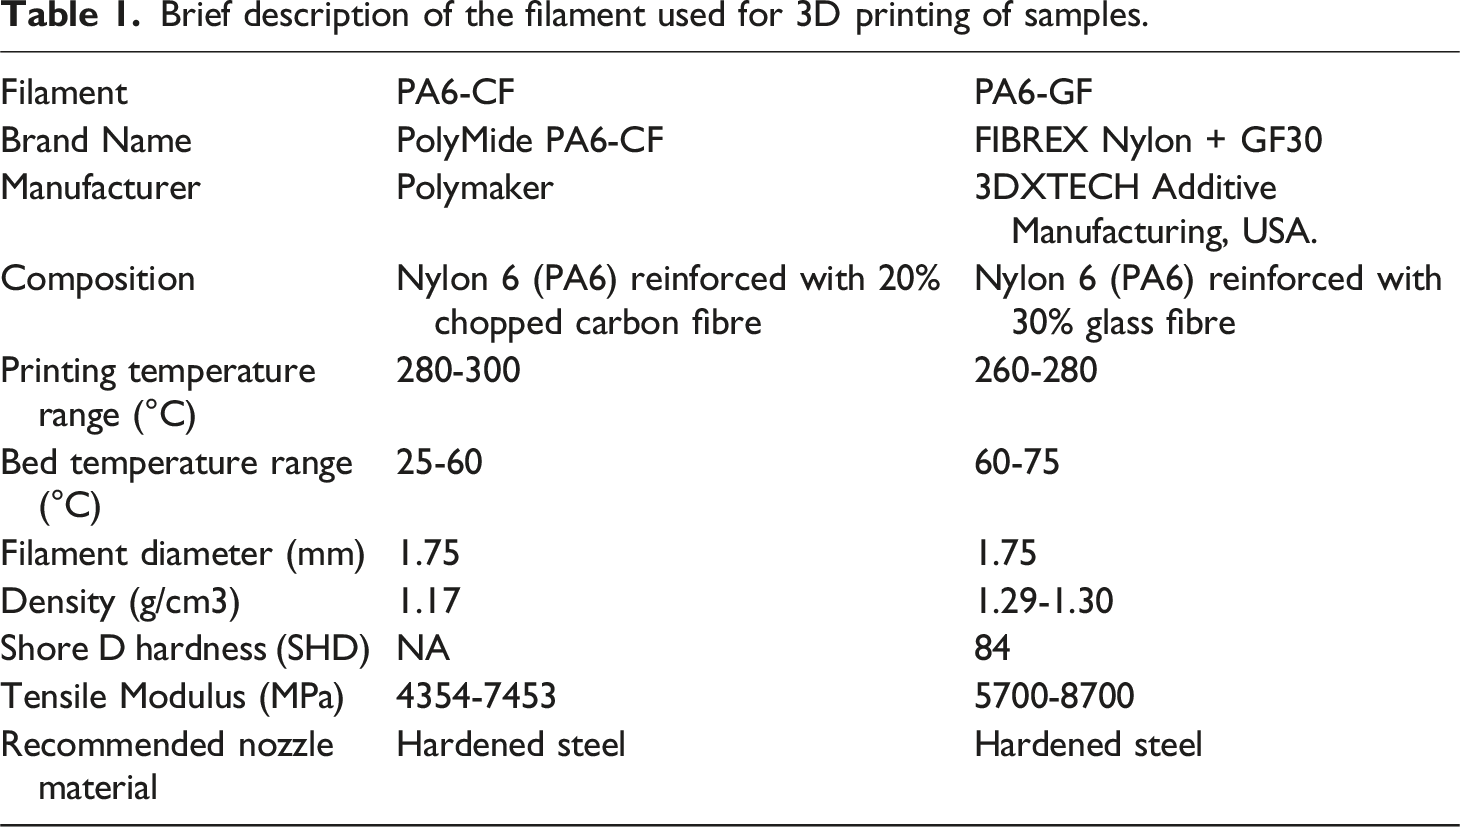
Brief description of the filament used for 3D printing of samples.
3D Printing
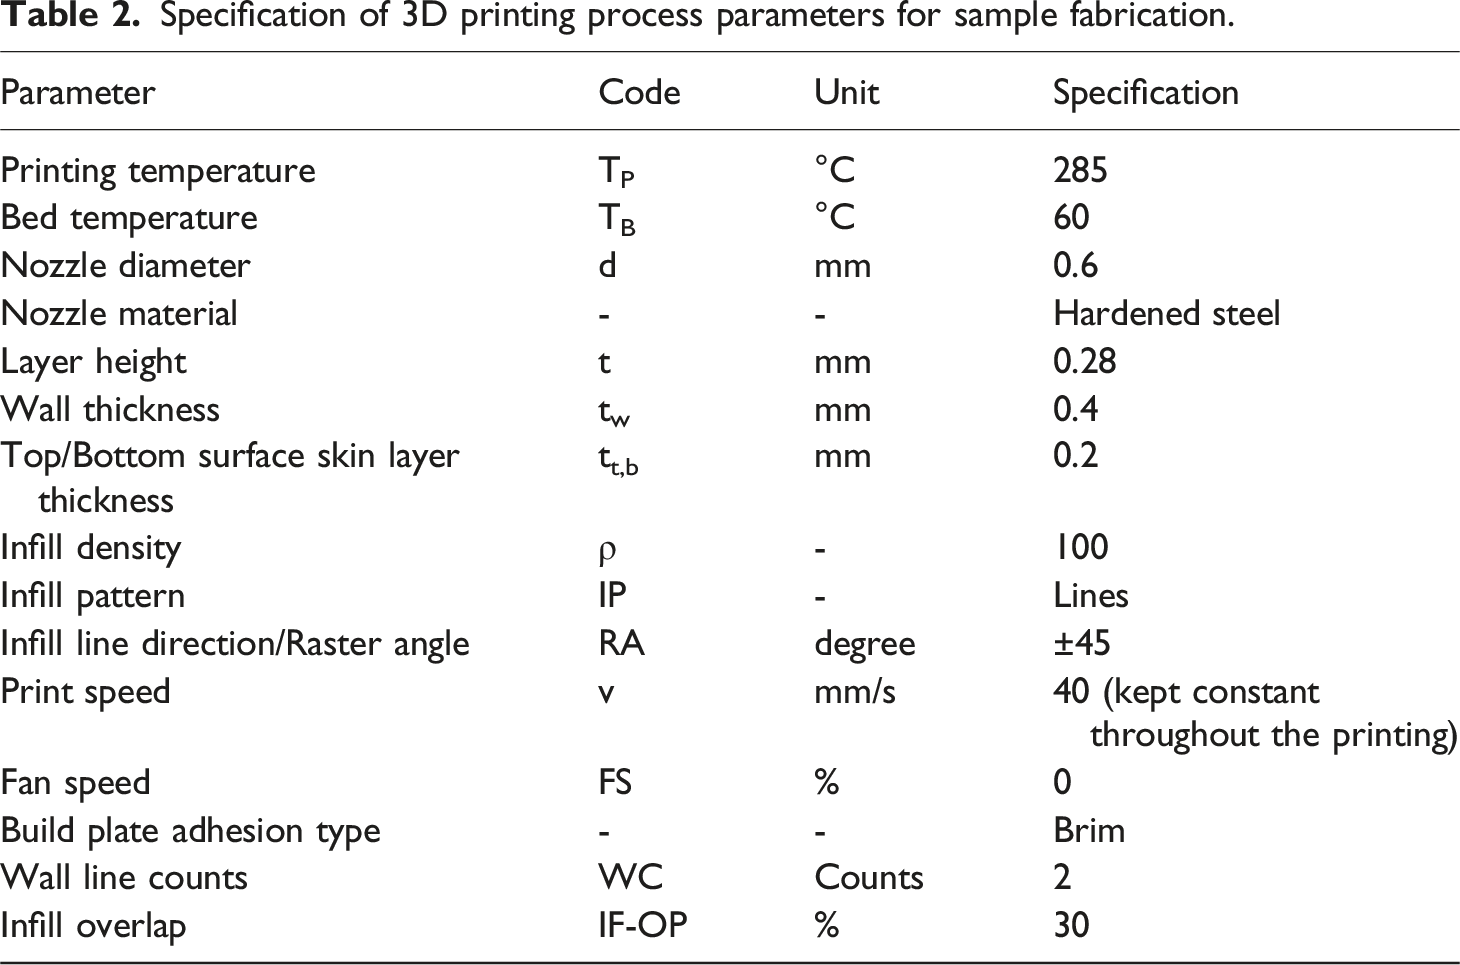
Specification of 3D printing process parameters for sample fabrication.
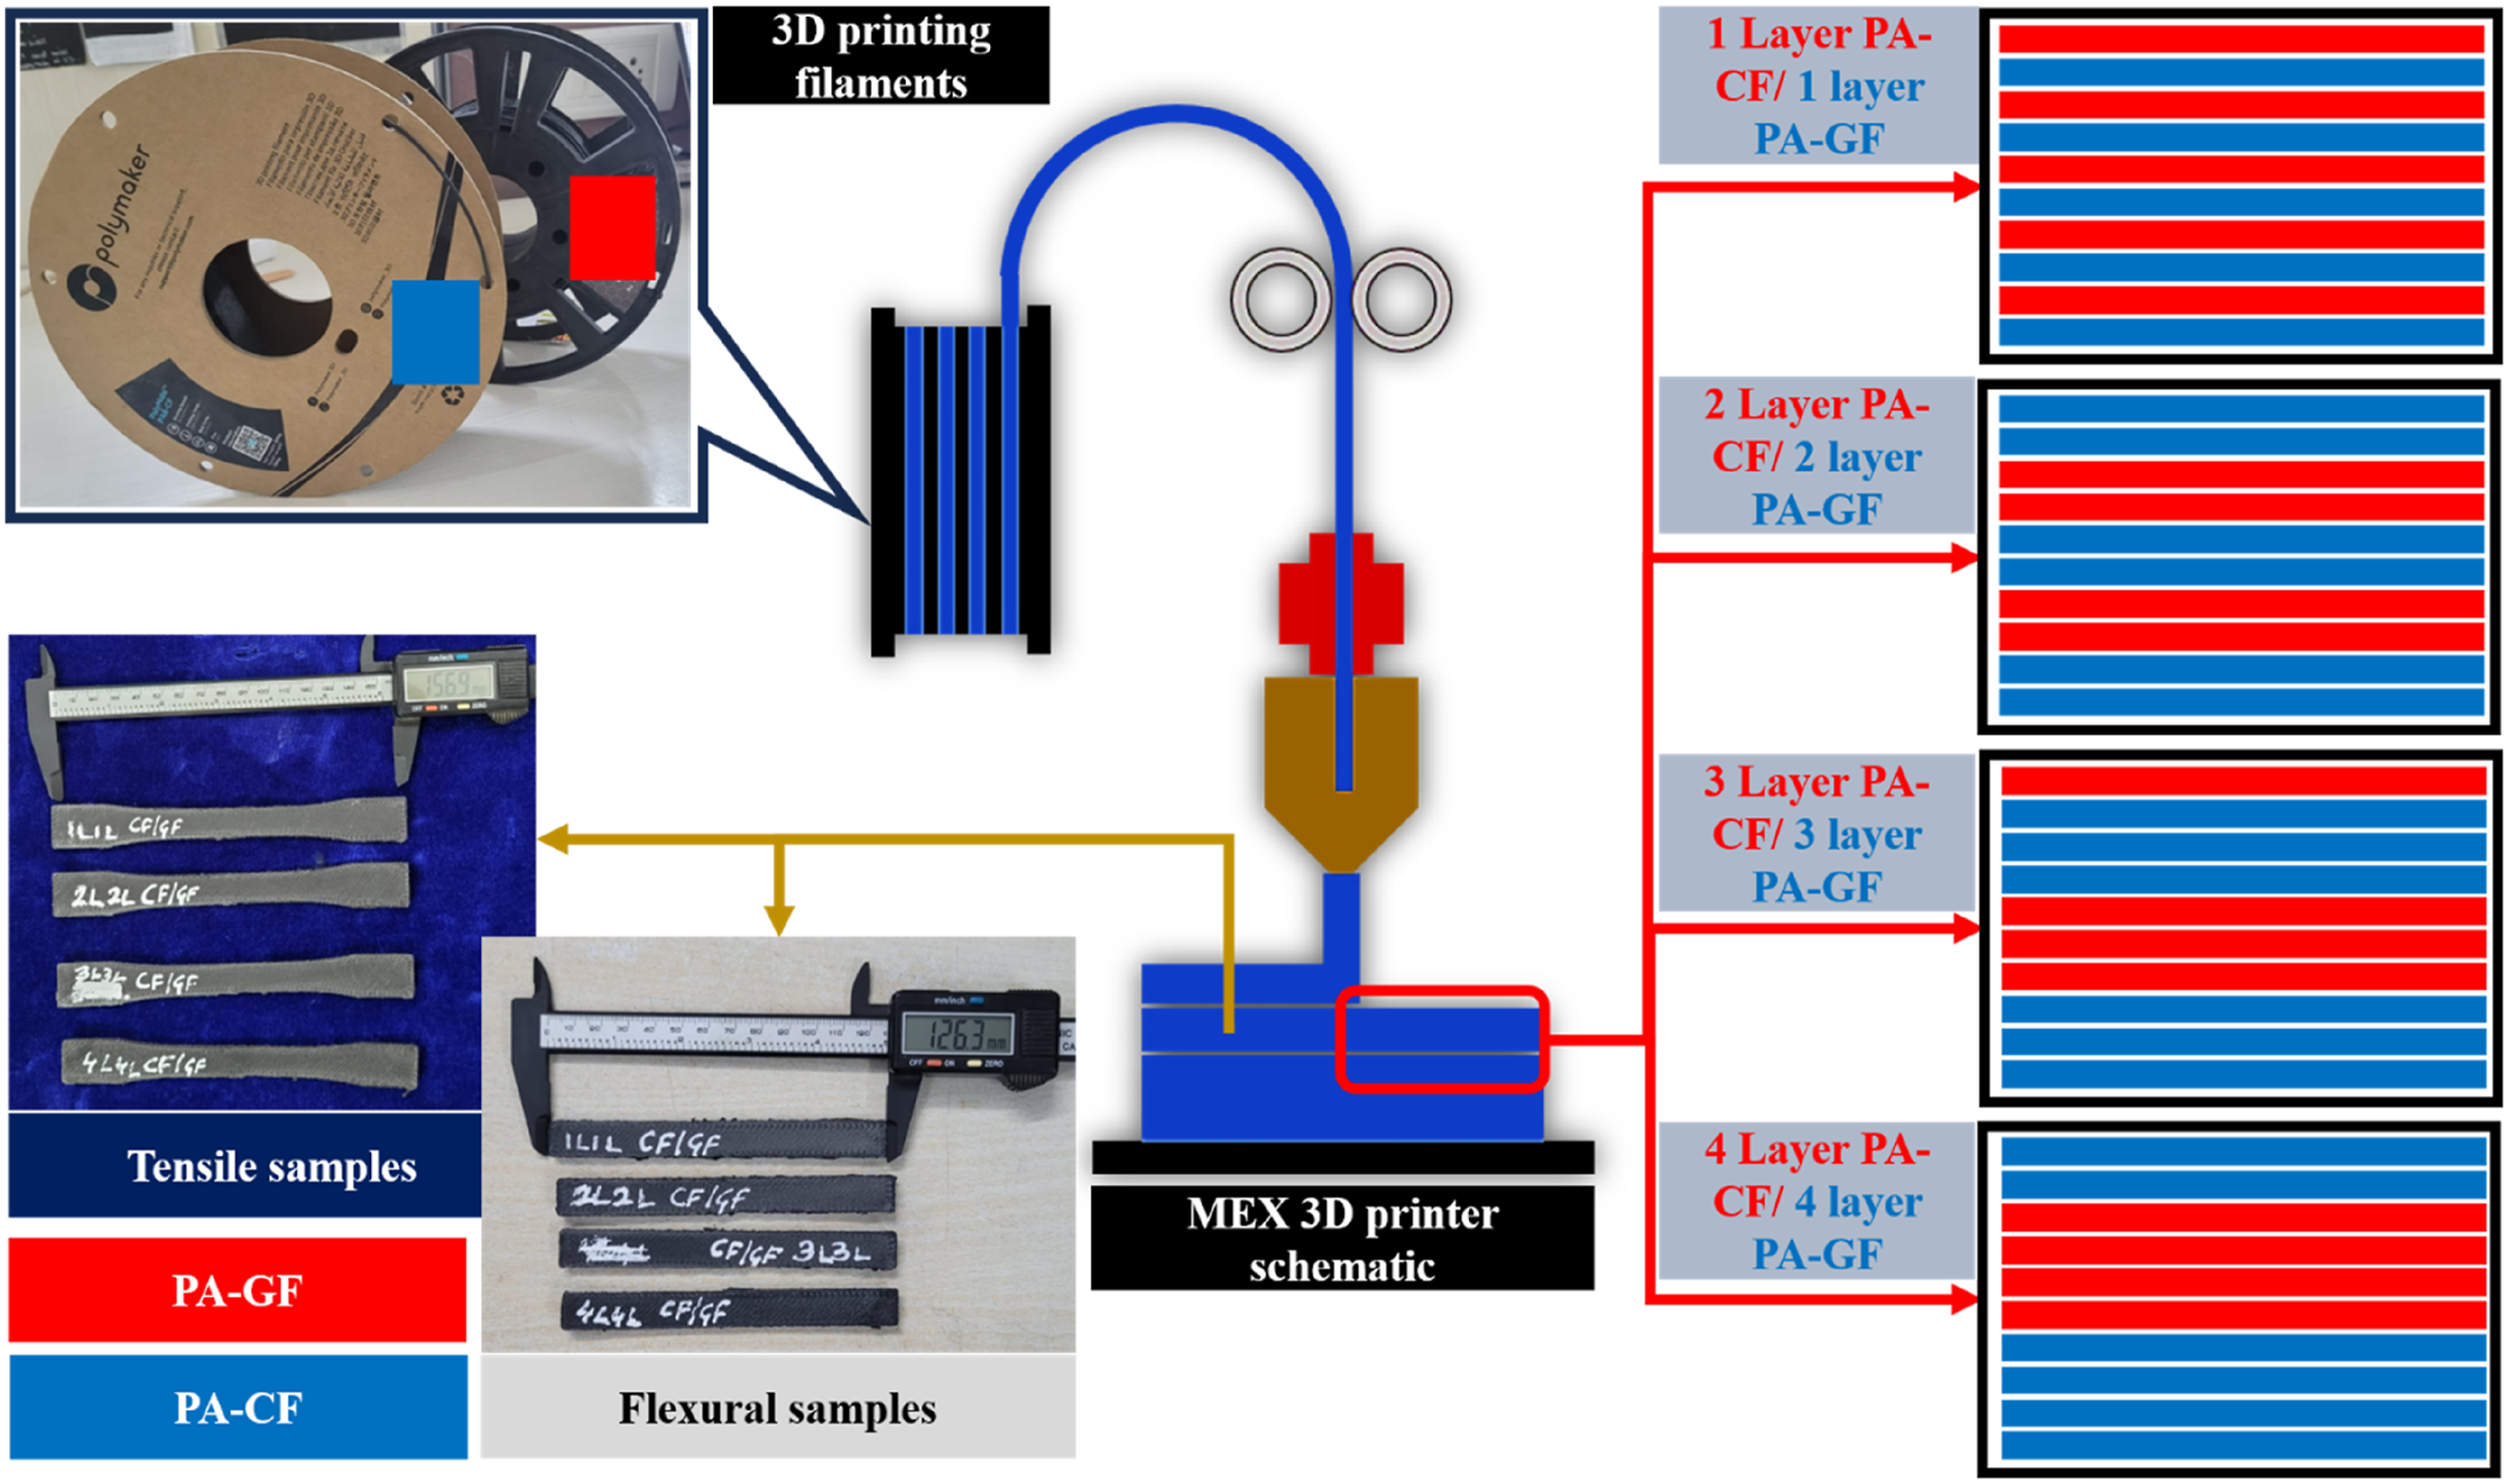
Schematic illustration of the 3D printing process via the print-pause-print method.
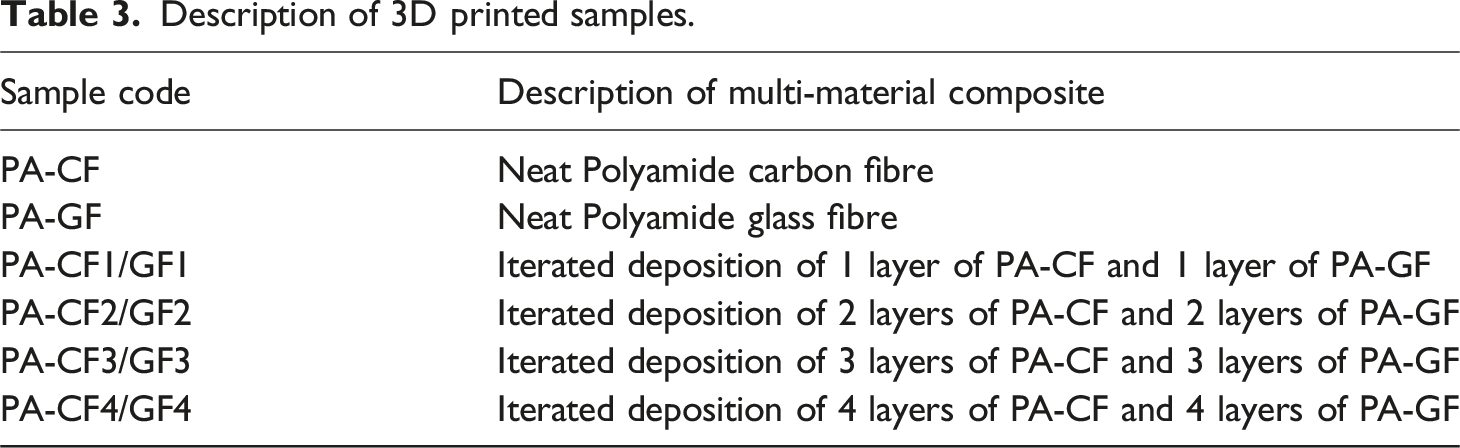
Description of 3D printed samples.
Shore-D Hardness
The hardness test was conducted using a Shore D durometer following ASTM D2240 standard. The test was conducted on a cuboid sample fabricated with dimensions of 25 mm × 25 mm × 6.0 mm. The samples were rested on a rigid horizontal surface while the indenter of the durometer was pushed perpendicularly over the sample surface by the gradual application of manual pressure until the entire indenter gets into the sample. The hardness was noted after 15s of indentation. At least five hardness readings were taken for the test specimen at different points, ensuring that values were never taken near edges or surface defects. The average was then calculated and reported as the Shore D hardness of the specimens.
Shrinkage
The dimensional stability of the fabricated samples was evaluated using the warpage measurement method, as specified in ASTM D6484. The sample of dimension 125 mm × 12.7 mm × 3.2 mm was fabricated for the test. The actual size specimens were measured using a vernier calliper, and they were compared with the dimensions of the original CAD model. The testing procedure was performed for five specimens, and the average value was reported. The percentage of warpage was calculated using the following equations (1)–(4).32,33


Where, SL, SB and SH correspond to specimen shrinkage along its length, breadth, and height, respectively; LC, BC and TC correspond to length, breadth, and height of the CAD model; and LM, BM and TM correspond to measured length, breadth, and height of the specimens. It should also be noted that the value of SL, SB and SH in equation 4 represent the linear shrinkage rates for each of the three dimensions of the 3D printed cuboid and are expressed as a decimal (if SL (%) = 2% then in equation 4 it will be 0.02).
Flexural Test
The flexural performance of the PA-GF/CF composites was evaluated using a 50 kN Universal Testing Machine (UTM; H50 KL, Tinius Olsen) in accordance with ASTM D790. Rectangular specimens with dimensions of 125 mm × 12.7 mm × 3.2 mm were fabricated and subjected to 3-point bend tests with a support span of 55 mm. After ensuring the sample’s firmness on the support, a point load with a displacement rate of 1 mm/min was applied to the sample, and its flexural properties were recorded. The test was conducted in a room conditioned at 23 ± 2°C and 50 ± 5% RH prior to testing. Three specimens were tested for each composition to ensure repeatability, and the average values, along with the standard deviation (SD), were reported.
Tensile Test
A tensile test was performed using a 50 kN Universal Testing Machine (UTM; H50 KL, Tinius Olsen). ASTM D638 type I specimens with a gauge length of 57 mm were fabricated for the test. The sample was placed between the grips of the crosshead, and a crosshead displacement of 5 mm/min was applied for the test. To prevent sample slippage during elongation, the sample ends were glued with high-friction sandpaper. The tests were carried out in a controlled environment of 25°C and 50% RH. Three specimens for each composition were tested, and their average values were reported.
Flammability Test
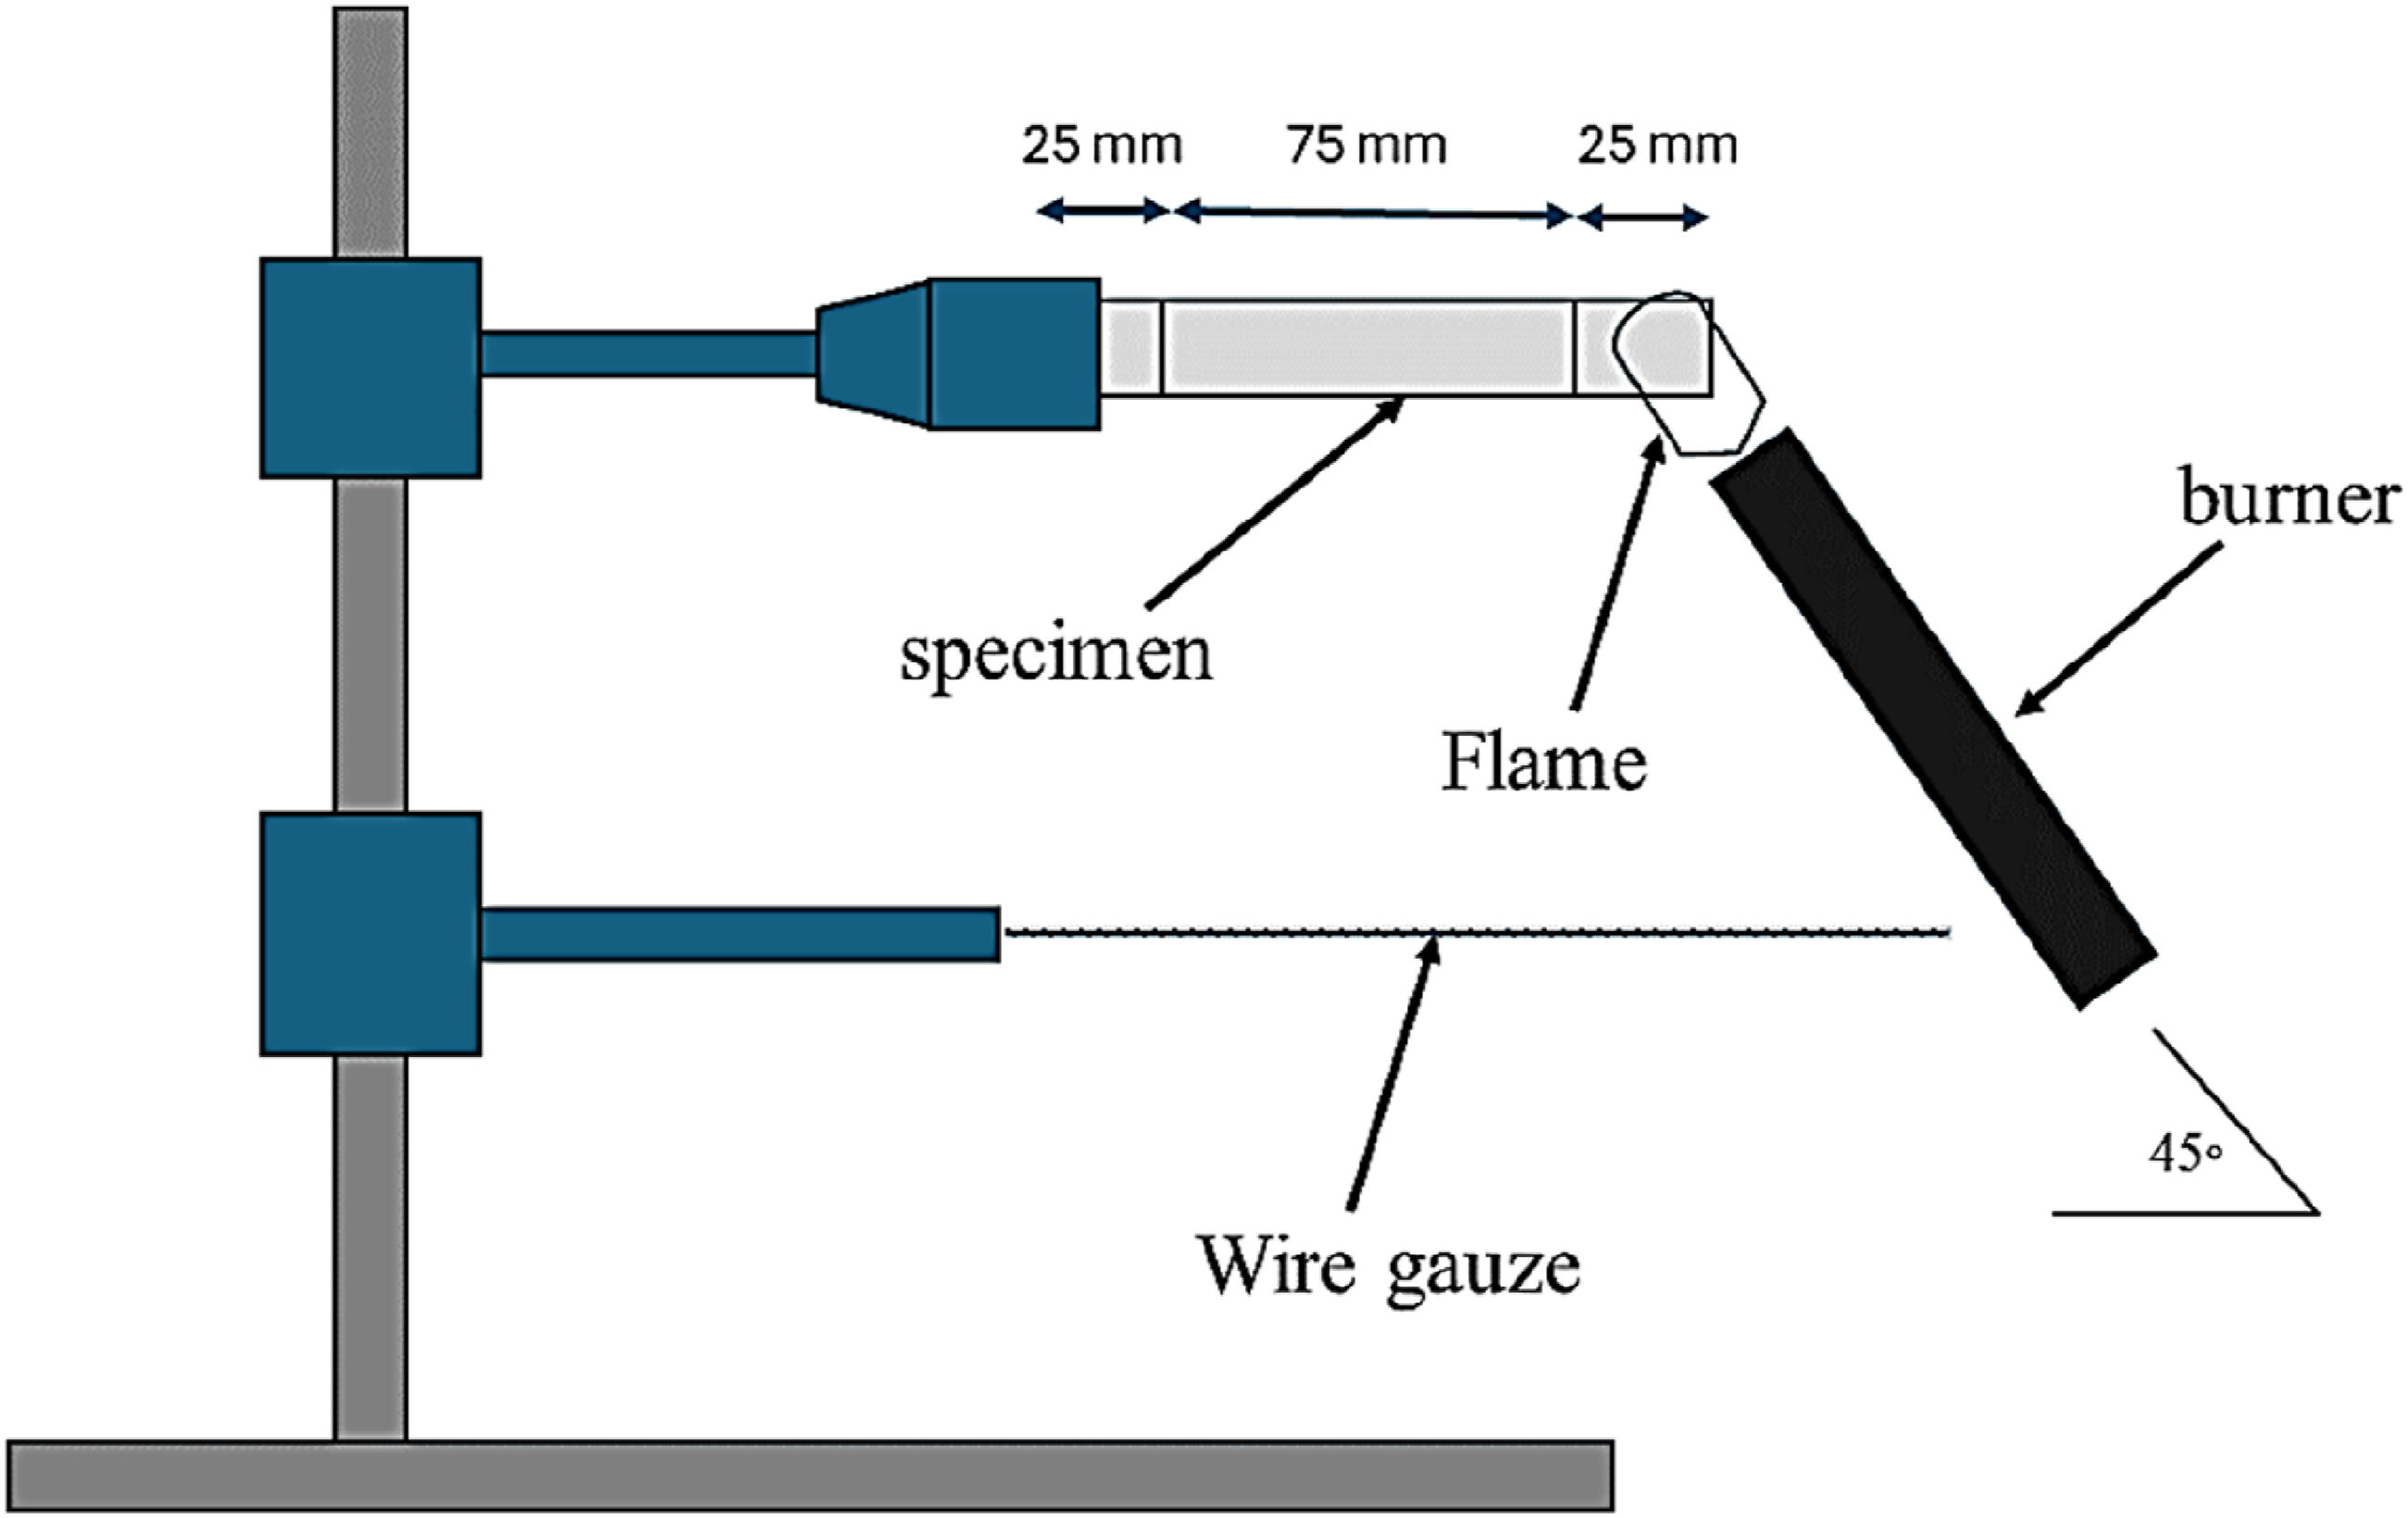
The flammability test was conducted to assess the fire resistance of the developed FGC. The test was conducted in accordance with ASTM D635-22 (equivalent to UL 94 HB) on a sample of dimensions 125 mm × 12.7 mm × 3.2 mm. Before the start of the test, the sample was marked at 25 mm and 100 mm from the end, and the remaining portion was gripped onto the lab scale bench vice setup. A Bunsen burner was used to ignite the sample, for which the burner was adjusted to a high blue flame. The free end of the sample was ignited by positioning the flame at 45 ± 2° from the traverse axis with an ignition time of 30 seconds. In some cases, it was observed that the flame reached the 25 mm mark before 30 seconds had elapsed. Therefore, the flame application was stopped immediately after reaching the mark, and the sample was allowed to burn until the 100 mm mark. Meanwhile, the first dripping and flame travel times (0 to 100 mm) were recorded. Since all the samples in this study reached a length of 100 mm, the linear burning rate (V) was calculated using equation (5).
34
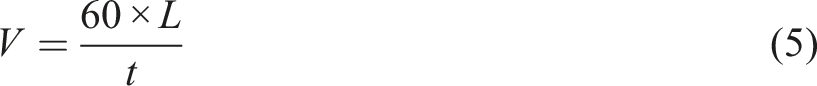
Where V is in mm/min, L is 75 mm, and t is the burning time in seconds. It must be noted that to pass the HB test, the V value must not exceed 40 mm/min. The detailed illustration of the test is shown in Figure 2.
34
Schematic illustration of the flammability test following the ASTM D635-22 standard
34
.
Results and Discussion
Shore D Hardness
Figure 3 shows the Shore D hardness of the 3D-printed PA–CF/GF FGCs recorded for the bottom surface of the sample. All samples exhibited similar SHD values with only minor variations. The 3D-printed PA-CF and PA-GF samples exhibited hardness values of 70 ± 3.6 SHD and 68.5 ± 0.5 SHD, respectively. The observed hardness values of single material PA-CF and PA-GF samples are slightly lower than FGCs and in agreement with the previous study, where the SHD value of PA-CF and PA-GF was found to be 70.3 ± 0.6 SHD and 66.3 ± 1.2 SHD.
19
Furthermore, PA-CF exhibited higher hardness than PA-GF due to the inherently higher surface hardness and stiffness of CF in the PA6 matrix. During indentation, the indenter likely encountered CF along the loading path, and its superior resistance to penetration limited further penetration, thereby increasing hardness. Additionally, PA-CF may have formed a denser, more compact surface layer during printing, whereas GF reinforcement tends to disrupt polymer flow and create micro-voids, leading to a less consolidated surface and reduced resistance to localized indentation. Shore D hardness of the 3D printed samples.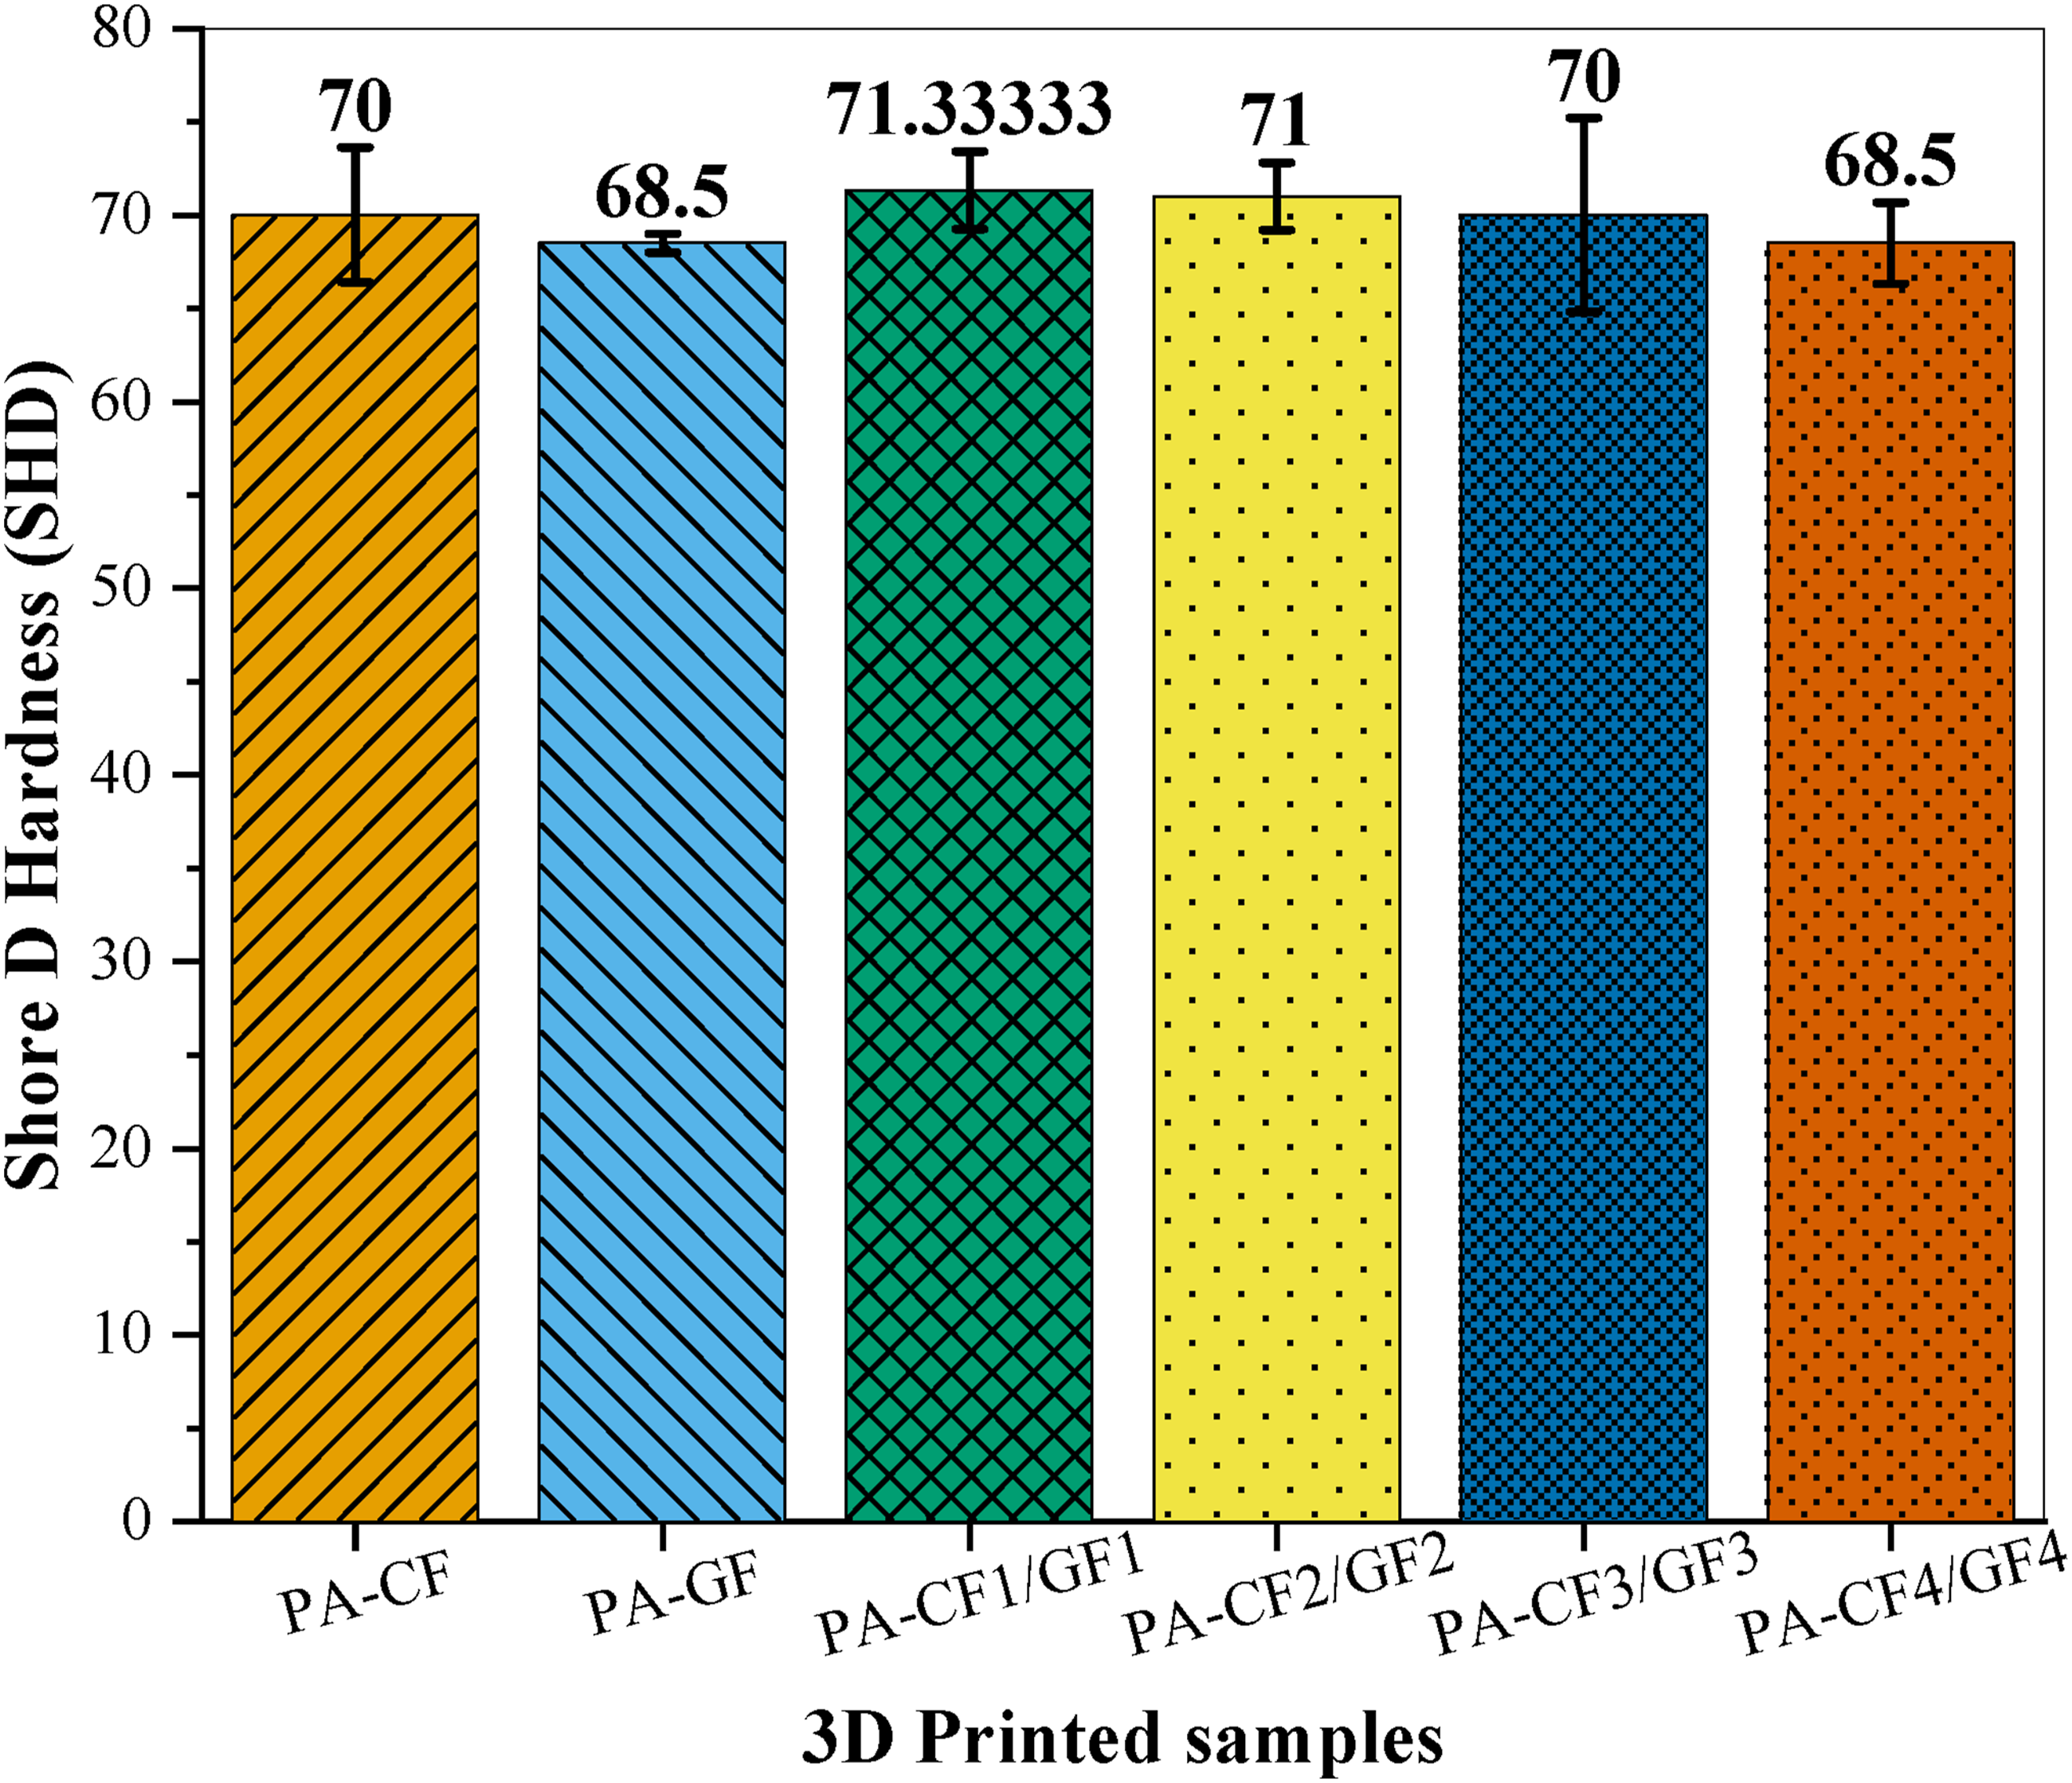
The PA-CF1/GF1 and PA-CF2/GF2 exhibited the similar hardness value of 71.3 ± 2.1 SHD and 71 ± 1.8 SHD, respectively. The consistency in the hardness values for PA-CF1/GF1 and PA-CF2/GF2 samples suggested that the composite surface is dominated by interfacial transitions between PA-CF and PA-GF, with fewer layer alterations, which may have led to improved interlayer fusion and uniform stress distribution, minimizing localized hardness variation. Additionally, similar observations have been reported in multi-material FDM structures, where a reduced number of material interfaces enhances interlayer diffusion and minimizes residual stress concentration at transition zones, thereby improving surface integrity and uniform mechanical response. 31 Furthermore, the sample PA-CF3/CF3 exhibited a hardness of 70 ± 5.2 SHD, which is comparable to that of PA-CF1/GF1 and PA-CF2/GF2, indicating a uniform distribution of reinforcement and improved surface quality. This optimal number of layers enhances interlocking between CF-rich and GF-rich regions, as shown in Figure 9(a), creating a denser, more compact surface structure that increases indentation resistance. However, depositing layers beyond 3 resulted in a decrease in hardness, with the PA-CF4/GF4 sample exhibiting the lowest hardness of 68.5 ± 2.2 SHD. This may be due to the formation of excessive interfacial boundaries, increased mismatch in thermal shrinkage between layers, and higher internal stresses, promoting micro-porosity or weak fusion zones. These effects reduce surface stability under localized loading, resulting in the lowest hardness among the multi-material samples.
Shrinkage Analysis
Figure 4 shows the shrinkage behaviour of the 3D printed PA-CF/GF FGCs. The PA-CF and PA-GF specimens exhibited similar shrinkage values of 14.8 ± 1.2% and 15.3 ± 0.9%, respectively. The slight difference in shrinkage values may be due to the thermal coefficient of expansion (CTE) of the CF (−9.0 × 10⁻⁶/°C and 0.0 × 10⁻⁶/°C in the longitudinal direction when heated from 0 to 300°C)
35
and the GF (6.0 × 10⁻⁶/°C up to 300°C).
36
The CF’s higher elastic modulus, compared with the GF’s, mitigates the composite’s thermal contraction during cooling. Furthermore, the PA-CF1/GF1 and PA-CF2/GF2 specimens showed a similar shrinkage value of 11.9 ± 1.0% and 11.9 ± 0.8%, respectively. At the lower layer, the mono-pair of CF and GF establishes a homogeneous network that minimizes thermal gradients and enhances the composite’s warpage resistance. Similarly, PA-CF3/GF3 samples exhibited a minimum shrinkage of 11.4 ± 1.1%, indicating that FGCs can be fabricated using a 3-layer alternating structure of PA-CF and PA-GF to achieve an optimal reinforcement framework. Fabricating FGCs with layer alteration up to 3 resulted in a homogeneous distribution of CF and GF and uniform interfacial layer interaction, mitigating polymer mobility during cooling and thereby restricting shrinkage. However, extending the reinforcement beyond a 3-layer alteration negatively affects sample shrinkage, as the PA-CF4/GF4 specimens exhibited a 14.1 ± 1.0% of shrinkage. With 4 layers of CF and GF in the PA matrix, the thermal-expansion mismatch is more pronounced. This may be attributed to the increase in interfacial boundaries by the alternating fibre layers. The interface experiences a thermal mismatch between the PA matrix and the reinforcing fibres during cooling, leading to localized stress accumulation and the formation of voids. This uneven stress distribution had led to increased volumetric contraction and overall shrinkage. Shrinkage behaviour of the 3D printed samples.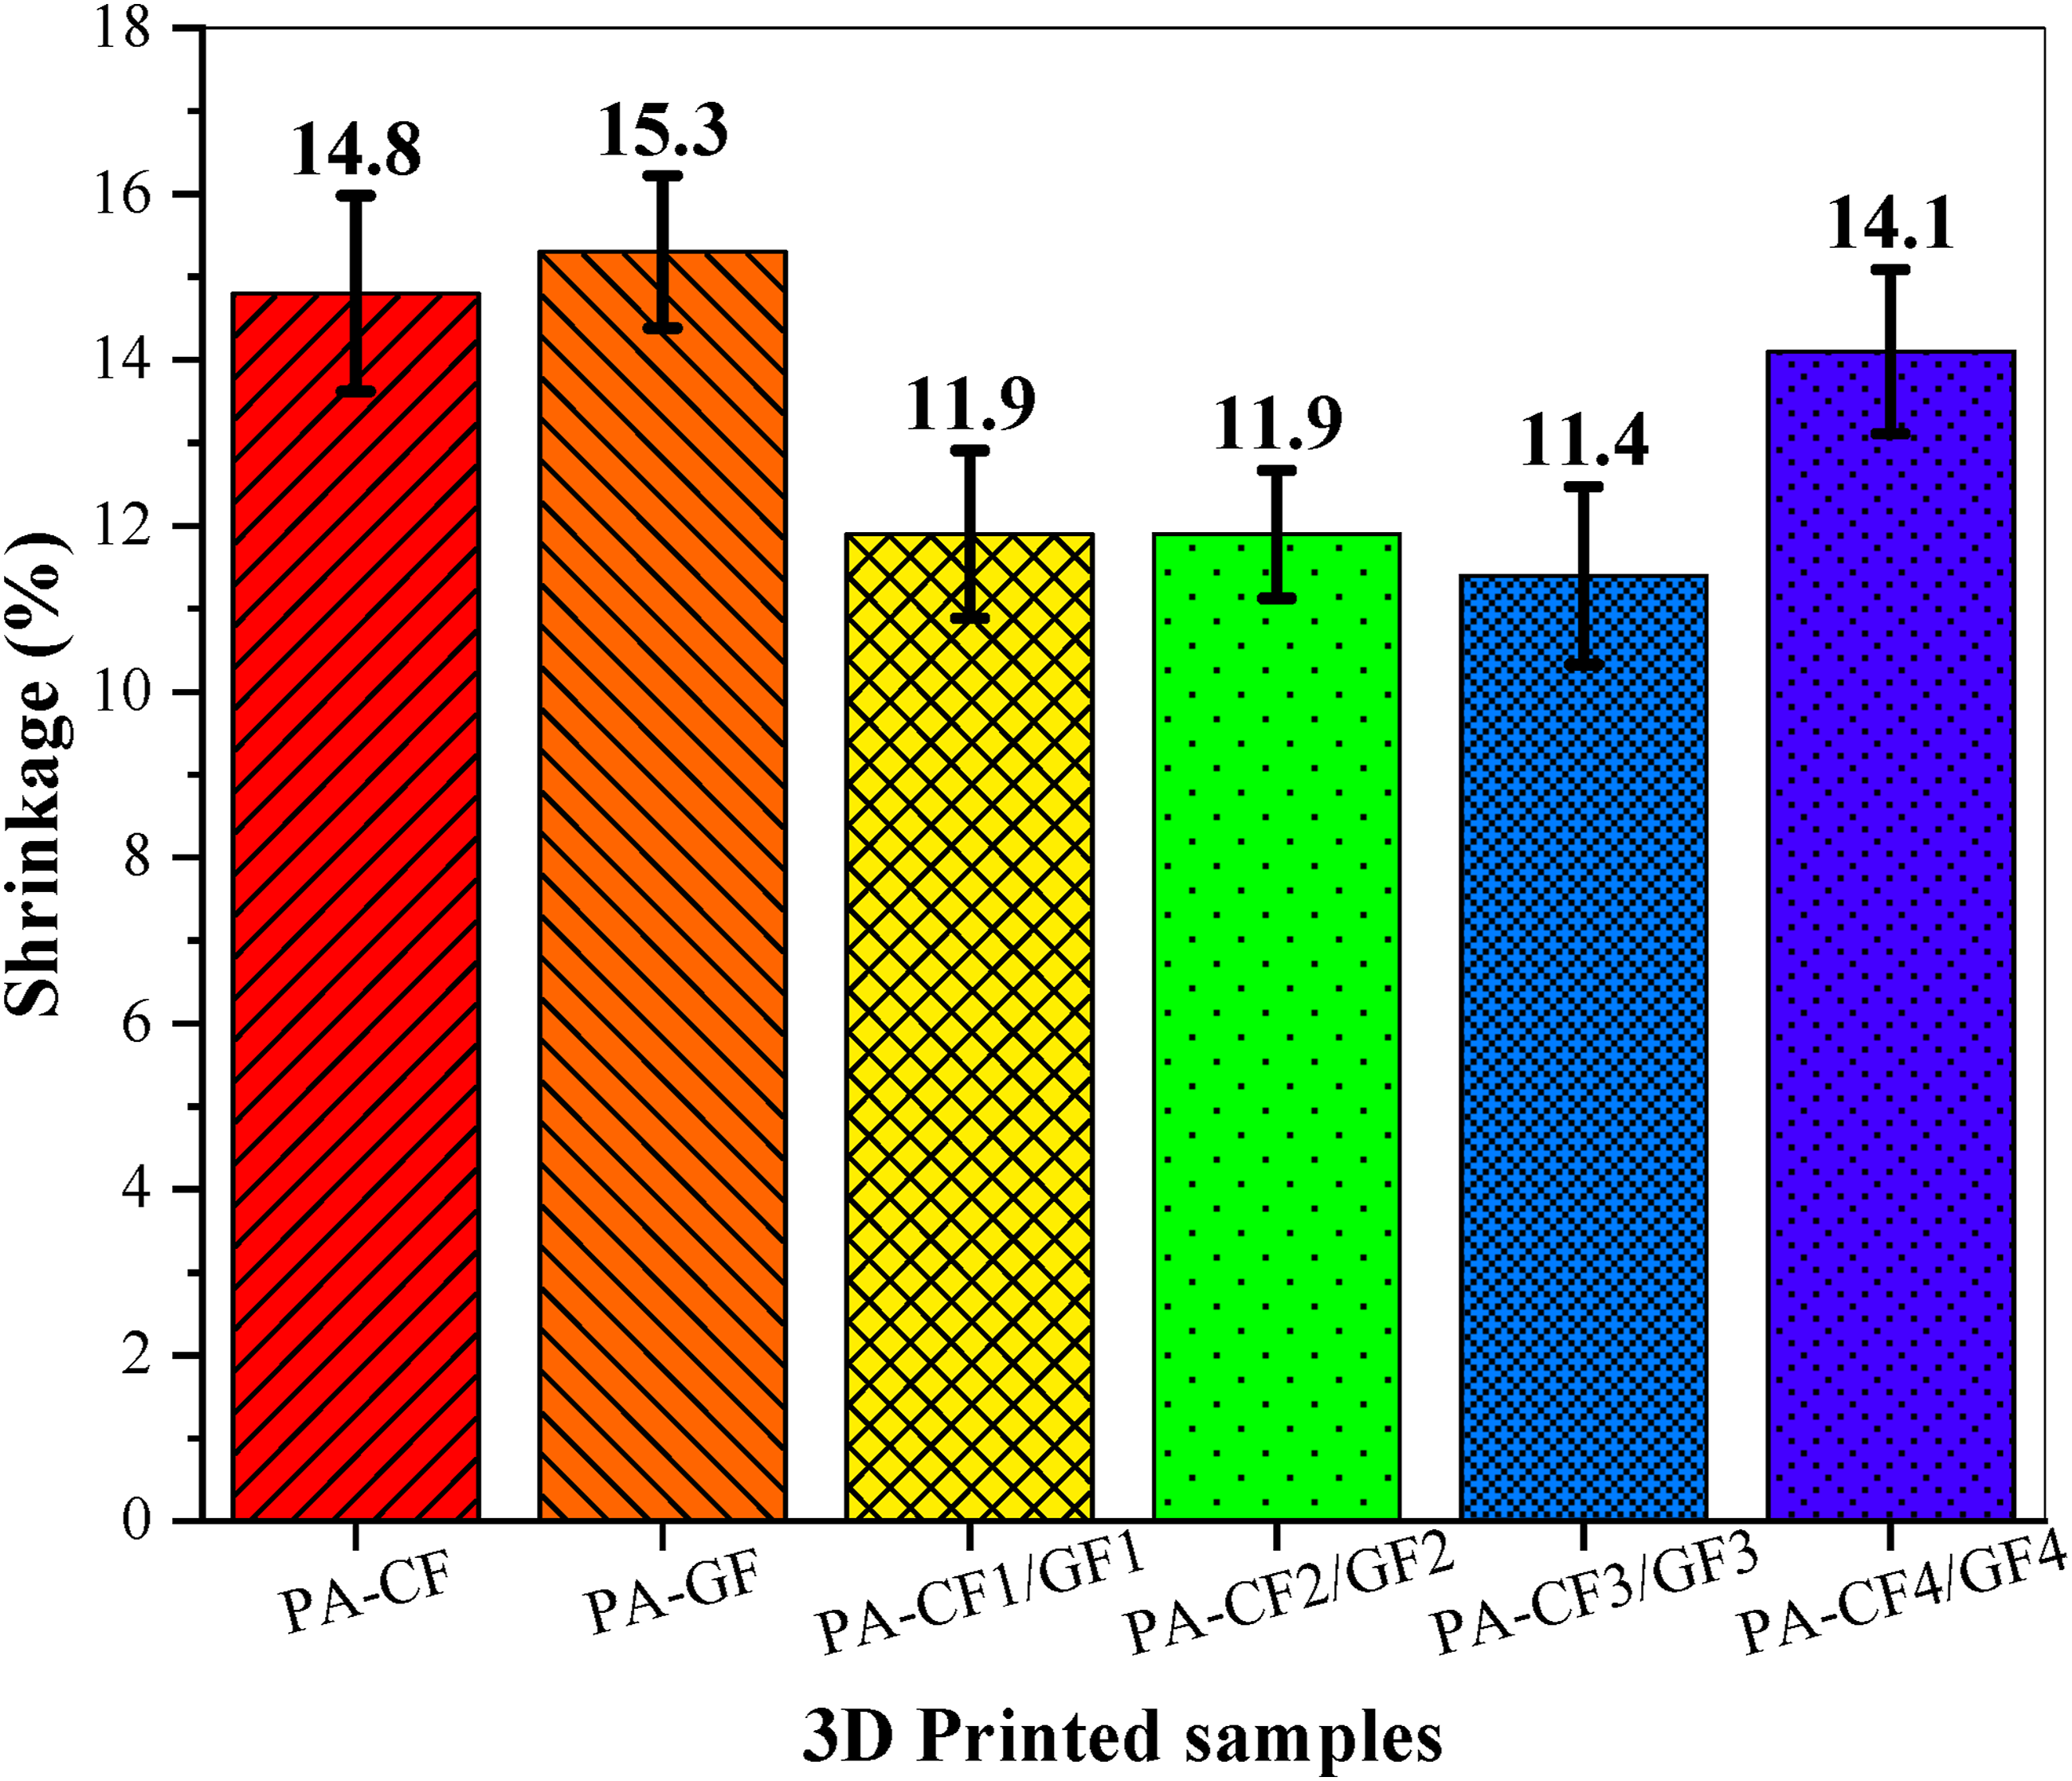
Flexural Properties Analysis
Figure 5 illustrates the flexural performance of PA-CF/GF FGC, showing the flexural stress-strain curve and a bar graph representing maximum flexural stress (Fs) exerted by the samples. Observing the flexural stress-strain curve shown in Figure 5(a), none of the samples has undergone complete failure, either due to cracking or any other factor, as evidenced by the camera image of failed flexural samples shown in Figure 5(c). After the application of the point load, the samples have undergone severe bending, with the PA-GF sample exhibiting the highest flexural properties. The PA-GF sample showed the steepest slope at the initial elastic region of the curve, indicating the highest stiffness (resistance to bending) among all the 3D printed samples, thereby exhibiting the highest flexural modulus. Additionally, as shown in Figure 5(b), the PA-GF samples exhibited the highest Fs values of 40.6 ± 1.9 MPa. The probable reason for PA-GF showing the highest flexural performance is superior fibre-matrix interfacial bonding, which results in better stress transfer.
25
GF may have improved wetting and reduced the void content in the composite, thereby enhancing interlayer diffusion during 3D printing. Following the PA-GF sample, the PA-CF3-GF3 FGC sample showed similar stiffness properties with the second-highest Fs value of 32.9 ± 1.5 MPa. This result demonstrated that the PA-CF3/GF3 composites exhibited optimal matrix-fibre reinforcement, characterized by strong interfacial bonding and a dominance of PA-GF layers, leading to lower porosity and improved interlayer consolidation under bending. However, exceeding three layers of PA-CF and PA-GF material reduced flexural performance, as shown by the PA-CF4-GF4 sample. This can be attributed to increased porosity, weaker interlayer adhesion, and reduced consolidation associated with the higher CF content, leading to inefficient stress transfer and premature interfacial failure under bending loads. Although PA-CF3/GF3 exhibited a slightly higher Fs of 32.9 ± 1.5 MPa compared to PA-CF2/GF2 (31.2 ± 1.4 MPa), the difference between the two configurations is relatively small (near to 5%) and falls within the experimental variability, as indicated by the overlapping standard deviation ranges. This suggests that two- and three-layer alternations of PA-CF and PA-GF provide comparable flexural reinforcement efficiency, beyond which performance does not significantly improve. However, the obtained flexural properties of the FGC are lower than those reported in previous studies, where the PA-CF sample exhibited the exceptional Fs values of 172.96 ± 1.5 MPa,
37
and 33-67 MPa,
38
while the PA-GF sample exhibited the Fs value of 84.39
25
and 55-79 MPa.
39
This variation highlights the need for further systematic investigation into the influence of 3D printing process parameters, internal architecture (lattice) and post-processing on the mechanical performance of hybrid multi-material composites. Flexural properties of the 3D printed specimens (a) flexural stress-strain curve; (b) bar graph illustrating maximum flexural stress, and (c) failed flexural sample images.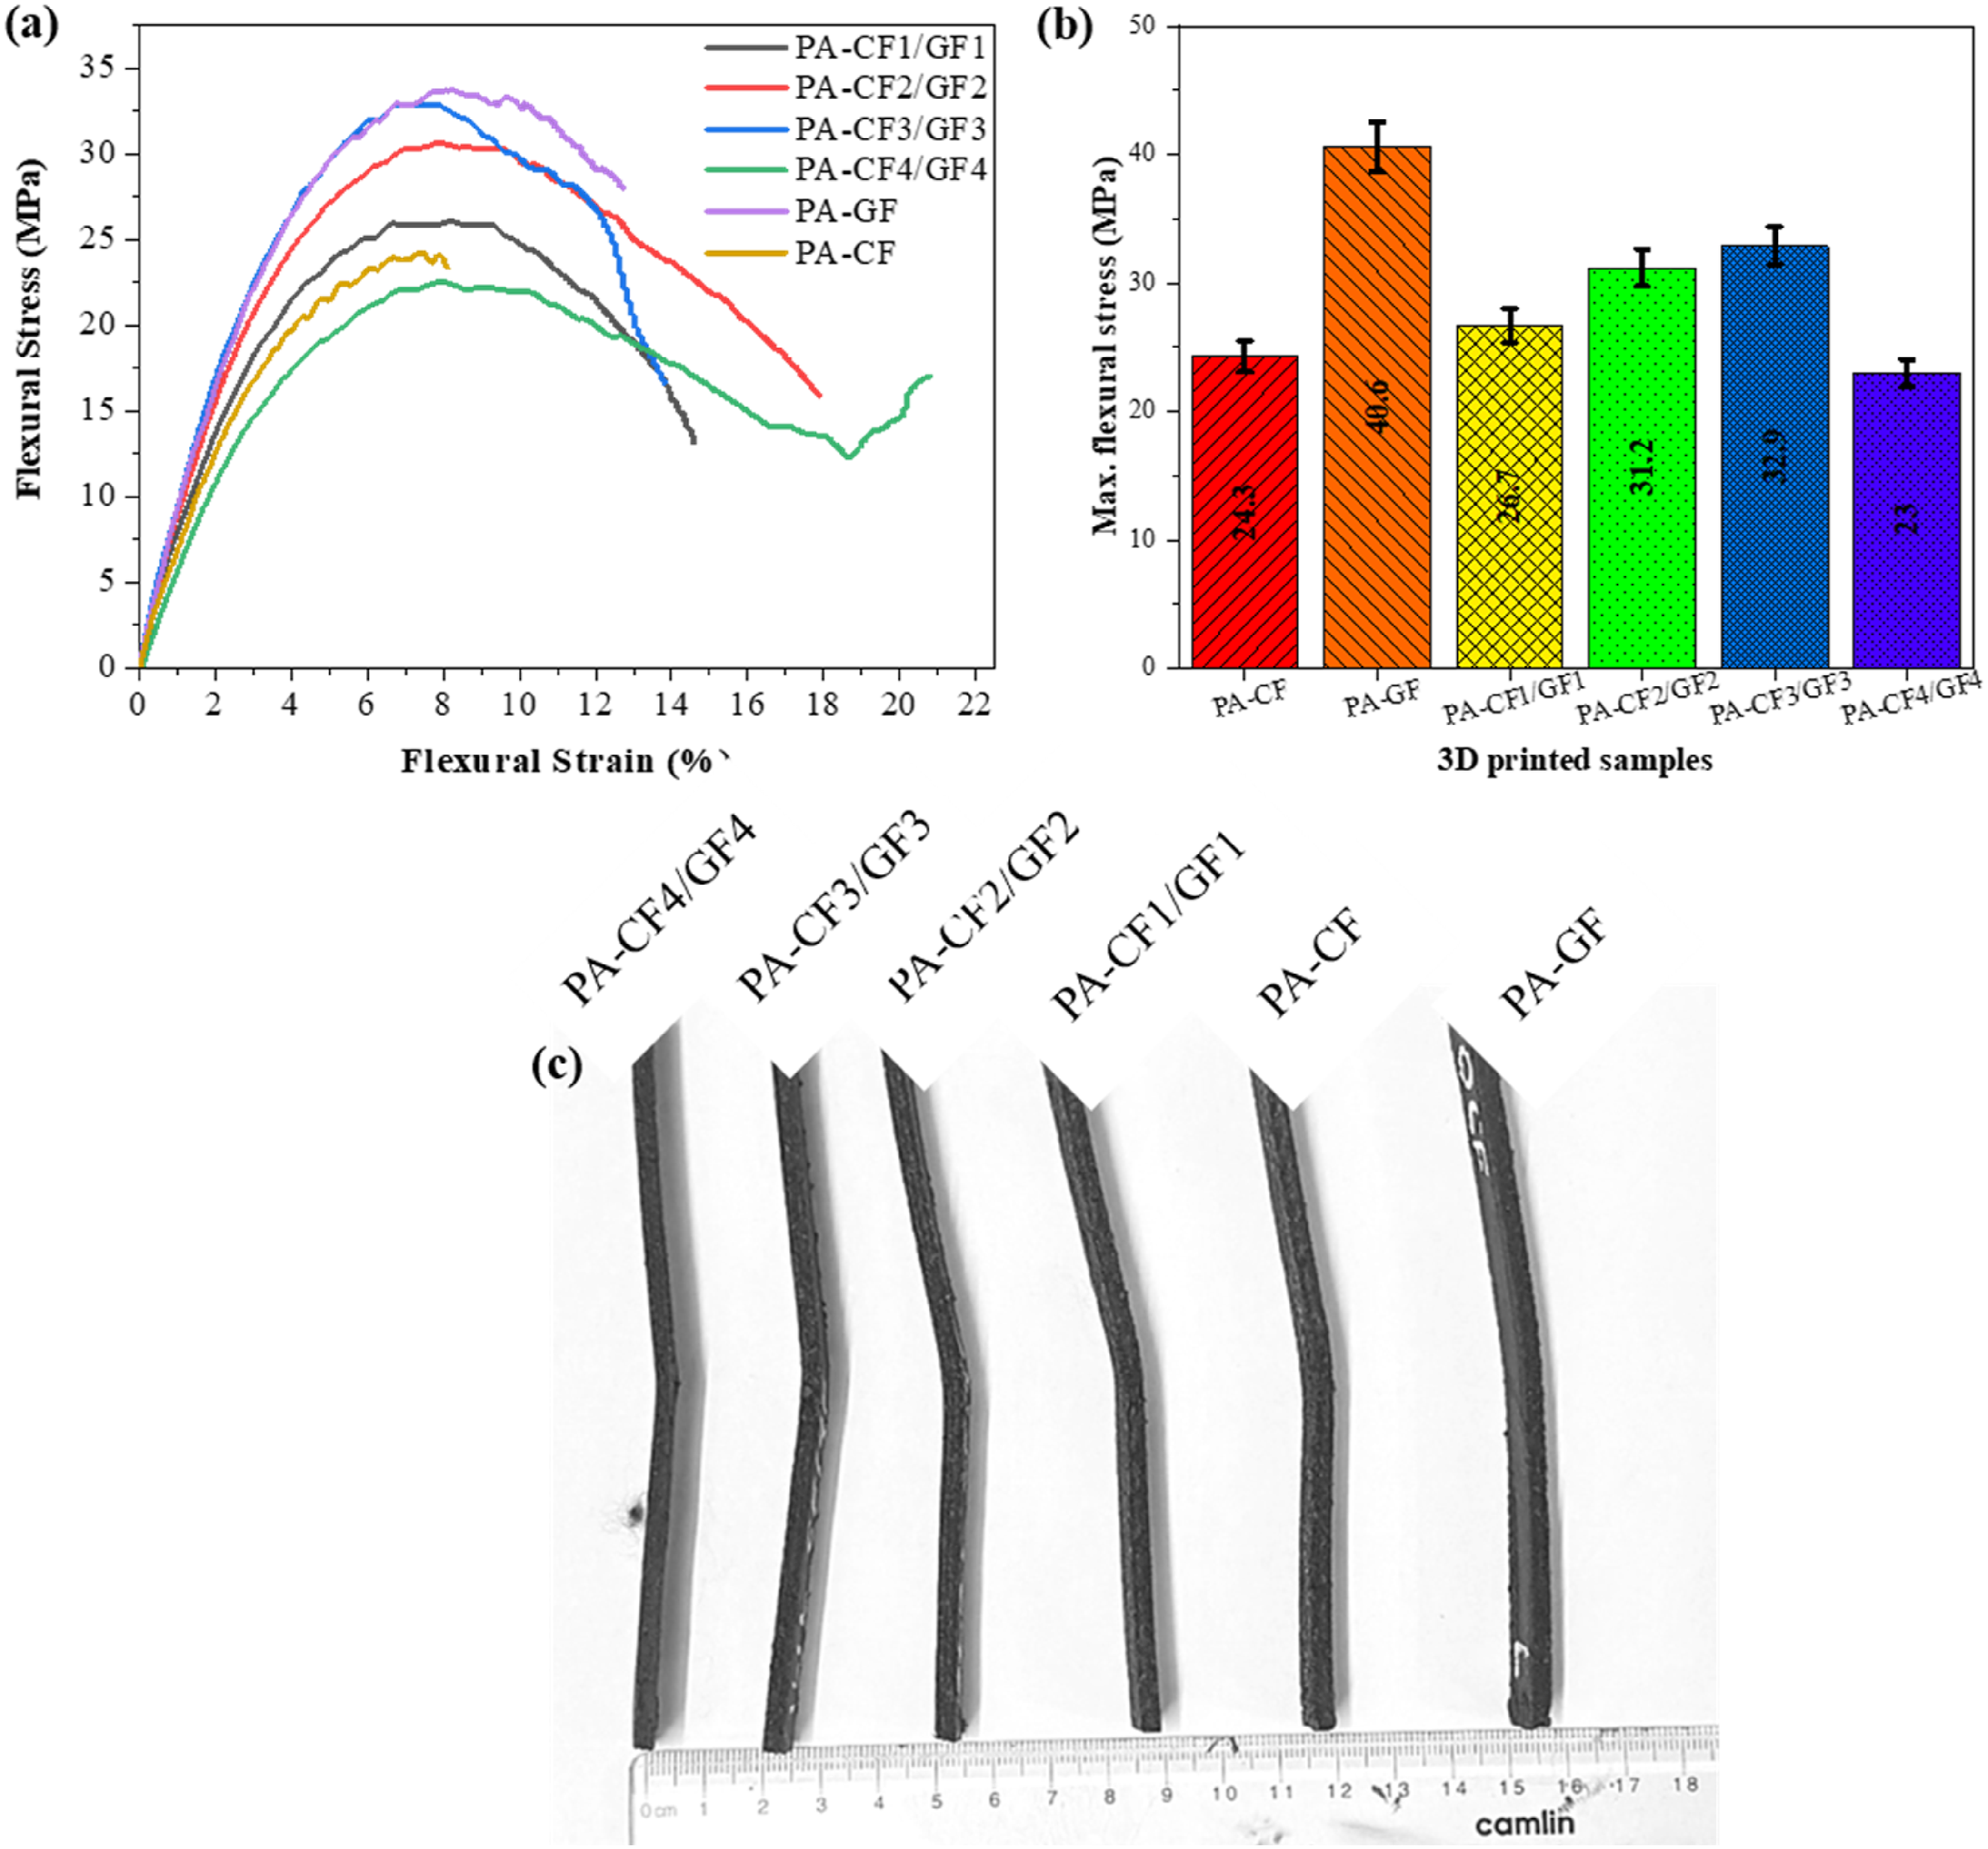
Tensile Behaviour
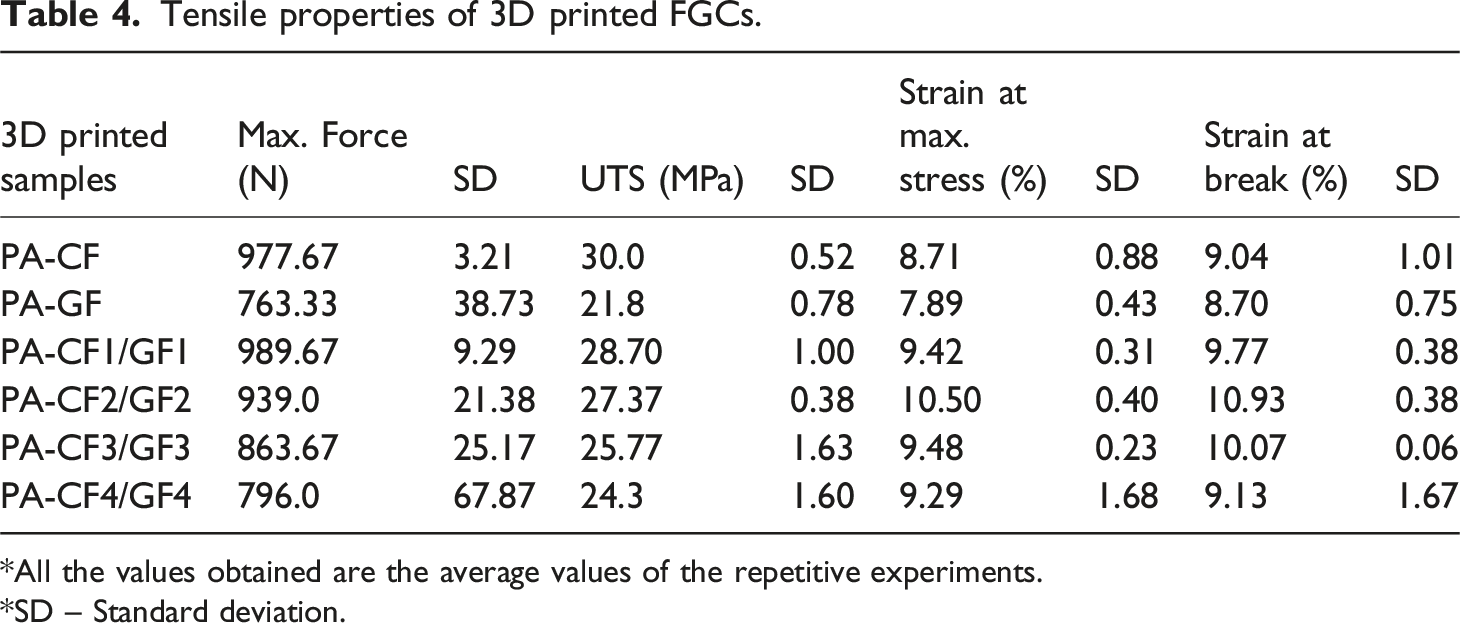
Figure 6 shows the tensile stress-strain curve, along with Table 4, presenting the ultimate tensile stress (UTS), maximum force (Fmax), strain at maximum stress (∈max), and strain at break (∈break) of the 3D-printed samples. Tensile stress-strain curve of 3D printed FGCs. Tensile properties of 3D printed FGCs. *All the values obtained are the average values of the repetitive experiments. *SD – Standard deviation.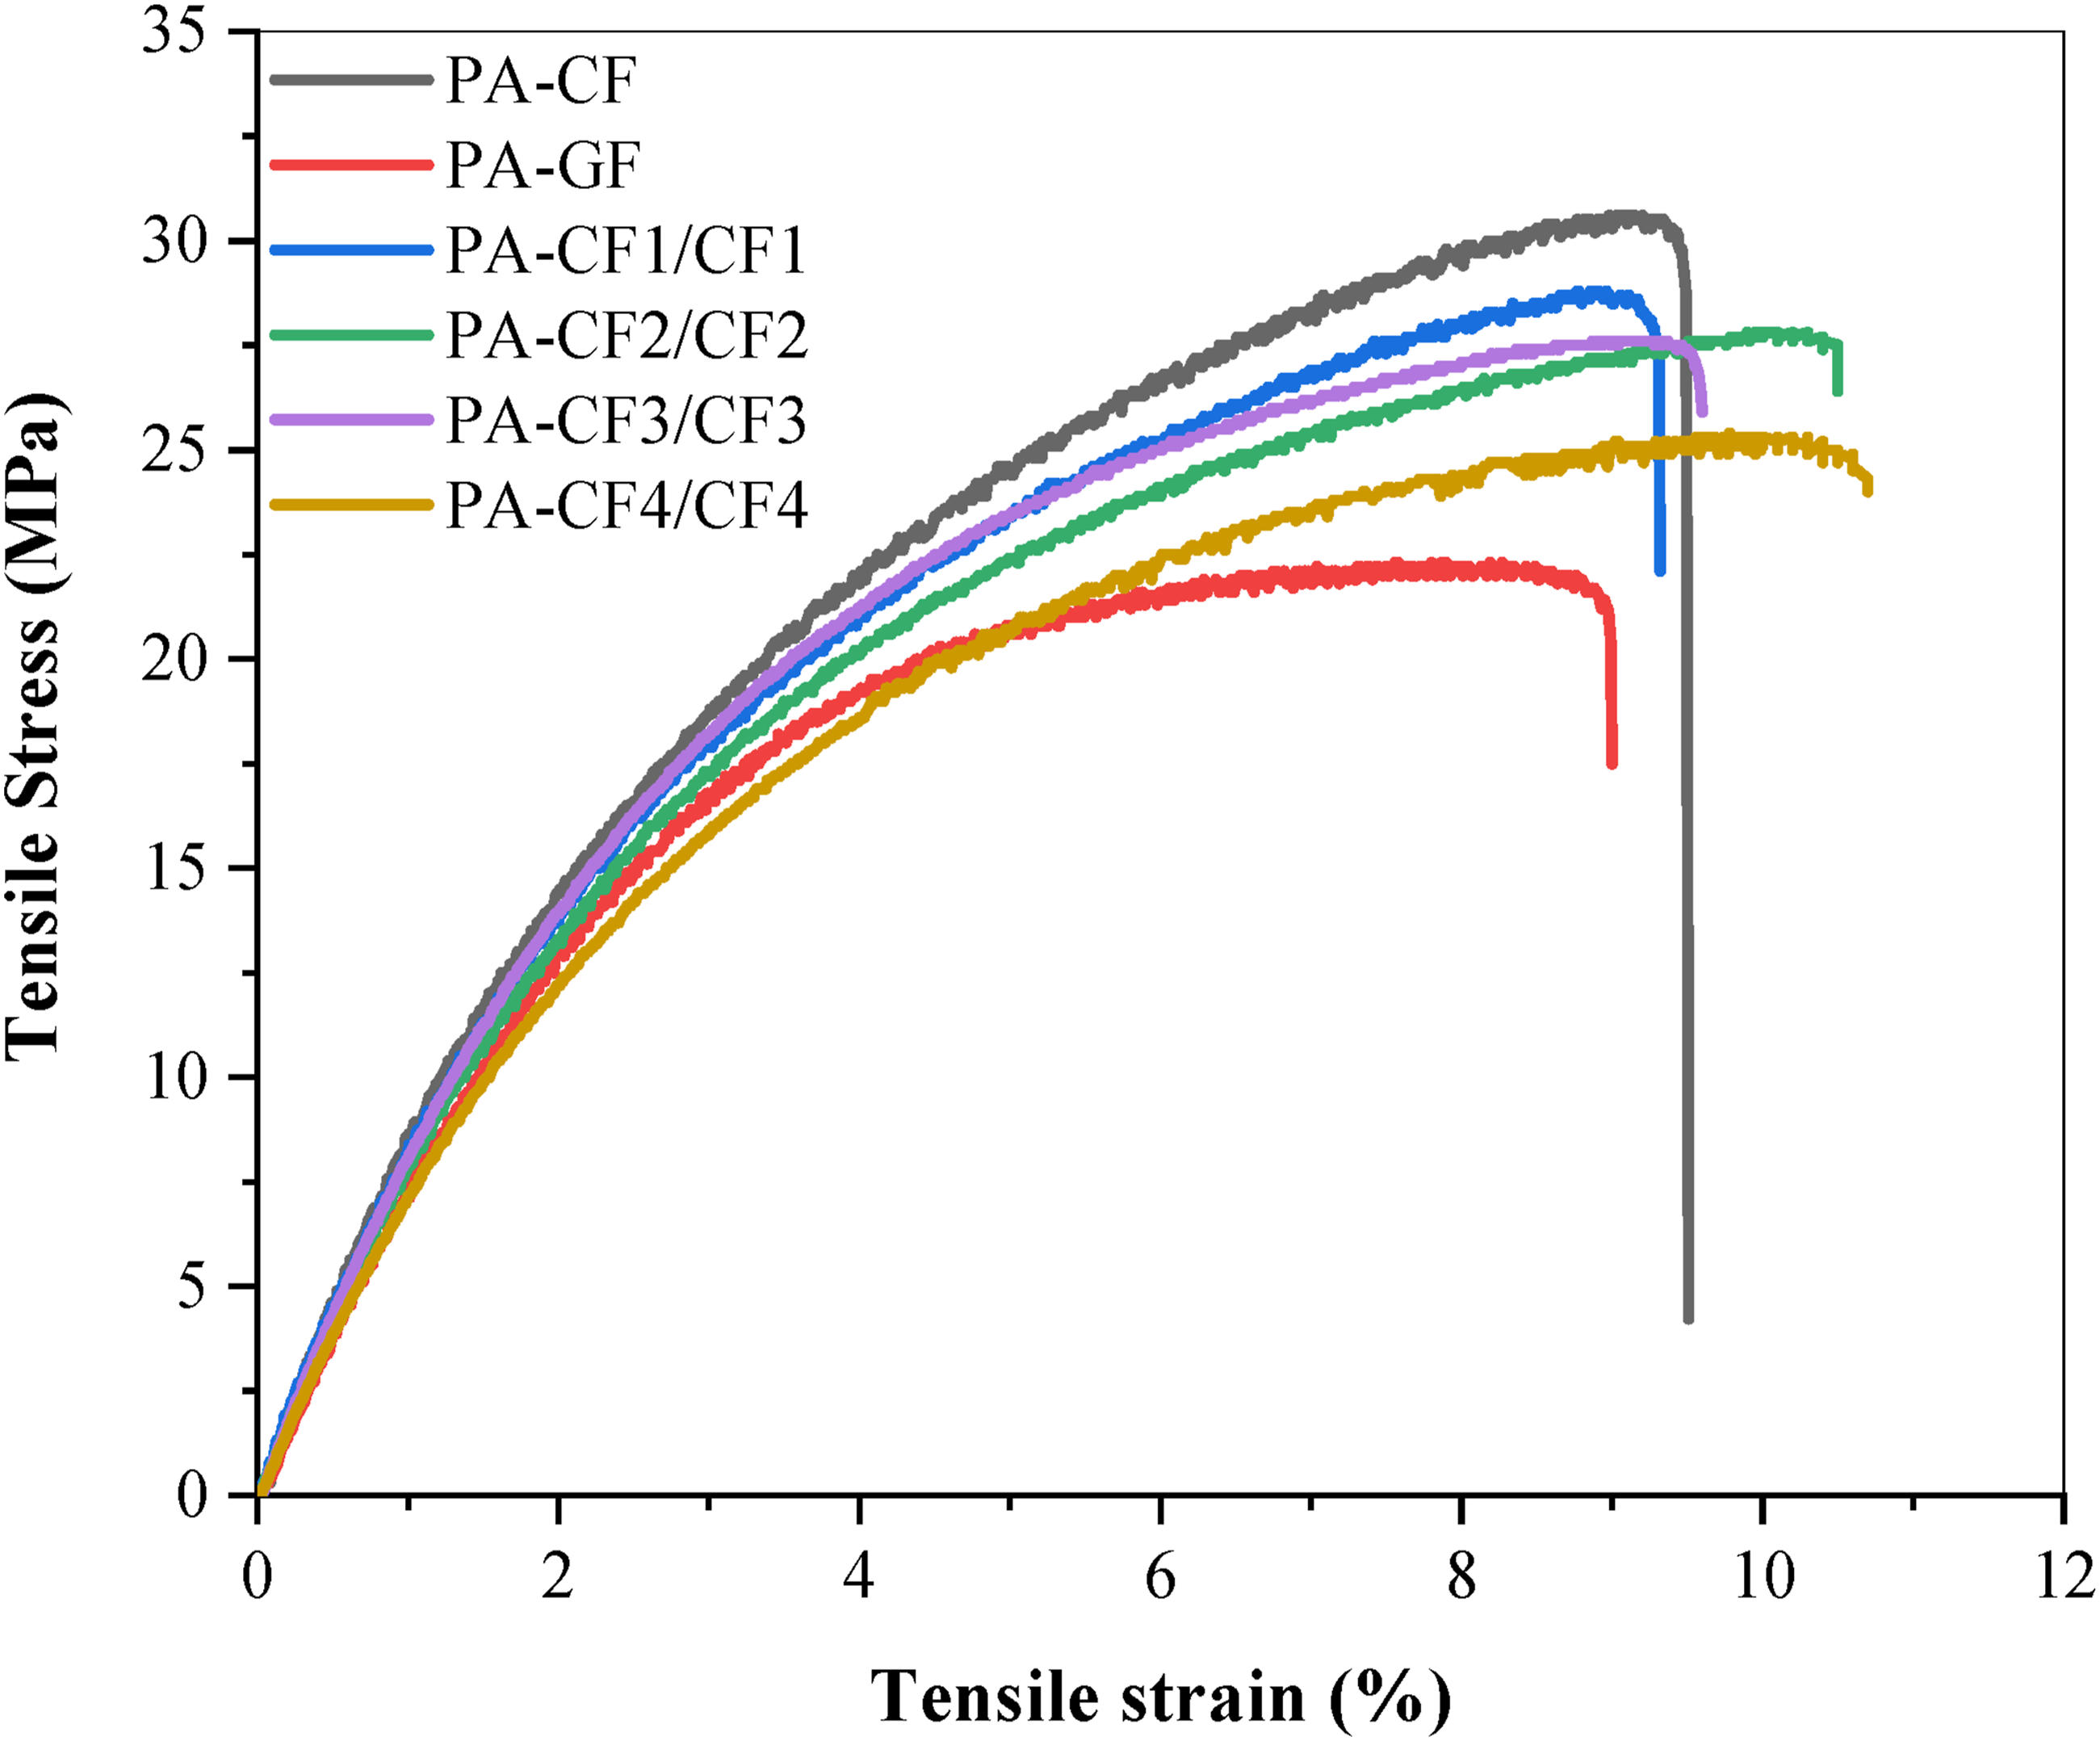
Observing the curve shown in Figure 6 and the data presented in Table 4, it was noted that the PA-CF sample exhibited the highest UTS among all the 3D printed samples, with the Fmax and UTS value of 977.67 ± 3.2 N and 30.0 ± 0.5 MPa, respectively. In the initial linear region (elastic region) of the curve, the PA-CF sample shows a relatively steep slope, indicating higher stiffness than all the samples. However, the sample exhibited lower strain, with ∈max and ∈break values of 8.71 ± 0.9% and 9.04 ± 1.0%, respectively, indicating brittle behaviour during tensile loading. This limited elongation behaviour may be due to the CF restricting the polymer chain mobility and promoting early crack initiation at the fibre-matrix interface. The SEM micrograph shown in Figure 7 demonstrates the failed region of the PA-CF sample, providing strong microstructural evidence of its brittle tensile response. Figure 7(a) shows the interfacial crack along the CF and PA matrix boundaries with the circular voids/cavities formed due to CF pull-out from the PA matrix, confirming premature crack initiation during tensile loading. The cavities formed after CF pull-out may have also acted as internal stress concentrators, accelerating crack coalescence. Additionally, the interfacial cracks were likely to originate from the stress-concentration zone around rigid CF, where poor wetting or incomplete fusion occurred during printing. Similarly, Figure 7(b) clearly shows interfacial debonding and voids formed by CF pull-outs, suggesting inefficient anchoring of CF within the PA matrix. The de-bonded interface reduces load-bearing efficiency, resulting in a sudden stress drop after reaching UTS. The evidence of a sharp fracture of the PA-CF sample is also seen from the stress-strain curve. Figure 7(c) shows the microscopy of the pulled-out CF, clearly providing evidence of inefficient anchoring of CF within the PA matrix. Additionally, the microscopy reveals that the failure mechanism may also be dominated by fibre extraction. The region highlighted by the red box shows a rough, fragmented surface morphology, characteristic of brittle matrix fracture in the absence of plastic deformation, indicating limited matrix ductility. At last, Figure 7(d) shows distinct CF fractures, indicating that, after failure of the matrix during loading, the applied load was abruptly transferred to the CF, leading to fibre breakage. The fracture end of CF also shows minimal plastic deformation prior to failure, consistent with the steep drop in the stress curve in Figure 6. Fracture morphology of the 3D printed PA-CF specimens highlighting (a) interfacial crack, (b) interfacial de-bonding and cavities formed due to CF pullout, (c) CF pull-out and matrix brittle failure, (d) CF fracture.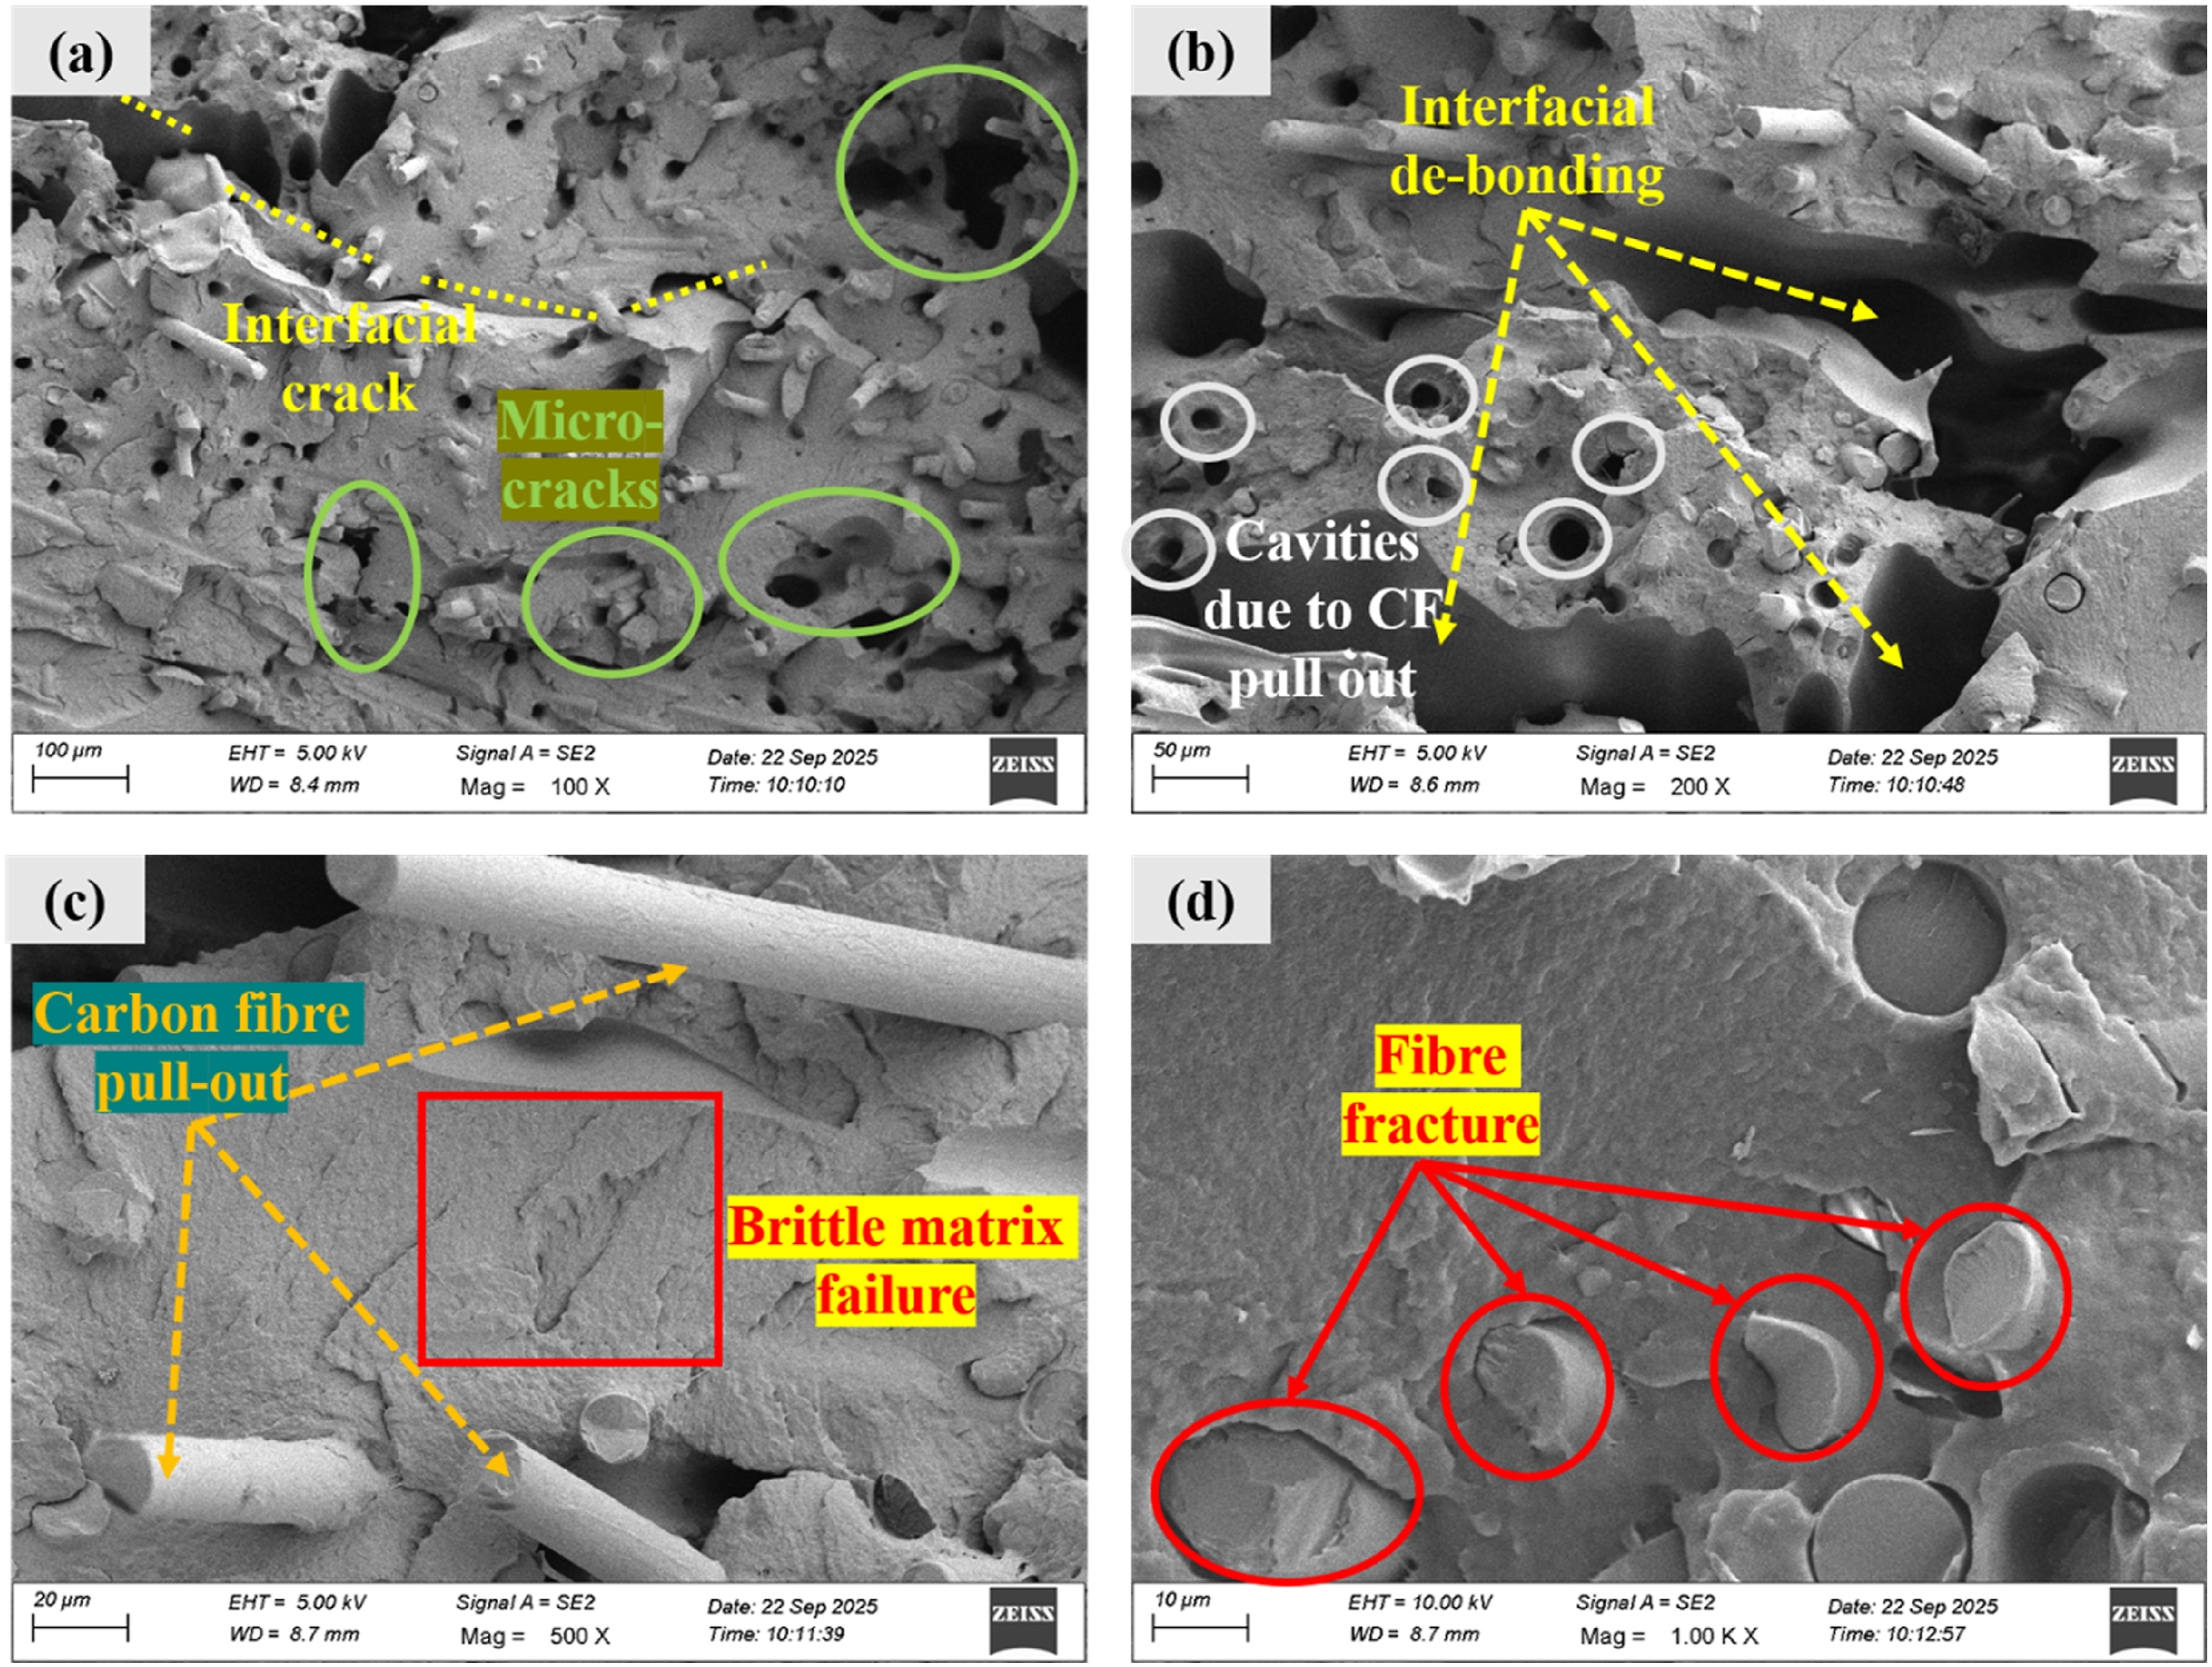
The PA-GF sample demonstrated the lowest tensile properties, with Fmax and UTS of 763.3 ± 38.7 N and 21.8 ± 0.8 MPa, respectively, but exhibited improved ductility. The stress–strain curve shows a more gradual increase in stress beyond the elastic region, indicating enhanced energy absorption prior to fracture. The sample exhibited ∈max and ∈break values of 7.9 ± 0.4% and 8.7 ± 0.8%, respectively, indicating stable deformation. The cross-sectional SEM images of the failed tensile sample, shown in Figure 8, provide clear evidence of enhanced elasticity and ductile tearing within the PA matrix. Figure 8(a) and 7(b) reveal prominent spurs and fibrillated regions, indicating substantial energy absorption prior to failure. Although some inter-bead debonding and localized voids are visible, their occurrence appears limited, enabling the composite to retain structural continuity and maintain effective stress transfer during loading. Furthermore, Figure 8(c) and 8(d) show partially embedded and moderately pulled-out glass fibres, indicating that the fibres effectively restricted matrix deformation and contributed to improved stiffness and elastic response prior to final fracture. Fracture morphology of the 3D printed PA-GF specimens highlighting (a) Inter-bead de-bonding, (b) ductile failure, (c) clustering of GF and its pullout, (d) matrix-reinforcement de-bonding.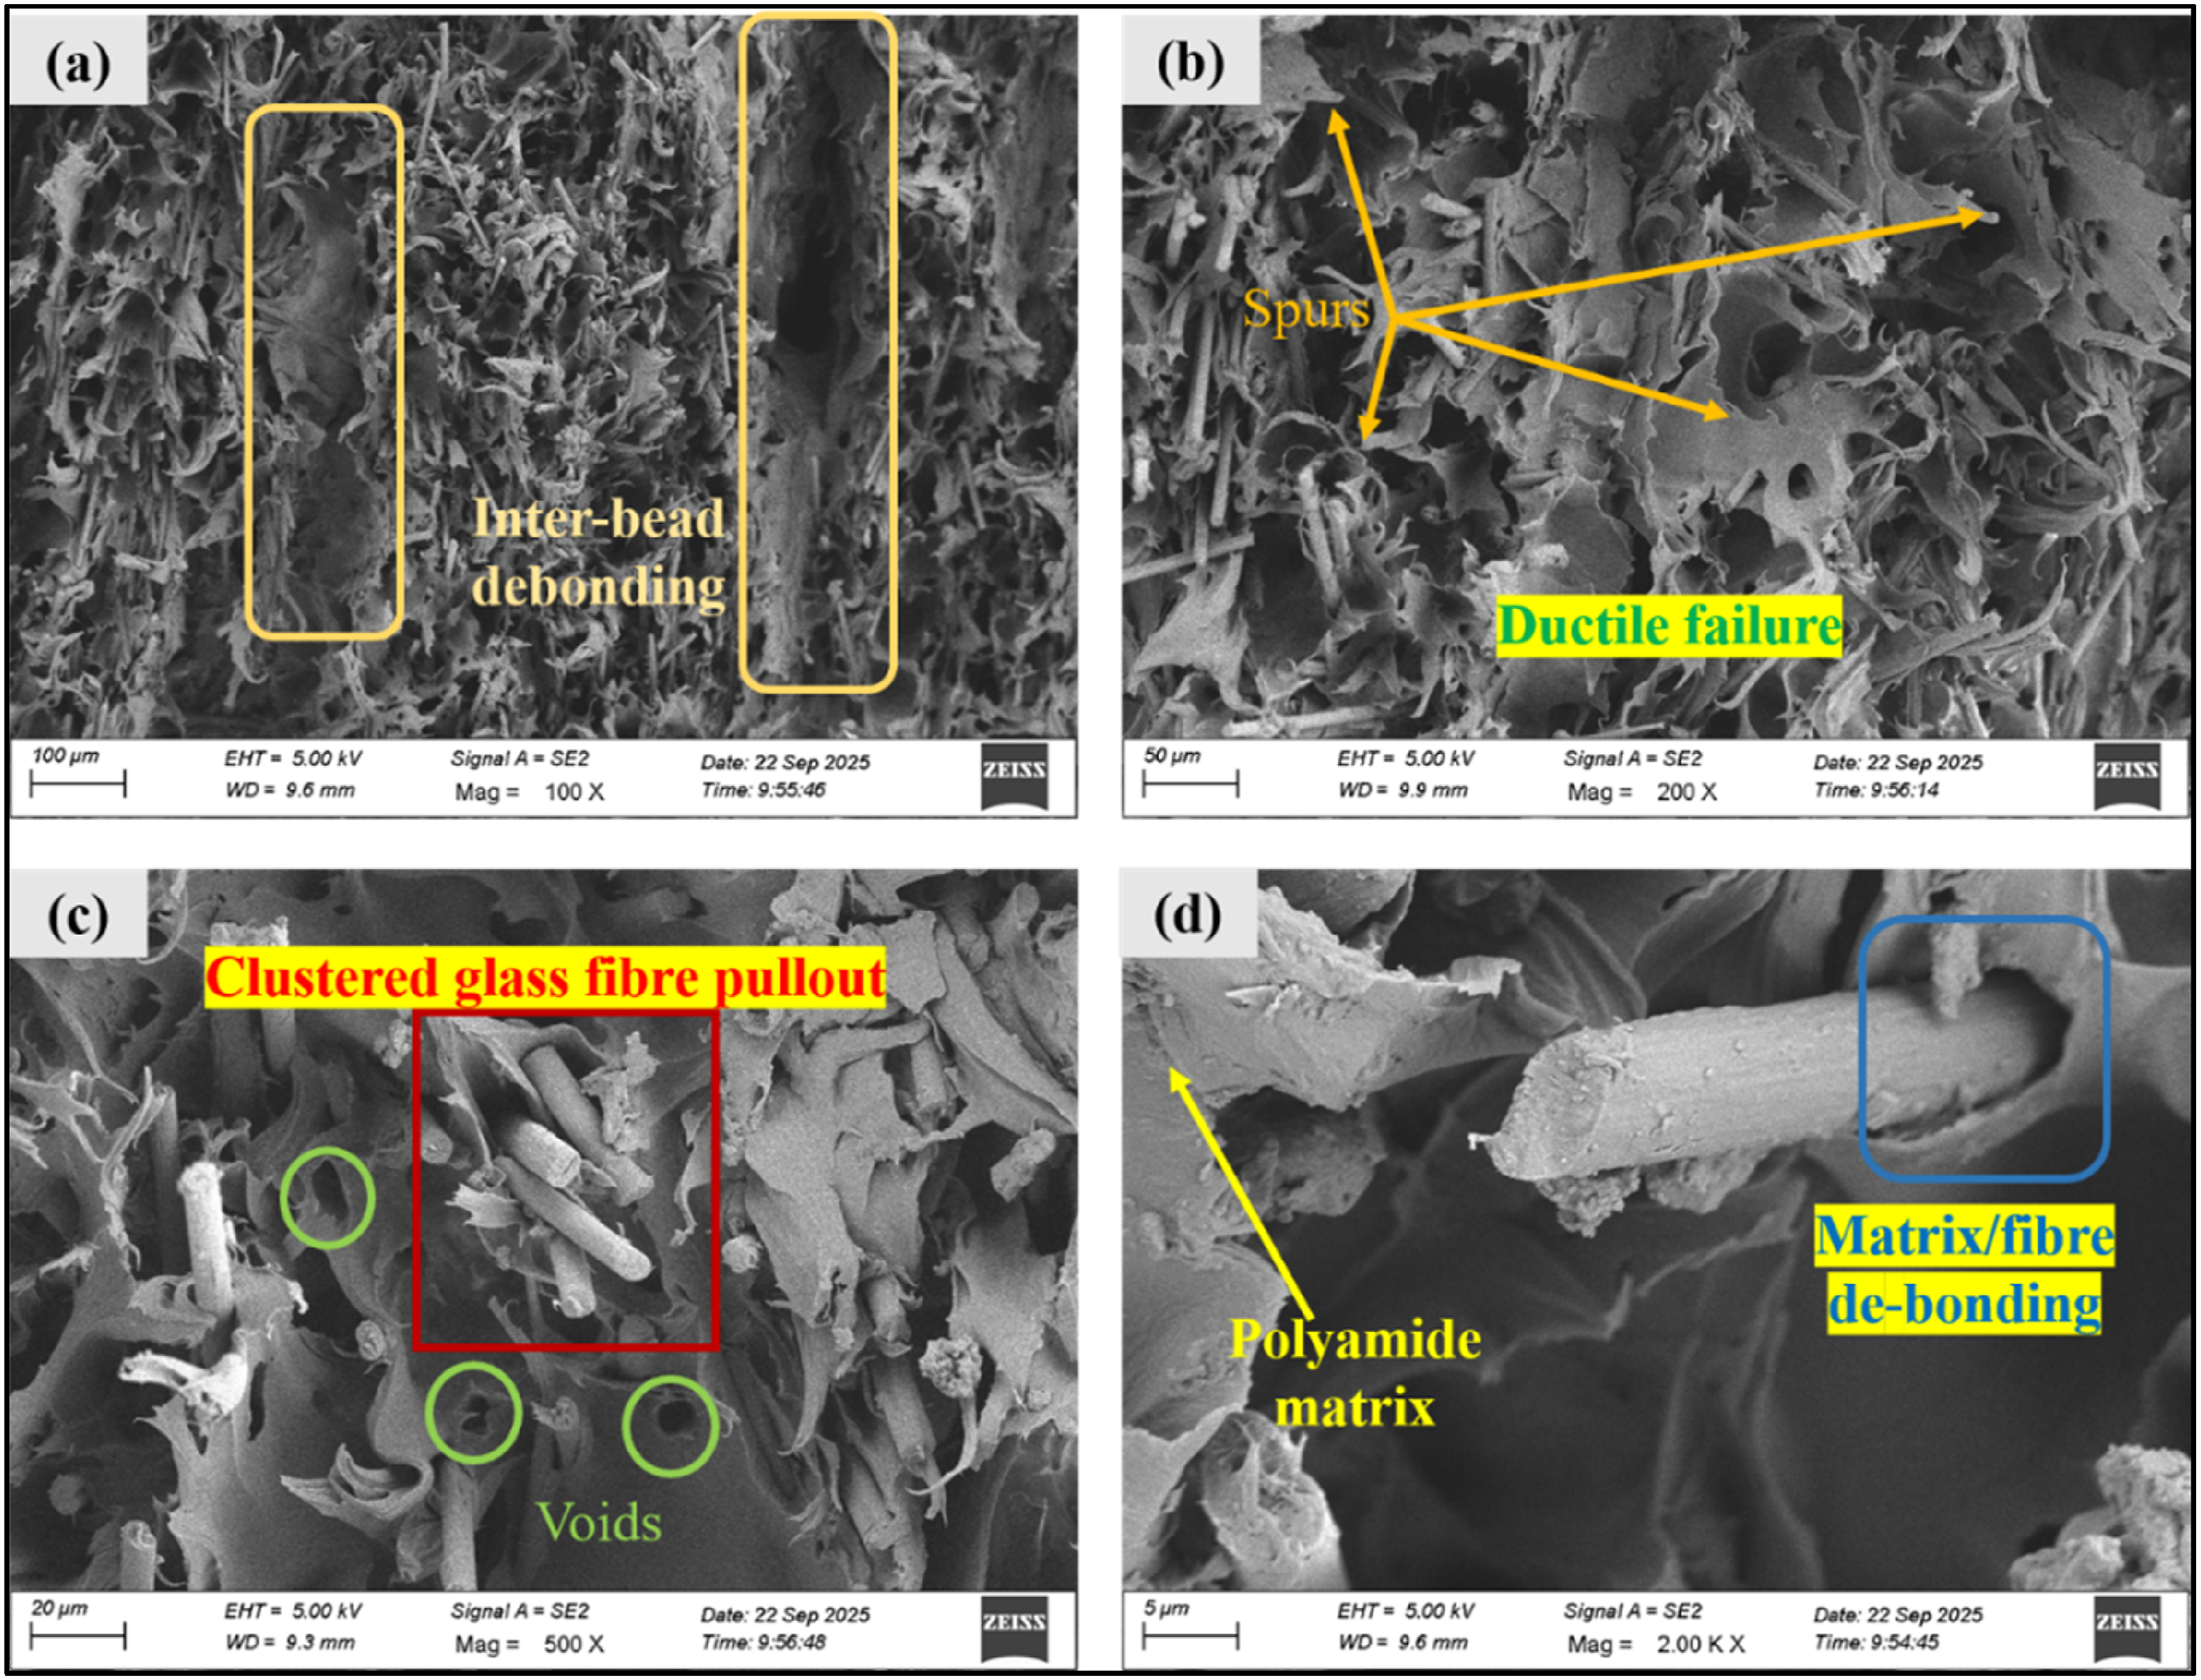
The stress-strain curve shown in Figure 6 for the PA-CF/GF FGC exhibits typical thermoplastic behaviour, with an initial linear elastic region, a minor strain-hardening zone, and sudden catastrophic failure. Among all the multi-material samples, the PA-CF1/GF1 and PA-CF2/GF2 samples exhibited the highest tensile properties, with a UTS value of 28.7 ± 1.00 MPa and 27.4 ± 0.4 MPa, respectively. However, the increase in layer alteration beyond 2 resulted in a decrease in tensile properties of the samples, with PA-CF4/GF4 showing the lowest tensile properties among the FGCs, with Fmax, UTS, ∈max and ∈break values 796 ± 67.9 N, 24.3 ± 1.6 MPa, 9.3 ± 1.7%, and 9.1 ± 1.7%, respectively. As shown in Table 4, the FGC samples exhibited significant variation in Fmax and UTS, with only a minor change in strain. The PA–CF3/GF3 and PA–CF4/GF4 composites end to exhibit localised fibre-rich zones that disrupt uniform load transfer and increase the likelihood of voids or unfused regions. Although PA–CF3/GF3 showed a relatively higher strain at break of 10.07 ± 0.06%, its UTS was lower (25.8 ± 1.6), likely due to excessive CF block thickness, which reduced reinforcement efficiency and compromised interlaminar integrity.
The SEM image of failed PA-CF1/GF1 shown in Figure 9 provides evidence of the superior properties of PA-CF1/GF1. Figures 9(a) and 9(b) shows well-fused interlayer regions and distinguishable PA/CF and PA/GF domains, which confirms stable bonding between consecutive layer interfaces. The interlayer separation observed in other architectures is substantially reduced here, aligning with the improved mechanical response. Figure 9(c) highlights limited fibre pull-out and controlled interfacial separation, suggesting that the CF and GF layers effectively shared the applied load before failure. Furthermore, the presence of smooth PA melt regions in Figure 9(d) indicates enhanced polymer flow and consolidation within the PA–CF2/GF2 layers, resulting in improved structural continuity and delayed crack propagation. Fracture morphology of the 3D printed PA-CF1/GF1 sample highlighting (a) PAGF and PA-GF layer, (b) CF and GF content in FGC, (c) interlayer separation, (d) PA matrix melt.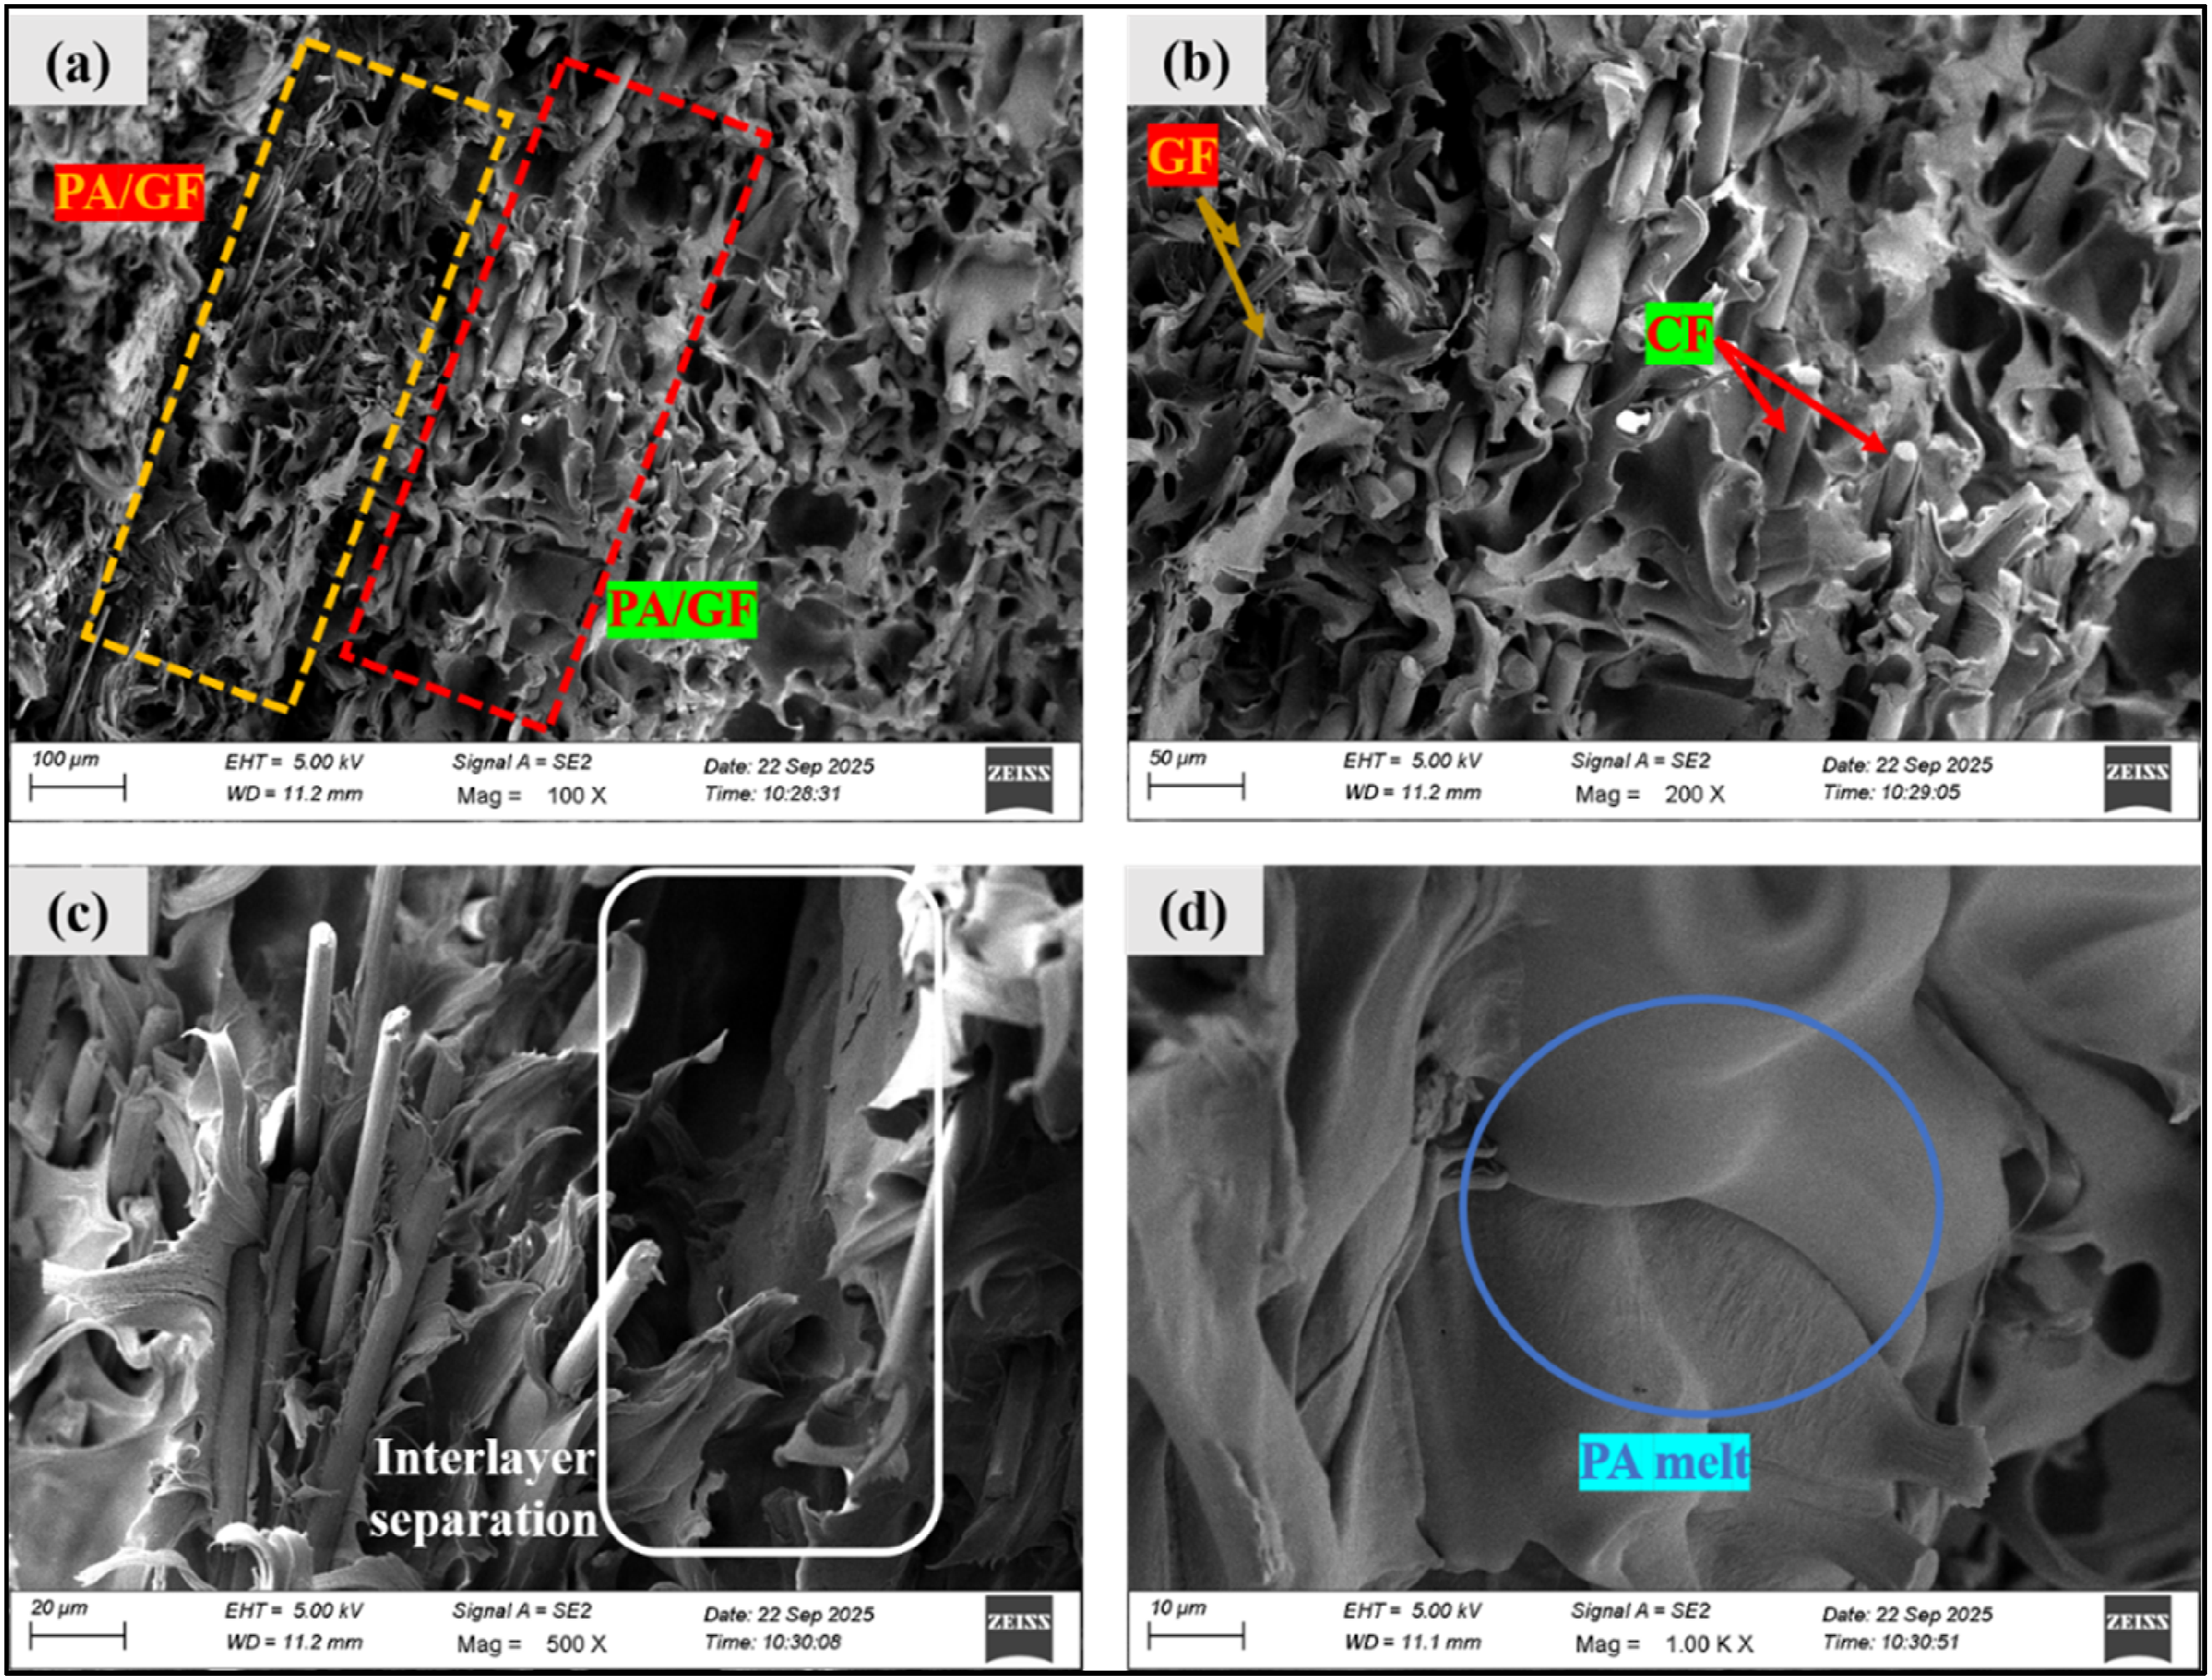
Flammability Analysis
UL-94 horizontal burning (HB) flammability test results of 3D-printed samples.
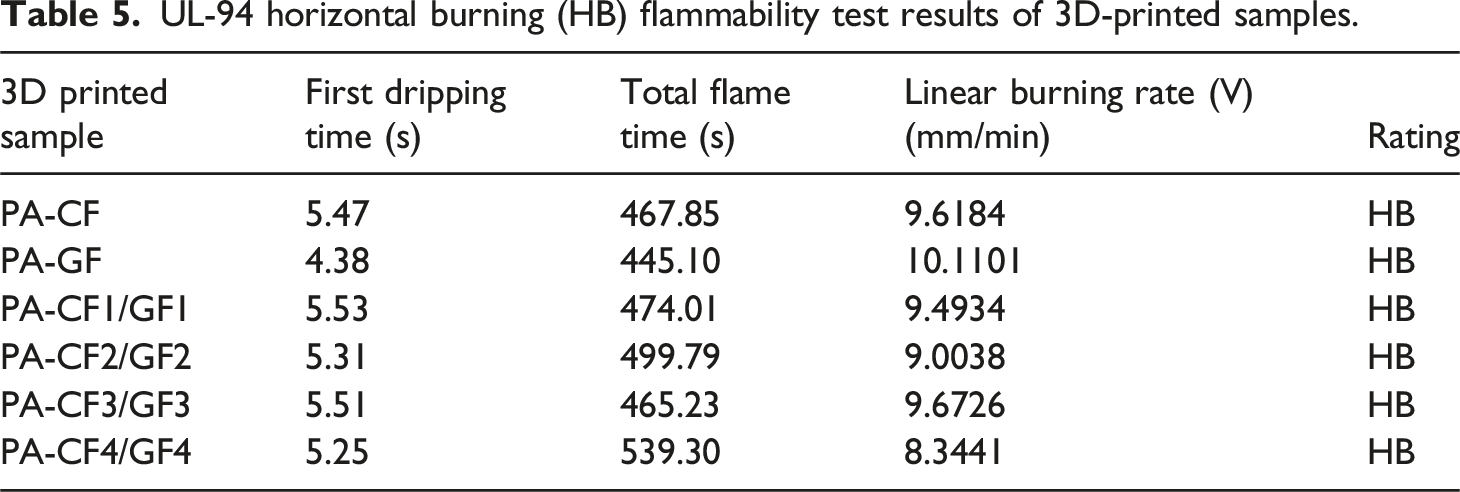
The PA–GF sample showed the highest linear burning rate (V) value of 10.11 mm/min, which can be attributed to the non-char-forming nature of GF and the absence of a thermally protective barrier during combustion. Furthermore, PA–CF exhibited a reduced V value of 9.62 mm/min, accompanied by a longer first dripping time. The presence of CF promotes char formation and heat shielding, which retards flame propagation. It can also be interpreted that FGC 3D printing has no effect on reducing the linear burning of the material, as a very slight reduction in V value is observed in the FGC samples. The PA–CF4/GF4 sample exhibited the lowest V value of 8.34 mm/min, with the longest total flame time of 8.344 s, indicating the formation of a more s20 and continuous char layer due to the presence of CF-rich interfaces, which restrict heat and mass transfer during combustion. Figure 10(a)-(f) shows the UL-94 horizontal burning test results of the 3D printed FGCs, where the left-hand picture shows the samples during full burning and the right-hand picture shows the region after complete sample burning. Figure 10(a) shows the relatively stable flame with noticeable molten polymer dripping for the PA-CF sample, and a rough, partially charred surface after burning. This indicates that CF promotes the formation of a protective carbonaceous layer that acts as a thermal barrier, slowing flame spread. The PA-GF sample, as shown in Figure 10(b), exhibited relatively intense flame and earlier dripping, resulting in the highest linear burning rate, which may be due to the non-char-forming nature of GF and the absence of a protective thermal barrier. The FGC shown in Figure 10(c-f) exhibited intermediate behaviour where the incorporation of CF within the GF matrix promotes partial char continuity and restricts heat and mass transfer during combustion. UL-94 horizontal burning (HB) flammability behaviour of 3D-printed PA–CF, PA–GF, and hybrid FGC samples: (a) PA–CF, (b) PA–GF, (c) PA–CF1/GF1, (d) PA–CF2/GF2, (e) PA–CF3/GF3, and (f) PA–CF4/GF4 (NOTE: Left images of each section shows the specimens during active flame exposure, and right images depict the fully burned condition after flame propagation).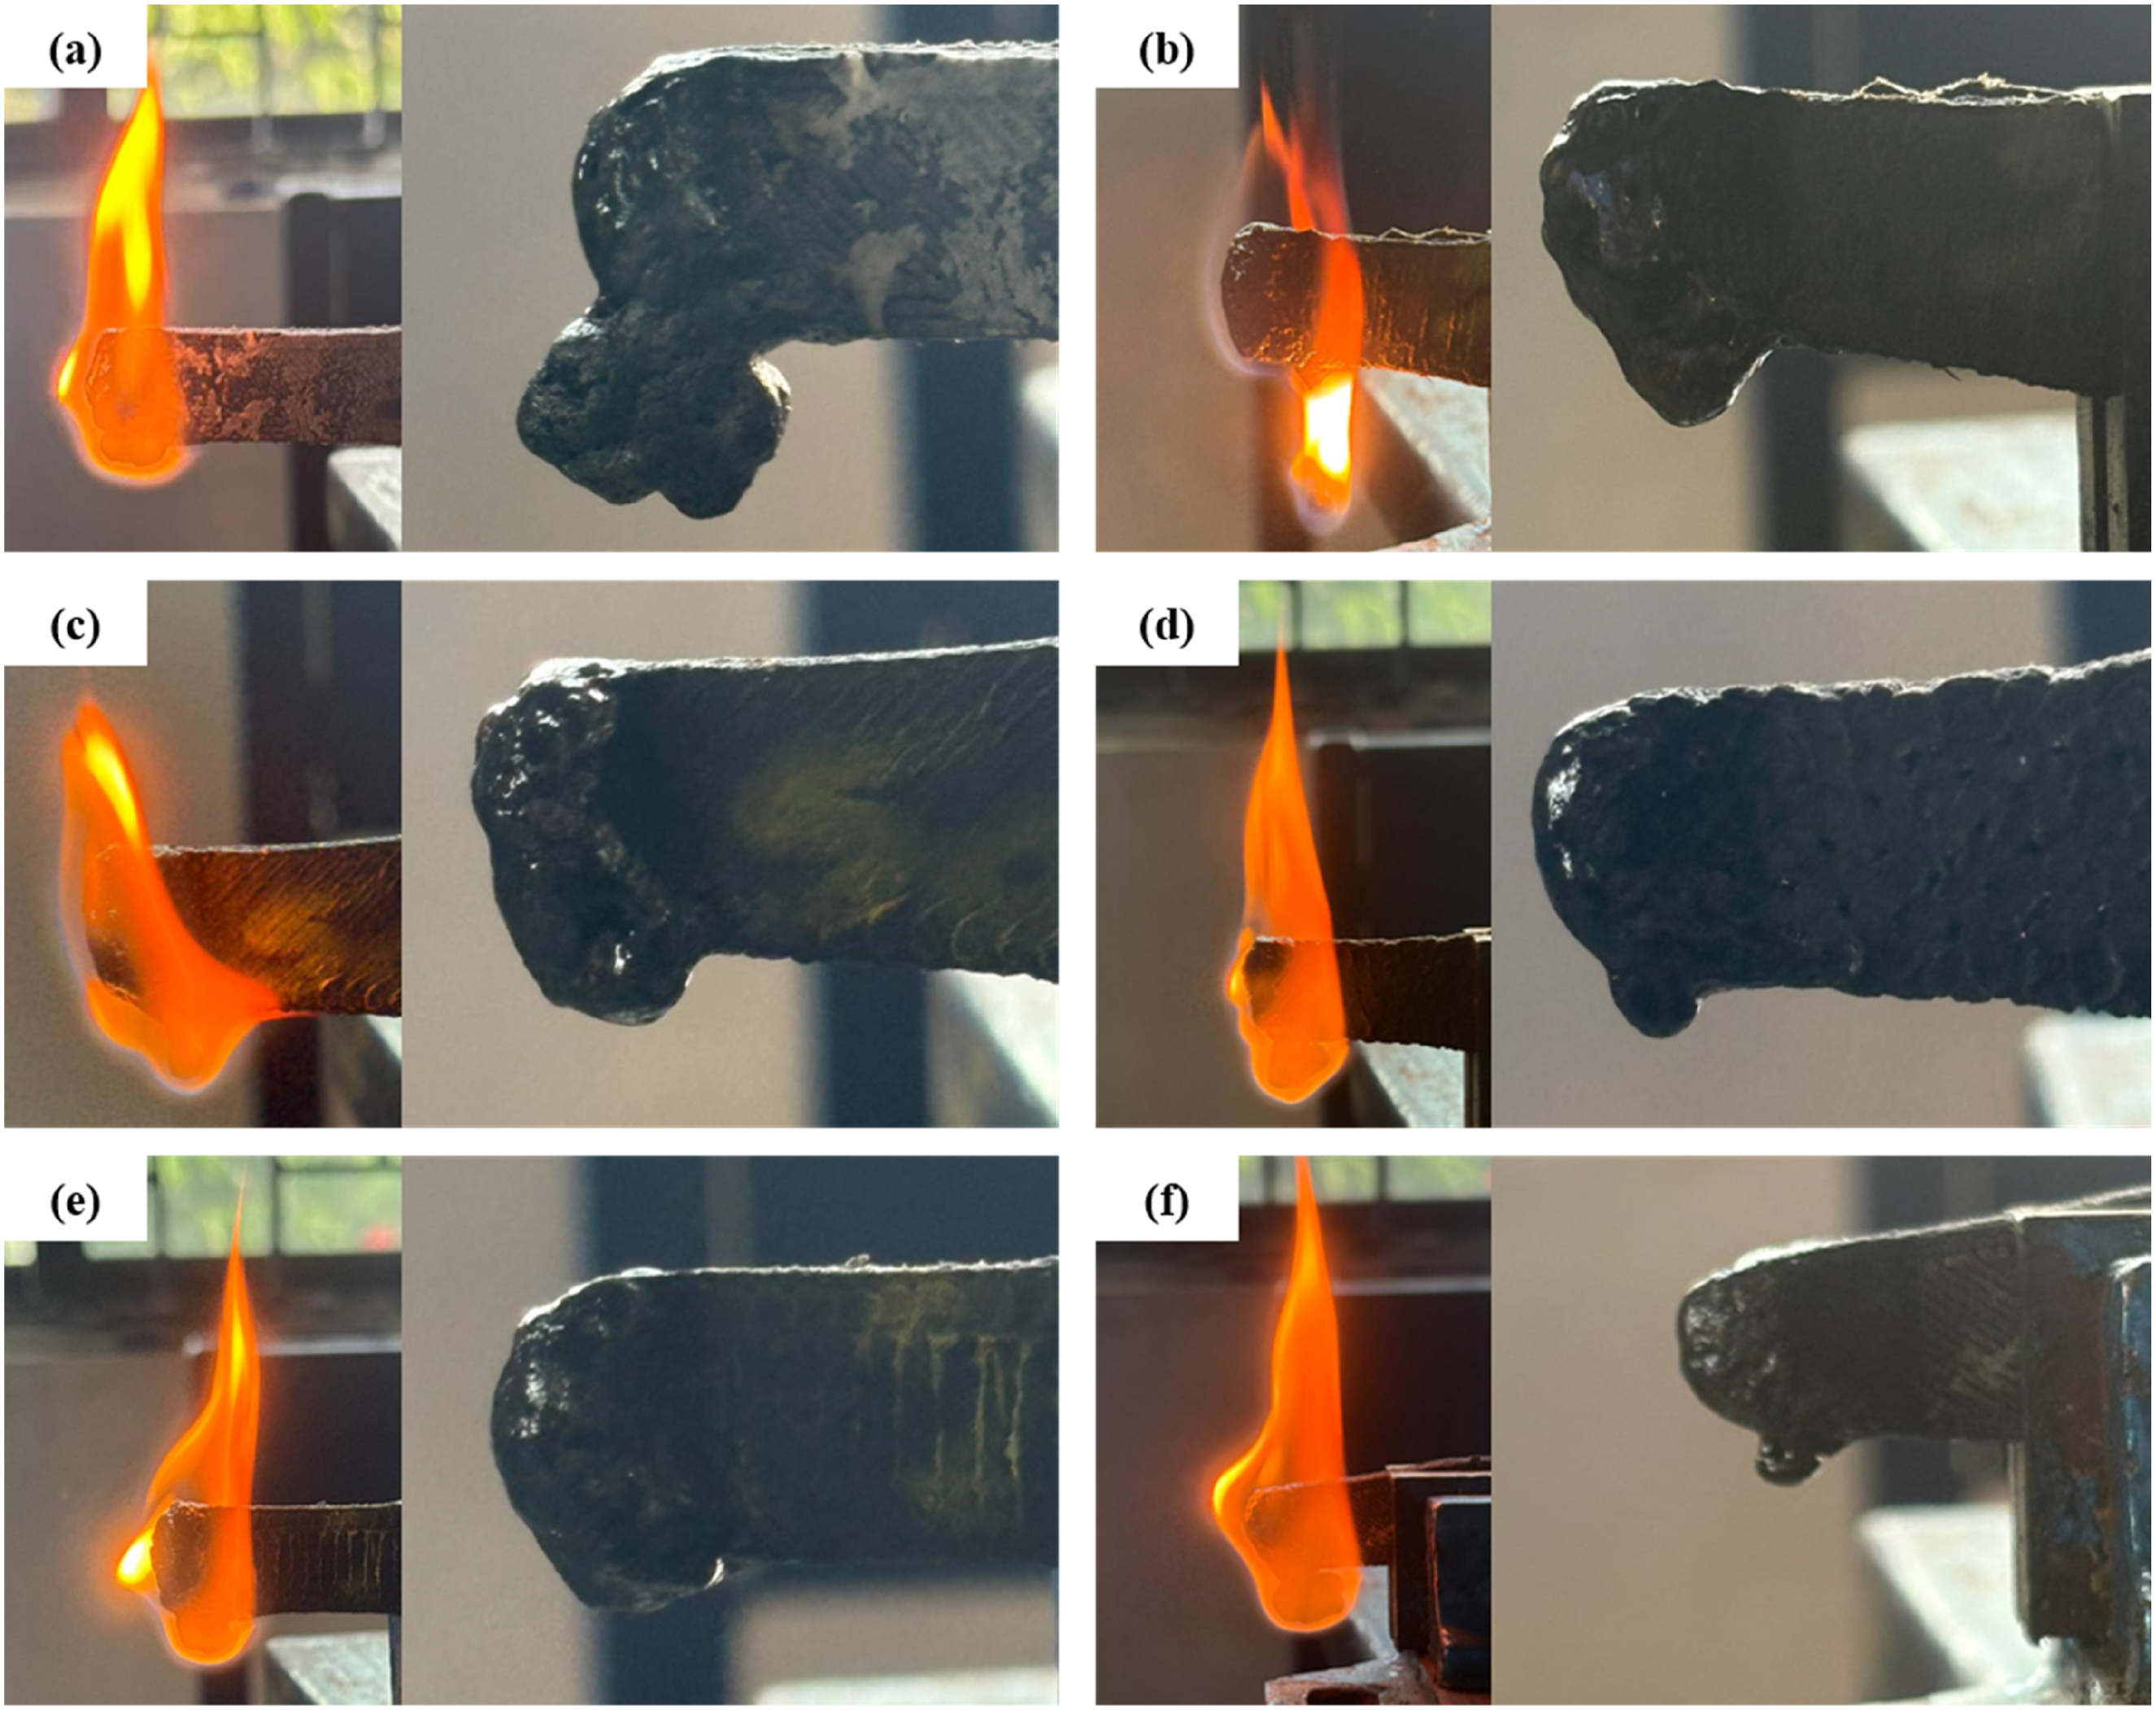
Conclusion
The aim of the study was to investigate the physical, mechanical, and flammability performance of 3D-printed PA-CF and PA-GF FGC. The samples were fabricated with different PA-CF/GF iteration layers, starting with a unary layer (1 layer) and ending with a quaternion layer (4 layers). The FGCs were fabricated using the print-pause-print method, in which, after printing the first layer with PA-GF, the printer paused to feed PA-CF filament, then deposited a layer of PA-CF on top of layer PA-GF, followed by continuous iteration. Based on the brief investigation following conclusion has been drawn: (1) The Shore D hardness and shrinkage results showed that PA-CF1/GF1 and PA-CF2/GF2 exhibited similar hardness values of 71.3 ± 2.1 SHD and 71 ± 1.8 SHD, respectively, along with the lowest shrinkage values of 11.9 ± 1.0% and 11.9 ± 0.8% among all the FGCs. These results indicate a more uniform reinforcement distribution and improved surface integrity. A comparable trend was also observed for the PA-CF3/GF3 sample, suggesting three-layer iteration is favourable for achieving optimal physical performance. (2) The flexural test revealed that PA-CF2/GF2 and PA-CF3/GF3 samples exhibited optimal layer iteration, showing the highest Fmax and Fs values of 31.2 ± 1.45 MPa and 32.9 ± 1.48 MPa, respectively, which are comparable to those of the PA-GF sample, which demonstrated superior flexural properties among all the 3D printed samples. (3) The tensile results revealed that the PA-CF2/GF2 and PA-CF3/GF3 samples exhibited the highest tensile properties, with a UTS value of 28.70 ± 1.0 MPa and 27.37 ± 0.4 MPa, respectively. The deposition of three-layer iteration of PA-GF and PA-CF enhances interlocking between CF-rich and GF-rich regions creating a denser, more compact surface structure with enhanced mechanical strength. (4) The flammability analysis revealed that all the samples have exhibited an HB rating, indicating comparable baseline flammability behaviour. The PA-CF4/GF4 sample exhibited the lowest V value of 8.34 mm/min and the longest total flame time of 8.344 s, indicating the formation of a more stable, continuous char layer due to CF-rich interfaces that restrict heat and mass transfer during combustion. (5) The developed composite can demonstrate strong potential for fabricating lightweight, semi-structural applications, including UAV components, automotive interior parts, customized tooling, and load-bearing polymer fixtures.
Footnotes
Acknowledgements
The authors would like to acknowledge Amrita Vishwa Vidyapeetham, Coimbatore, for providing valuable technical setups.
Declaration of conflicting interests
The authors declared no potential conflicts of interest with respect to the research, authorship, and/or publication of this article.
Funding
The authors received no financial support for the research, authorship, and/or publication of this article.
Declaration of generative AI and AI-assisted technologies in the writing process
During the preparation of this work, the authors used ChatGPT LLM in order to improve the readability and language of the written text. After using this tool/service, the author(s) reviewed and edited the content as needed and take(s) full responsibility for the content of the publication.