
Abstract
To address poor rheology, pumping challenges, and interfacial instability during pipe-jacking through sandy-spoil, this study develops a sodium polyacrylate (PAA)-modified bentonite slurry and establishes an integrated macro–micro–nano multiscale analytical framework. At the macroscopic level, an orthogonal design systematically evaluates fluid loss, Su’s funnel viscosity, bleeding rate, and friction coefficient; the results indicate that 12-14% bentonite with 0.3-0.4% PAA simultaneously achieves low fluid loss, near-zero bleeding, and pronounced friction reduction while keeping viscosity within the pumpable range. At the microscopic level, TEM reveals a transition from a dense, agglomerated state to a flexible, lubricated state; PAA forms a coating layer and lubricating film that enhance particle dispersion and flow, strengthen thixotropic recovery, and thereby optimize structural stability and rheological performance. At the nanoscale, MD elucidates a cooperative interfacial mechanism: PAA and water assemble on mineral surfaces into a stable hydrated/lubricating layer, where weak interactions strengthen particle-water-polymer coupling, accounting for the macroscopic improvements in friction reduction and stability. Overall, PAA modification enables coordinated “lubrication-water retention-interface stabilization,” providing experimental evidence and mechanistic support for optimizing pipe-jacking slurry formulations.
Introduction
As urbanization accelerates and spatial resources become increasingly constrained, underground infrastructure has correspondingly expanded, 1 imposing higher demands on the construction of subsurface structures. 2 Since its introduction, pipe-jacking has been widely deployed in urban tunneling, transportation facilities, and underground pipeline works owing to its high efficiency and low-disturbance characteristics.3–5 However, excessive frictional resistance at the pipe-soil interface is frequently encountered during pipe-jacking, which increases the required jacking force and, in turn, elevates energy consumption and construction risk, thereby constraining its broader application in urban underground development. 6 Studies indicate that this resistance arises primarily from interfacial friction and drag between the pipe wall and surrounding soil, and its magnitude is governed by multiple factors, including soil properties, depth of cover, grouting parameters, and construction conditions. 7 Moreover, inadequate control of pipe-soil interaction can induce ground settlement; if such settlement exceeds allowable limits, it may threaten adjacent structures, further compounding construction complexity and safety risks.
To address the suite of issues arising from excessive pipe-soil friction and ground settlement during pipe-jacking, researchers have proposed injecting a lubricating slurry between the pipe wall and the surrounding soil to reduce interfacial resistance and enhance ground stability, among which thixotropic slurries have become a focal topic owing to their distinctive mineral architecture and thixotropic behavior.8,9 Composed primarily of bentonite and water, a thixotropic slurry forms a three-dimensional network that behaves as a colloidal gel with finite strength at rest but rapidly liquefies under shear. 10 This trait enables the formation of a continuous, stable “mud film” between the pipe wall and soil during advance, markedly lowering interfacial friction; it also provides water sealing and helps prevent ground instability. 11 Wen, K., and co-workers incorporated pipe-soil-slurry interactions and combined numerical with theoretical results to develop a predictive model, thereby improving estimates of jacking thrust. 12 Using a conventional direct-shear device and a novel triaxial apparatus, Reilly, C. C., and colleagues reported that injecting thixotropic slurry can reduce frictional resistance by up to 90% and decrease the thrust required for pipe-jacking-findings especially relevant to urban utility construction. 13 Liu H.D. et al. showed, via uniaxial and AE tests, that clay thickness/quantity and moisture weaken mudstone–clay roofs and shift failure from tensile–shear to pure tensile. 14 Liu, S., et al. demonstrated that optimizing thixotropic slurry formulations effectively diminishes soil friction and ground settlement, ensuring smooth pipe advancement and exhibiting strong adaptability under complex soil conditions. 15
With the deepening of research on thixotropic slurries, investigators have pursued more efficient modification strategies. Sodium polyacrylate (PAA), a common polymer with excellent water solubility as well as strong adhesion and dispersibility, has gradually become a key component for optimizing the performance of thixotropic slurries. 16 Li, M.’s team mixed bentonite and PAA into mortar to prepare a cement-based mortar with humidity-regulating functionality, and characterized its morphology and structure using X-ray diffraction (XRD) and Fourier-transform infrared spectroscopy (FTIR); the results showed that the modified mortar outperformed the original mortar in both morphology and humidity regulation. 17 Gao, C. and colleagues reported the preparation and application of poly(acrylic acid) (PAA)-modified chitosan (CS/PAA), demonstrating that PAA enables cement pastes to achieve higher flexural strength without reducing compressive strength. 18 Lyu, J. and co-workers, through water-vapor adsorption tests and SEM-EDS analyses, found that PAA exhibits strong adsorption but weak desorption and more prominently promotes cement hydration, significantly increasing the degree of hydration and calcium content. 19 Takeno, H. et al. compared the tensile properties of clay/poly(propylene oxide) and clay/sodium polyacrylate systems with similar molecular masses, showing stronger clay-PAA interactions and higher tensile extensibility and fracture stress in the clay/PAA system. 20
In summary, prior research on thixotropic slurries has largely focused on the macro and micro-scales. 21 Macroscale studies primarily use laboratory tests and engineering applications to evaluate rheology, lubrication, and the mitigation of frictional resistance under various construction environments. Microscale investigations emphasize mineral composition, particle-size distribution, and interactions with water molecules. Nevertheless, the underlying mechanisms remain insufficiently resolved, particularly at the molecular level. To elucidate the role of PAA in thixotropic slurries, molecular dynamics (MD) provides a powerful approach. 22 Gupta et al. employed MD to examine the structure and dynamics of irregular poly(acrylic acid) (PAA) aqueous solutions across different concentrations and charge densities, showing that PAA chains contract with increasing concentration and that interchain aggregation intensifies accordingly. 21 Feng, Y., and his students demonstrated via MD that pretreatment of carbon fibers and the use of modifiers enhance interfacial bonding with cement matrices through hydrogen bonding and ionic interactions, forming stable interfacial architectures. 23 Wei, P. C., and co-workers investigated the frictional behavior between montmorillonite layers at varying water contents, locating the friction/shear zone within the interlayer spacing. 24 Collectively, the literature indicates that MD can delineate PAA-soil/mineral interactions and clarify the mechanisms by which PAA reduces friction, strengthens interfacial adhesion, and improves slurry stability.
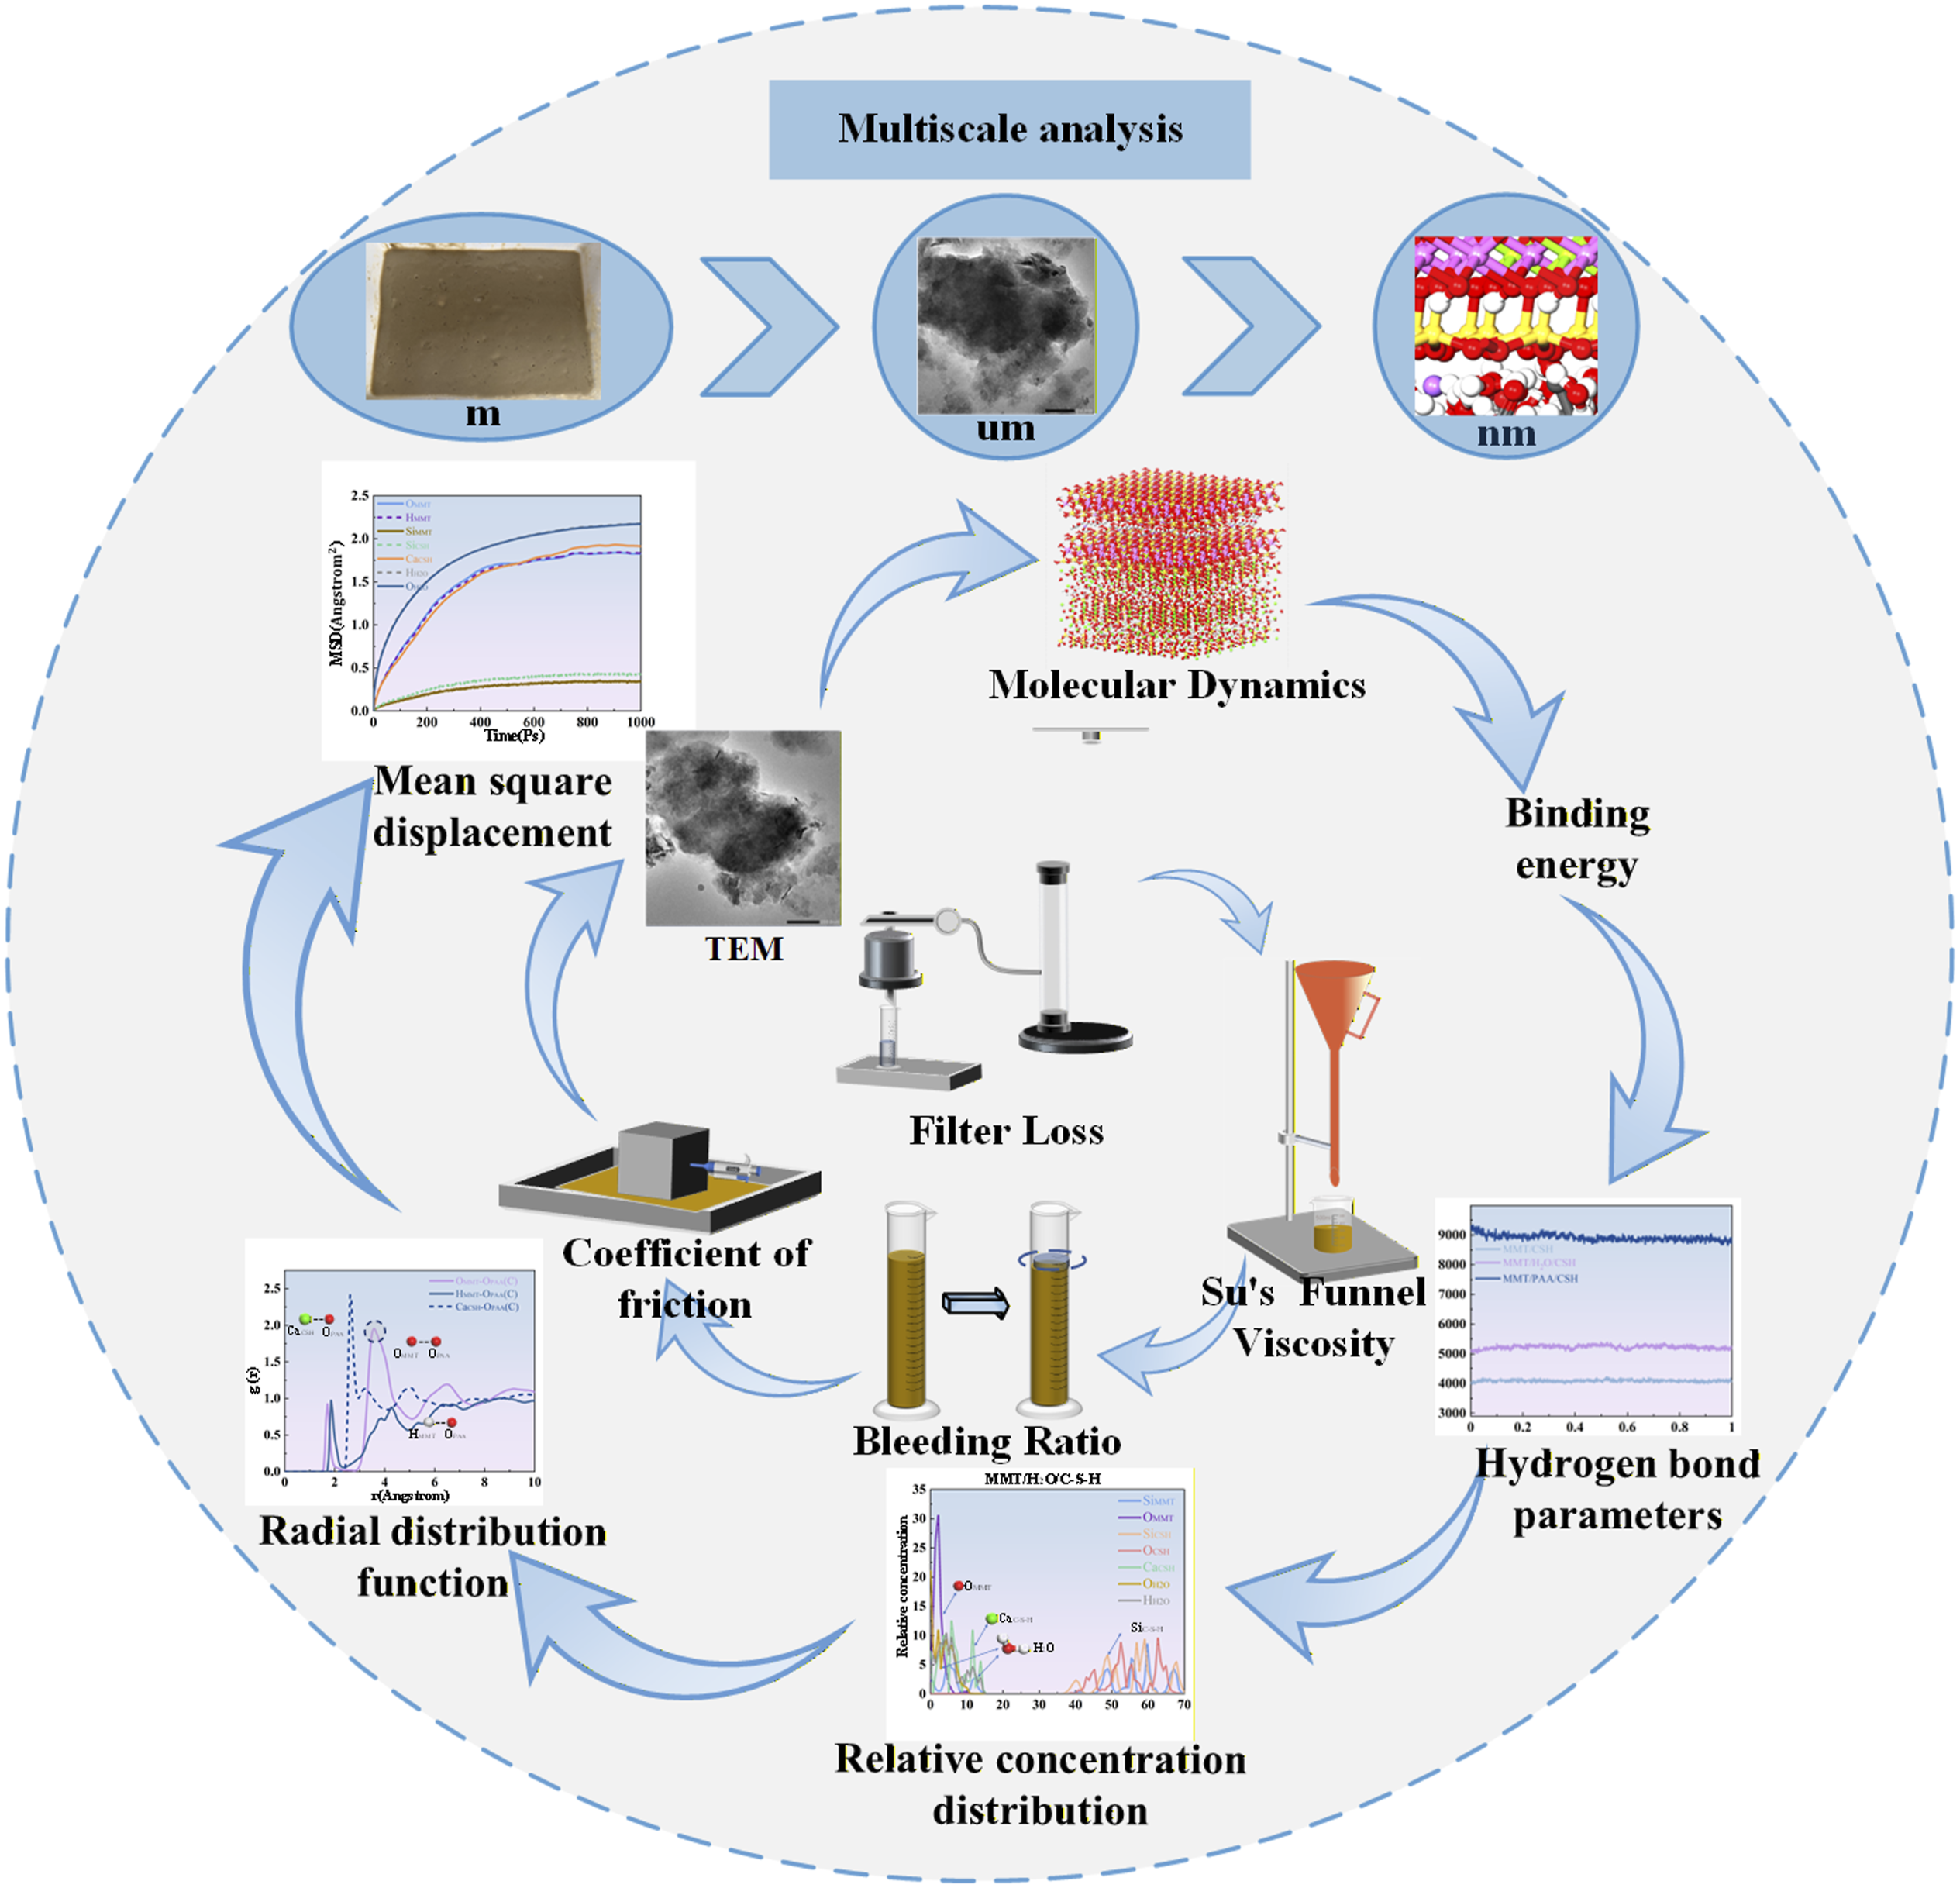
To fill the gap in understanding the interfacial mechanisms of thixotropic slurries, this study for the first time introduces a multiscale analysis into the thixotropic slurry system and systematically investigates the dual enhancement by sodium polyacrylate (PAA) of interface friction reduction and overall performance in pipe jacking. At the macroscopic scale, slurry performance indices and specimen friction tests are used to evaluate how different PAA contents affect interface friction during pipe jacking. At the microscopic scale, transmission electron microscopy (TEM) is used to observe interfacial morphological changes between the thixotropic slurry and soil, to analyze the rheological behavior of the PAA modified slurry, and to examine its role in reducing friction during construction while providing a certain degree of structural support. At the nanoscale, molecular dynamics (MD) simulations combined with binding energy (BE), hydrogen bond (HB) analysis, radial distribution functions (RDF), and mean square displacement (MSD) are employed to quantify changes in friction at the interface between the PAA modified slurry and soil and to elucidate the atomistic thixotropic mechanisms that underpin friction reduction.
This study demonstrates the mechanism by which PAA modified slurry reduces interface friction during pipe jacking and helps prevent ground settlement, provides new theoretical support for the application of thixotropic slurry, and promotes its wider adoption in engineering practice under complex ground conditions.
Experimental methods
Starting materials
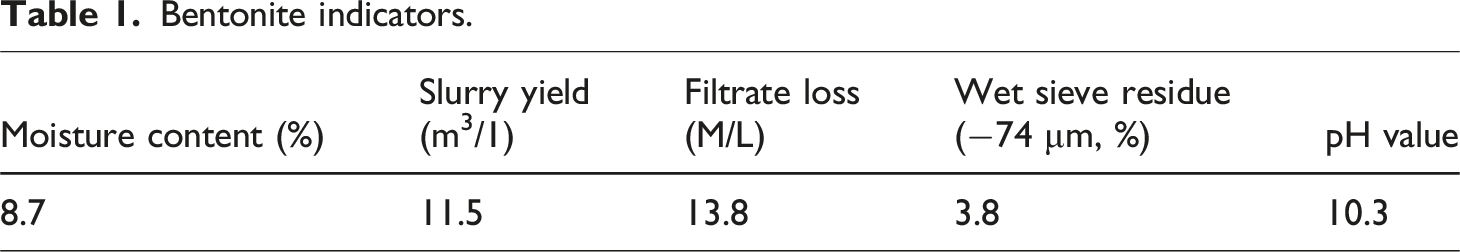
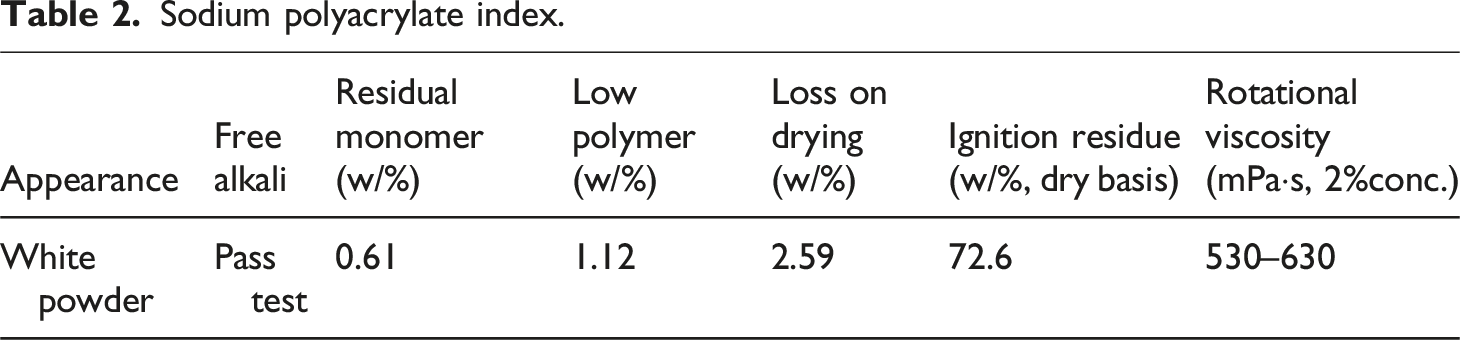
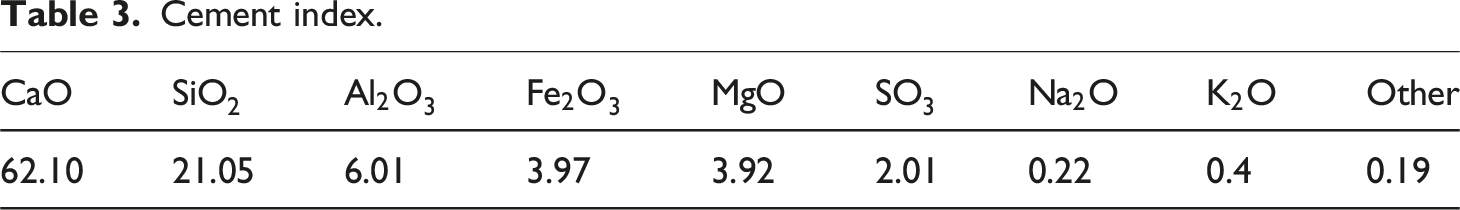
Figure 1 provides the bentonite used for the slurry in this study, the appearance of high purity sodium polyacrylate powder, the Portland cement used to cast the concrete specimens for the slurry friction coefficient tests, as well as the mudstone and the prepared thixotropic slurry; the relevant parameters are given in Tables 1–3. The results indicate that all materials meet the requirements of the subsequent experiments and provide a reliable basis for the performance analysis. Materials for thixotropic slurry and friction tests. Bentonite indicators. Sodium polyacrylate index. Cement index.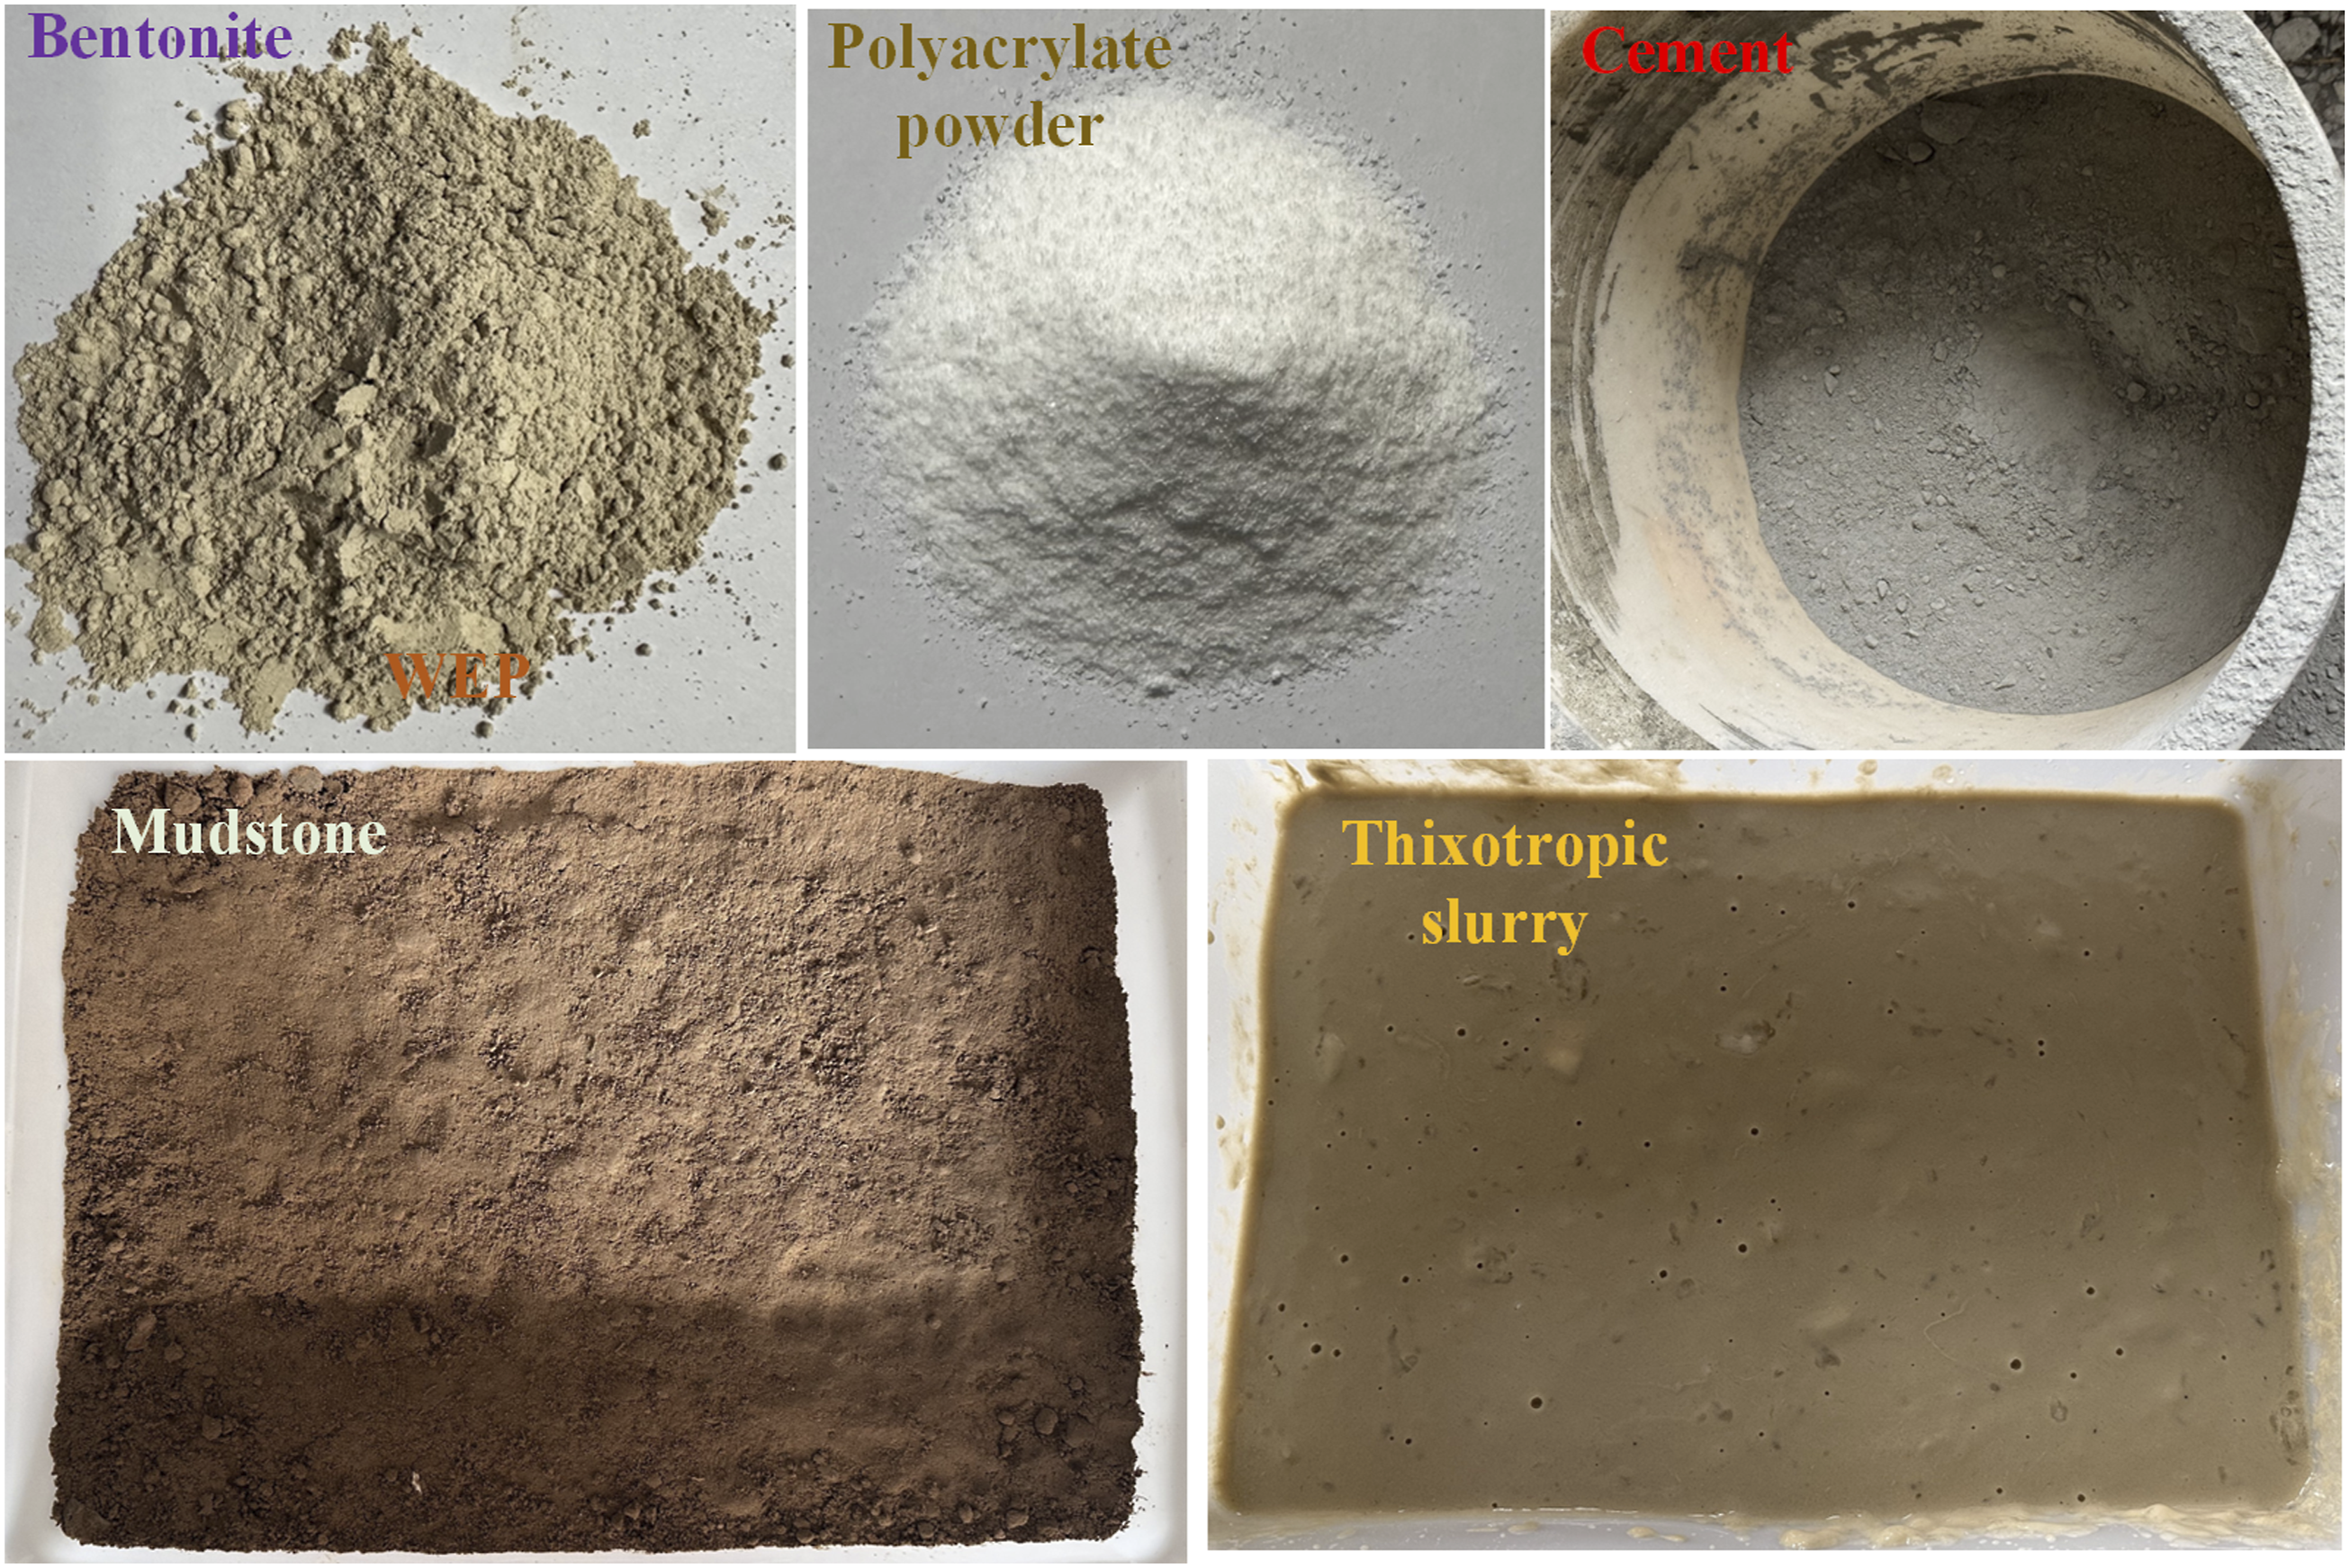
Mixture design
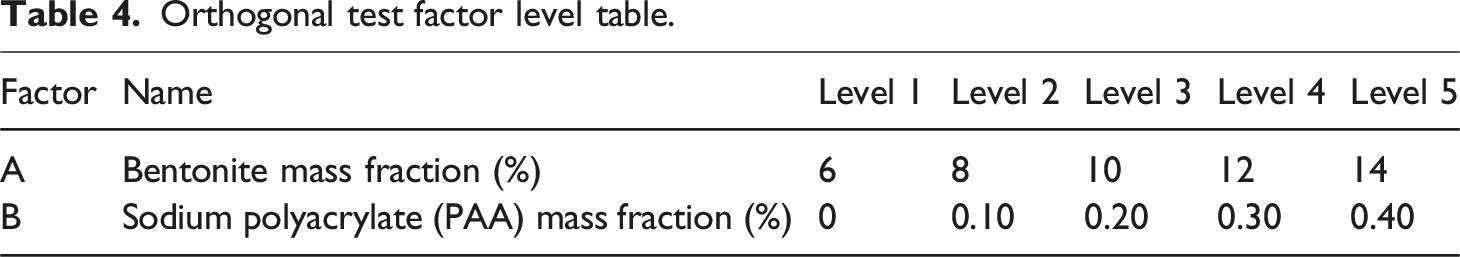
Previous studies and engineering practice show bentonite contents below 6% cause insufficient yield stress and poor water retention, while exceeding 15% leads to excessive viscosity, poor pumpability, and reduced lubrication efficiency in pipe-jacking grouting. Thus, 6-14% was chosen to cover the practical operating range and avoid extreme rheological conditions. 25 The dosage of sodium polyacrylate is typically referenced to the mass of bentonite and controlled at approximately 0.4% by mass; this proportion has been verified in the literature and in the authors’ prior studies. 26
Orthogonal test factor level table.
Sample preparation
Preparation of PAA solution
In this study, the PAA solution was prepared directly from powder. During preparation, the required mass of PAA powder was slowly added to a portion of deionized water and stirred at low speed for 5–10 min to achieve initial dispersion. The remaining water was then added according to the designed proportion, and with continuous stirring the PAA was allowed to dissolve gradually to avoid local concentration spikes that could induce flocculation. After all additions, stirring was maintained for 20–30 min to ensure homogeneity. The solution was then allowed to stand for 1-2 h to permit further uncoiling of the PAA chains in water, thereby enhancing thixotropy. Immediately before use, the solution was gently stirred for 5–10 min to obtain a stable and uniform PAA solution.
Preparation of thixotropic slurry
Preparation began with hydration of the bentonite. According to the designed proportion, add clean water to the mixing vessel and slowly sprinkle bentonite powder while stirring at 300–400 r/min to avoid agglomeration. Continue stirring for 20–30 min and then allow the mixture to stand for 12–24 h so that the bentonite fully hydrates to form the slurry matrix. Subsequently, introduce the pre-treated PAA solution into the slurry at the designed dosage while maintaining stirring at 300 r/min to ensure uniform dispersion. To further promote homogenization and maturation, after all materials have been added increase the stirring speed to 400–500 r/min and continue stirring for 15–20 min. Allow the resulting slurry to rest for 1-2 h to enhance thixotropic-related performance. Immediately before use, gently stir for 5–10 min.
Preparation of concrete specimens
Concrete cubes with dimensions 100 × 100 × 100 mm were prepared at a water-to-cement ratio of 0.45. After thorough mixing, the mixtures were cast and cured under standard conditions (20 ± 2°C, relative humidity >95%) for 28 d. After curing, the contact surfaces of the specimens were ground and cleaned to ensure surface flatness and consistency.
Experimental apparatus and methods
Measurement of slurry performance indices and friction coefficient
In pipe jacking, thixotropic slurry is crucial for lubrication, friction reduction, and ground support. Slurry performance was evaluated using six parameters: specific gravity, pH, fluid loss, water separation ratio, filter cake thickness, and Su’s funnel viscosity. Among these, fluid loss, funnel viscosity, and bleeding rate are the most influential. 27 Accordingly, this study tested these three indices and the friction coefficient under different mixture proportions.
Measurement of fluid loss employed an air-pressurized filter press at 0.69 MPa for 30 min, with the collected filtrate volume taken as the fluid loss. Principle: under applied gas pressure, a portion of the water in the slurry passes through filter paper and is collected in a graduated cylinder. Su’s funnel viscosity was measured with a Su’s funnel by recording the efflux time (s) required to reach 500 mL in a graduated cup. Principle: a fixed volume of slurry drains through the funnel under gravity, and the time to 500 mL characterizes flowability. The bleeding ratio was determined by placing 100 mL of slurry in a graduated cylinder for 24 h, measuring the volume of supernatant water, and converting it to a percentage. Principle: upon standing, the slurry undergoes solid–liquid separation, and the amount of water appearing at the top reflects slurry stability. For the slurry friction coefficient test, a field-collected soil–rock mixture was placed in a model box and compacted; a concrete specimen resting on the surface was then driven at a constant rate using a mechanical push–pull force gauge, and the thrust reading was recorded. Tests were repeated under different slurry mix proportions and the results compared. Figure 2(a)–(d) present the equipment used and schematic principles for these analyses. Experimental apparatus and principles.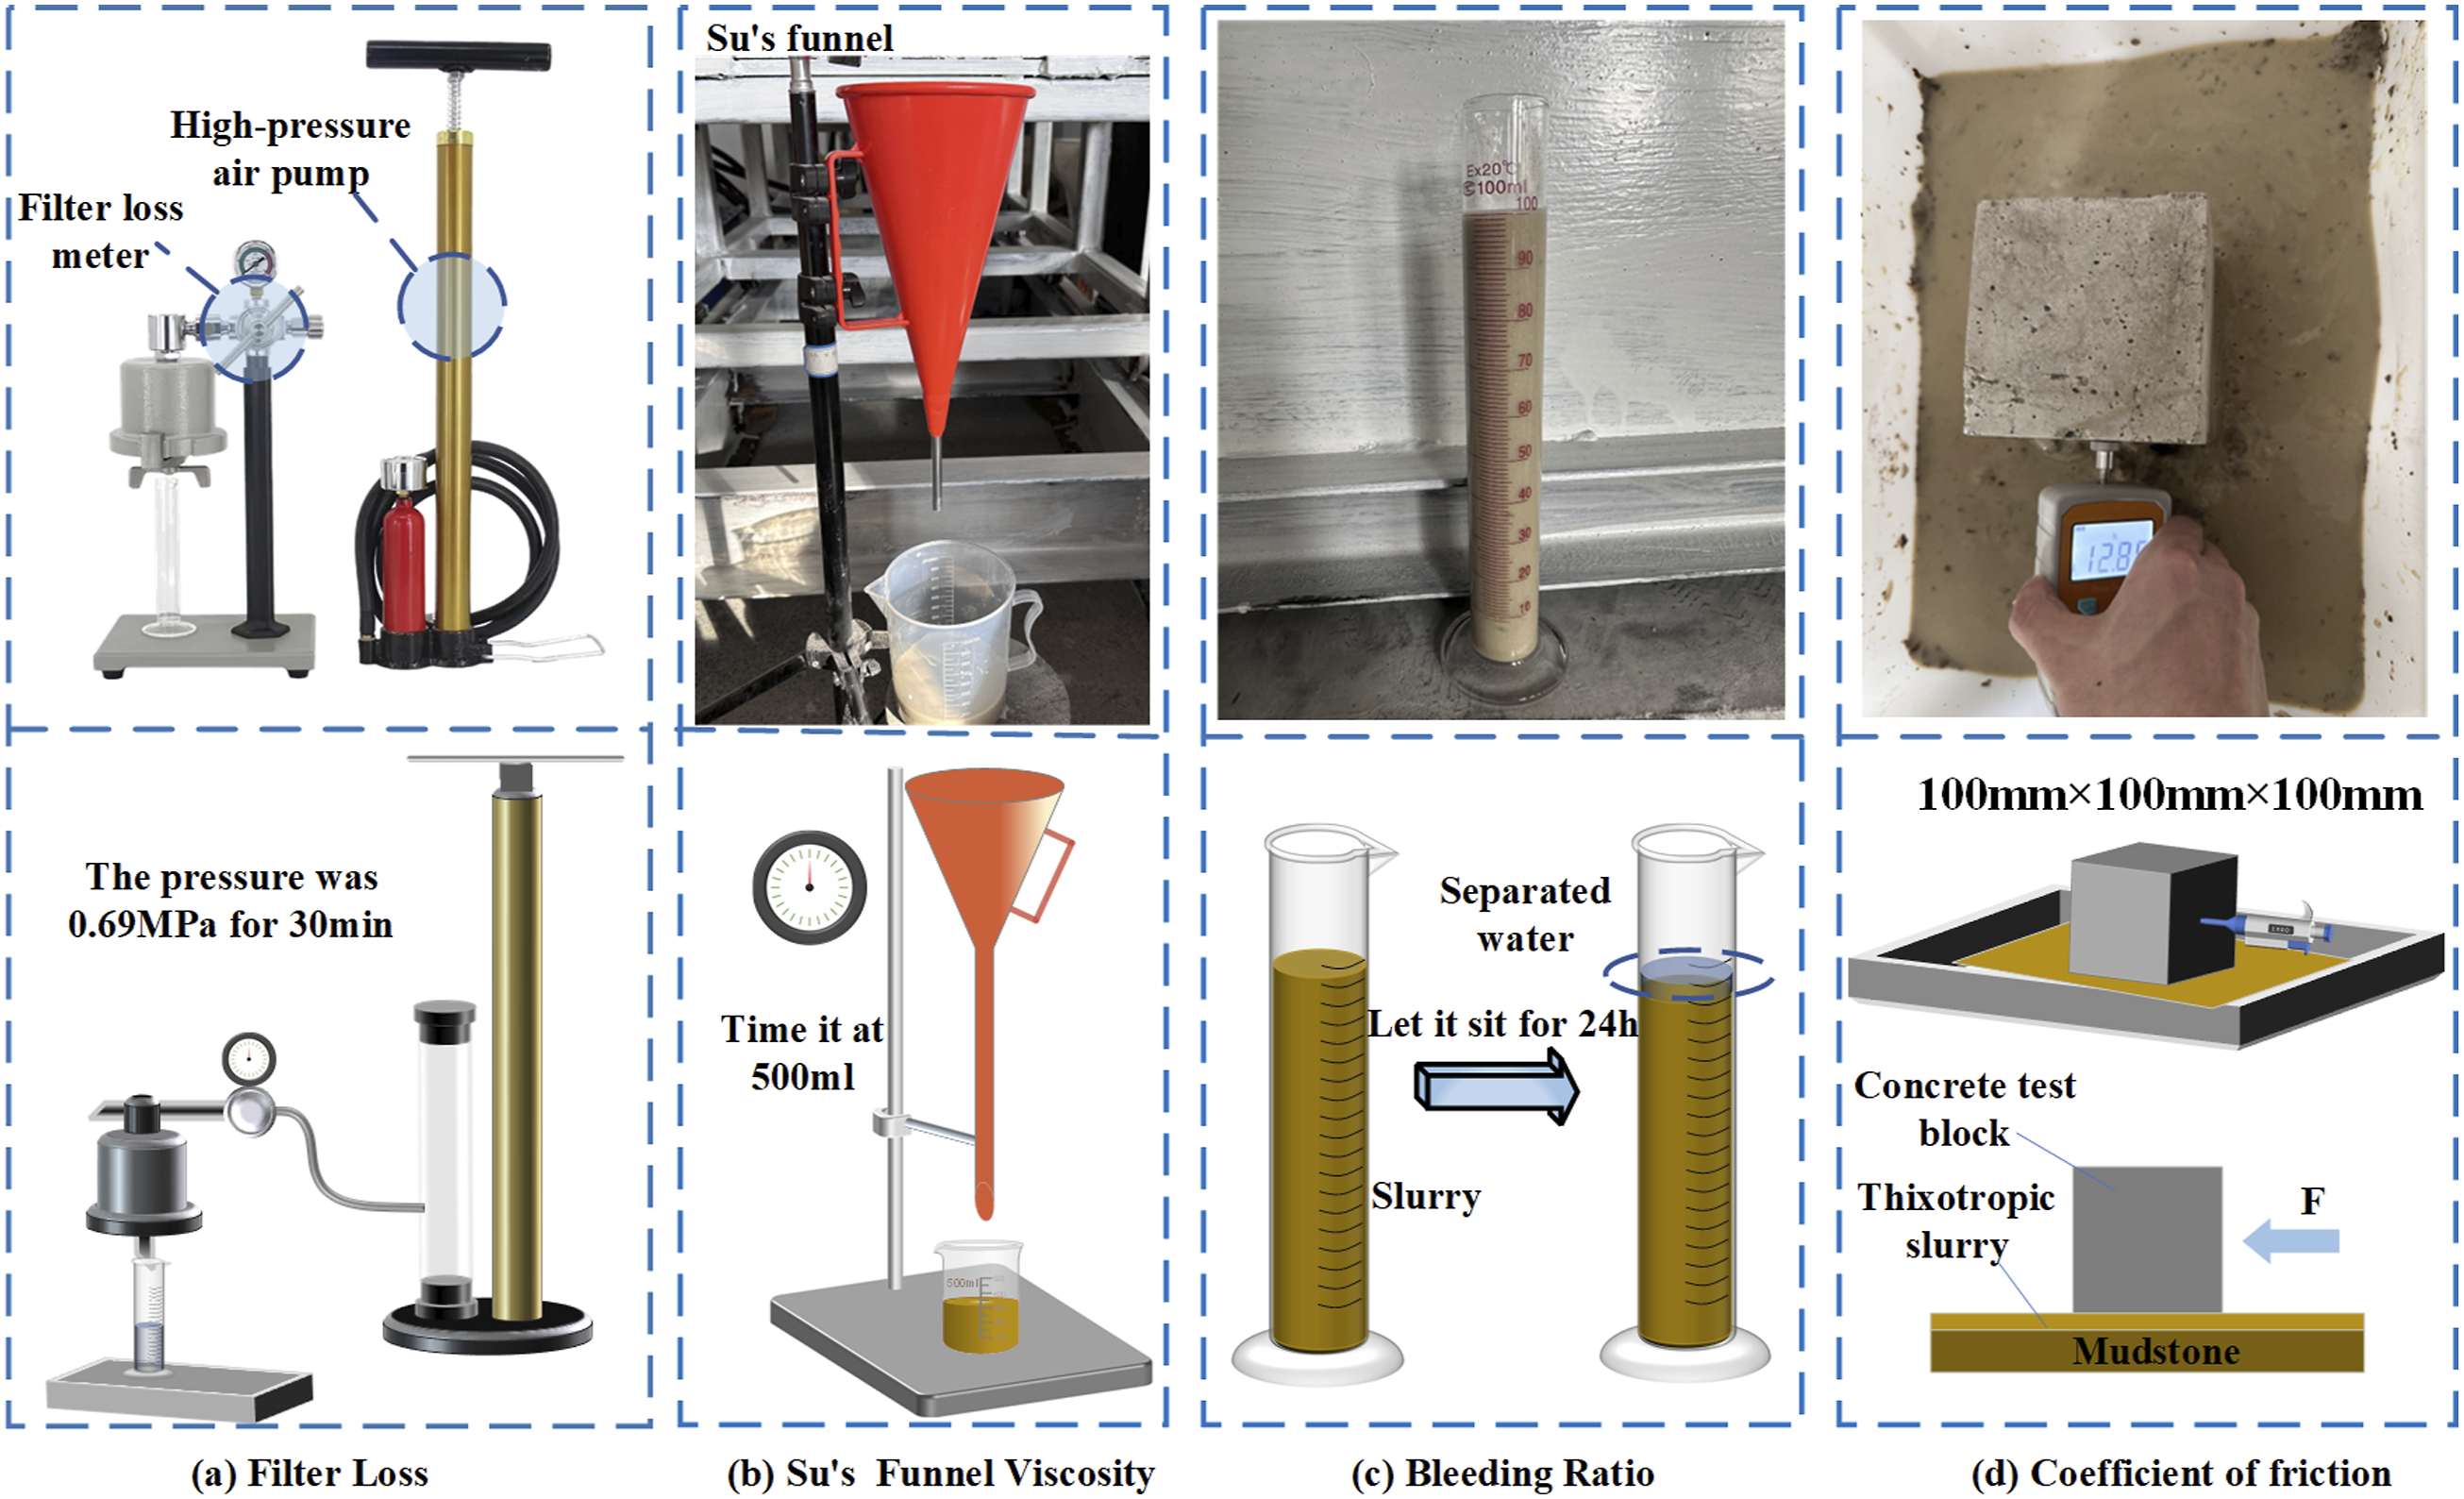
Transmission Electron Microscope (TEM)
TEM offers ultrahigh spatial resolution and versatile microanalytical capabilities, making it a key technique for characterizing nanoscale interfacial structures. According to prior studies, the prepared slurry specimens are electron transparent and suitable for TEM observation. 28 In this study, TEM specimens were prepared by the powder dispersion method. 29 Dried slurry was ground to a fine powder in an agate mortar; approximately 0.02 g of powder was transferred to a 1.5 mL microcentrifuge tube, and 1 mL of anhydrous ethanol was added as the dispersing medium. The suspension was ultrasonically dispersed for 5–10 min, allowed to stand for 3–5 min, and the supernatant was used for grid preparation. Using a micropipette, about 3 µL of the suspension was deposited onto a carbon-coated copper grid; excess liquid was wicked from the edge with filter paper, and the grid was air dried in a clean environment. After drying, the samples were examined directly by TEM.
Nanoscale simulation methods
Computational model
All structural models were constructed on the Materials Studio 2023 platform. The models were then imported into LAMMPS for energy minimization, ensemble control, and molecular dynamics simulations. This workflow leverages the modeling and visualization strengths of Materials Studio together with the computational efficiency of LAMMPS, enabling reliable simulation of the microstructural features and evolutionary mechanisms of the studied system.
Bentonite (Montmorillonite) model
Observation of the thixotropic slurry microstructure indicates that the system consists primarily of montmorillonite and polymeric components, and its behavior is governed mainly by the distinctive lattice structure of montmorillonite(MMT). 27 The montmorillonite model adopted here follows the Wyoming-type structure proposed by Viani et al.30,31 This mineral is a canonical 2:1 layered silicate in which tetrahedral Si-O sheets, an octahedral Al-O sheet, and a tetrahedral Si-O sheet (TOT) stack along the [0 0 1] crystallographic direction.32,33 The unit-cell composition is Na0.75(Si7.75Al0.25) (Al3.5Mg0.5)O20(OH)4, with lattice parameters a = 5.18–5.23 Å, b = 8.98–9.06 Å, and c = 9.6 Å (dry state). Within the structure, one of every 32 Si4+ in the tetrahedral sheet is replaced by Al3+, and one of every 8 Al3+ in the octahedral sheet is replaced by Mg2+; substitution sites are arranged so that adjacent positions are not substituted simultaneously. 34 The resulting −0.75 e layer charge is compensated by interlayer Na+ ions. This model satisfies layer-charge constraints and is representative in both structural and electrochemical characteristics. 35
Abbasi, B., and co-workers used molecular dynamics to investigate the nanoscale stick–slip behavior of hydrated Na-montmorillonite under hydrostatic stress with explicit interlayer water, showing that stick–slip is governed by the structure of the interlayer water.
36
Consequently, explicit inclusion of interlayer water molecules is essential: they determine the basal spacing and structural stability and regulate interlayer adsorption and migration, thereby mediating layer–layer interactions and more faithfully reflecting the frictional response of montmorillonite. The composition is Na0.75(Si7.75Al0.25) (Al3.5Mg0.5)O20(OH)4·nH2O. Experimental studies indicate that the thickness of bound water in montmorillonite ranges from 3.1 to 10.65 Å, corresponding to 10–100% relative humidity.
37
Accordingly, in this study a single monolayer of water molecules was randomly adsorbed in the interlayer by a Monte Carlo procedure to represent 10% water content (mass fraction, defined as the mass of water relative to dry montmorillonite).
38
Subsequent simulations were conducted on this basis, as shown in Figure 3(a). Model construction process for each component.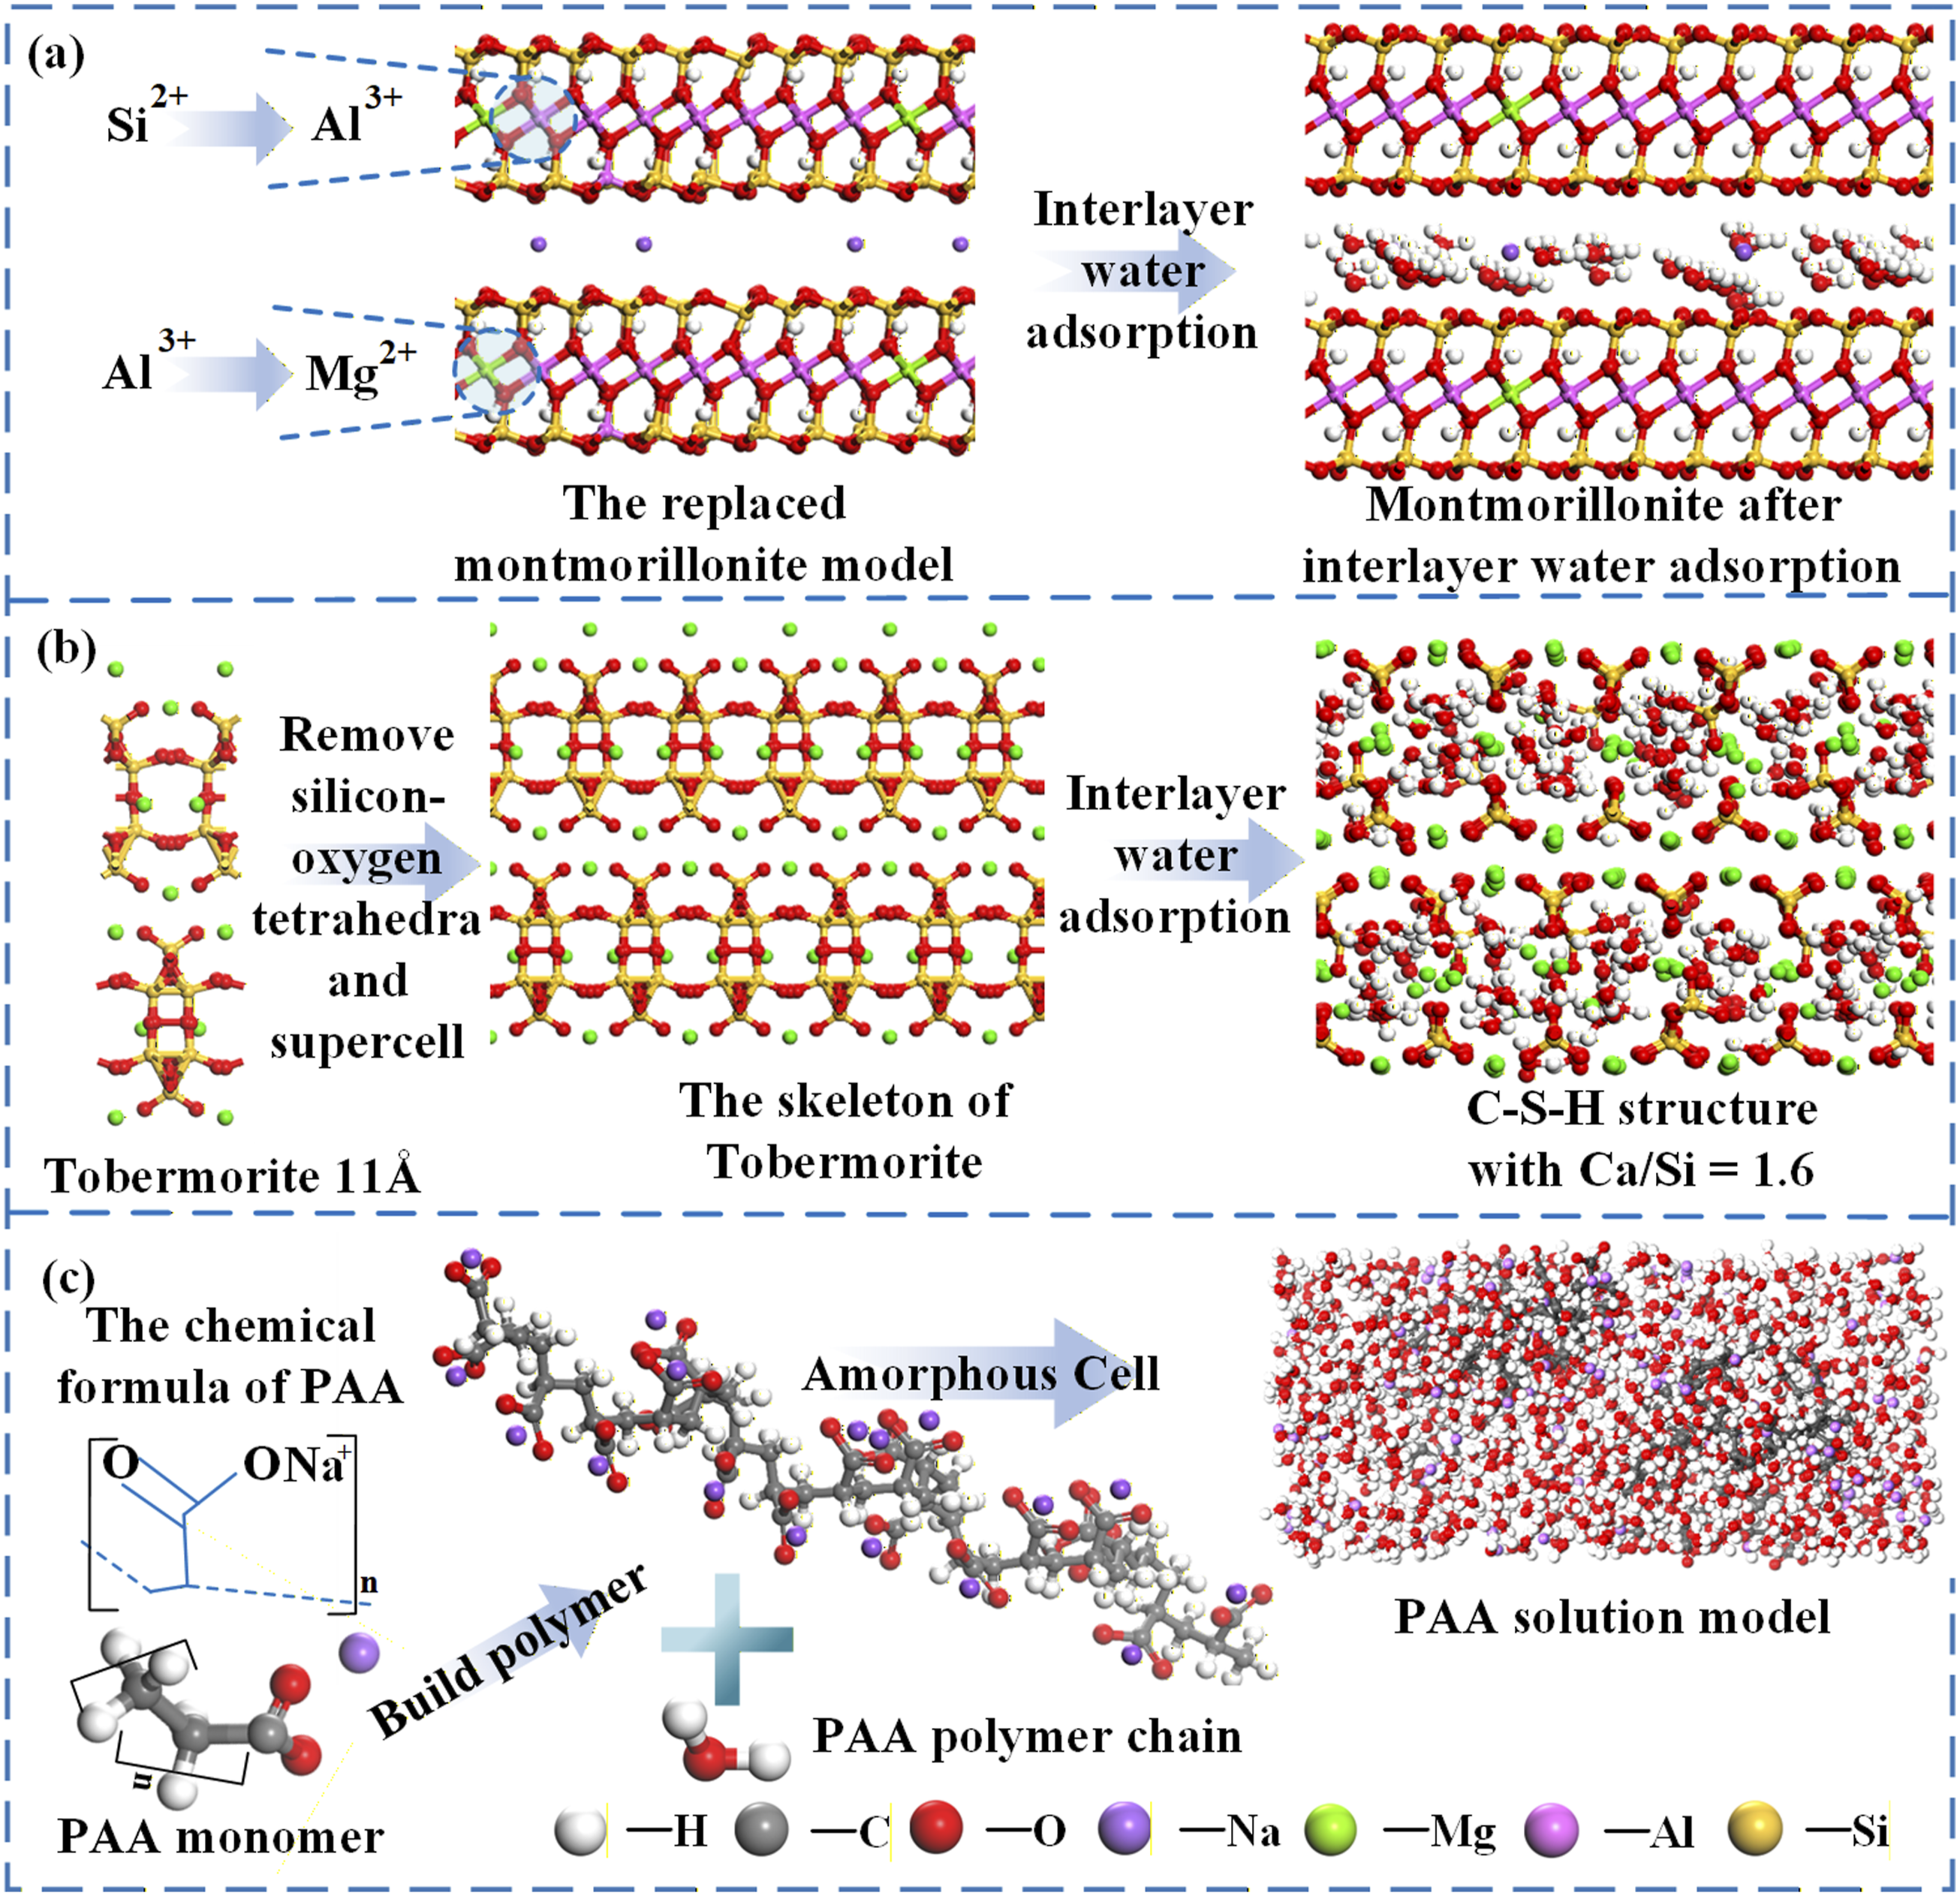
Cement Model
Calcium silicate hydrate (C–S–H) gel, the principal hydration product of cement paste, is a key determinant of concrete mechanical properties. 39 In this study, the C–S–H phase is treated as a layered silicate composed of alternating calcium–silicate sheets and is modeled on the 11 Å Tobermorite structure. 40 The unit cell has the composition Ca2.25[Si3O7.5(OH)1.5]·H2O with lattice parameters a = 22.34 Å, b = 22.18 Å, c = 22.78 Å, and α = β = γ = 90°. To obtain Ca/Si ≈ 1.6, bridging Si–O tetrahedra were randomly removed from selected silicate chains, consistent with small angle neutron scattering (SANS) results indicating a composition of (CaO)1.7(SiO2)·1.8H2O. 41 Water molecules were then inserted into structural voids using a grand canonical Monte Carlo (GCMC) procedure. 42 Subsequent dynamical relaxation over 300–800 K yielded the amorphous C–S–H structure shown in Figure 3(b). The resulting model not only captures essential structural features of C–S–H but also aligns well with experimental stoichiometry and structural descriptors. 43
Sodium polyacrylate (PAA) model
As shown in Figure 3(c). In modeling PAA, polymer chains were constructed from the repeat unit –[CH2–CH(COONa)]– with a degree of polymerization of approximately 20 to balance computational efficiency and molecular representativeness. 22 Sodium ions (Na+) were included as dissociated counterions coordinated to carboxylate (–COO-) groups to reflect the aqueous state. The PAA chain and an appropriate number of water molecules were then placed in a simulation box to form an aqueous PAA system. After geometry optimization and molecular dynamics relaxation, the resulting configurations, which are closer to the slurry environment, were used for subsequent simulations of interfacial interactions and rheological behavior.
Interface model construction
In this study, layered interface models were built using the Build Layers module. First, MMT and C-S-H unit cells were constructed in Materials Studio, and supercell expansion and lattice matching were applied to obtain the initial interface. Three systems were then assembled in sequence: MMT/C-S-H as a dry reference interface formed by direct juxtaposition, as shown in Figure 4(a); MMT/H2O/C-S-H with water molecules inserted in the interlayer and at the interface and a free water region placed between the two phases to emulate the baseline slurry environment, as shown in Figure 4(b); and MMT/PAA/C-S-H formed by adding a PAA chain to the water containing system to represent the modified slurry, as shown in Figure 4(c). All systems were geometry optimized and imported into LAMMPS, where energy minimization and ensemble relaxation were performed to obtain equilibrated structures. Interface model construction for MMT/C-S-H, MMT/H2O/C-S-H, and MMT/PAA/C-S-H.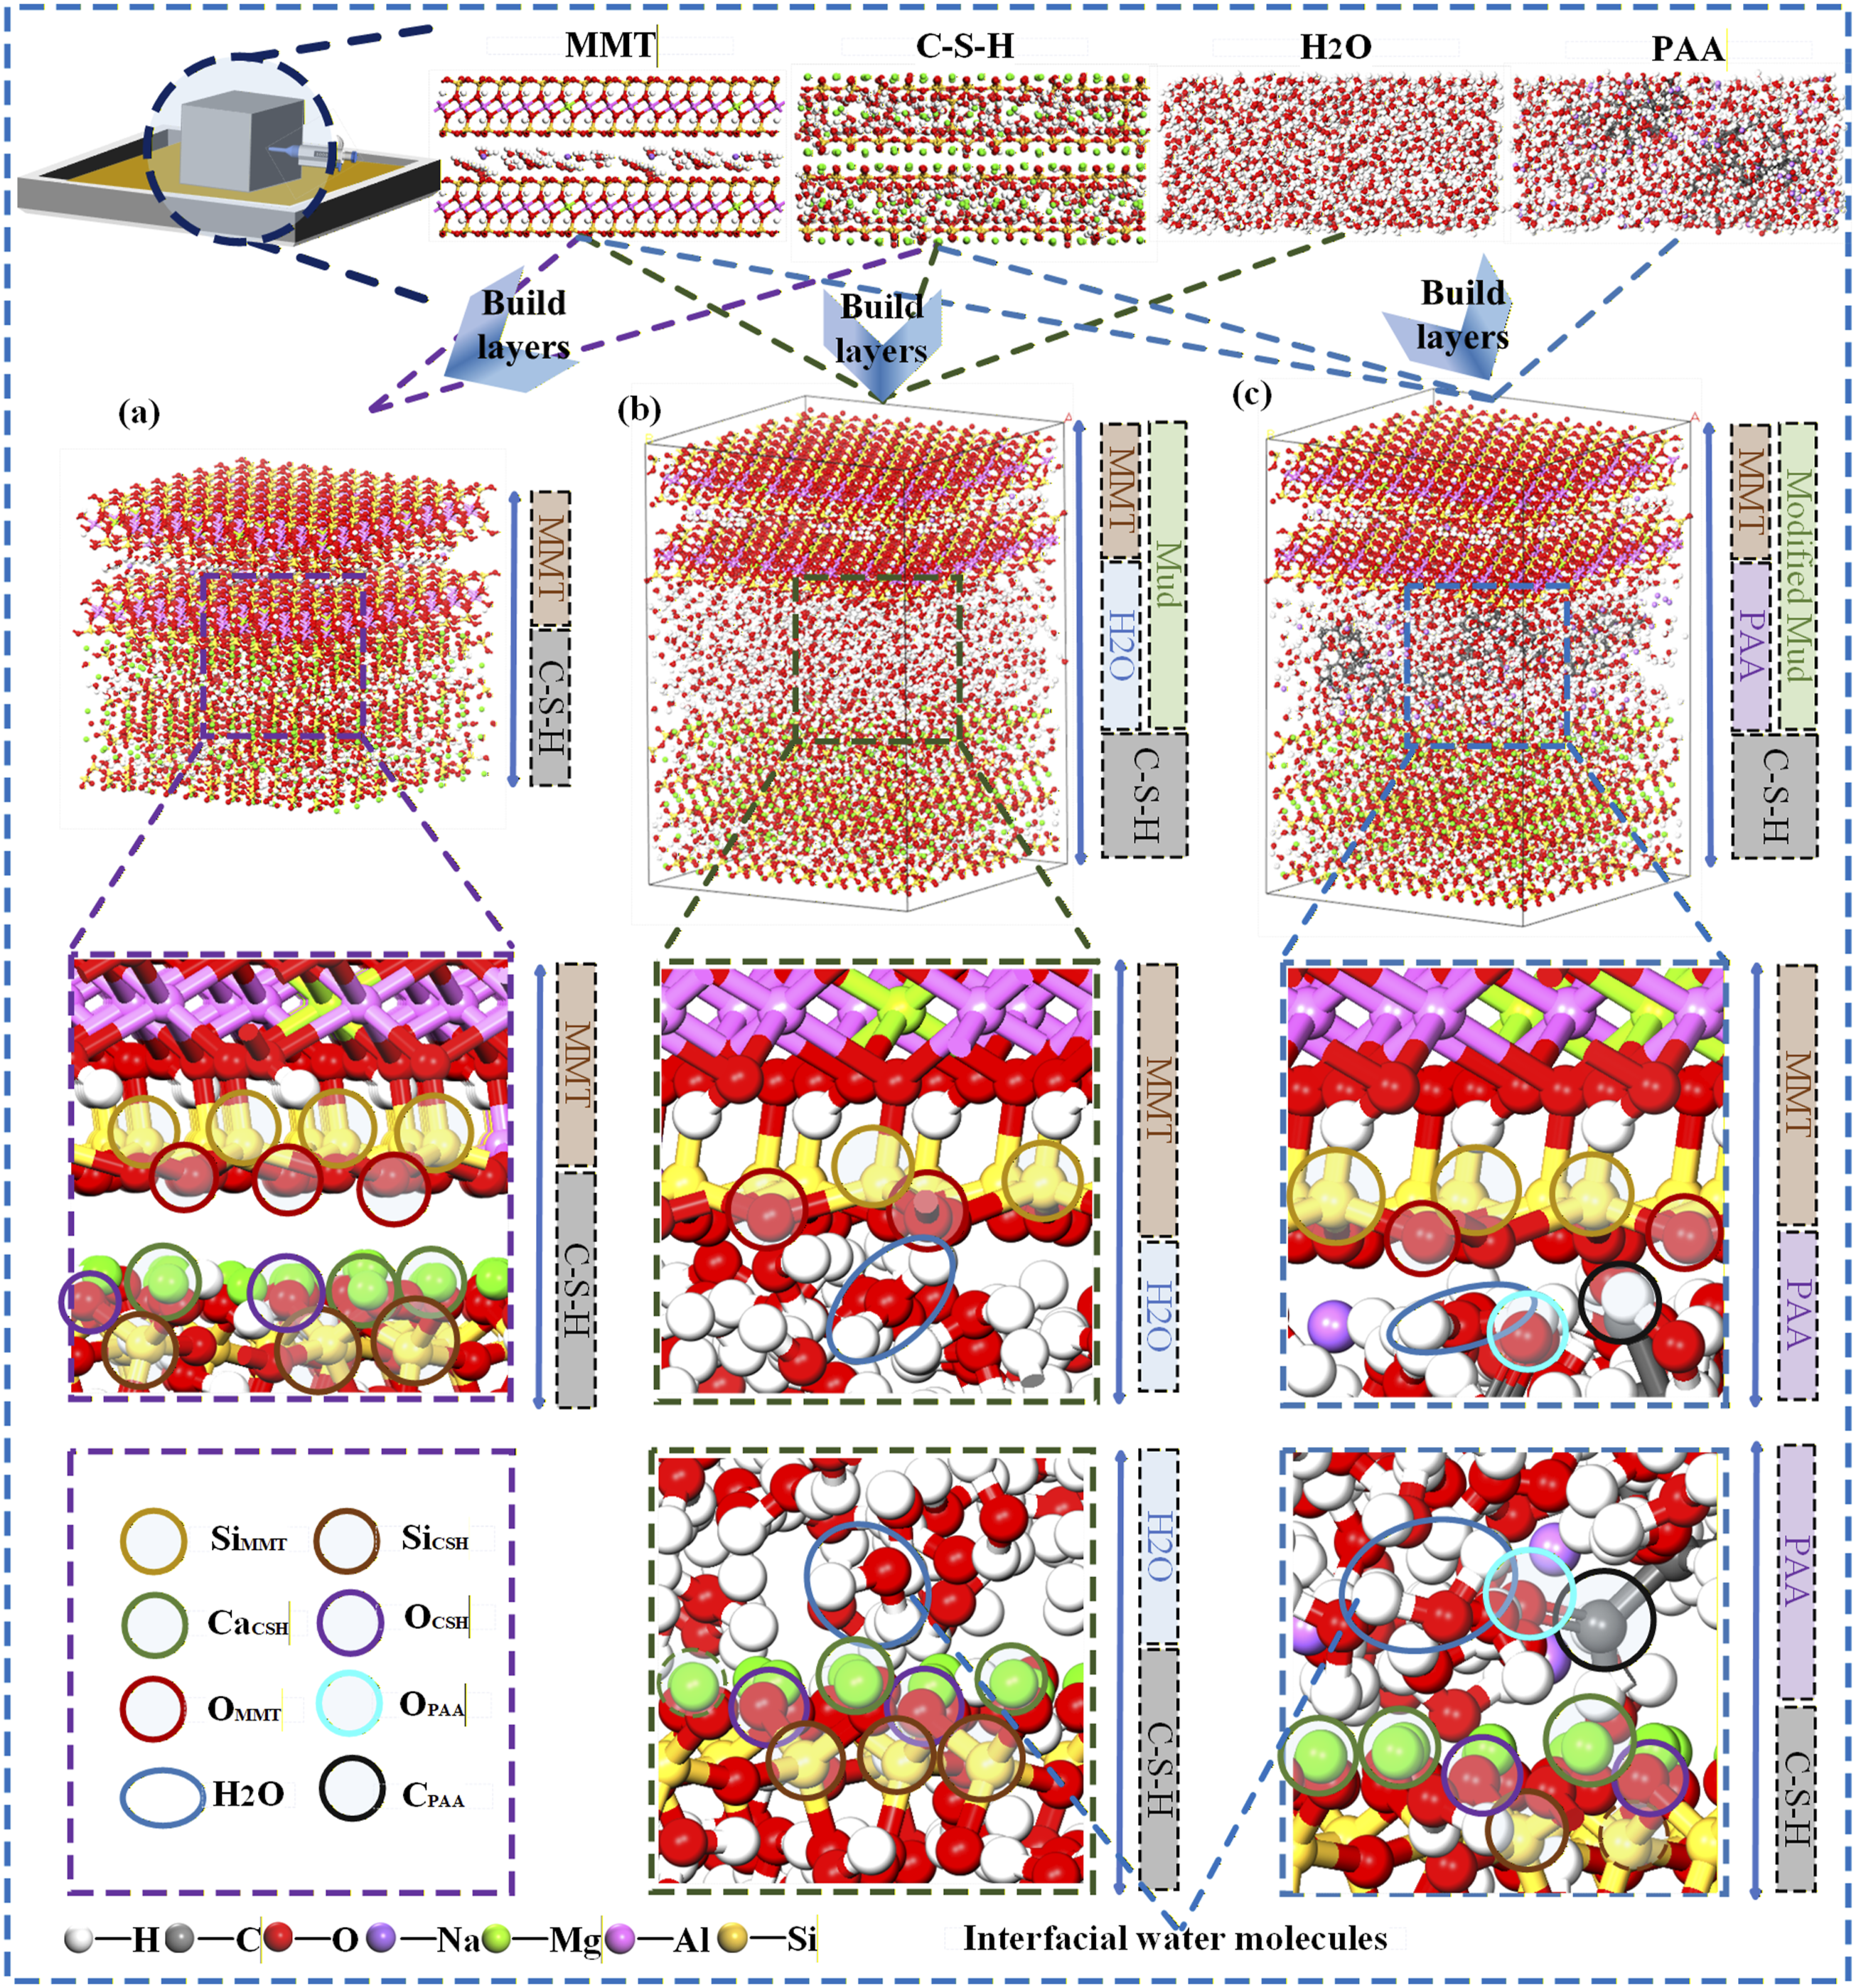
As shown in Figure 4, enlarged interfacial snapshots of the three systems reveal distinct features of ionic clusters and molecular arrangements at the interfaces. In MMT/C-S-H, Si and Ca atoms form a three dimensional framework, and CaCSH is in direct contact with OMMT, indicative of direct ionic interactions. In MMT/H2O/C-S-H, free water molecules occupy the gap between the two phases; HH2O engages with OMMT and OCSH as potential hydrogen bonding sites, so water acts as a bridging and buffering medium. In MMT/PAA/C-S-H, carboxylate oxygens of PAA (OPAA) accumulate near CaCSH and, together with interfacial water molecules, participate in the interactions, giving rise to a more complex cooperative effect among ions, polymer, and water molecules at the interface. All systems were geometry optimized and then imported into the LAMMPS platform, where energy minimization and ensemble relaxation were performed to obtain equilibrated interfacial structures.
Force field and simulation details
In this study, force fields were selected and combined according to the characteristics of each system. For the unmodified interfaces (MMT/C-S-H and MMT/H2O/C-S-H), the ClayFF force field was employed. ClayFF was developed for hydrated minerals and can capture electrostatics, the hydrogen bond network, and ion exchange in layered silicates and calcium silicate hydrates, thereby ensuring a realistic description of the inorganic phases and their interactions. 44 For the sodium polyacrylate (PAA) modified slurry, a single force field cannot fully represent the multiscale interactions between organic polymer segments and inorganic mineral interfaces, so a hybrid of ClayFF and CVFF was adopted. The combined ClayFF and CVFF force field has been proven to effectively simulate the multiscale interactions between organic polymer segments and inorganic mineral interfaces. 23 The inorganic mineral phases were described with ClayFF to preserve the fidelity of the crystalline and aqueous environment. 45 Whereas the organic polymer chains and associated functional groups were described with CVFF to reflect chain flexibility, van der Waals interactions, and hydrogen bonding. 46 Cross interactions between the two domains were coupled through van der Waals and electrostatic terms, which maintains the accuracy of the mineral-water description while enabling a physically reasonable representation of the polymer-inorganic interface. 47
To further interrogate the structural stability and interaction characteristics of the three interface systems, multi-stage relaxation and optimization were performed in LAMMPS. All conditions were specified through input scripts (in files) and included geometry optimization, annealing, and subsequent dynamical equilibration. First, the systems were preprocessed with the Smart algorithm combined with annealing to randomize molecular configurations. Thereafter, NVT and NPT ensembles were applied sequentially at 298 K: in the NVT stage, an initial equilibration of about 1 ps was followed by 200 ps of dynamical relaxation to achieve preliminary stability in density and volume, in the NPT stage, 48 the simulations continued for more than 200 ps under constant temperature and pressure with Nosé–Hoover control, allowing volume fluctuations to converge and the interfacial structure to approach realistic conditions. 49 These settings yielded stable and representative configurations that underpin the subsequent investigation of interfacial mechanisms.
Simulation calculations
The stability of the interfacial structure depends not only on the intrinsic properties of each constituent but also on their interactions at the interface. To elucidate the interaction mechanisms in the interface models, we calculated the interfacial binding energy, hydrogen bonding metrics, relative molecular concentration profiles, radial distribution functions, and mean square displacement.
Results and discussion
Slurry performance and friction coefficient test results
Figure 5 presents the effects of bentonite and PAA contents on the rheology and fluid loss of the thixotropic slurry. As shown in Figure 5(a)–(d), with increasing dosages of bentonite and PAA, the fluid loss and friction coefficient decrease overall, the Su’s funnel viscosity progressively increases, and the bleeding ratio approaches zero. These trends indicate a clear synergistic effect of the two constituents in enhancing rheological stability and resistance to fluid loss. Results of slurry performance tests and friction coefficient tests on concrete specimens.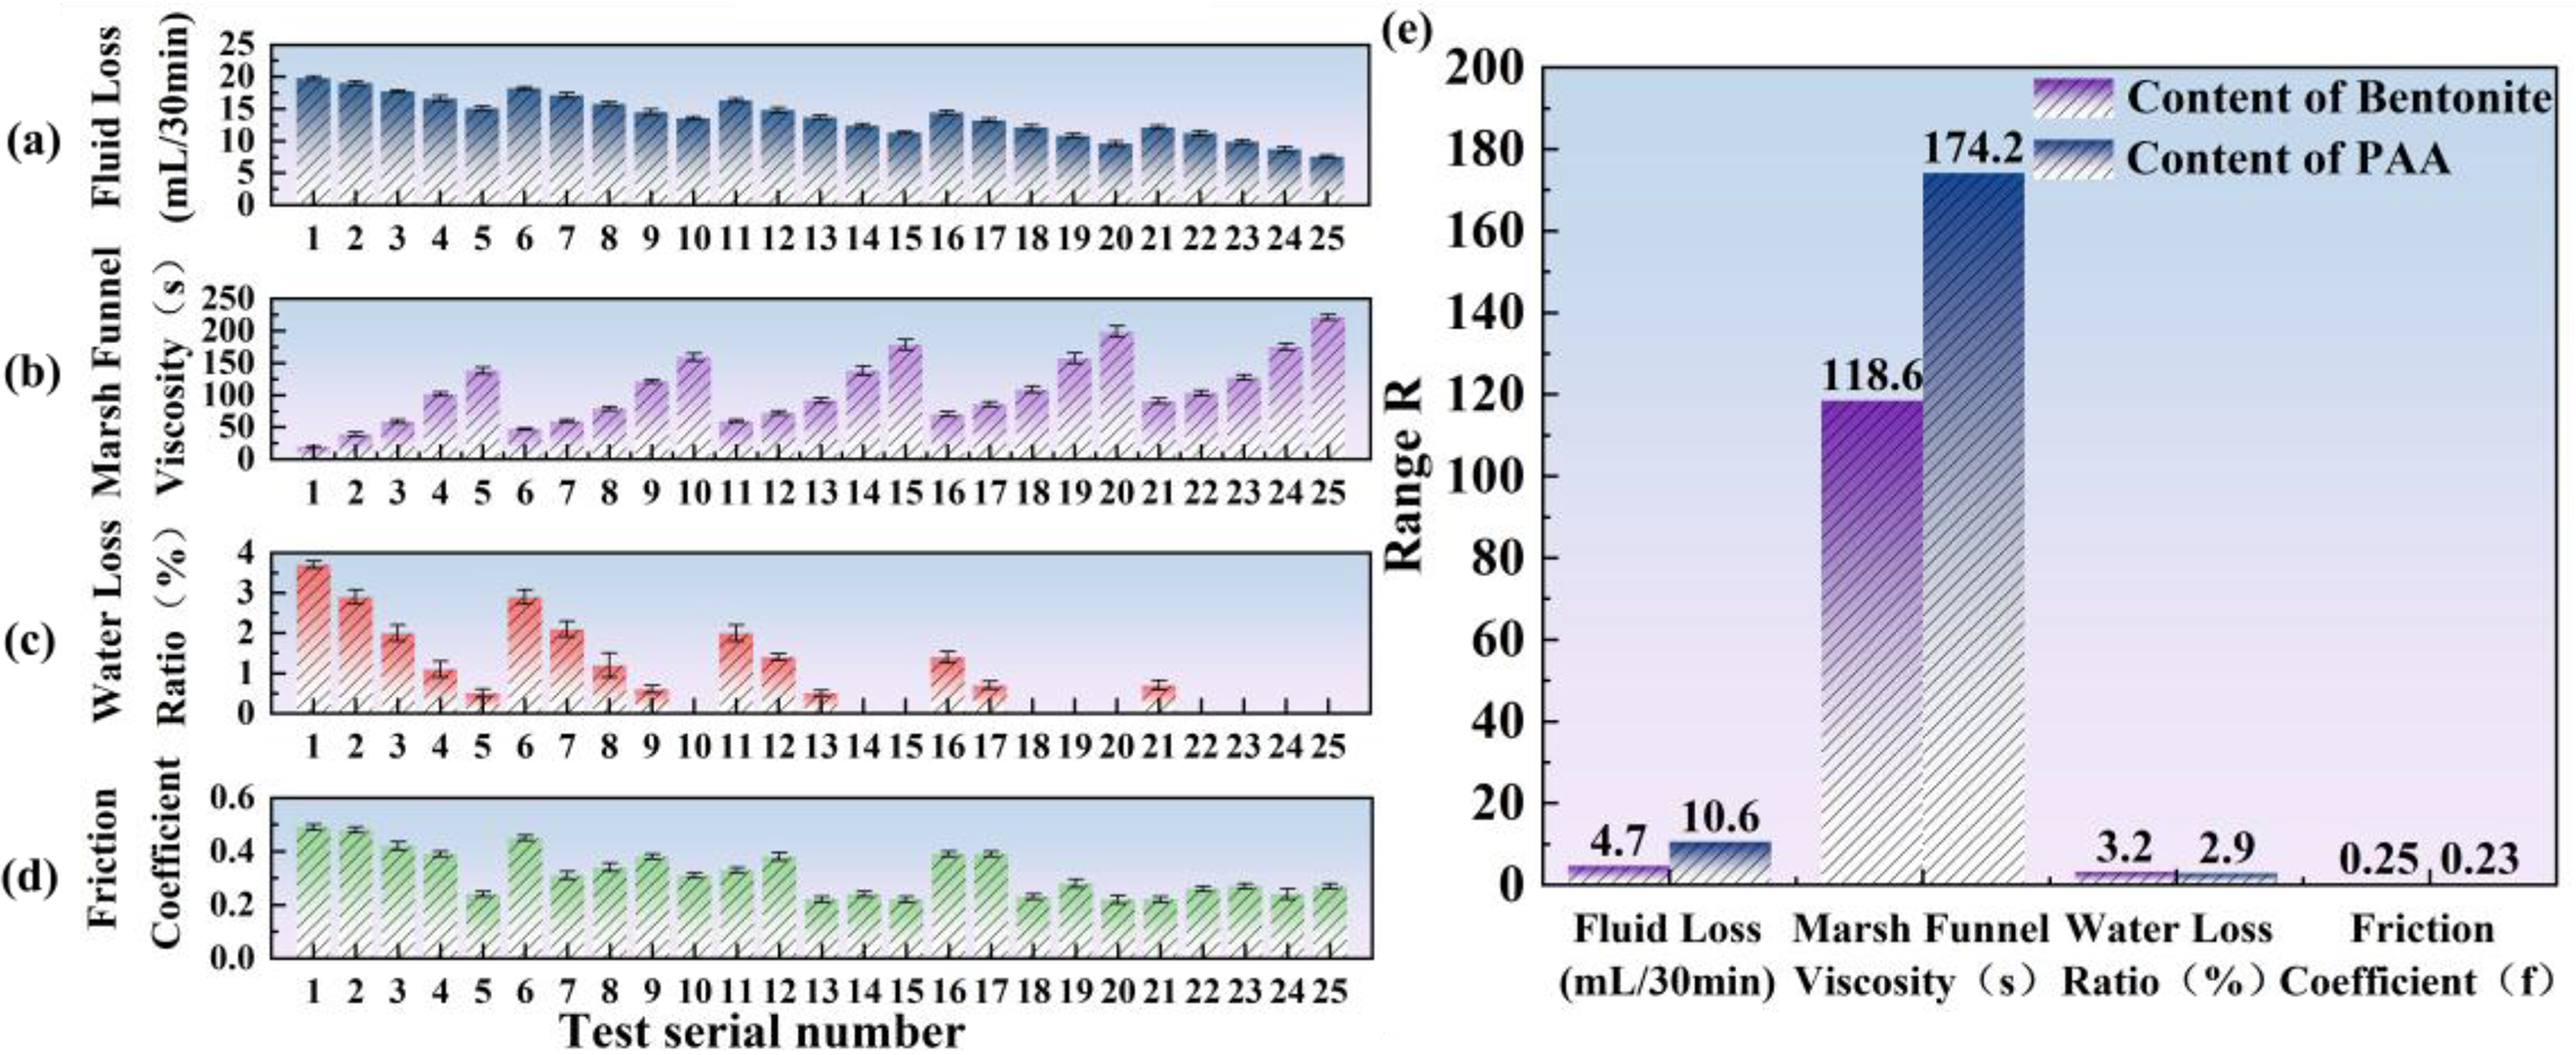
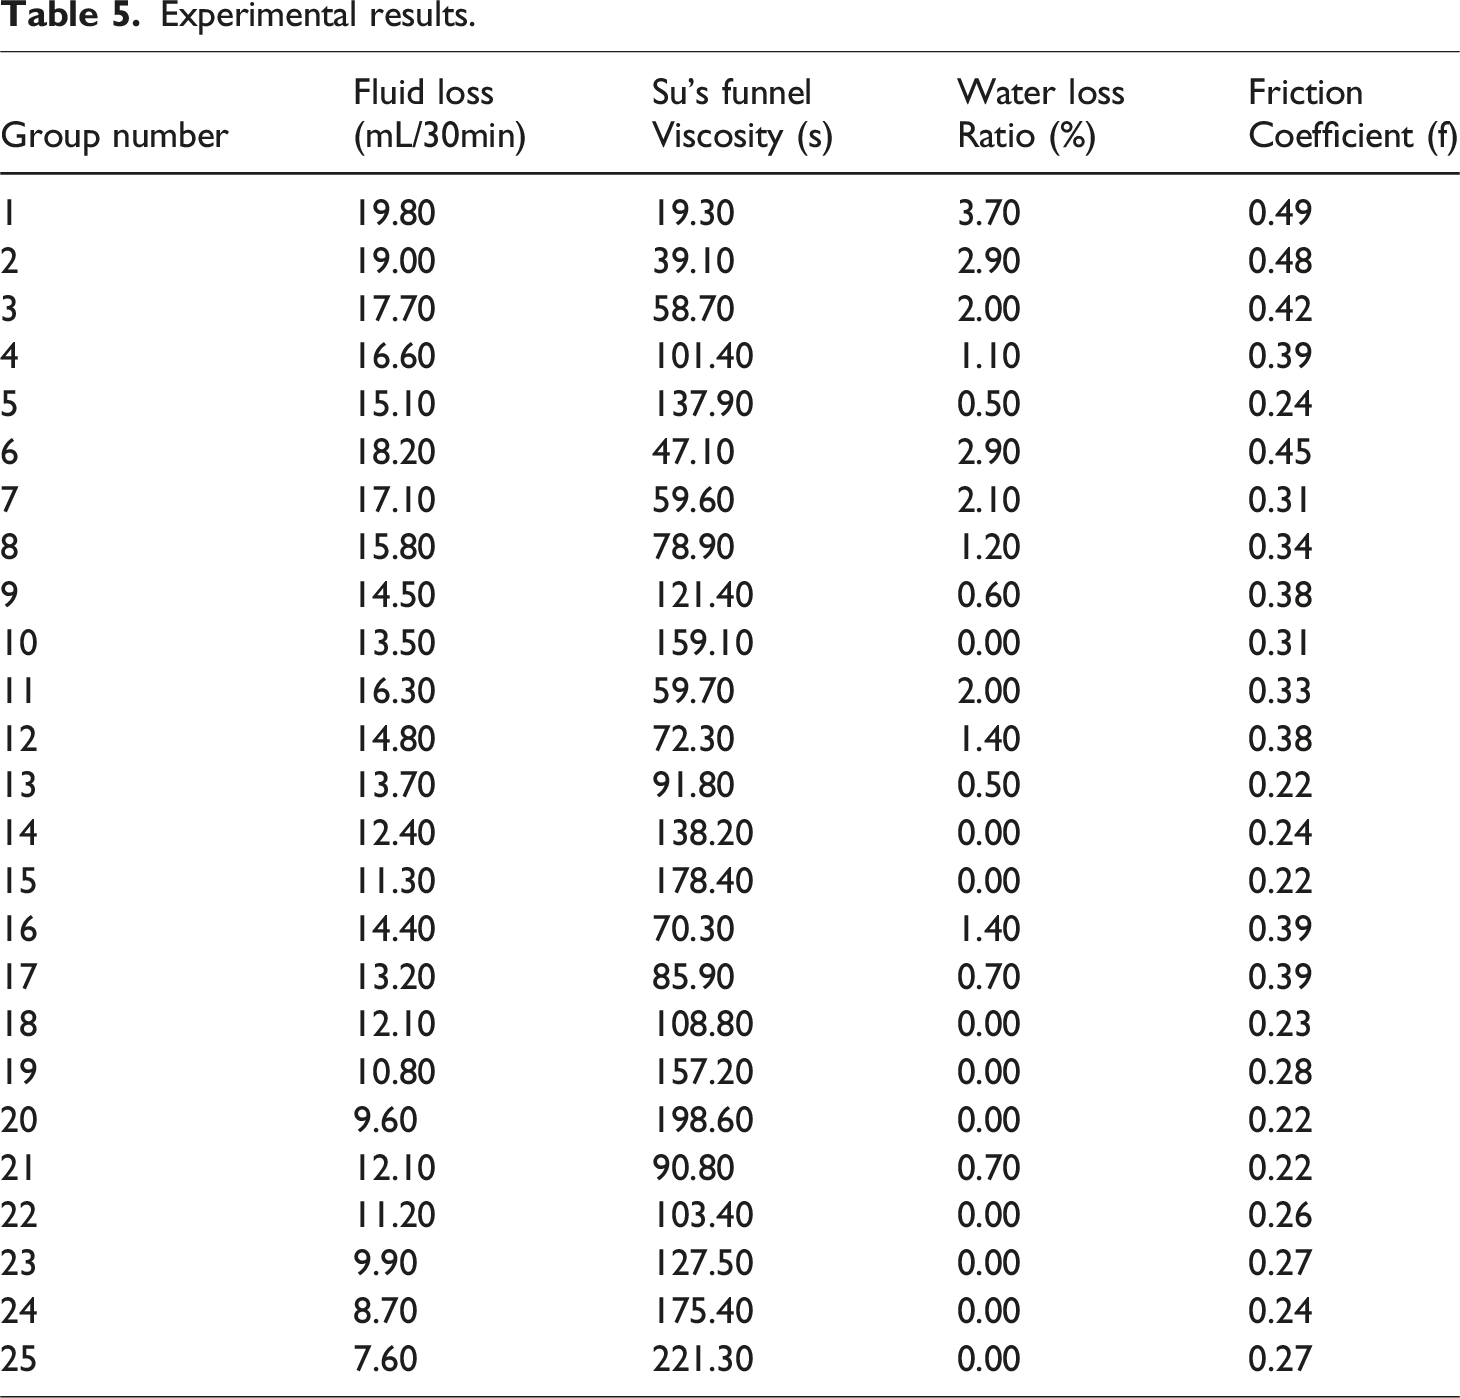
Considered individually, the fluid loss in Figure 5(a) decreases from 19.8 mL/30 min to 7.6 mL/30 min, a reduction of approximately 61.6%. Increasing the bentonite content effectively improves sealing and water retention, while the addition of PAA further strengthens fluid-loss control. The range analysis yields R-bentonite = 4.7 and R-PAA = 10.6, indicating that PAA exerts the stronger influence on fluid loss. For viscosity in Figure 5(b), the Su’s funnel time rises from 19 s to 221 s, evidencing progressive densification of the network and enhanced thixotropic resistance. The corresponding ranges (R-bentonite = 118.6; R-PAA = 174.2) show that both factors are significant, with PAA playing the dominant role; however, overly high PAA dosages may cause over-gelation and compromise pumpability. For bleeding in Figure 5(c), the ratio falls from 3.7% to 0%, demonstrating complete suppression of free-water exudation. The similar ranges for bentonite and PAA (3.2 and 2.9, respectively) suggest comparable contributions to water retention, and their combination effectively stabilizes the slurry water content. For the friction coefficient in Figure 5(d), the value declines from 0.49 to 0.22, an overall decrease of 55%; the ranges (R-bentonite = 0.25; R-PAA = 0.23) indicate nearly equal contributions to lubrication, primarily through improved particle distribution and matrix continuity. As shown by the range bar chart in Figure 5(e), PAA has a stronger overall impact than bentonite, especially on viscosity and fluid-loss performance. Taken together, an optimal window is achieved at 12–14% bentonite and 0.3–0.4% PAA, delivering fluid loss <10 mL/30 min, a Su’s funnel time of about 150 s, bleeding ≈0%, and a friction coefficient of approximately 0.22.
From an engineering perspective, the friction coefficient in Figure 5(d) decreases from 0.49 to 0.22, corresponding to an overall reduction of approximately 55%. Since the friction-related component of pipe-jacking resistance is proportional to the interface friction coefficient under identical conditions, this reduction would theoretically translate into a comparable decrease in frictional jacking resistance, highlighting the practical significance of the optimized PAA–bentonite system.
Experimental results.
Transmission electron microscopy results
Transmission electron microscopy (TEM) directly reveals the structural evolution of bentonite slurry before and after PAA modification, with representative images at multiple magnifications shown in the Figure 6. In the unmodified sample, particles are highly agglomerated and pores are heterogeneously distributed. After PAA modification, the system exhibits uniformly dispersed particles, refined pores, and the formation of organic coating and lubricating layers. These observations indicate that PAA molecules regulate the interparticle interaction network through intercalative adsorption and the formation of a hydration film. Carboxylate groups in PAA engage in hydrogen bonding and electrostatic adsorption with surface hydroxyls on bentonite, increasing the basal spacing and improving interfacial lubrication, which markedly enhances thixotropy and friction reduction and strengthens both rheological stability and support capacity of the slurry. TEM images without magnification annotations.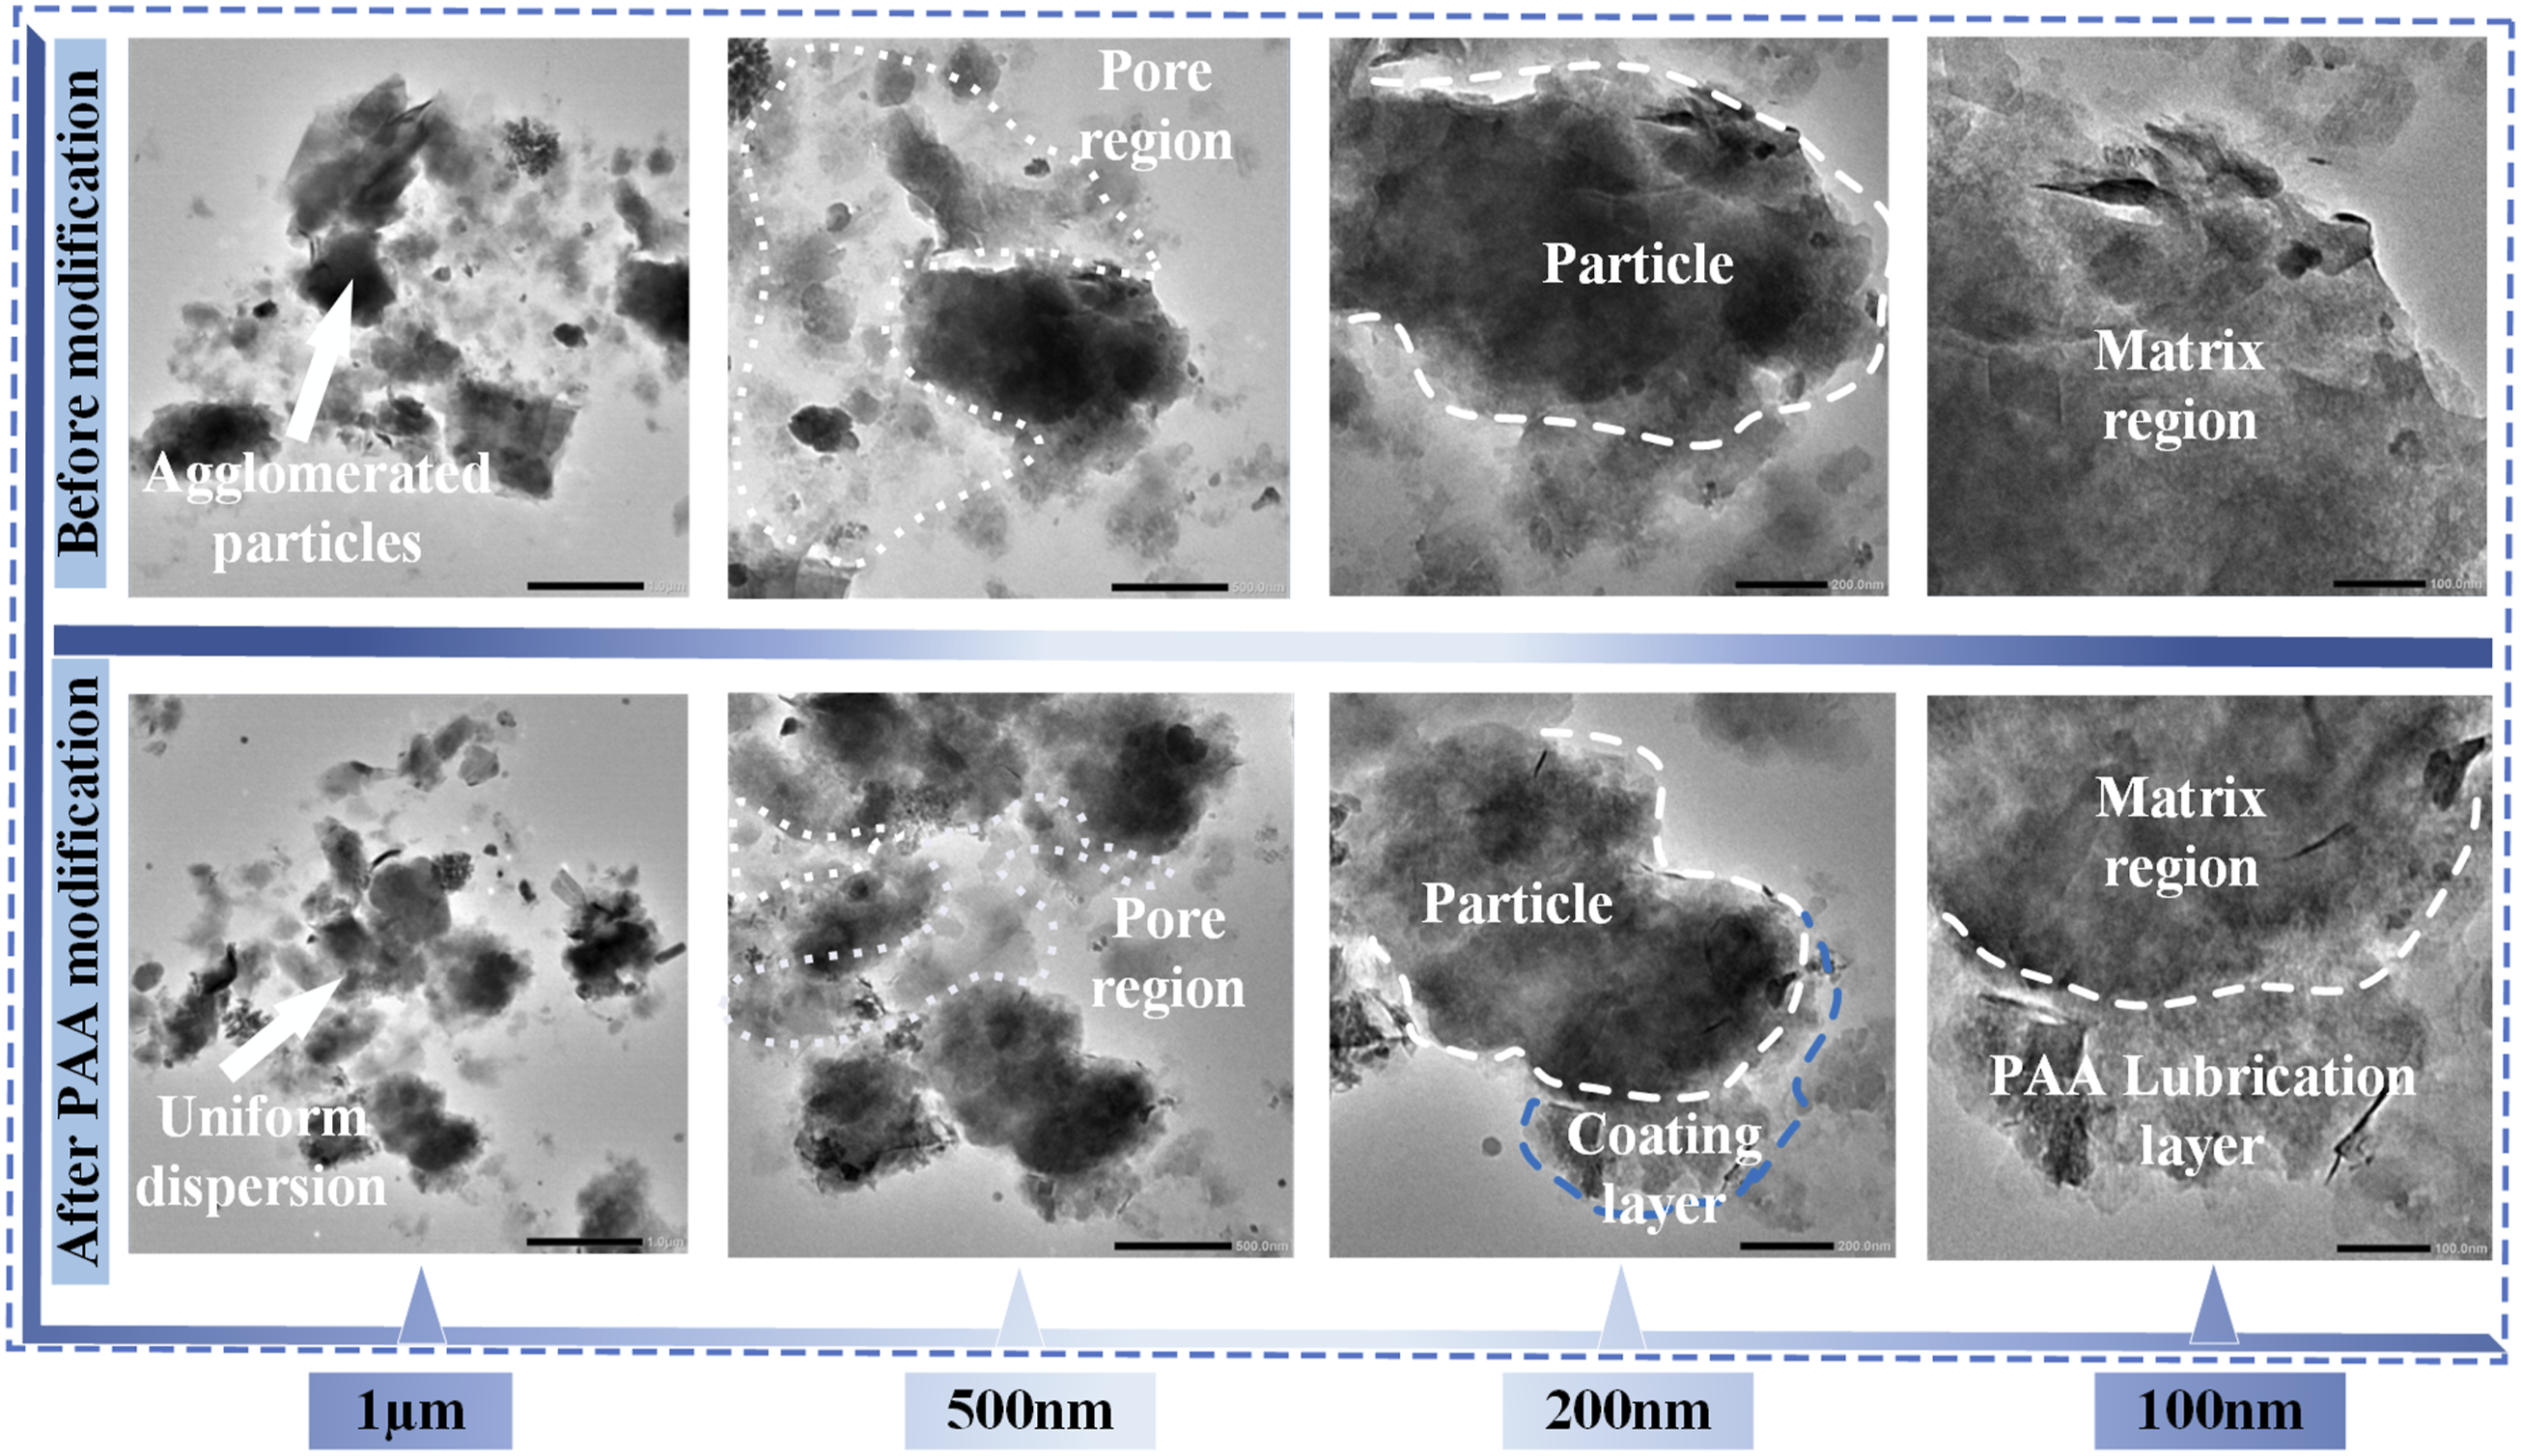
Magnification dependent features further clarify these differences. At the 1 μm scale, the overall particle distribution is evident: the unmodified slurry shows severe flocculated aggregates with irregular pores, whereas the PAA modified slurry displays uniform dispersion and a more open framework, consistent with improved colloidal stability. At 500 nm, the unmodified pores appear rough and irregular with blurred particle boundaries; the modified slurry shows uniformly distributed pores surrounded by a continuous, compact matrix, indicating that PAA promotes homogenization and reduces local density fluctuations. At 200 nm, a distinct coating layer appears on particle surfaces in the modified sample as a low contrast organic film, attributable to PAA adsorption or partial intercalation; this layer improves surface planarity and interfacial compatibility, a feature absent in the unmodified slurry. At 100 nm, a lubricating layer between particles and the matrix is observed as a semi-transparent, flexible interphase; this hydrated organic layer substantially lowers interparticle friction and facilitates reversible structural reconstruction. The unmodified slurry lacks such a layer, and its interfacial boundaries are rough with pronounced brittleness.
The transformation from dense agglomeration to a dispersed, coated microstructure directly improves rheology. The PAA adsorption layer reduces interparticle friction and significantly enhances lubrication, while the weak bond network formed by PAA enables rapid breakdown and recovery under shear, yielding a pronounced thixotropic response. Therefore, PAA modification not only improves particle dispersion and surface characteristics but also markedly enhances lubrication, stability, and the controllability of thixotropy, providing essential support for achieving low friction and stable flow in shield tunneling and pipe jacking grouting systems.
Molecular simulation results
Binding energy (BE)
BE results.
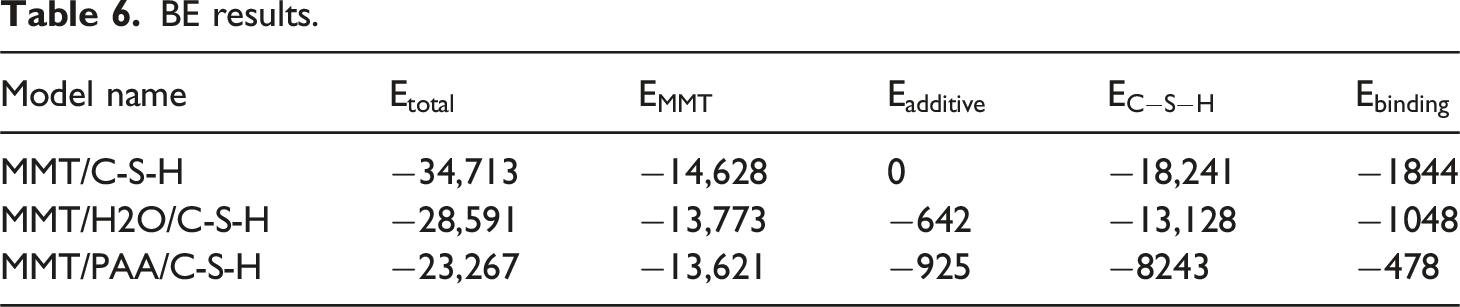
The binding energy follows the order MMT/C-S-H > MMT/H2O/C-S-H > MMT/PAA/C-S-H. Specifically, the MMT/C-S-H system exhibits a binding energy of −1844 kcal·mol−1, indicating that rigid solid-solid contact between dry soil and C-S-H provides the strongest interfacial attraction, primarily from the combined van der Waals and Coulombic interactions; however, this interface also shows pronounced local stress concentrations and nonuniform contacts, leading to limited overall homogeneity. In contrast, the binding energy of MMT/H2O/C-S-H decreases to −1048 kcal·mol−1, implying that interfacial water forms a lubricating layer that weakens rigid solid-solid interactions, while the introduction of water also promotes hydrogen bonding and electrostatic adsorption, yielding a more continuous interfacial transition zone. With PAA modification, the binding energy further decreases to −478 kcal·mol−1, showing that polymer molecules, through competitive adsorption and the formation of a compliant lubricating film, further lower the interfacial energy and thereby markedly improve lubrication and thixotropy. Overall, the binding energy trends are consistent with the observed macroscopic reductions in friction and improvements in rheology, corroborating the interfacial regulatory roles of water and PAA. To further clarify the origin of the interfacial energy reduction, subsequent analysis will examine hydrogen-bond counts, bond lengths, and angular distributions.
Hydrogen bonds
H-bond is a key noncovalent interaction that governs interfacial structural stability and intermolecular forces, playing an important role in interfacial adhesion of composites.
52
As shown in Figure 7, the distributions of hydrogen-bond angles, counts, and lengths differ markedly among the three interfacial systems (MMT/C-S-H, MMT/H2O/C-S-H, and MMT/PAA/C-S-H); the corresponding quantitative values are summarized in Table 7. Hydrogen-bond calculation results. Average values of hydrogen bond parameters.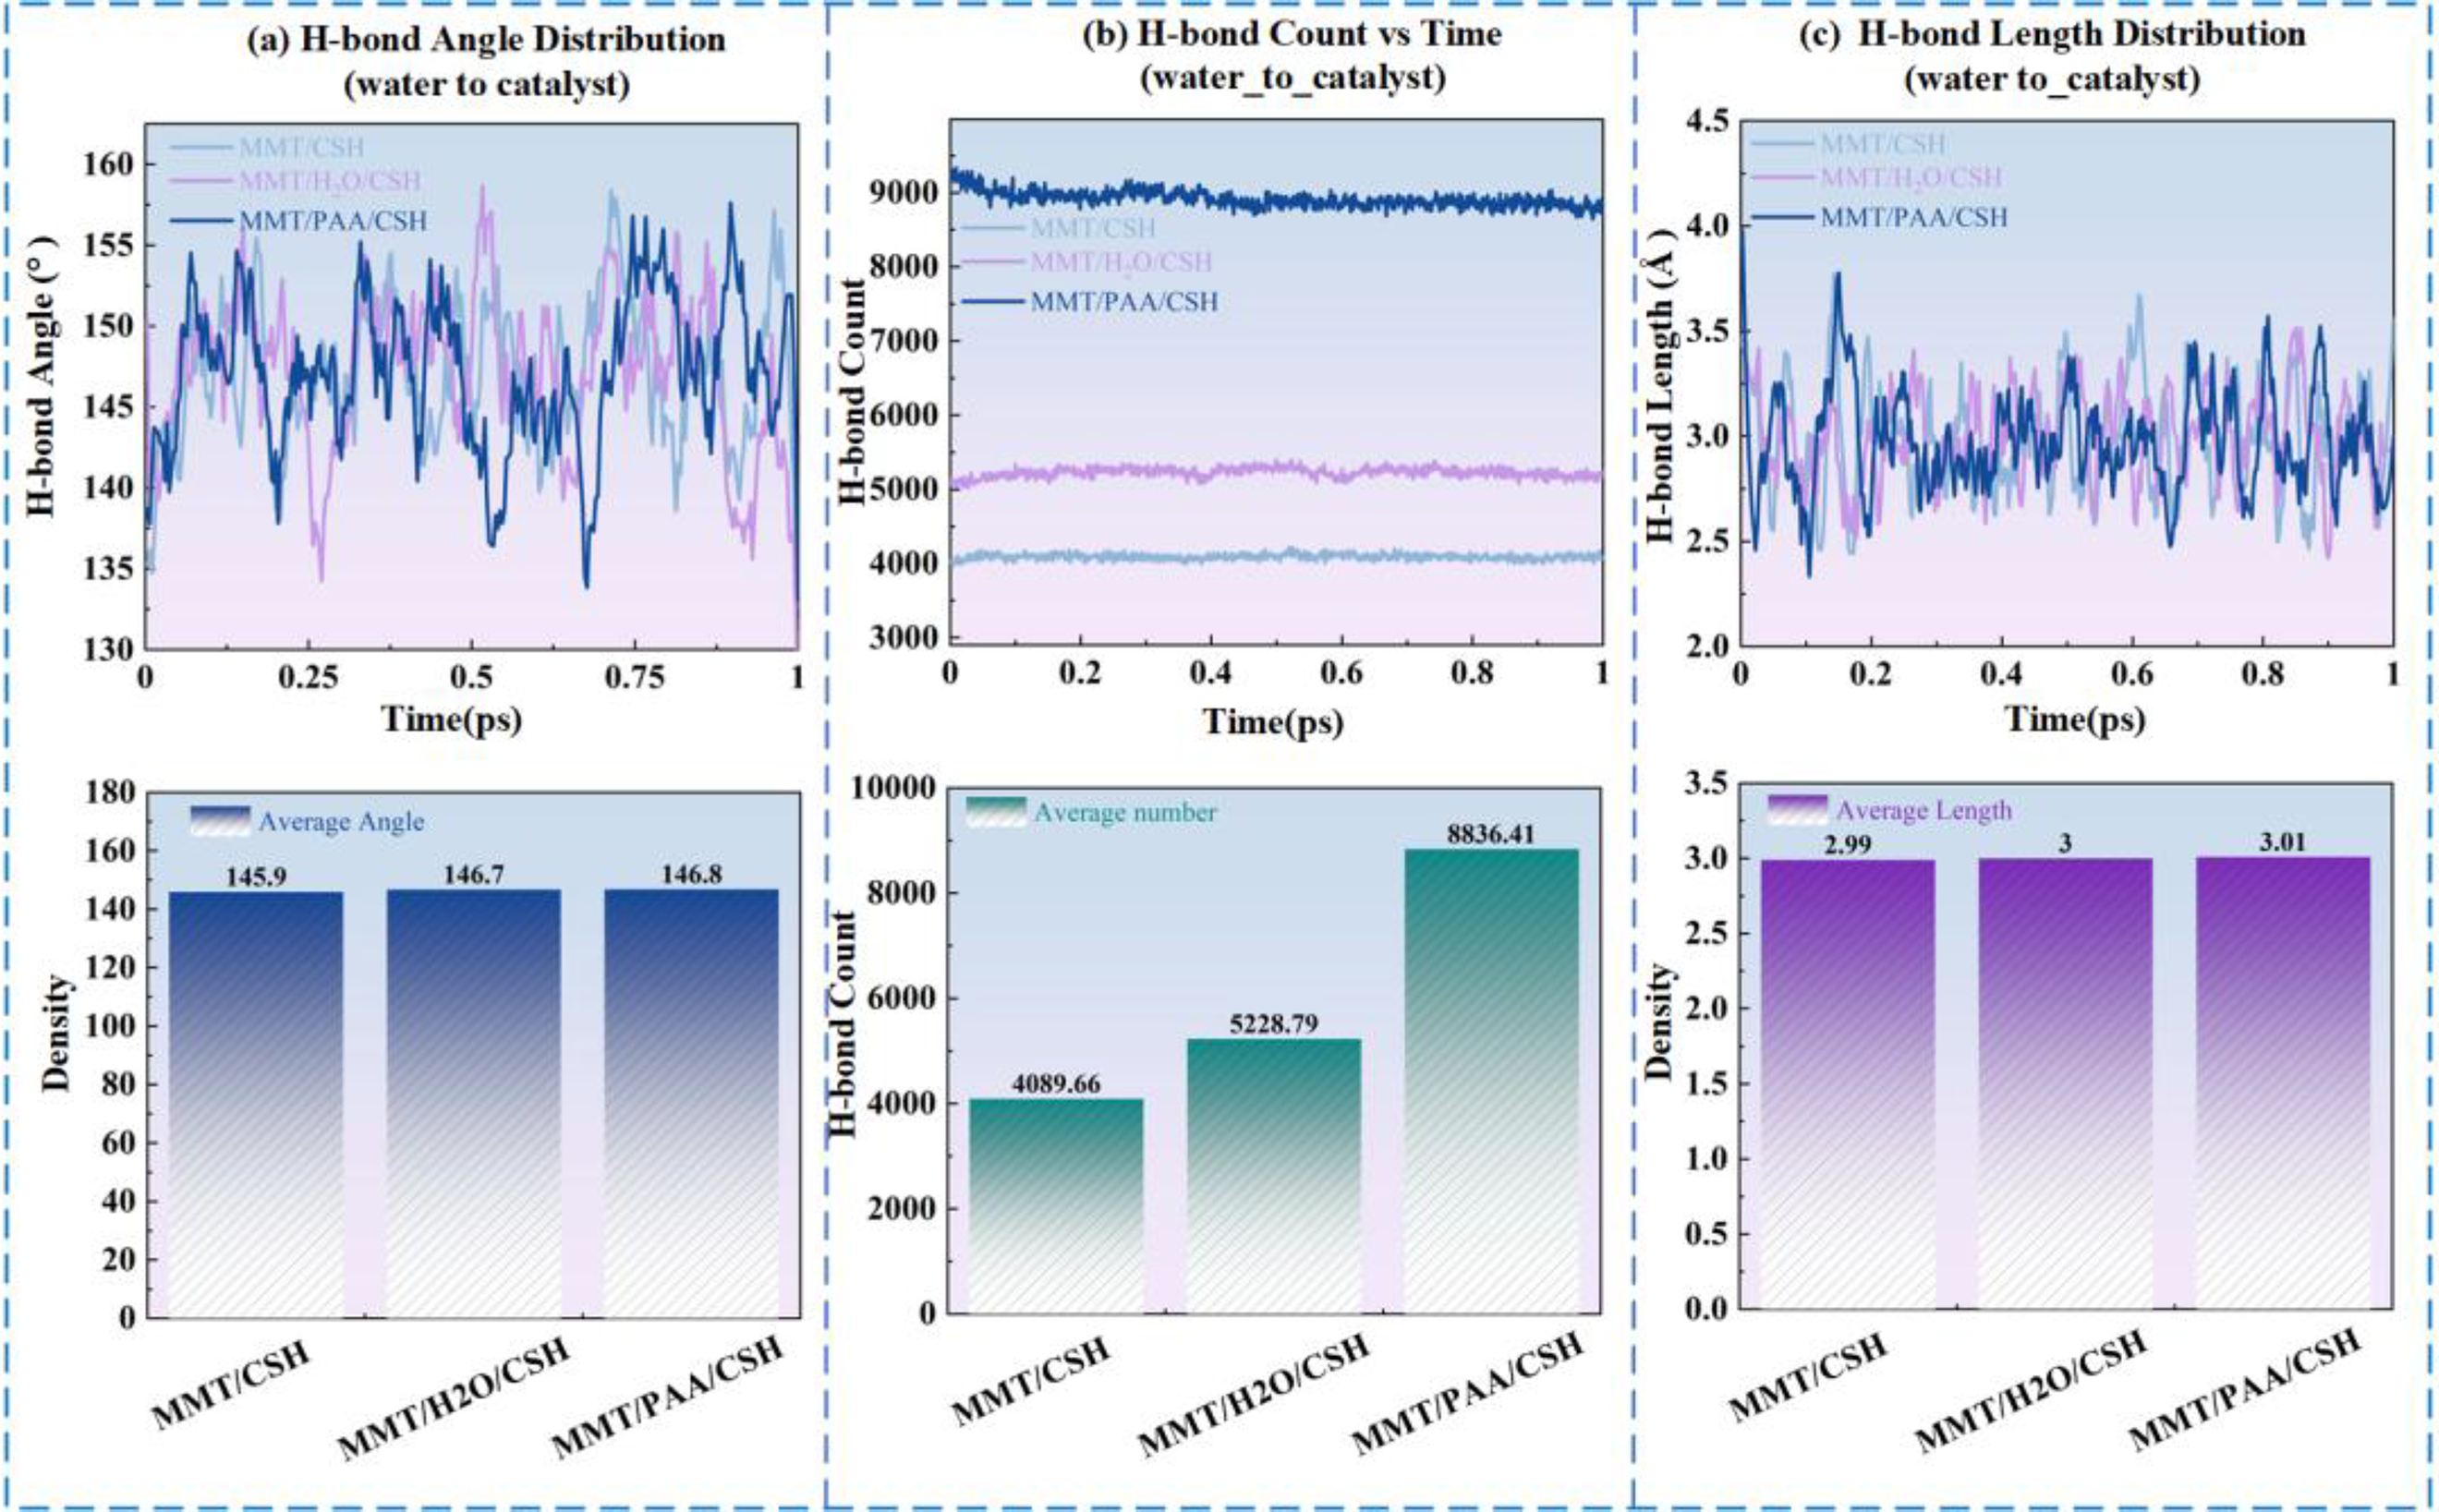
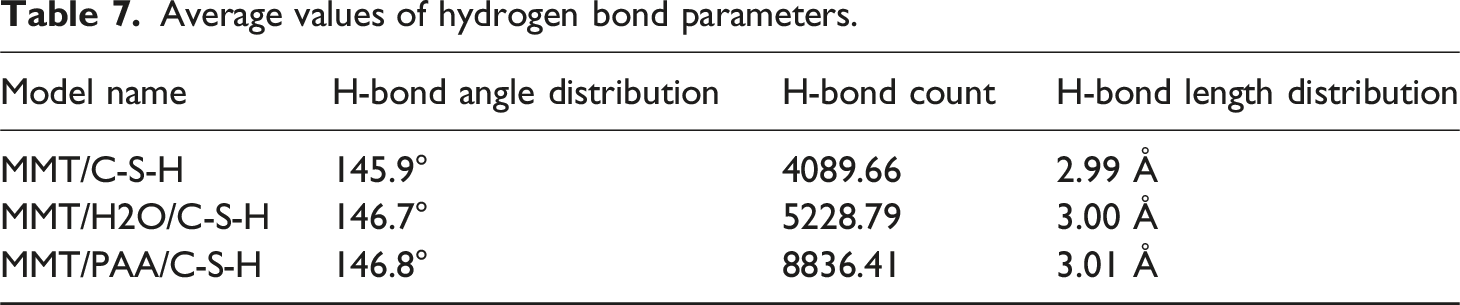
We observe that in the MMT/C-S-H system the mean hydrogen-bond angle is 145.9°, the count is only 4089.66, and the average hydrogen-bond length is 2.99 Å, indicating weak interfacial bonding and limited mobility, which yields the largest friction and the poorest lubrication and thixotropy. By contrast, in the MMT/H2O/C-S-H system the mean angle increases to 146.7°, the count rises to 5228.79, and the bond length grows to 3.00 Å, suggesting a looser hydrogen-bond network that facilitates water sliding at the interface, thereby reducing friction and improving lubrication. Further, in the MMT/PAA/C-S-H system the mean angle reaches 146.8°, the count increases to 8836.41, and the length slightly increases to 3.01 Å, reflecting a denser and more stable hydrogen-bond network. With the lubricating film formed by PAA, this system maintains a stable interface while minimizing direct solid-solid contact, ultimately achieving the lowest friction and the best lubrication and thixotropic response.
Notably, although PAA increases the number and stability of hydrogen bonds, the interfacial binding energy decreases. This arises because PAA forms a separation layer between MMT and C-S-H, weakening direct electrostatic and van der Waals interactions and shifting the interface from strong adsorption to compliant lubrication. Hence, hydrogen-bond metrics and binding energy are not simply positively correlated; rather, they are coupled and jointly govern the macroscopic improvements in lubrication and thixotropy.
Relative concentration (RC)
To elucidate the spatial locations of key species and characterize their states within the interface models, Figure 8 presents the relative concentration distributions (RC) for the three interfacial systems. The concentration profiles depict the variation of atomic number density along a specified direction.
53
Relative concentration (RCD) profiles of the three interfacial systems.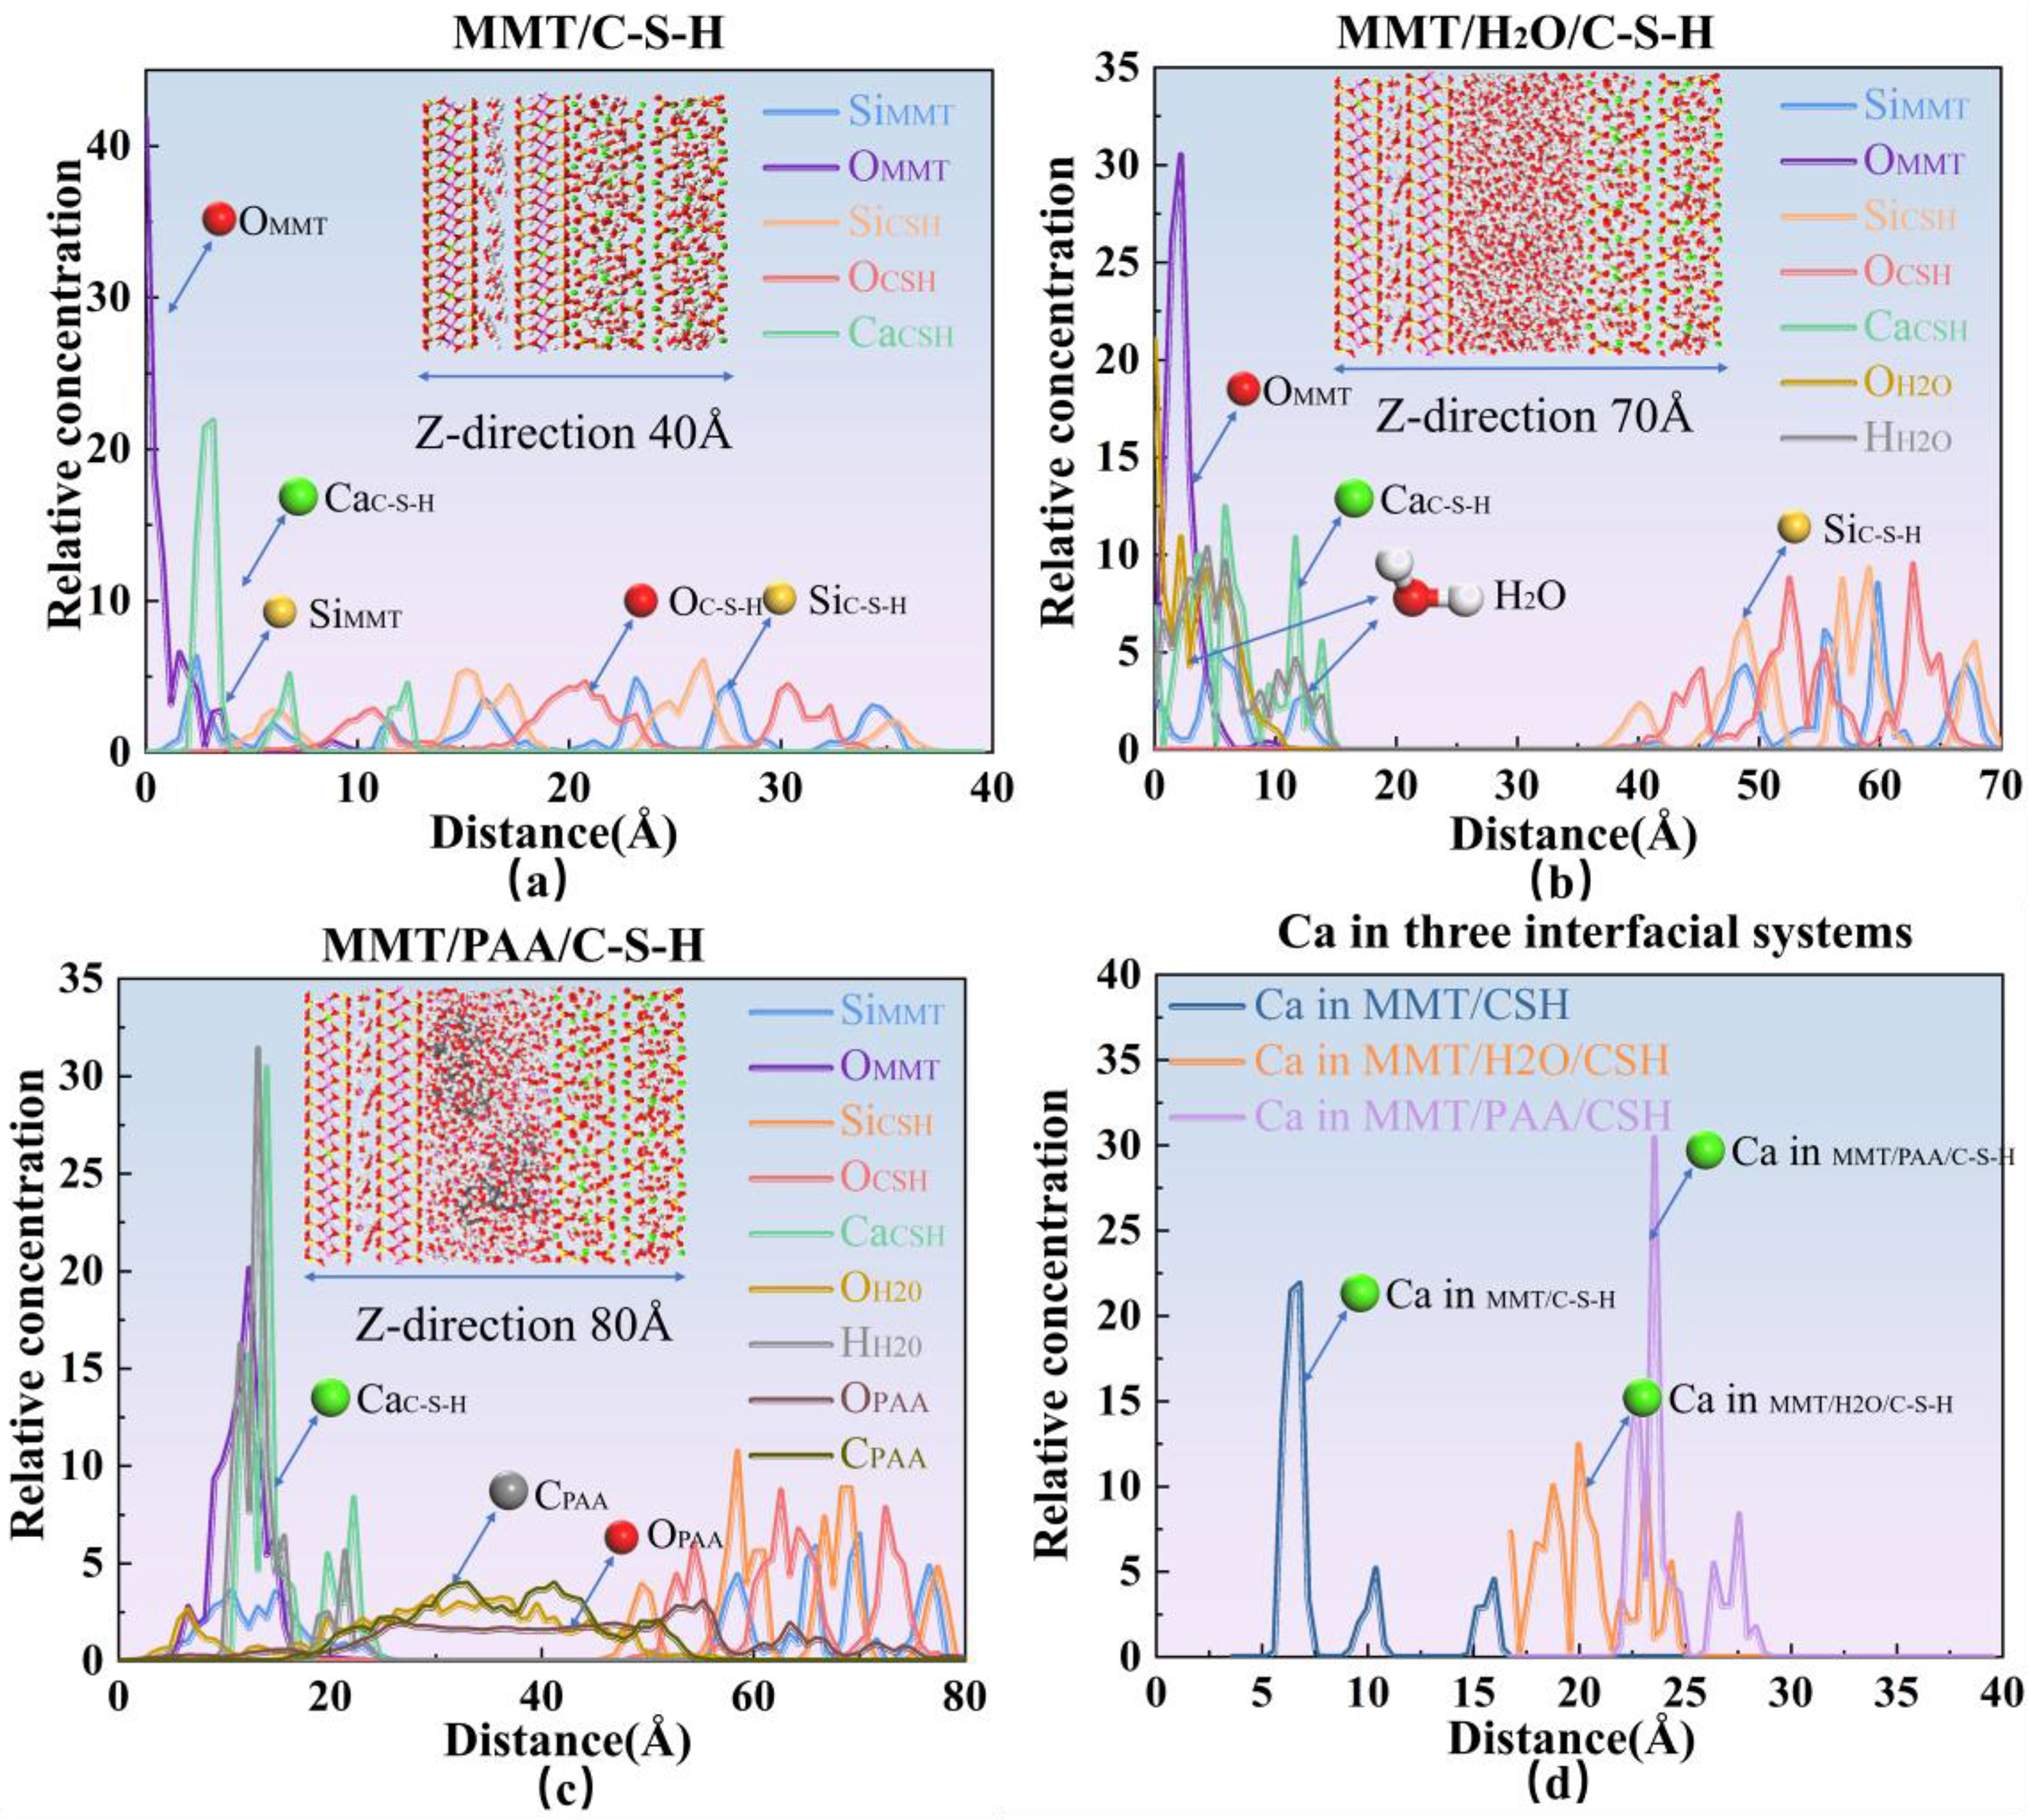
In Figure 8(a), for the MMT/C-S-H interface, Si and O atoms exhibit sharp peaks on their respective solid sides, Ca is enriched at the interface, and the interfacial thickness is minimal, indicating pronounced direct contact between the two phases with virtually no intervening medium. In Figure 8(b), for MMT/H2O/C-S-H, O and H atoms of water are distributed continuously between the two solids; adsorption peaks appear near the solid surfaces, and a plateau emerges in the middle region with overlap relative to the solid phase curves. The interfacial thickness increases markedly, showing that the water layer buffers the interface and weakens rigid solid-solid contact. In Figure 8(c), for MMT/PAA/C-S-H, the carboxylate oxygen of PAA forms a distinct peak on the C-S-H side, while the main-chain carbon extends outward, displaying a stratified arrangement. Compared with Figure 8(b), the water distribution becomes thinner but still retains adsorption peaks at the interface. This system exhibits the thickest and most uniform interface, indicating that PAA and water act cooperatively to form a stable multilayer structure.
Figure 8(d) compares the distribution of Ca across the three systems. In MMT/C-S-H, Ca shows a sharp peak at 5-7 Å, indicating strong interfacial concentration and a bridging role. In MMT/H2O/C-S-H, the Ca distribution broadens to 15-22 Å with a reduced peak height, reflecting dispersion under hydration. In MMT/PAA/C-S-H, Ca exhibits its strongest peak at 22-26 Å with a secondary peak beyond 27 Å, indicating strong binding with PAA carboxylates and migration toward the polymer region, consistent with a more complex cooperative interaction.
In summary, the RCD analysis elucidates the evolution of interfacial structure: MMT/C-S-H presents the narrowest interface dominated by solid-solid contact; MMT/H2O/C-S-H features a broadened interface where the water layer weakens direct interactions; MMT/PAA/C-S-H achieves the thickest and most stable interface through carboxylate-Ca binding and water-mediated cooperation. Taken together, panels (a)-(d) demonstrate a transition in Ca2+ distribution from localization to dispersion and then to polymer-side enrichment, with interfacial thickness and stability increasing in the order MMT/C-S-H < MMT/H2O/C-S-H < MMT/PAA/C-S-H. This trend clearly evidences the synergistic roles of water and PAA in enhancing interfacial stability and lubrication.
Radial distribution function (RDF)
As shown in Figure 9, to quantify the probability of finding different atoms within a specified radial range, the radial distribution function (RDF) is computed; the positions and heights of its peaks indicate, respectively, the most probable interatomic separations and the strength of their interactions.
53
RDF of key atomic pairs for the three systems (A = MMT/C-S-H, B = MMT/H2O/C-S-H, C = MMT/PAA/C-S-H).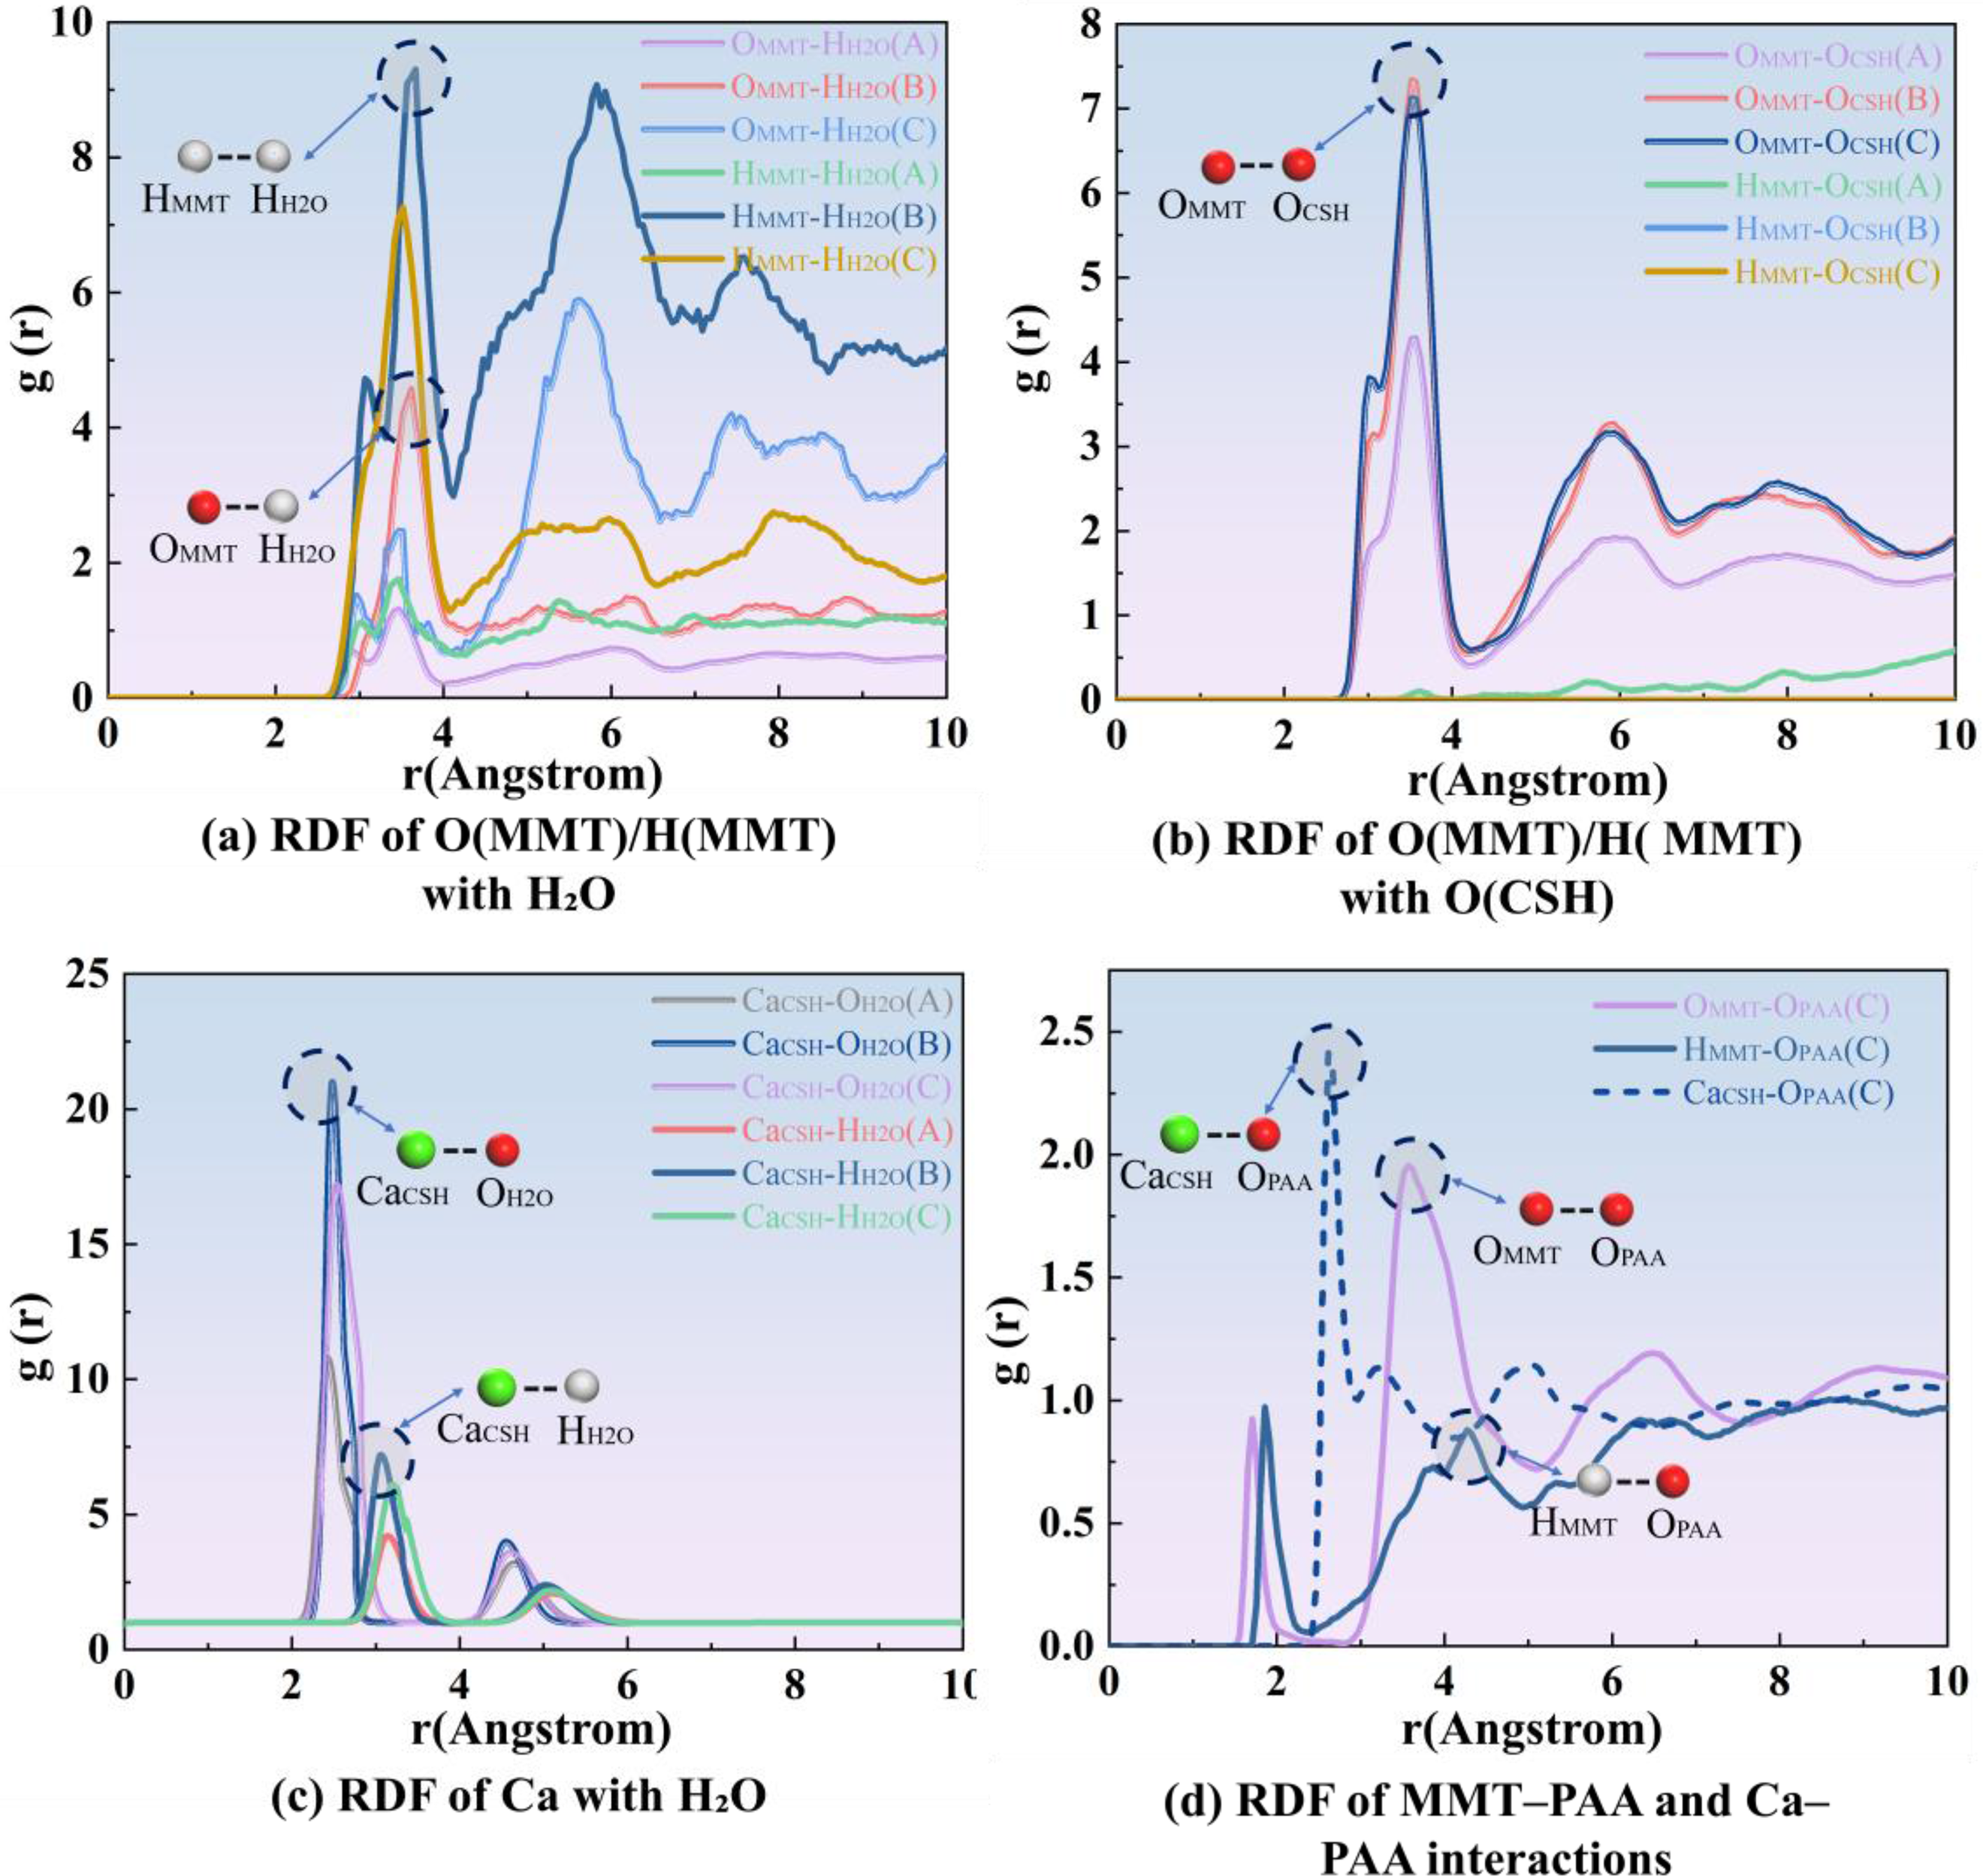
As shown in Figure 9(a), in system (A) the OMMT/HMMT with H2O RDF lacks buffering by an interfacial water layer, so contact is dominated by direct solid–solid interactions, resulting in high friction and poor lubrication. With the introduction of water in system (B), a sharp primary peak appears near 2.7 Å, indicating that a stable hydrogen-bond network forms at the interface, effectively separating the rigid surfaces and markedly reducing friction. Upon further addition of PAA in system (C), cooperative interactions between PAA carboxylate/carbonyl groups and water densify and render the interfacial hydrogen-bond network more continuous, thereby further stabilizing the lubricating film and enhancing friction reduction. As shown in Figure 9(b), the OMMT/HMMT with OCSH peak at approximately 3.8 Å strengthens progressively with the addition of water and then PAA, indicating that the polymer not only improves interfacial affinity but also reinforces interfacial stability by strengthening the hydrogen-bond network.
As shown in Figure 9(c), the RDF of Ca2+ with H2O displays a pronounced first-shell peak at 2.4 Å, with the hydrated system exhibiting the highest intensity. This indicates that Ca2+ is effectively stabilized within its hydration shell, which enhances the mobility of the interfacial molecular layer and thus improves lubricating performance. In the PAA system, however, this peak weakens, implying partial replacement of water molecules by the carboxylate oxygen atoms of PAA and the formation of stronger Ca2+ with PAA coordination. Consequently, Ca2+ with PAA anchoring sites stabilize the interface while reducing the loss of free water, thereby reconciling interfacial stability with lubricity. 54 As shown in Figure 9(d), peaks at 2.6–2.8 Å for the OMMT-OPAA and HMMT-OPAA pairs indicate that PAA establishes a continuous hydrogen-bond network on the MMT surface, forming a molecular lubricating film. Moreover, the intensified Ca2+ with OPAA peak at 2.3 Å evidences ionic coordination that furnishes rigid anchoring nodes, preventing excessive interfacial sliding under shear. 55
Figure 9(a)–(d) systematically elucidates the evolution of interfacial lubrication and bonding mechanisms: in the dry system, which lacks a buffering layer, friction is maximal; upon addition of water, a hydration-mediated hydrogen-bond network emerges, markedly improving lubricity; with further incorporation of PAA, this hydrogen-bond network operates in concert with Ca2+-PAA ionic coordination, endowing the interface with a compliant lubricating film and rigid anchoring sites. This synergy reconciles friction reduction with mechanical reinforcement, thereby substantially enhancing interfacial adhesion strength and stability.
Mean square displacement (MSD)
MSD is the average of the squared particle displacement and is an important indicator of a system’s thermal stability and the degree of atomic confinement. A lower MSD growth rate generally indicates a denser interfacial structure and stronger bonding.
56
Figure 10 presents the time evolution of MSD for the three systems; by fitting the terminal slope to obtain the diffusion coefficient D, the data clearly reveal differences in interfacial molecular migration under the various modification conditions. The MSD curves and the corresponding diffusion coefficients (D) for the three systems.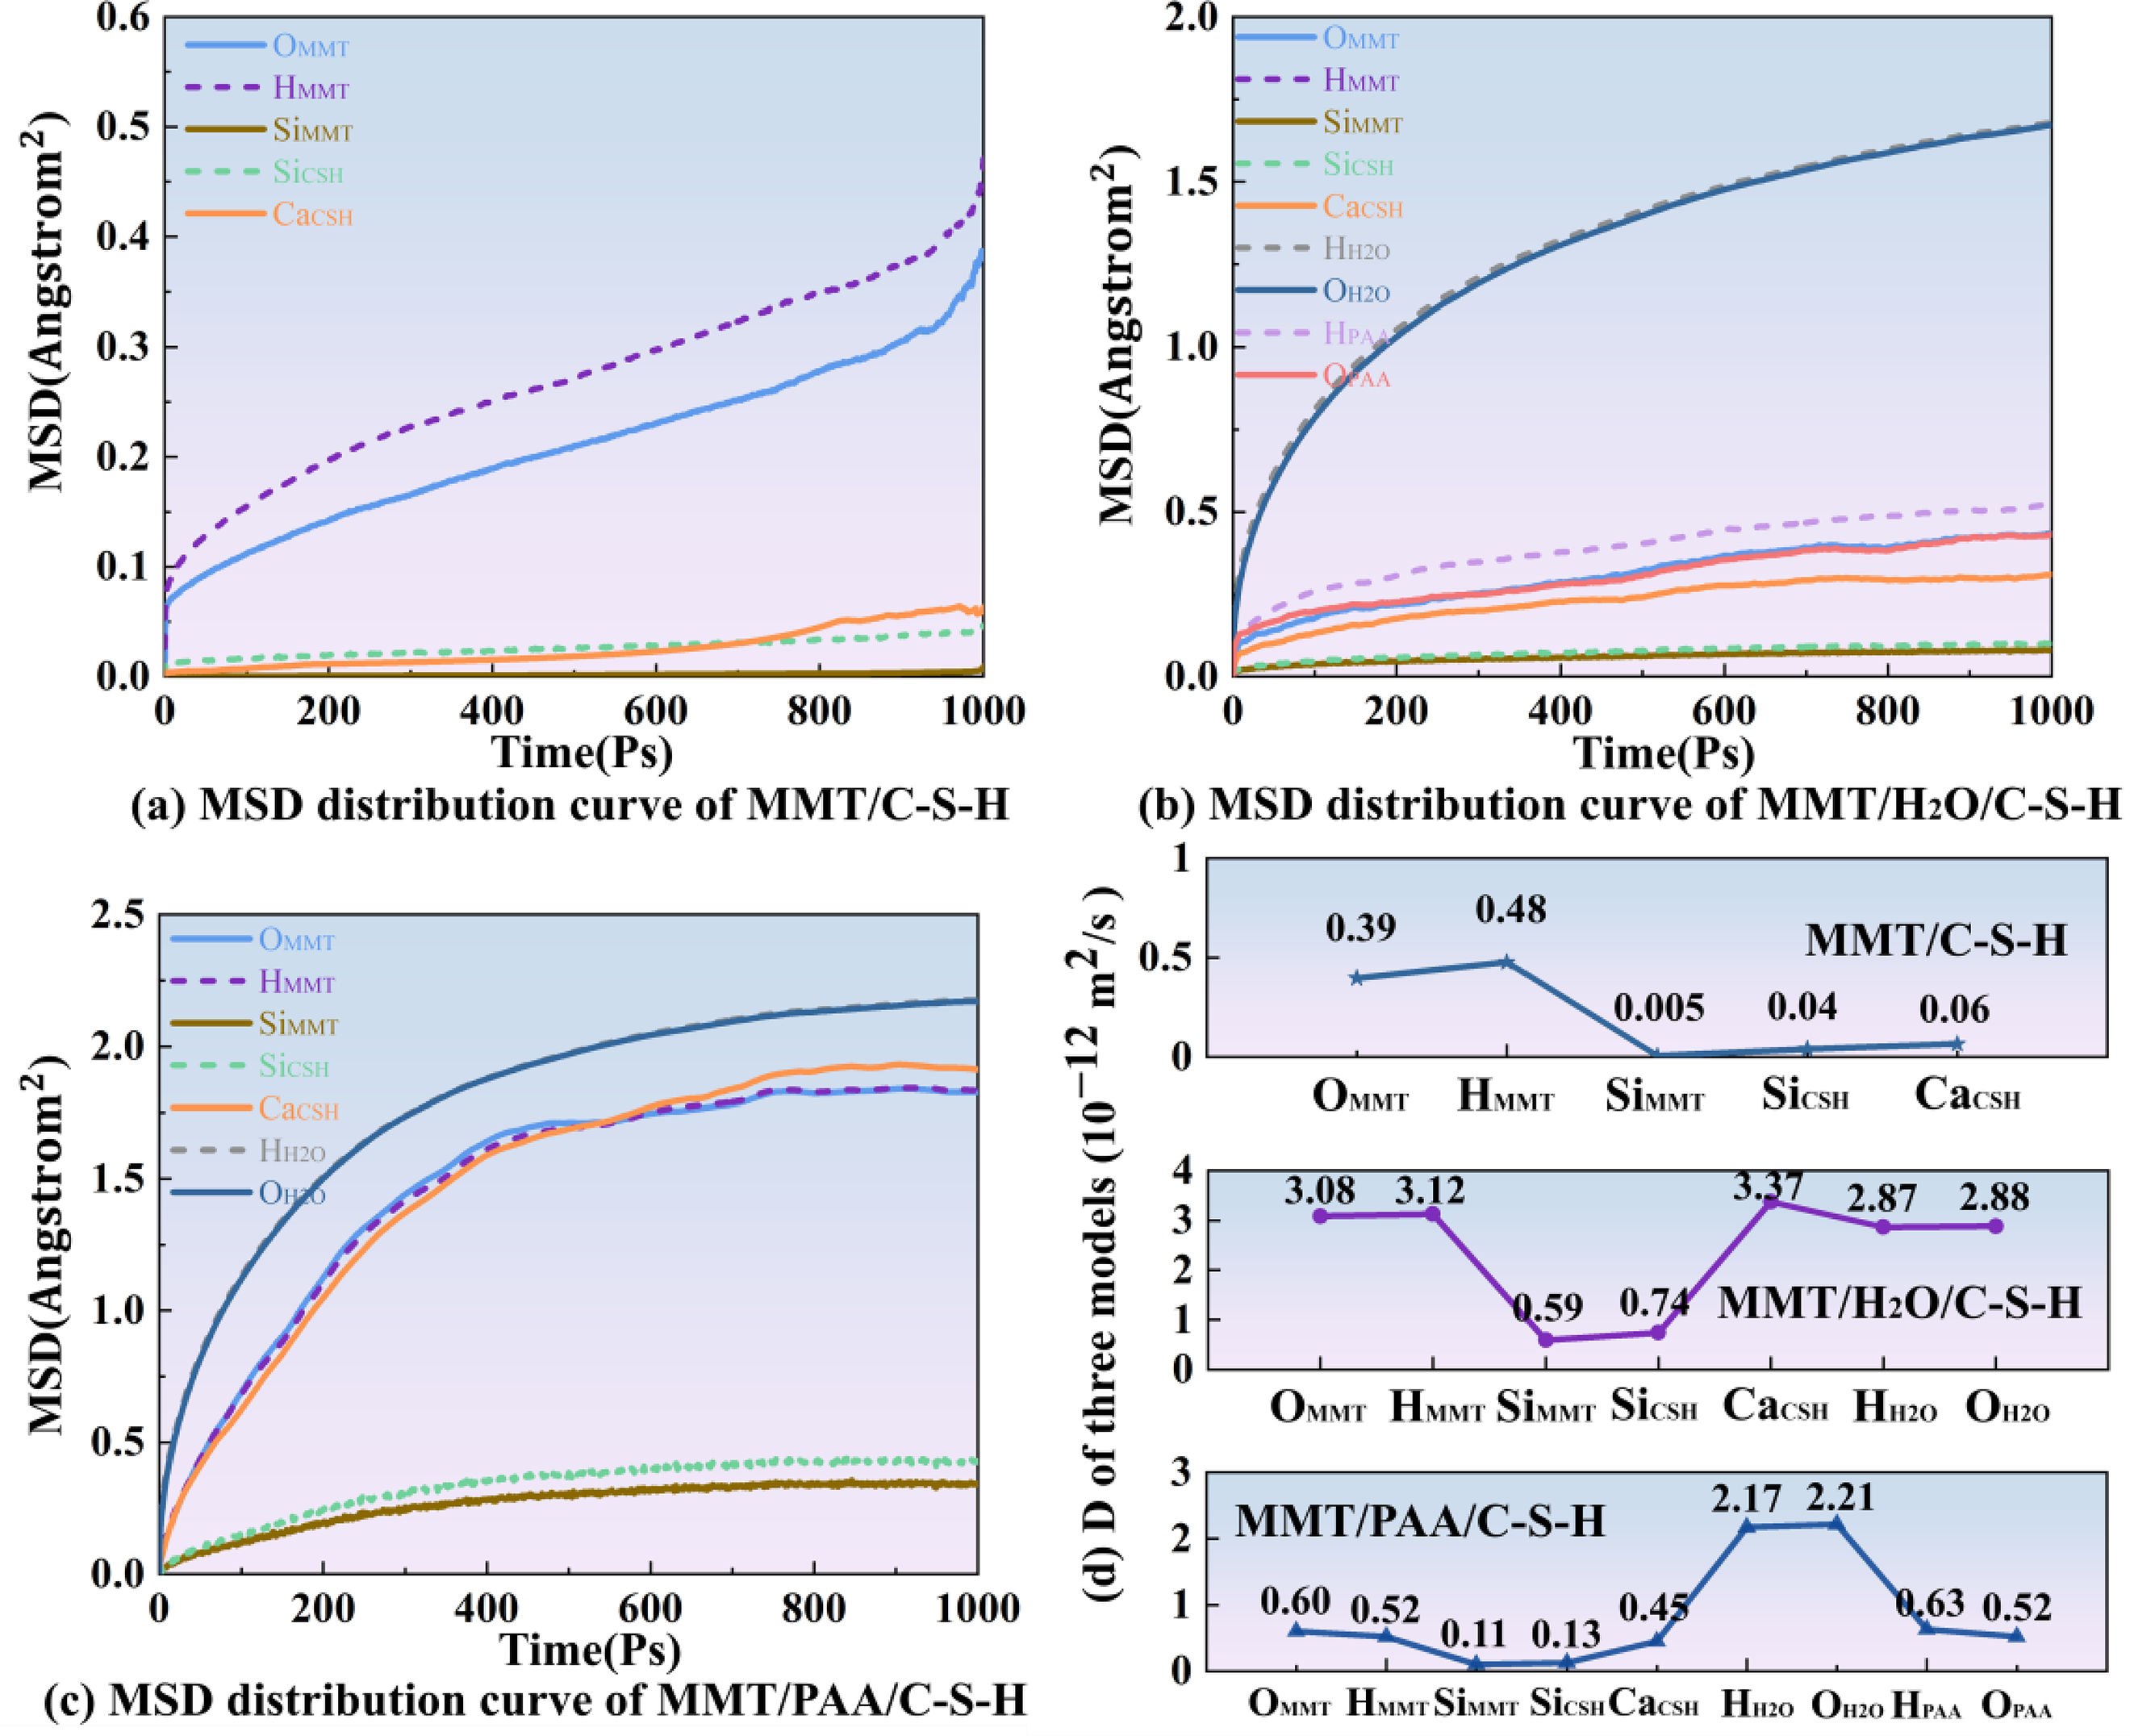
As shown in Figure 10(a), the MSD curves of the MMT/C-S-H system are overall flat. Although OMMT and HMMT exhibit slightly higher displacements than the framework ions, their absolute values remain very small. SiMMT and SiCSH nearly coincide with the zero axis, reflecting merely lattice thermal vibrations, and the corresponding diffusion coefficients are consistently low. The migration of Ca in C-S-H is only 0.06 × 10⁻¹² m2 s−1, indicating a rigidly locked interface where molecular motion is strongly constrained.
In Figure 10(b), upon introducing water (MMT/H2O/C-S-H), the MSD curves rise markedly at early times and then transitioning to a slower growth stage. The diffusion coefficients for OMMT and HMMT reach 3.08 and 3.12 × 10⁻¹² m2 s−1, respectively, evidencing a substantial increase. Free water species (HH2O and OH2O) show D values of 2.87 and 2.88 × 10⁻¹² m2 s−1, indicative of high interfacial mobility. The framework atoms SiMMT and SiCSH also become partially activated, while the diffusion coefficient of CaC-S-H increases to 3.37 × 10⁻¹² m2 s−1 exceeding that of water revealing pronounced Ca2+ migration and redistribution at the interface under hydration. These results indicate that water establishes a lubricating layer that greatly attenuates direct solid-solid contact and induces concerted motion of surface groups and ions; although lubricity is significantly enhanced, potential ion leaching and structural relaxation are also implicated.
In the MMT/PAA/C-S-H system with PAA added, the overall trend of the MSD curves lies between the dry and hydrated cases. The diffusion coefficients of water molecules, HH2O and OH2O, decrease to 2.17 and 2.21 × 10⁻¹² m2/s, weaker than in the pure water system. For the PAA chain segments, the diffusion coefficients of HPAA and OPAA are 0.63 and 0.52 × 10⁻¹² m2/s, indicating moderate mobility that is clearly lower than that of water. Meanwhile, OMMT and HMMT fall relative to the hydrated system, and the framework Si remains weakly diffusive. Notably, the diffusion coefficient of CaCSH drops from 3.37 to 0.43 × 10⁻¹² m2/s, indicating that PAA forms stable coordination or hydrogen bonding with Ca2+ and effectively suppresses disordered ionic diffusion. These results show that PAA forms a polymer film at the interface, which not only constrains water molecules but also enhances interfacial stability through an anchoring effect. Overall, the PAA system preserves a degree of lubricity while markedly improving structural stability, reflecting the dual advantages of lubrication and anchoring.
Qualitative analysis
This study adopts a multiscale framework combining macroscale experiments with molecular dynamics (MD) simulations to clarify how PAA modification governs slurry interfacial behavior and rheology. At the atomic scale, MD shows that PAA carboxyl groups coordinate with Ca2+ ions and densify the interfacial hydrogen-bond network, forming a stable hydrated polymer layer. The reduced interfacial adhesion energy explains the measured decrease in friction coefficient, while the suppressed diffusion of free water is consistent with the observed reduction in fluid loss and near-zero bleeding. These features collectively enhance interfacial stability and water retention. At the microscale, TEM observations corroborate the MD predictions, showing a transition from agglomerated particles and coarse pores to dispersed particles with a continuous organic-rich interfacial layer. This flexible coating accounts for the simultaneous reduction in friction and maintenance of pumpable viscosity. These mechanisms manifest at the macroscale in the orthogonal tests: within 12–14% bentonite and 0.3–0.4% PAA, the slurry exhibits low fluid loss (minimum ≈7.6 mL/30 min), near-zero bleeding, a friction coefficient around 0.22 (generally <0.25), and a Su’s funnel time of about 150–180 s. Together, these results establish a continuous mapping from nanoscale ion coordination and hydrogen-bond densification, through microscale interfacial layer formation, to macroscopic rheology and friction performance, providing an operational framework for engineering application.
Multiscale interpretation and limitations of MD simulations
In the present study, molecular dynamics simulations are employed to resolve interfacial mechanisms at the atomic scale. Owing to their intrinsically short time scales and high effective strain rates, MD simulations are not intended to provide direct quantitative correspondence with continuum-scale experimental values. Instead, the MD results serve as a mechanistic bridge that explains the origin of the observed macroscopic trends, such as reduced friction, enhanced water retention, and improved thixotropic stability. Through this mechanism-oriented multiscale interpretation, consistency across length scales is established without enforcing point-to-point numerical equivalence.
Conclusion
This study introduces sodium polyacrylate (PAA) as a modifier to improve the flowability and stability of sandy spoil slurry for pipe-jacking, and proposes a “dual optimization” mechanism that enhances both lubricity and interfacial stability. The main conclusions are as follows: (1) Macroscale tests show that with PAA addition, fluid loss decreases markedly (by approximately 60%) and bleeding is effectively suppressed to nearly zero; meanwhile, the Su’s funnel time increases with dosage, indicating enhanced cohesion due to chain entanglement and network formation. To balance pumpability and stability, a bentonite content of 12–14% combined with 0.3–0.4% PAA maintains the funnel time at about 150–180 s while keeping the friction coefficient below 0.25 (corresponding to an overall reduction of ∼55% compared with the unmodified system). Sensitivity analysis further indicates that bentonite primarily governs fluid loss and viscosity, whereas PAA is more influential on friction and bleeding; within the above ranges, the two components act synergistically to achieve low fluid loss, low drag, and workable viscosity. (2) TEM observations show that PAA forms a uniform coating on sandy spoil particles and fills interparticle pores, producing a denser and more homogeneous structure. The bentonite slurry transitions from a densely agglomerated state to a flexible lubricating architecture with a continuous coating, which suppresses re-flocculation, reduces internal friction, and improves reconstruct-ability, yielding higher structural stability and better rheological response. (3) Molecular dynamics simulations reveal that water creates a flexible lubricating layer at the interface, while PAA forms stable anchoring sites with Ca2+ through its carboxyl groups, effectively retaining interfacial water and generating a thick and uniform multilayer interfacial film. Analyses of the hydrogen-bond network, binding energy, and radial distribution functions show that the synergy of lubrication, water retention, and anchoring markedly improves the interfacial microstructure and provides a molecular basis for enhanced macroscopic rheology and friction reduction.
Although early research was conducted on lubrication at both macro and micro scales, this work advances the field by liking macroscale and microscale experiments with molecular simulations from multiple perspectives to elucidate how admixtures enhance slurry thixotropy. Based on these findings, future research will expand the range of simulated and experimental dosages to identify optimal proportions under diverse operating conditions. In parallel, molecular dynamics simulations will continue to be used to resolve atomistic interfacial behavior, and the resulting mechanistic insights will be translated toward engineering application through large-scale laboratory testing and in situ validation under representative construction scenarios. These efforts will promote the integration of component–structure–performance relationships into slurry design and practice and advance the development of more rigorous multiscale modeling in subsequent studies.
Footnotes
Declaration of conflicting interests
No potential conflict of interest was reported by the authors.
Funding
The authors disclosed receipt of the following financial support for the research, authorship, and/or publication of this article: This work was supported by the National Natural Science Foundation of China Grant Nos. 52178401, 52578540, 52478477, the Science and Technology Innovation Team Support Program for Henan Universities Grant No. 23IRTSTHN014, the Key Project of the Natural Science Foundation of Henan Province Grant No. 252300421251, and the Henan Provincial Natural Science Foundation Interdisciplinary Innovation Research Group Project Grant No. 252300421827.