
Abstract
This study investigates how carbon black (CB) distribution in co-continuous polypropylene (PP)/poly(ethylene-co-vinyl acetate) (EVA) blends affects electrical impedance spectroscopy (EIS) properties. PP:CB and EVA:CB masterbatches with 1, 2, or 3 vol% CB were prepared by the melt-mixing method. PP:CB and EVA:CB masterbatches with different CB volume fractions were mixed together to form PP/EVA blends (40/60 vol%) with CB distributions of 1/3, 2/2, or 3/1 vol%. A 60/40 vol% PP/EVA blend with 2/2 vol% CB was also prepared to study morphology effects. Samples were characterized using EIS, scanning electron microscopy (SEM), atomic force microscopy (AFM), Raman spectroscopy, and dynamic rheometry. SEM and AFM confirmed co-continuous morphology in all samples. EIS revealed that uneven CB distribution, particularly in the PP:CB 3 vol%/EVA:CB 1 vol% blend, reduced the real part of impedance and increased the frequency cut-off (fc), indicating higher capacitance in Nyquist plots. The 60/40 vol% PP/EVA blend with 2/2 vol% CB exhibited a 38-fold capacitance increase compared to the 40/60 vol% blend, attributed to lower impedance in the PP:CB phase. These findings demonstrate that tailoring CB distribution optimizes electrical energy storage performance and establishes EIS as a robust tool for characterizing conductive particle distribution in immiscible polymer blends.
Introduction
Electrically conductive polymer nanocomposites have garnered significant attention for their applications in anti-static packaging, electromagnetic interference (EMI) shielding, sensors, and energy storage devices.1–4 A primary challenge in developing these materials is achieving adequate electrical conductivity while minimizing the content of conductive fillers, which often compromise mechanical properties and processability.5–7 To address this, recent research has focused on strategies to reduce the electrical percolation threshold by tailoring the microstructure of these composites. 8 One practical approach involves blending immiscible polymers with conductive nanoparticles (NPs), allowing for control over the spatial distribution of conductive pathways. 9
A fundamental study by Sumita et al. 10 demonstrated that localizing conductive NPs within a single phase of a co-continuous polymer blend significantly lowers the percolation threshold, an effect termed double percolation. This structural advantage facilitates more efficient charge transport. 10 However, the distribution of NPs across the phases of polymer blends often occurs in a non-uniform manner, meaning they are not predominantly localized in a single phase but are distributed across both phases. This behavior is influenced by a combination of thermodynamic, kinetic, and processing factors, including nanoparticle–polymer interactions and processing conditions. 11 A thorough understanding of how NP distribution affects electrical performance is therefore essential for the rational design of advanced nanocomposites for sensing and EMI applications. 12
One of the polymer blends which has been studied in the literature as a polymer matrix of conductive fillers is polypropylene/ethylene-vinyl acetate (PP/EVA). For example, Zhang et al studied direct current (DC) electrical conductivity of PP/EVA with conductive carbon black (CB) fillers. They observed that percolation threshold for PP/CB was 7.8 vol%, but for PP/EVA/CB percolation threshold decreased to 3.8 vol% because of the double percolation phenomena, and also, they revealed that at a constant concentration of 5 vol%, the electrical conductivity for PP/CB was 10−12 S/cm, but for PP/EVA/CB it was decreased to 10−2 S/cm. 13 Another study, related to the PP/EVA blend containing CB particles is about the effect of processing on the electrical percolation threshold. Which they extruded samples one time and three times then they compared that with each other, they observed that for one time extrusion the morphology was co-continuous but by re-extrusion of them, the morphology from co-continuous transforms to disperse-matrix morphology, because of this reason the volume resistivity was increased from 1014 to 107 Ω.cm. 14 Sena et al. demonstrated the advantages of gradient structural design in polymer nanocomposites for electromagnetic absorption. Using a PP/EVA/CNT system with a co-continuous morphology, they achieved a percolation threshold of 0.02 vol% due to the selective localization of CNTs at the interface and within the EVA phase. The study compared single-layer absorbers against three-layer cascade configurations. They found that arranging layers with increasing conductivity gradients (e.g., 0.3/0.7/1.0 wt% CNT) optimized impedance matching, resulting in a minimum reflection loss of −35.5 dB and an effective absorption bandwidth of 6.6 GHz, superior to homogeneous single-layer counterparts. 15
Frequency-dependent conductivity analysis is a useful method for investigating the microstructure of such composites. Specifically, the frequency cut-off (fc) at which impedance largely drops relates to the number of available conductive pathways, while the slope after the cut-off provides insights into the main conduction mechanism. Electrical Impedance Spectroscopy (EIS) has become a particularly powerful tool in this area. 16 For example, Dadashi et al 17 studied the conduction behavior of PP/EVA blends with multi-walled carbon nanotubes (MWCNTs) using a PP-g-MA/MWCNT masterbatch. They observed that short mixing times (around 1 minute) resulted in less dispersion and lower real impedance (Z′), indicating better conductivity and a very low percolation threshold of 0.16 vol%. The appearance of a dielectric relaxation peak near 105 Hz indicated a dominant direct-contact conduction mechanism. In contrast, longer mixing times (about 4.5 minutes) increased Z′ by a factor of 40 and produced larger semicircles in Cole-Cole plots, implying a shift to a tunneling-dominated mechanism and a higher percolation threshold of 0.95 vol%.
In a related study, the role of compatibilizers such as PP-g-MA in enhancing the dielectric properties of PP/EVA/CNT composites was examined. Increasing the content of PP-g-MA from 0 vol% to 20 vol% significantly improved both dielectric constant (from 10 to approximately 4 × 10⁴ F/m) and dielectric loss (from 5 × 10² to around 3 × 10⁶ F/m), indicating the development of a more interconnected and polarizable conductive network. This was further supported by Cole-Cole plots, which showed a notable decrease in semicircle diameter, reflecting lower charge transfer resistance and better CNT dispersion. Additionally, a downward shift in the frequency cut-off suggested a more capacitive and continuous conductive network, with 20 vol% PP-g-MA identified as the optimal content for maximizing performance. 18
In a recent study by Katten et al., 19 the impedance properties of a poly(ethylene glycol)/poly(vinyl acetate) blend (PEG/PVA) containing MWCNTs were investigated. The samples were prepared by solution casting with different concentrations of MWCNTs: 0.3 wt%, 0.6 wt%, and 1.2 wt%. According to the results, it was shown that increasing the concentration of MWCNTs enhanced the capacitive behavior of the samples due to improved charge transfer capability between the MWCNTs. The shift in the peak of the imaginary part of impedance and the decrease in peak intensity demonstrated a reduction in the relaxation time of the samples. Furthermore, the lowering of the Nyquist plot radius indicated a decrease in interfacial polarization, suggesting that these PEG/PVA/MWCNTs composites act as conductive blend nanocomposites with potential for energy storage applications.
In a recent study, Nagabhooshnam et al. 20 prepared PVA-based hybrid composites in which the basalt microfiber (10 vol%) and nickel microwire (30 vol%) contents were kept constant, while the biocarbon content was varied from 0 to 5 vol%. The EIS analyzer was used to characterize the samples. The Nyquist analysis confirmed that hybrid reinforcement systematically enhances electrical relaxation and interfacial charge dynamics, with biocarbon content playing a dominant role in strengthening polarization mechanisms and dielectric loss processes.
In another study, EIS revealed a strong dependence of the electrical response on frequency and filler loading in the MWCNTs/PANI/PS nanocomposites. The real part of impedance (Z′) decreased monotonically with increasing frequency for all samples, with the highest values observed at low frequencies due to pronounced space-charge accumulation and interfacial polarization. Increasing the PANI and MWCNT contents led to a significant reduction in Z′ over the entire frequency range, indicating enhanced charge-carrier mobility and the formation of conductive percolation pathways. 21
Ibrahim et al 22 investigated the effect of static applied pressure on the electrical and dielectric properties of multiwalled carbon nanotube (MWCNT) and polystyrene (PS) nanocomposites. The study also characterizes the mechanical and optical properties of these materials, emphasizing the role of 2,3-hydroxy-2-naphthoic acid (β-HNA) as a dispersing agent. Analysis using Cole-Cole plots further reveals that the radius of the impedance semicircles decreases with higher pressure, indicating a reduction in the distance between nanotubes and a decrease in contact resistance within the conductive network. These changes are found to be highly reproducible during loading-unloading cycles, suggesting that the stable and predictable relationship between impedance, frequency, and pressure makes these nanocomposites suitable for pressure-sensitive sensing applications.
Given the significance of conductive nanoparticle distribution in binary blends for electrical properties, and the sensitivity of the EIS technique to microstructural analysis, this study investigates the EIS characteristics of PP/EVA blend nanocomposites containing carbon black (CB) nanoparticles with intentionally varied degrees of CB segregation. A 40/60 vol% PP/EVA blend was prepared with CB localized at 1/3, 2/2, and 3/1 vol% ratios. Additionally, a 60/40 vol% PP/EVA blend with a 2/2 vol% CB distribution was prepared to examine the influence of blend morphology. The highlight difference between our research compare to previous literatures are in this research we localize selectively CB particles in both phase with different ratio of CB in two phases, but in the previous research works, CB particles were localized predominantly in one phase and we want to investigate the effect of ratio of localization, and also in the previous works they used dc conductivity.
This research addresses two significant gaps in the existing literature. First, while prior research has consistently focused on CB localization within a single phase, this work investigates the specific impact of partitioning CB across both phases at varying ratios. Second, whereas previous studies relied largely on DC conductivity measurements, this study utilizes Electrical Impedance Spectroscopy (EIS) to achieve a more comprehensive characterization of the electrical properties and microstructure properties.
Materials and Methods
Materials
PP J740, with a density of 0.9 g/cm3 and a melt flow index (MFI) of 25 g/10 min at 230°C, was purchased from Hyosung Company, China. EVA grade VS430 with 19 wt% of Vinyl Acetate Content (VA), from Lotte Chemical with density of 0.939 g/cm3 and MFI of 2.5 g/10 min at 190°C was used. Ketjenblack EC-300J, with a surface area of 800 m2/g and a volume resistivity of 0.01 Ω·cm, was purchased from LION Specialty Chemicals Co., Ltd. Before mixing EVA with PP, EVA was placed in an oven at 60°C. Samples were blended using an internal mixer with a volume of 60 cc. The main formulation under investigation consists of 60 vol% EVA and 40 vol% PP, along with a fixed 4 vol% of conductive carbon black. This specific composition was chosen based on previous research projects aimed at achieving a conductive co-continuous morphology.17,18
Sample Preparation
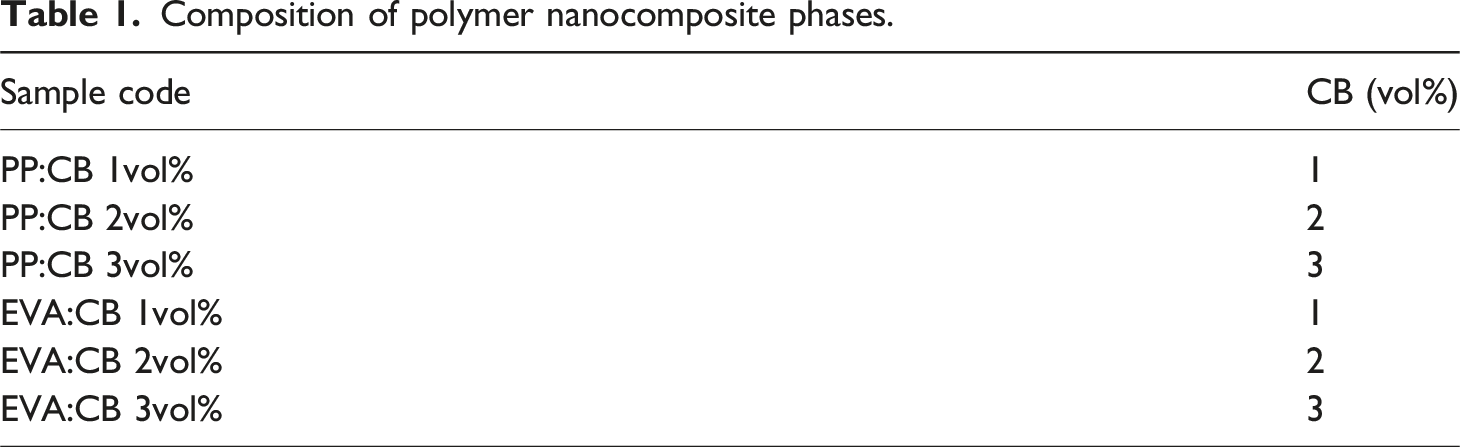
Composition of polymer nanocomposite phases.
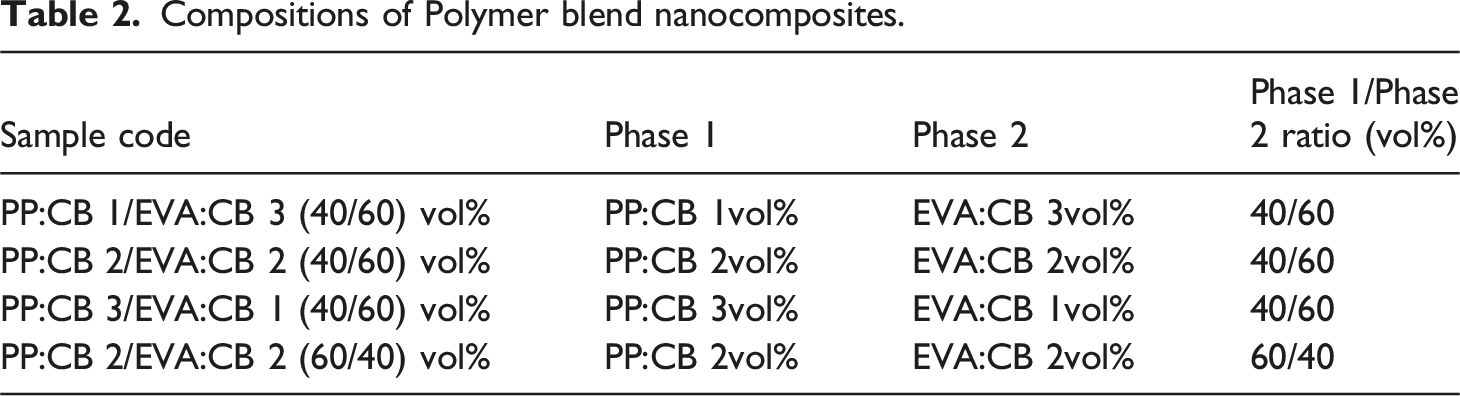
Compositions of Polymer blend nanocomposites.
Characterization
FESEM Test
A field emission scanning electron microscope (FE-SEM) was used to analyze polymer blend nanocomposites morphology using cryogenically fracturing of rectangular samples after being immersed in liquid nitrogen for 5 minutes. To better distinguish the phases in the images, the fractured samples were placed in 1,2-dichloroethane solution at 70°C under stirring for 1 hour to extract the EVA phase. The fractured cross-sections were then coated with a thin layer of gold to enhance conductivity and improve image quality. Imaging was performed using MIRA SEM, manufactured by TESCAN.
Atomic Force Microscopy (AFM) Test
The morphology and surface topology of the samples were examined using a multifunctional atomic force microscope (AFM) equipped with a silicon tip (ARA-AFM, ARA Pajohesh). Thin film specimens were prepared with a cryo-ultramicrotome.
Rheological Measurement Spectroscopy Test
To investigate viscosity changes versus shear rate and predict blend morphology and process kinetics, a Physica MCR300 viscometer from Anton Paar was used. The steady shear rate viscosity was measured up to a shear rate of 50 Hz. Additionally, to study the viscoelastic properties of the melt, strain sweep tests were first conducted to identify the linear viscoelastic region. Based on the strain sweep results, polymer nanocomposite samples were evaluated at 190°C and 1% strain across a frequency range of 0.1 to 600 Hz.
Electrical Impedance Spectroscopy (EIS) Test
To examine the inductive and capacitive properties of the samples, changes in the real and imaginary parts of impedance with frequency were analyzed. This test was carried out using a Solar Sharif Iran potentiostat from IRASOL, in electrical impedance mode, over a frequency range of 0.1 to 1 MHz. The applied voltage ranged from −5 to +5 V. Each EIS curve is an average of at least three replicates. The replicates show standard deviations less than a nominal value of 2%.
Results and Discussion
Thermodynamic and Kinetic Prediction of NPs Localization

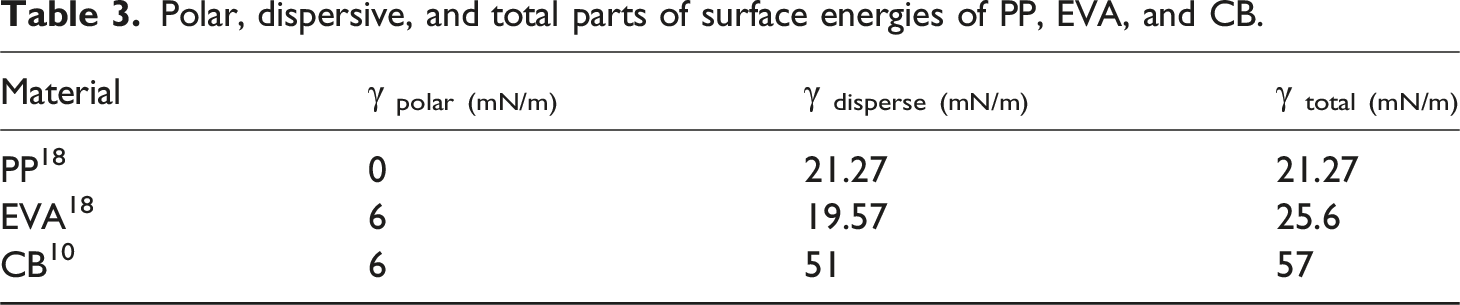
Polar, dispersive, and total parts of surface energies of PP, EVA, and CB.
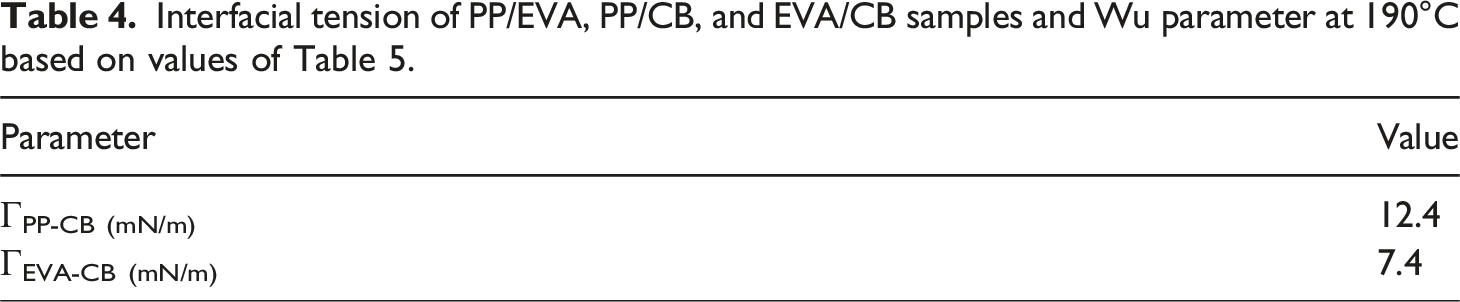
Interfacial tension of PP/EVA, PP/CB, and EVA/CB samples and Wu parameter at 190°C based on values of Table 5.
Viscosity versus shear rate data plots is shown in Figure S1. This figure shows that PP has lower viscosity than EVA at all shear rates, meaning that CB localized in PP remains in this phase because of the kinetic preference of CB for PP. The lower viscosity of PP compared to EVA was the main reason for choosing these materials to kinetically control NP localization within PP, preventing migration from this phase. The thermodynamic affinity of CB for EVA, combined with its kinetic affinity for PP and a short mixing time, ensures CB retention in both phases and prevents its migration between both phases.
Morphological Observation
Figure 1 shows FE-SEM images of different PP/EVA blend samples: PP:CB 1/EVA:CB 3 (40/60) vol%, PP:CB 2/EVA:CB 2 (40/60) vol%, PP:CB 3/EVA:CB 1 (40/60) vol%, and PP:CB 2/EVA:CB 2 (60/40) vol%. All samples display a co-continuous or semi-co-continuous structure. The dark areas are the EVA phase, which was selectively etched using 1,2-dichloromethane, while the gray areas represent the PP phase. FE-SEM micrographs of (a) PP:CB 1/EVA:CB 3 (40/60) vol%,(b) PP:CB 2/EVA:CB 2 (40/60) vol%, (c) PP:CB 3/EVA:CB 1 (40/60) vol%, and (d) PP:CB 2/EVA:CB 2 (60/40) vol%.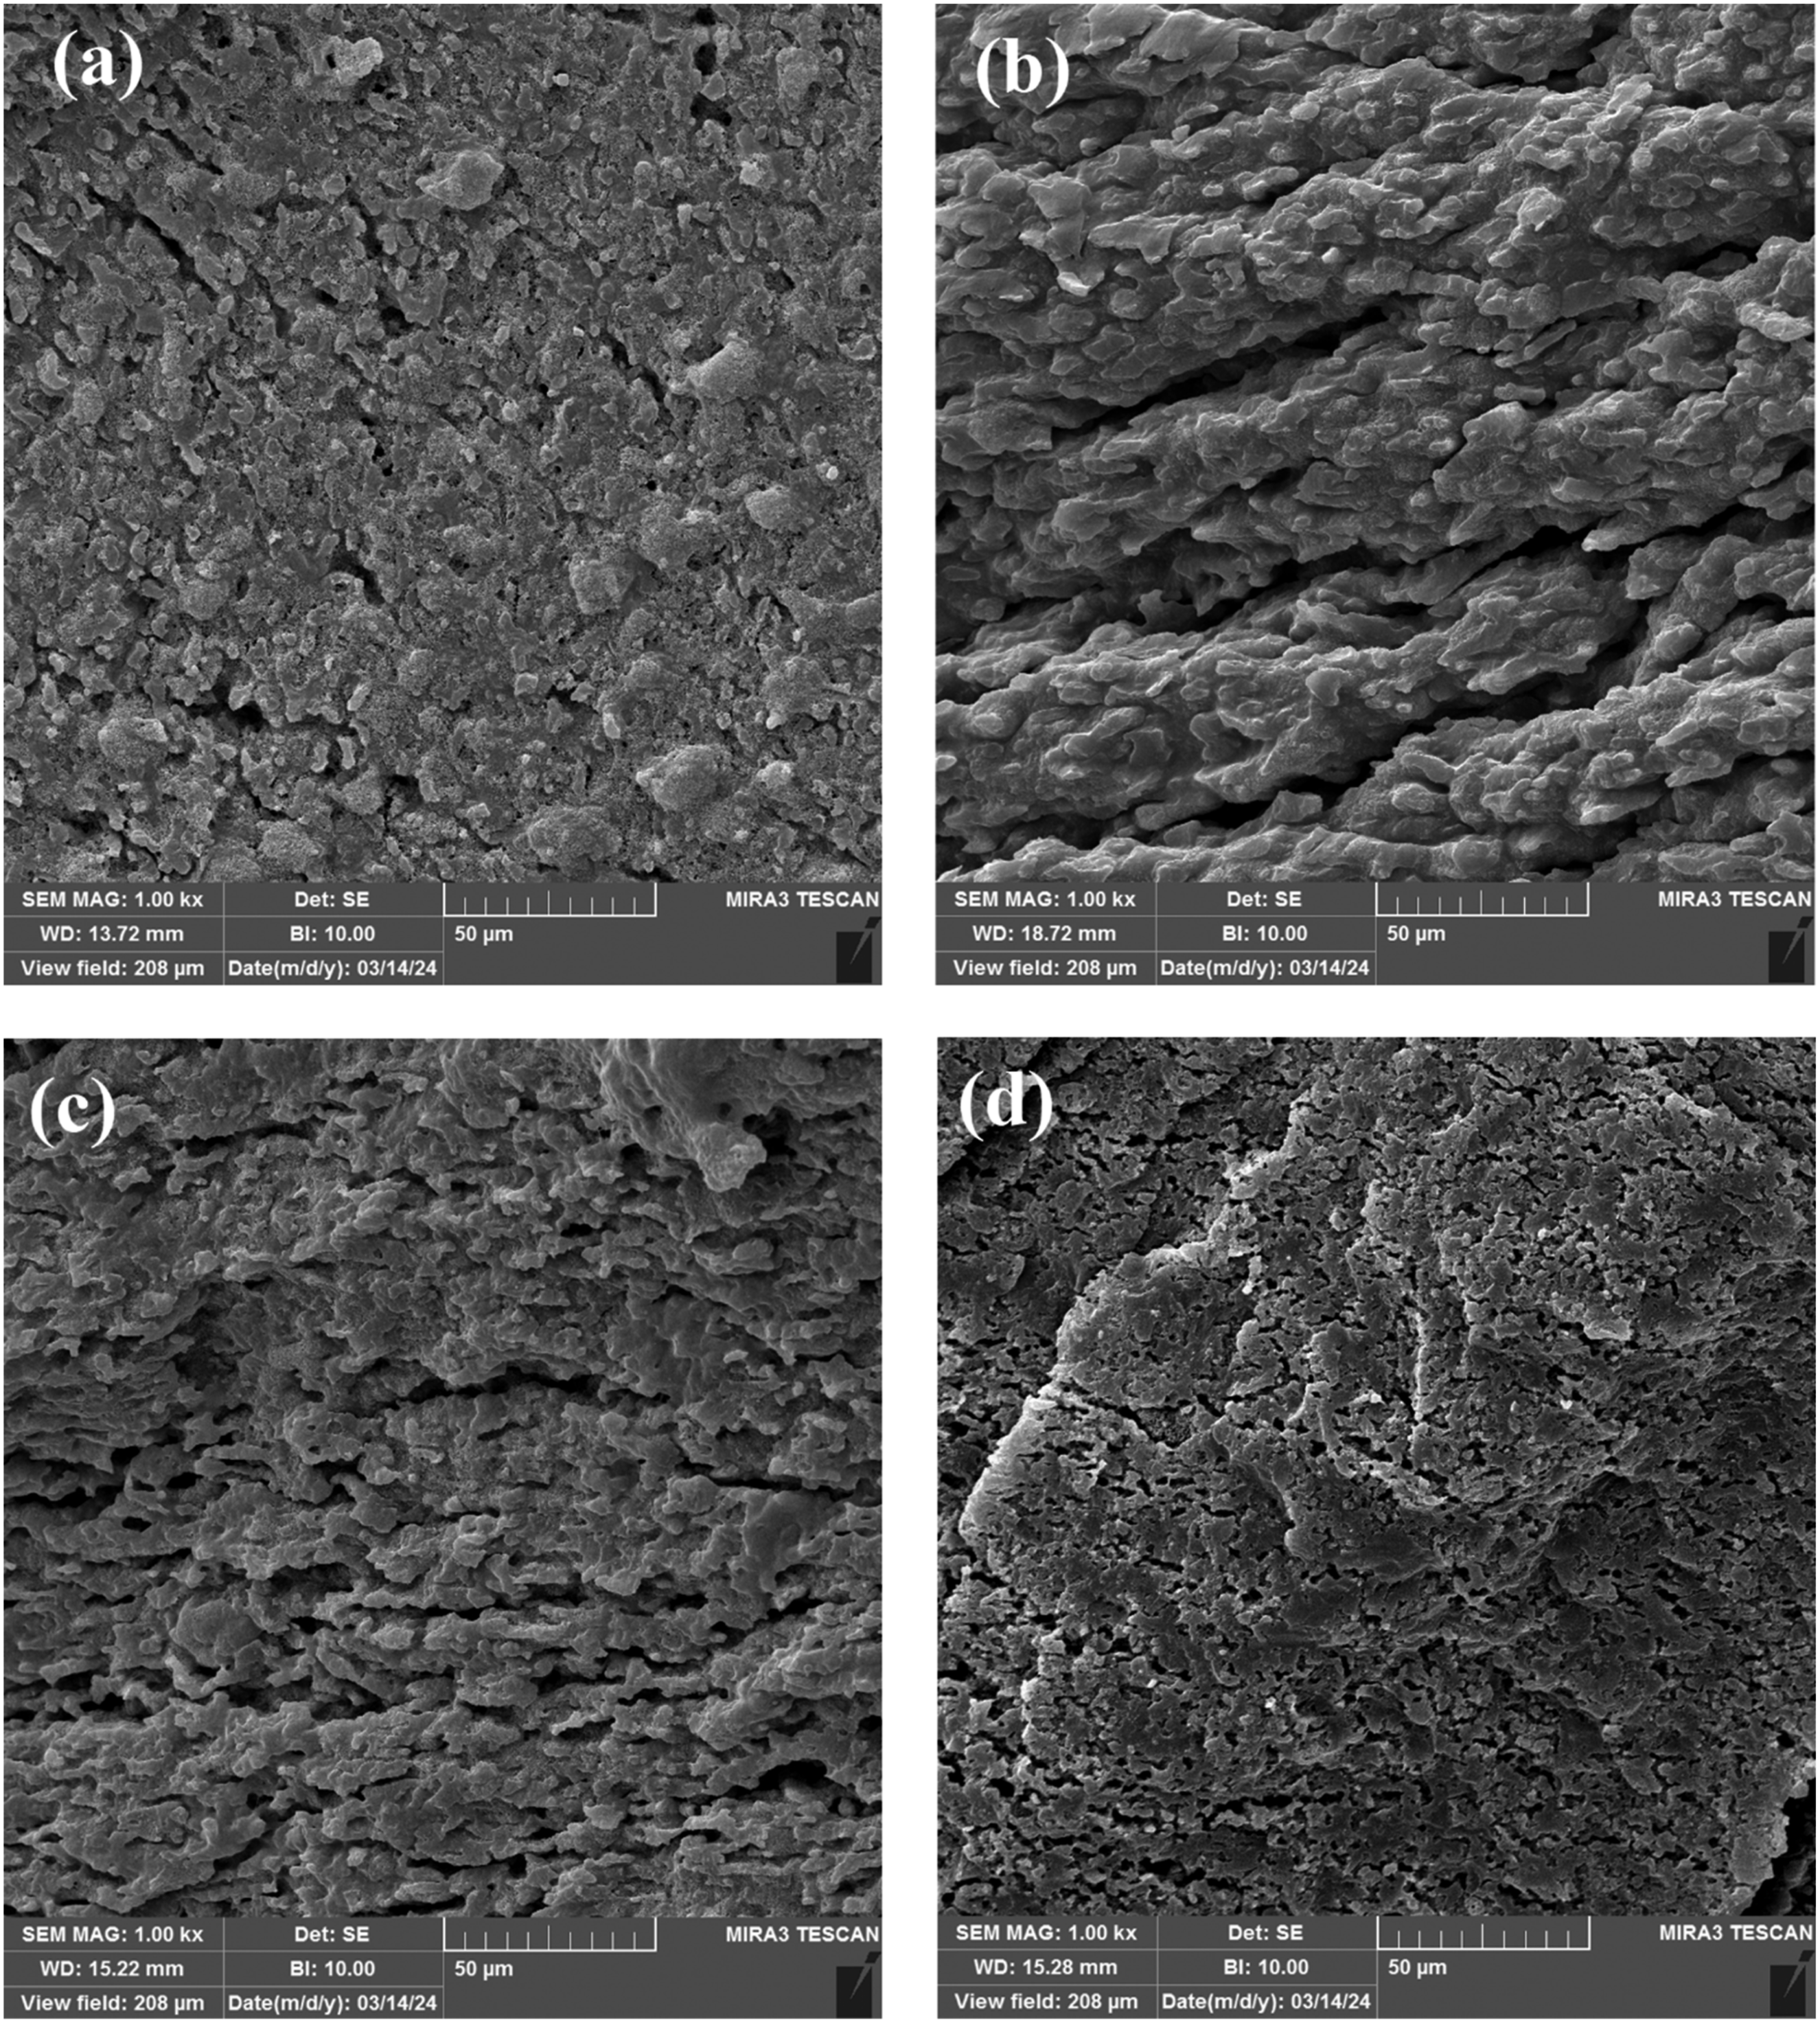
As seen in Figure 1(a), PP:CB 1/EVA:CB 3 (40/60) vol% does not show a clear droplet matrix morphology; instead, signs of co-continuous morphology are observed. However, the degree and size of co-continuity increase in PP:CB 2/EVA:CB 2 (40/60) vol%, Figure 1(b). Furthermore, co-continuity is more visible for PP:CB 3/EVA:CB 1 (40/60) vol%, Figure 1(c). Therefore, as the concentration of CB increases in the PP phase, the degree of co-continuity increases. Lastly, the PP:CB 2/EVA:CB 2 (60/40) vol%, blend, where the volume percent of the PP phase is larger than the EVA phase, displays co-continuous morphology.
Figure 2 presents a higher-magnification view of the PP:CB 2/EVA:CB 2 (60/40 vol%) sample to observe the CB particles. The dark areas represent EVA, while the gray areas correspond to PP. Figure 2(a) indicates that spherical CB particles, highlighted by red circles, are present in both the PP and EVA phases. This observation was expected because the short mixing time (30 s) prevented the migration of CB between the phases. In addition, the lower viscosity of PP used in this study compared to EVA, as shown in Figure S1, helped to keep most of the CB within their masterbatch structures. A related study using the masterbatch method for PP/EVA/CNT systems showed that by reducing the mixing time to 1 min, CNTs remained within their respective phases. FE-SEM of (a) PP:CB 2/EVA:CB 2, (b) PP:CB 3/EVA:CB 1, and (c) PP:CB 1/EVA:CB 3 (60/40) vol% showing distribution of CB in PP and EVA.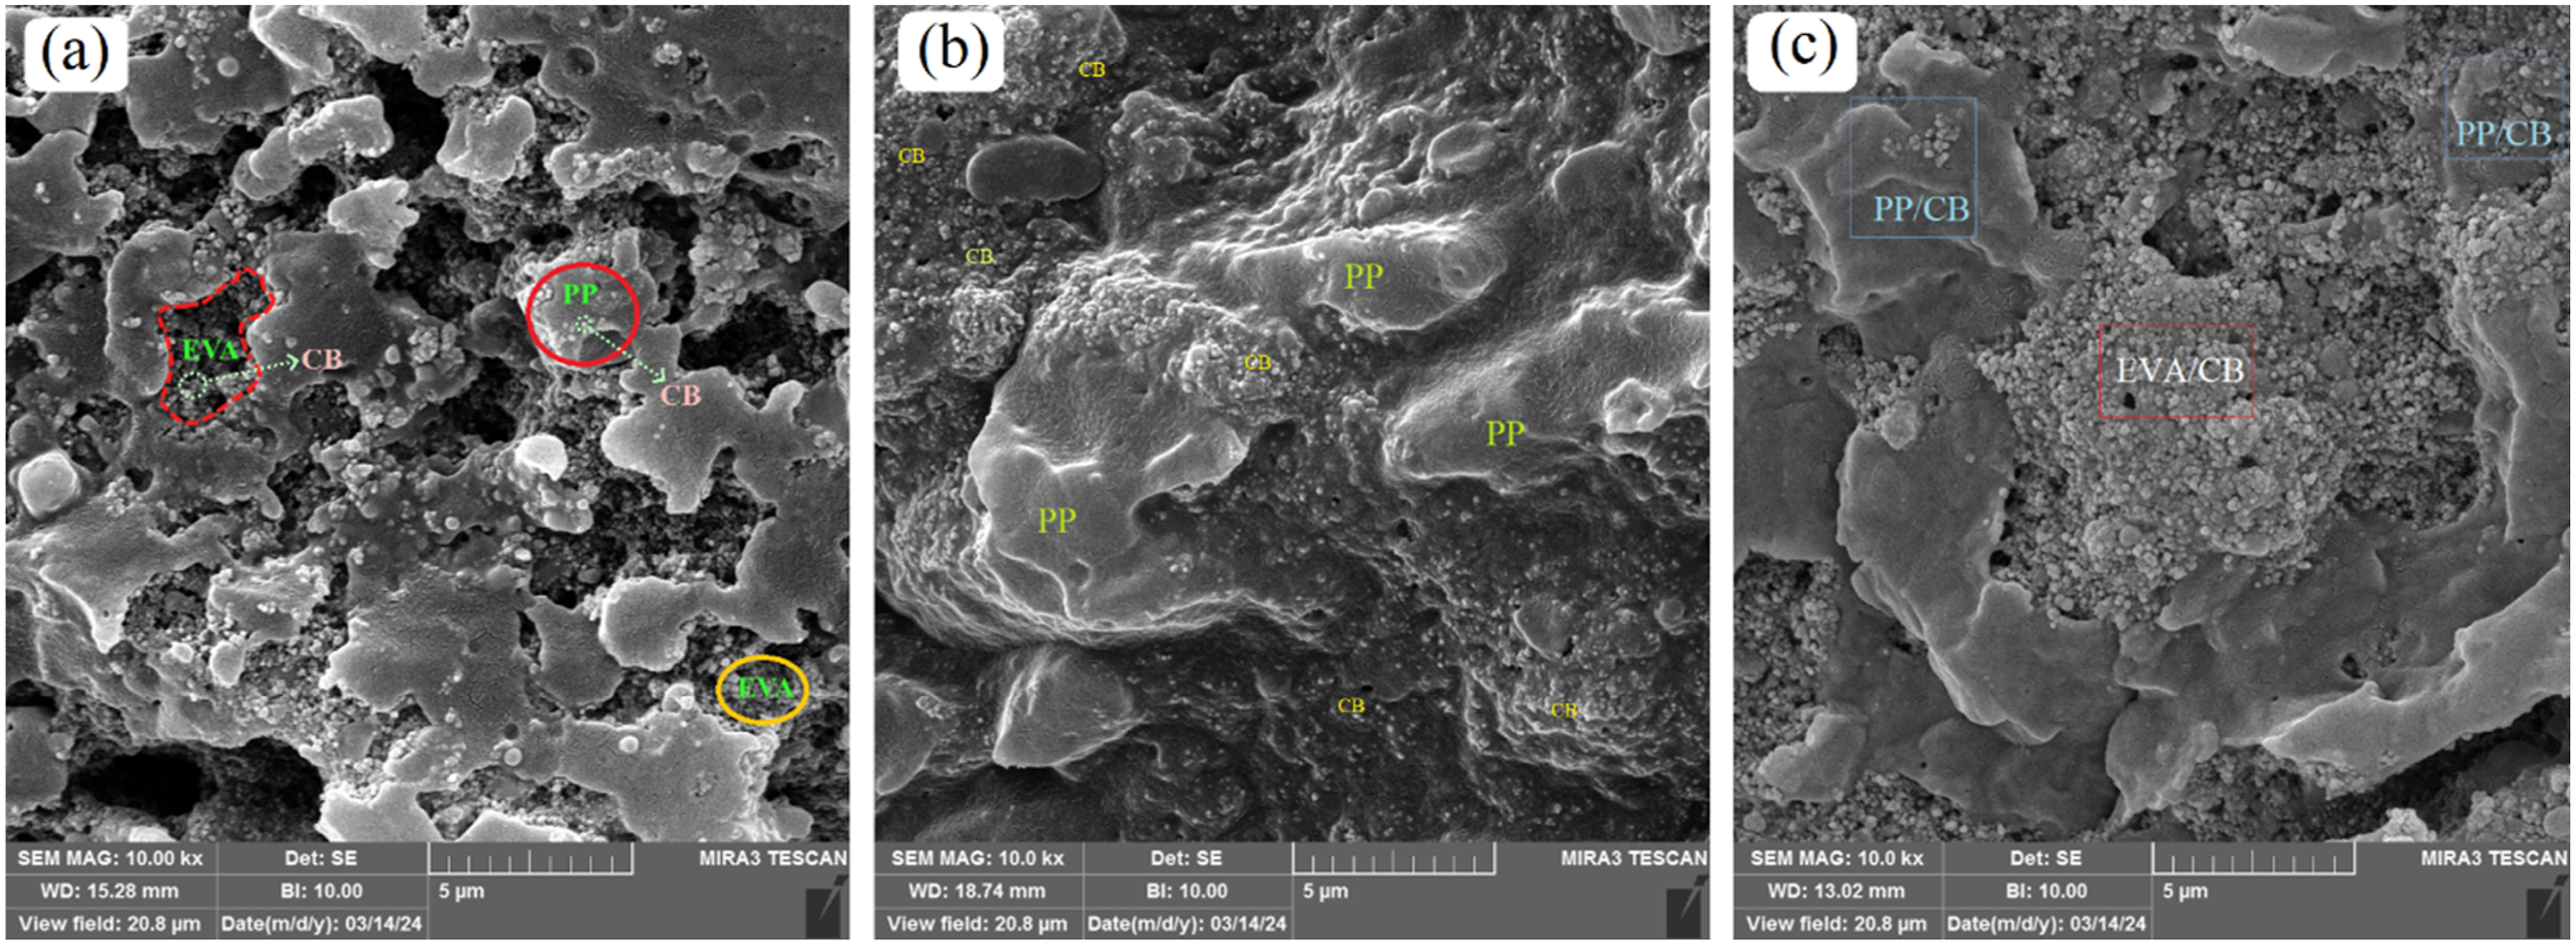
For further evaluation, the PP:CB 3/EVA:CB 1 sample, as shown in Figure 2(b), was examined. In this figure, spherical CB particles can clearly be observed in PP phase. In addition, the PP:CB 1/EVA:CB 3 sample shown in Figure 2(c) presents an interesting observation in which, after etching the EVA phase, some CB particles become attracted to each other due to the adhesive nature of EVA following extraction of this phase. Also, four specimens of the PP:CB 3/EVA:CB 1 sample were immersed in 1,2-dichloromethane for 24 hours, and it can be seen in Figure S2 that the color of the supernatant solution is completely black, indicating that most of the CB particles are present in the EVA phase.
EIS Measurements
Figure 3 shows the real part of impedance (Z′) and the imaginary part of impedance (Z′′) for all the samples. The real part (Z′) indicates resistance, and the imaginary part (Z′′) corresponds to reactance (also called the loss factor). Impedance (Z) is a complex quantity made up of the two components: It is expressed as Z = Z′ + jZ′′, where j is the imaginary unit (√−1)18. Real part of Impedance versus frequency for (a) PP:CB 1/EVA:CB 3 (40/60) vol%, (b) PP:CB 2/EVA:CB 2 (40/60) vol%, (c) PP:CB 3/EVA:CB 1 (40/60) vol%, and (d) PP:CB 1/EVA:CB 3 (60/40) vol% compared with their components.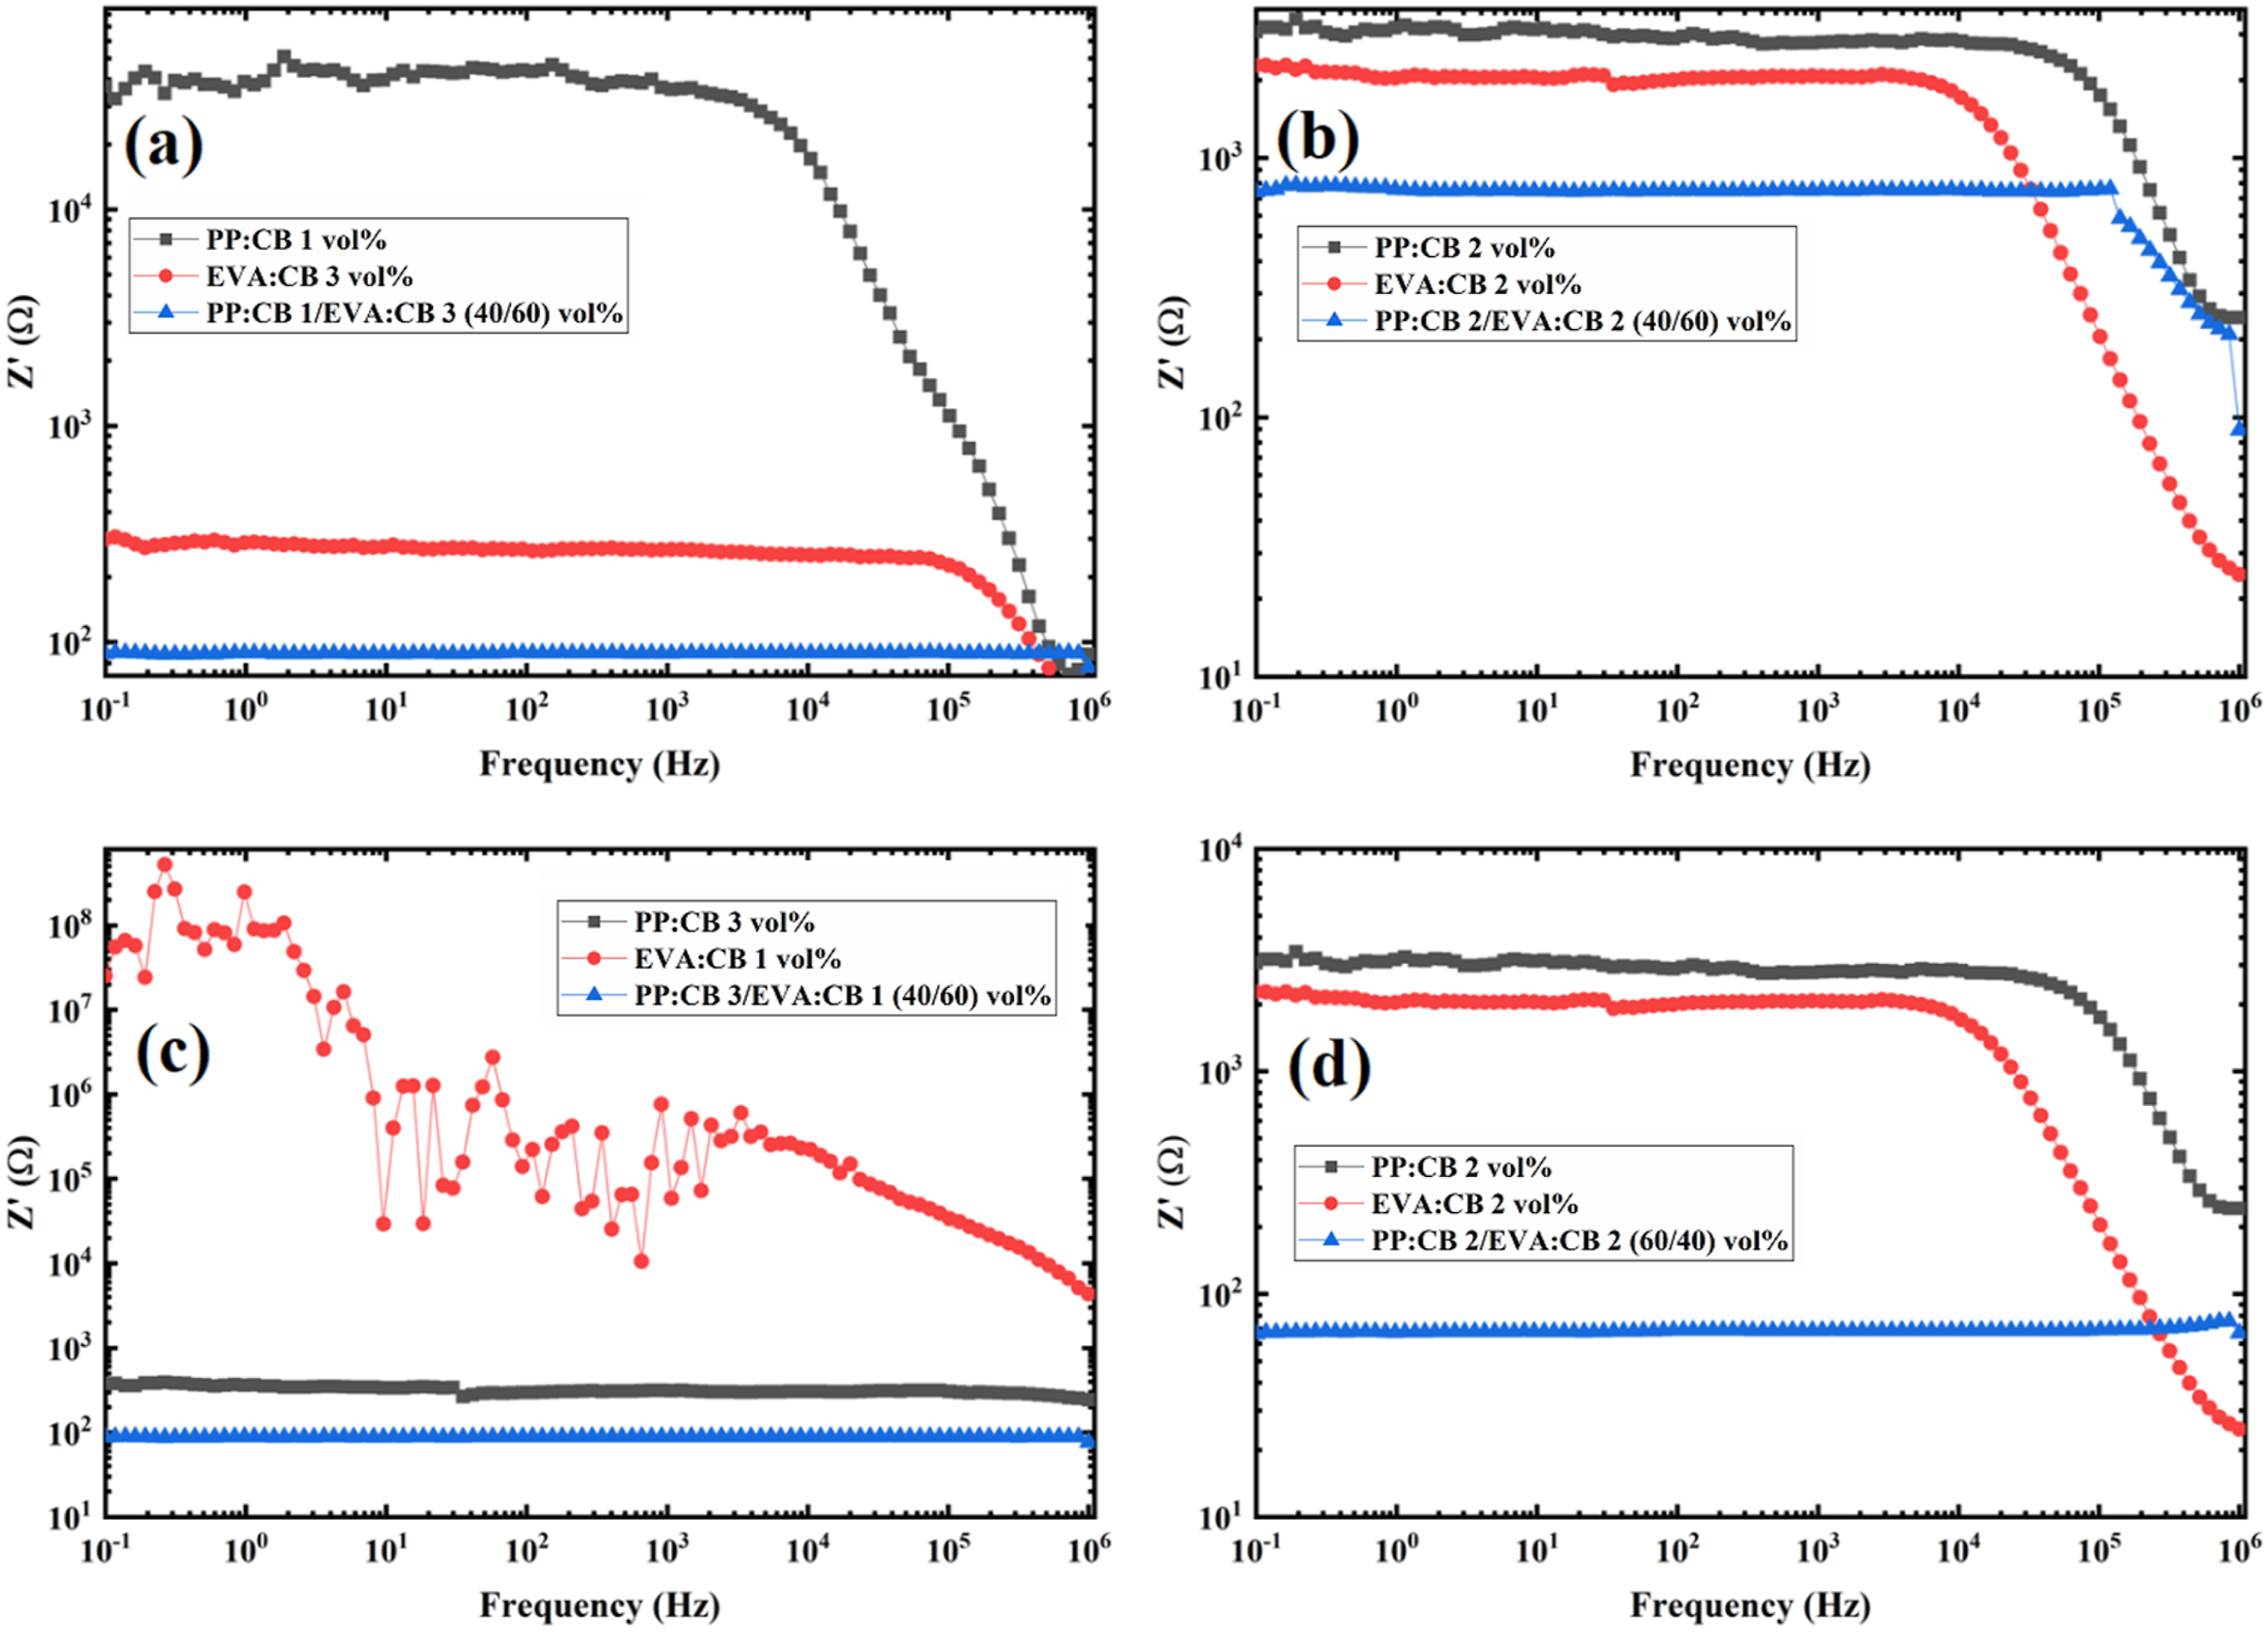
Figure 3 compares the EIS behavior of the PP/EVA blends and their single matrix counterparts, i.e. PP:CB 1vol%, PP:CB 2vol%, PP:CB 3vol%, EVA:CB 1vol%, EVA:CB 2vol%, EVA:CB 3vol%. First of all, Figure 3(a) clearly and interestingly shows the synergistic effect or double percolation effect of blending the two polymers. The impedance of PP:CB 1/EVA:CB 3 (40/60) vol% is smaller than that of PP:CB 1vol% and EVA:CB 3vol%. PP:CB 1/EVA:CB 3 (40/60) vol% blend shows higher fc than those of PP:CB 1vol% and EVA:CB 3vol%. This trend indicates that blending these two components improves the formation of conductive pathways compared to each component alone. The higher fc observed for EVA 3vol% compared to PP 1vol% is due to the greater CB content in the EVA phase.
Similarly, Figure 3(b) to 3(d) show the benefit of double percolation for blending PP and EVA. According to Figure 4(b), the fc of PP:CB 2vol% is higher than that of EVA:CB 2vol%, while the fc of PP:CB 2/EVA:CB 2 (40/60) vol% exceeds that of both components. Since PP:CB 2vol% and EVA:CB 2vol% have the same nanoparticle content and concentration according to Figure 3(b), the higher fc compared to EVA:CB 2vol% is related to more conductive pathways in PP, due to the crystalline structure of PP and its excluded volume effect and higher segregation of CB particles in PP due to higher interfacial tension of PP/CB compared to EVA/CB.
17
Imaginary part of Impedance versus frequency for (a) PP:CB 1/EVA:CB 3 (40/60) vol%, (b) PP:CB 2/EVA:CB 2 (40/60) vol%, (c) PP:CB 3/EVA:CB 1 (40/60) vol%, and (d) PP:CB 1/EVA:CB 3 (60/40) vol% samples compared with their components.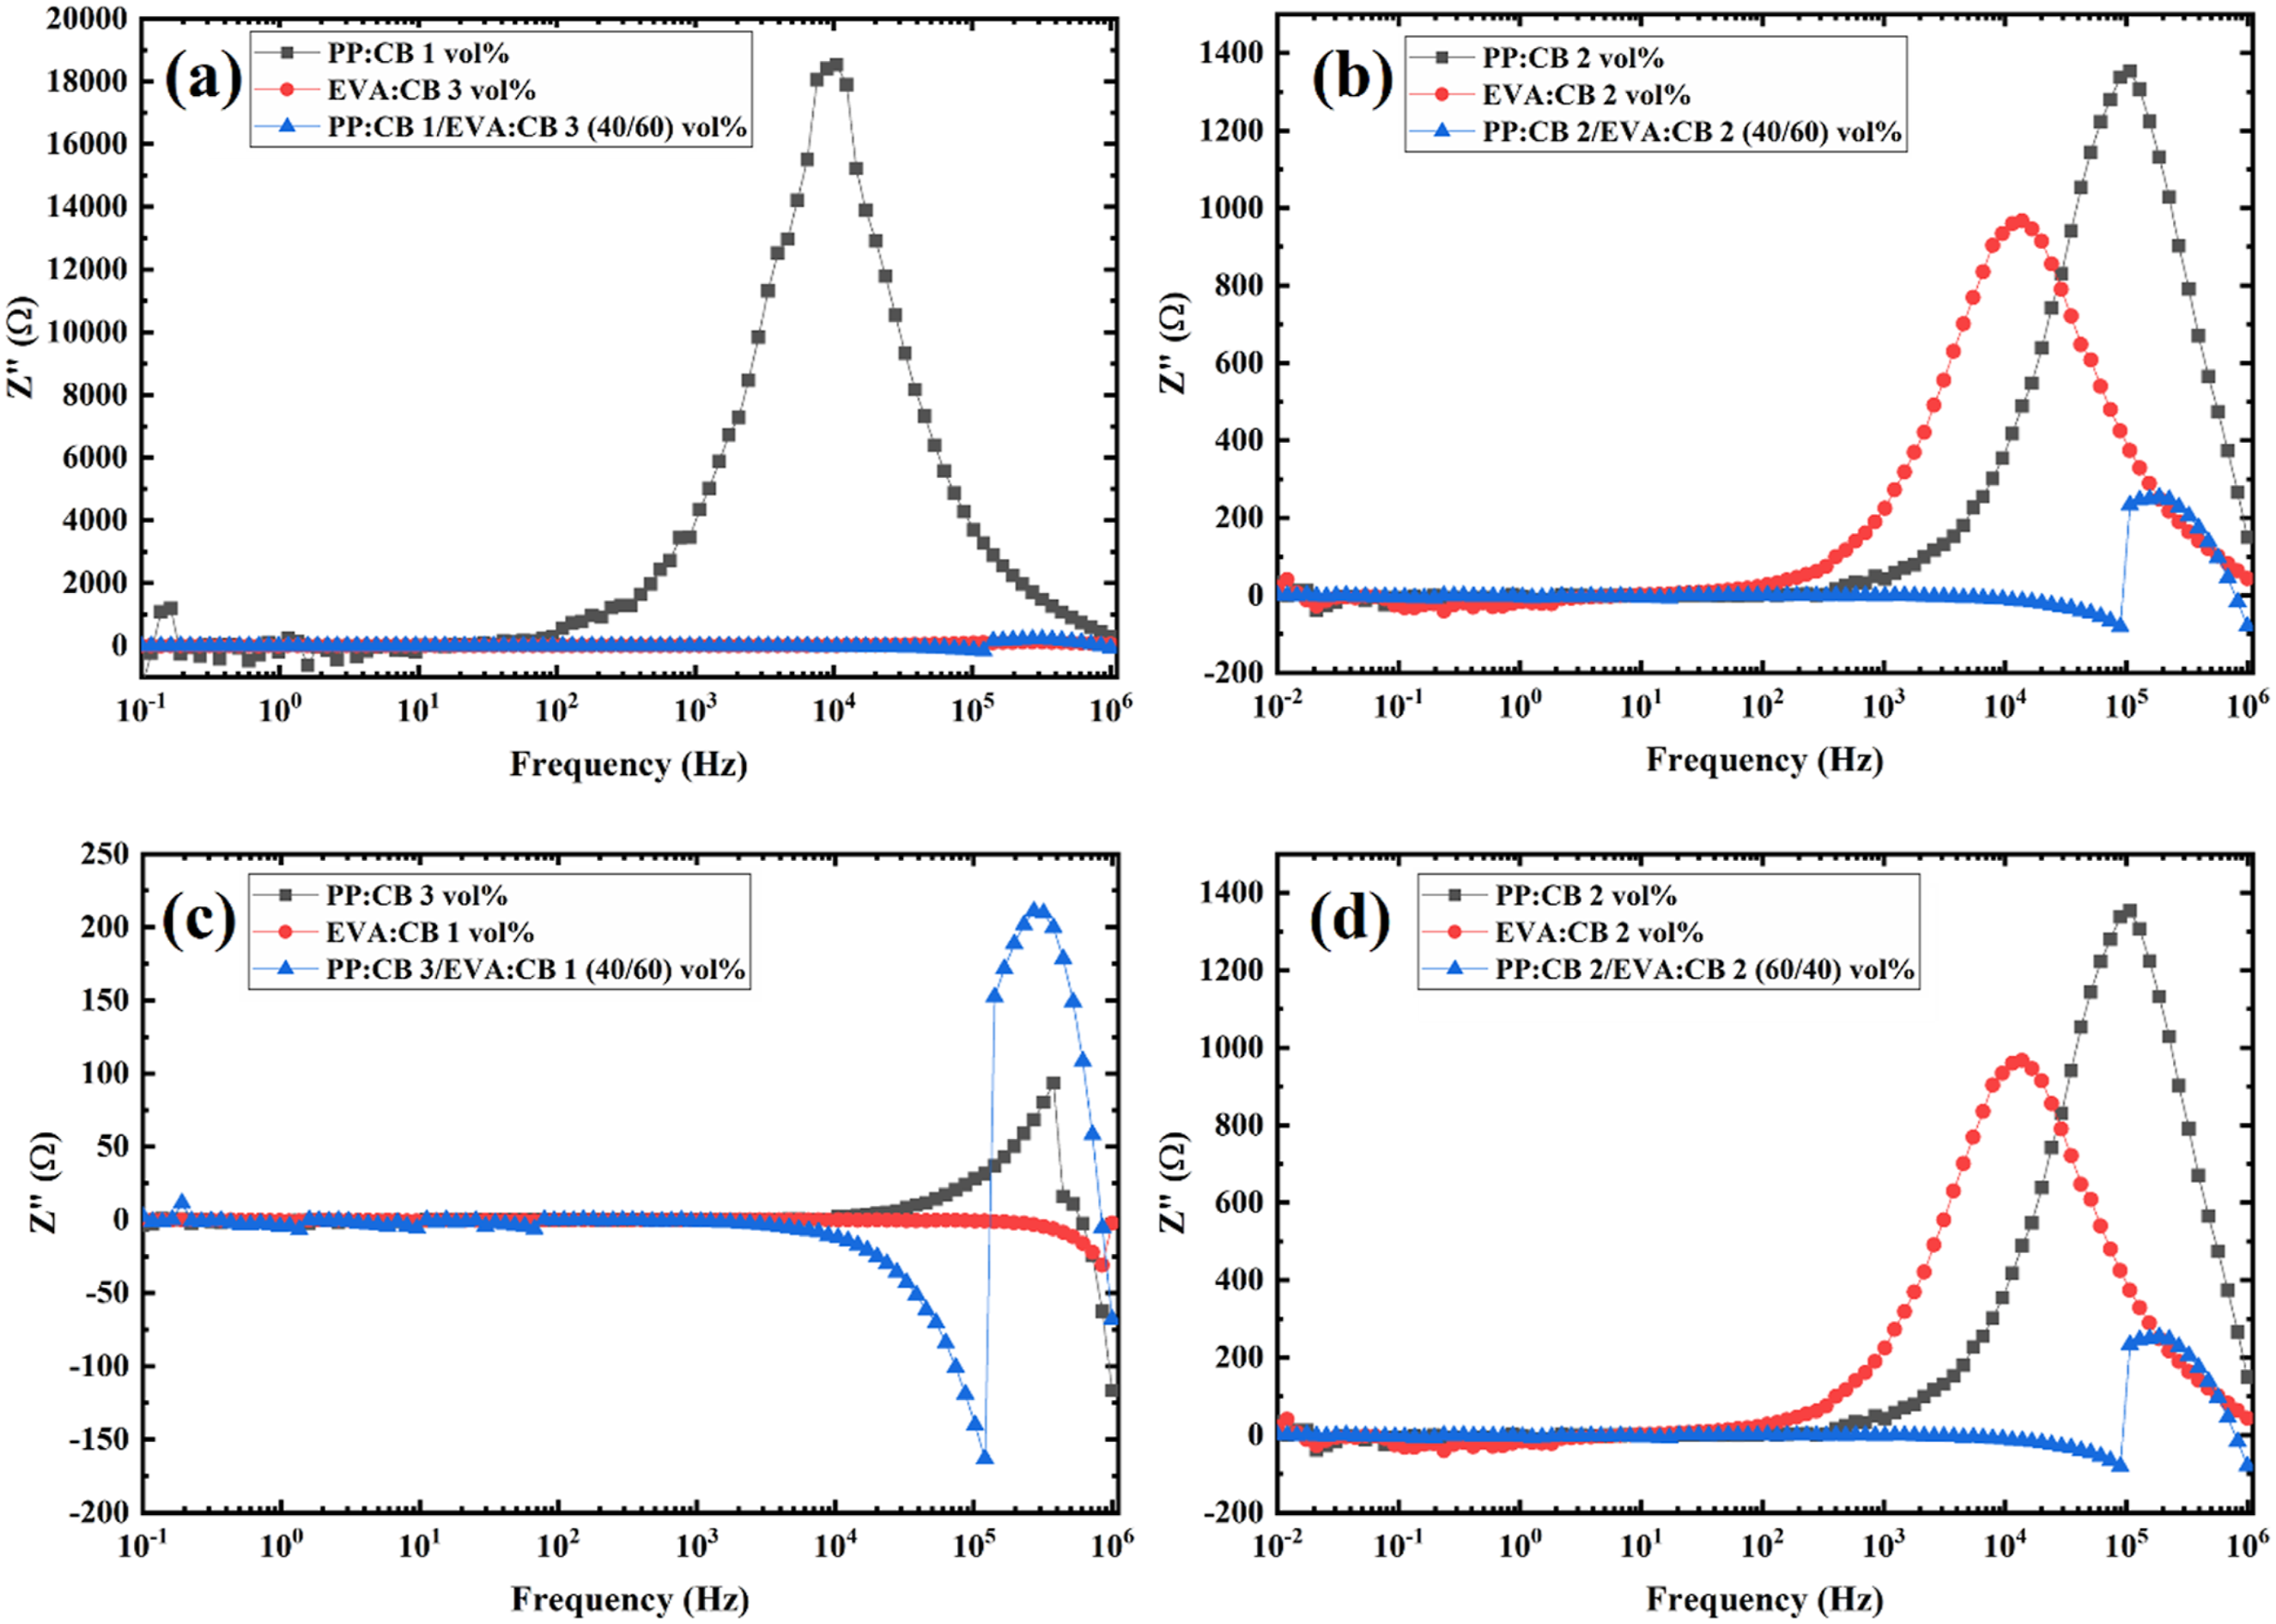
It is interesting to compare EVA:CB 2vol% and PP:CB 2vol% in Figure 3(b). PP:CB 2vol% shows higher impedance than EVA:CB 2vol%, i.e. PP:CB 2vol% is less conductive. Therefore, it is not expected to see fc at lower frequencies, which is not the case. It was seen that PP:CB 2/EVA:CB 2 (60/40) vol% is more conductive than PP:CB 2/EVA:CB 2 (40/60) vol%, which implies that the PP phase is more efficient in making conductive pathways. Therefore, through a contradiction, it is suggested that PP:CB 2vol%, which has higher impedance than EVA:CB 2vol%, has a more conductive structure due to the higher fc. Therefore, apart from impedance (Z′), fc is a determining factor in comparing the conductivity of polymer composites. This is another unique feature of EIS.
As illustrated in Figure 3, a distinct crossover in electrical behavior is observed between the two composites. At a 1% filler loading, EVA:CB exhibits significantly higher impedance than PP:CB. However, at 2%, the trend reverses, with PP:CB displaying higher impedance than EVA:CB.
This phenomenon can be attributed to the Excluded effect driven by polymer crystallinity. Polypropylene (PP) possesses a significantly higher crystalline fraction (41.9%) compared to EVA 24 (24.6%), as confirmed by the crystallinity data in Figure S3. Because the crystalline zones exclude the Carbon Black (CB) particles, the filler is forced into a much smaller amorphous volume in the PP matrix. This confinement facilitates the formation of a conductive network in PP even at low concentrations (1%). In contrast, the larger amorphous phase in EVA allows the CB to disperse more broadly, preventing the formation of efficient pathways at the same loading.
At higher filler loadings (2%), the quality of the internal network and interfacial contact becomes the dominant factor. The EVA matrix demonstrates superior wetting of the CB particles compared to PP, which reduces the contact resistance between particles. Consequently, the impedance of the EVA:CB system drops below that of PP:CB as the filler concentration increases.
Figure 4(a) to (d) show the part Z′′ of the samples. As observed, the less conductive samples display peaks at specific frequencies, confirming the same fc values seen in Z′ curves. Additionally, these curves align with the Z′ curves regarding shifts in fc for the blends. Surprisingly, there is a clear difference between the shape and trend of the peaks in the blends and their corresponding single matrix components. In the PP:CB or EVA:CB nanocomposites, the peaks are uniform and symmetrical, but for the PP: CB/EVA: CB blends, the peaks are irregular in shape and asymmetrical. At the peaks for the blends, Z′′ initially decreases and then suddenly increases with frequency, indicating a notable change in behavior. In other words, this suggests a discontinuity at the peak of the curve, which is associated with the heterogeneity of the polymer blend nanocomposites.
Figure 5 shows the real part and imaginary part of impedance for PP/EVA blend composites. As seen in Figure 5(a), the impedance Z′ of PP:CB 3/EVA:CB 1 (40/60) vol% and PP:CB 2/EVA:CB 2 (60/40) vol% are considerably lower than the other two, which is an indication of the formation of more conductive networks in these samples. On the other hand, PP:CB 2/EVA:CB 2 (40/60) vol% and PP:CB 1/EVA:CB 3 (40/60) vol% show a characteristic frequency called frequency cut-off (fc) at which Z′ suddenly drops. At fc, the real part of the impedance (Z′) shifts from a frequency-independent (resistive-like) behavior to a frequency-dependent (capacitive-like) behavior. This transition indicates a change in the electrical response of the nanocomposites.
18
However, fc is not observed in the measured frequency range for the other two samples, which are more conductive. This is due to the formation of highly conductive pathways in these systems, which pushes fc to higher values outside the measurement range.
16
As the system becomes more conductive, the resistive mechanism of conduction governs the electrical conduction behavior up to a higher frequency. Plots of (a) real part of Impedance (Z’) and (b) Imaginary part of Impedance (Z”) versus Frequency for PP:CB 1/EVA:CB 3 (40/60) vol%, PP:CB 2/EVA:CB 2 (40/60) vol%, PP:CB 3/EVA:CB 1 (40/60) vol%, and PP:CB 1/EVA:CB 3 (60/40) vol%.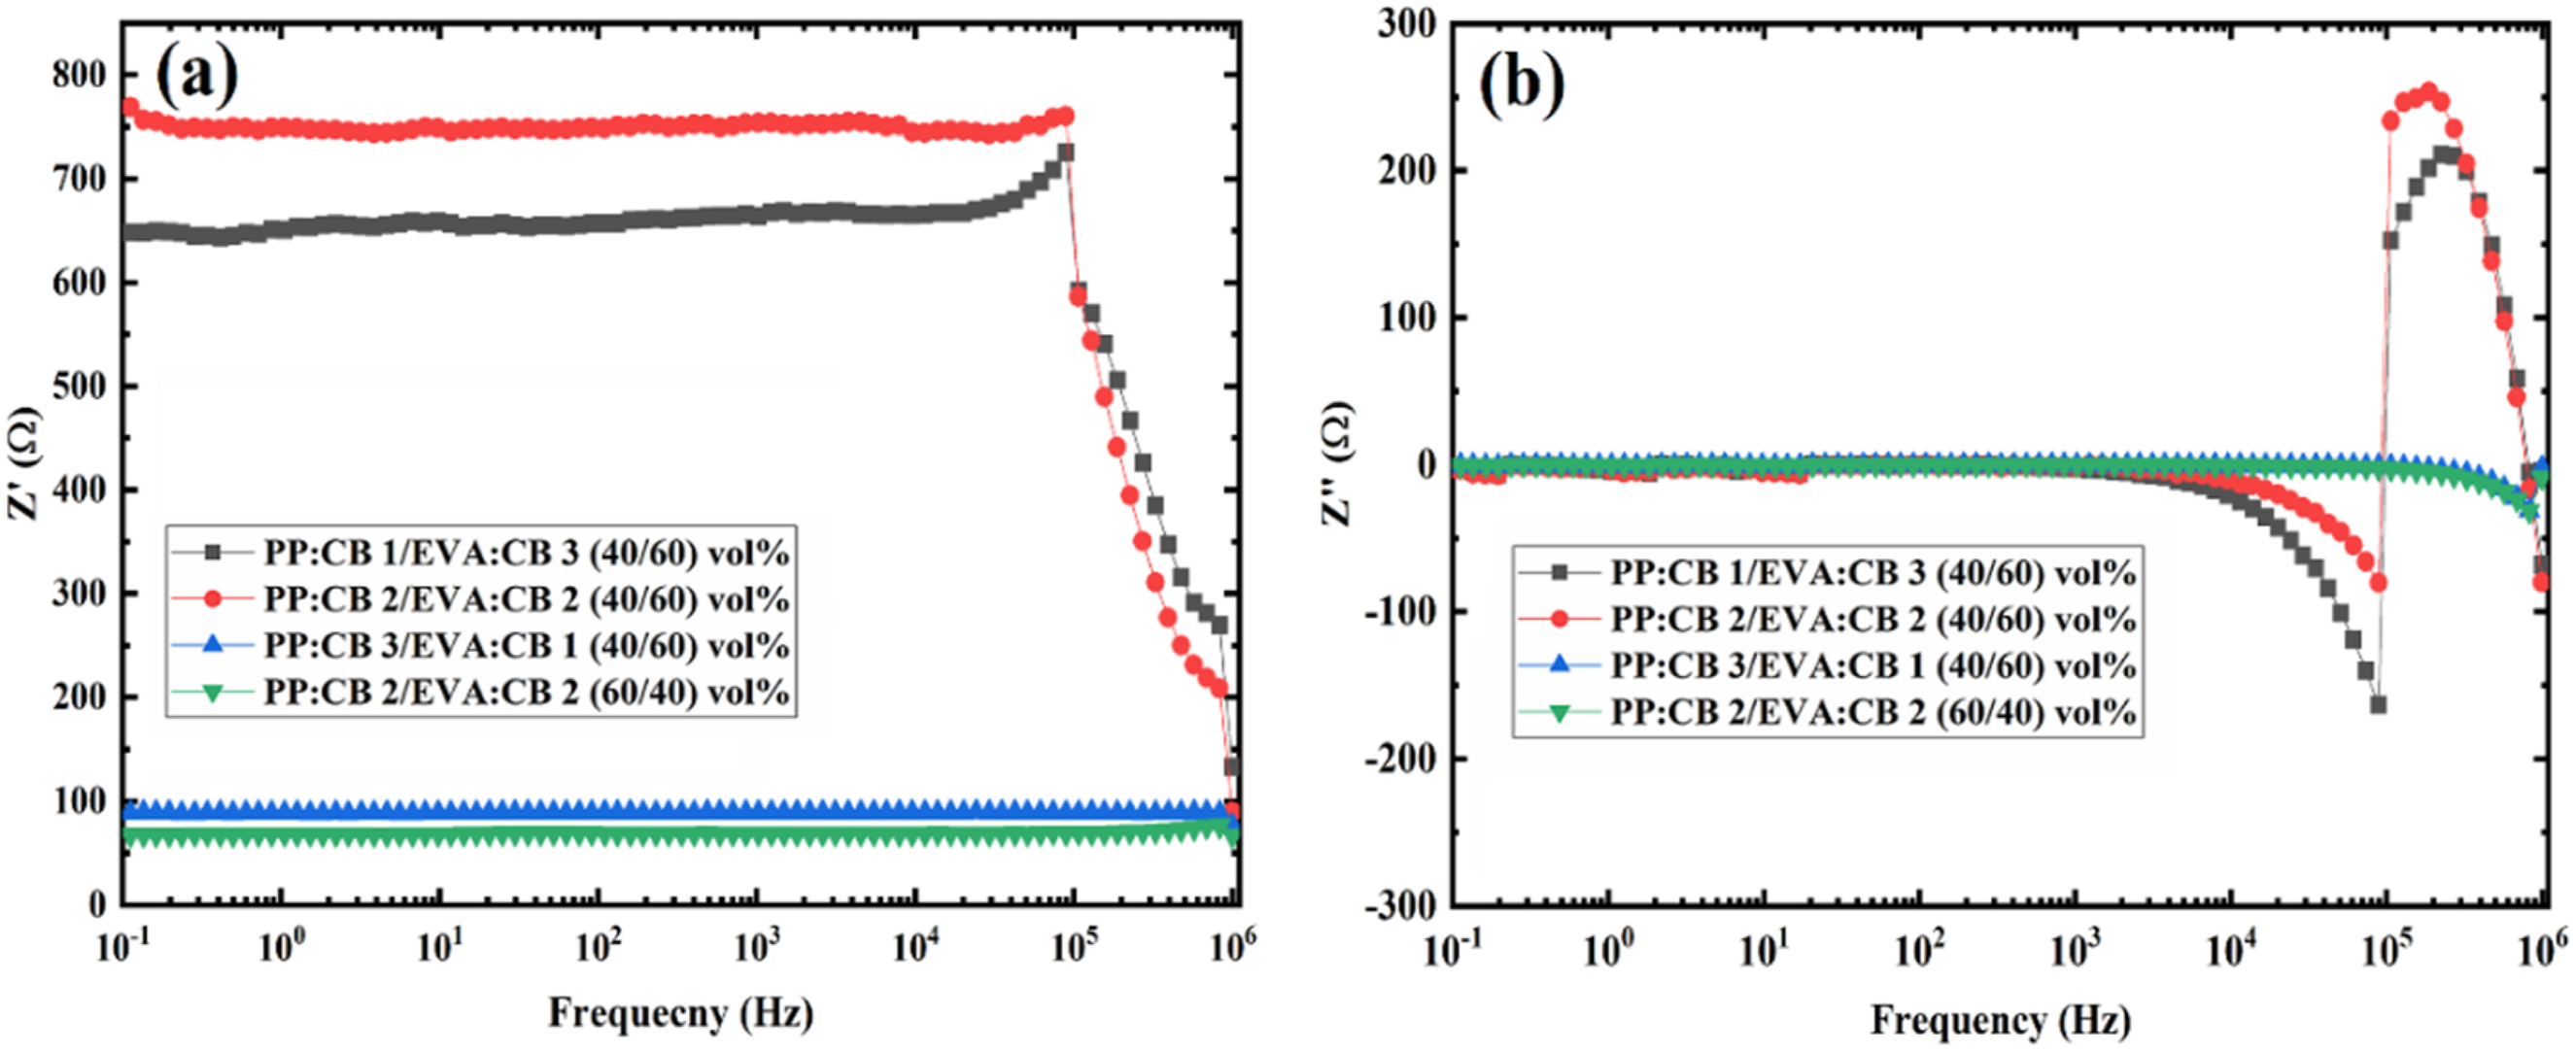
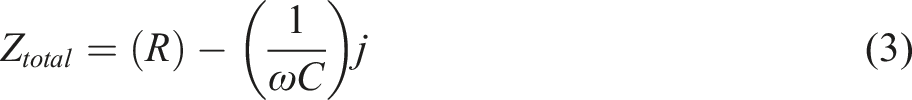
Figure 5(b) displays Z′′ versus frequency for all four samples. Z′′ indicates the capacitive behavior and is defined as Z′′ = 1/jωC, where ω is the angular frequency and C is the capacitance. 16 Figure 5(b) shows Z′′ values of zero for all the samples until a characteristic frequency i.e. these composites do not show capacitance behavior before fc. The observations in Figure 3(a) are supported here in Figure 5(b). Now strong peaks at 105 Hz are observed for PP:CB 2/EVA:CB 2 (40/60) vol% and PP:CB 1/EVA:CB 3 (40/60) vol% which already showed fc in the frequency range.
The differences observed in the impedance properties of the four samples with a sum-up of 4 vol% CB in each sample depend not only on the morphology of the blends, e.g. degree of co-continuity and grain size, but also on the concentration of CB in each phase. PP:CB 2/EVA:CB 2 (60/40) vol% shows the lowest impedance i.e. highest electrical conductivity. Among PP:CB 2/EVA:CB 2 (40/60) vol% blends, the PP:CB 3/EVA:CB 1 (40/60) vol% blend exhibits significantly higher conductivity due to its pronounced co-continuous morphology. In this blend, the PP phase, containing 3 vol% of CB, contributes more to the nanocomposite’s conductivity than the EVA phase, containing 1 vol% of CB, owing to the higher carbon black content in the PP phase. Furthermore, the presence of CB particles in the PP phase is more effective than their presence in the EVA phase due to two factors. First, the volume exclusion effect of PP crystallization, which induces a more segregated structure of CB particles. Second, the lower thermodynamic affinity of CB particles toward PP chains causes more segregation of CB particles as compared to their case in the EVA phase. Briefly, the effective concentration of CB in PP is higher than EVA at equivalent CB content. As Figure 4 shows, PP:CB 1vol% is several orders of magnitude more conductive than EVA:CB 1vol%. Also, PP:CB 3vol% is more conductive than EVA:CB 3vol% since PP:CB 3 vol% does not show fc while EVA:CB 3vol% does. The finer morphology and more co-continuity of PP:CB 3/EVA:CB 1 (40/60) vol% with more segregated and excluded CB particles in its PP phase are associated with a lower real part of impedance and no detectable fc in the frequency range studied. For PP:CB 2/EVA:CB 2 (40/60) vol% and PP:CB 1/EVA:CB 3 (40/60) vol% differences of the peaks of Z′′ are interesting. The peak of the PP:CB 1/EVA:CB 3 (40/60) vol% occurs at a lower frequency with a higher magnitude. The differences between the morphologies of these two samples are highlighted with novel features attained by EIS.
Despite the absence of fc for PP:CB 3/EVA:CB 1 (40/60) vol% and PP:CB 2/EVA:CB 2 (60/40) vol%, here we see that they start to show a decline in Z′′ versus frequency at the right end of the frequency range, which is evidence of the peaks afterwards.
Figure 6 shows Cole-Cole plots of PP:CB 1/EVA:CB 3 (40/60) vol% and its components. The radius of the semicircle indicates the nanocomposite resistance, while the center of the semicircle shows the distance between NPs. According to Figure 6(a), PP:CB 1 vol% exhibits a larger semicircle compared to EVA: CB 3 vol% and PP:CB 1/EVA:CB 3 (40/60) vol%, which shifts to the right. The position of the semicircle’s center in Cole-Cole plots relates to the average distance between particles. A lower CB content in PP results in a greater particle separation. In Figure 6(b), Cole-Cole plots of EVA:CB 3 vol% are observed on the left side of the graph, with the smallest semicircle center, indicating that the average particle distance in EVA:CB 3 vol% is much lower than in PP:CB 1 vol%. Plots of Cole-Cole (Z”-Z’) of (a) PP:CB 1/EVA:CB 3 (40/60) vol% and its components and (b) the magnified low frequency part of the left (Figure 7(a)).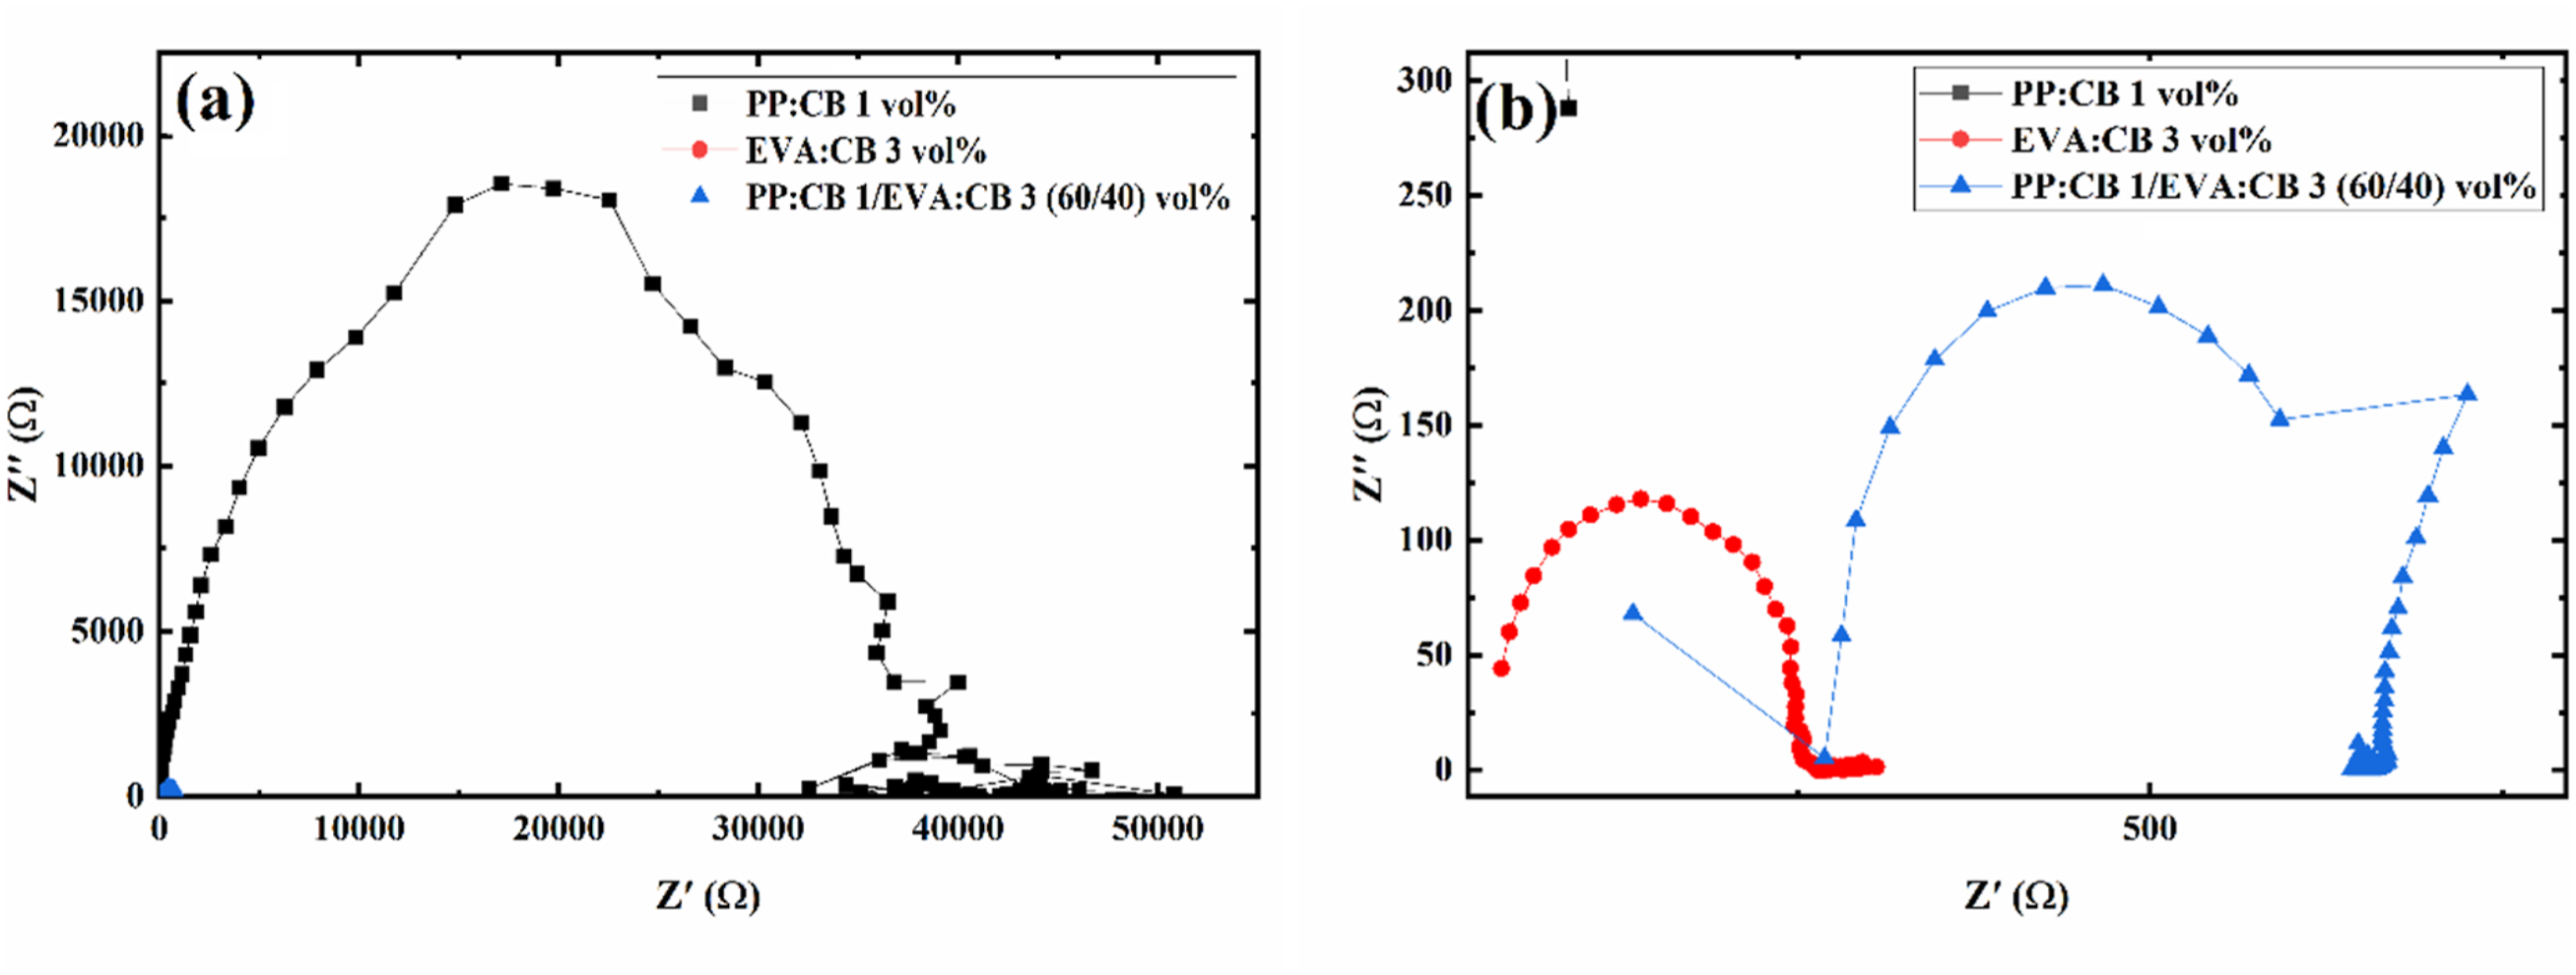
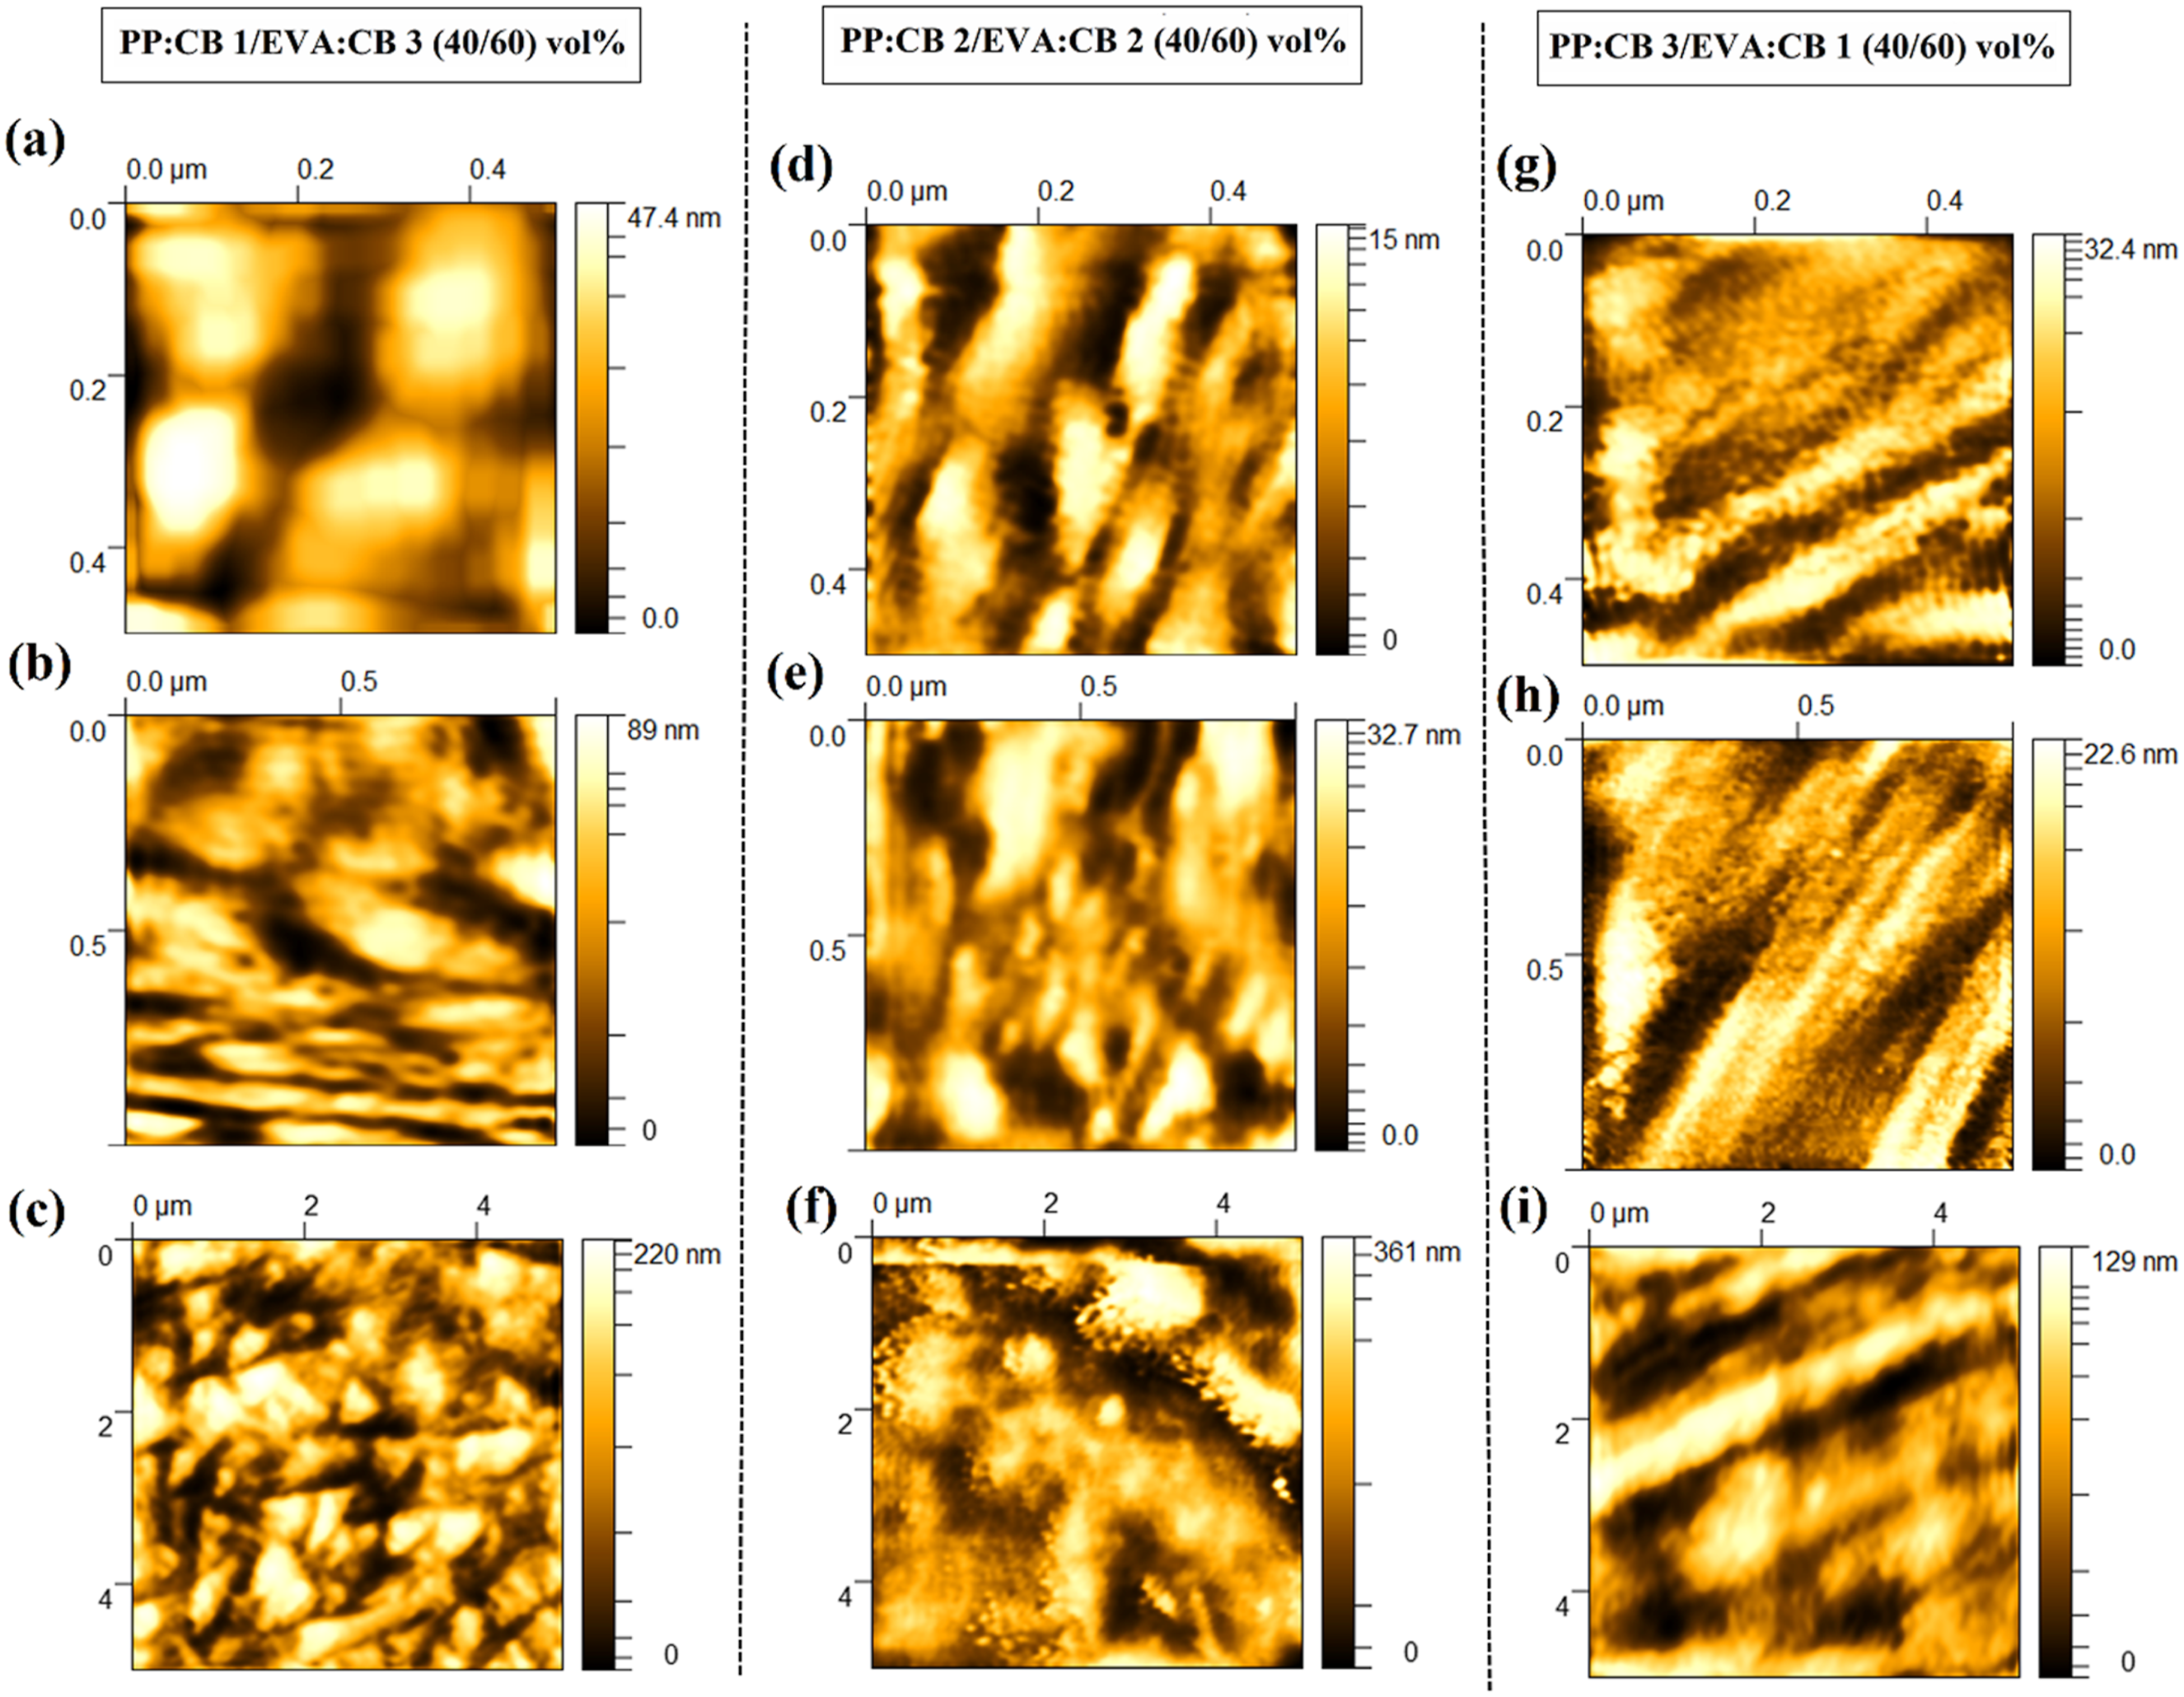
Figure 7 also presents Cole-Cole plots for various PP/EVA samples. The PP:CB 1/EVA:CB 3 (40/60) vol% and PP:CB 2/EVA:CB 2 (40/60) vol% samples exhibit semi-circle-like behavior, though not an ideal semi-circle, due to phase segregation and heterogeneity in the samples. However, the other two samples, PP:CB 3/EVA:CB 1 (40/60) vol% and PP:CB 2/EVA:CB 2 (60/40) vol%, do not display a semi-circle. Low resistivity in PP:CB 3/EVA:CB 1 (40/60) vol% and PP:CB 2/EVA:CB 2 (60/40) vol% prevents the formation of a semi-circle. The equivalent circuit for PP:CB 1/EVA:CB 3 (40/60) vol% and PP:CB 2/EVA:CB 2 (40/60) vol% samples was determined to be [Rs + (Rct||C)] (Figure 8(c)), whereas the equivalent circuit for PP:CB 3/EVA:CB 1 (40/60) vol% and PP:2/EVA2 (60/40) was found to be R + C (Figure 8(d)). Parameters for both models were obtained by fitting equations (2) and (3) to the experimental plots. Here, Rs represents bulk resistance, Rct denotes charge transfer resistance, and C indicates capacitance. Fitting parameters can be observed in Table 5. Cole-Cole plots (a) of PP:CB 1/EVA:CB 3 (60/40) vol%, PP:CB 2/EVA:CB 2 (60/40) vol%, PP:CB 3/EVA:CB 1 (60/40) vol%, and PP:CB 2/EVA:CB 2 (40/60) vol% sample and (b) its magnification. Atomic Force Microscopy (AFM) micrographs of (a) PP:CB 1/EVA:CB 3 (40/60) vol% magnification of 0.5 µm, (b) PP:CB 1/EVA:CB 3 (40/60) vol% magnification of 1 µm, (c) PP:CB 1/EVA:CB 3 (40/60) vol% magnification of 5 µm, (d) PP:CB 2/EVA:CB 2 (40/60) vol% magnification of 0.5 µm, (e) PP:CB 2/EVA:CB 2 (40/60) vol% magnification of 1 µm, (f) PP:CB 3/EVA:CB 1 (40/60) vol% magnification of 5 µm, (g) PP:CB 3/EVA:CB 1 (40/60) vol% magnification of 0.5 µm, (h) PP:CB 3/EVA:CB 1 (40/60) vol% magnification of 1 µm, (i) PP:CB 3/EVA:CB 1 (40/60) vol% magnification of 5 µm. Sample names, their corresponding model types, and the parameters fitted to experimental data.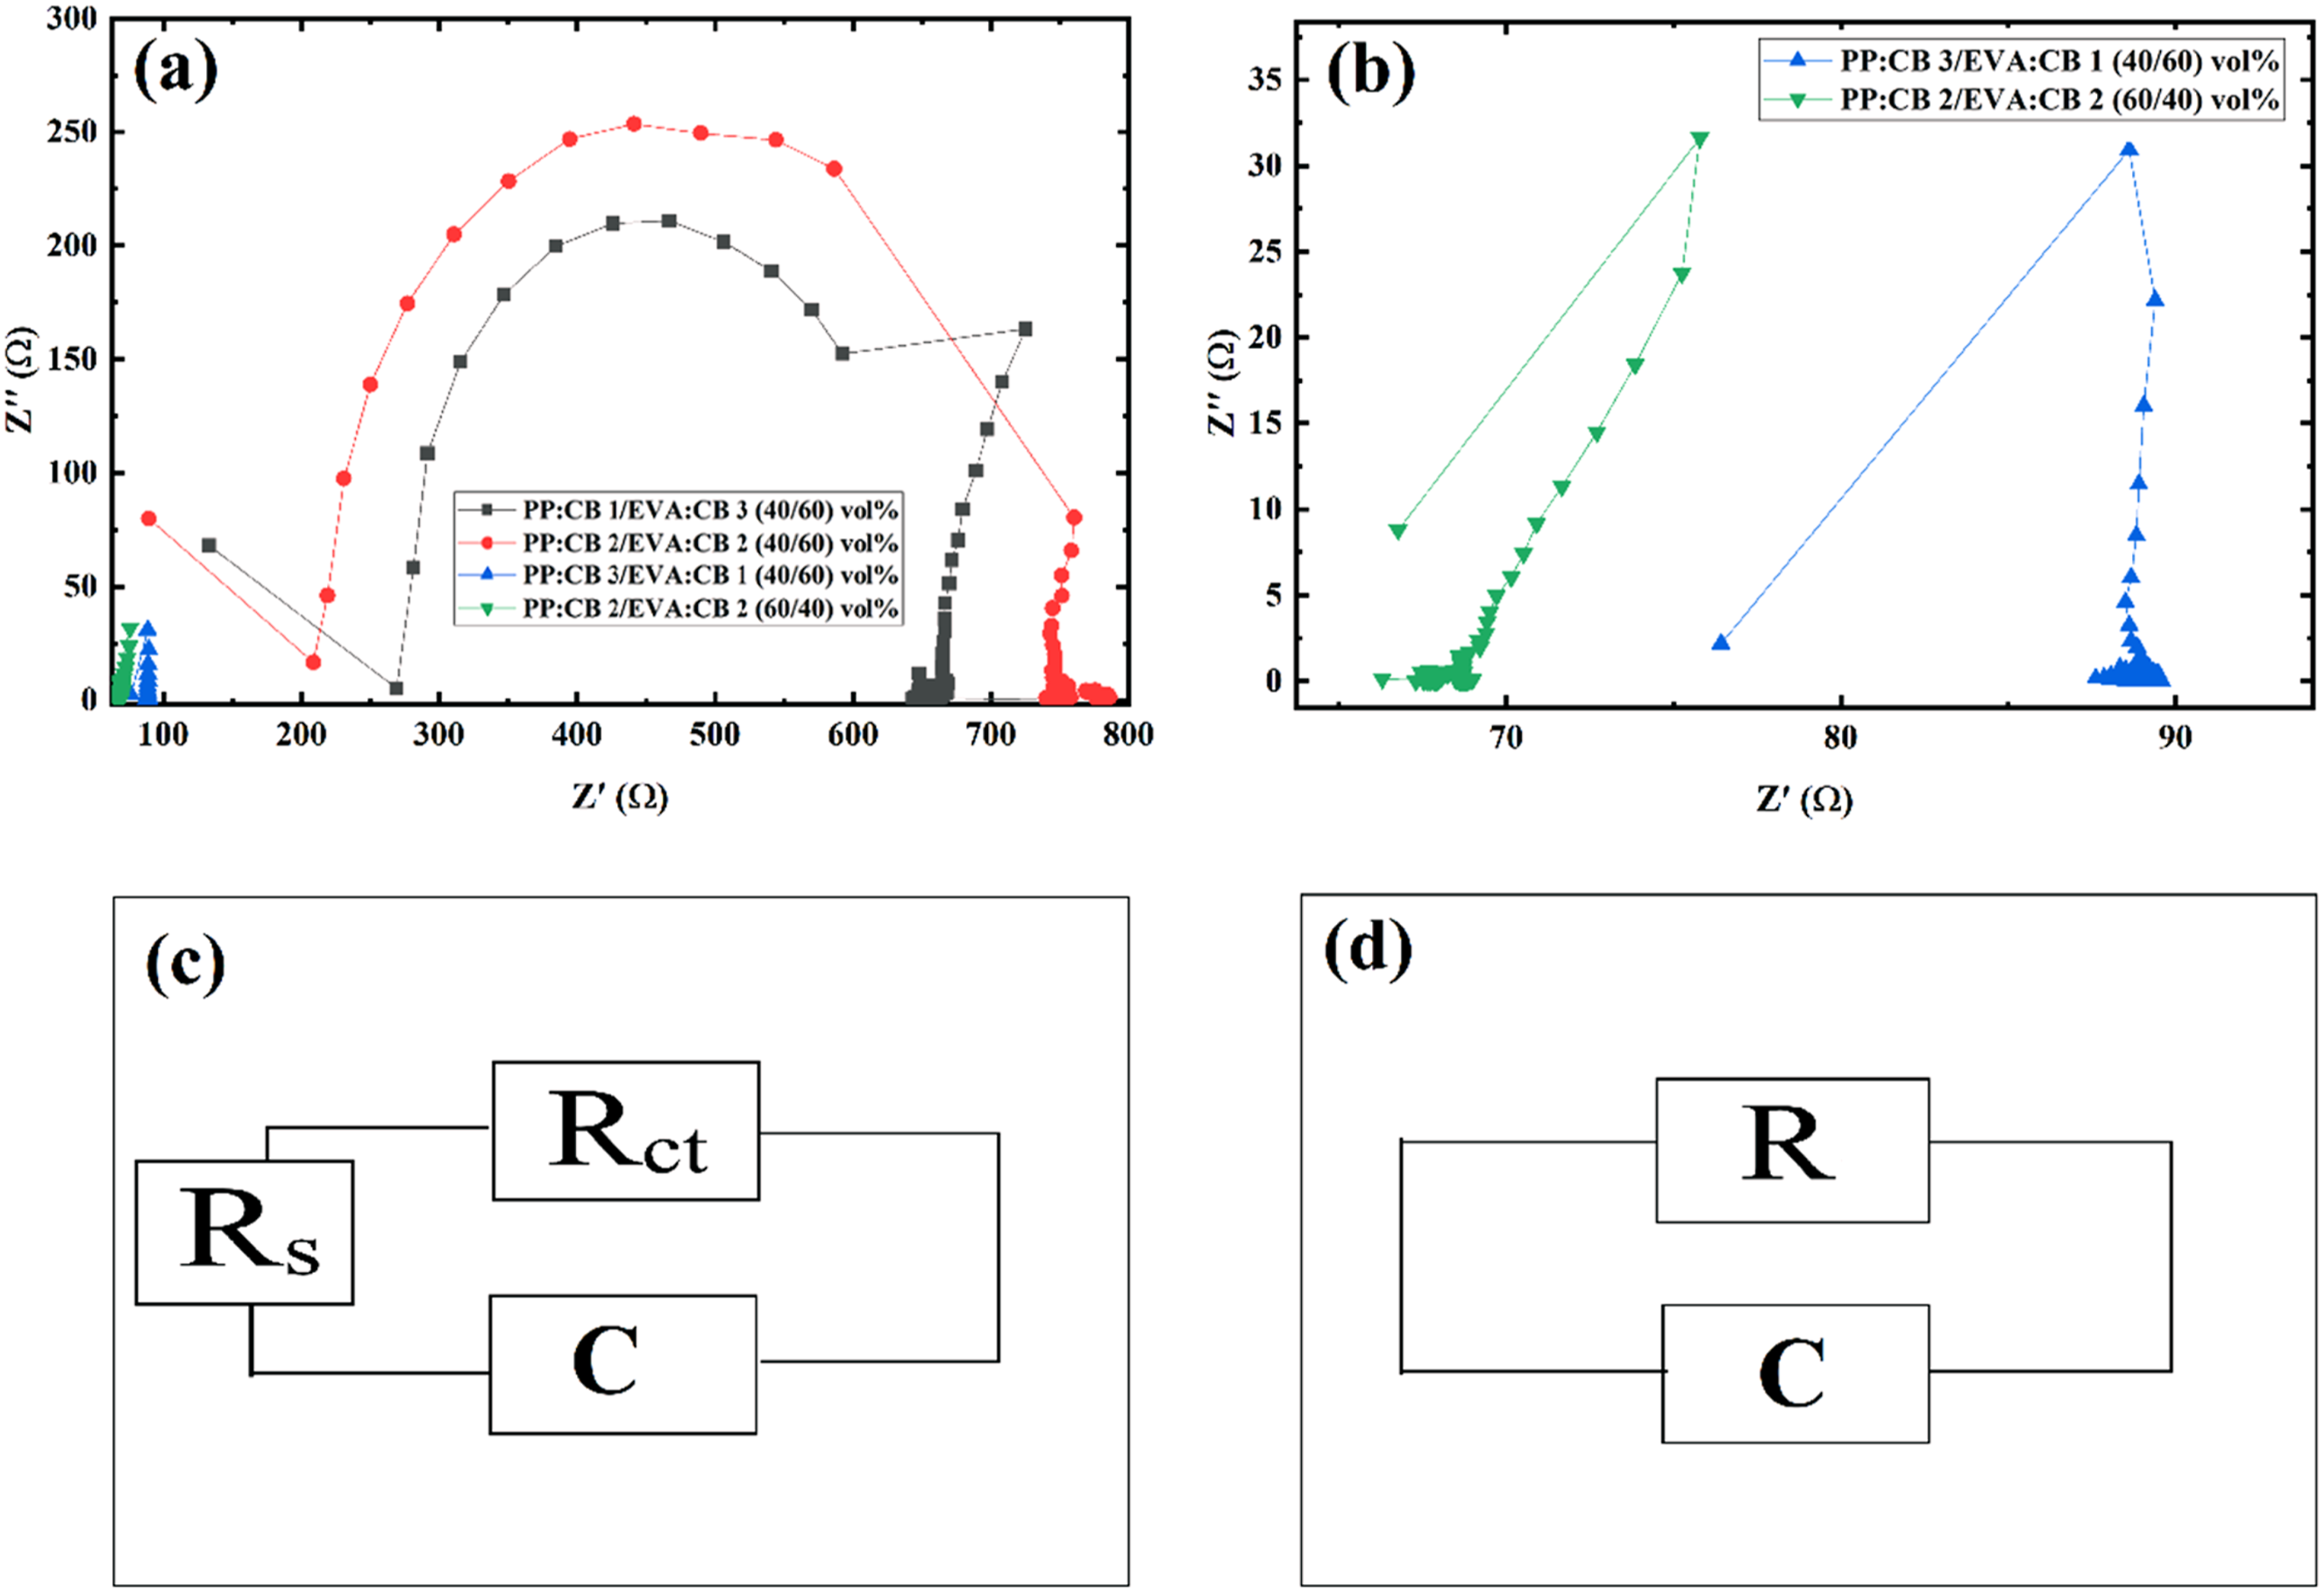
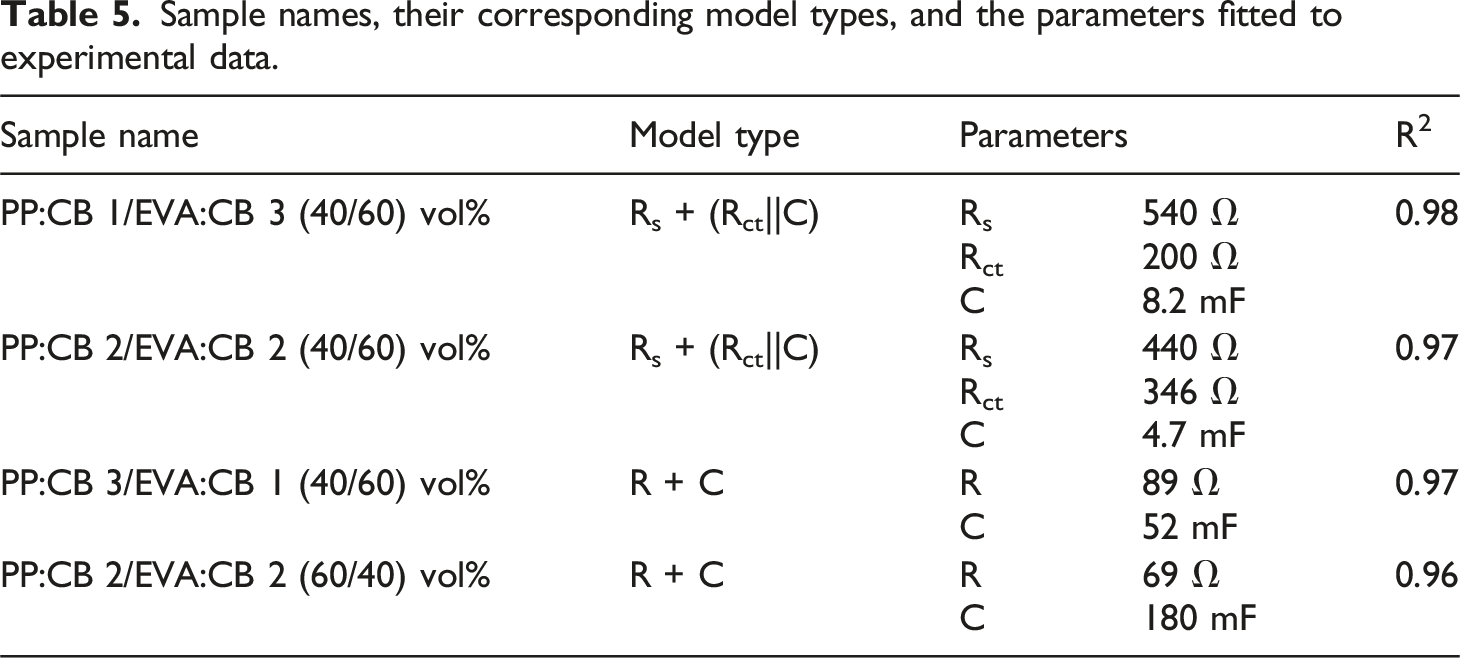
When comparing PP:CB 1/EVA:CB 3 (40/60) vol% and PP:CB 2/EVA:CB 2 (40/60) vol% samples, the bulk resistance of PP:CB 2/EVA:CB 2 (40/60) vol% is lower than that of PP:CB 1/EVA:CB 3 (40/60) vol% because more carbon black (CB) particles are localized in the PP phase. However, the tunneling resistance in PP:CB 2/EVA:CB 2 (40/60) vol% is higher than in PP:CB 1/EVA:CB 3 (40/60) vol%, as the conduction mechanism in PP:CB 2/EVA:CB 2 (40/60) vol% is predominantly ohmic rather than tunneling, due to higher interfacial tension between CB and PP. The PP:CB 3/EVA:CB 1 (40/60) vol% sample exhibits a resistivity of 89 Ω, while the PP:CB 2/EVA:CB 2 (60/40) vol% sample shows a resistivity of 69 Ω, indicating that PP:CB 2/EVA:CB 2 (60/40) vol% is more co-continuous compared to PP:CB 3/EVA:CB 1 (40/60) vol%.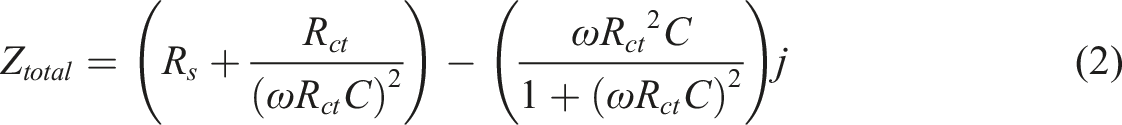
Microstructure Analysis
Figure 8 presents the AFM results of PP/EVA samples with a 40/60 v%, prepared by microtoming before analysis. The bright regions correspond to agglomerated CB particles, while the dark regions represent the EVA phase. The large, bright aggregates seen in Figure 8(a)–(c) suggest that the CB is successfully embedded within the dominant EVA matrix, potentially forming a network there. Figure 8(d)–(f) show the bright and dark regions are more evenly mixed. This suggests that the CB is distributed across both phases, which reduces the interfacial tension and allows for a more finer morphology structure. According to Figure 8(g)–(h), since PP is only 40% of the volume (the minority phase) but holds most of the CB, the PP phase becomes extremely stiff and highly visible.
As seen, the PP:CB 1/EVA:CB 3 (40/60) vol% sample exhibits a more dispersed morphology of dark areas, i.e. less co-continuity. PP:CB 3/EVA:CB 1 (40/60) vol% sample shows the highest level of interconnectivity and continuity. These observations are consistent with the morphological features observed in FE-SEM images and are supported by the EIS results.
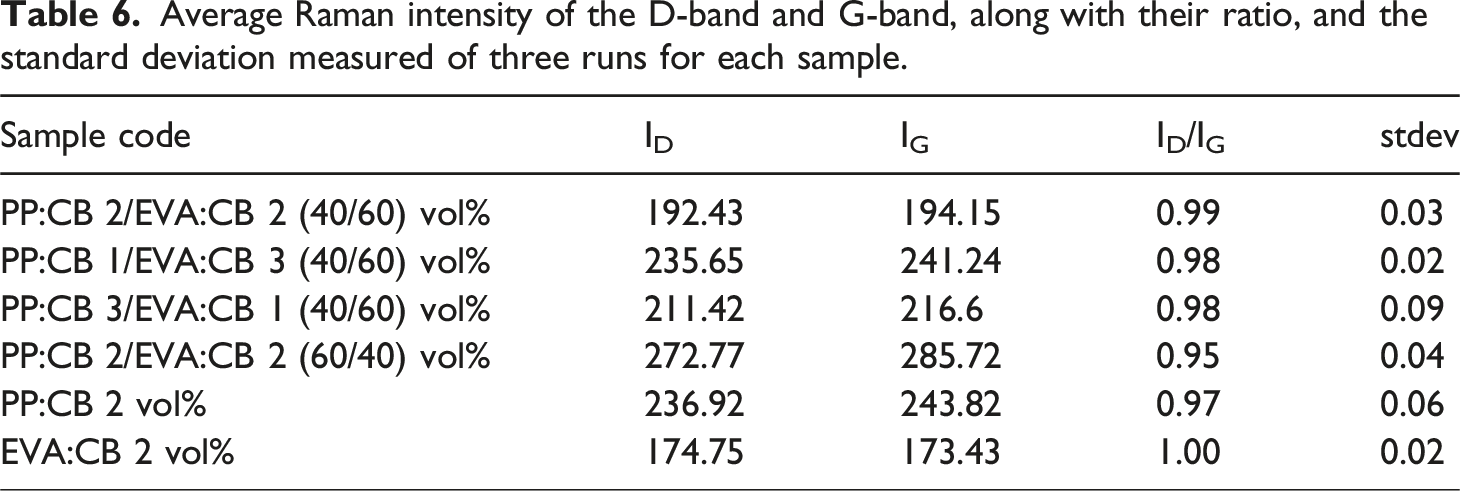
Average Raman intensity of the D-band and G-band, along with their ratio, and the standard deviation measured of three runs for each sample.
Rheological Measurements
Figure 9 illustrates the complex viscosity, storage shear modulus, and loss modulus for the samples PP:CB 2 vol%, EVA:CB 2 vol%, and their blend (PP:CB 2/EVA:CB 2) at a 60/40 vol% ratio. According to the figure, the viscosity of EVA:CB 2 vol% is higher than that of PP:CB 2 vol%, which is attributed to the lower viscosity of PP compared to EVA. When PP:CB 2 vol%, and EVA:CB 2 vol% are blended, the resulting viscosity, storage modulus, and loss modulus fall between the values of the individual components, indicating low compatibility between the two polymers. Plots of (a) storage modulus versus frequency, (b) loss modulus versus frequency, and (c) complex viscosity versus frequency for PP:CB 2vol%, EVA:CB 2vol%, and PP:CB 2/EVA:CB 2 (60/40) vol%.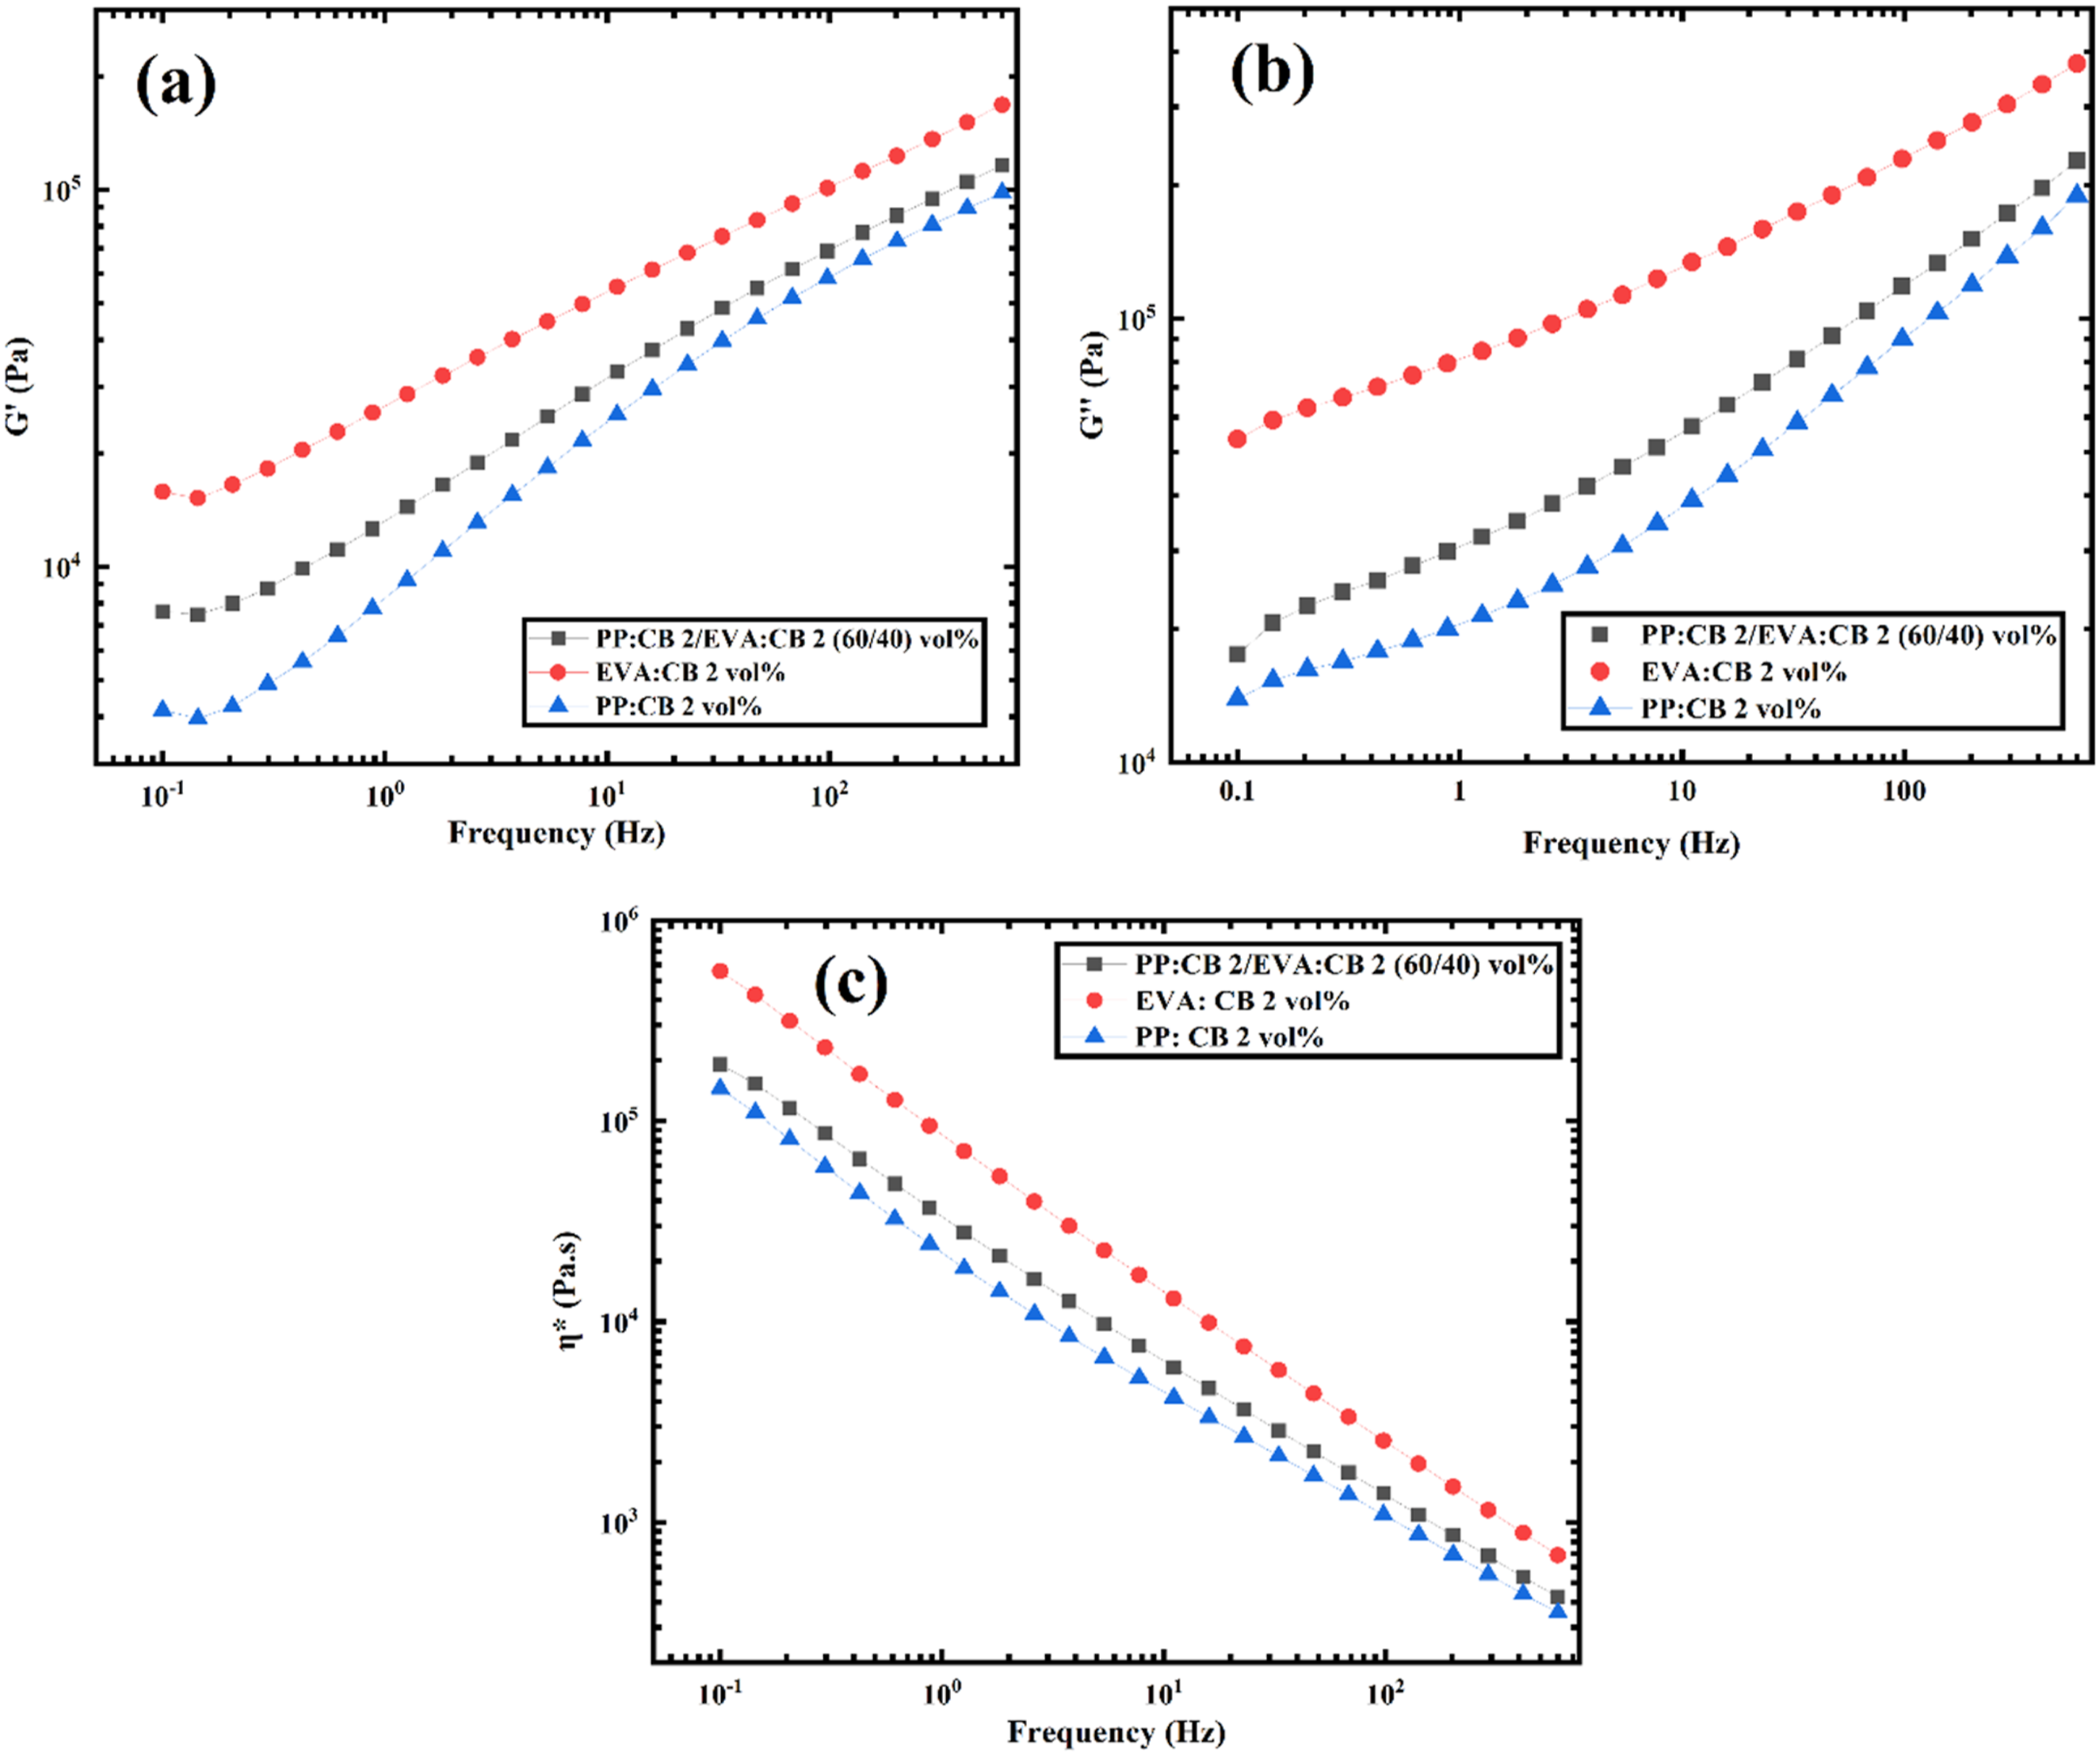
Rheology can also be used as a tool to assess the morphological coherence of polymer blends. In such cases, the composition ratio of the polymer blend must remain constant. To this end, the complex viscosity, storage modulus, and loss modulus of the samples PP:CB 1/EVA:CB 3 (40/60) vol%, PP:CB 2/EVA:CB 2 (40/60) vol%, and PP:CB 3/EVA:CB 1 (40/60) vol% are shown in the figure. Based on the Figure 10, the complex viscosity storage modulus, and loss modulus of PP:CB 3/EVA:CB 1 (40/60) vol% are higher than the others, which may be attributed to more co-continuoty of PP and EVA in this sample supported by morphological images and impedance results. Plots of (a) storage modulus versus frequency, (b) loss modulus versus frequency, and (c) complex viscosity versus frequency for PP:CB 1/EVA:CB 3, PP:CB 2/EVA:CB 2, and PP:CB 3/EVA:CB 1 (40/60) vol%.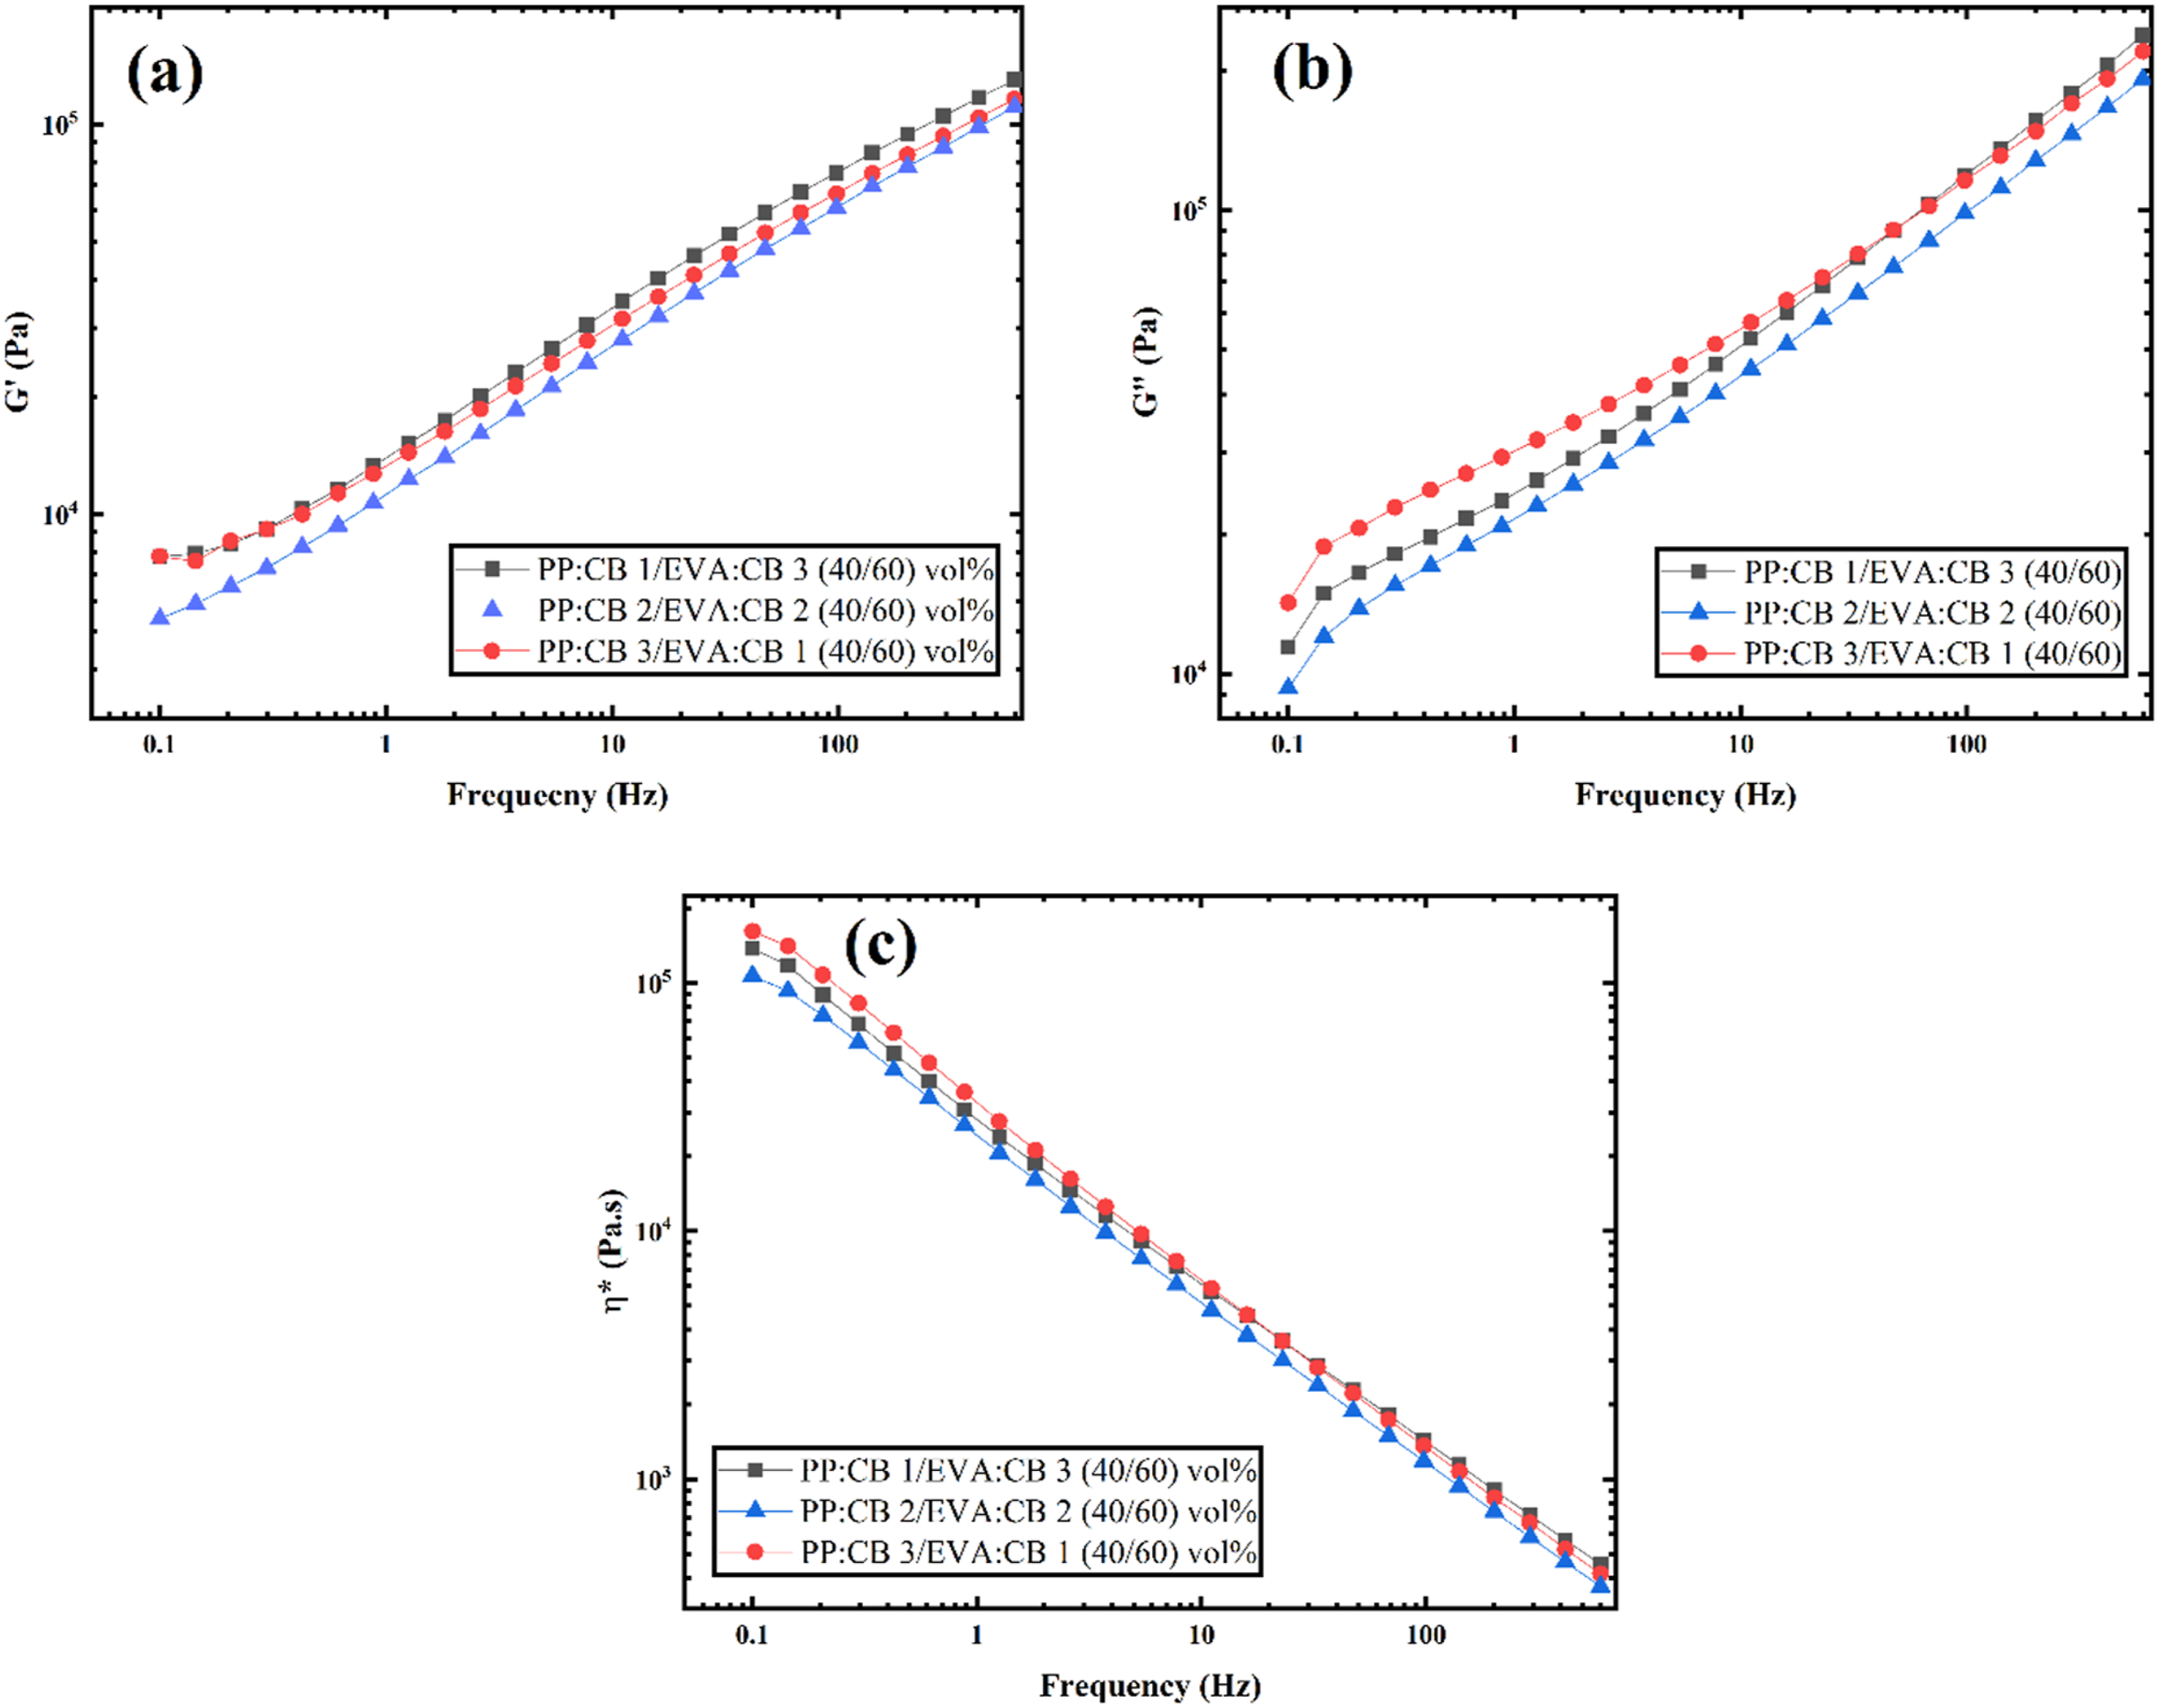
Conclusion
The electrical impedance spectroscopy (EIS) behaviour and morphology of PP/EVA blends containing carbon black (CB) and their single matrix counterparts, i.e. PP/CB and EVA/CB, were investigated. The results indicated that EIS effectively distinguishes between double percolation and the synergistic effects in immiscible polymer blends, enhancing electrical conductivity. In PP/EVA blends with carbon black, the resistance (Z′) significantly decreased compared to the individual components. All samples displayed non-capacitive behavior until reaching a characteristic frequency cutoff (fc), where conduction shifted from resistive to capacitive. The PP/CB(2 vol%) showed higher Z′ than EVA/CB(2 vol%), indicating EVA’s greater conductivity. However, the blend with a 60/40 ratio of PP/EVA (each with 2 vol% CB) was more conductive than the reverse ratio of 40/60. This suggests that the PP phase, comprising 60 vol% of the blend, is more conductive than EVA, influenced by the differences in fc between the two phases.
The change of Z′′ with frequency showed another unique feature of EIS. All the samples show a peak at a high fc value if it falls in the measuring range. The interesting distinction tool of EIS was the geometry and trend of the peak. In the single polymer composites, i.e. PP/CB or EVA/CB, a symmetrical and uniform/monotonical peak was observed, while for the blends, the peak was not symmetrical and the trend was different. For the blend at the onset of peak first Z′′ decreased drastically and then suddenly increased. This behaviour is suggested as a non-continuity point in the curve and characteristic behaviour only for conductive immiscible polymer composites. From the Cole-Cole Plots, it was found that nanoparticle distance is lower for the more conductive samples, while less conductive composites show larger semicircles. It was found that the co-continuity of the blend increases fc, conductance Z′ and peak height in the Z′′ curve versus frequency at fc increases. For obtaining capacitance of samples, equilavalnt circuits was fitted to Cole-Cole plots. Results showed that increasing PP volume fraction from 40 vol% to 60 vol% in PP/EVA blend, increased capacitance from 4.7 mF to 180 mF. This study suggests that with by tuning the composition of blend and distribution of nanoparticles between two phase in binary blend, it can be reached to appropriate conductive application in energy storage materials.
Supplemental material
Supplemental material - Electrical impedance spectroscopy (EIS) analysis of carbon black distribution in Co-continuous PP/EVA blend
Supplemental material for Electrical impedance spectroscopy (EIS) analysis of carbon black distribution in Co-continuous PP/EVA blend by Parsa Dadashi, Ghodratollah Hashemi Motlagh, Sarah Shahdadnezhad in Journal of Thermoplastic Composite Materials
Footnotes
Acknowledgements
The authors would like to thank Azmoon Dana Plastic company for their support in this project, particularly for carrying out the EIS tests that belonged to their company.
Declaration of conflicting interests
The authors declared no potential conflicts of interest with respect to the research, authorship, and/or publication of this article.
Funding
The authors received no financial support for the research, authorship, and/or publication of this article.
Data Availability Statement
Data will be made available upon request to any interested party by the authors.
Supplemental material
Supplemental material for this article is available online.