
Abstract
Carbon fiber-reinforced poly (ether-ether-ketone) (CF/PEEK) is a widely used composite material in aerospace, automotive, and biomedical applications. However, achieving a high-quality surface finish during machining remains challenging due to its low thermal conductivity and high abrasiveness. This study investigates the thermal effects of using cooled compressed air (CCA at −40°C) and heated compressed air (HCA at 60°C) on surface finish during face milling of PEEK reinforced with 30% short carbon fiber (CF30), compared to dry machining (DRY). A Box-Behnken experimental design was applied with three levels of cutting speed (v c ), feed per tooth (f z ), and axial depth of cut (a p ). Surface profiles and roughness parameters (R a and R z ) were statistically evaluated using ANOVA, Abbott–Firestone curves (AFC), and probability density functions (PDF). Scanning electron microscopy (SEM) and 3D interferometry were employed to analyze the optimized and best-performing samples. Results indicated that the lowest roughness values were achieved under CCA, while HCA yielded the highest. In both cases, f z was the most significant factor. AFC and PDF analyses confirmed that surfaces machined with CCA exhibit a more homogeneous 2D roughness profile, with less pronounced peaks and valleys. The regression model accurately predicted roughness values under CCA, with an error of approximately 4%, aligning well with experimental results (R a = 0.307 μm, R z = 2.210 μm) and maintaining a suitable material removal rate (MRR = 1723 mm3/min). SEM images revealed that CCA enhances surface finish by increasing composite stiffness, facilitating cutting. 3D roughness profiles confirmed isotropic characteristics for all conditions. After optimization, CCA exhibited the lowest S a (0.371 µm), DRY the lowest S z (12.42 µm), and HCA the roughest surface profile, confirming the trends observed in 2D analysis.
Keywords
Introduction
Poly-ether-ether-ketone (PEEK) is a high-performance thermoplastic polymer, known for its excellent properties, making it an ideal choice for engineering applications that require high performance. 1 It is an excellent alternative to metals such as aluminum, stainless steel, and titanium due to its superior resistance to hydrolysis, corrosion, friction, and flame. To enhance the strength and performance of a polymer, reinforcements are often incorporated into its matrix. 2 Consequently, this improvement depends on the properties of the matrix and reinforcement, the reinforcement’s geometry and orientation, and the matrix-to-reinforcement ratio. 3 Carbon fiber (CF) reinforcement is available in two configurations: short fibers and continuous fibers. Continuous fibers offer superior mechanical performance but result in higher material consumption and cost, while short fibers provide an intermediate solution, improving mechanical performance relative to the neat thermoplastic, although they do not achieve the efficiency of continuous fibers. 4 Since CF and PEEK are highly compatible, this combination improves mechanical strength, frictional performance, and thermal properties. Therefore, PEEK composites are widely applied in the automotive, aerospace, chemical, and biomedical sectors. 5 Polymeric composites offer excellent design versatility, allowing components to be manufactured close to their final shape. However, to achieve high geometric precision, adequate tolerances, and superior edge quality, certain machining operations remain necessary. 6
Machining is an efficient process to produce mechanical parts, implant materials, and prostheses from PEEK composites, ensuring the dimensional accuracy and surface finish required for the desired performance and extended service life.7,8 Cutting CF/PEEK composites is mainly required to produce components with specific dimensions and surface roughness to facilitate assembly processes. 9 However, the abrasive nature of carbon fibers reduces their machinability. 7 Additionally, the anisotropy and non-homogeneity of composites influence the cutting process, often causing delamination, fiber pull-out, and surface defects.10,11 In CF/PEEK machining, feed rate is the main cutting parameter that affects surface roughness, followed by cutting speed and depth of cut. 11 Increasing the feed rate enhances heat generation and tool wear, damages surface roughness, and may also increase vibrations that are harmful to surface finish. Low cutting speeds can result in a large material flow of cut fibers that harms surface roughness, while high cutting speeds increase temperature, producing chips mainly composed of less deformed matrix material and cut fibers. Increased depth of cut may lead to high normal pressure and seizure. 12 Furthermore, surface roughness is a key quality characteristic that directly affects performance, aesthetic appearance, fatigue resistance, and degradation resistance. 13 Thus, process optimization is necessary to ensure high-quality surfaces in machined parts.
The low thermal conductivity of polymers leads to heat concentration at the tool’s cutting edge, hindering the generation of a smooth surface. In CF/PEEK machining, high cutting speeds combined with abrasive reinforcement accelerate tool wear mechanisms and compromise surface quality.11,14 Cutting temperatures can easily exceed the glass transition temperature (T g ) of the polymer matrix and even the degradation temperature around the cutting edge. 15 When the cutting temperature exceeds the T g , the resin loses its fiber-supporting capacity, causing surface defects and material degradation.16–19 High-speed dry (HSD) milling studies of CF/PEEK indicate that cutting temperature is a primary factor in defects such as delamination and uncut fibers, highlighting the need to control thermal effects for surface integrity.6,20 Despite cryogenic cooling being an eco-friendly machining strategy that can improve surface quality, reduce tool wear, mitigate burr formation, and enable higher cutting speeds and feed rates, 15 excessive workpiece cooling may potentially induce undesirable microstructural changes in polymeric composites. 5
Compressed air techniques are attractive for sustainability and cost-effectiveness, as they are cheap and readily available resources. 21 Liu et al. 16 demonstrated that compressed air helps limit temperature increases and preserve surface integrity, making HSD milling a promising strategy to improve quality and efficiency. Cooled compressed air (CCA) is an eco-friendly alternative that reduces energy consumption and supports high cutting performance. 22 In HSD milling of CF/PEEK, a compressed-air jet removed up to 50% of the generated heat, maintaining the surface temperature below T g and preserving the integrity of the polymer matrix, resulting in a good surface finish. 16 Despite these benefits, Ensinger 23 recommends preheating short CF/PEEK (30/70) workpieces from 80 to 120°C before semi-finish machining, followed by finish machining after cooling at room temperature. This recommendation motivated the investigation of heated compressed air (HCA). John and Kumaran 24 reported that HCA is economically viable, sustainable, and beneficial in drilling unidirectional CFRP laminates, reducing thrust force and delamination at low feed rates. However, a scientific gap remains in the process optimization of CF/PEEK milling with CCA and HCA to enhance the surface quality.
To optimize the machining process and achieve the best workpiece surface finish, the Box-Behnken Design (BBD) emerges as a multi-objective method for identifying the optimal combination of input parameters for a specific process. 25 BBD is a second-order rotational or nearly-rotational design based on incomplete three-level factorial designs for each controllable factor, generating a response surface. 26 Complementarily, the Abbott-Firestone curve (AFC) is a helpful statistical tool for evaluating surface texture, providing a cumulative profile function that describes the distribution of peaks and valleys. The flatter the curve, the lower these peaks and valleys, and the more uniform the roughness profile. 27 Additionally, the probability density function (PDF) assesses skewness (peak-valley relationship) and kurtosis (degree of flatness) of the roughness profile. 28 The PDF describes the probability of occurrence of a given vertical amplitude in the roughness profile relative to a reference position. The closer the skewness is to zero, the more symmetric the number of peaks and valleys on the surface. Furthermore, the closer kurtosis is to zero, the better the balance between few sharp peaks and shallow valleys in the surface profile.29,30
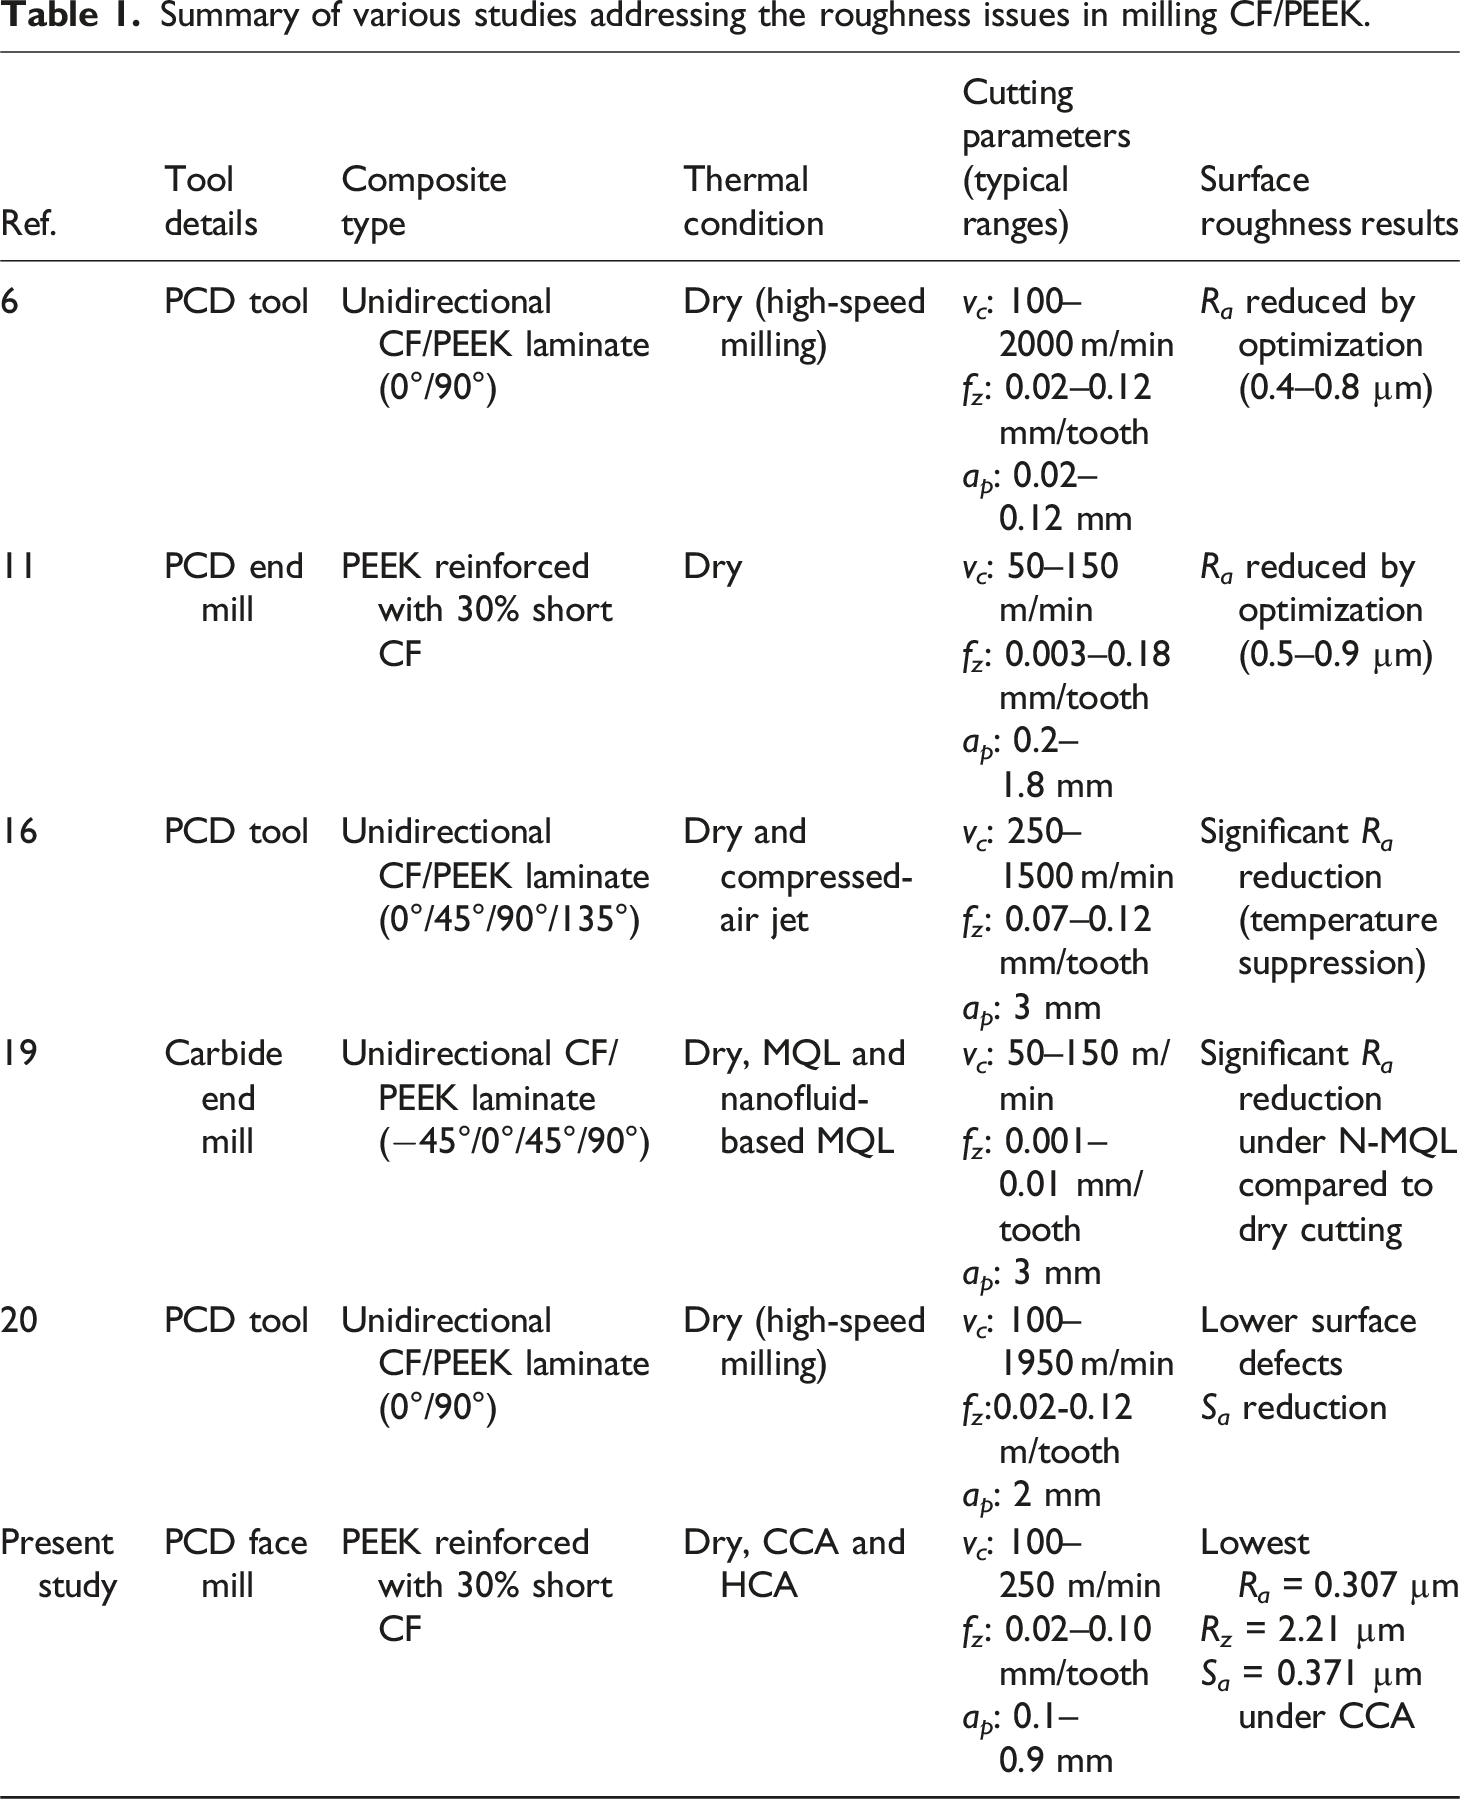
Summary of various studies addressing the roughness issues in milling CF/PEEK.
Material and methods
The composite material used is a natural PEEK reinforced with 30% short carbon fibers (TECAPEEK CF30 black), manufactured by Ensinger Plastics. This material has a density of 1.41 g/cm3, a tensile strength of 112 MPa, a thermal conductivity of 0.66 W/(m⋅K), a glass transition temperature of 147°C, a melting point of 341°C, and a service temperature range from 260°C (long term) to 300°C (short term).
31
Face milling was performed on a Romi Discovery 308 machining center (maximum power 5.5 kW, maximum spindle speed 4000 rpm) using diverse cutting parameter combinations. A Sandvik R390-11T304E-P4-NL CD10 positive rhombic insert with a polycrystalline diamond (PCD) tip, tool nose radius (rε) of 0.4 mm, cutting edge radius (rβ) of 4.5 µm, sharp wedge, and wiper geometry (2.2 mm length) was used. The inserts were mounted on a Sandvik CoroMill® 390 end mill (20 mm nominal diameter and two-insert capacity). To ensure process accuracy, the end mill was clamped in a Sandvik Corochuck® 930 hydraulic chuck, minimizing runout error (less than 2.0 μm). To optimize material usage and prevent damage, the workpiece (46.5 × 38.0 × 31.5 mm) was machined in steps with a radial depth of cut of 11.5 mm. Over 45 runs, the total cutting length was approximately 1418 mm, resulting in a cutting time of 6.75 min without replacing the tool edges. No measurable tool-edge wear or fracture was observed throughout the experiments. Figure 1 illustrates the experimental setup under the CCA application. A plastic push-to-connect Y-splitter for an 8 mm tube was used to direct the compressed air. It was positioned at a 45° angle and 20 mm from the cutting zone. Experimental setup with CCA application.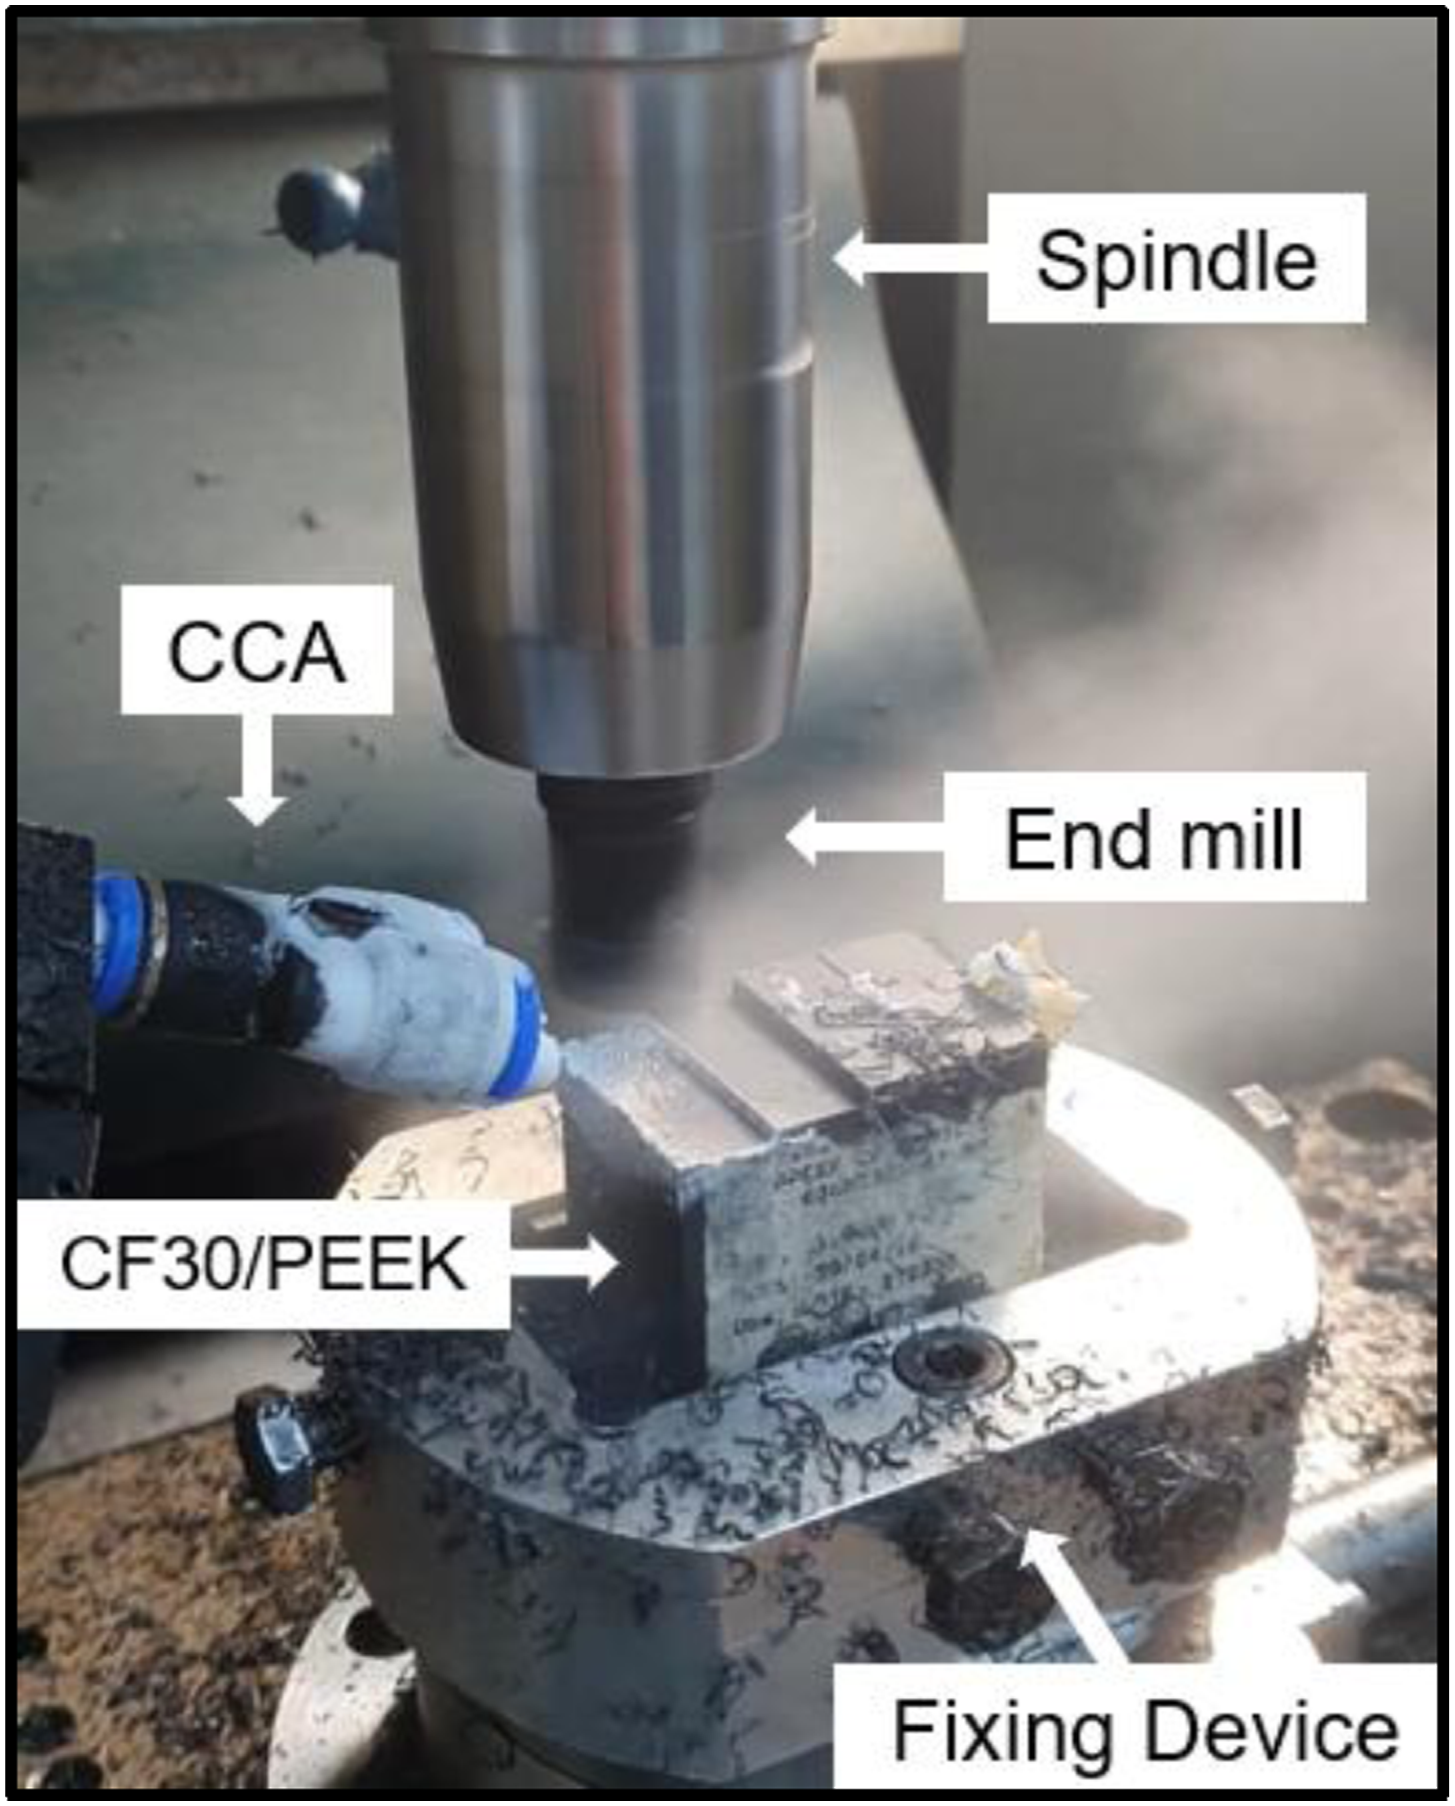
Cutting parameter combinations for 15 machining runs.
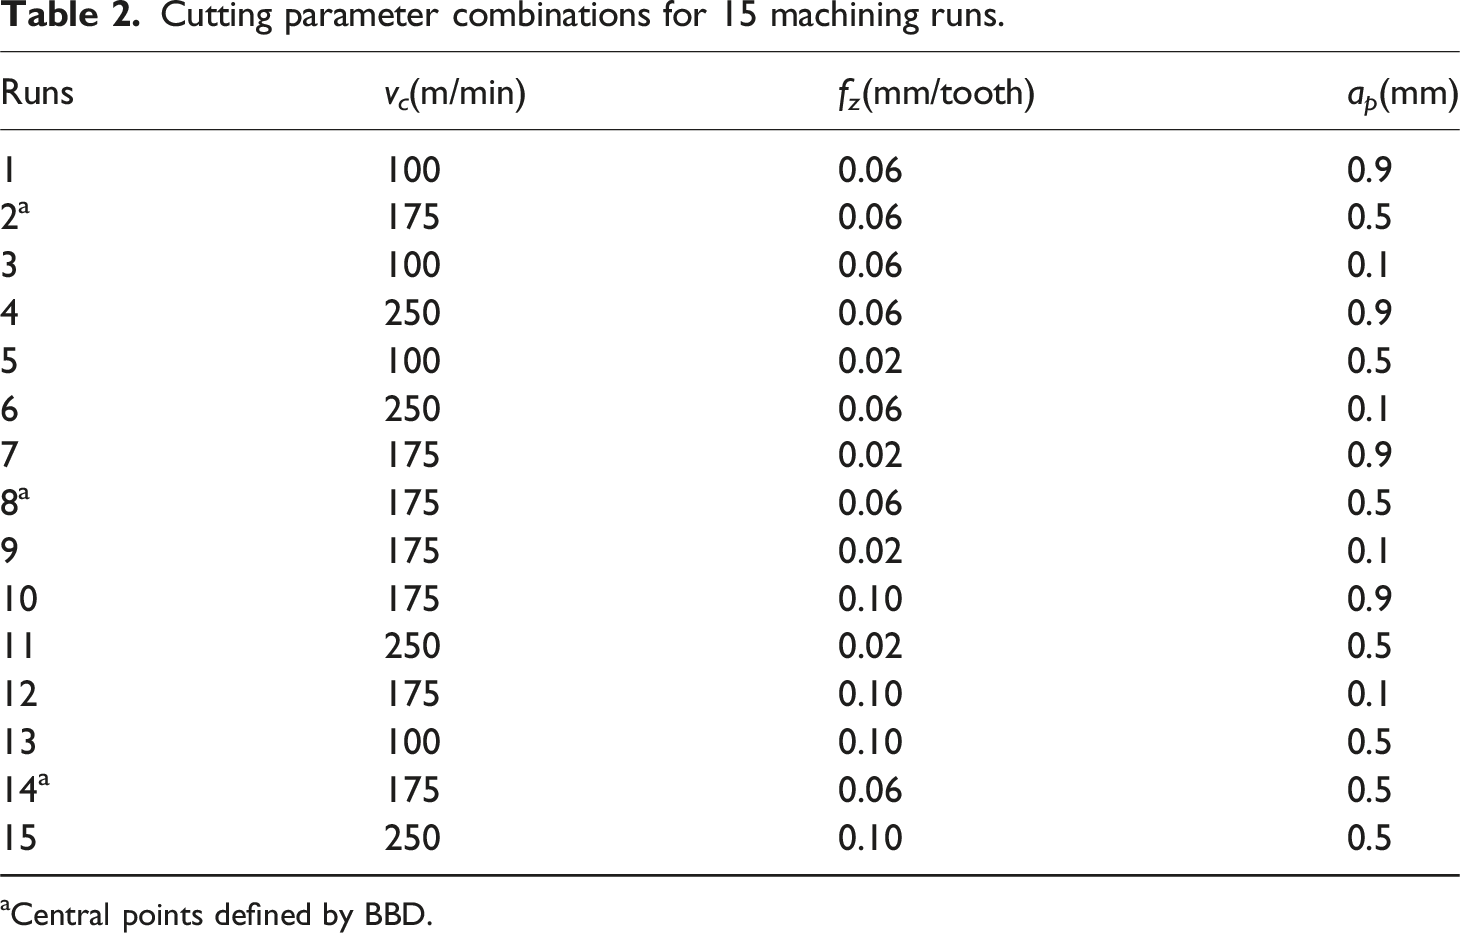
aCentral points defined by BBD.
The cooling device used in this study (Figure 2a) consists of an aluminum helical coil tube with 30 m length and 8 mm diameter placed inside a thermally insulated container filled with dry ice (solid CO2) at −78 °C. Compressed air at 400 kPa circulates through the coil, exchanging heat with the dry ice. A type-K thermocouple (with a measurement range from −100 to 1000 °C) was employed to monitor the air temperature at the coil outlet. Temperature data were collected using an Agilent 34970A data acquisition system. To initiate the process, 7.0 kg of dry ice were required, with a continuous refill rate of approximately 1.0 kg/h. The runs began 1 minute after the air temperature stabilized at −40 ± 1 °C, as indicated by the thermocouple. Due to water droplets in the compressed air and the low SCO2 temperature, air-line regulators were installed to prevent coil obstruction. In addition, the cutting strategy was optimized to execute cutting runs more quickly, and an anemometer was used to verify the air flow.
The heating device (Figure 2(b)) has a configuration similar to the cooling device. It consists of a thermally insulated container filled with water, heated to the boiling point (100°C) by two electric resistors. An aluminum coil with dimensions similar to those of the cooling device, fully immersed in boiling water, transfers heat to the compressed air circulating through it. The air temperature at the coil outlet defines the heated compressed air (HCA) condition. The runs under HCA started 1 min after the temperature stabilized at 60 ± 3°C. Scheme for compressed air devices: (a) cooling; (b) heating.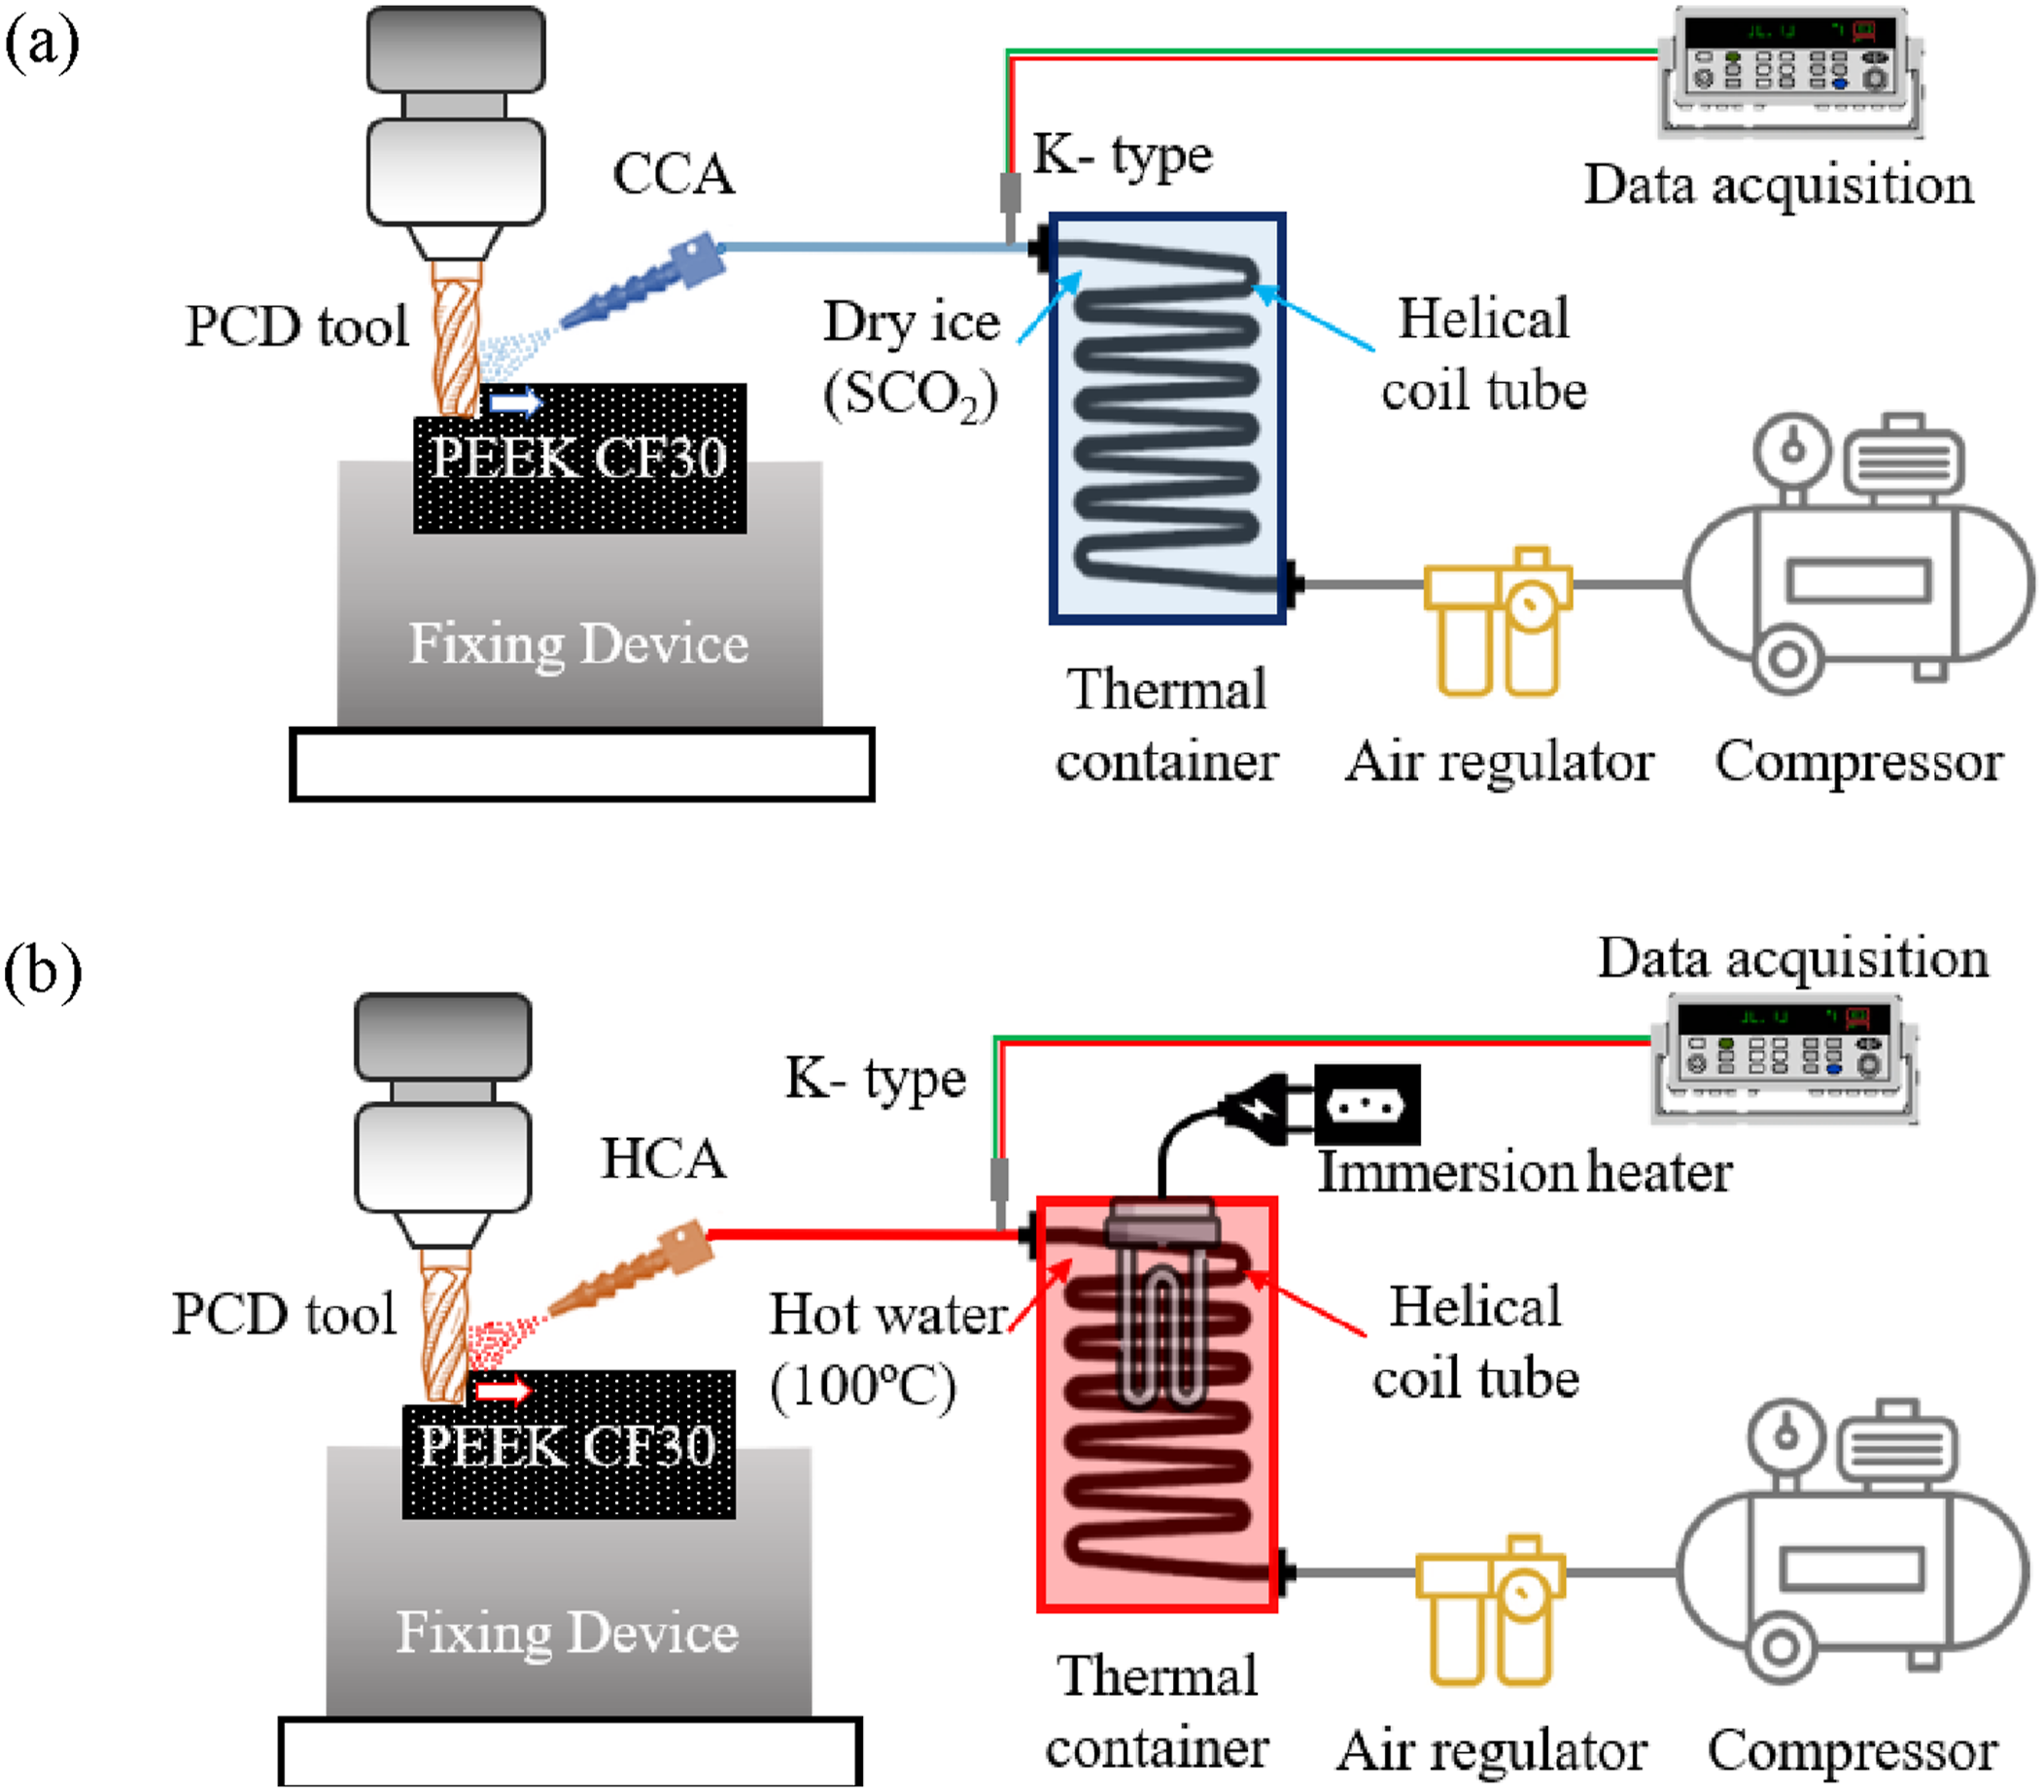
To evaluate the 2D roughness profile and the amplitude parameters R a and R z of the machined surfaces, a Mitutoyo SJ-201P portable profilometer (0.01 µm resolution) was used to collect three roughness profiles and parameters collected on each sample, employing a sampling length (l e ) of 0.8 mm and an evaluation length of 4.0 mm. This setup is recommended for roughness values between 0.1 < R a < 2.0 µm and/or 0.5 µm < R z < 10 µm for non-periodic profiles as specified in ISO 21920-3. 32 Data were collected with the dedicated software SJ Tools, which allows graphical analysis of the distribution of peaks and valleys generated during face milling.
The response variables (R a and R z ) were statistically analyzed using Minitab® 22 (free trial) to perform analysis of variance (ANOVA) and to optimize the process via the Box-Behnken Design (BBD). Matlab R2014a (MathWorks®) was used to generate the Abbott-Firestone curves (AFC) and probability density functions (PDF) from the 2D roughness profiles. Surface textures of the machined samples were analyzed using a Zeiss EVO MA10 scanning electron microscope (SEM). For complementary analysis of optimized surfaces (3D profile and parameters S a and S z ), a Taylor Hobson Precision Talysurf CCI Lite M112-3993-03 white-light interferometer was employed. Data processing and analysis were conducted using MountainsMap® software, which is integrated with the equipment.
Results and discussion
Ra and Rz Roughness
The R
a
and R
z
roughness values measured after face milling of CF30-reinforced PEEK under dry, CCA, and HCA conditions are shown in Figure 3. In most runs, the R
a
and R
z
values obtained with cooled compressed air (CCA) were lower than those produced under the other conditions. Across all runs, the application of CCA resulted, on average, in reductions of 5.12% in R
a
and 8.77% in R
z
compared with those values generated by DRY machining. The HCA condition also resulted in reductions of 5.12% in R
a
and 9.72% in R
z
when compared with the DRY condition. Surface roughness values after CCA, DRY, and HCA milling: (a) R
a
; (b) R
z
.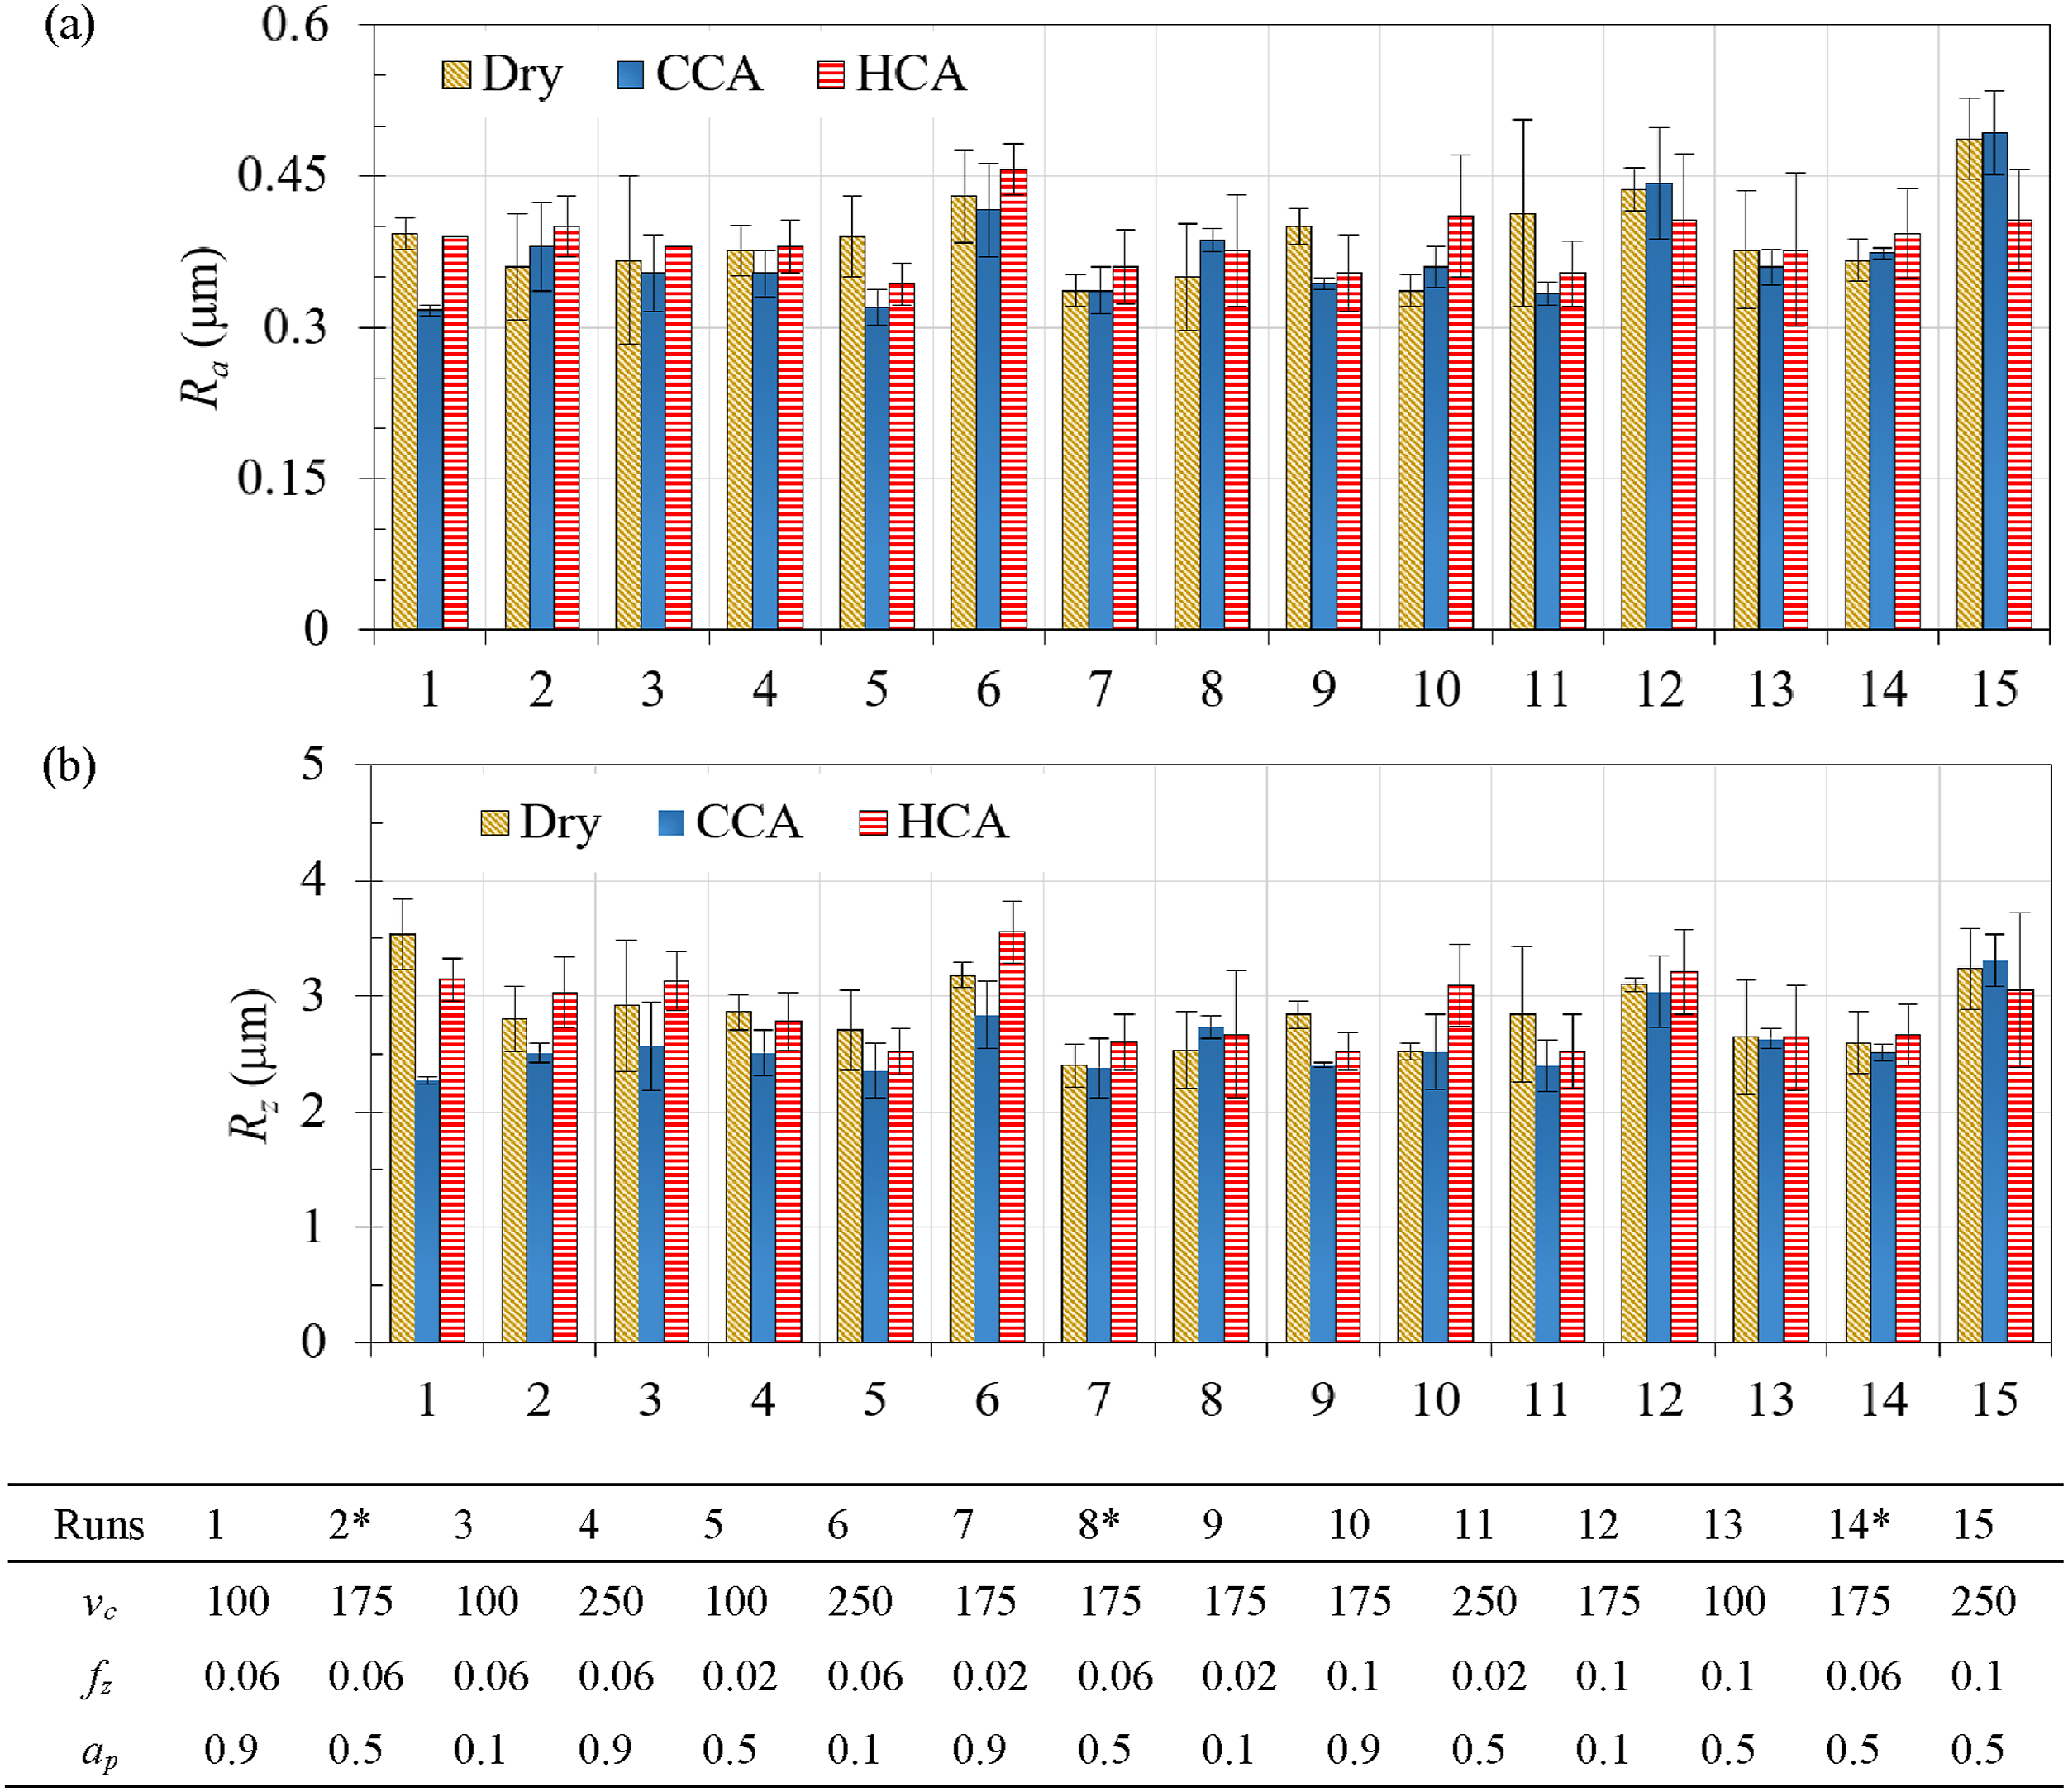
Grouping the data by cutting speed (v c ) and analyzing the mean R a and R z values in both CCA and HCA conditions, the best results were obtained at v c = 100 m/min. However, under DRY conditions, the lowest roughness values were obtained at v c = 175 m/min. It is noteworthy that the combination of CCA with v c = 100 m/min produced the lowest roughness values among the nine evaluated cases, with a mean R a value of 0.34 μm (representing a reduction of 8% compared with HCA and 10.5% with DRY at the same v c ) and an average R z of 2.46 μm (14% and 16.6% lower than HCA and DRY, respectively). A lower cutting speed tends to generate less heat in the cutting zone, which is beneficial for polymers sensitive to high temperatures. 6 The feed per tooth (f z ) is theoretically the cutting parameter with the highest influence on surface roughness.11,13 This trend is confirmed for both DRY and HCA conditions, where the lowest R a and R z values were achieved with the smallest f z (0.02 mm/tooth). However, under the CCA condition, the best performance was observed with the middle f z (0.06 mm/tooth), indicating a distinguishing behavior. According to Cao et al., 6 this f z level may represent an equilibrium between stable chip formation and tool overload, i.e., smaller values do not remove material sufficiently, while larger values increase cutting forces, vibration, deformation, or surface defects.
Lowest R a and R z roughness values for each thermal condition.
The feed per tooth in the best CCA condition (0.06 mm/tooth) disagrees with the expectation that a lower feed per tooth generates better surface quality.11,19 As the uncut chip thickness is proportional to f z , the f z /rβ ratio (13.3) facilitates the chip breakage, promotes a more effective cutting regime, and reduces surface deformation at low temperatures. Besides, a higher a p (0.9 mm) improves the coolant penetration to the cutting interface. At lower f z (0.02 mm/tooth), the f z /rβ ratio (4.4) can make chip cutting difficult and impair surface finish due to the ploughing effect. 33
Surface texture assessment
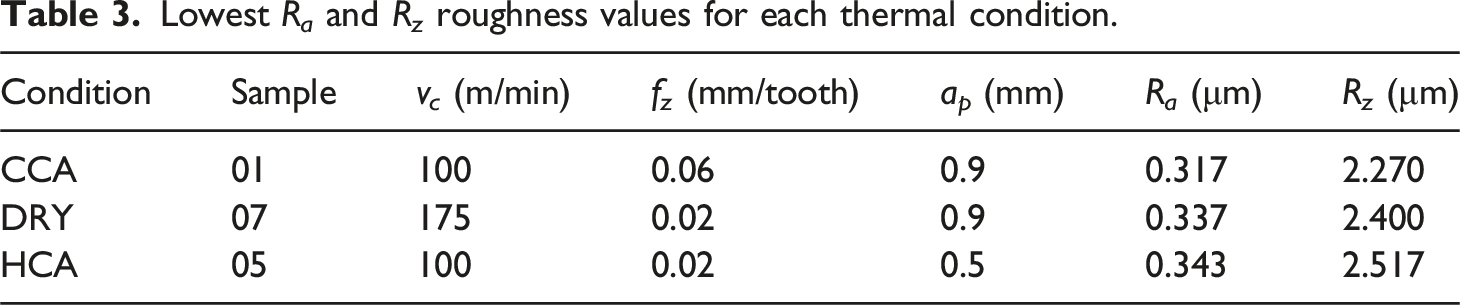
Figure 4 shows the 2D roughness profiles of samples CCA01, DRY07, and HCA05. When comparing the profiles, it was observed that the distributions of peak and valley amplitudes were similar across the three thermal conditions. Although some peaks exceed ±1.5 µm, most height variations remain within ±1.0 µm, regardless of the cutting condition. Surface roughness profiles of samples: (a) CCA01; (b) DRY07; (c) HCA05.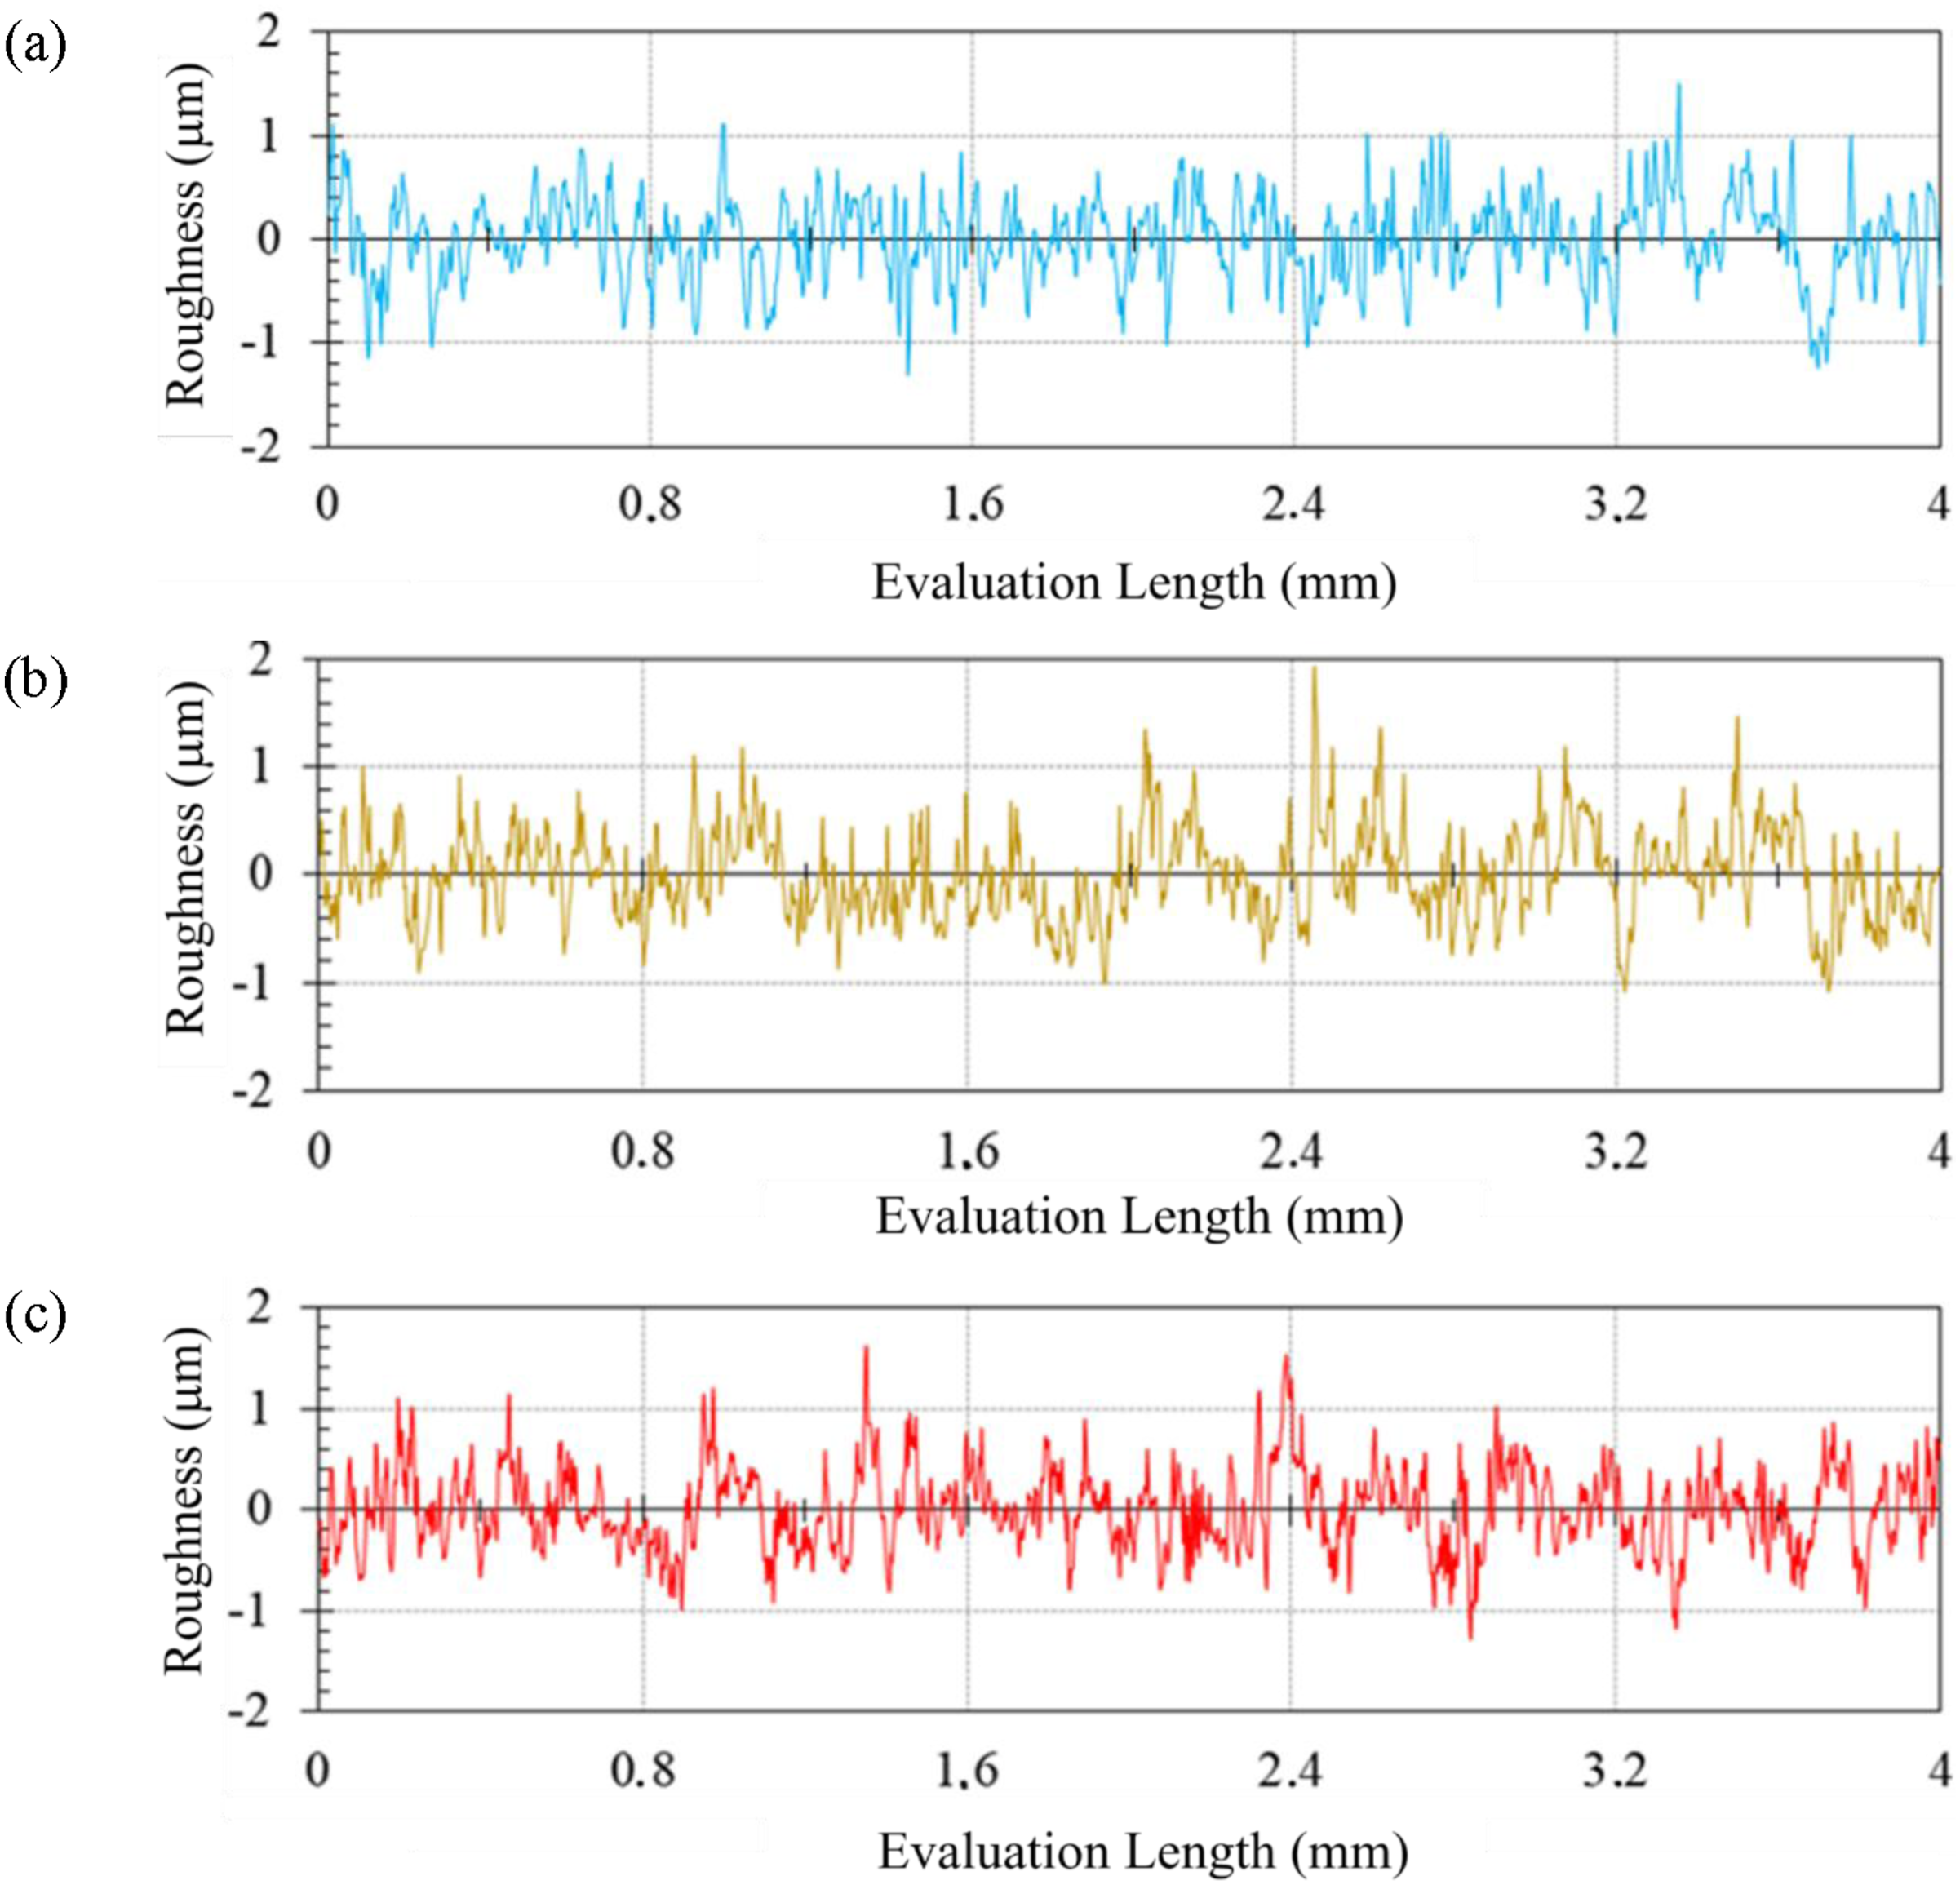
A distinct feature is the presence of more pronounced undulations in DRY07, which are not observed in the profiles of CCA01 and HCA05, indicating greater surface regularity when compressed air is applied, thereby facilitating more effective chip evacuation. 16
Figure 5 shows the AFC and PDF plots for the samples with the lowest R
a
values in each of the thermal conditions analyzed. AFC and PDF plots of samples: CCA01, DRY07, and HCA05.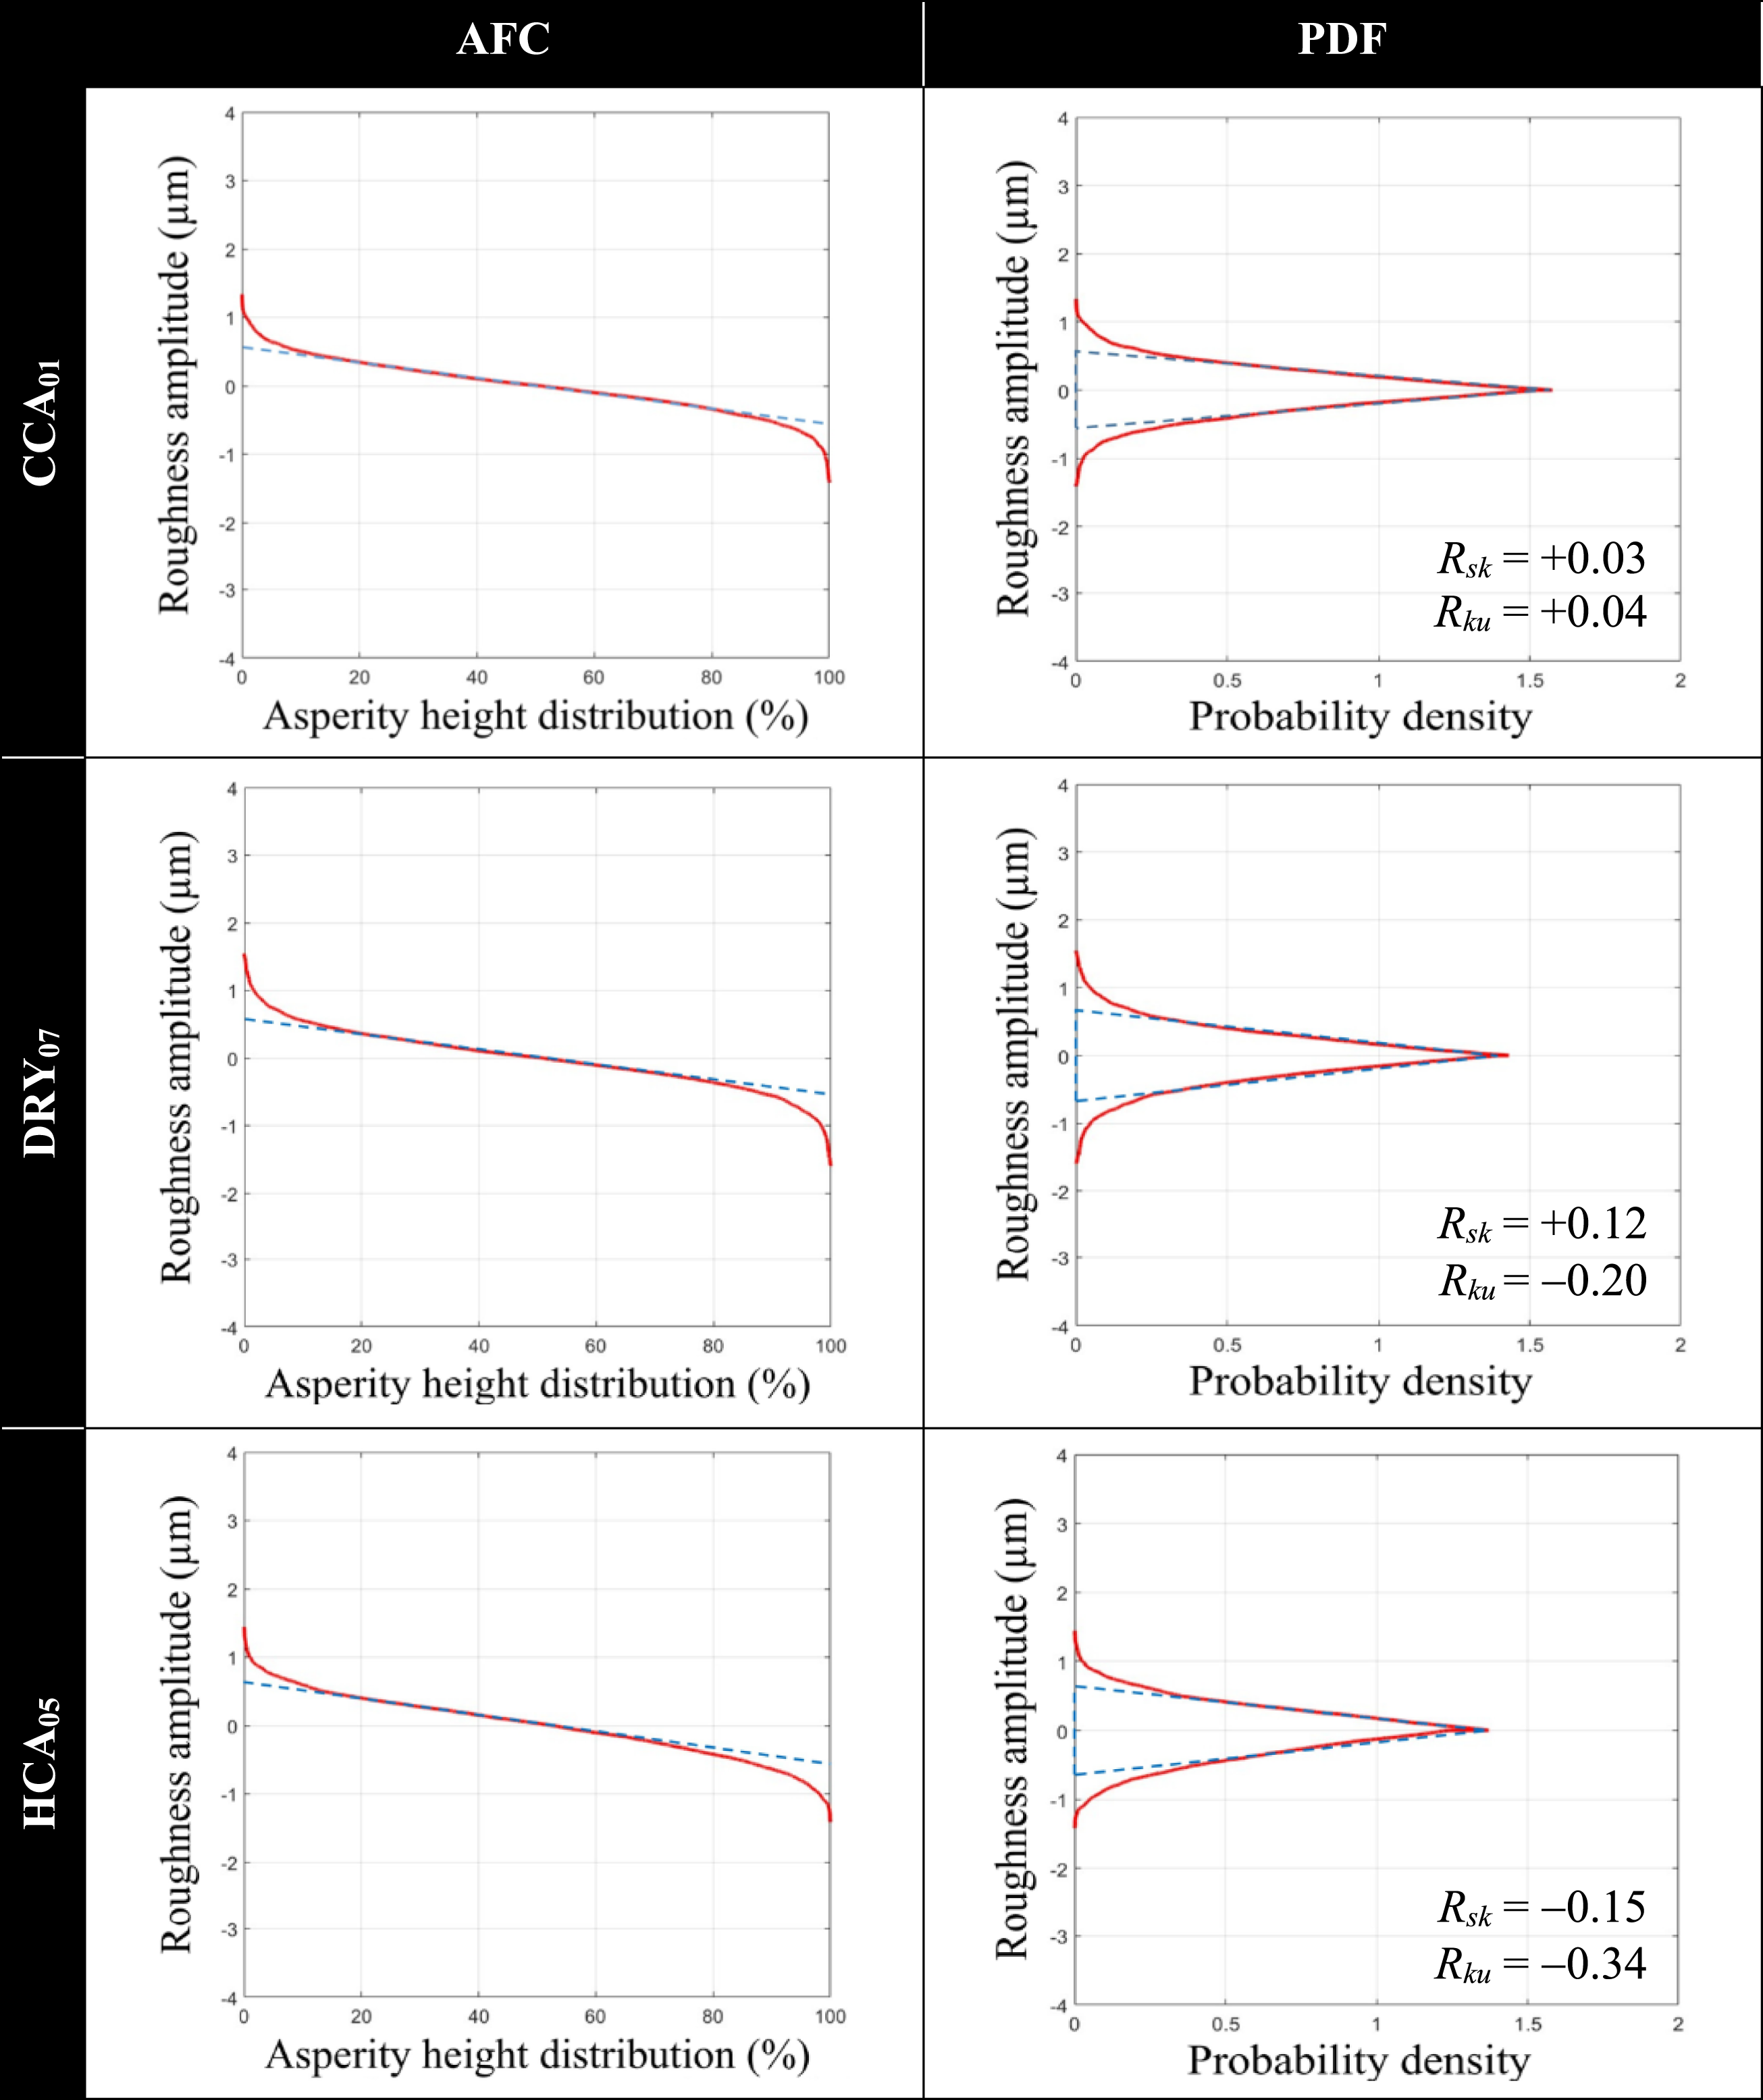
The AFC curves for these cases exhibit similar profiles, with only slight variations in slope. Analysis of the PDF functions indicates that the CCA condition has a higher concentration of data near the mean line (high kurtosis) and no skewness, reflecting a more uniform distribution of peaks and valleys and a more controlled roughness profile.29,30 R sk and R ku values obtained for sample CCA01 are closer to zero, indicating that the distribution of peaks and valleys in the roughness profile is approximately normal and symmetric. Comparatively, sample DRY07 exhibits a slightly asymmetric distribution, with more peaks than valleys (R sk > 0) and higher peaks and deeper valleys (R ku < 0). Sample HCA05 also shows a slightly asymmetric distribution, with more valleys than peaks (R sk < 0). However, in these cases, the R sk and R ku values have been within the interval [−1, +1], indicating excellent surface quality. 30
Figure 6 presents the SEM images corresponding to the best surface roughness results in each thermal condition, captured at 500x and 2000x magnifications. The machined surface of CCA01 at 500x shows no significant defects, whereas at 2000x, small voids are observed. This fact may be related to the strong temperature dependence of the mechanical behavior of polymers. Below the T
g
, polymers tend to exhibit brittle behavior.
5
In this context, natural PEEK has been reported to undergo a ductile–brittle transition at low temperatures, resulting in an abrupt change in impact behavior and a significant reduction in energy absorption capability.
34
In the DRY07 sample, the 500x image reveals a surface quality poorer than that of the CCA01 sample; at 2000x, smearing, voids, and exposed carbon fiber reinforcement are evident. The voids were possibly formed due to plastic deformation and material flow during cutting, which is directly associated with smearing. The heat generated during face milling softens the PEEK matrix, causing it to spread over the machined surface (smearing) that directly affects surface texture.35,36 For the HCA05 sample, the SEM image at 500x magnification shows that plastically deformed material was dragged by the cutting edge, resulting in feed marks with smearing. Under HCA conditions, the increase in temperature induced by the cutting process, further intensified by the application of compressed air at 60°C, may have raised the workpiece temperature above its T
g
(147°C), thereby driving the composite into a rubbery regime. This behavior promotes material adhesion and flow, thereby favoring the formation of pronounced feed marks and surface smearing as indicated in the SEM image at 2000x magnification. SEM images of the samples with better surface finish.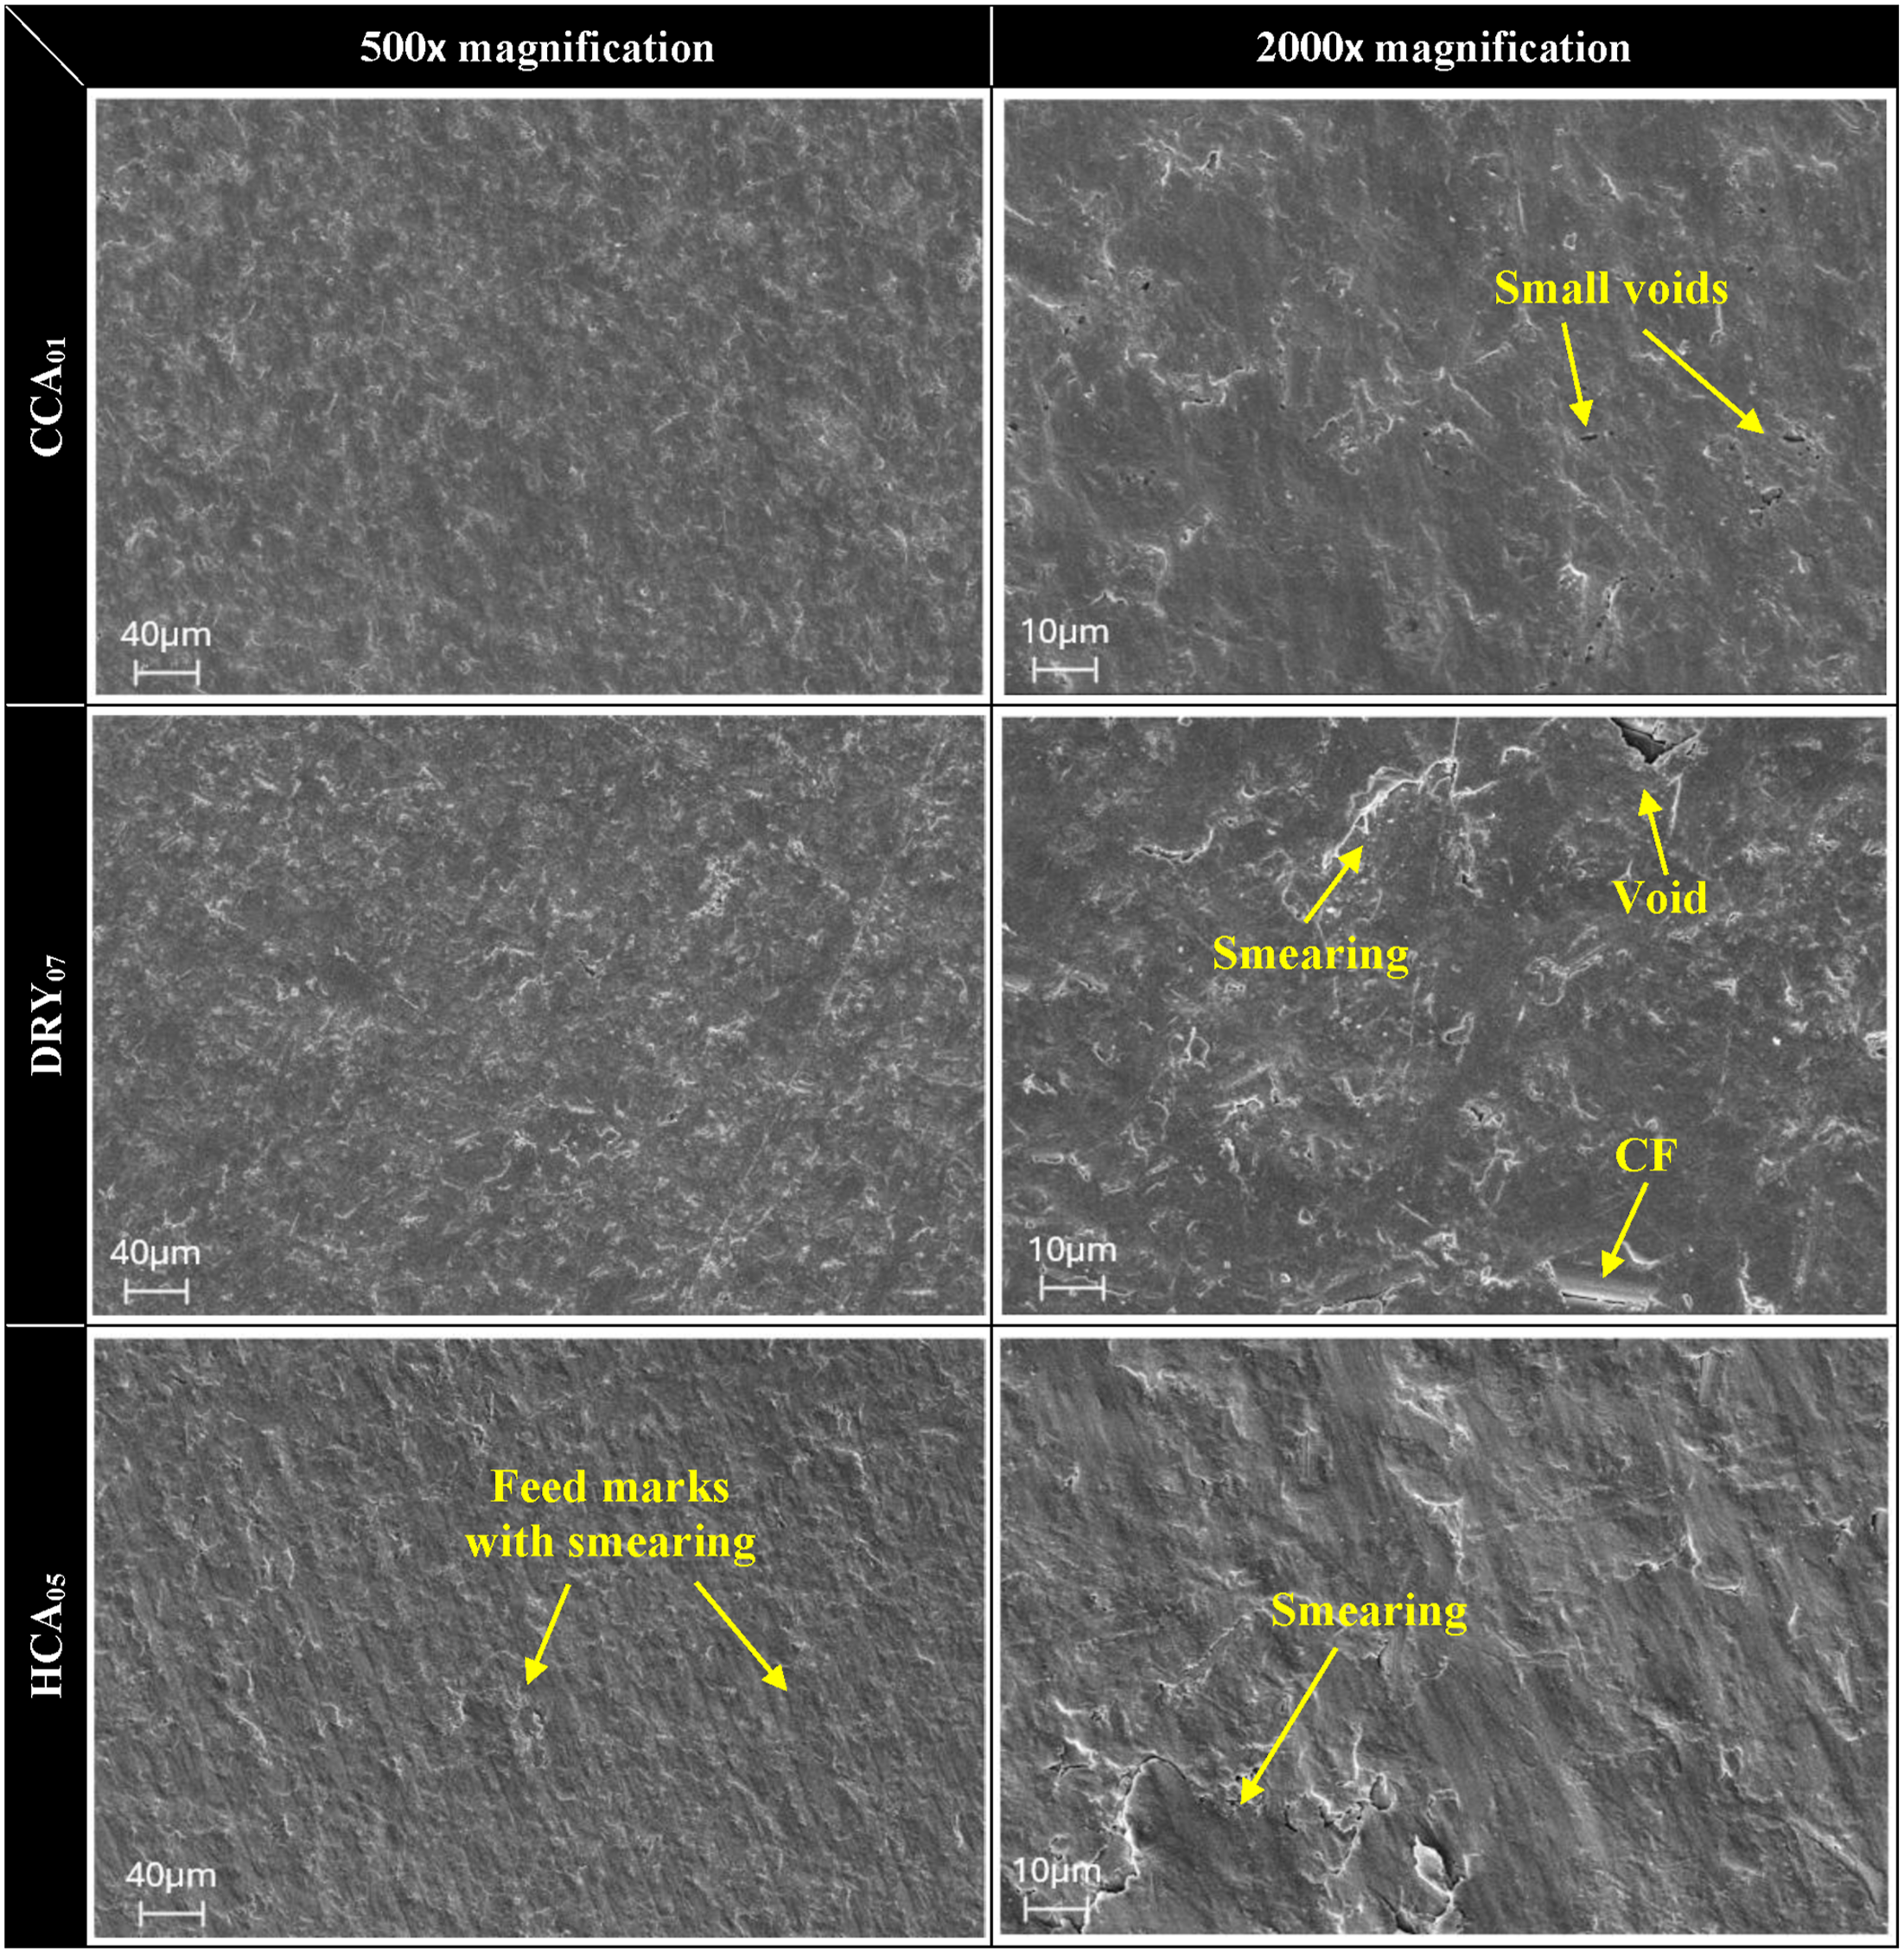
Statistical analysis and optimization
ANOVA results for R a and R z (α = 0,05).
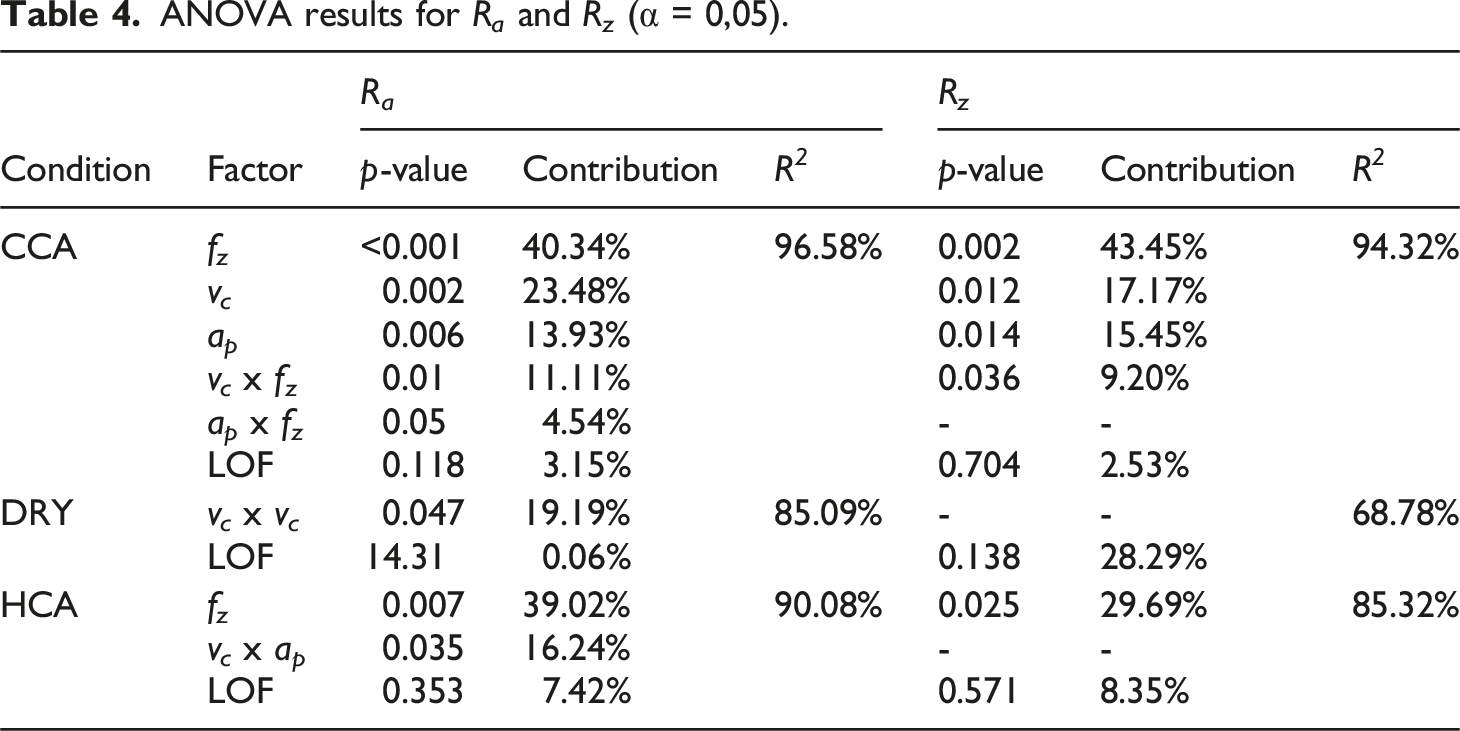
Figure 7 presents the multiple comparisons of the paired means of the significant first-order variables obtained using the Tukey test (α = 0.05). As reported by Aita et al.,
37
this test was used as a complement to ANOVA to assess whether changes in the levels of the input parameters lead to statistically significant differences in the surface roughness of CF/PEEK. The graphical interpretation is based on identifying confidence intervals that do not intersect the zero value, indicating statistically significant differences among the evaluated means. All of Tukey's graphs are available in the supplementary materials. Tukey pairwise comparisons.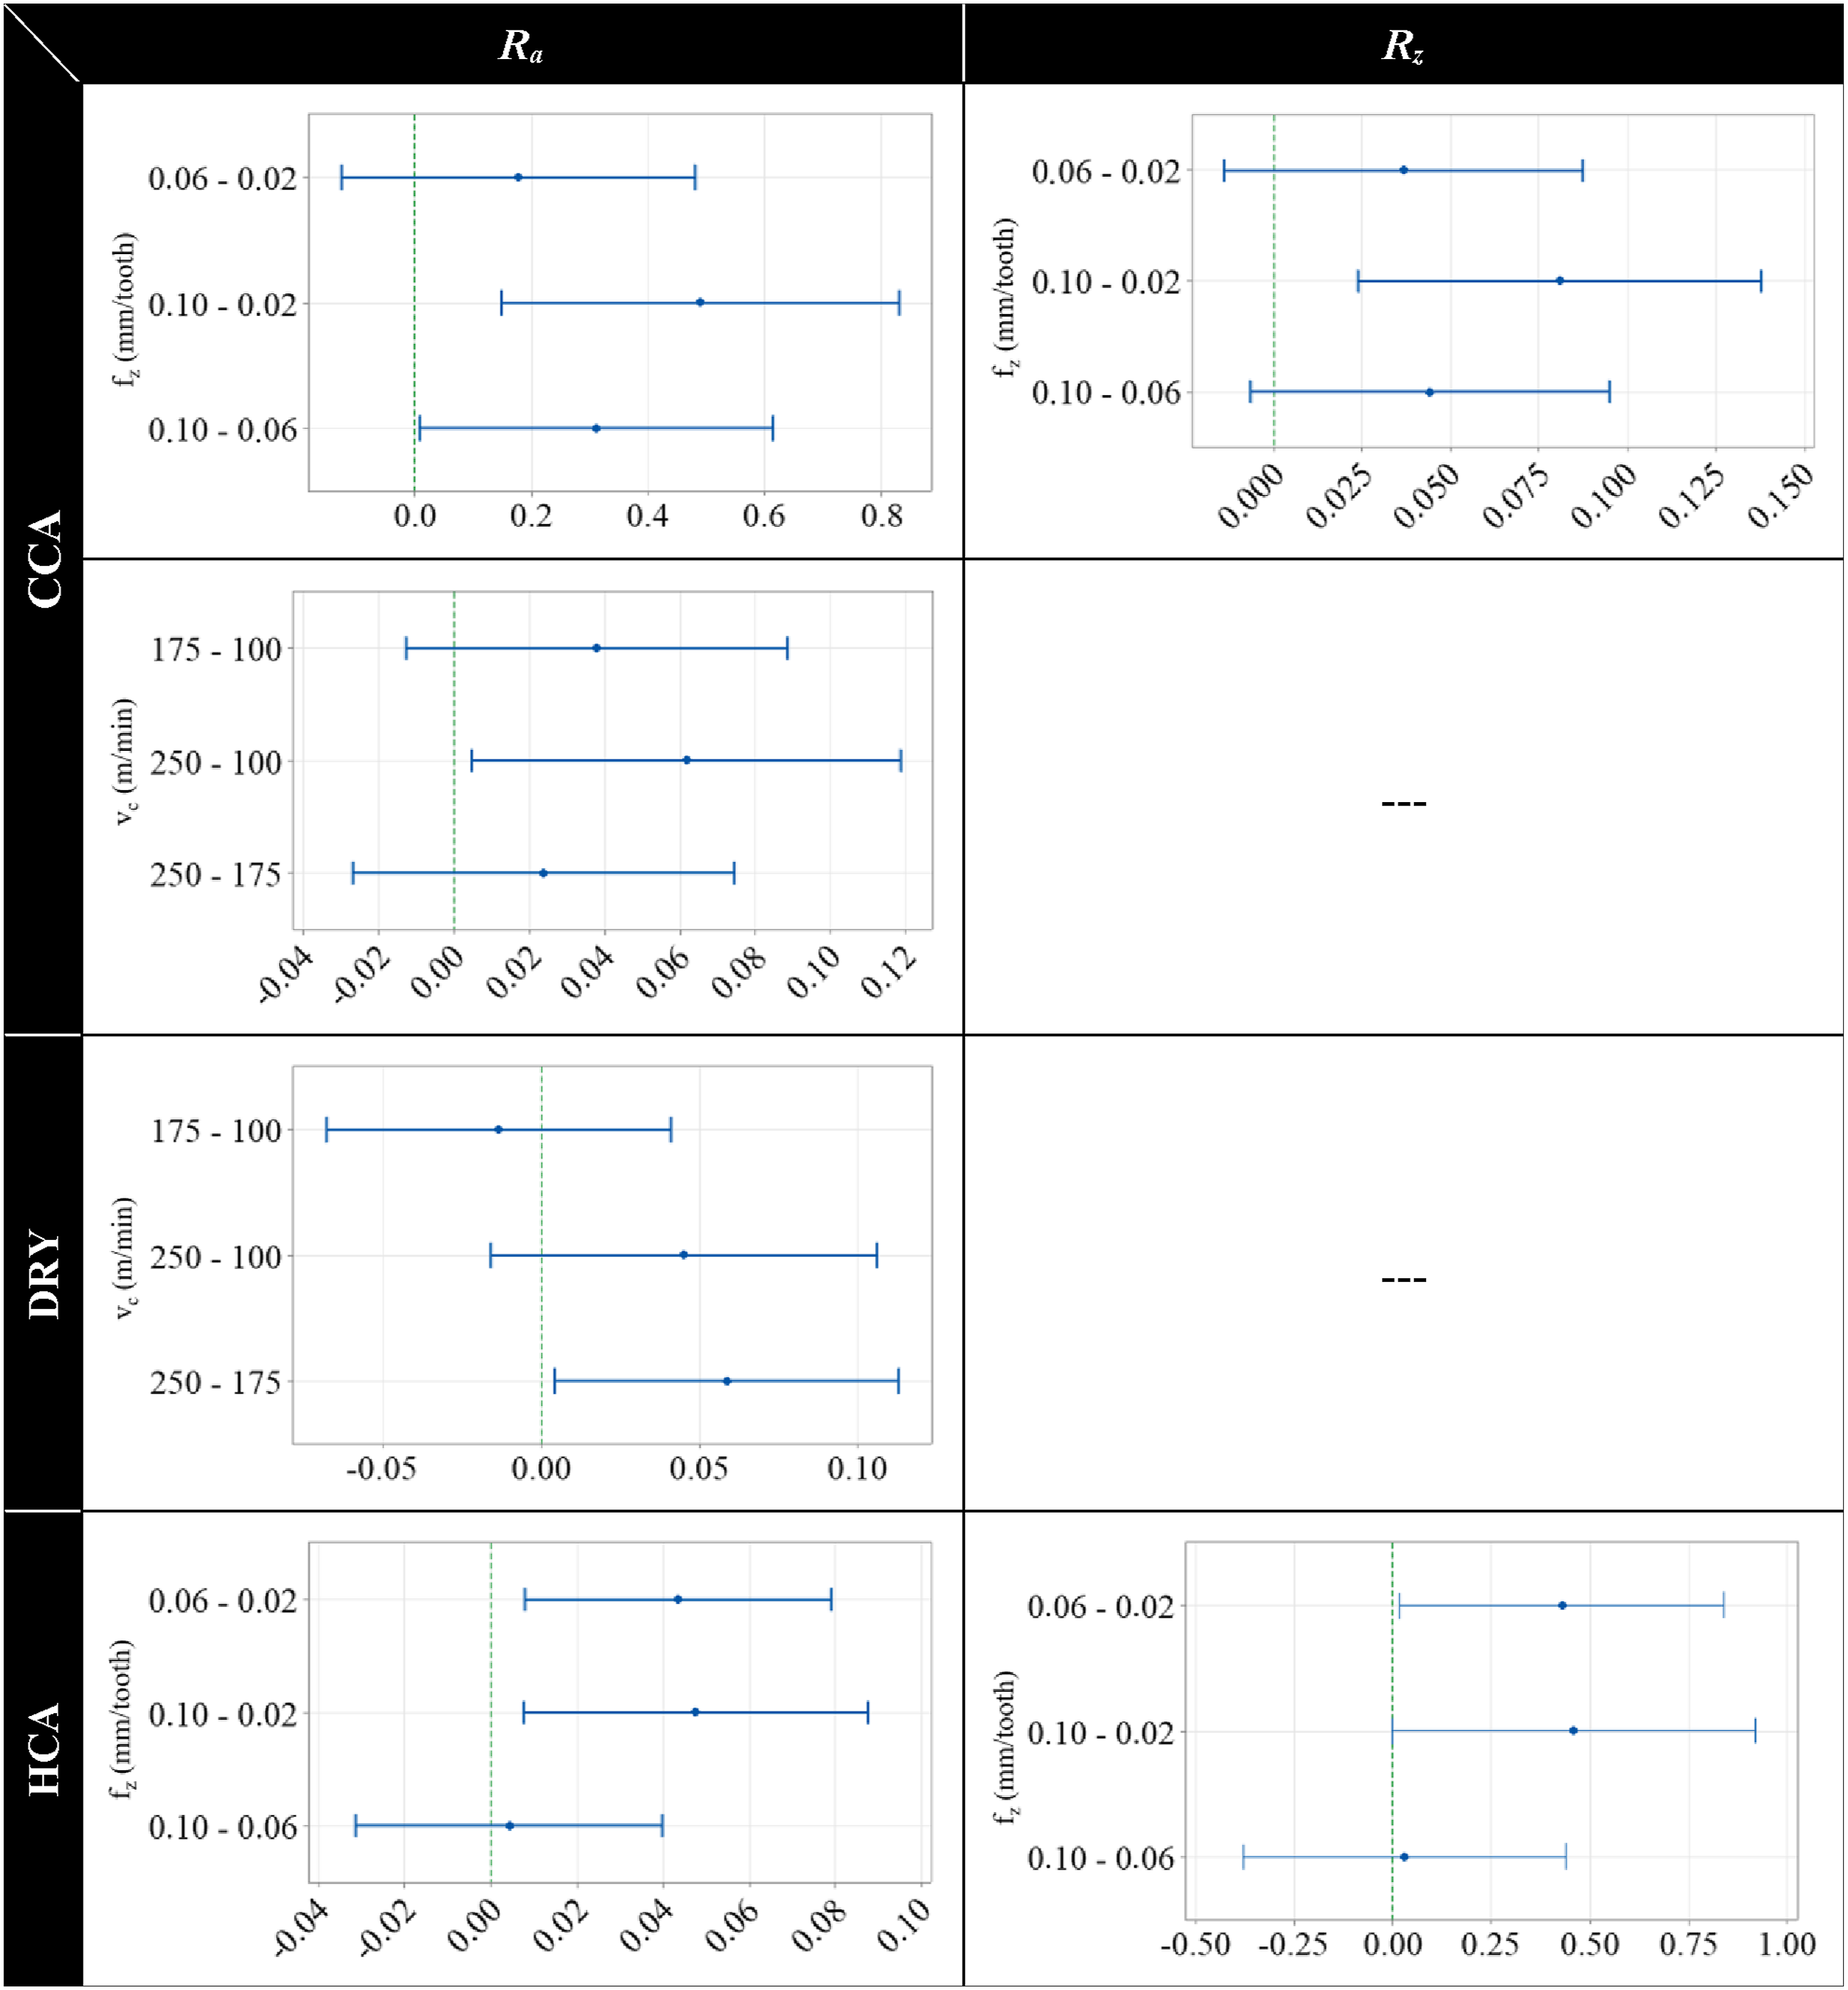
The f z interval of 0.02–0.10 mm/tooth was the only range that exhibited statistically significant differences in both R a and R z under CCA. In addition, the cutting speed interval of 250–100 m/min showed a statistically significant effect on R z . Zhang et al. 11 reported that the most significant parameters affecting surface roughness generated by CF/PEEK milling are feed per tooth (f z ) and cutting speed (v c ). This trend was confirmed under the CCA condition (Table 4 and Figure 7), where f z had the strongest influence on both R a and R z , followed by v c .
Under DRY conditions, none of the parameters exhibited a significant linear effect (Table 4). The only relevant factor was the quadratic effect of cutting speed (v c x v c ) on R a , which may also be attributed to the temperature increase in the cutting zone induced by this parameter. 12 This behavior was also confirmed by the Tukey test (Figure 7), which showed that the v c interval of 250–175 m/min was the only range that exhibited statistically significant differences. This effect may be further intensified by the absence of cooling, which hampers temperature control and efficient chip evacuation.16,21
Liu et al. 20 stated that v c is the parameter that most influences the heat generated in the cutting zone during dry face milling of unidirectional CF/PEEK laminates, although fiber orientation also affects this factor. Liu et al. 38 concluded that v c is the primary factor influencing the temperature rise in the cutting zone during the milling of carbon fiber-reinforced polymer (CFRP). Klein et al. 21 noted that increasing the axial depth of cut (a p ) increases the cutting-zone temperature during CFRP milling, leading to higher tool wear, reduced matrix support for the fibers, and poorer surface finish. These studies indicate that the cutting-zone temperature should be limited through appropriate machining conditions to ensure a high-quality texture, i.e., surfaces with minimal defects. Therefore, the significance of v c and a p (and/or a e ) is understood to depend on variations in the cutting-zone temperature.
Finally, under the HCA condition, f z again proved to be the most influential parameter. However, in addition to f z , the interaction between cutting speed and axial depth of cut (v c x a p ) was significant (Table 4). This effect can again be related to changes in the cutting-zone temperature. Moreover, the removal of the layer from this heated surface depends directly on the a p . The f z exhibited two statistically significant intervals for R a and R z in the Tukey test, which is most likely associated with the pronounced feed marks observed. These marks result from increased plastic deformation during cutting caused by high temperatures, as shown in Figure 6.
Desirability function results.
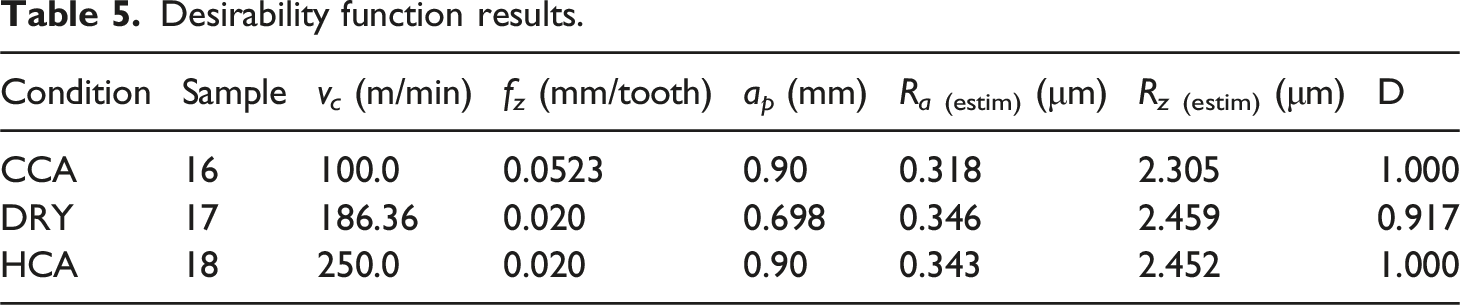
As mentioned before, a higher f z (0.0523 mm/tooth) facilitates the chip breakage at low temperatures more than a lower f z (0.02 mm/tooth) due to the ploughing effect. 33 It allows for improving the surface finish.
Measured and predicted roughness values.
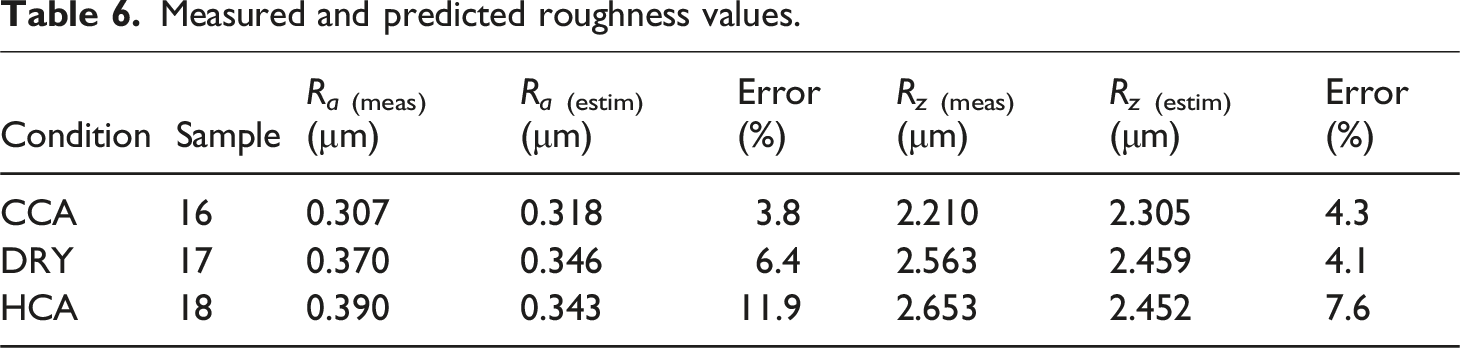
The substantial increases in v
c
(from 100 to 250 m/min) and a
p
(from 0.50 to 0.90 mm) may have caused higher roughness values (particularly R
a
) in the HCA18 sample compared to the HCA05 sample, also due to the higher temperature in the cutting zone. The analysis of the material removal rate (MRR) (Figure 8) shows that, in addition to providing the best surface finish, the CCA condition also exhibits superior MRR. The MRR results for all runs are in the supplementary materials. Comparison between material removal rates for better surfaces.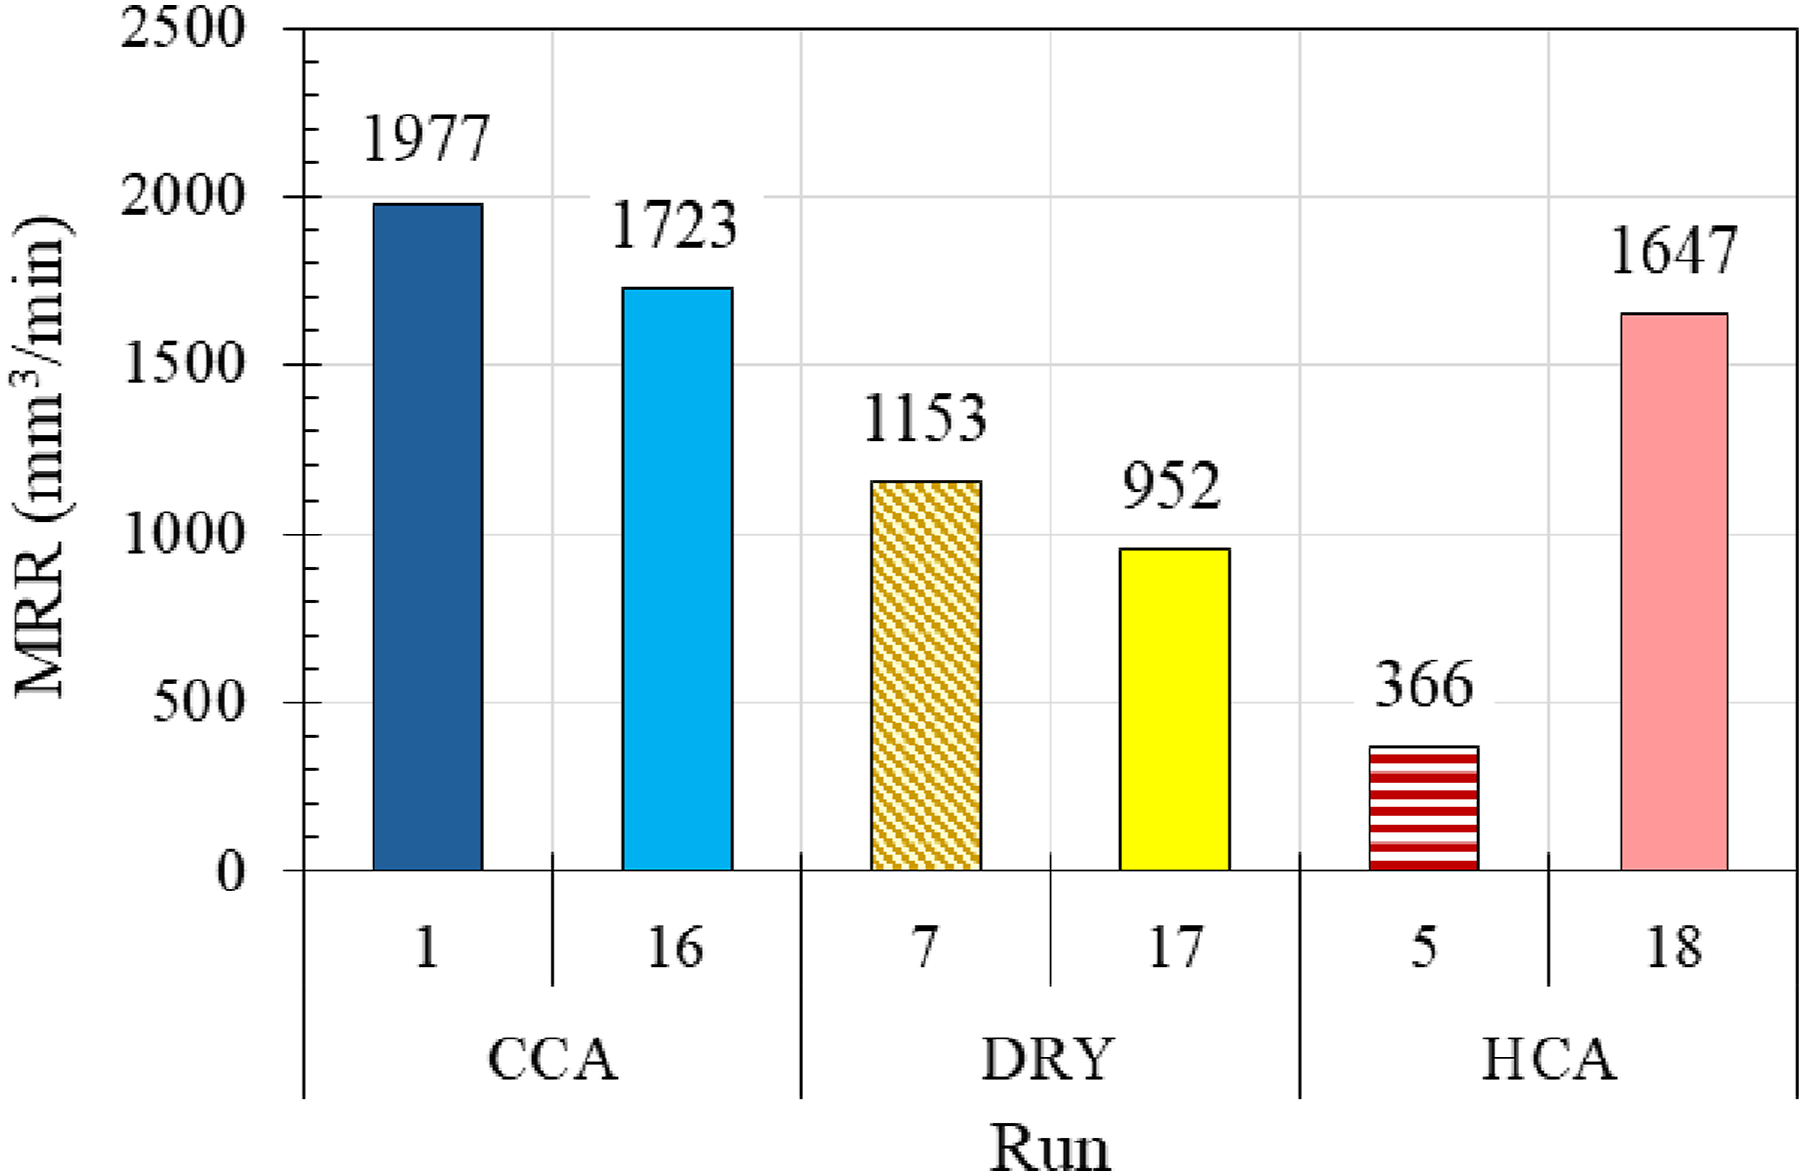
Figure 9 shows the SEM images of the surface with the optimized roughness values results for each thermal condition, captured at 500x and 2000x magnifications. As previously mentioned, the texture of the CCA16 sample appears more uniform than that of the CCA01 sample, although small voids are still observed at 2000x. The cooling effect promotes stiffening of the composite, facilitating efficient cutting while reducing the spreading and plastic deformation that are predominant under dry or less effective cooling conditions.
40
In the DRY17 sample, the surface texture retained characteristics like those of the DRY07 sample, but with reduced smearing and no tearing (exposing the CF). Conversely, in the HCA18 sample, no feed marks were observed, unlike in the HCA05 sample, where smearing of higher magnitude and adhered material were detected. SEM images of the samples generated under optimized parameters.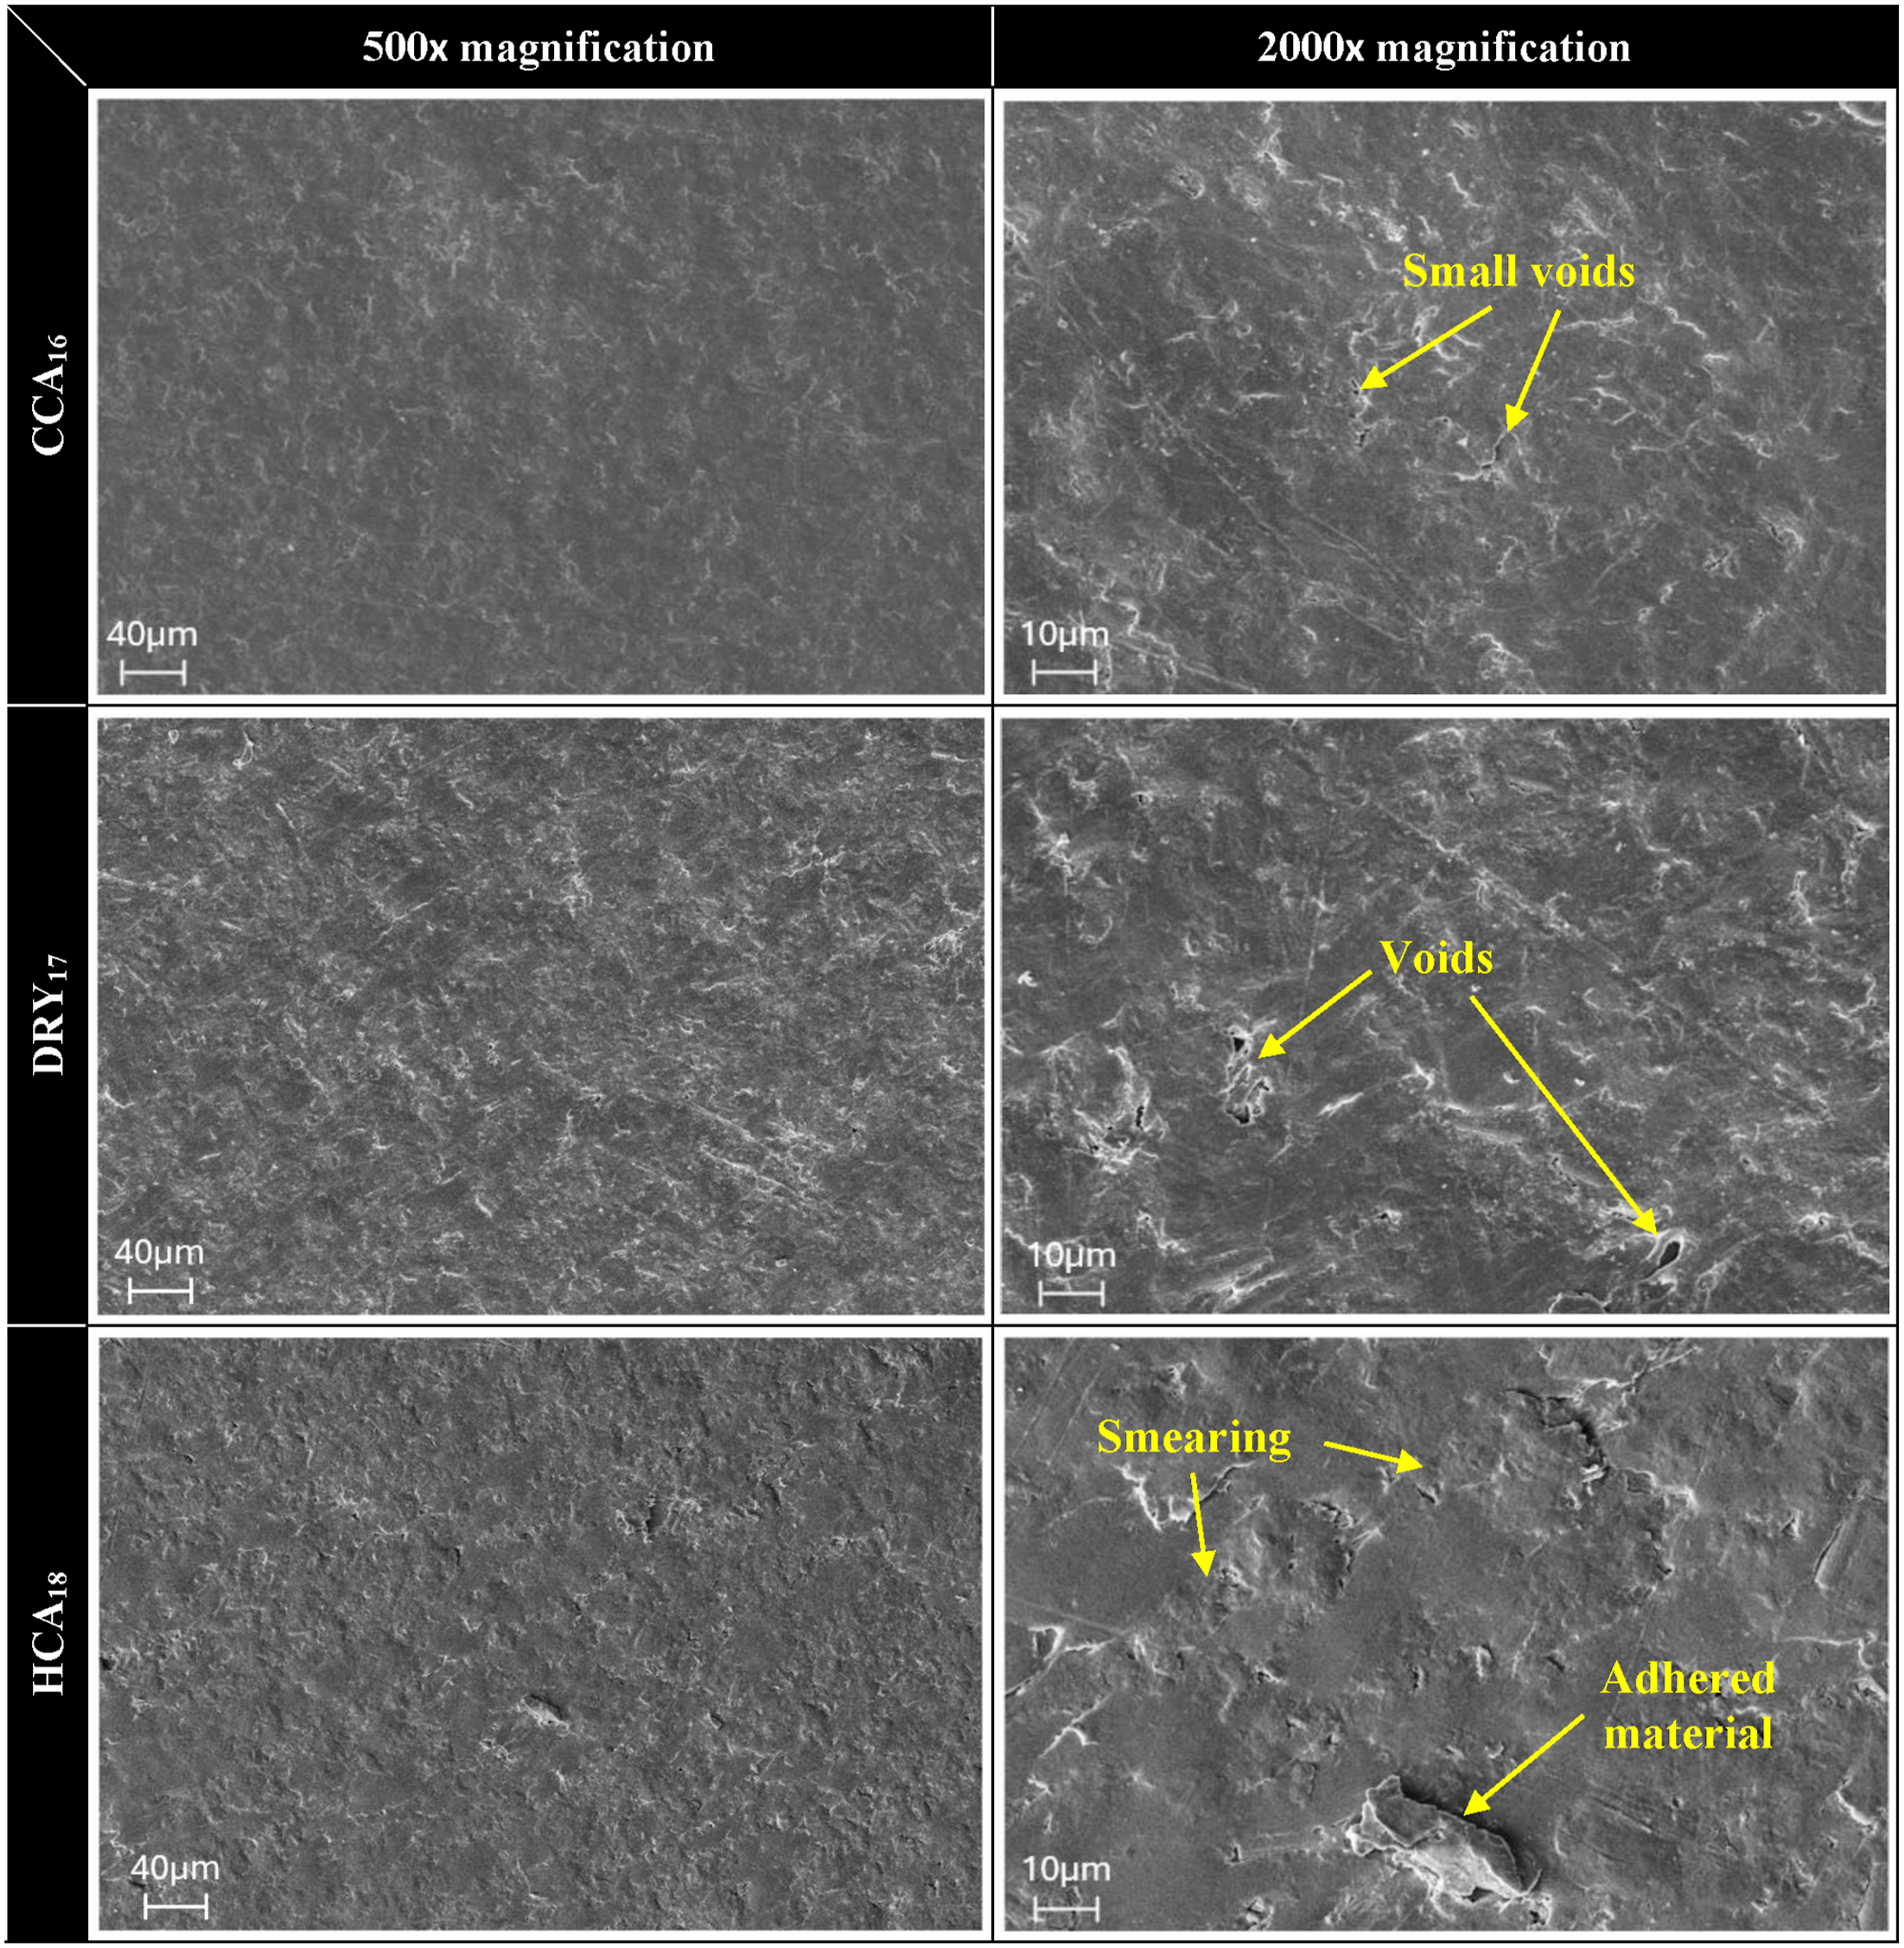
The R a parameter, widely used for evaluating metallic surfaces, is limited in composite machining due to the material’s heterogeneity, making surface characterization less reliable (it does not differentiate between peaks and valleys nor define the shapes of profile irregularities). 17 Therefore, the S a parameter, which evaluates an area, provides a value closer to the real surface. In this study, S a values remained consistent with the R a measurements. While R z denotes the arithmetic mean of the five highest peak-to-valley distances in each sampling length of a 2D profile, the S z indicates the maximum height of the limited area surface. Thus, S z is more consistent with R t (maximum height of the 2D profile) than with R z .
Figure 10 presents the 3D and 2D roughness profiles obtained by interferometry for the previously best-finish samples (CCA01, DRY07, HCA05) and for the optimized samples (CCA16, DRY17, HCA18), considering a predefined square with an area of 1.96 mm2. It is observed that the surfaces of the optimized samples CCA16 (S
a
= 0.371 μm; S
z
= 18.23 μm) and DRY17 (S
a
= 0.400 μm; S
z
= 12.42 μm) exhibit similar characteristics, differing mainly in the amplitude of the peaks and valleys (smaller under the DRY condition). A similar behavior is observed in samples CCA01 (S
a
= 0.385 μm; S
z
= 23.09 μm) and DRY07 (S
a
= 0.402 μm; S
z
= 15.48 μm), which display comparable morphology. However, for the HCA18 sample (S
a
= 0.394 μm; S
z
= 19.19 μm), in addition to a higher roughness amplitude, the feed marks highlighted in Figure 6 are observable. High amplitudes were also observed in the HCA05 sample (S
a
= 0.415 μm; S
z
= 20.39 μm), although, in this case, no feed marks were evident. 3D and 2D roughness profiles of the samples generated under optimized parameters and those with the best surface finishes from the initial runs.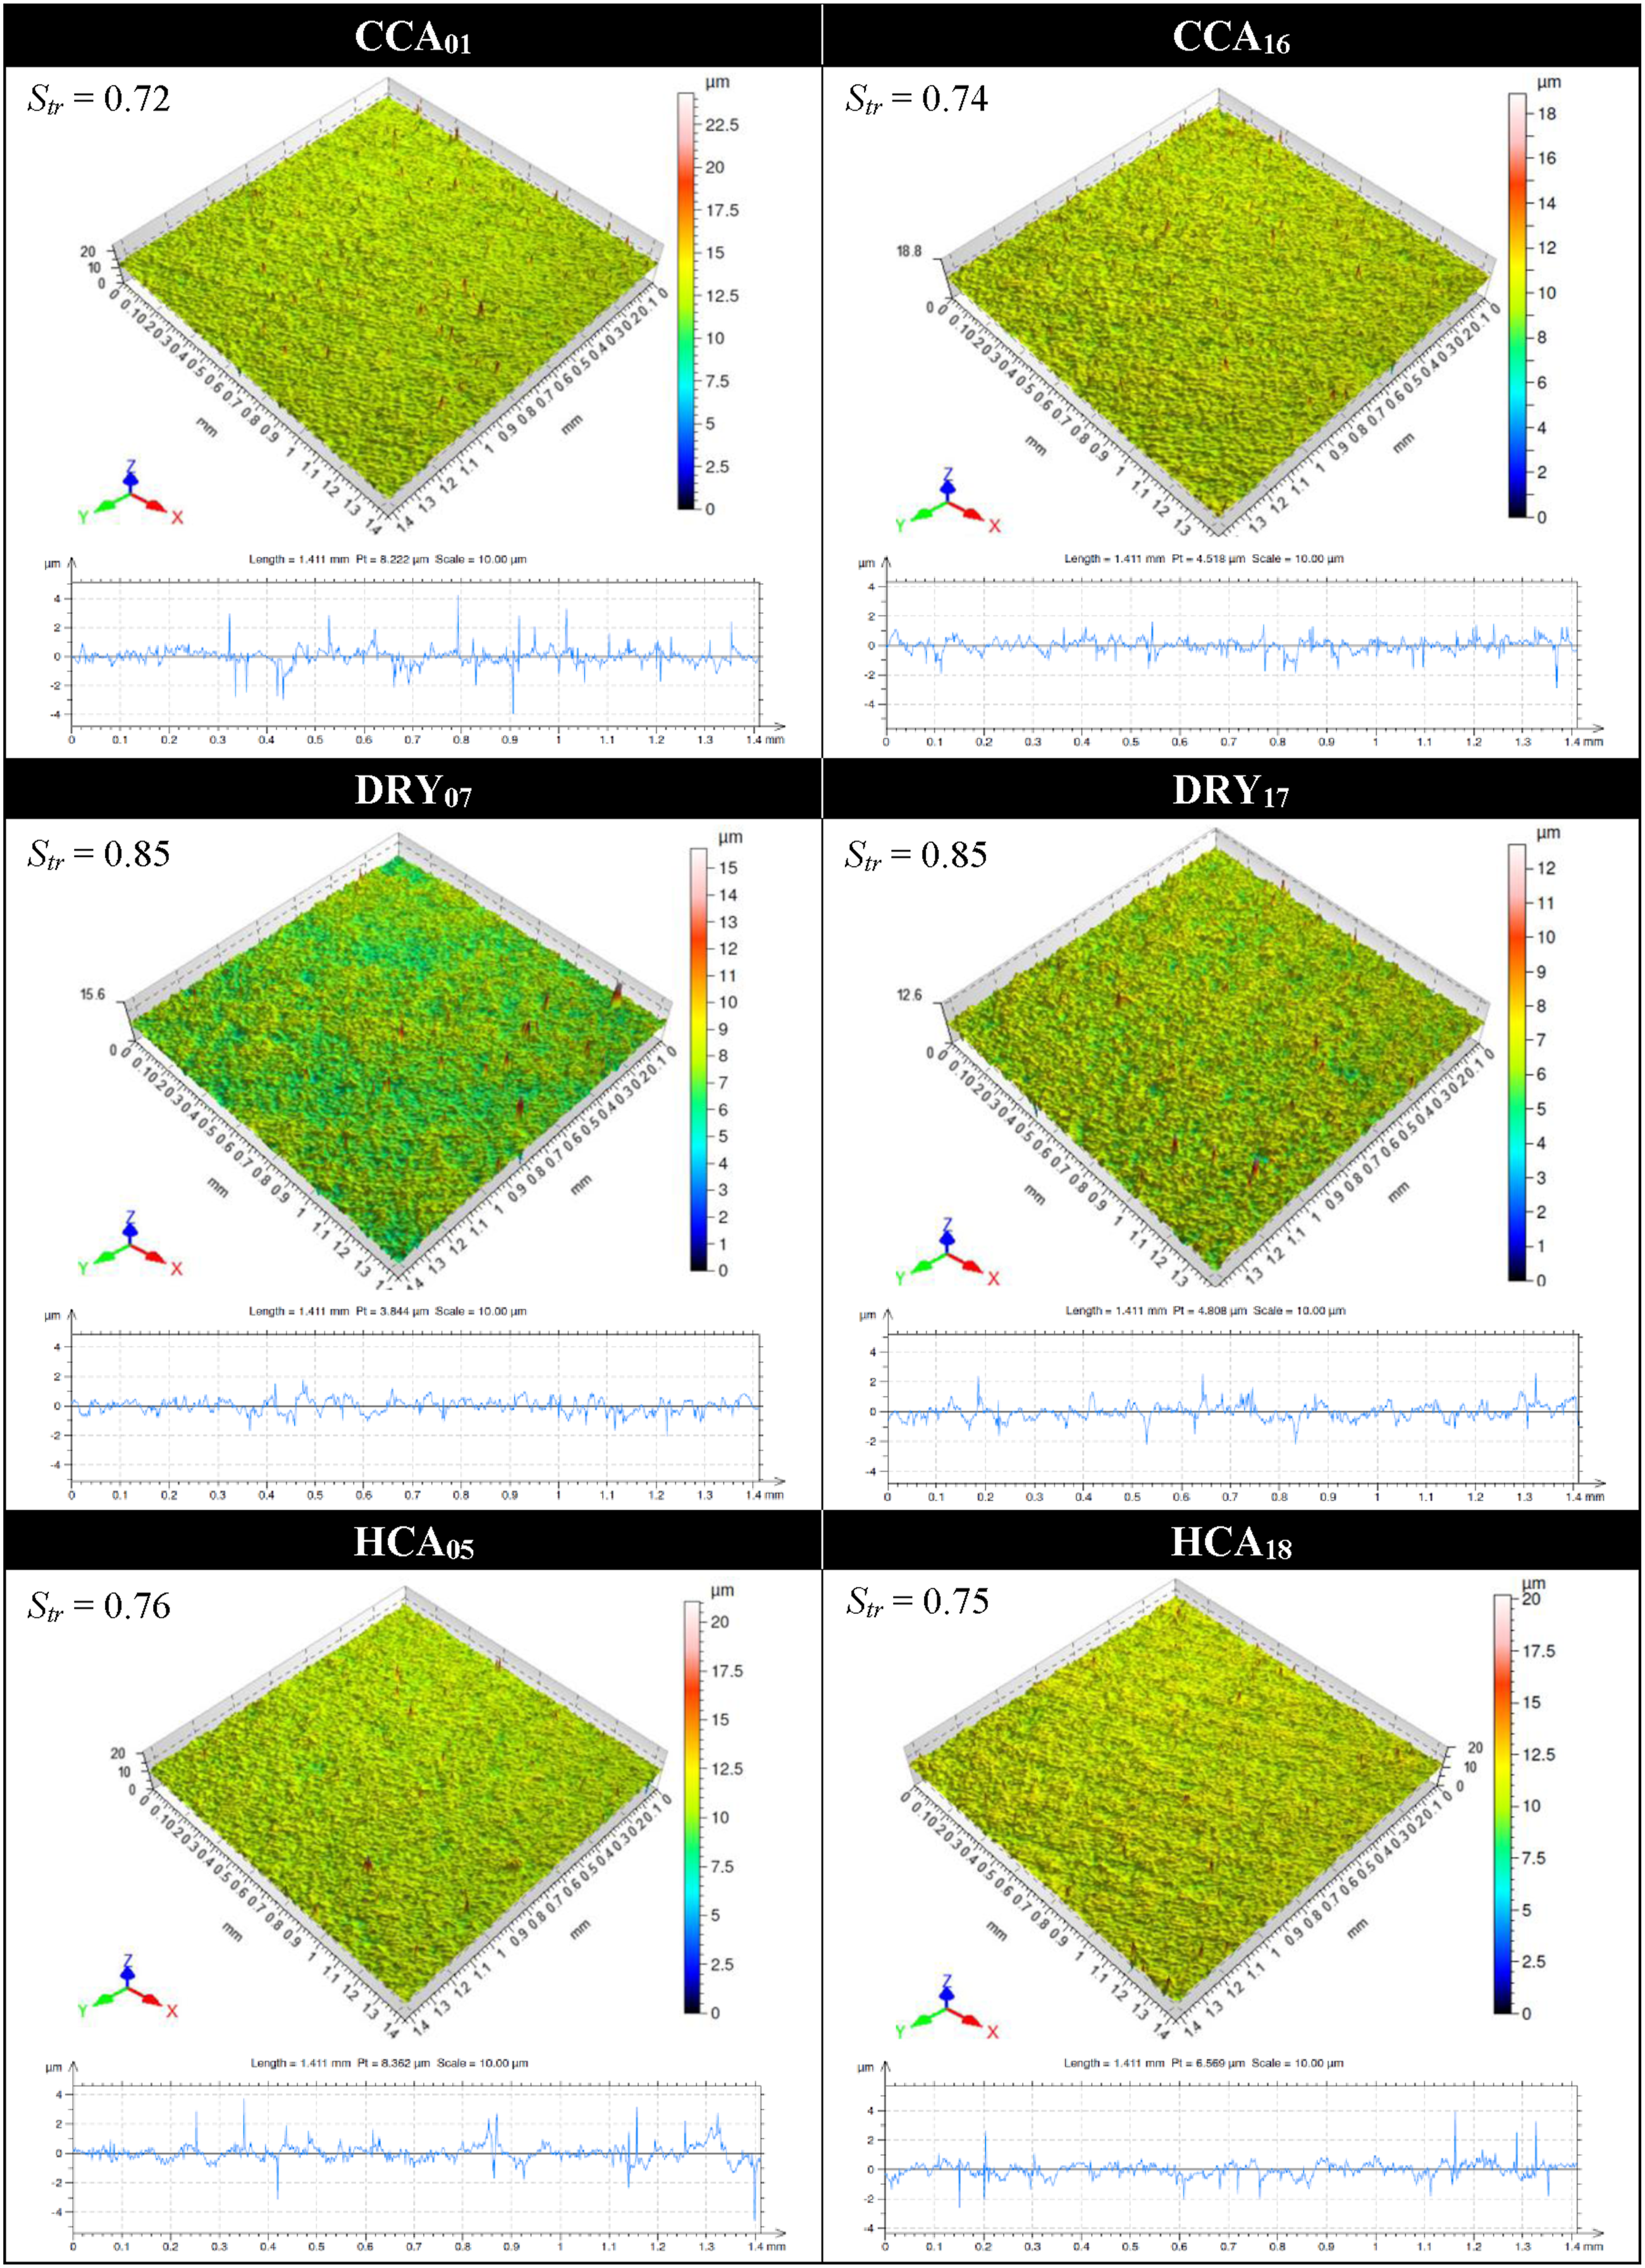
The S tr parameter denotes surface isotropy when its value exceeds 0.50. As cited previously, anisotropy in composites can induce surface flaws.10,11 It is known that unreinforced PEEK is isotropic, but adding aligned CF would make it anisotropic (the strength and stiffness of the composites depend on the fiber directions). The high dispersion of short fibers and the low incidence of structural defects may have contributed to the surface isotropy of this CF30-reinforced PEEK workpiece. Moreover, the values obtained for the optimized and the best-performing combinations were similar. The 2D profiles complement the analysis of the 3D surface. The optimized CCA16 sample exhibits a lower number of peaks and valleys than CCA01, leading to an improvement in the S tr parameter. The profiles of the DRY07 and DRY17 samples show a high degree of similarity, which is consistent with their identical S tr values. The HCA18 sample shows fewer peaks and valleys and a more uniform profile than HCA05. Overall, the 2D profiles are in good agreement with previously obtained results.
Thus, based on the surface quality characterization employing the S a parameter from the 3D roughness profile, it is evident that the optimization process yielded slightly better results than those observed in the best runs for each condition.
Conclusions
The study analyzed the influence of cooled compressed air (CCA) and heated compressed air (HCA) on the face milling of CF30-reinforced PEEK using a PCD tool, comparing these conditions with dry machining (DRY) and evaluating their effects on surface finish under different cutting conditions. The main conclusions are summarized as follows: (1) Sample CCA01 exhibited the lowest roughness values (R
a
= 0.317 μm and R
z
= 2.27 μm) among the 15 initial samples, indicating that cooled compressed air at a low v
c
reduced the cutting-zone temperature, limited thermal softening of the matrix, and preserved the surface integrity. (2) AFC and PDF confirmed a more homogeneous and stable roughness profile of sample CCA01, with fewer sharp peaks and shallower valleys than samples DRY07 and HCA05. (3) Multi-objective optimization identified CCA as the optimal thermal condition for minimizing R
a
and R
z
values with v
c
= 100 m/min, f
z
= 0.052 mm/tooth, and a
p
= 0.9 mm. Validation tests demonstrated accuracy for predicting roughness values (error ≈4%), providing good agreement with the experimental results. (4) SEM analyses confirmed that CCA01 achieved the best surface quality, with no smearing and only small voids. After optimization, the texture of sample CCA16 became more uniform than that of CCA01, while DRY and HCA conditions exhibited increasing feed marks and smearing. (5) 3D roughness analyses confirmed isotropic behavior of this composite under all better conditions. After optimization, CCA16 presented the lowest S
a
value (0.371 μm), DRY17 the lowest S
z
value (12.42 μm), and HCA18 the most irregular texture (highest roughness values).
Although cooled compressed air (CCA) improves surface quality, its industrial implementation should also consider the cost-benefit relationship, as the additional complexity of the cooling system may not always justify the cost compared to dry machining (DRY). In addition, the present study is limited to a short CF30-reinforced PEEK composite, a single cutting-tool material/geometry, and the absence of in situ temperature measurements. Future investigations should therefore include temperature and tool-condition monitoring, cooling strategies, and the assessment of different tool materials/geometries to establish performance-productivity trade-offs better and support broader industrial applications.
Supplemental material
Supplemental Material - Influence of cooled and heated compressed air on the surface finish in face milling of CF30-reinforced PEEK
Supplemental Material for Influence of cooled and heated compressed air on the surface finish in face milling of CF30-reinforced PEEK by Fernando Pasquali, Carlos A. G. Aita, André J. Souza, and Milton L. Polli in Journal of Thermoplastic Composite Materials
Footnotes
Author’s note
This manuscript is original and has not been submitted for publication elsewhere. The manuscript has no associated data from any data repository.
Acknowledgements
The authors thank Ensinger® Co. for the donation of PEEK/CF30 workpiece, Sandvik Coromant Co. for the donation of PCD milling inserts, Minitab® 22 for the trail test license for statistical analysis, Multiuser Center for Materials Characterization (CMCM/UTFPR) for the 3D roughness analysis and the Federal Institute of Santa Catarina (Process No. 23292.030882/2022-26) for granting leaves for study.
Author contributions
Each author contributed to the research presented in this manuscript, approved the contents, and agreed to comply with the ethical standards.
Declaration of conflicting interests
The authors declared no potential conflicts of interest with respect to the research, authorship, and/or publication of this article.
Funding
The authors received no financial support for the research, authorship, and/or publication of this article.
Supplemental material
Supplemental material for this article is available online.
References
Supplementary Material
Please find the following supplemental material available below.
For Open Access articles published under a Creative Commons License, all supplemental material carries the same license as the article it is associated with.
For non-Open Access articles published, all supplemental material carries a non-exclusive license, and permission requests for re-use of supplemental material or any part of supplemental material shall be sent directly to the copyright owner as specified in the copyright notice associated with the article.