
Abstract
This study presents an efficient methodology for generating random fiber distribution structures capable of accommodating a wide range of volume fractions. The proposed approach, an enhancement over the conventional random distribution particle swarm optimization (RDPSO) method, integrates particle swarm optimization (PSO) for initial fiber placement within a defined window, hard-core scattering to fill matrix-rich regions, and controlled random fiber deletion to obtain the representative volume element (RVE). This comprehensive procedure is termed random deletion after fiber-filling particle swarm optimization (RDAFF_PSO). The spatial statistical properties of the generated fiber distributions were rigorously evaluated and compared against those produced by RDPSO, a completely spatial randomness (CSR) pattern, and experimental data. The results demonstrate the superior performance of RDAFF_PSO in generating realistic fiber distributions. Furthermore, the elastic properties of carbon fiber-reinforced plastic (CFRP) composites were predicted using RVE models generated via the RDAFF_PSO method. The predicted mechanical properties exhibit strong agreement with experimental measurements, validating the efficacy of this approach for estimating the mechanical constants of unidirectional fiber-reinforced composites and facilitating multiscale analysis.
Keywords
Introduction
Representative volume elements (RVE) have been extensively employed to predict the elastic properties of fiber-reinforced composites comprising two-component materials. 1 Key factors such as the intrinsic properties of the matrix and fiber-matrix interface,2,3 void defects, 4 thermal residual stresses, 5 and other are also incorporated into the prediction of the mechanical behavior of the composites,6,7 including the fracture mechanics. 8 RVE are commonly utilized in the simulation of interface failures 9 and in multiscale analysis of structures subject to various loading conditions.10–14 In recent years, physics-based machine learning methods have achieved significant progress in multiscale composite analysis, which requires extensive material data from RVE simulations to train artificial intelligence (AI) models. Wei et al. 15 proposed a physics-embedded machine learning model called deep material network (DMN), which learns the microstructural morphologies of composite RVE through offline training and predicts nonlinear behaviors during online simulations. By coupling DMN with the finite element software LS-DYNA, they achieved rapid nonlinear multiscale modeling from microscopic materials to macroscopic structures. Maurya et al.16,17 integrated RVE with a multiscale point cloud approach and subsequently developed a novel failure criterion to enhance the modeling of orthotropic composite structures under both quasi-static and impact loading conditions. Microscopic (constituent-level) structural conditions, such as the properties of the constituent materials and the spatial distribution of the inclusions, strongly influence the interactions between constituents and, ultimately, the mechanical properties of the macroscopic structure (structural-level). 1
Therefore, RVE that account for the random distribution of fibers in the prediction of elastic properties and fracture behavior have become a popular approach in this field. In recent years, researchers have proposed various algorithms for generating RVE with random fiber distributions, achieving satisfactory results in the prediction of the composite elastic properties.18–21 Early algorithmic efforts included the development of a hard-core model, which assumed that fibers could not collide with each other. However, this model was limited by its inability to achieve fiber volume fractions greater than approximately 50%, 22 making it unsuitable for applications requiring high fiber content (50%–65%). 1 In light of this, scholars have proposed noval algorithms to generate randomly distributed structures with high-content volume fractions of fibers to increase the content.
Among the proposed algorithms, some necessitated intricate fiber stirring processes
20
while others relied on a combination of experimental image-numerical approach,
21
which required advanced software and hardware resources. Among these methods, the most effective algorithms were the random distribution particle swarm optimization (RDPSO),
19
random sequential expansion (RSE),
18
and so forth, which demonstrated excellent performance without excessive computational complexity or resource demand. Although the underlying principles of these algorithms differ, the process of generating RVE share common features: an initial fiber is generated in the window and used as the target fiber to generate the second. This process continues iteratively until no additional fibers can be placed near the existing ones. This process continues iteratively until no additional fibers can be placed near the existing ones. The fiber generation process of this algorithm was shown to be very similar to “circling” behavior, so it was called the “circling” algorithm figuratively. Its fiber generation schematic is shown in Figure 1.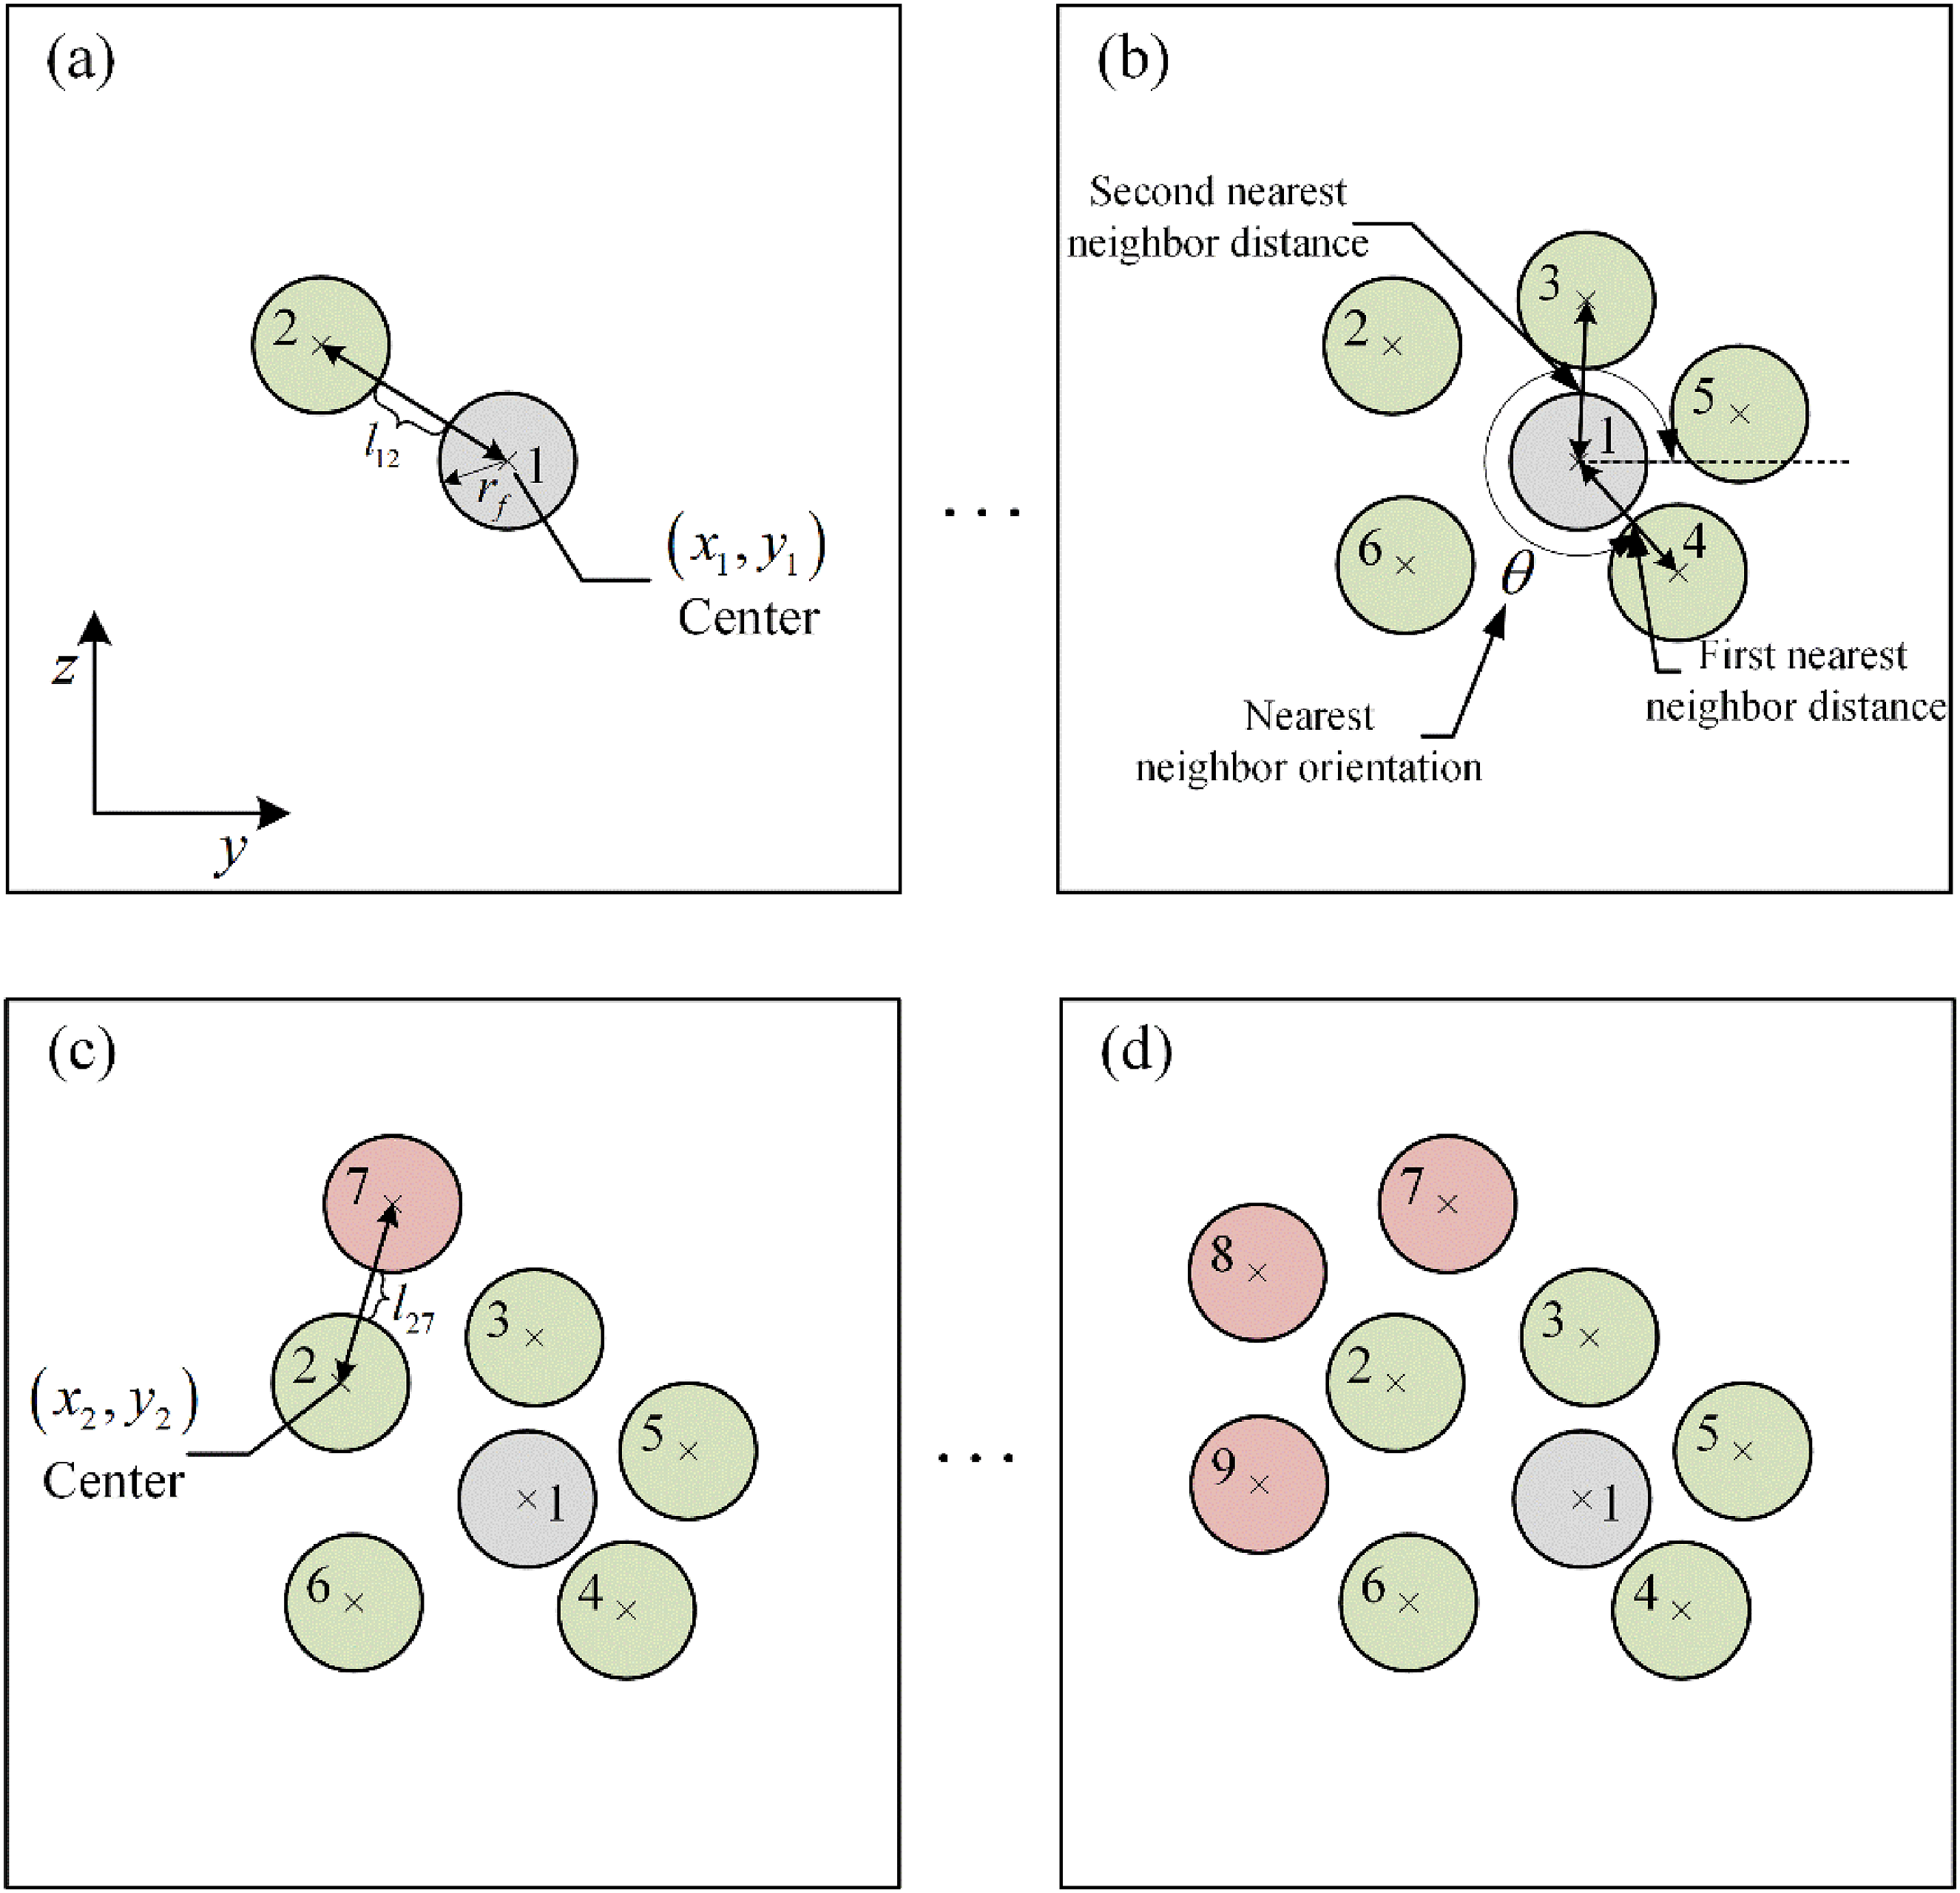
However, these algorithms have notable limitations. Taking the RDPSO for example, since the fibers were generated in the form of “circling”, the generated RVE have large, dense fiber cluster within the window in the absence of interference, leading to the formation of matrix-rich region, as shown in Figure 2(a). As a result, the whole structure lost its randomness and could not reflect the real fiber distribution. To mitigate this issue, Liu et al.
19
proposed the idea of fiber jumping, in which a fiber jumped out of the large cluster and was generated in the matrix-rich region under specific conditions, reducing the clustering effect. While this innovation provided a valuable improvement, it exhibited two drawbacks. First, the method heavily depends on fiber spacing; when the fiber spacing was too small, a large cluster accompanied by multiple small clusters was easily formed, as shown in Figure 2(b). Second, the approach struggles to generate RVE with high-content volume fractions. If the distance between the jumped fiber and nearest fiber was (a) Large cluster phenomenon easily formed by the “circling” algorithm; (b) multicluster phenomenon easily formed by the method proposed by Liu et al.
19
after improvement.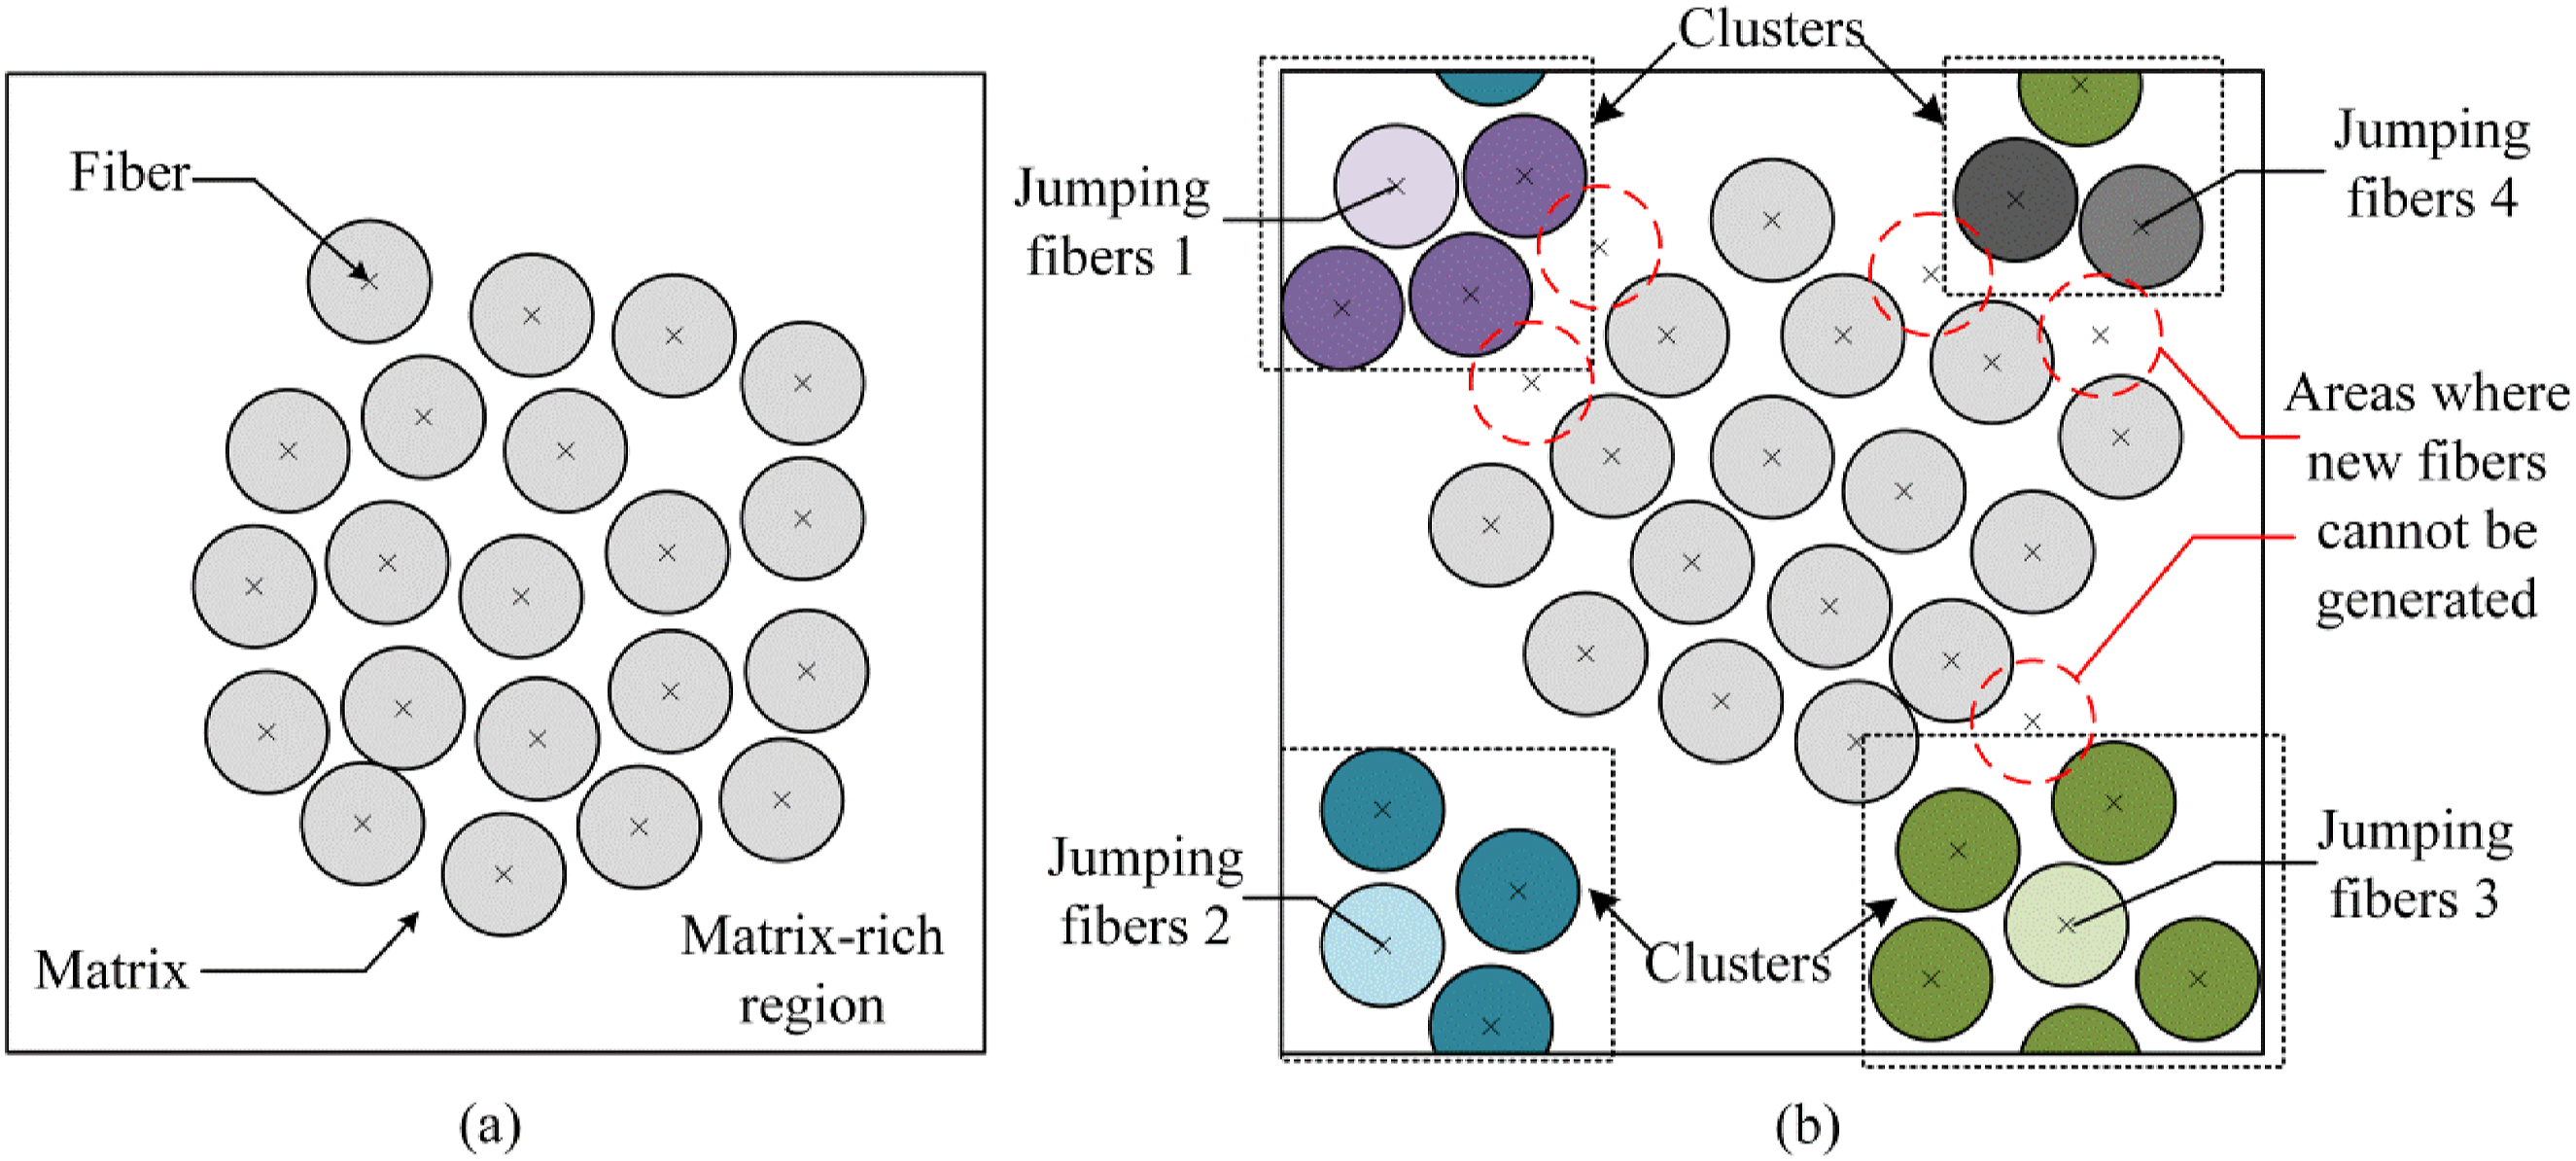
To address the aforementioned limitations of RDPSO, this study introduces a novel methodology for generating RVE across a wide range of fiber volume fractions. The new method provides a solution to the inherent challenges of the “circling” algorithm. The method incorporates PSO to randomly generate the initial fiber distribution, fill the blank region (matrix-rich region), and randomly removes fibers to achieve the desired volume fraction. This process effectively mitigates clustering, enhances the uniformity of fiber distribution, and improves the algorithm’s capability to produce RVE with high fiber content.
Descriptions of the RDAFF_PSO method
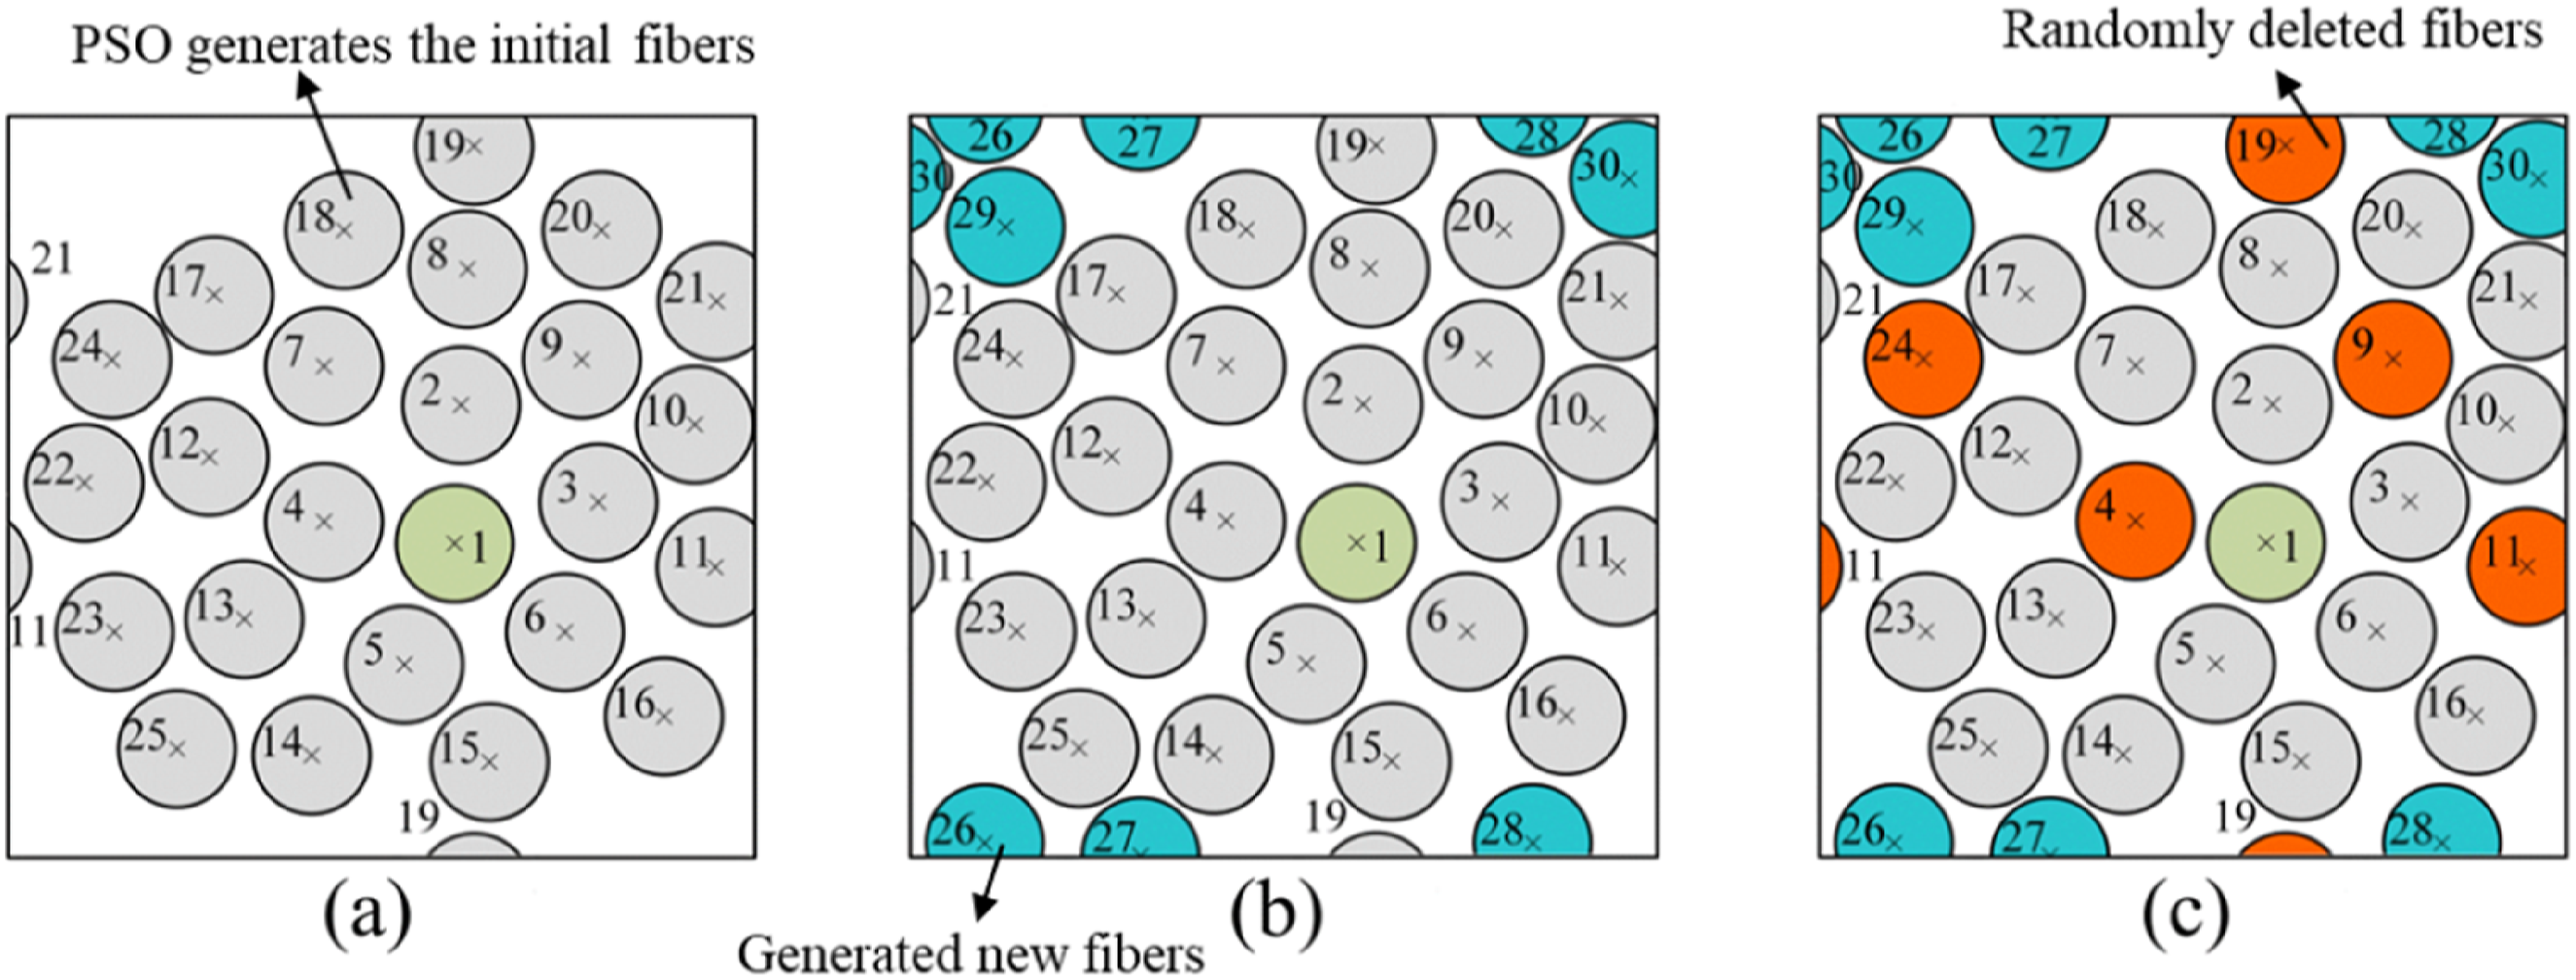
The RDAFF_PSO method consists of three main steps (Figure 3): (a) The PSO algorithm was employed to generate initial fiber distributions; (b) Matrix-rich region retrieval is performed on the whole region, and new fibers are generated within these regions using the hard-core model to eliminate the large matrix-rich areas; (c) Fibers are randomly removed to the desired volume fraction. Schematic diagram of the three main steps (a)–(c) of the RDAFF_PSO method.
PSO algorithm for the initial fibers generation
The PSO algorithm, first proposed by Kennedy and Eberhart, 23 is a widely adopted group intelligence optimization technique. It mimics the cooperative behavior observed in animal groups, such as flocks of birds, and operates as a stochastic search algorithm based on collective collaboration.19,23 Both PSO algorithms and genetic algorithms are essentially heuristic search algorithms, 24 which locate the optimal solution by iteratively adjusting the particle positions in the search space. In this study, a particle population size of 20 and a dimension size of 2 were chosen, following the guidelines from relevant literature. 19
The PSO algorithm has three main parameters of position,


Equation (1) describes the velocity update, which is then in equation (2) to compute the new position. Here
The initial fibers for the first step of the RDAFF_PSO were generated using the RDPSO approach proposed by Liu et al.
19
The following fitness function was employed for optimizing fiber spacing
19
:
Search and filling of matrix-rich regions
To search the matrix-rich region for the whole domain, a 15 µm × 15 µm search bar was employed. The search bar was moved horizontally in 10 µm increments and vertically in 15 µm increments.
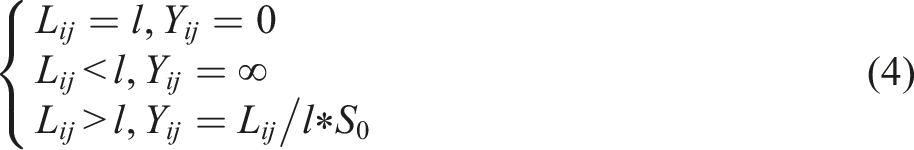
If the fiber volume fraction in the search bar was below the required level, up to 700 attempts were made to generate new fibers based on the hard-core model. The fibers were generated under two constraints: They should not intersect with other fibers; Periodic boundary conditions (PBC) were maintained. Until the whole window retrieval was finished, no large matrix-rich region existed in the window area and the fibers filled the whole window. A schematic diagram is shown in Figure 4. Schematic diagram of the fiber-filling process.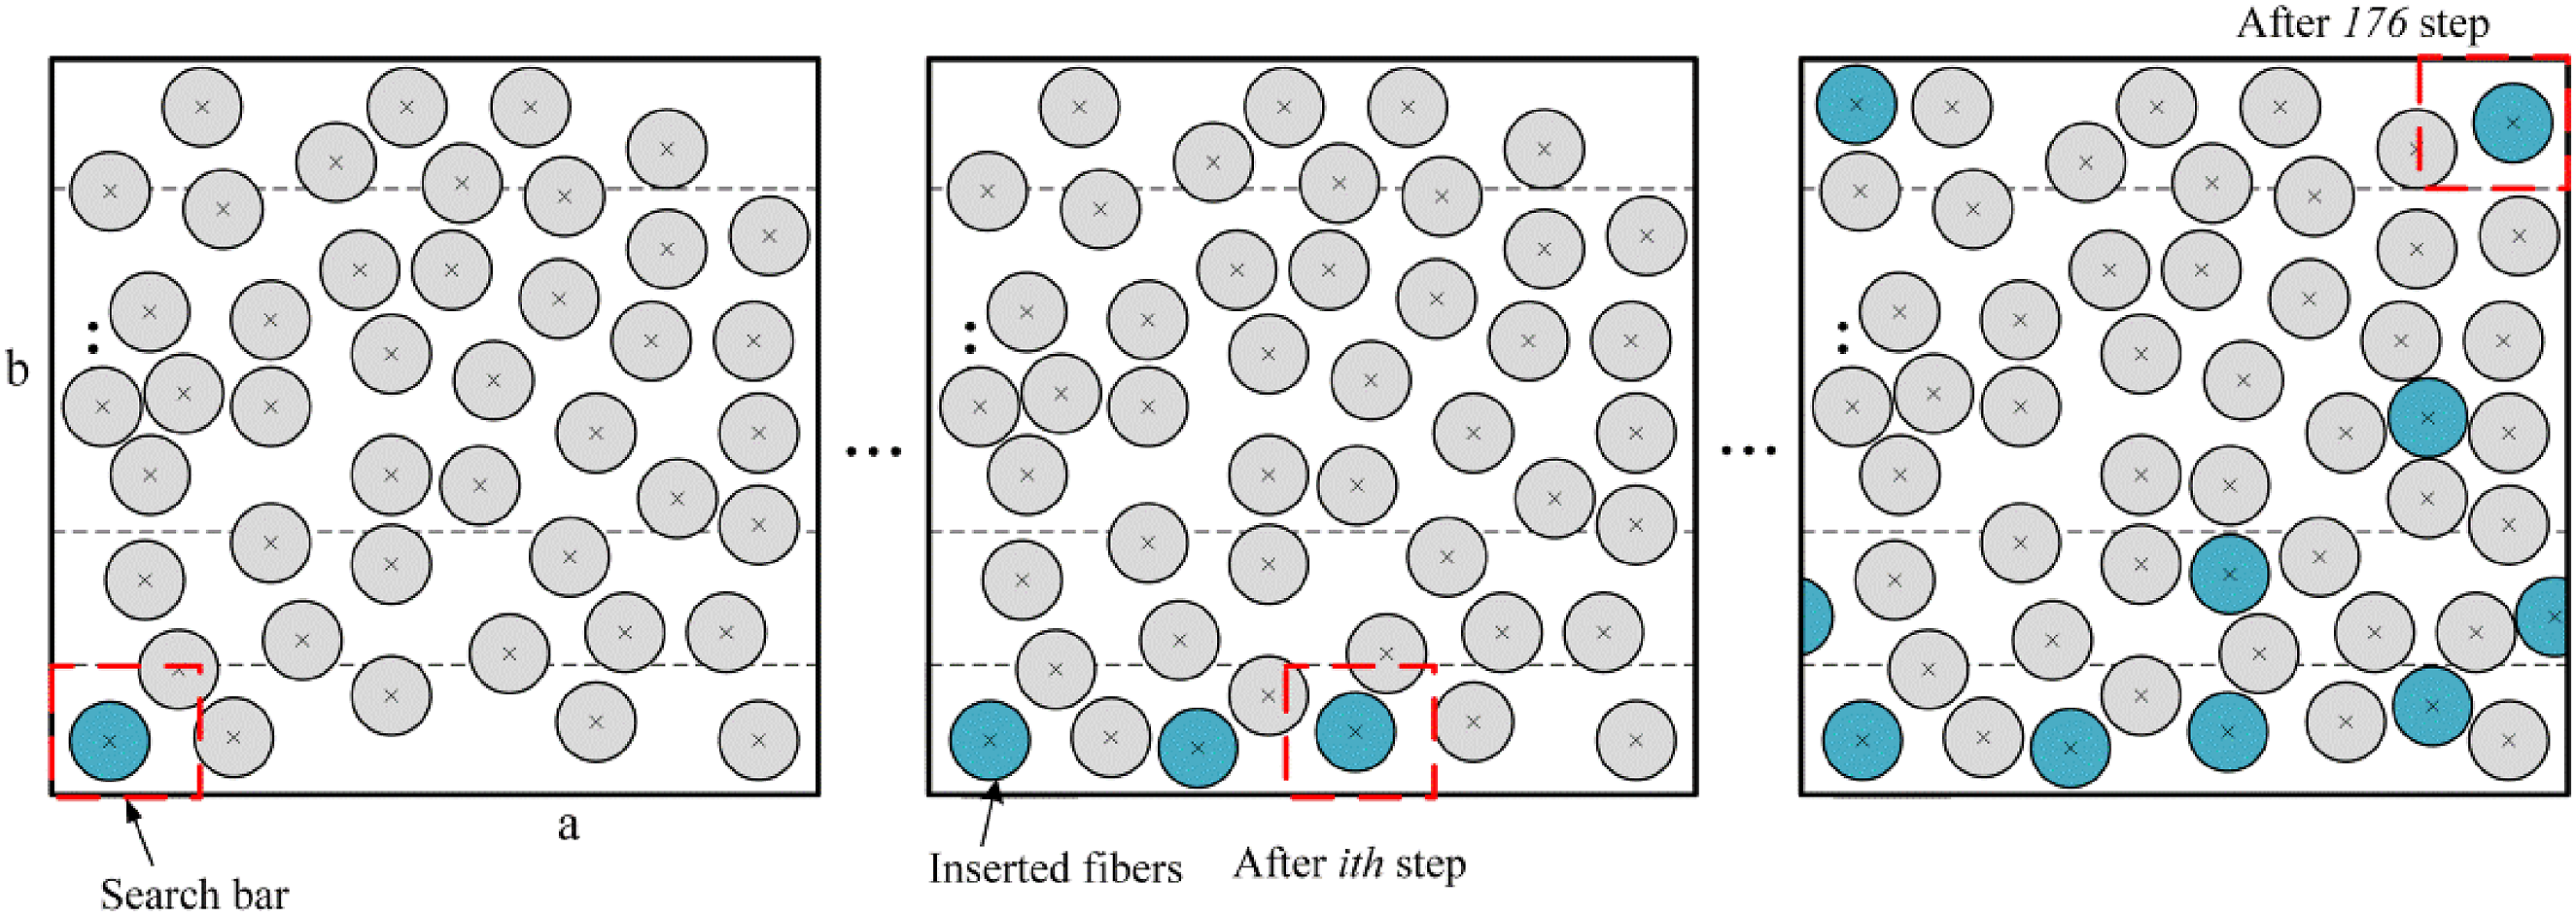
Random deletion of the fiber contents
Once the matrix-rich regions were addressed, the central coordinates of the fibers in the whole area were classified, as shown in Figure 5. Fibers were then randomly deleted while ensuring PBC compliance. The deletion process ended once the desired fiber volume fraction was achieved. Division area for fiber random deletion.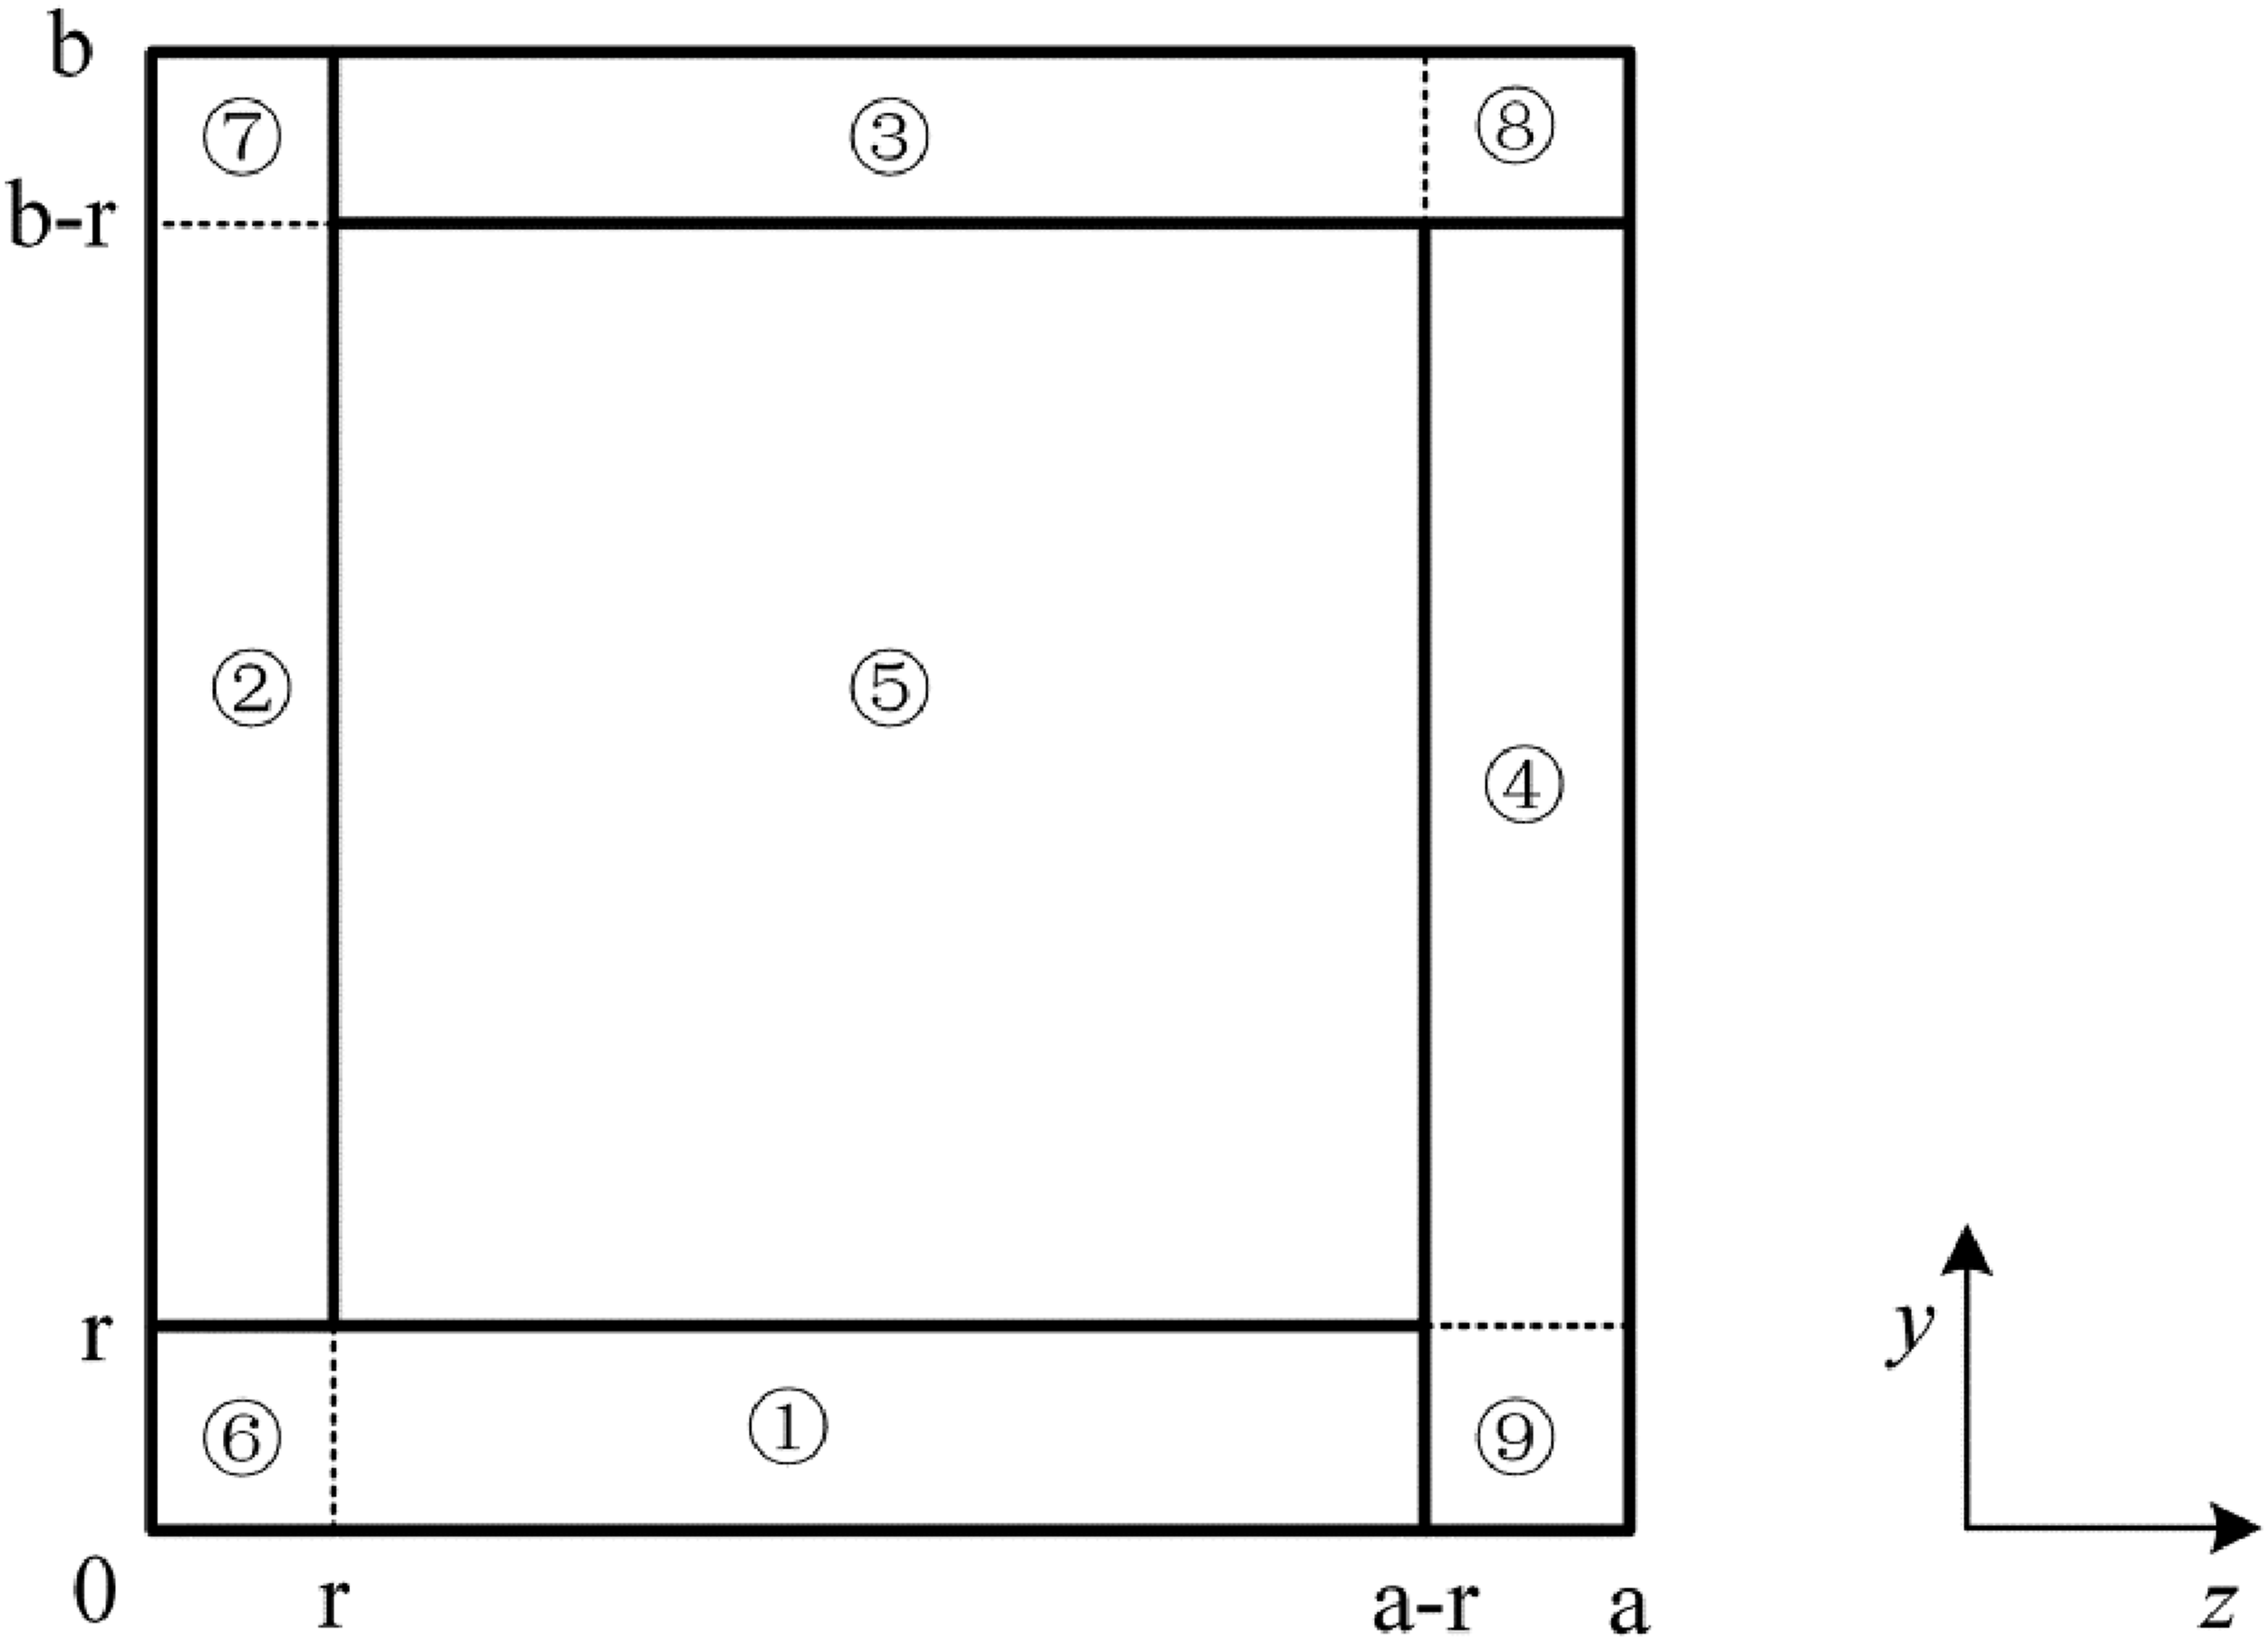
Generation of random fibers by RDAFF_PSO
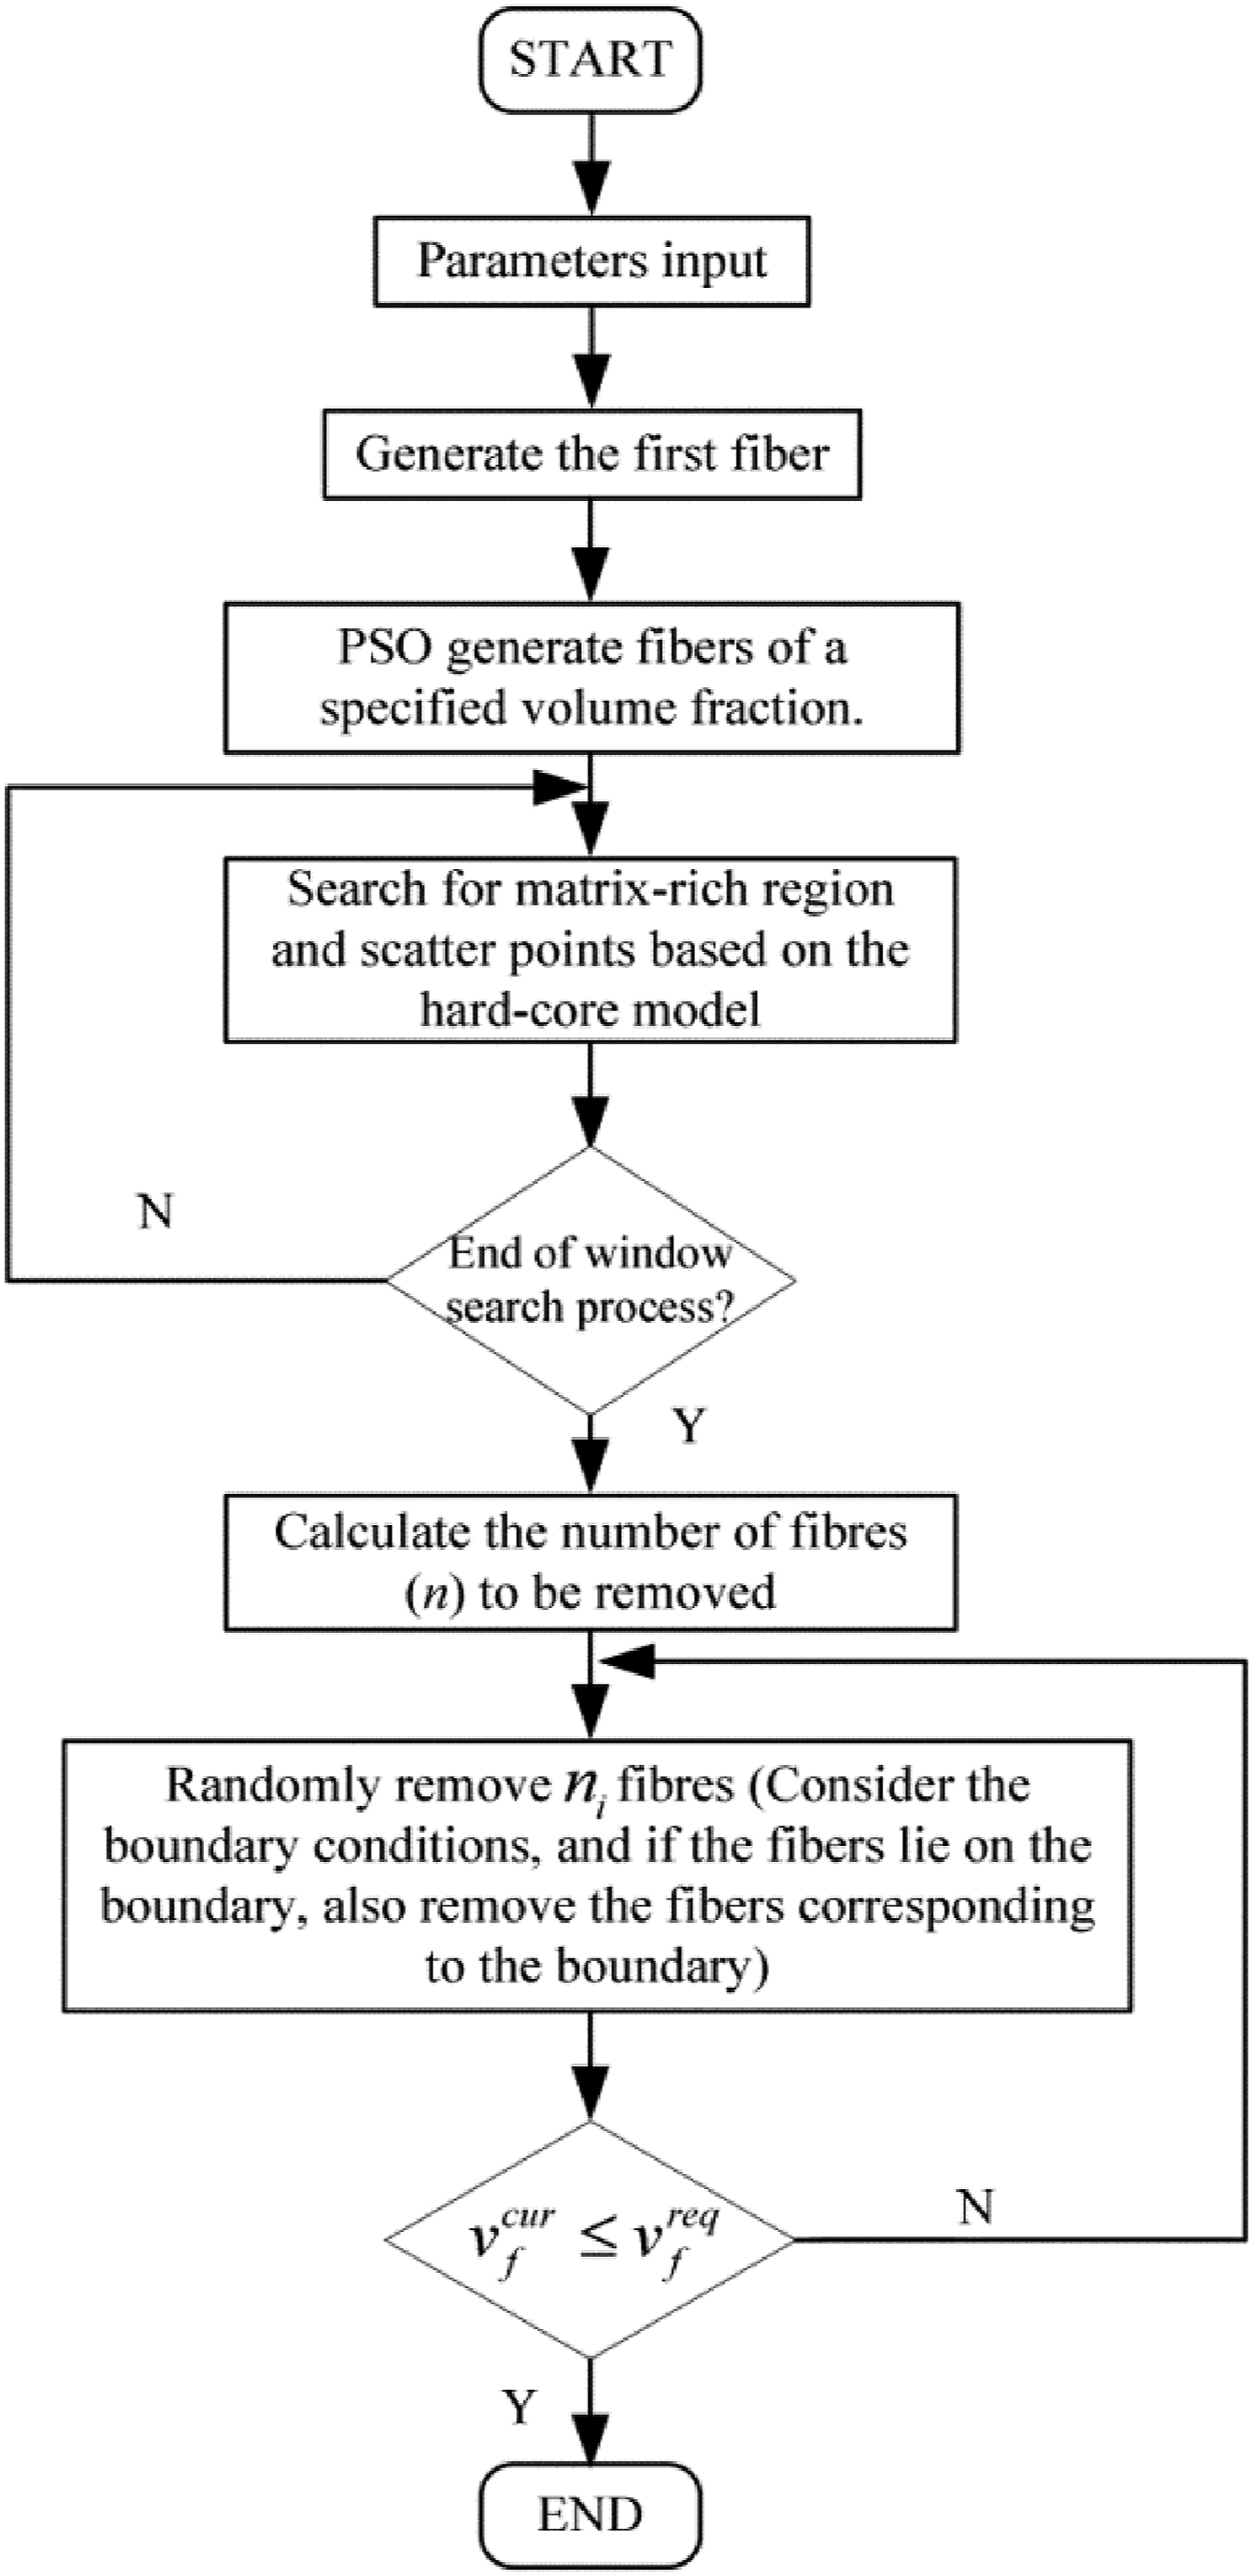
The flowchart of RDAFF_PSO method is shown in Figure 6. The procedure is as follows: (1) The first fiber (2) The coordinates of the second point (3) Steps 1 and 2 were repeated until no further fibers could be generated around the initial fiber. The second fiber was taken as the center, and (4) The matrix-rich regions were searched for in the window region, and new fibers were added using the hard-core model. (The hard-core model refers to randomly generating fiber coordinates (x, y) within the RVE region. Both the abscissa x and ordinate y are generated randomly using Python’s ‘random’ function library.) (5) The fibers in the window area were randomly deleted until the fiber volume fraction was met. The algorithm then ended. Flowchart of the RDAFF_PSO method.
The codes of the generation algorithm were implemented in Python. When the fiber spacing was set to an almost tangential fiber spacing (0, 0.01), an RVE with a maximum fiber content of 66.9787% could be generated, meeting the requirements for most fiber volume fraction scenarios. Taking the commonly used three volume fractions of 50%, 60%, and 65% as an example, the fiber spacings were set to (1.5, 2), (0, 1.45), and (0, 0.2), respectively. The process and results of RVE generation at the three volume fractions are shown in Figure 7. RVE generation process for three fiber volume fractions: (a) 50%, (b) 60%, (c) 65%. S1: Generate fibers by PSO; S2: Insert fibers by Hard-model; S3: Random removal of fibers.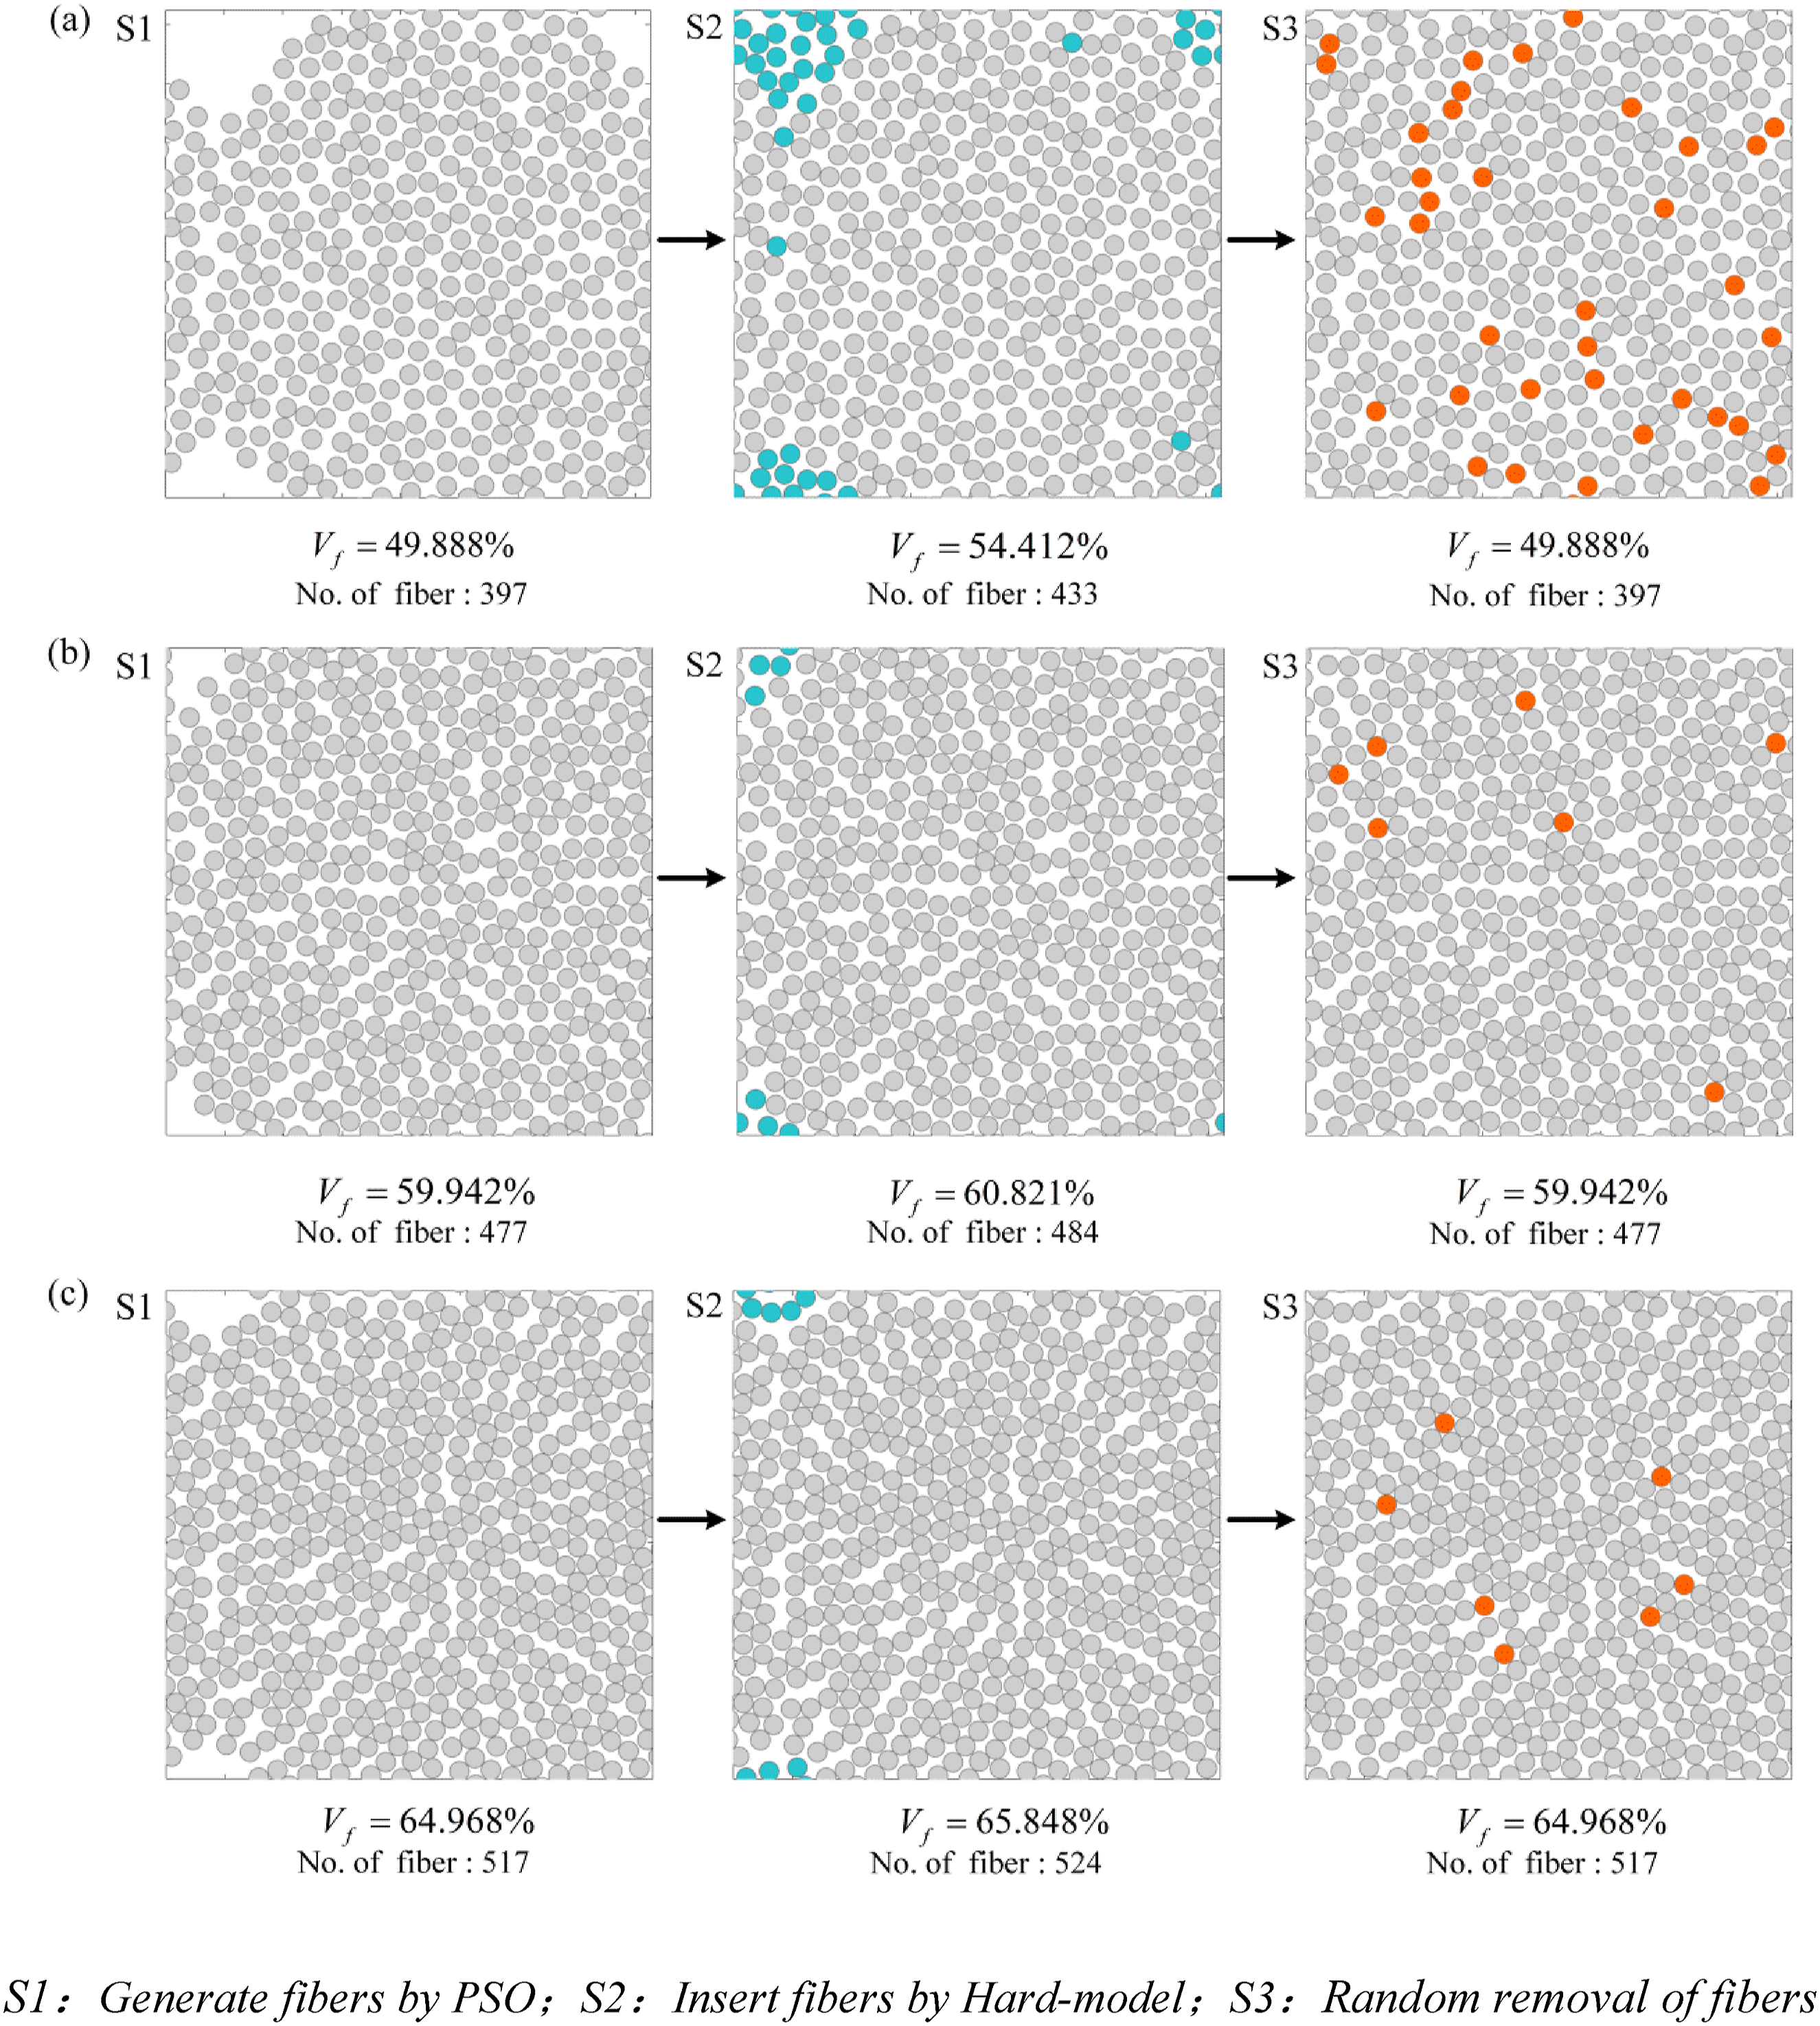
Comparison of computation times between RDPSO and RDAFF_PSO
Computational time of the two algorithms.
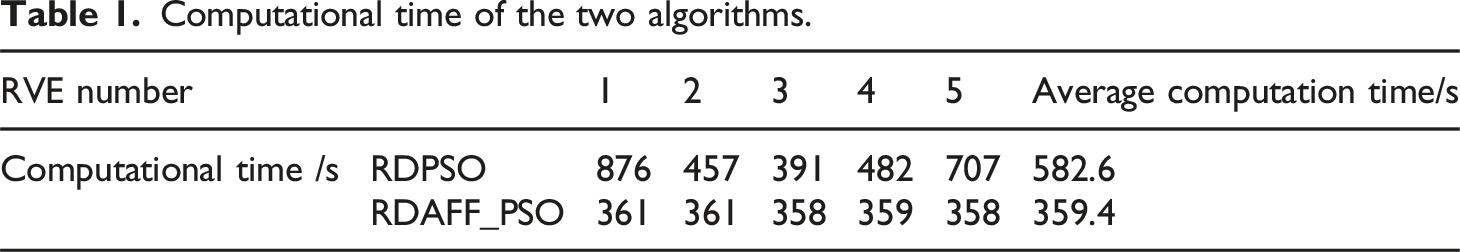
Statistical analysis further reveals that the RDPSO algorithm encounters generation failures when processing RVEs with fiber volume fractions exceeding 60%. The failure rate exhibits a progressive increase with higher volume fractions, as previously explained in Figure 2. In contrast, RDAFF_PSO maintains robust performance across all volume fractions. This superior reliability stems from its unique algorithmic structure: the target volume fraction is achieved in the step 1, while subsequent steps (Step 2 and Step 3) solely focus on optimizing fiber distribution randomness, as illustrated in Figure 7.
Statistical analysis of the generated fibers
The validity of the random fiber distribution algorithm primarily depends on assessing its randomness. In this study, four statistical properties were evaluated to quantify randomness: nearest neighbor distance, nearest neighbor direction, Ripley’s K-function, and pair distribution function. These properties were used to compare the fiber distributions generated by RDAFF_PSO with those of the RDPSO, experiment, 21 and completely spatial randomness (CSR) , thereby verifying the rationality of RDAFF_PSO.
The RVE dimensions were chosen to ensure a sufficiently large representation of the material’s overall distribution. Following Trias et al.,
26
the parameter δ was set to a minimum of 50 when the fiber volume fraction of the unidirectional fiber-reinforced composite was 50%,. Accordingly, the RVE dimensions in this study were taken as δ = 50,
Nearest neighbor distance
The nearest neighbor distance function describes the probability density of the distance between a target fiber and its closest neighboring fiber (as shown in Figure 1(b)). This measure captures short-range fiber interactions, such as clustering tendencies in the spatial distribution.
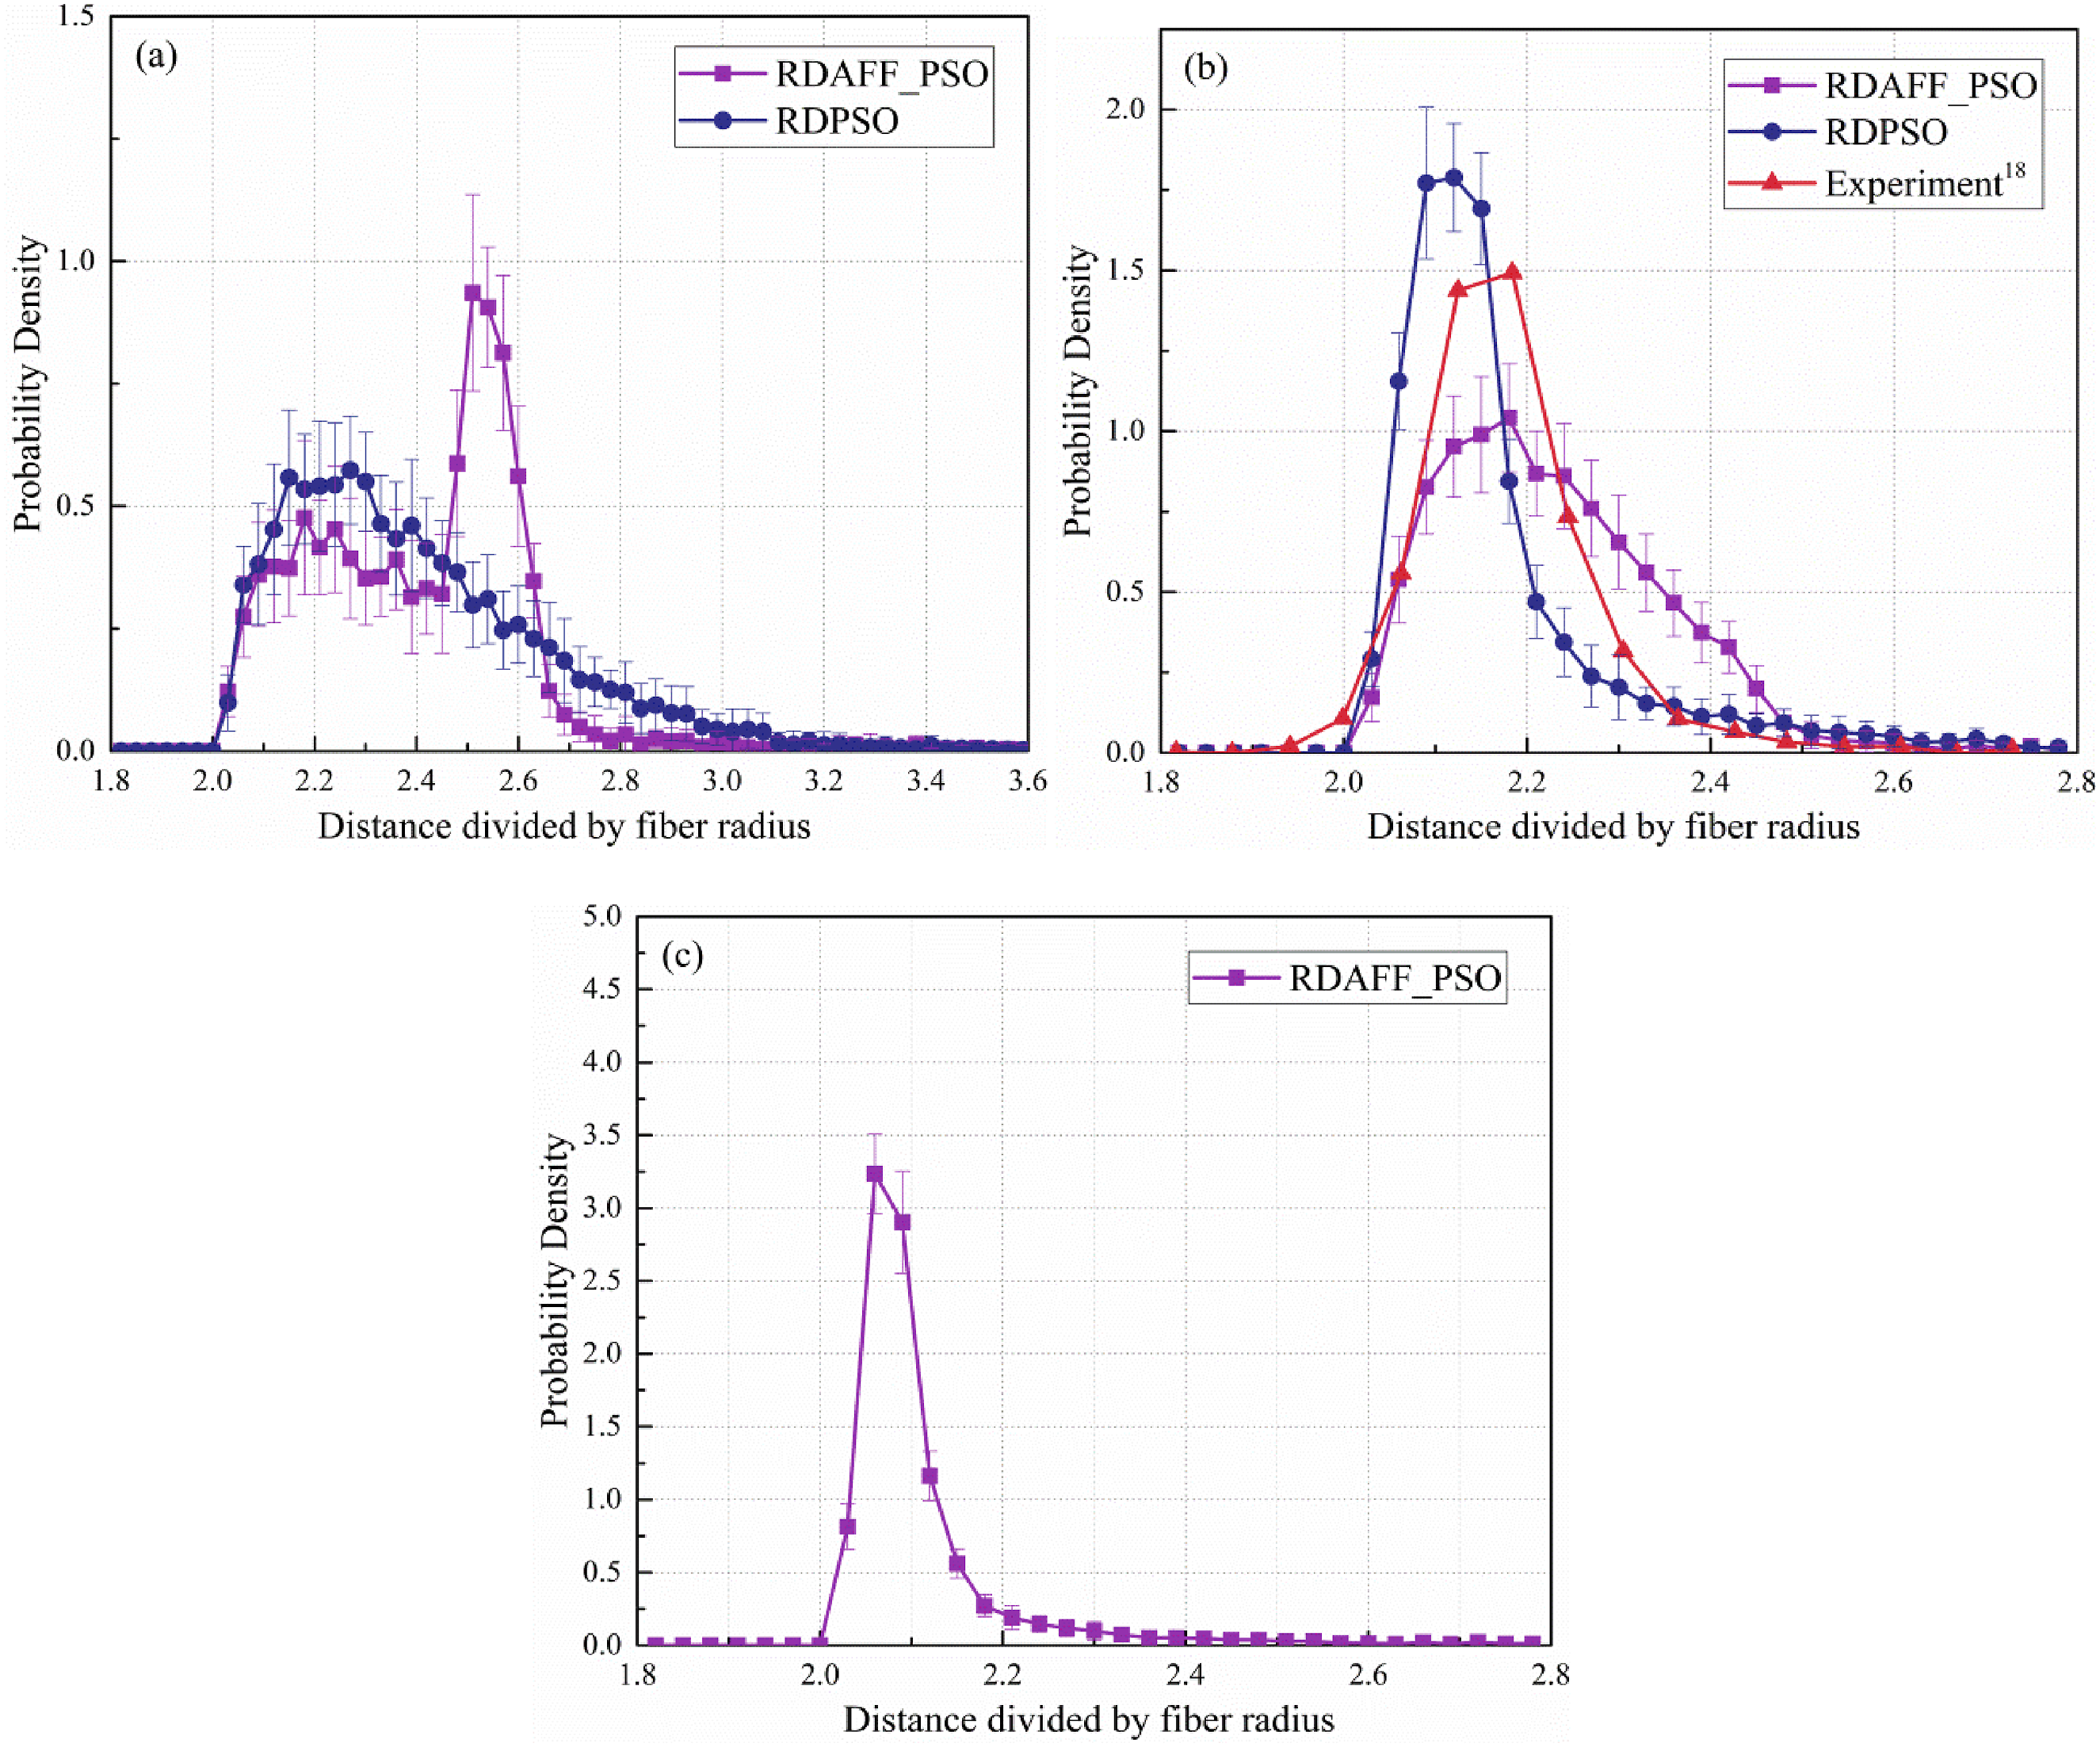
Figure 8 shows that the curves of RDAFF_PSO and RDPSO increase sharply when the fiber center distance between the two nearest neighbors exceeds 2 Nearest neighbor distance probability density function: (a) 50%; (b) 60%; (c) 65%. Second nearest neighbor distance probability density function: (a) 50%; (b) 60%; (c) 65%.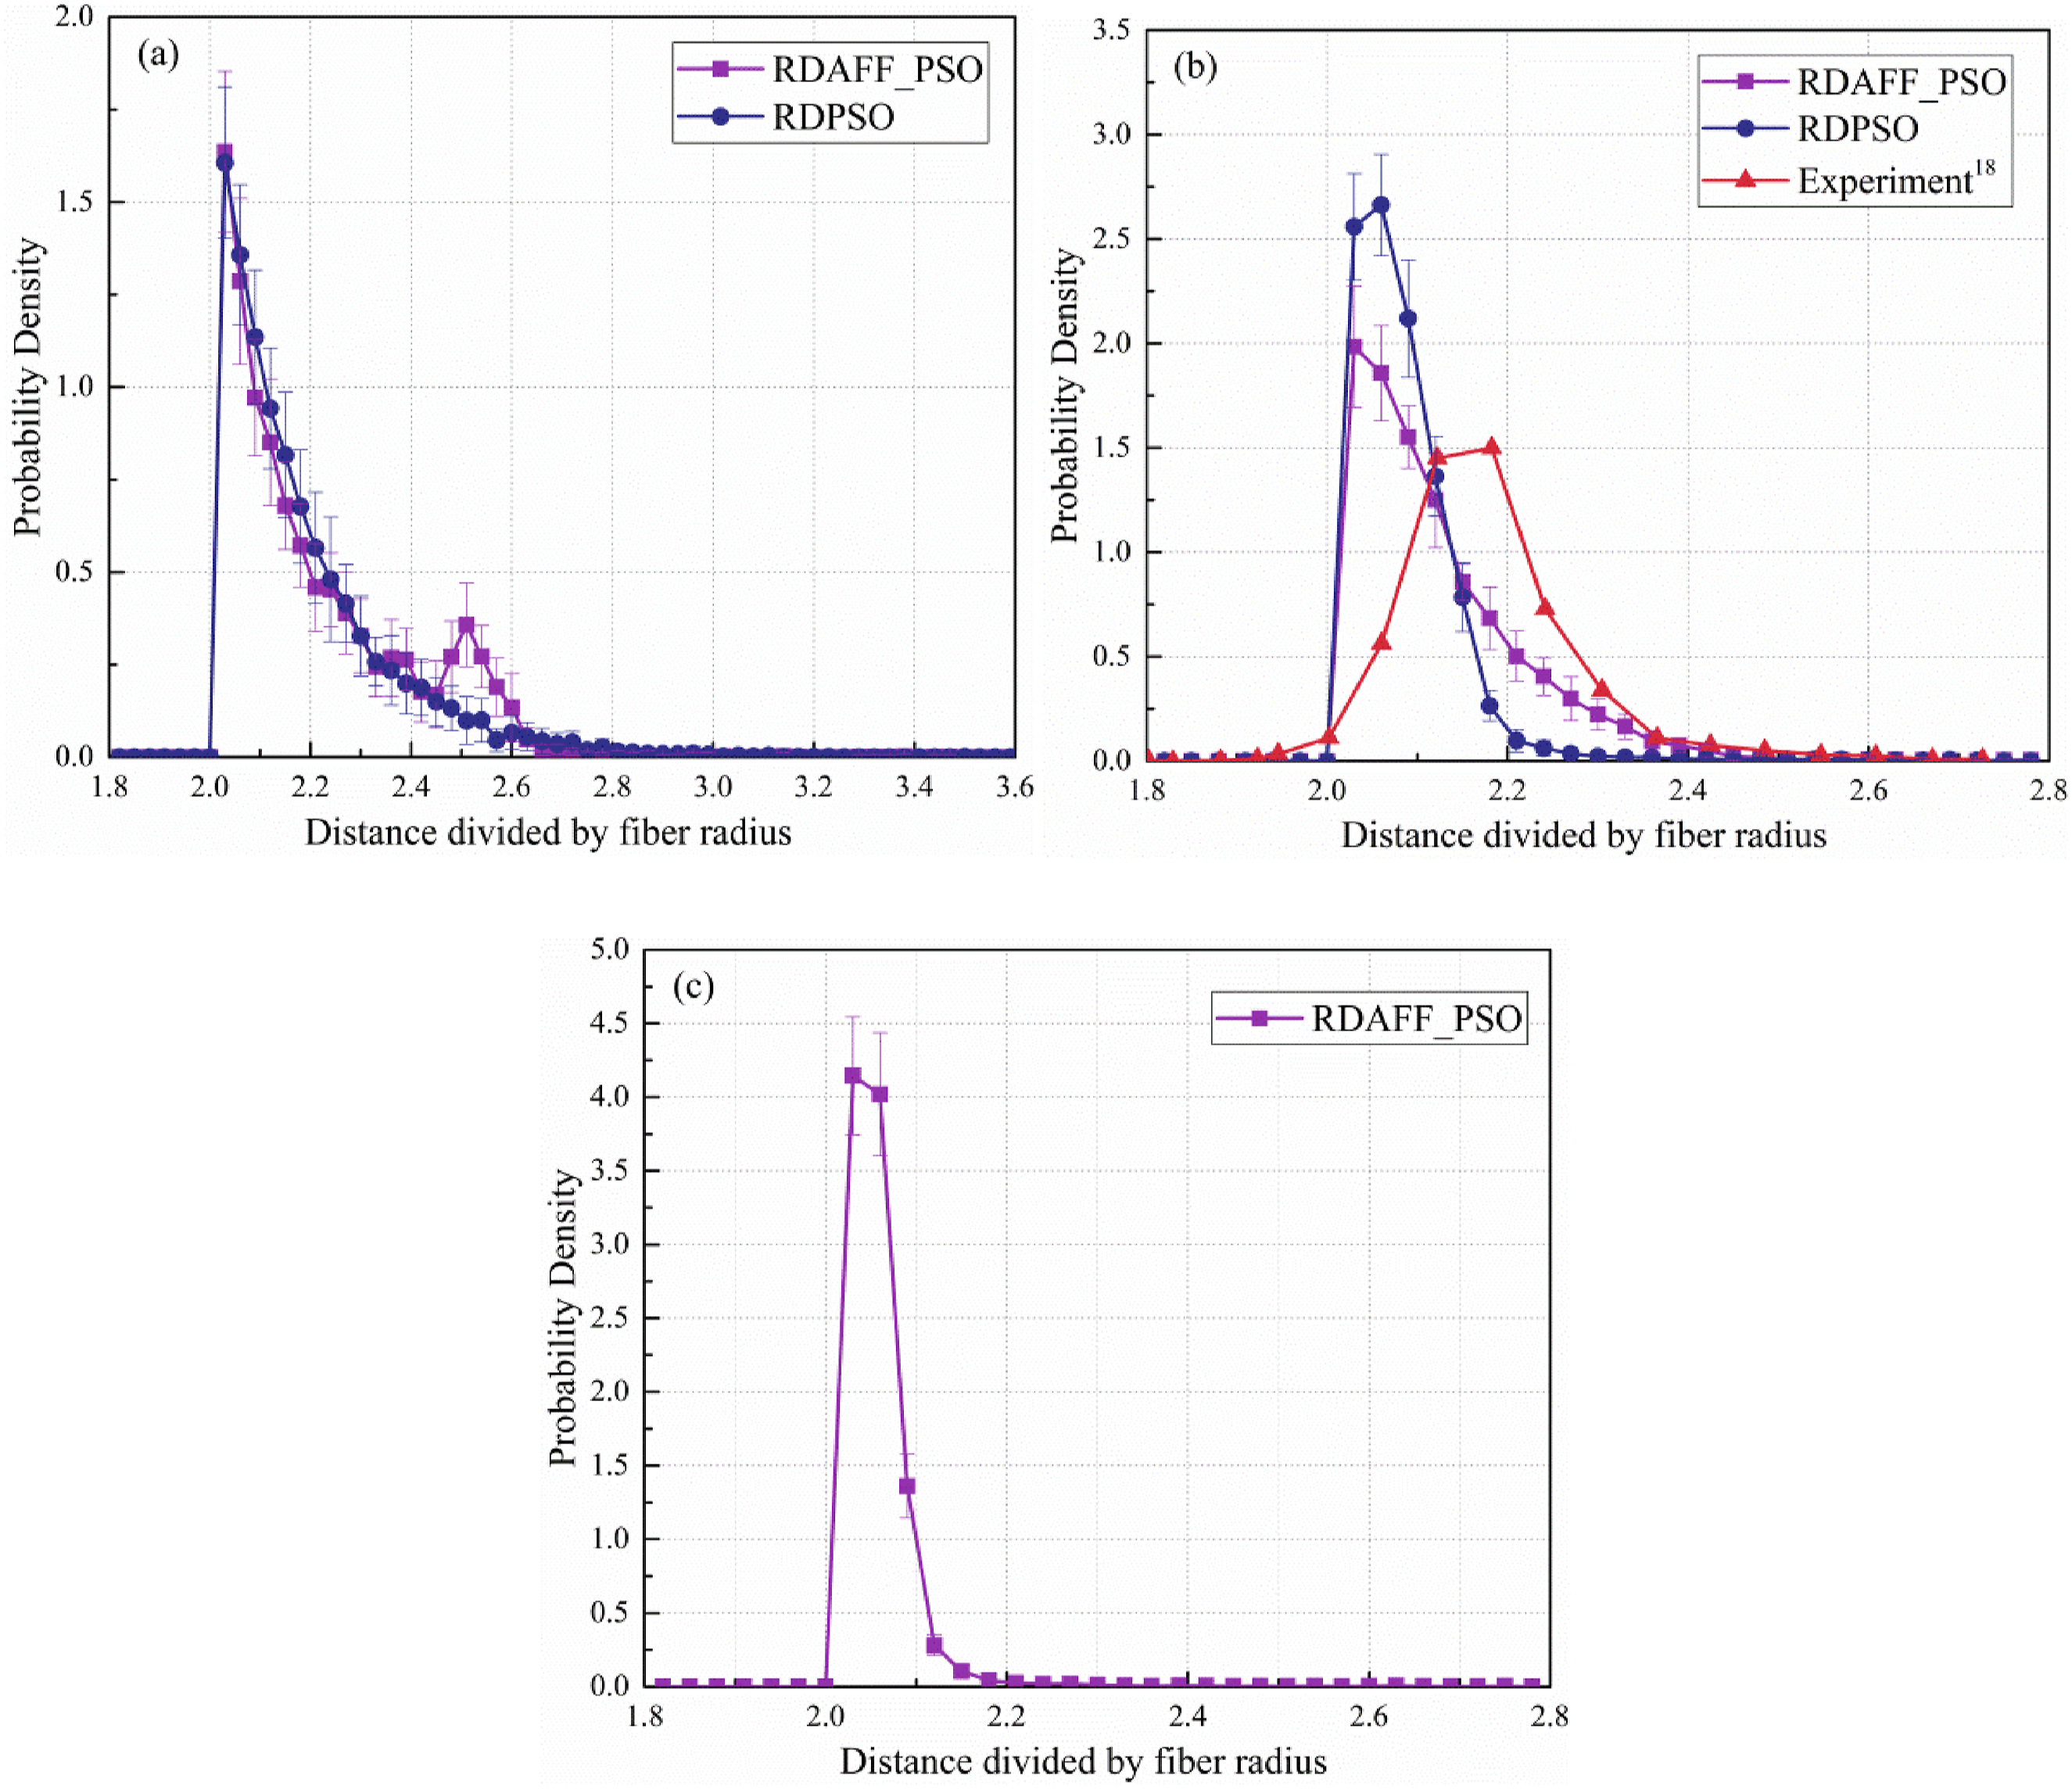
Nearest neighbor orientations
Once the coordinates of the fiber center at the nearest neighbor distance were known, the nearest neighbor orientation can be calculated as the angle between the line connecting the target fiber’s center to its nearest neighbor and the horizontal axis (Schematic diagrams was shown in Figure 1(b)).
Figure 10 demonstrates that the RDAFF_PSO curve aligns well with the CSR curves for all three volume fractions, indicating that the nearest neighbor fibers generated by the two algorithms had equal probabilities in each direction. Nearest neighbor orientation distribution function.: (a) 50%; (b) 60%; (c) 65%.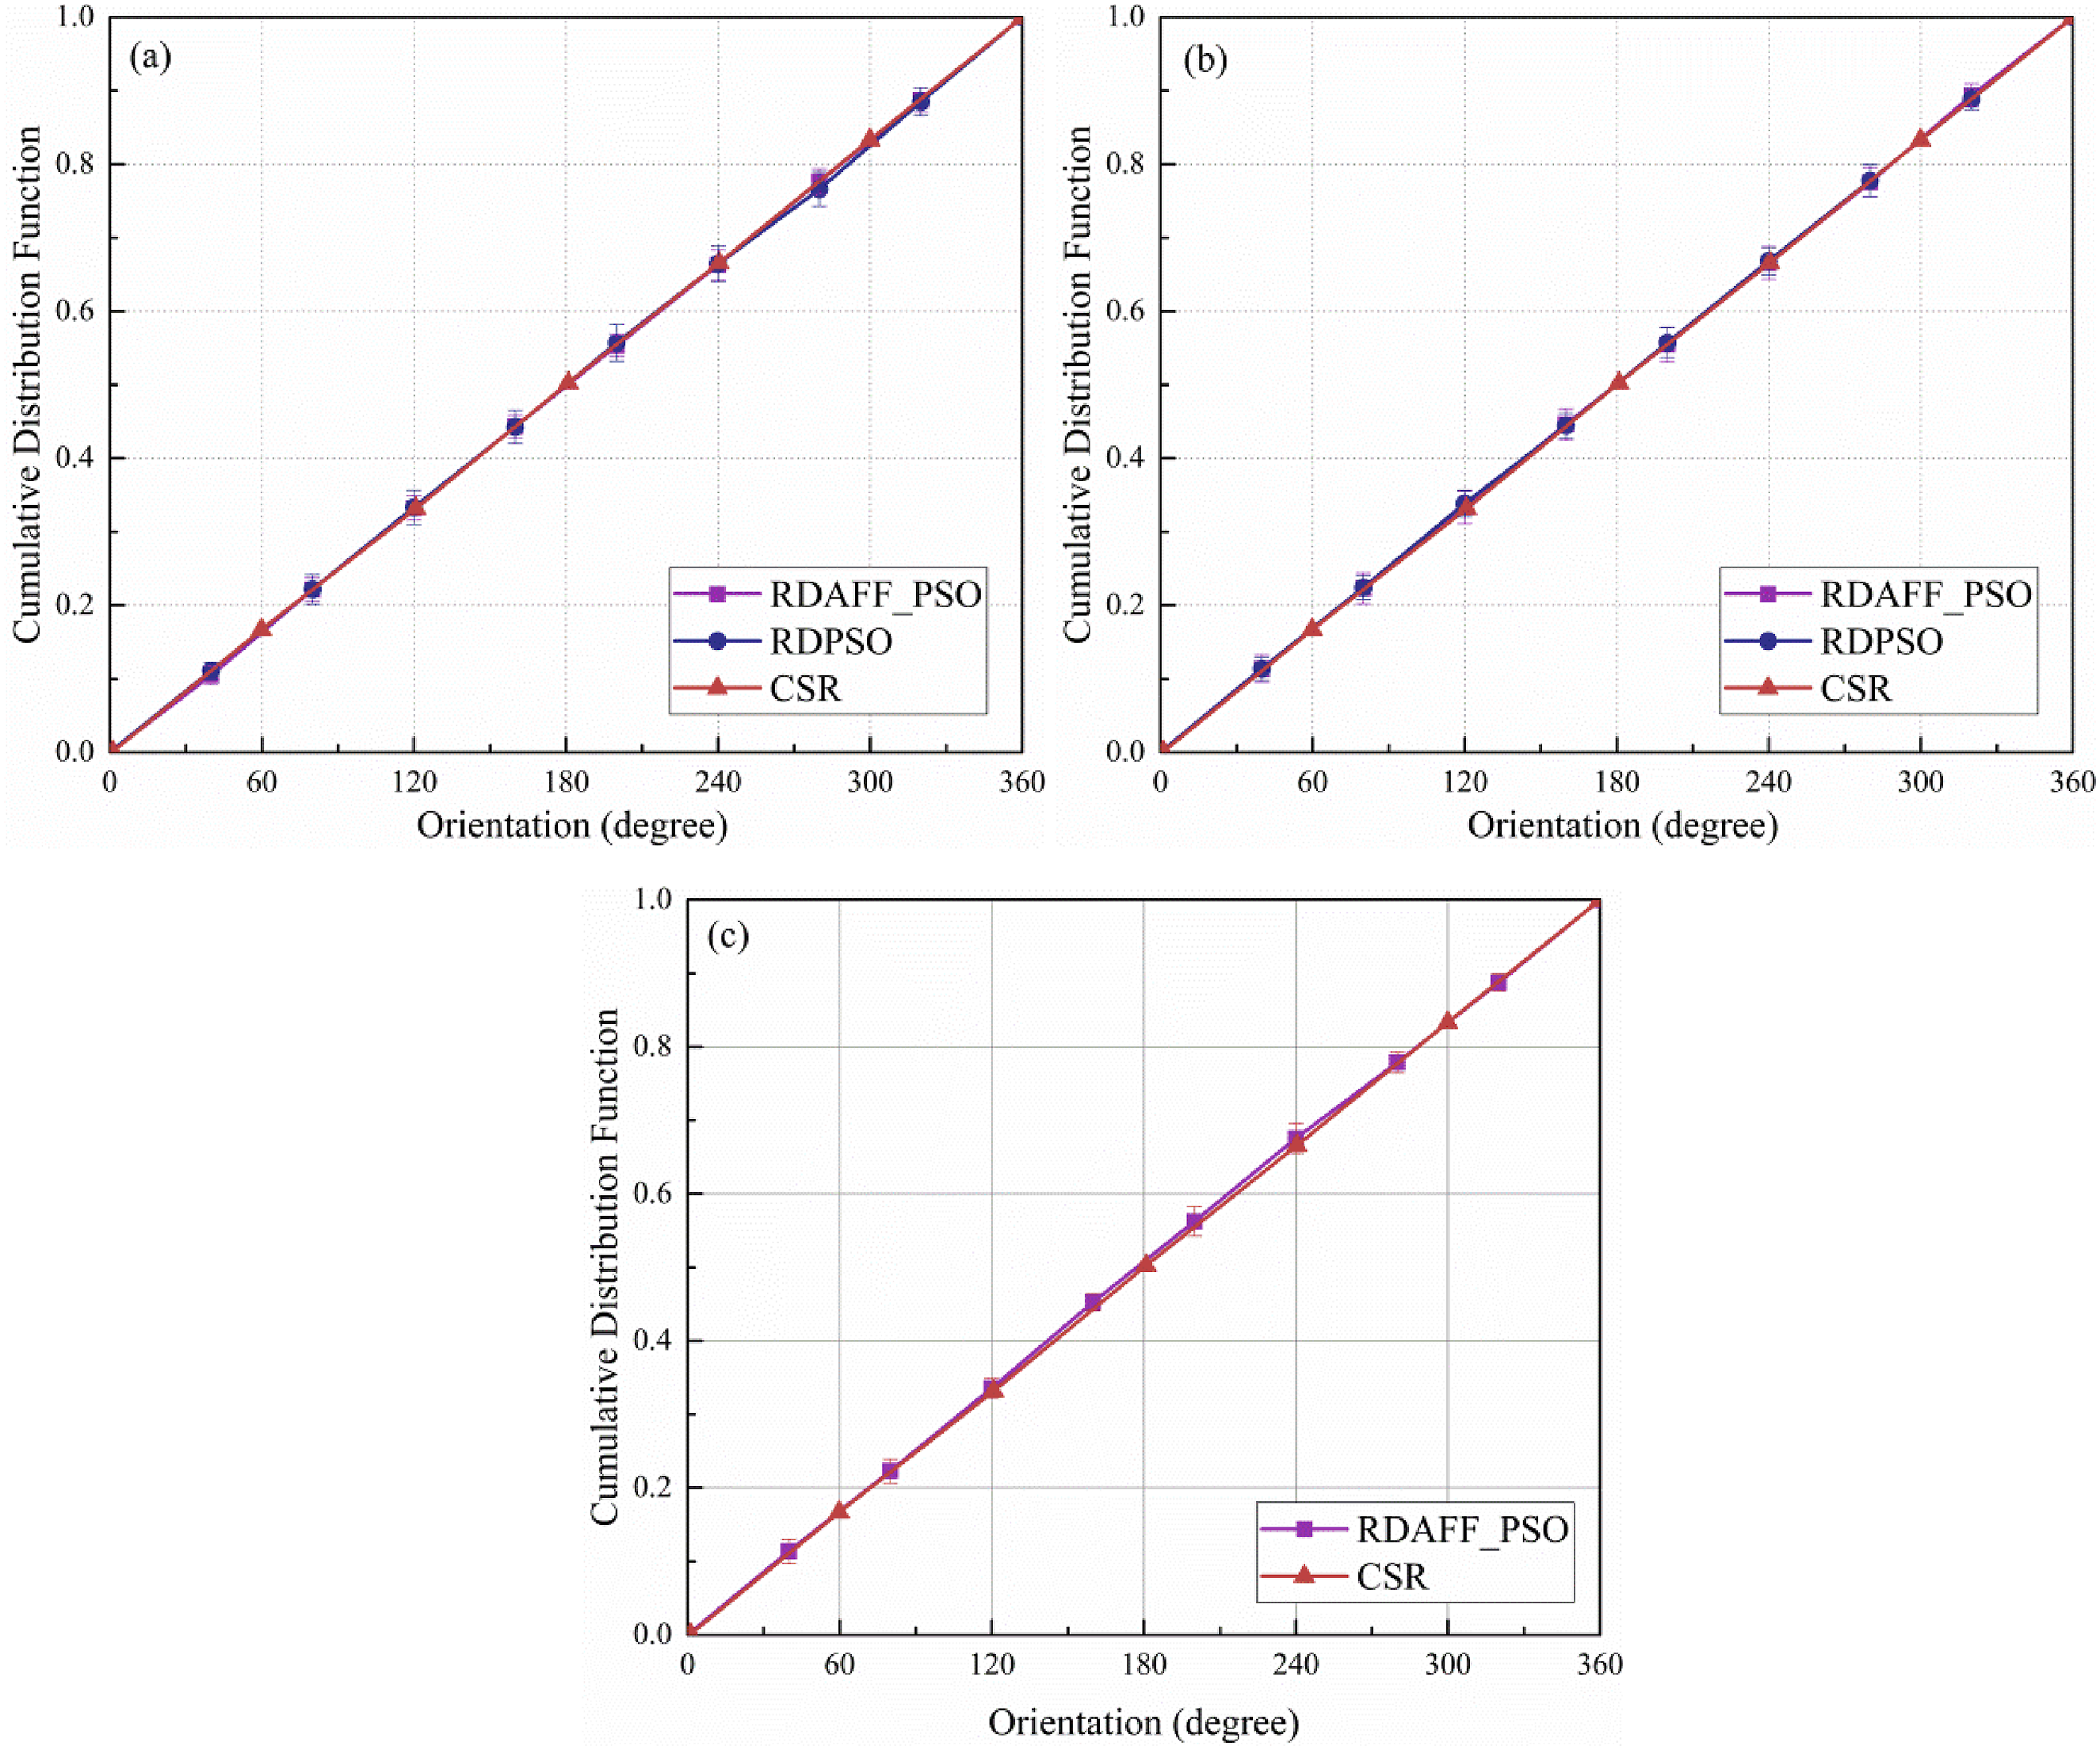
Ripley’s K-function
Ripley’s K-function, or the second-order intensity function, is a widely used statistical measure for analyzing spatial point distributions. It quantifies the clustering or regularity of points by evaluating the number of additional points within a circular region of radius r around any given point. It is defined as the ratio of the number of additional points in a circular region at radial distance r from any point to the number of points in the unit domain19,20:

Irrespective of the existence of the distribution of points, clustering, regularity, and other phenomena are observed by the relative position of the
Figure 11(b) compares the RDAFF_PSO, RDPSO, CSR, and experimental Ripley’s K-function curves at a volume fraction of 60%. The figure shows that when the fiber spacing is relatively short, roughly before Ripley’s K-function: (a) 50%; (b) 60%; (c) 65%.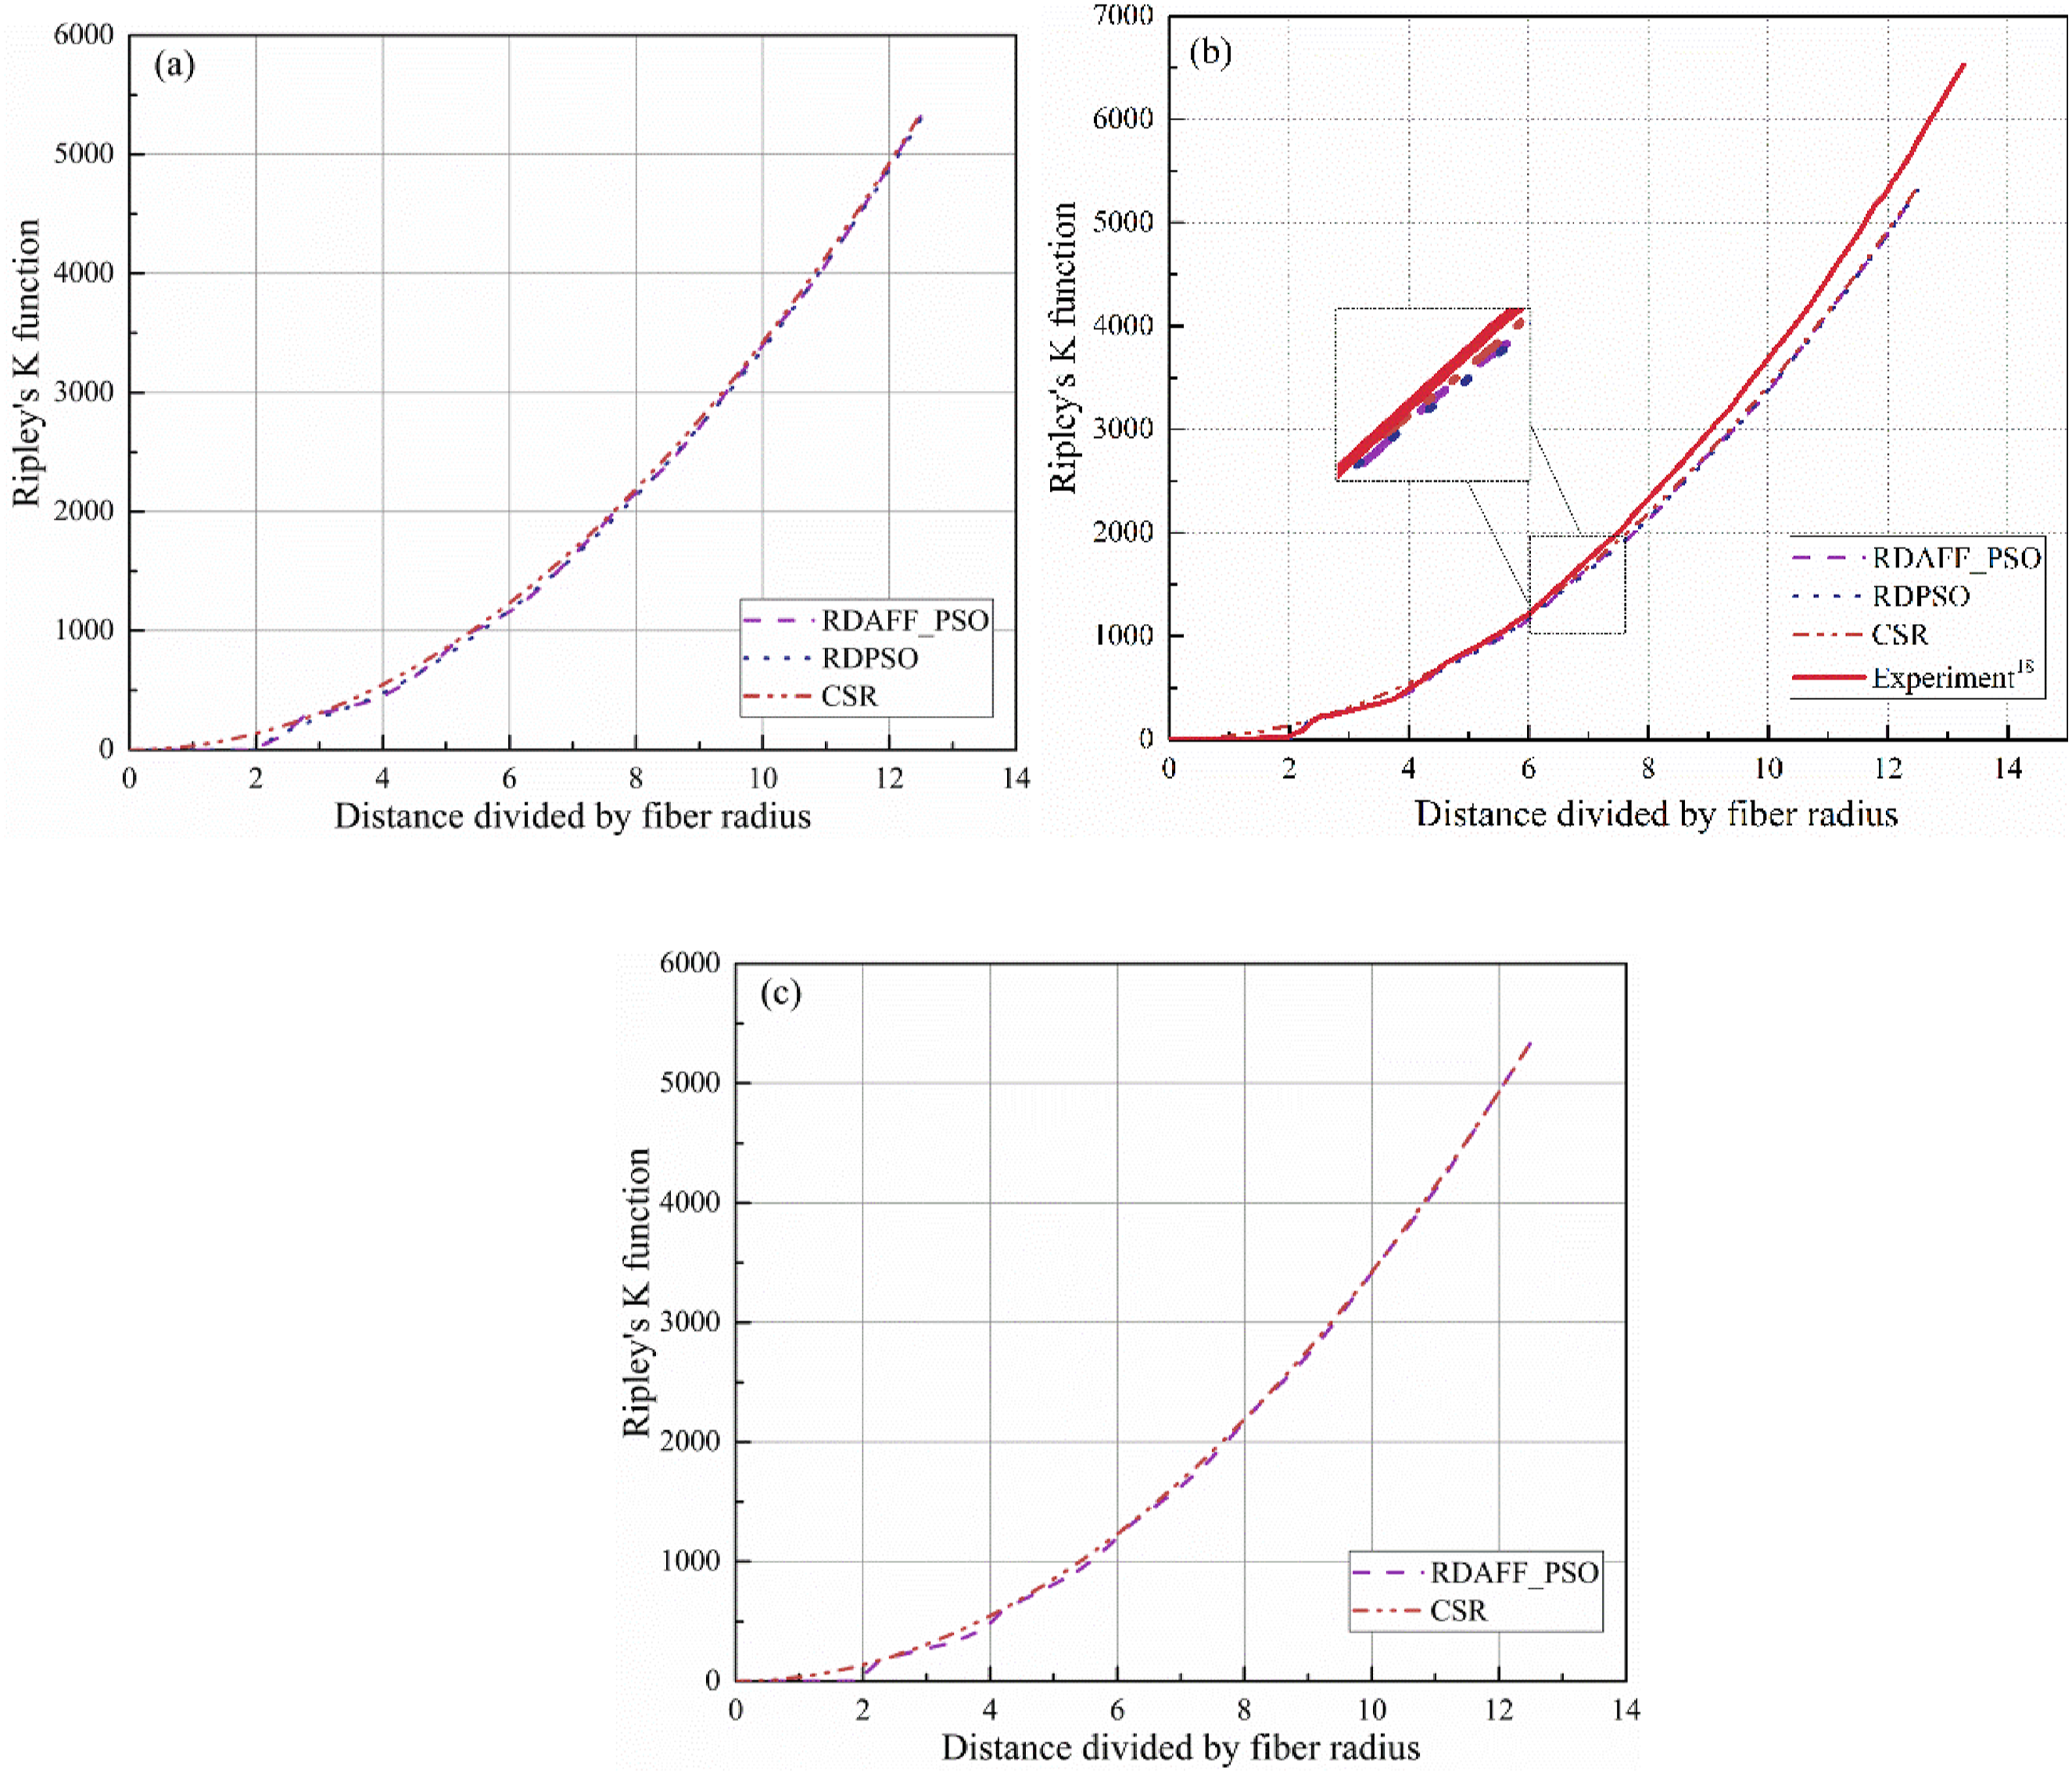
Pair distribution function
The pair distribution function is a commonly utilized statistical tool for analyzing the spatial distribution pattern of points. It is defined as the probability of finding additional points from a circle of inner radius r to a circular region of outer radius r + dr
27
:
Substituting Equation (7) in (8) yields the pair distribution function in a CSR, where
The results in Figure 12(b) demonstrate that although the experimental curve exhibits a higher peak, this anomaly was not significant.18,19 The curves of RDAFF_PSO, RDPSO, and the experimental data eventually converged to 1. In addition, the curves in Pair distribution function: (a) 50%; (b) 60%; (c) 65%.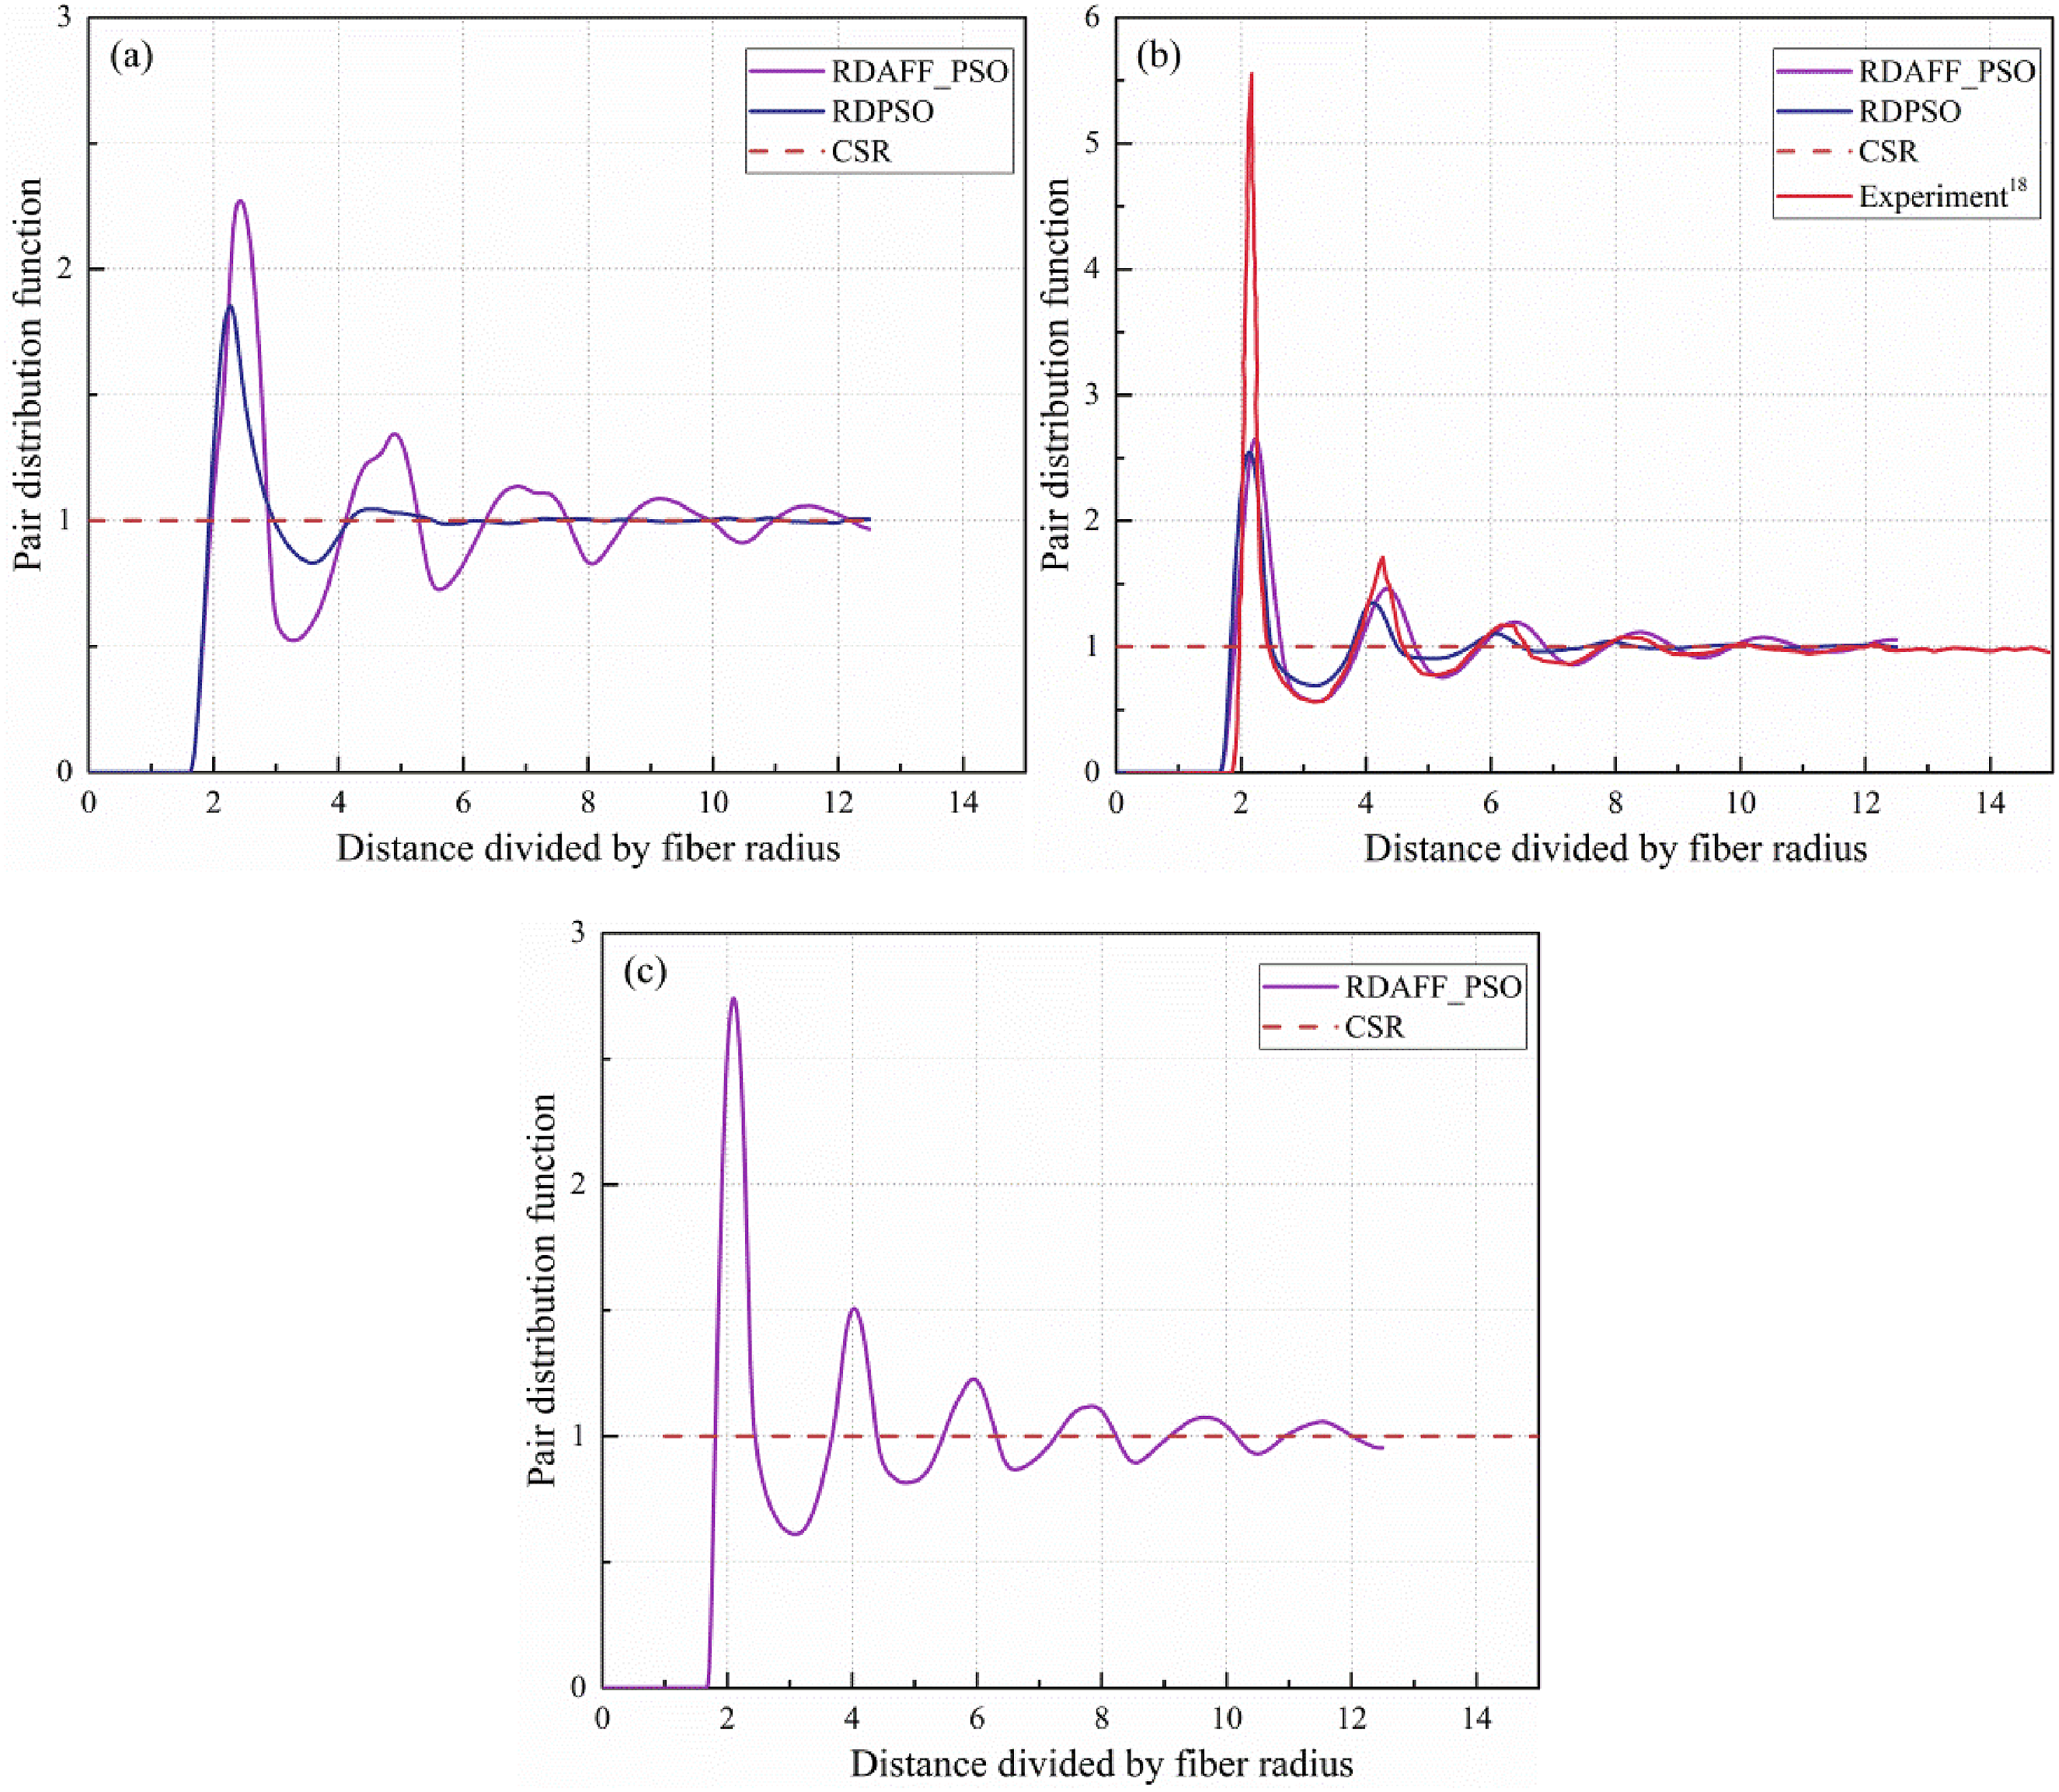
Prediction of effective elastic constants
The primary objective of developing this algorithm was to replicate the actual fiber distribution state to predict the elastic constants of the composite material. In this section, predictions are presented for composites with fiber volume fraction of 50%, 60%, and 65% respectively with experimental results compared to the predicted results for 60% fiber volume fraction.
Finite element model
To ensure representative features, such as appropriate mesh quality and computational accuracy, the following parameters were used in this study: Diagram of the RVE model generated by RD_PSO: (a) 50%; (b) 60%; (c) 65%.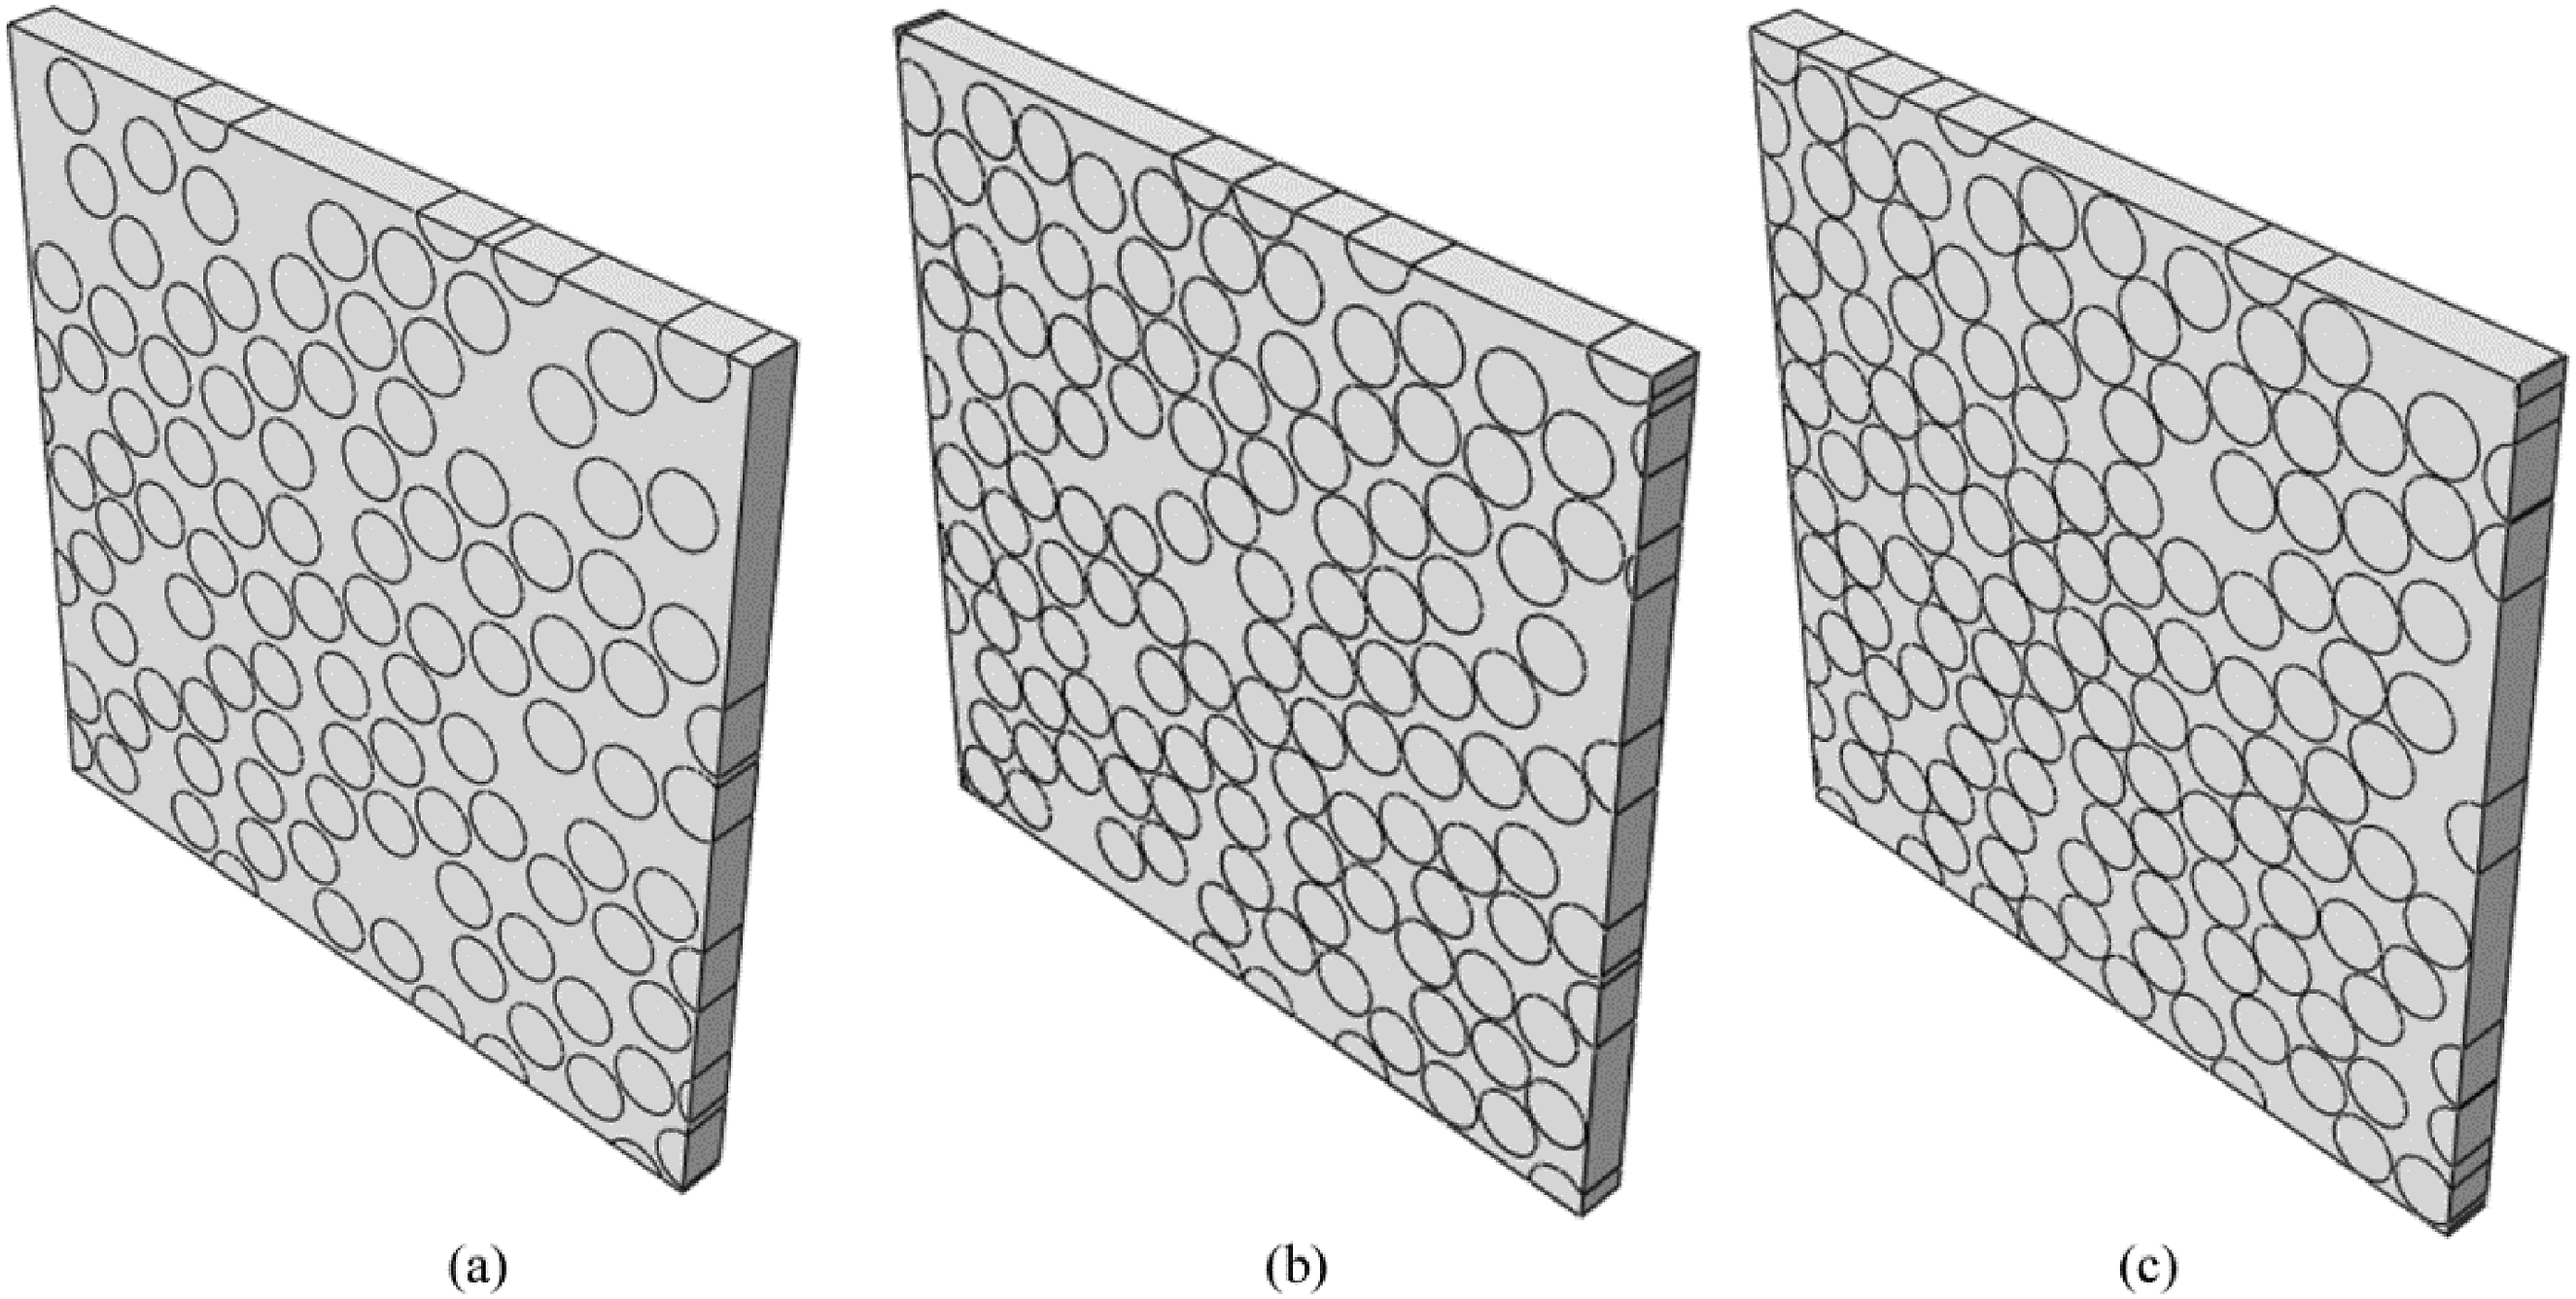
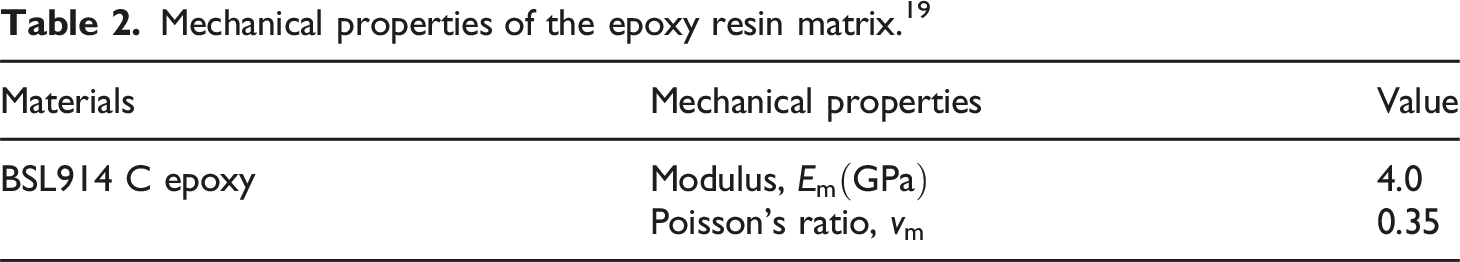
Mechanical properties of the epoxy resin matrix. 19
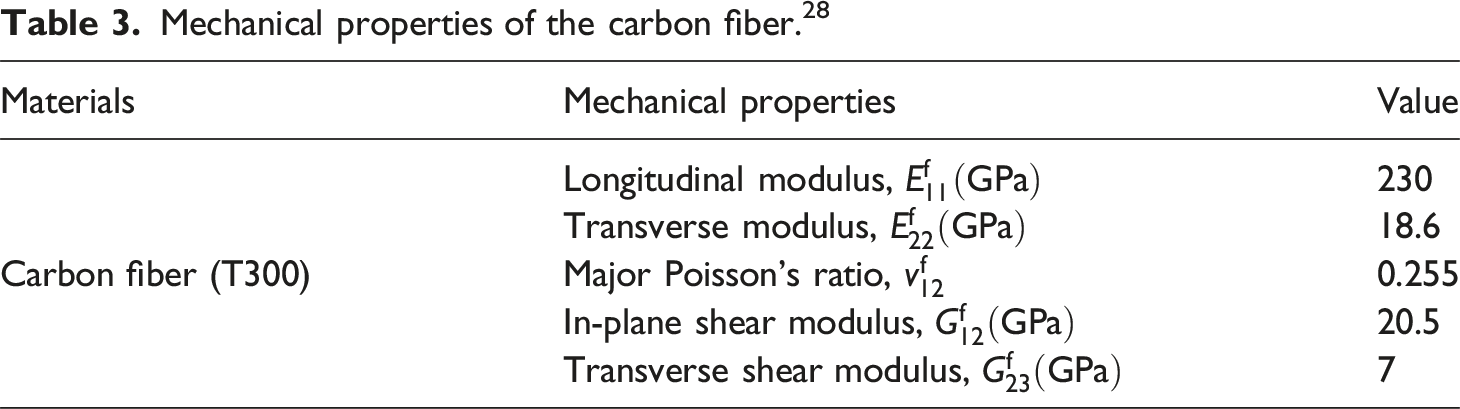
Mechanical properties of the carbon fiber. 28
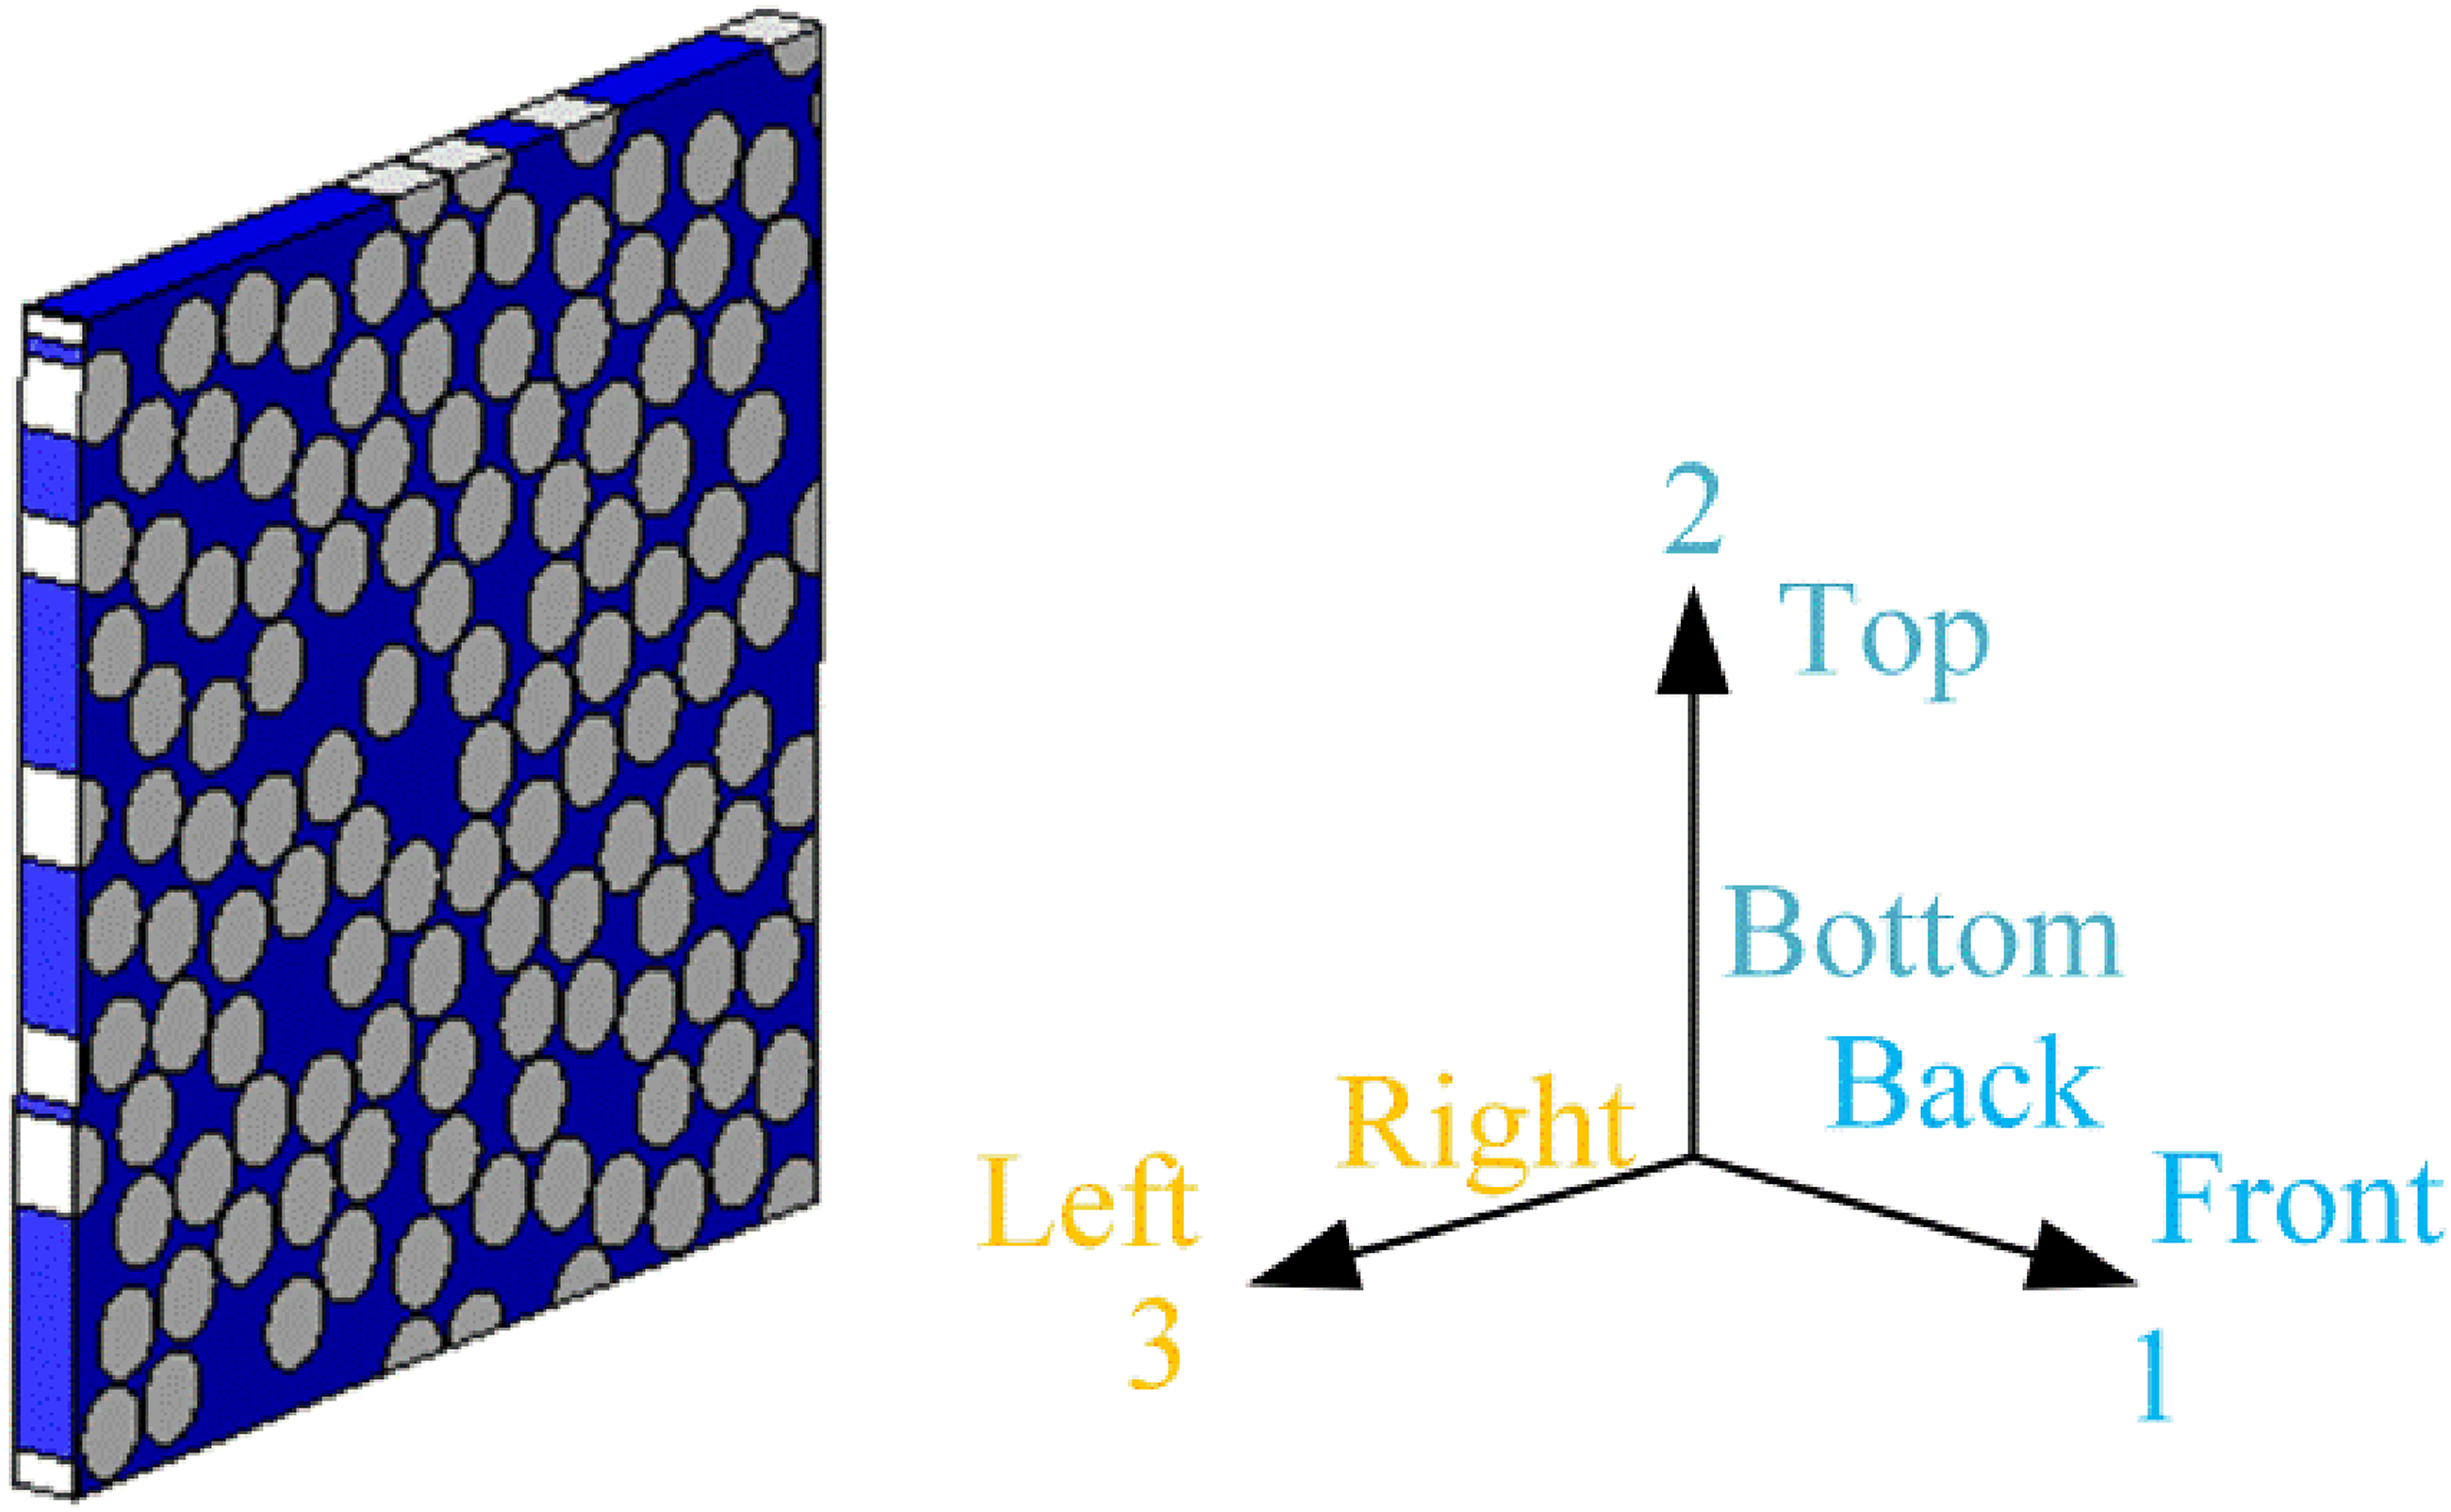
Schematic diagram of PBC 29 .
Taking the PBC of the elastic modulus E11 as an example
29
:


Taking the PBC of the elastic modulus G12 as an example
29
:


Results and discussion
The RVE stress diagram ( RVE stress diagrams for the prediction of elastic constants (a) E11, (b) E22, (c) E33. Prediction results. aThe superscript a indicates that the data were from the experiment.
19
The predicted elasticity constants.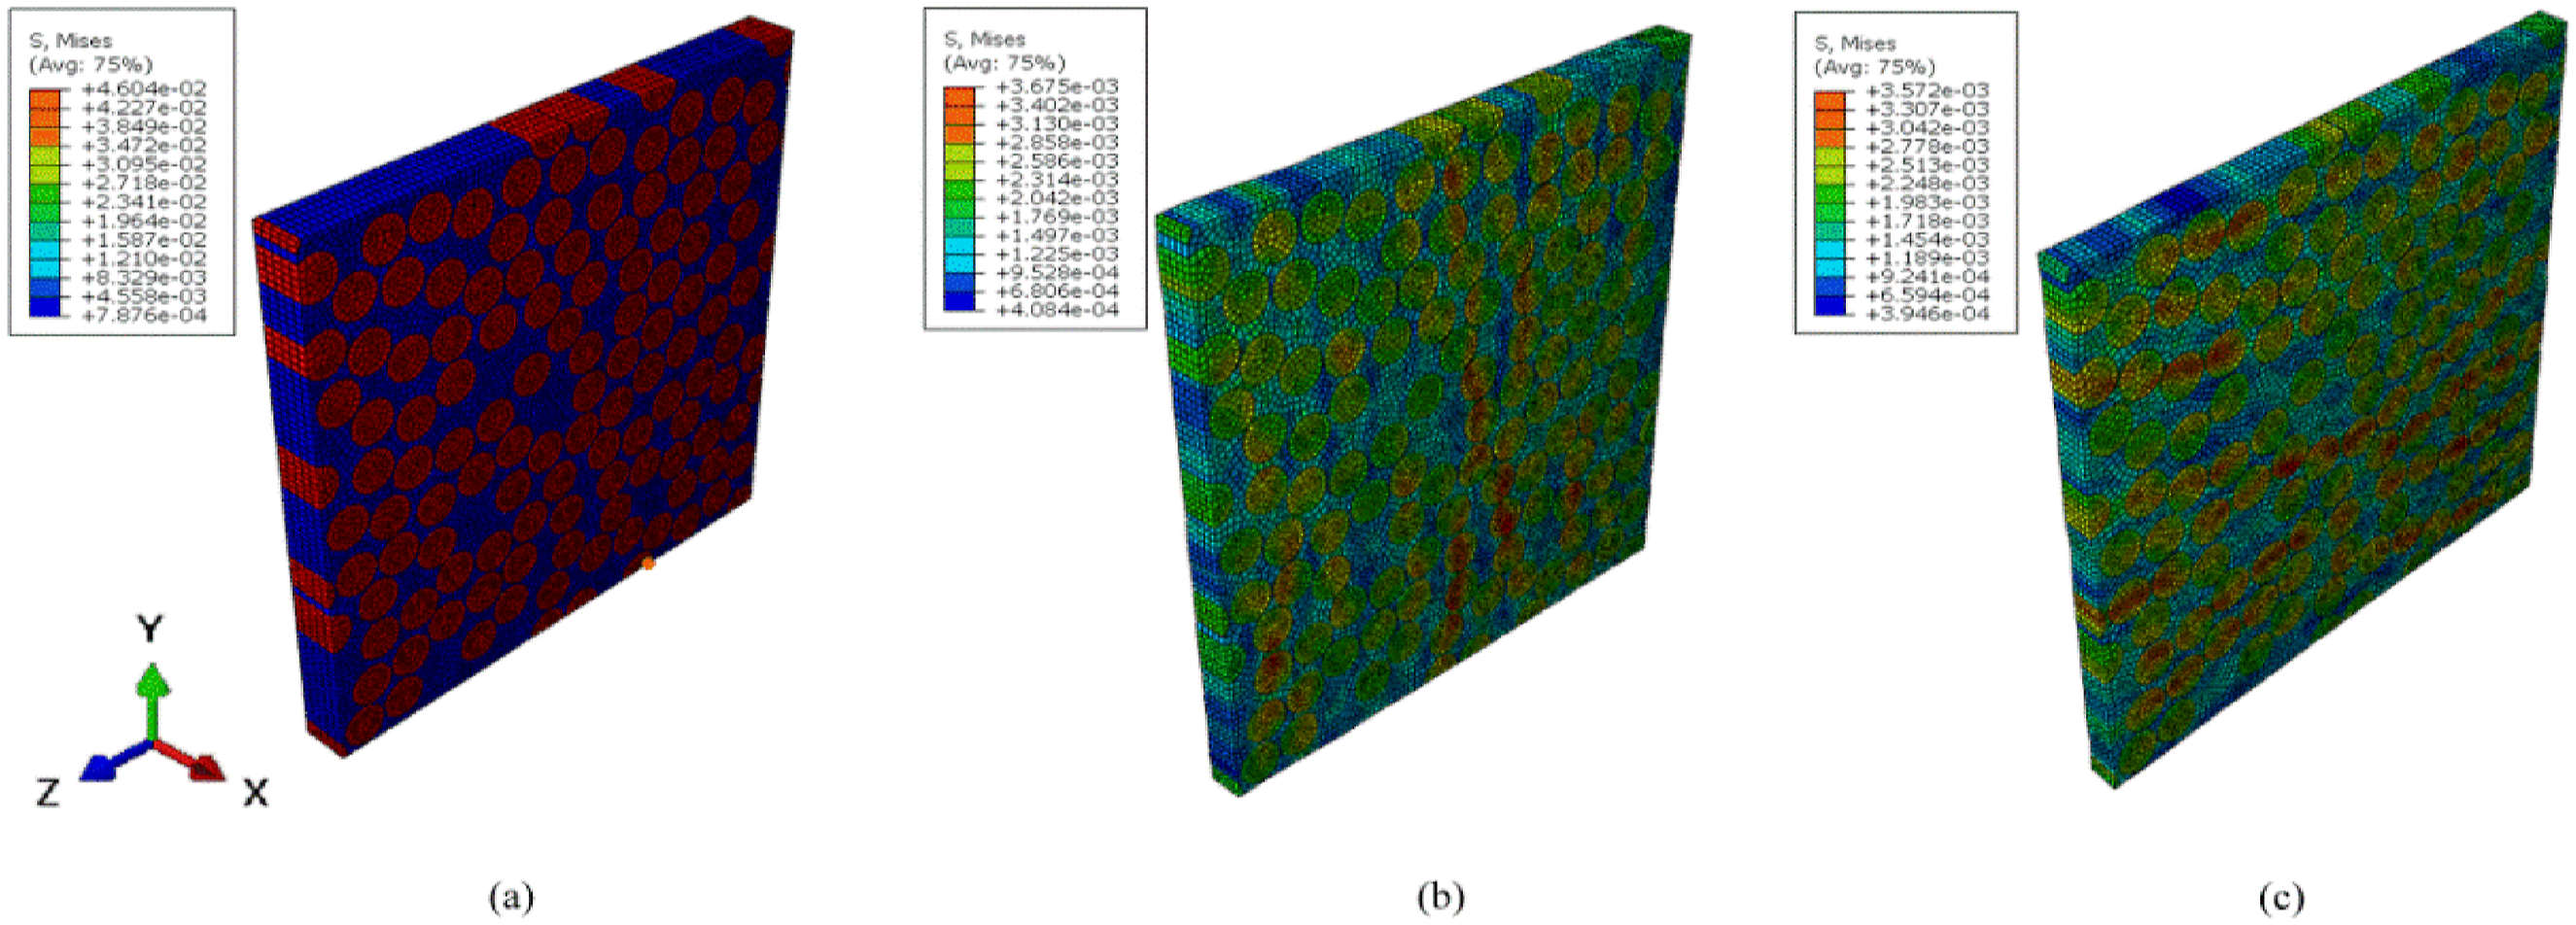
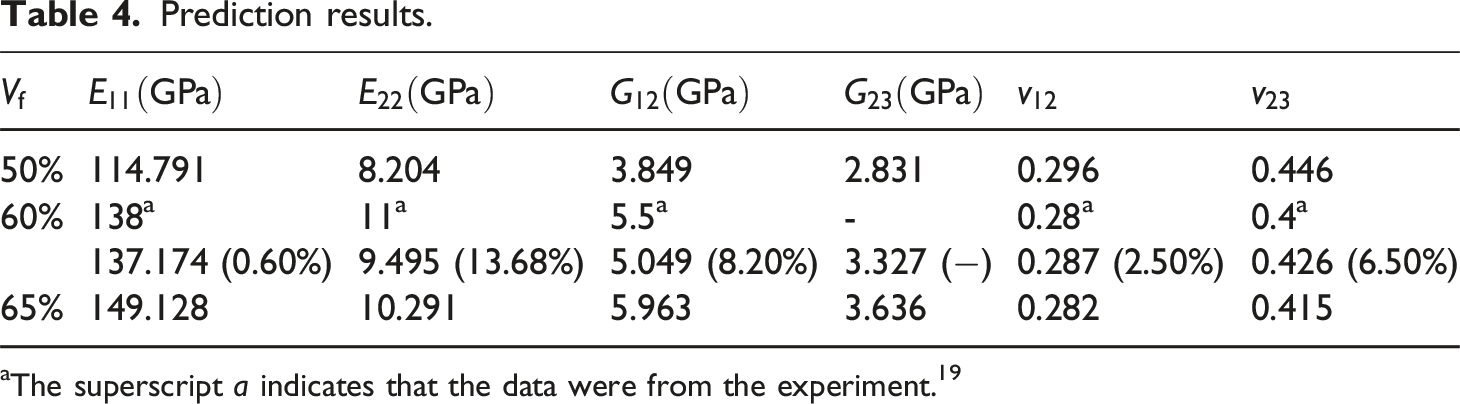
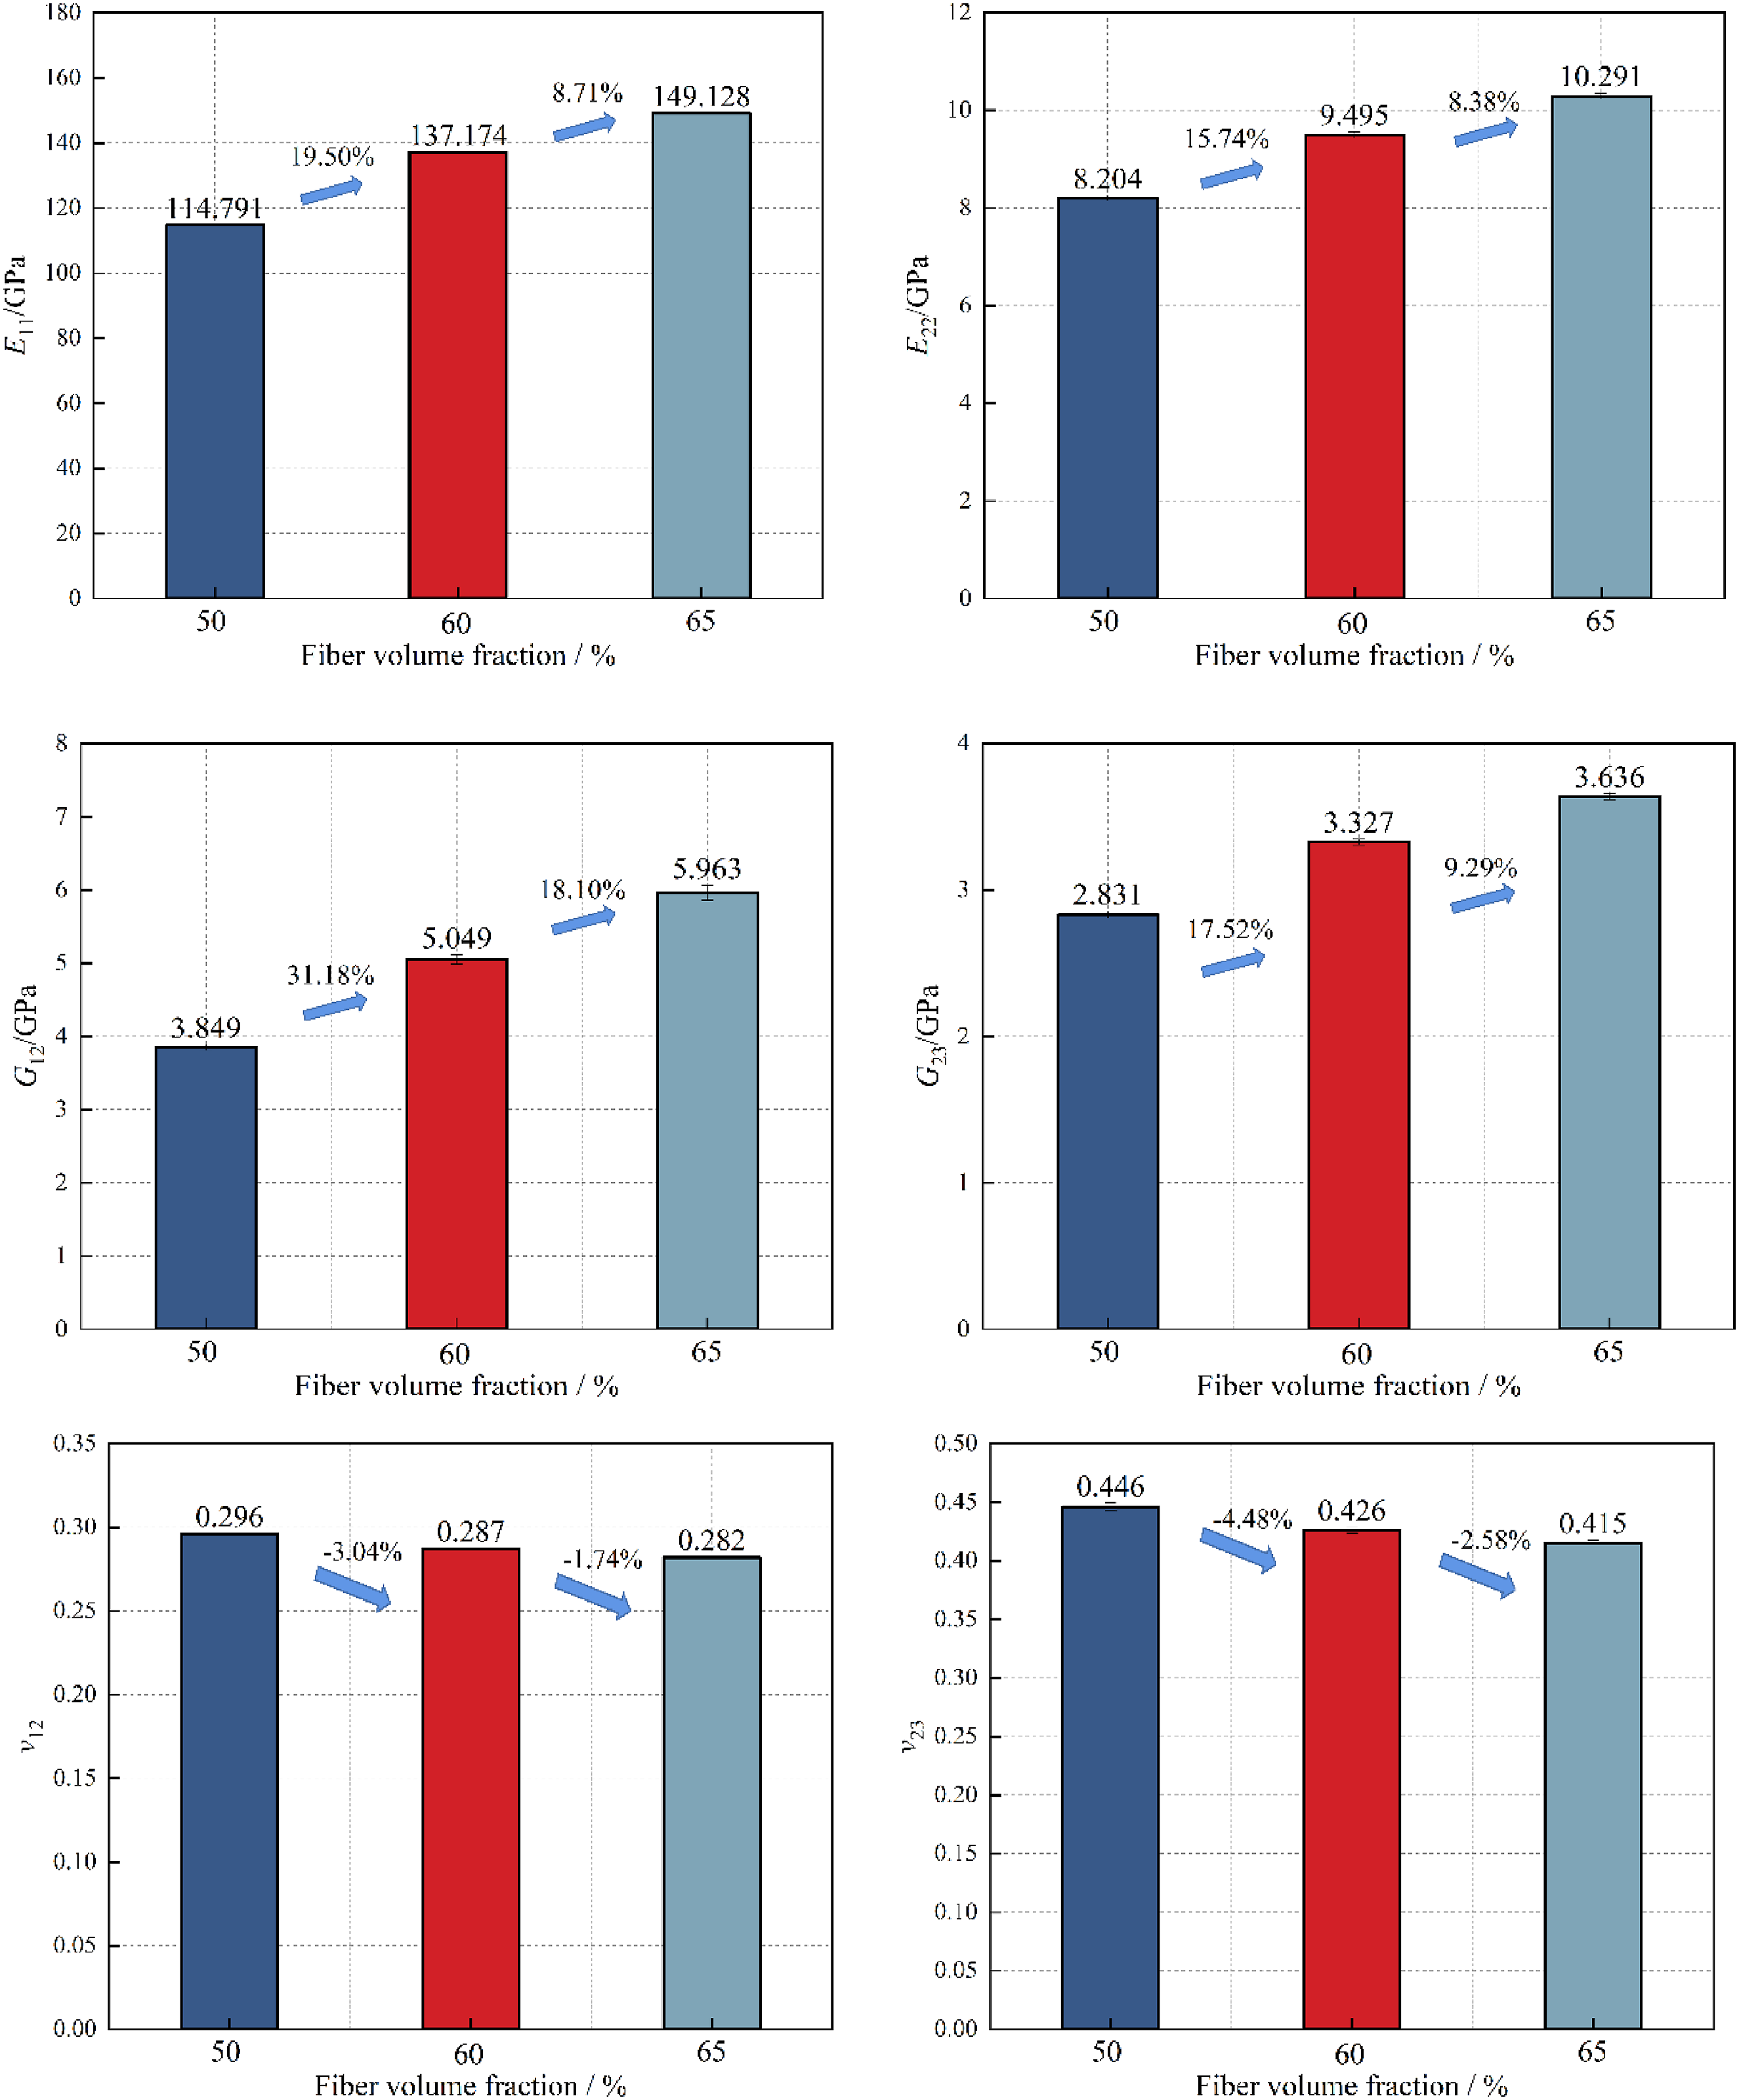
The results indicate a clear increase in the elastic modulus E11 along the fiber direction and the elastic modulus E22 perpendicular to the fiber direction, shear modulus G12 and G23 with increasing fiber volume fraction. Notably, as the fiber volume fraction increases from 50% to 60% and 60 to 65%, the E11 increases by 19.5% and 8.71% respectively. This indicates that the first interval contributes approximately twice the increase of the second. Similar trends are observed for E22, 15.74% vs. 8.38%, G12 (31.18% vs 18.10%) and G23 (17.52% vs 9.29%). While Poisson’s ratio slightly decreases with increasing volume fraction, the multiplication of the percentage decrease is similar to that of the elastic modulus and shear modulus, with 50% to 60% being twice that of 60% to 65%, as in v12 (−3.04% vs −1.74%) and v23 (−4.48% vs −2.58%). These patterns suggest a proportional relationship between fiber volume fraction and elastic constant such as E11.
Table 4 shows that the predicted elastic constants were in close agreement with the experimental results (
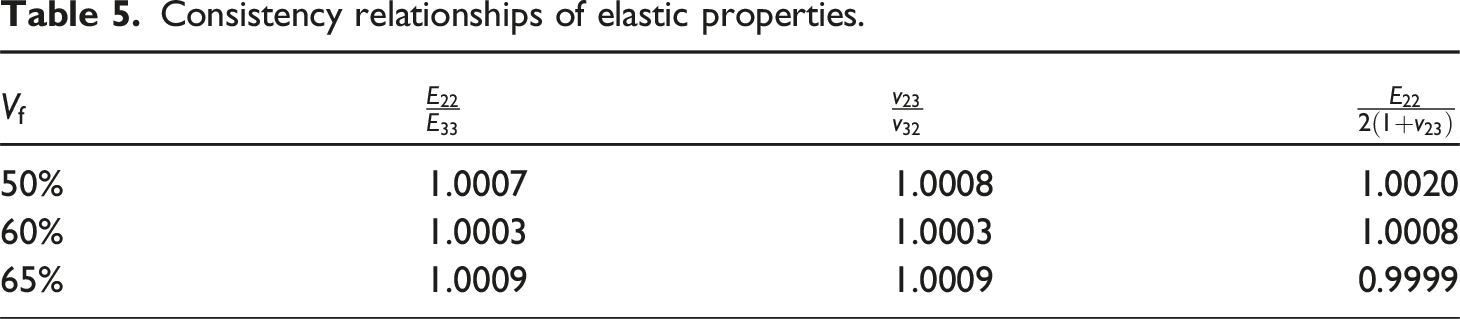
Consistency relationships of elastic properties.
Conclusions
This study proposes an enhanced algorithm, RDAFF_PSO, based on the RDPSO framework, for generating randomly distributed fiber structures in RVE. The PSO-based methodology effectively mitigates fiber clustering phenomena and enhances distribution randomness compared to conventional algorithms. Statistical evaluations confirm the randomness of the generated distributions, and the RVE predictions for elastic constants align well with experimental results. This method provides a robust tool for micromechanical simulations and multiscale analysis of fiber-reinforced composites.