
Abstract
The effect of aggregate granulometry and mixing percentage on the strength of concretes containing cement-based and thermoplastic polyester-based binders was investigated. Seven different aggregate granulometry (G1-G2-G3-G4-G5-G6-G7) and four types of aggregate percentages (%55, %65, %75, %85) were used in the study. It has been observed that polymer concrete has better mechanical properties than the behavior of cementitious concrete. SEM images were taken from polymer concrete and cemented concrete samples. It has been observed that the pore ratio and ITZ in polymer concrete are minimal, and the polymer can better grasp the aggregates. In addition, it has been observed that aggregate granulometry greatly affects the compressive strength of polymer concrete. It has been determined that the flexural strength of polymer-binder concrete is much higher than cement-binder concrete. It has been observed that the reaction occurring while producing cementitious concrete is greatly affected by the amount of cement in the mixture and is the determining factor in strength. In polymer concrete, it was understood that the aggregate granulometry in the mixture was more decisive. Then, two types of efficiency analysis were carried out. It has been understood that using too much binder is not efficient and economical, and aggregate mixture type and granulometry are more important.
Keywords
Introduction
Polymer concrete (PC) is a novel and high-performance material in comparison to traditional building materials. PC has widespread usage areas due to some important advantages over cementitious concrete. Polymer concrete has several advantages, including strong strength, a short drying time, outstanding adhesive capabilities, resistance to abrasion and corrosion, waterproofing, and good acoustic and thermal insulation properties. Many researchers have done many studies to determine the mechanical properties of various polymer concretes obtained by putting materials in various proportions and sizes into polyester. Abdel-Fattah and El-Hawary 1 investigated the effect of the percentage of resin and the percentage of reinforcement in the mixture on the flexural behavior of polymer concrete. Muthukumar et al. 2 measured the compressive strength of polymer concretes at different times. The effects of variables such as the drying time and binder content of polymer concrete on polymer concrete were investigated. Muthukumar et al. 3 studied on optimization of mix proportions of silica aggregates for use in polymer concrete was attempted using statistical techniques. Muthukumar and Mohan 4 examined a range of polymer concretes based on furan resin that were made using an aggregate mix fraction that had the minimum pore content. Lokuge et al. 5 added fly ash to polymer concrete formed with polyester, vinyl ester, and epoxy resin, and investigated the effect of fly ash on the mechanical properties of polymer concrete. To examine the effect of the amount of fly ash on the mechanical properties of polymer concrete, polymer concretes were produced with different amounts of fly ash by Gorninski et al. 6 The elastic modulus of polymer concretes produced using orthophthalic and isophthalic polyester binders was investigated by Gorninski et al. 7 Gorninski et al. 8 have investigated the behavior of polymer concretes with various resin types in various environments. Characterisation of polymer concrete with epoxy polyurethane acryl matrix was researhed by Agavriloaie et al. 9 A new kind of polymer concrete was developed utilizing epoxy polyurethane acryl and aggregates. Barbuta et al. 10 described the fly ash characterization and microstructure of polymer concrete derived from the experimental mixtures. Ateş 11 investigated compression strength optimization using granulometry and binder rate changes in epoxy binder and polymer resin binder concretes. Ateş 12 researched density and compressive strength properties of polyester composites reinforced with spiral geometry woven fiber. Feng et al. 13 presented mechanical properties and discrete element simulation of KH-560 modified polystyrene concrete. Ferdous et al. 14 examined the influence of resin-to-filler ratio and matrix-to-aggregate ratio on mechanical and durability parameters. Atabadi et al. 15 investigated microstructural characterization and mechanical properties of lightweight polymer concrete. Aghdam et al. 16 researched influence of elevated temperatures on mode I and mode II fracture toughness and fracture energy of nanoclay reinforced polymer concrete. Belmokaddem et al. 17 investigated mechanical and physical properties and morphology of concrete containing plastic waste as aggregate. Shawki et al. 18 researched the rheological properties of high-performance SCC using recycled marble powder. Negm et al. 19 studied on high and normal strength concrete using grounded vitrified clay pipe (GVCP). Nemr et al. 20 presented the effect of mineral pigments on mechanical properties of concrete. Amgad et al. 21 researched correlation of non-destructive with mechanical tests for self-compacting concrete (SCC). Coskun 22 developed procedure about equivalent rectangular stress distribution in thermoplastic beam design.
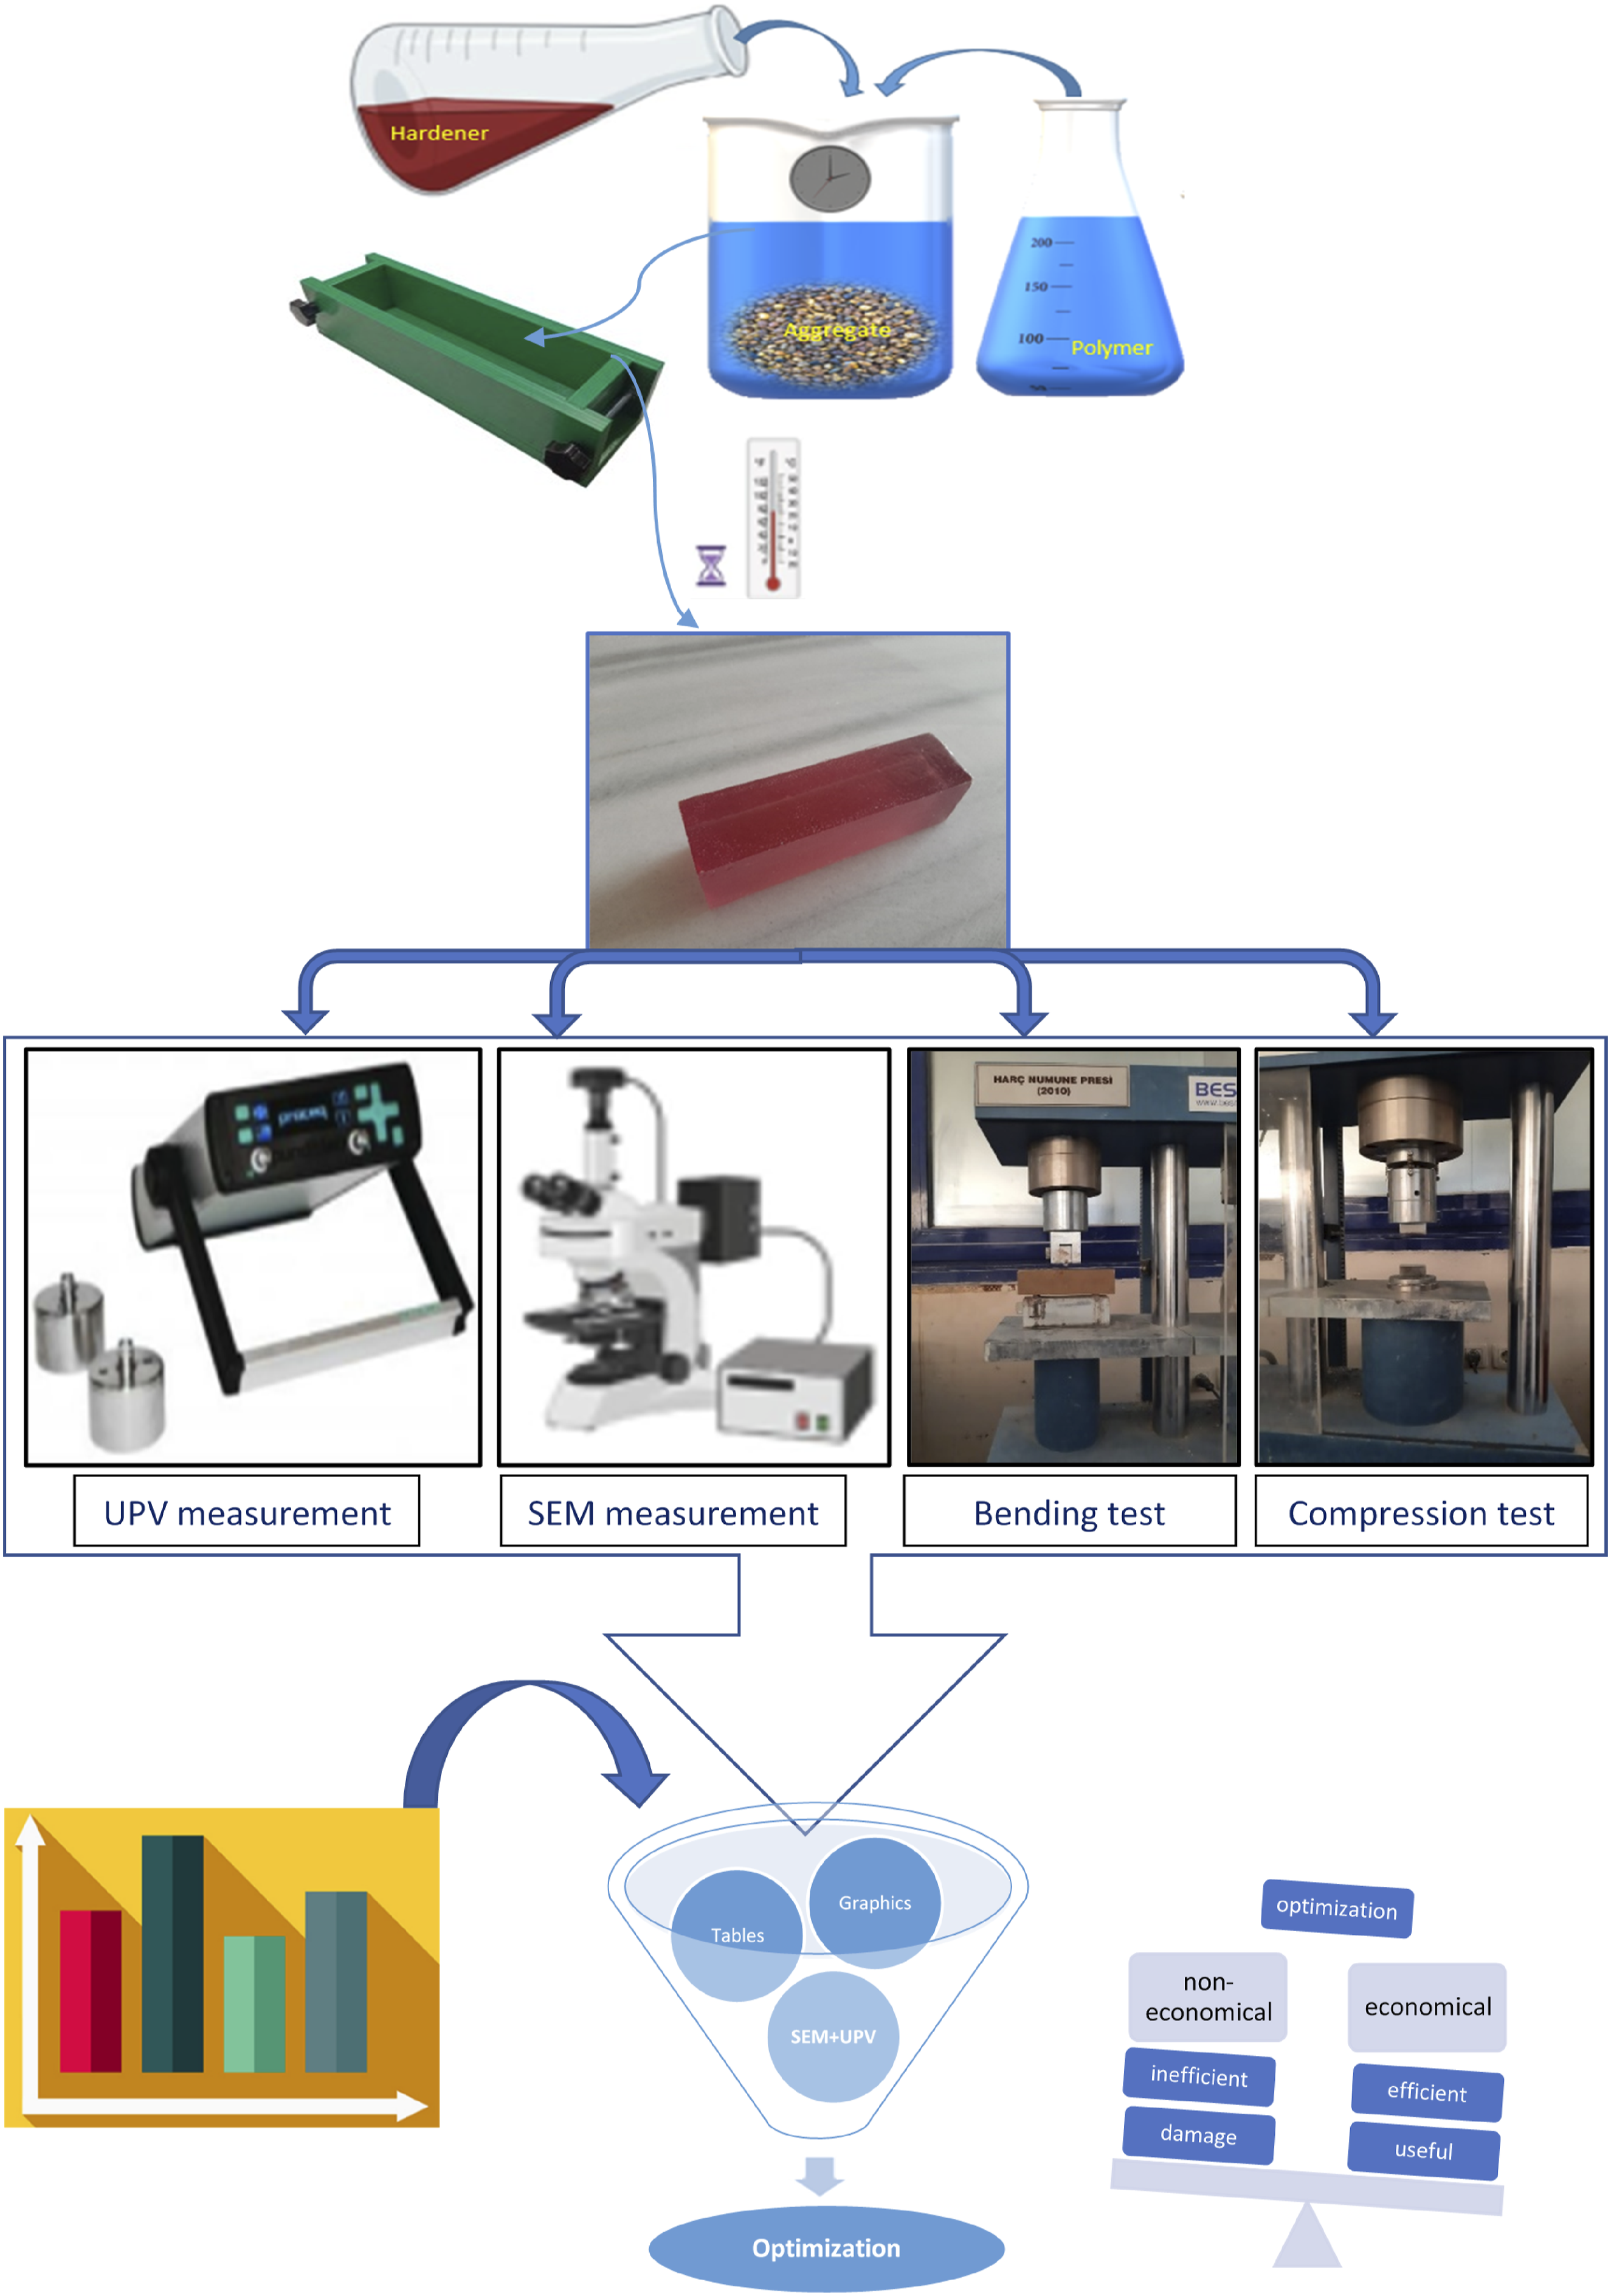
In this study, a total of 168 samples were produced, 84 for polymer concrete and 84 for cement concrete. The classification of these samples is as follows; four kinds of percentage mix types (55%,65%,75%,85%) seven types of granulometry in each percentage mix type (G1, G2, G3, G4, G5, G6, G7) and three samples for each granulometry group were produced from cemented concrete and polymer concrete samples. Three samples were produced for each classification and the results obtained for the three samples produced were averaged. This study focuses on determining the mechanical properties of polymer binder concrete and cement binder concrete in various mixing ratios and various aggregate granulometry, as well as recommending optimum strength and economic solutions by performing efficiency analyses. In light of all these parameters, it is a first in the literature. The study is organized as follows: A comparative study was carried out on the physical, mechanical, and ultrasonic pulse properties of concrete by producing both cementitious and polymer concrete. After the tests, microanalysis was performed with a Scanning Electron Microscope (SEM). This work aims to determine the most suitable situation for cement and polymer concrete by using various aggregate granulometry and various aggregate percentages in the mixture. For this reason, a sensitivity analysis is presented to clarify the effect of aggregate percentage and aggregate granulometry in the mixture. It needs to be investigated because there is not enough research on this subject. Last, an analysis of the efficiency of cement and polymer concrete was made, and optimum levels for polymer and cement concretes were detected.
Materials
Cement
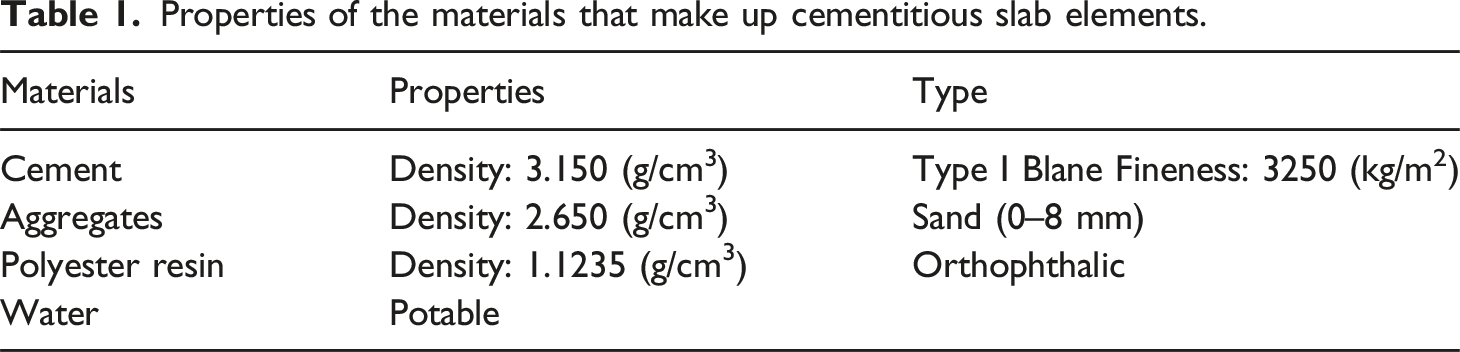
In this study, normal strength concrete design is aimed. Standard CEM I 42.5 R Portland cement was used in the production of samples (Figure 1). Some information on the cement used is represented in Table 1. Cemented concrete beam samples. Properties of the materials that make up cementitious slab elements.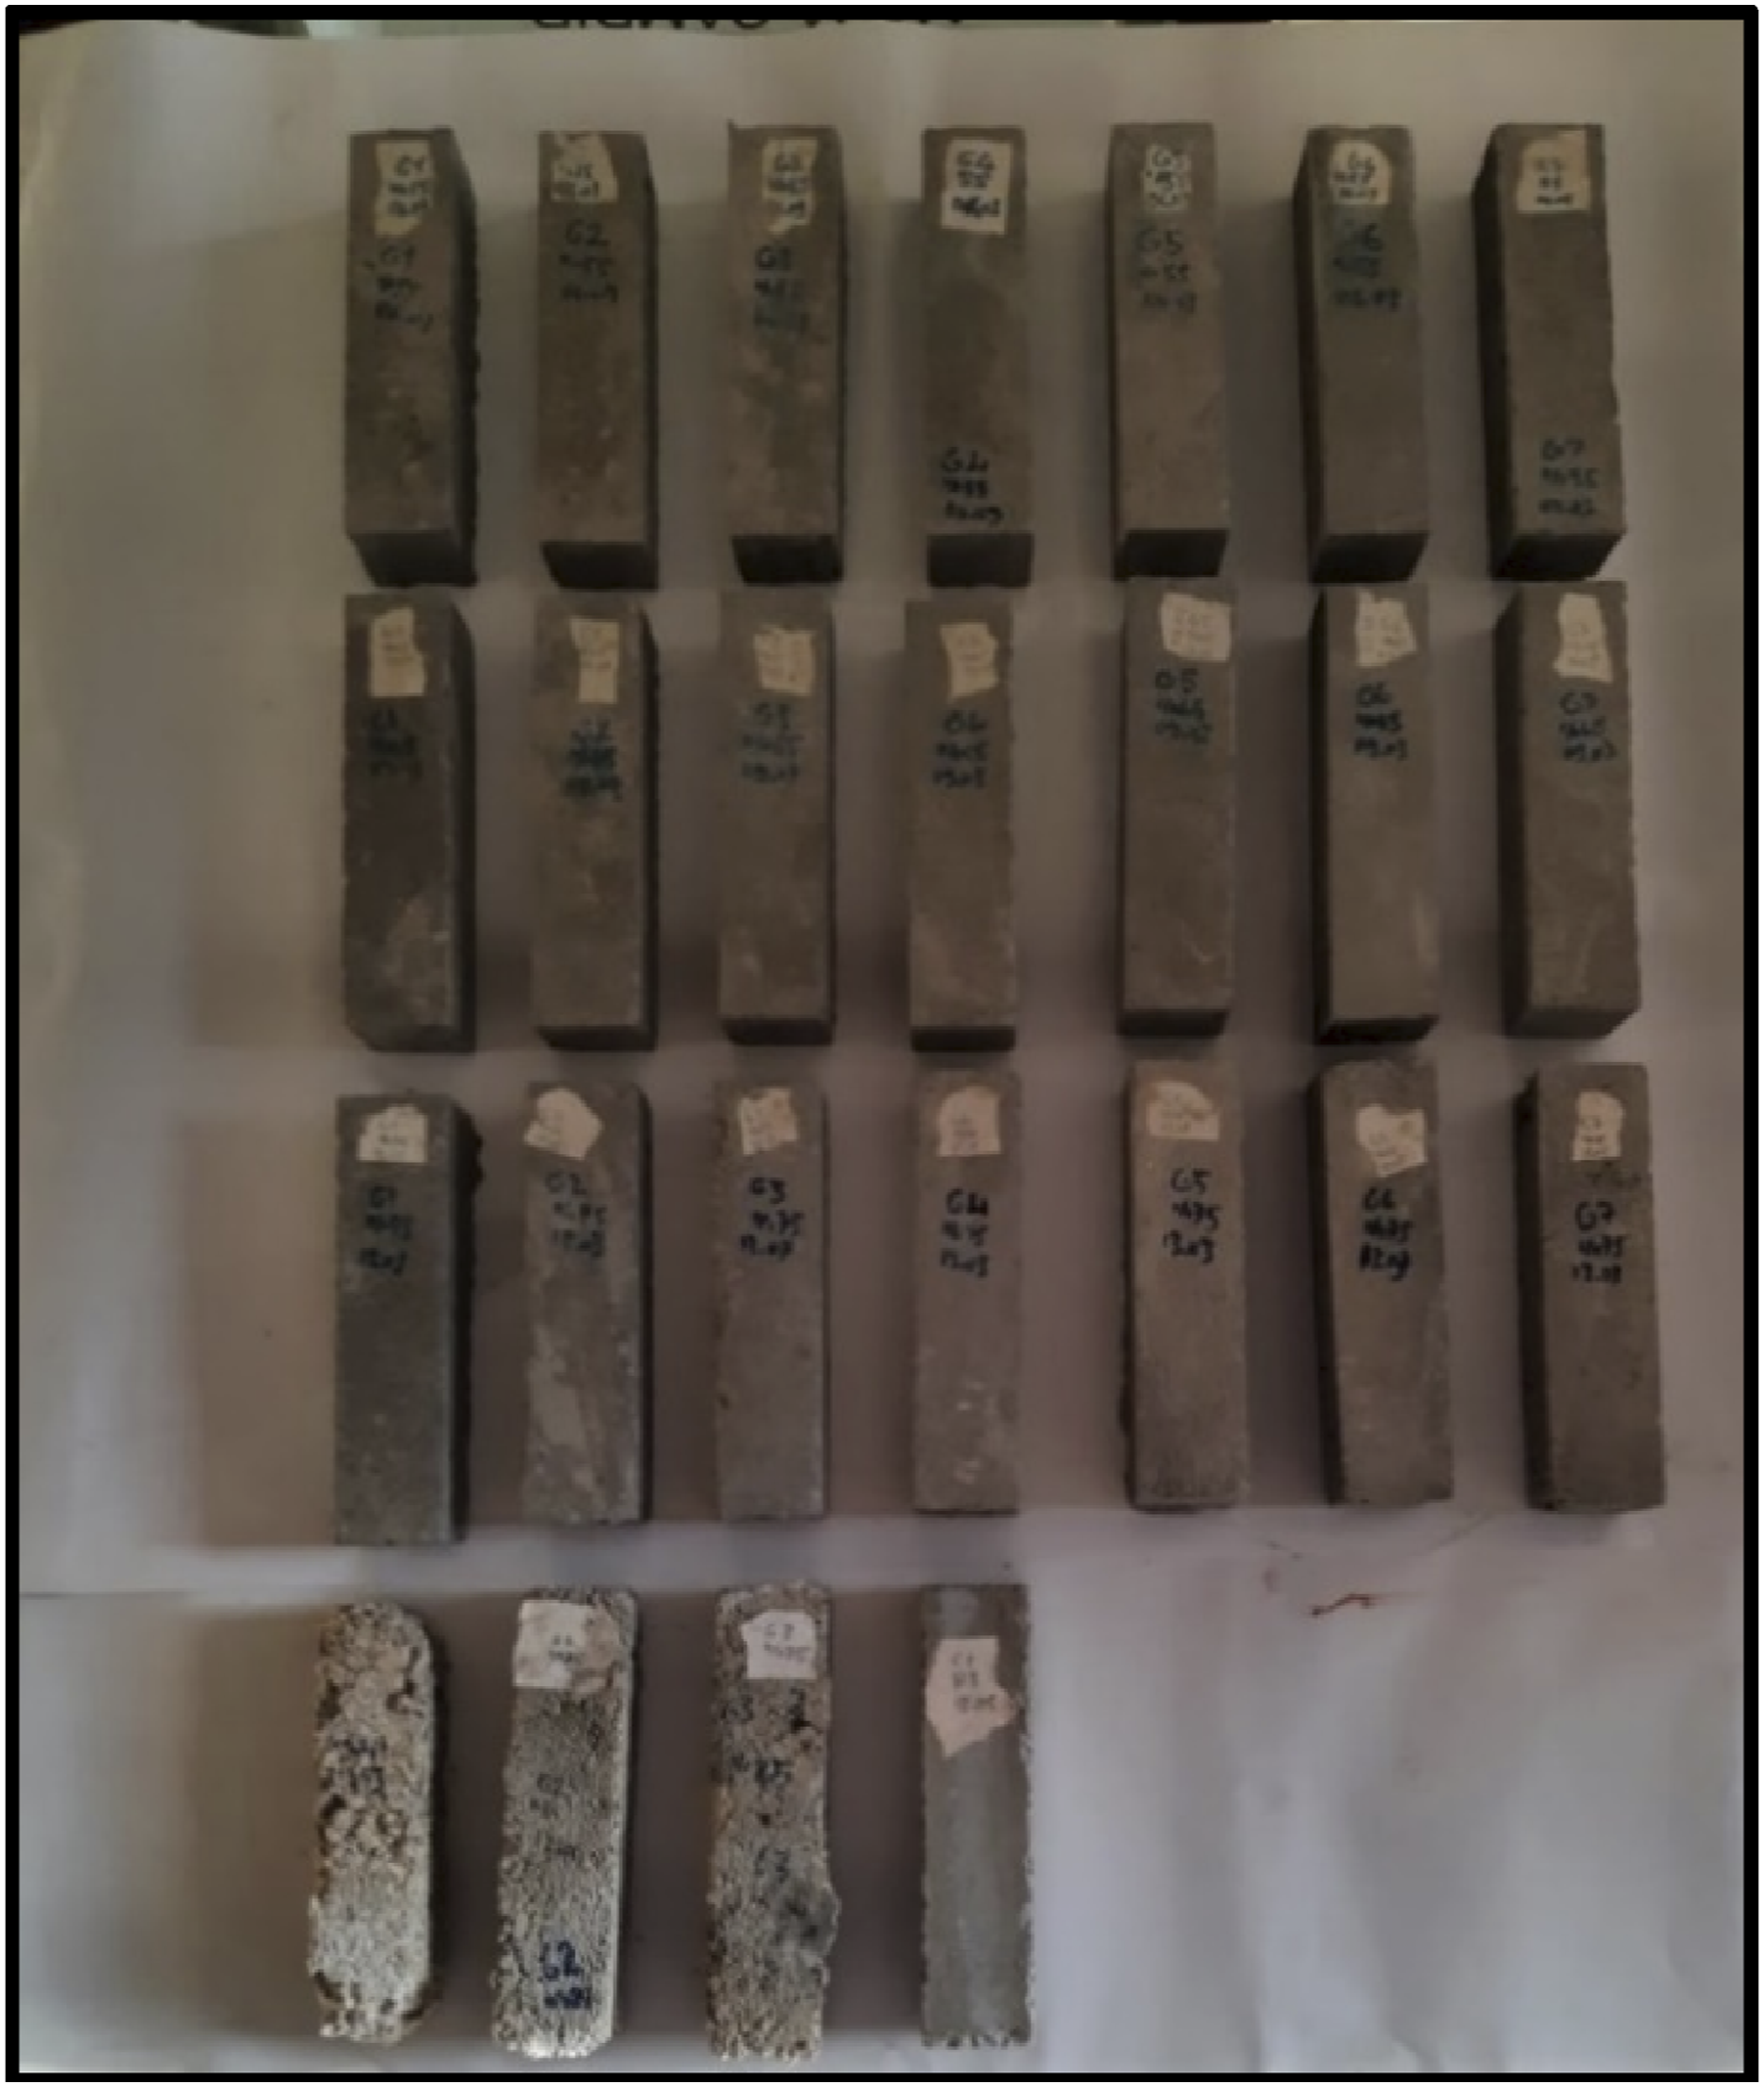
Natural aggregates
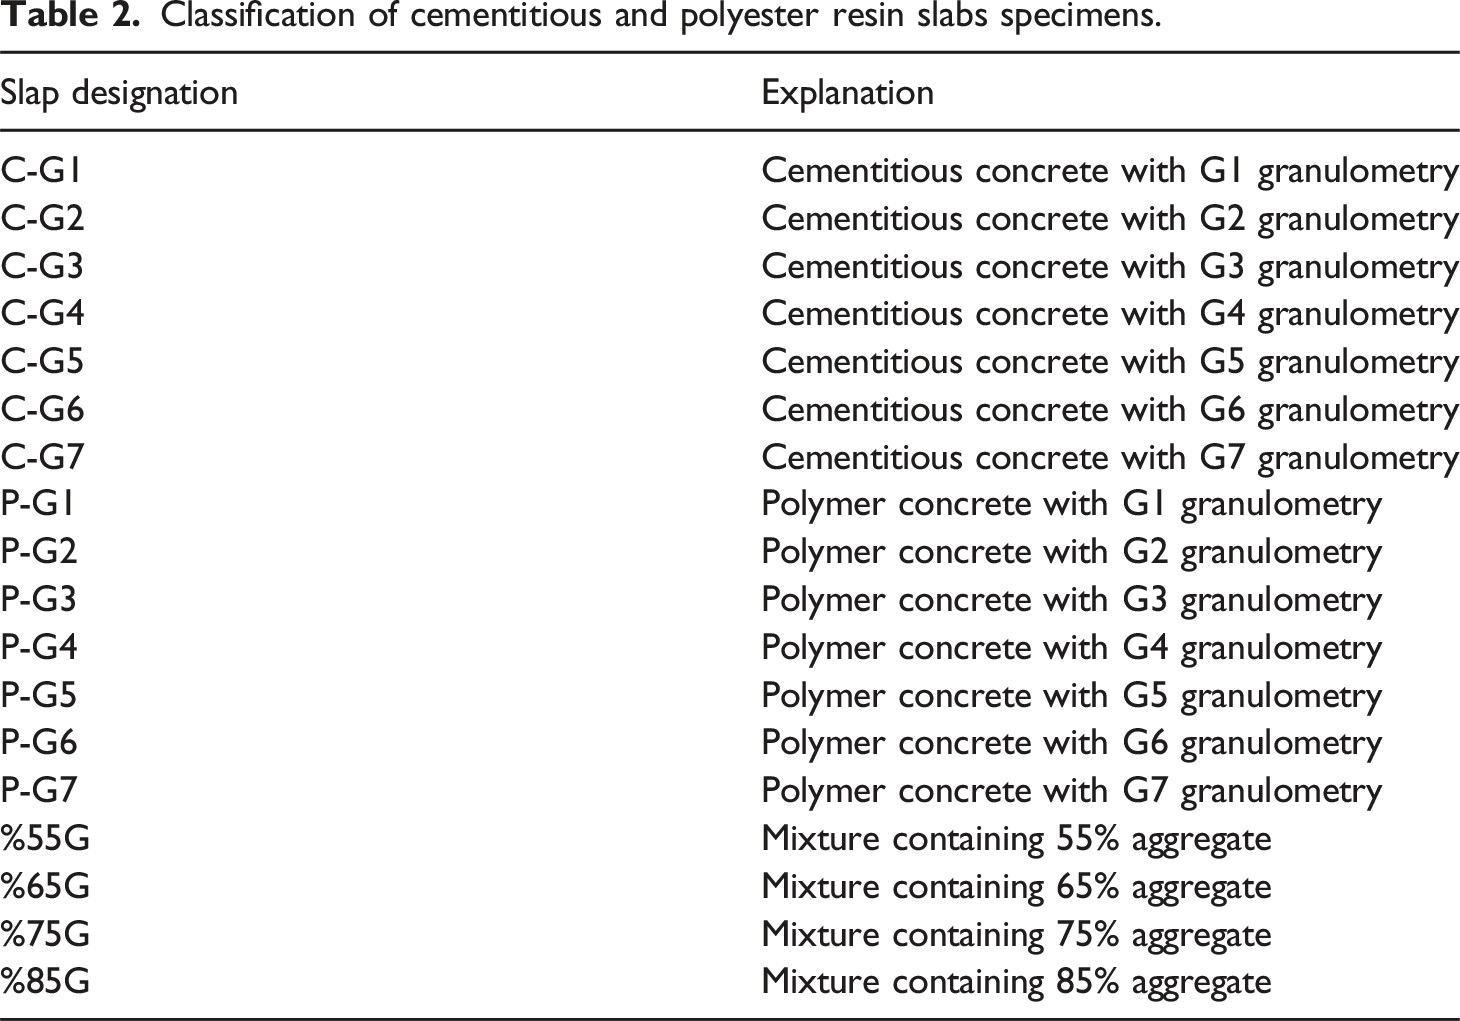
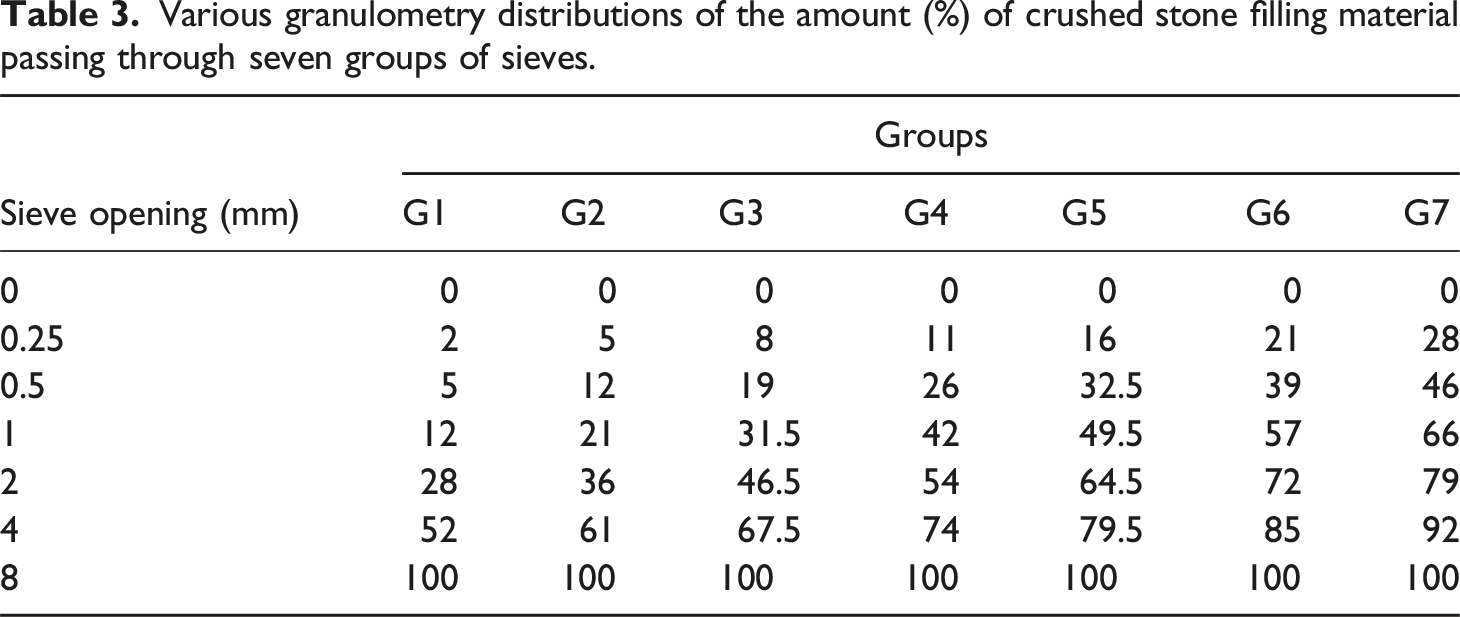
In the work, dolomite-limestone origin aggregate obtained from the quarries in the Iskenderun region was used. In concrete production, the usage rate of the aggregate with a particle diameter of 0–8 mm (Figure 2) is 50% by weight. The physical details of the aggregates employed in this research are presented in Tables 1–3. Crushed stone used in the mixture divided into groups in the range of 0 to 8 mm grain diameter. Classification of cementitious and polyester resin slabs specimens. Various granulometry distributions of the amount (%) of crushed stone filling material passing through seven groups of sieves.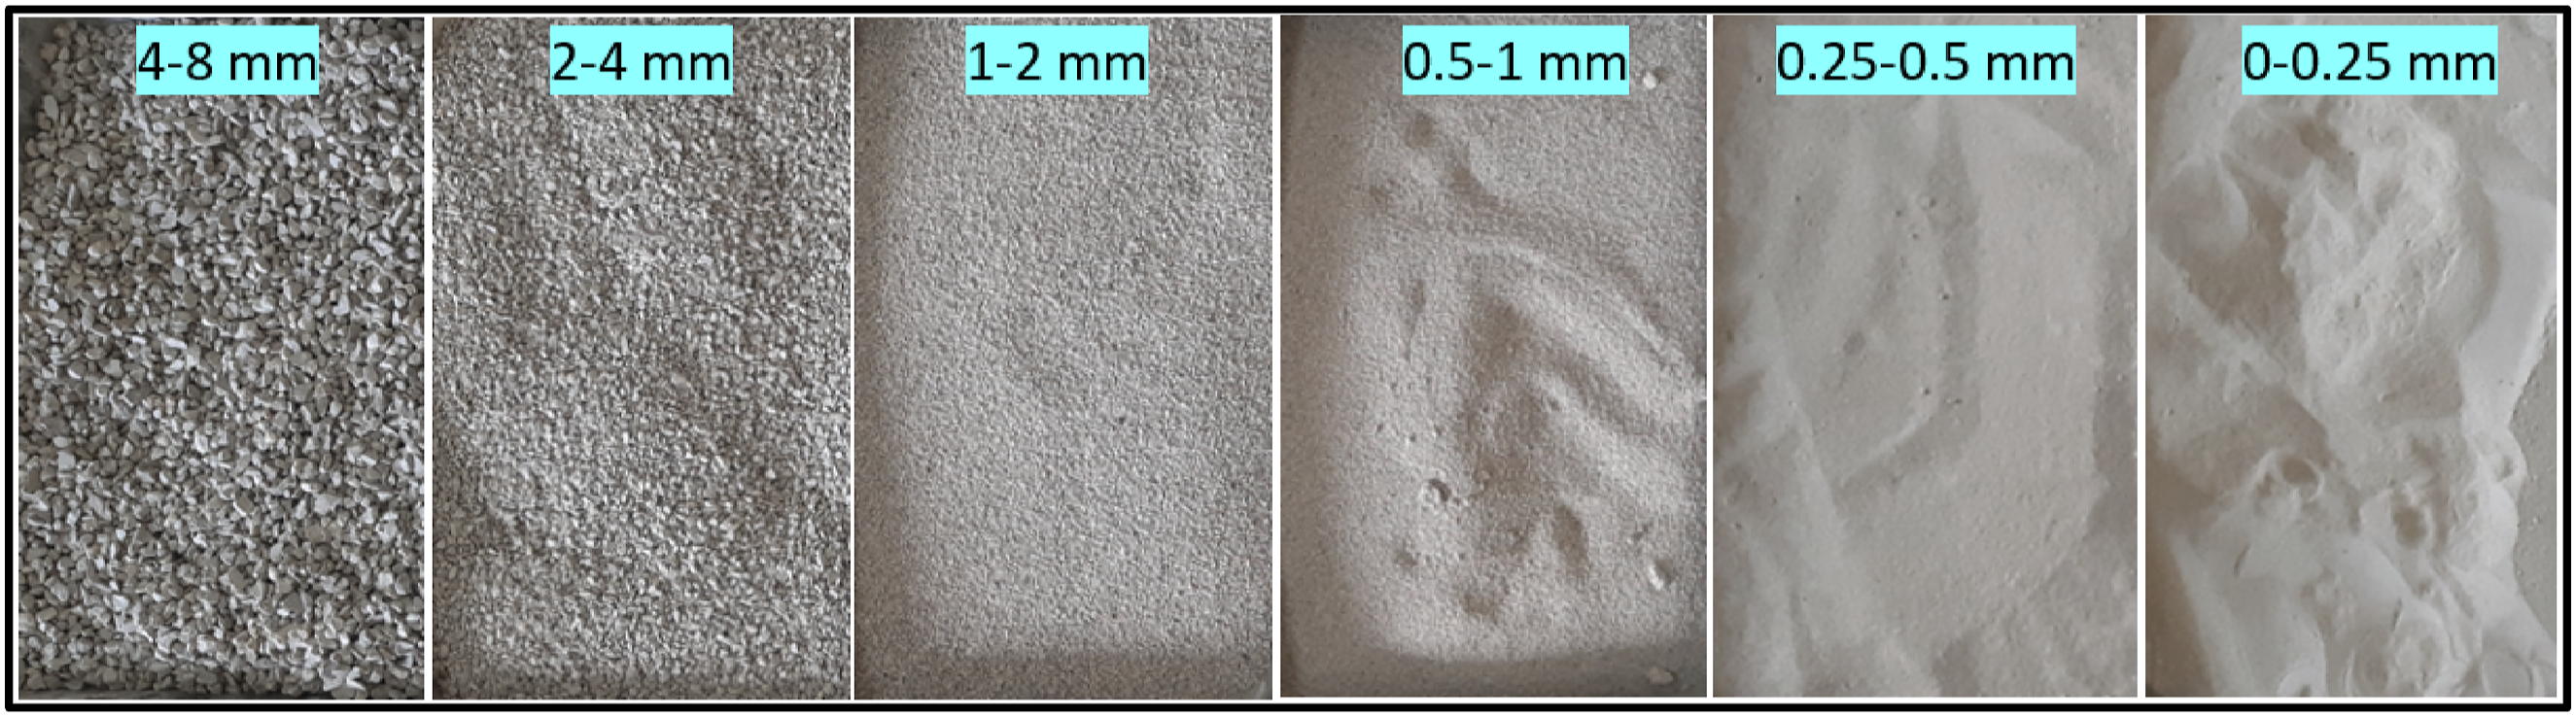
Polyester resin
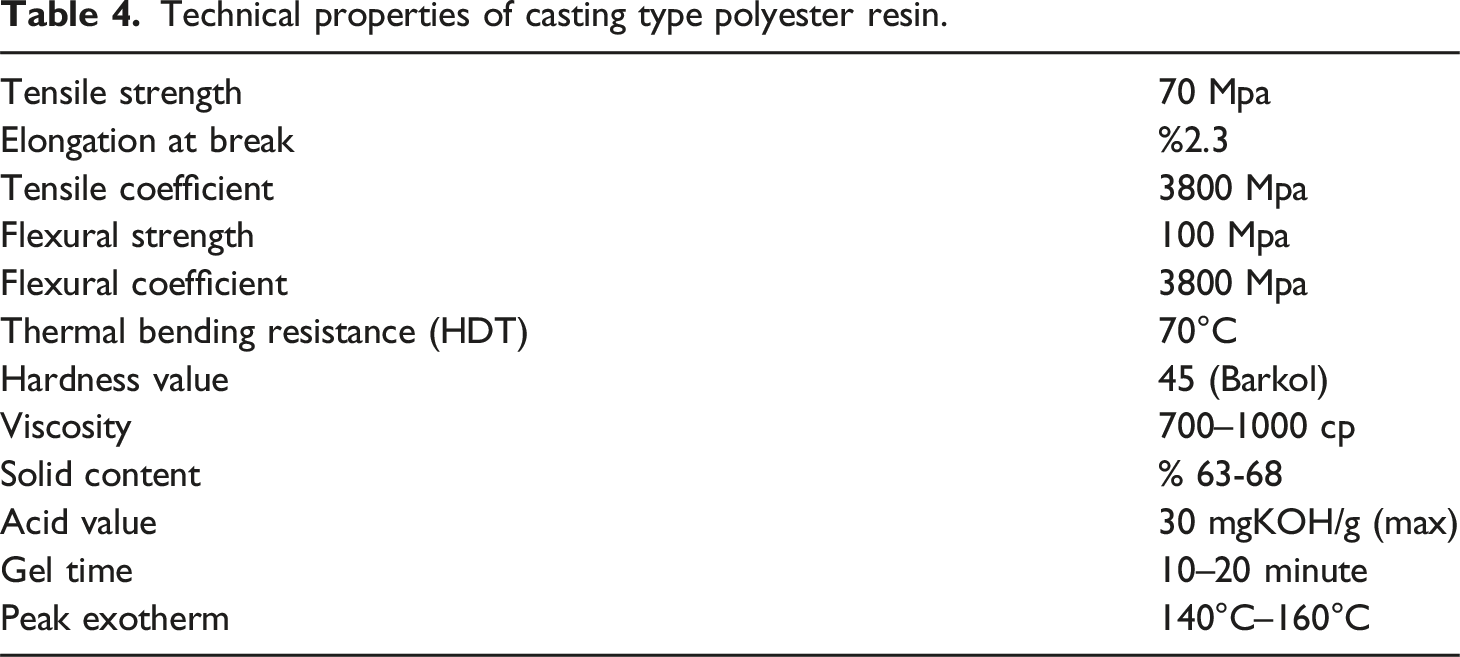
In this study, orthophthalic polyester resin was used in the production of polymer concrete (Figure 3). The Cobalt Octoate accelerator and MEK-P freezer were mixed with polyester resin. Tables 1 and 4 shows the properties of polyester resin used. Sample of the matrix material and polymer concrete prepared for the bending and compression test. Technical properties of casting type polyester resin.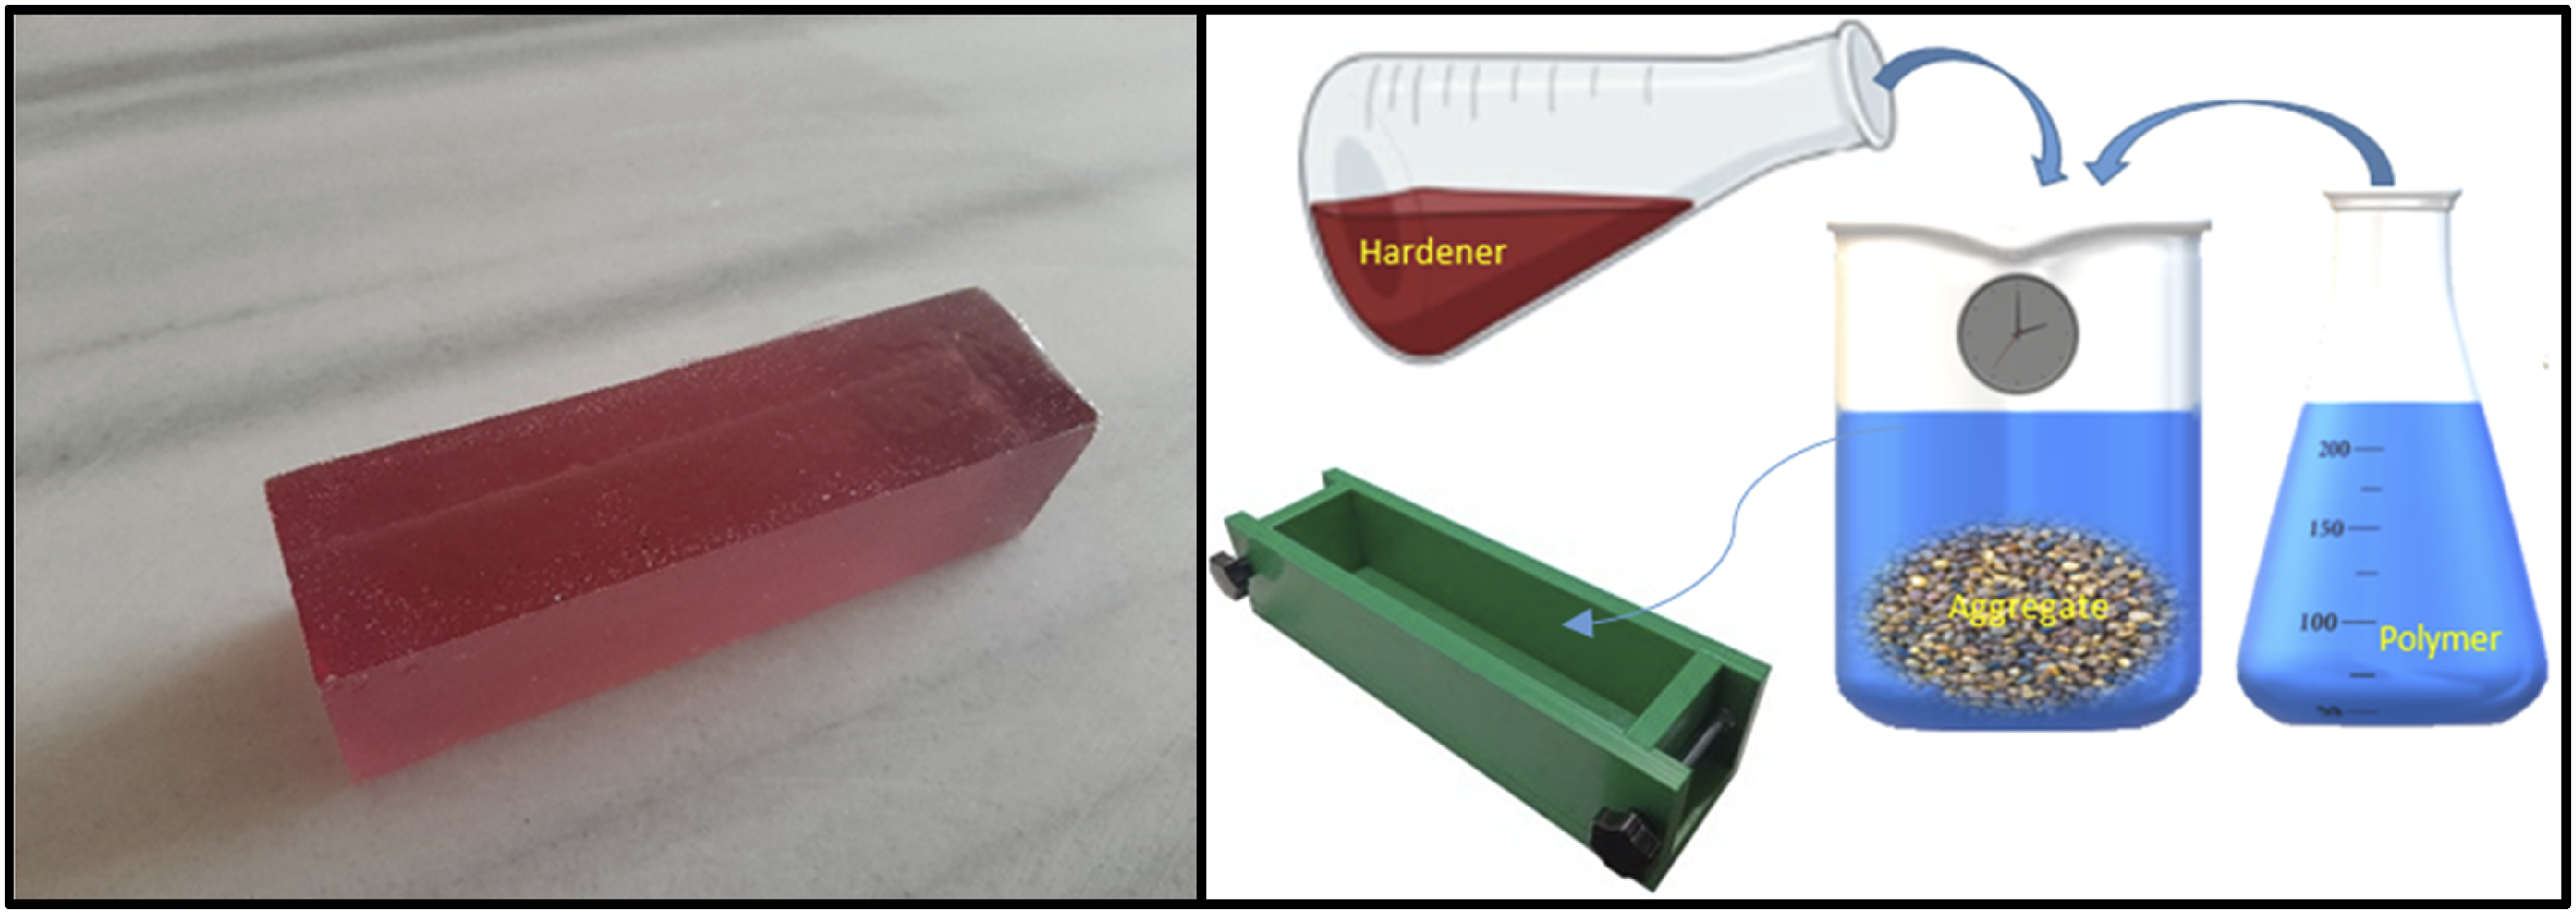
Production of test specimens
In the study, a total of 168 samples were produced, 84 for polymer concrete and 84 for cement concrete. The classification of these samples is as follows; four kinds of percentage mix types (55%,65%,75%,85%) seven types of granulometry in each percentage mix type (G1, G2, G3, G4, G5, G6, G7) and three samples for each granulometry group were produced from cemented concrete and polymer concrete samples. Three samples were produced for each classification and the results obtained for the three samples produced were averaged. The naming and properties of the materials of the produced samples are shown in Tables 1 and 2, respectively.
The test sieve sets required for grouping the aggregates according to the grain sizes in the determined standards are selected according to EN 12620, 23 ISO 3310-1, 24 ISO 3310-2, 25 ASTM C136-137 26 standards and are wire mesh with 0.25, 0.50, 1.0, 2.0, 4.0, 8.0 mm grain sizes. Sieve analysis of aggregates was performed using square-hole sieves and sieve shakers (Table 2).
In the study, the maximum grain size was designed as 8 mm. As seen in Figure 4, various aggregate granulometry curves are given from G1 to G7. In Table 3, the amount of crushed stone material passed under the seven sieves determined for the granulometric distribution is given as a percentage (%). In standard granulometry curves, the region between the A and B curves is defined as the region where the aggregate distribution is very good, and the region between the A and C curves is defined as the usable region (Ateş
11
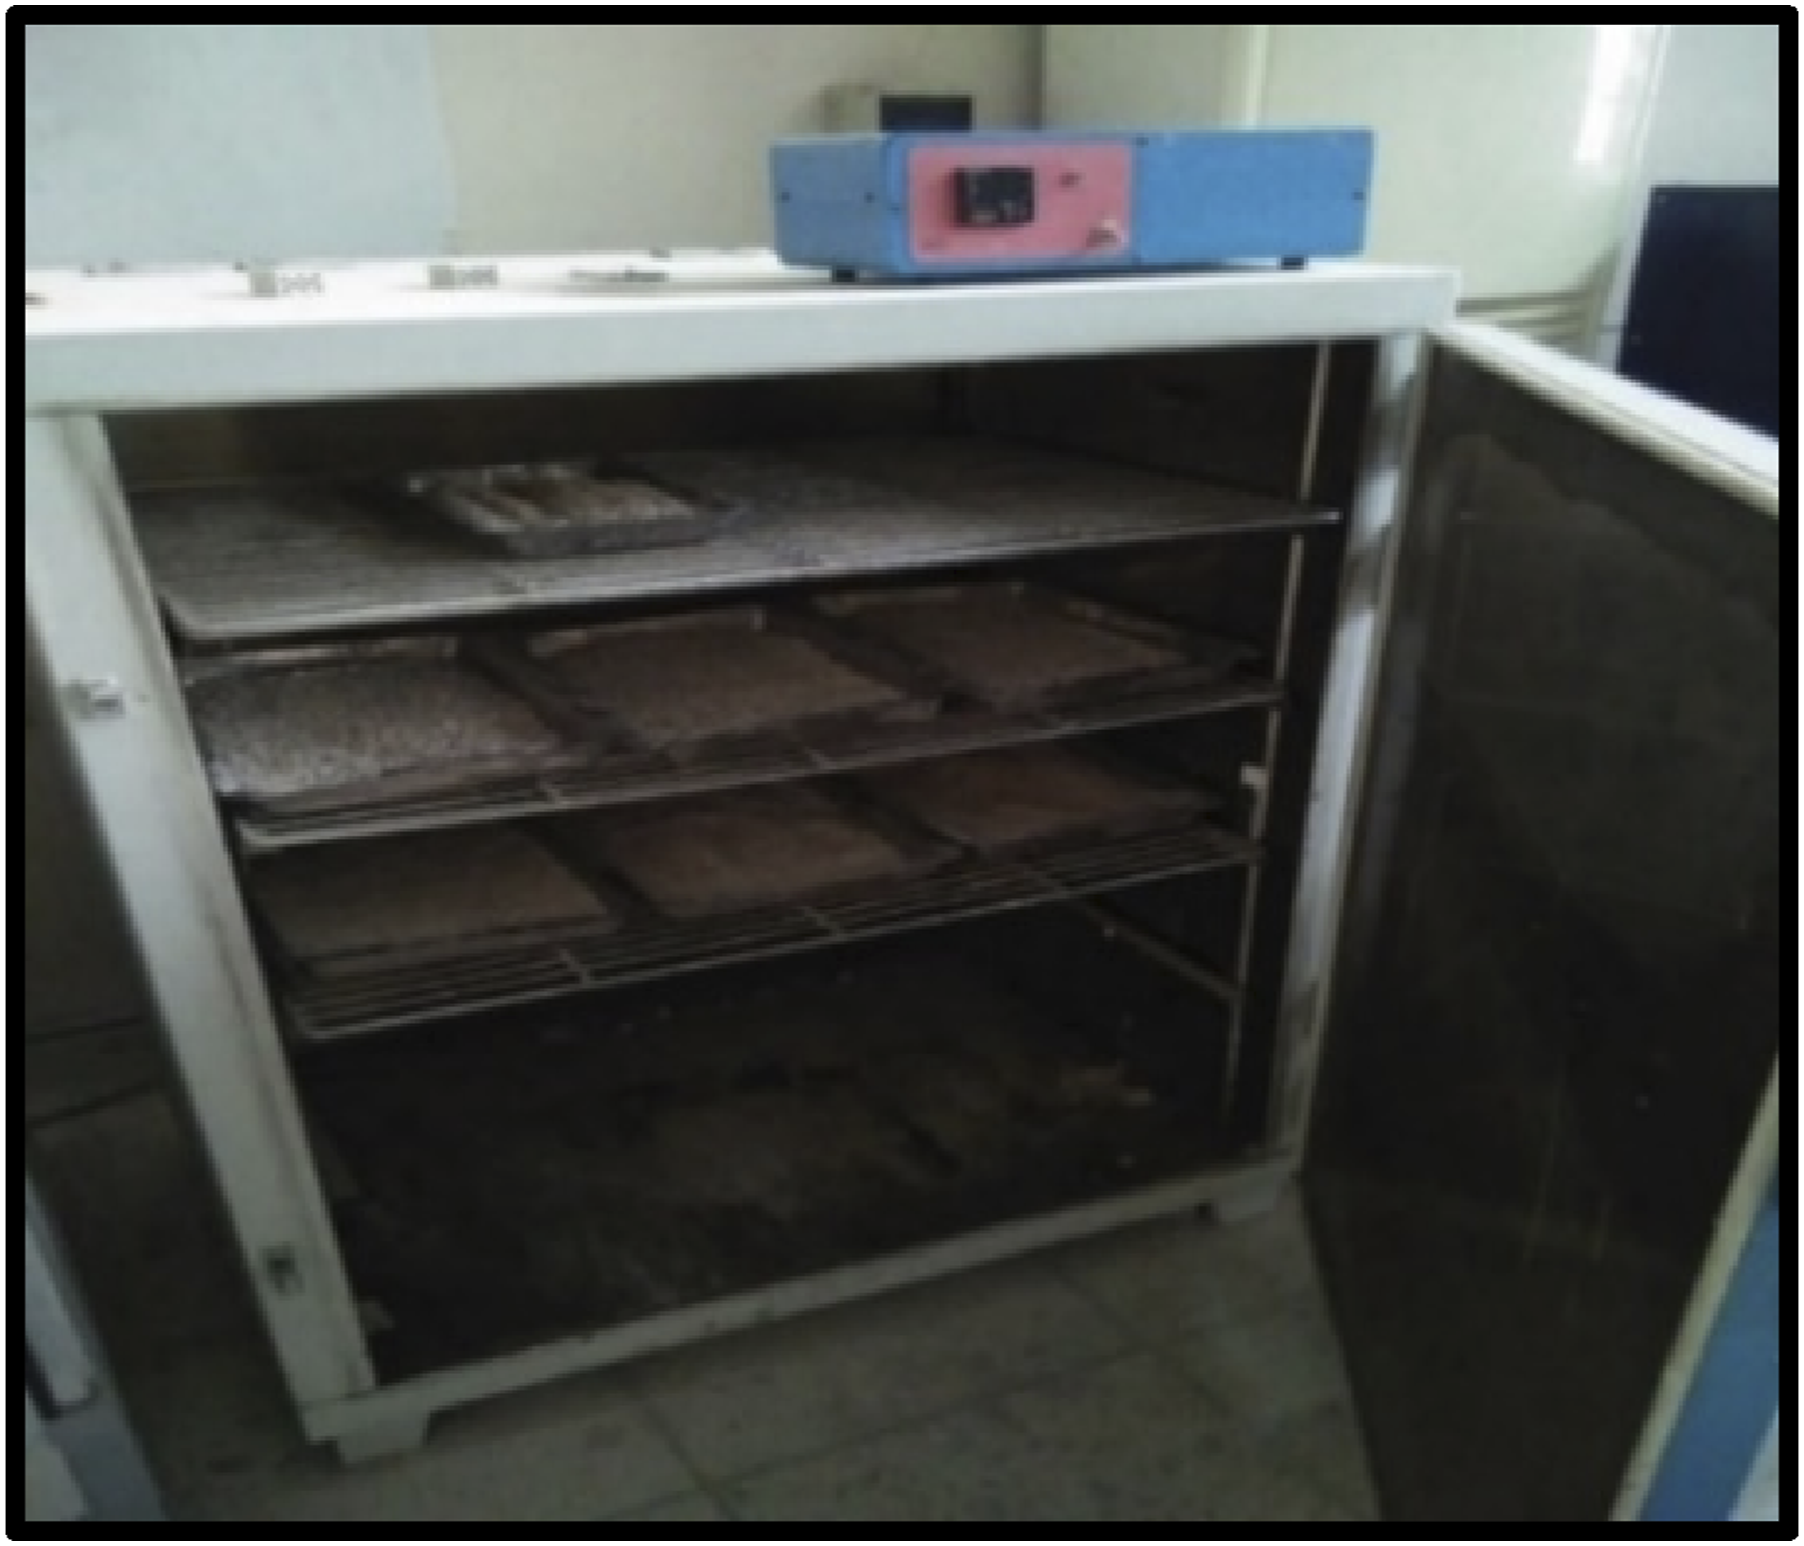
). In Figure 4, our design curves G2, G4 and G6 are drawn the standard A, B, C curves, respectively, G1 below ideal region, G3 between ideal regions, G5 between usable regions and G7 as above usable regions. Cementitious concrete and polymer concrete obtained for different grain distribution in all regions from G1 to G7 in granulometric distribution were produced in various cement and polyester resin ratios. An oven was used to dehumidify the crushed stones used in the experiment (Figure 5). Aggregates were kept in an oven at 110°C for 24 hours. In the study, while producing cementitious concrete, the water-cement ratio was taken as 0.5. The cemented concrete samples produced (Figure 1) were kept in the curing pool for 28 days (ISO 2736-2
27
). Mixed aggregate granulometry curves from one to seven for crushed stone with a maximum grain size of 8.0 mm. Oven used to dehumidify crushed stones.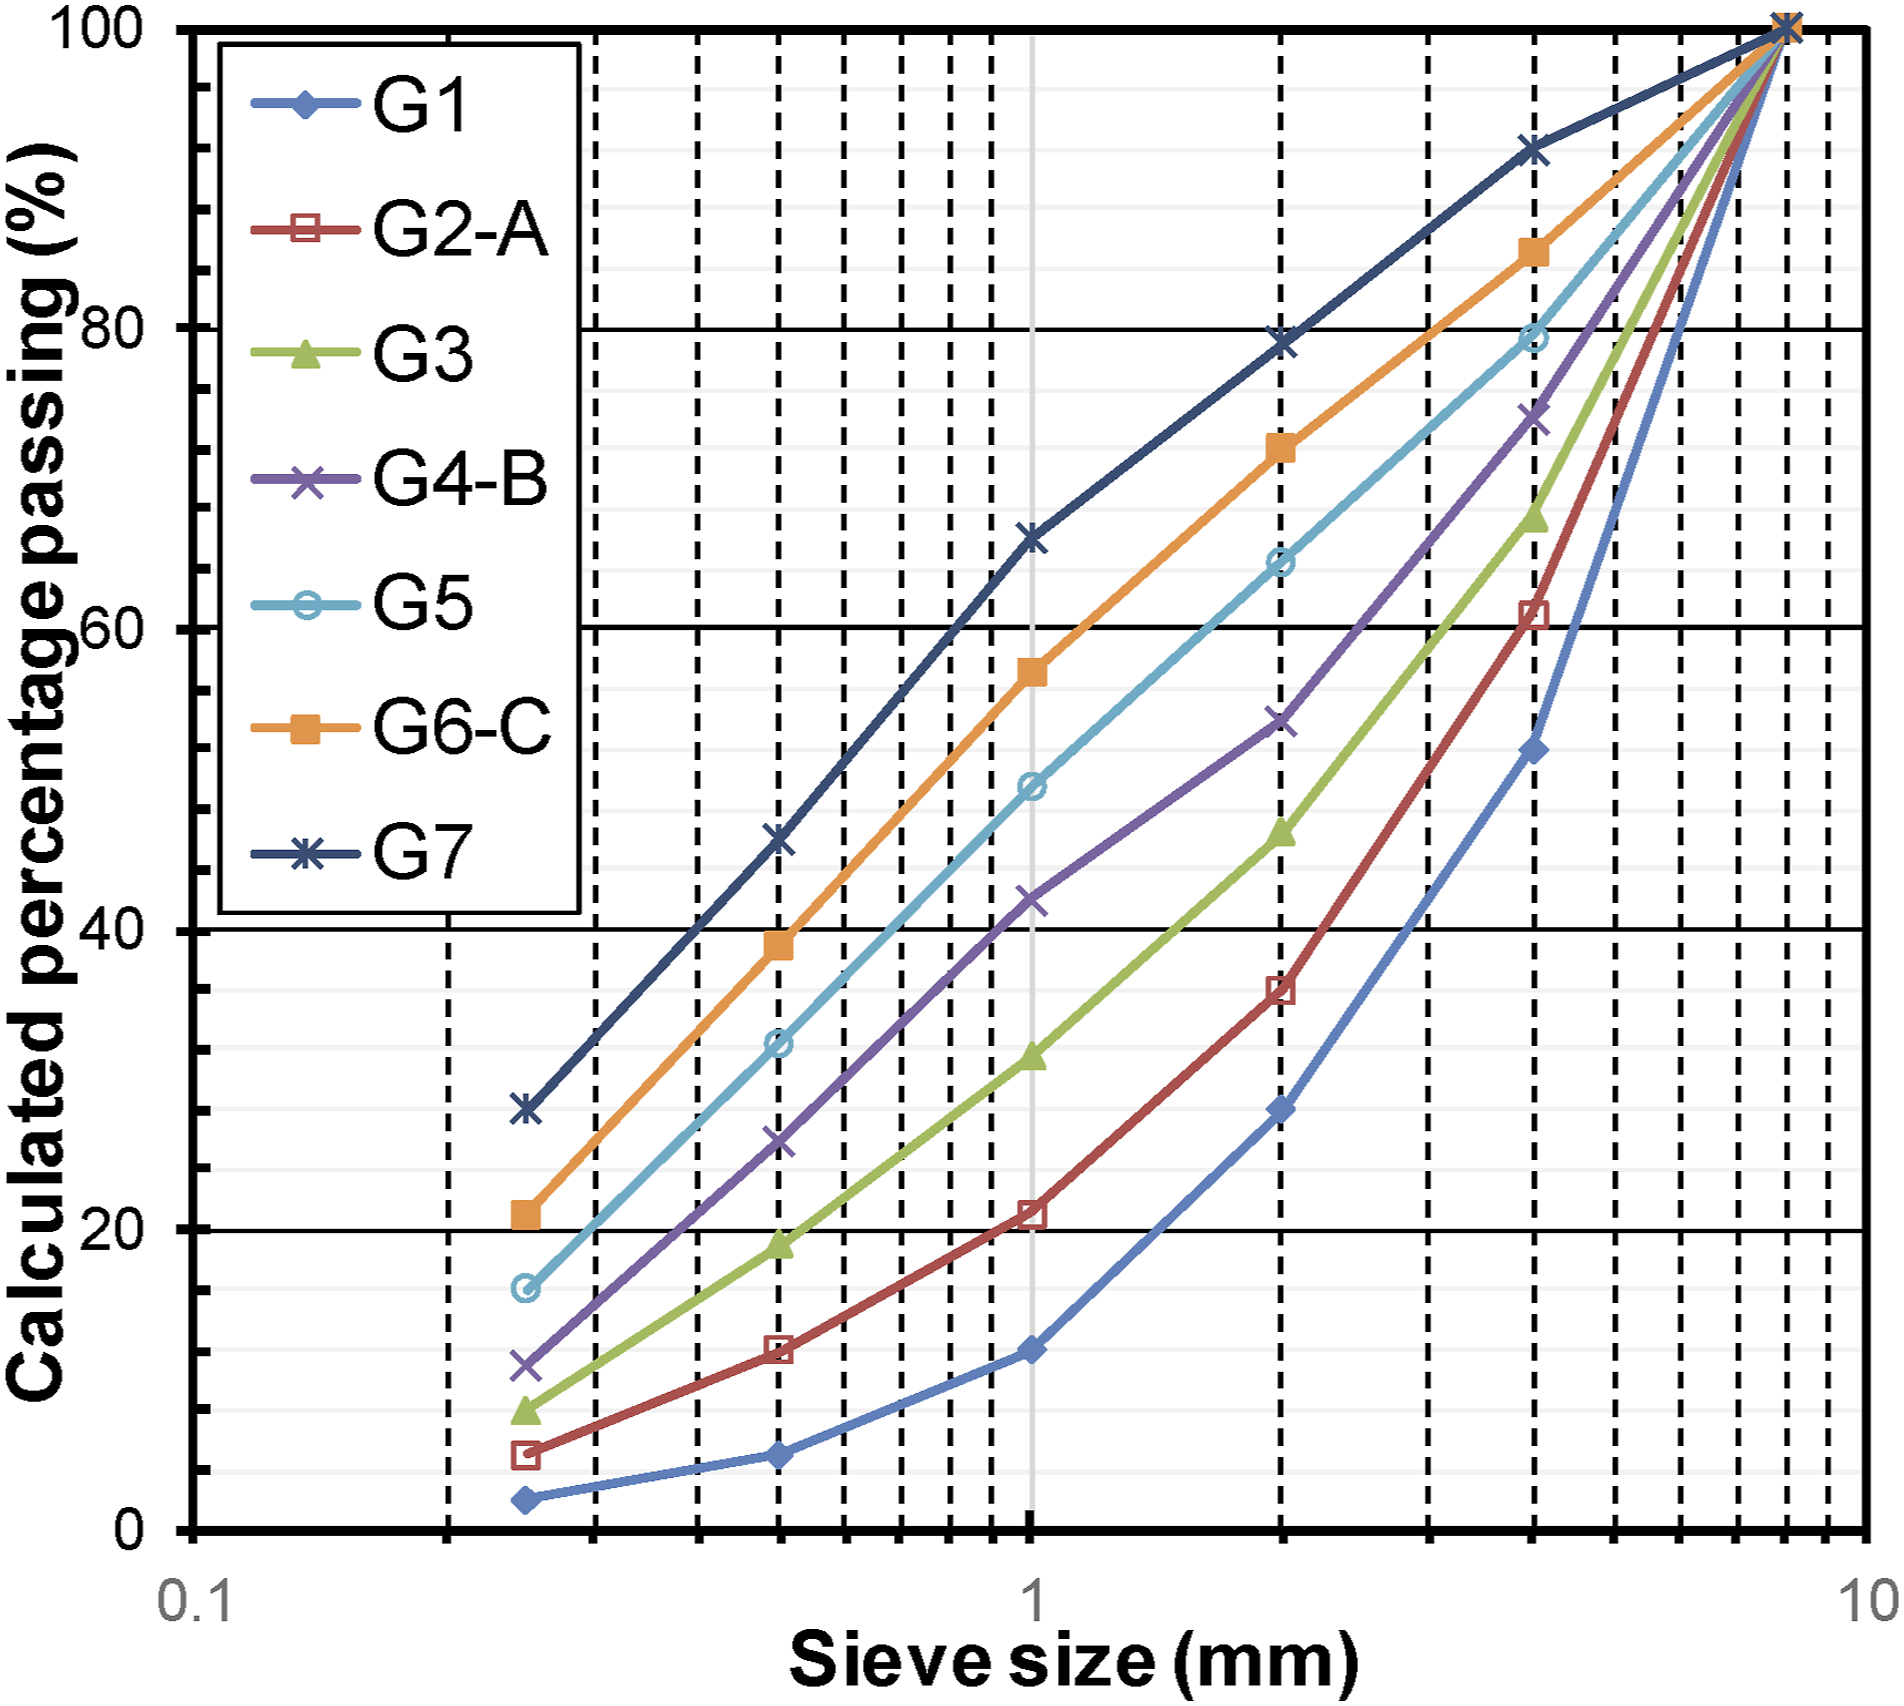
Orthophtatic polyester is used as the polyester resin used in the production of polymer concrete (Table 4). 4 × 4 × 16 cm mold was used in casting. 0.2% by weight of Cobalt Octoate 6% accelerator was mixed into the polyester resin. Then, 1% by weight of MEK-P freezer was added to the casting type polyester resin. After mixing sufficiently, the mixture was poured into molds. After the curing period was completed, the molds were opened. The mechanical properties of the produced composite materials were investigated (Figure 6). Polymer concrete beam specimens.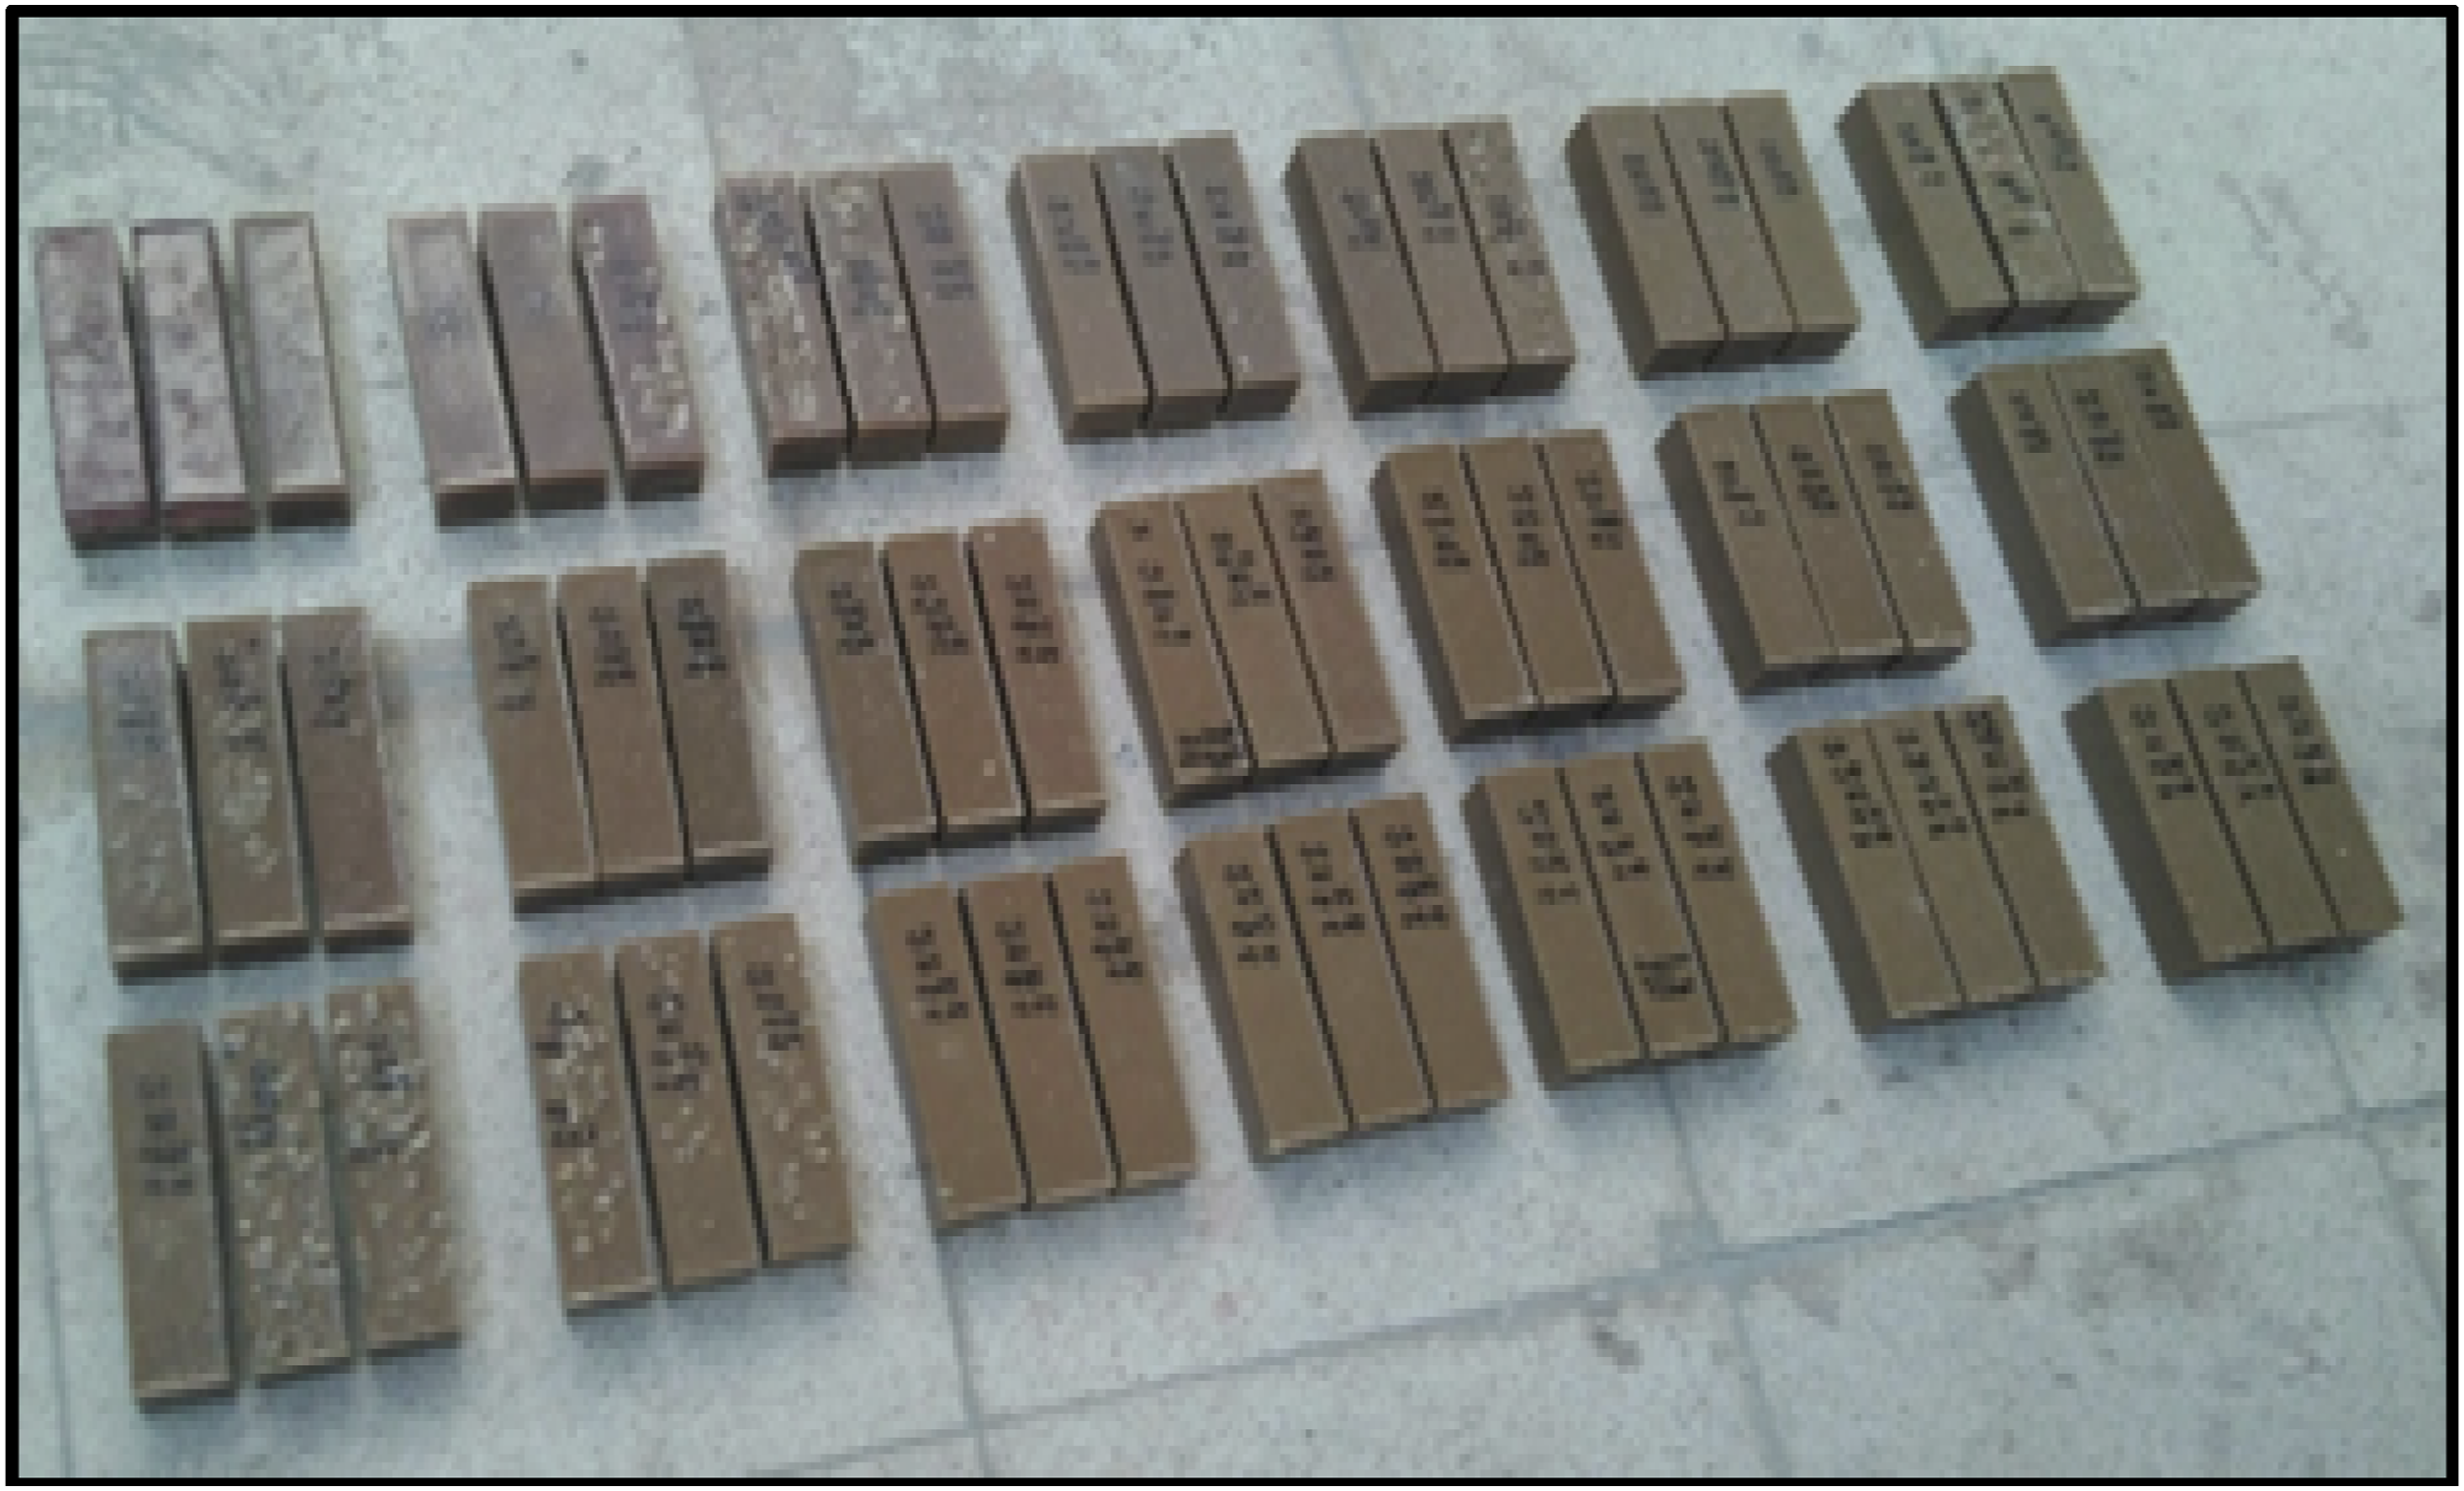
Experimental procedures
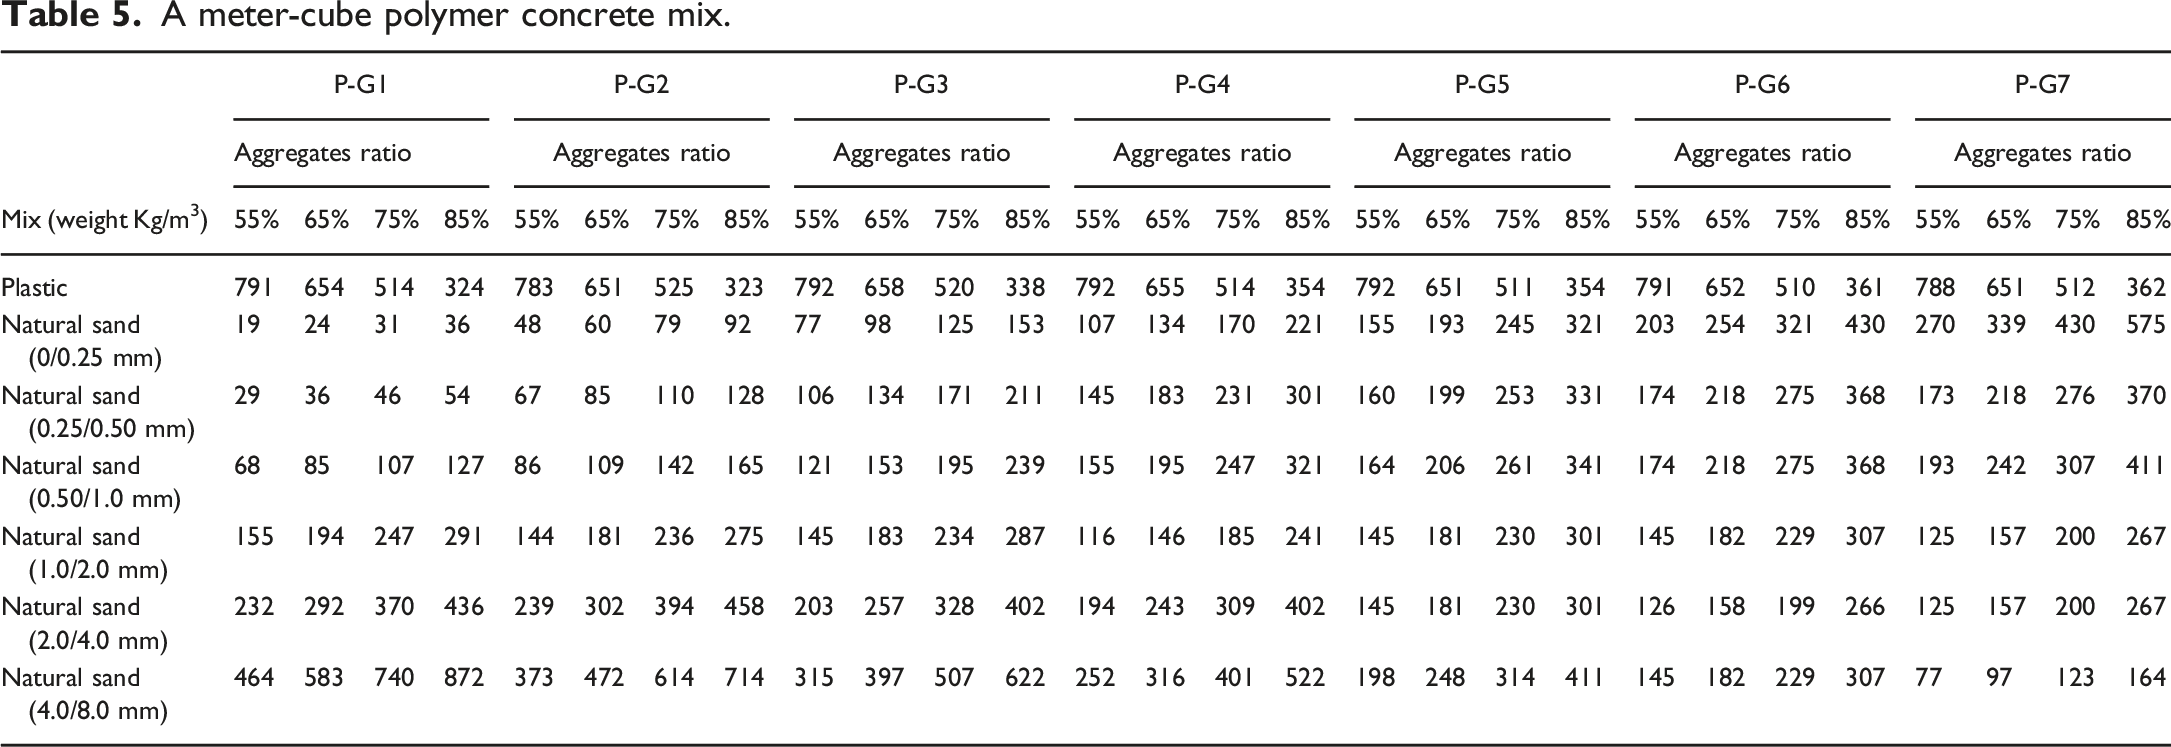
A meter-cube polymer concrete mix.
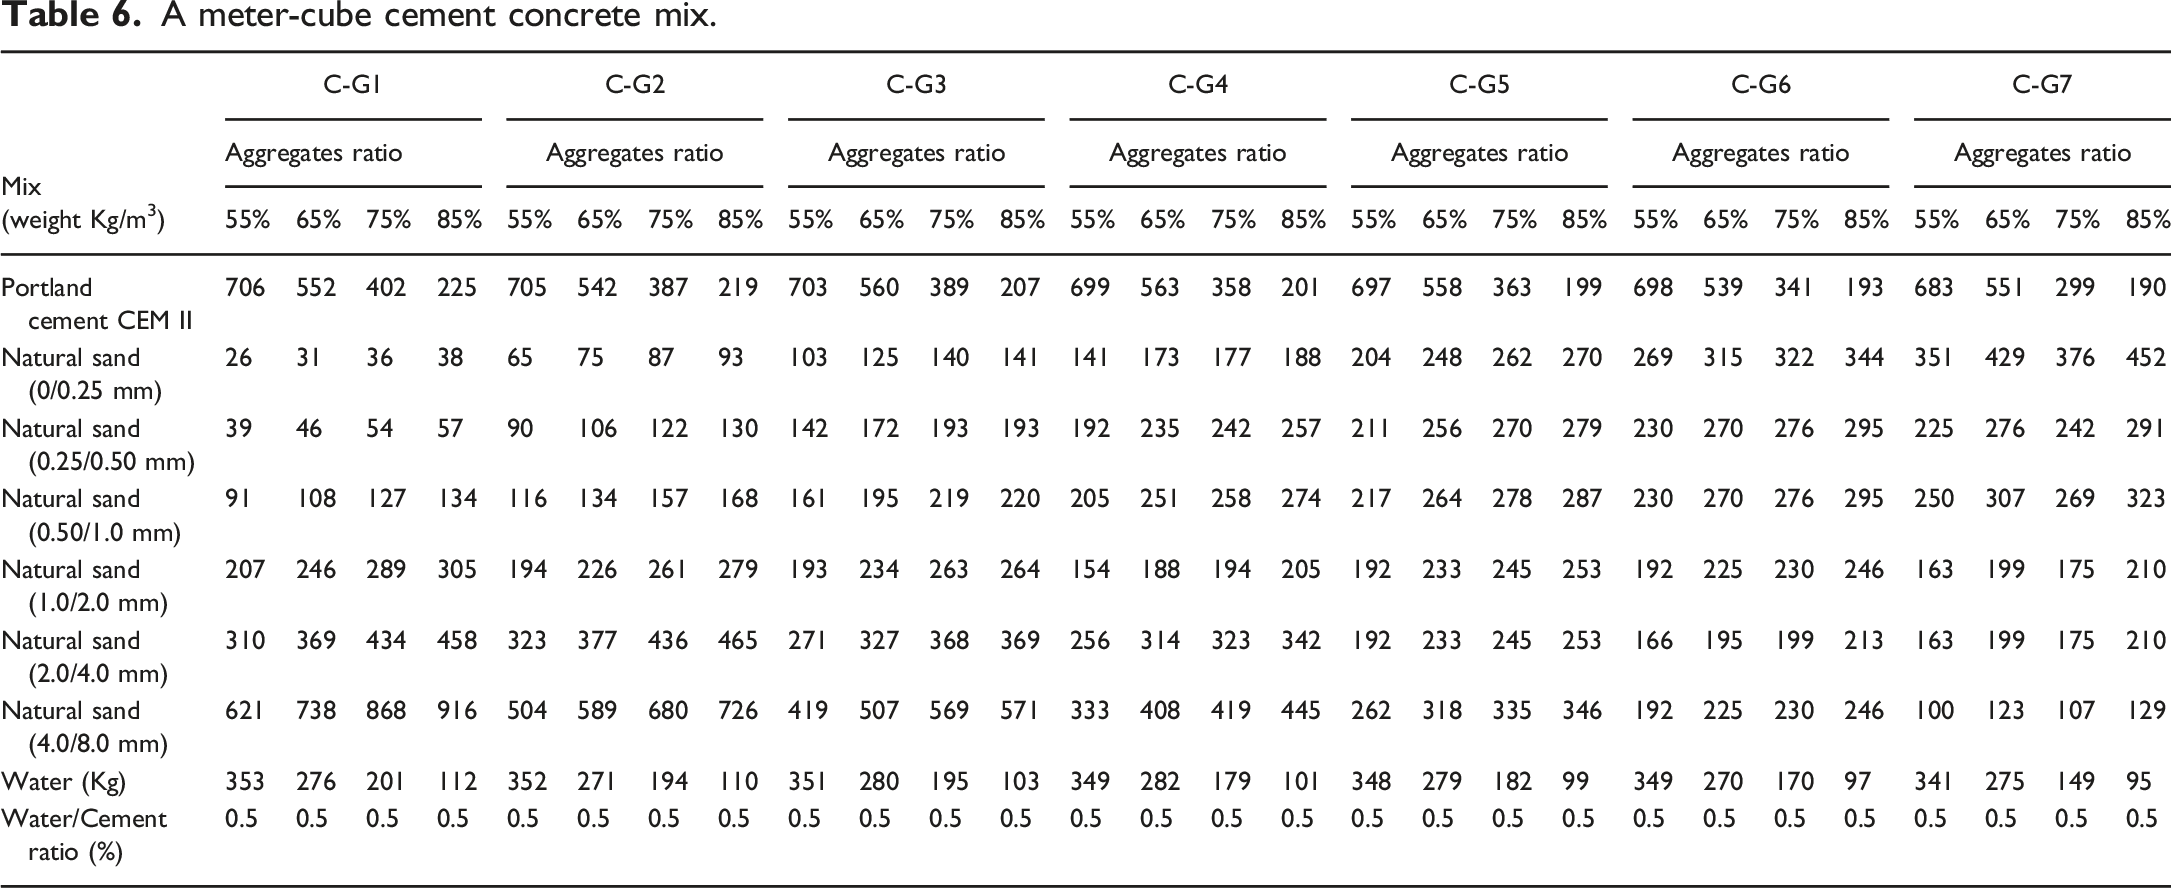
A meter-cube cement concrete mix.
Compression test
Three samples were prepared from each of the above-mentioned mixtures for the pressure test. In the study, 4 × 4 × 4 cm mortar samples cured for 28 days were subjected to a pressure test in accordance with TS EN 12,390-3
30
and TS EN 12,390-4.
33
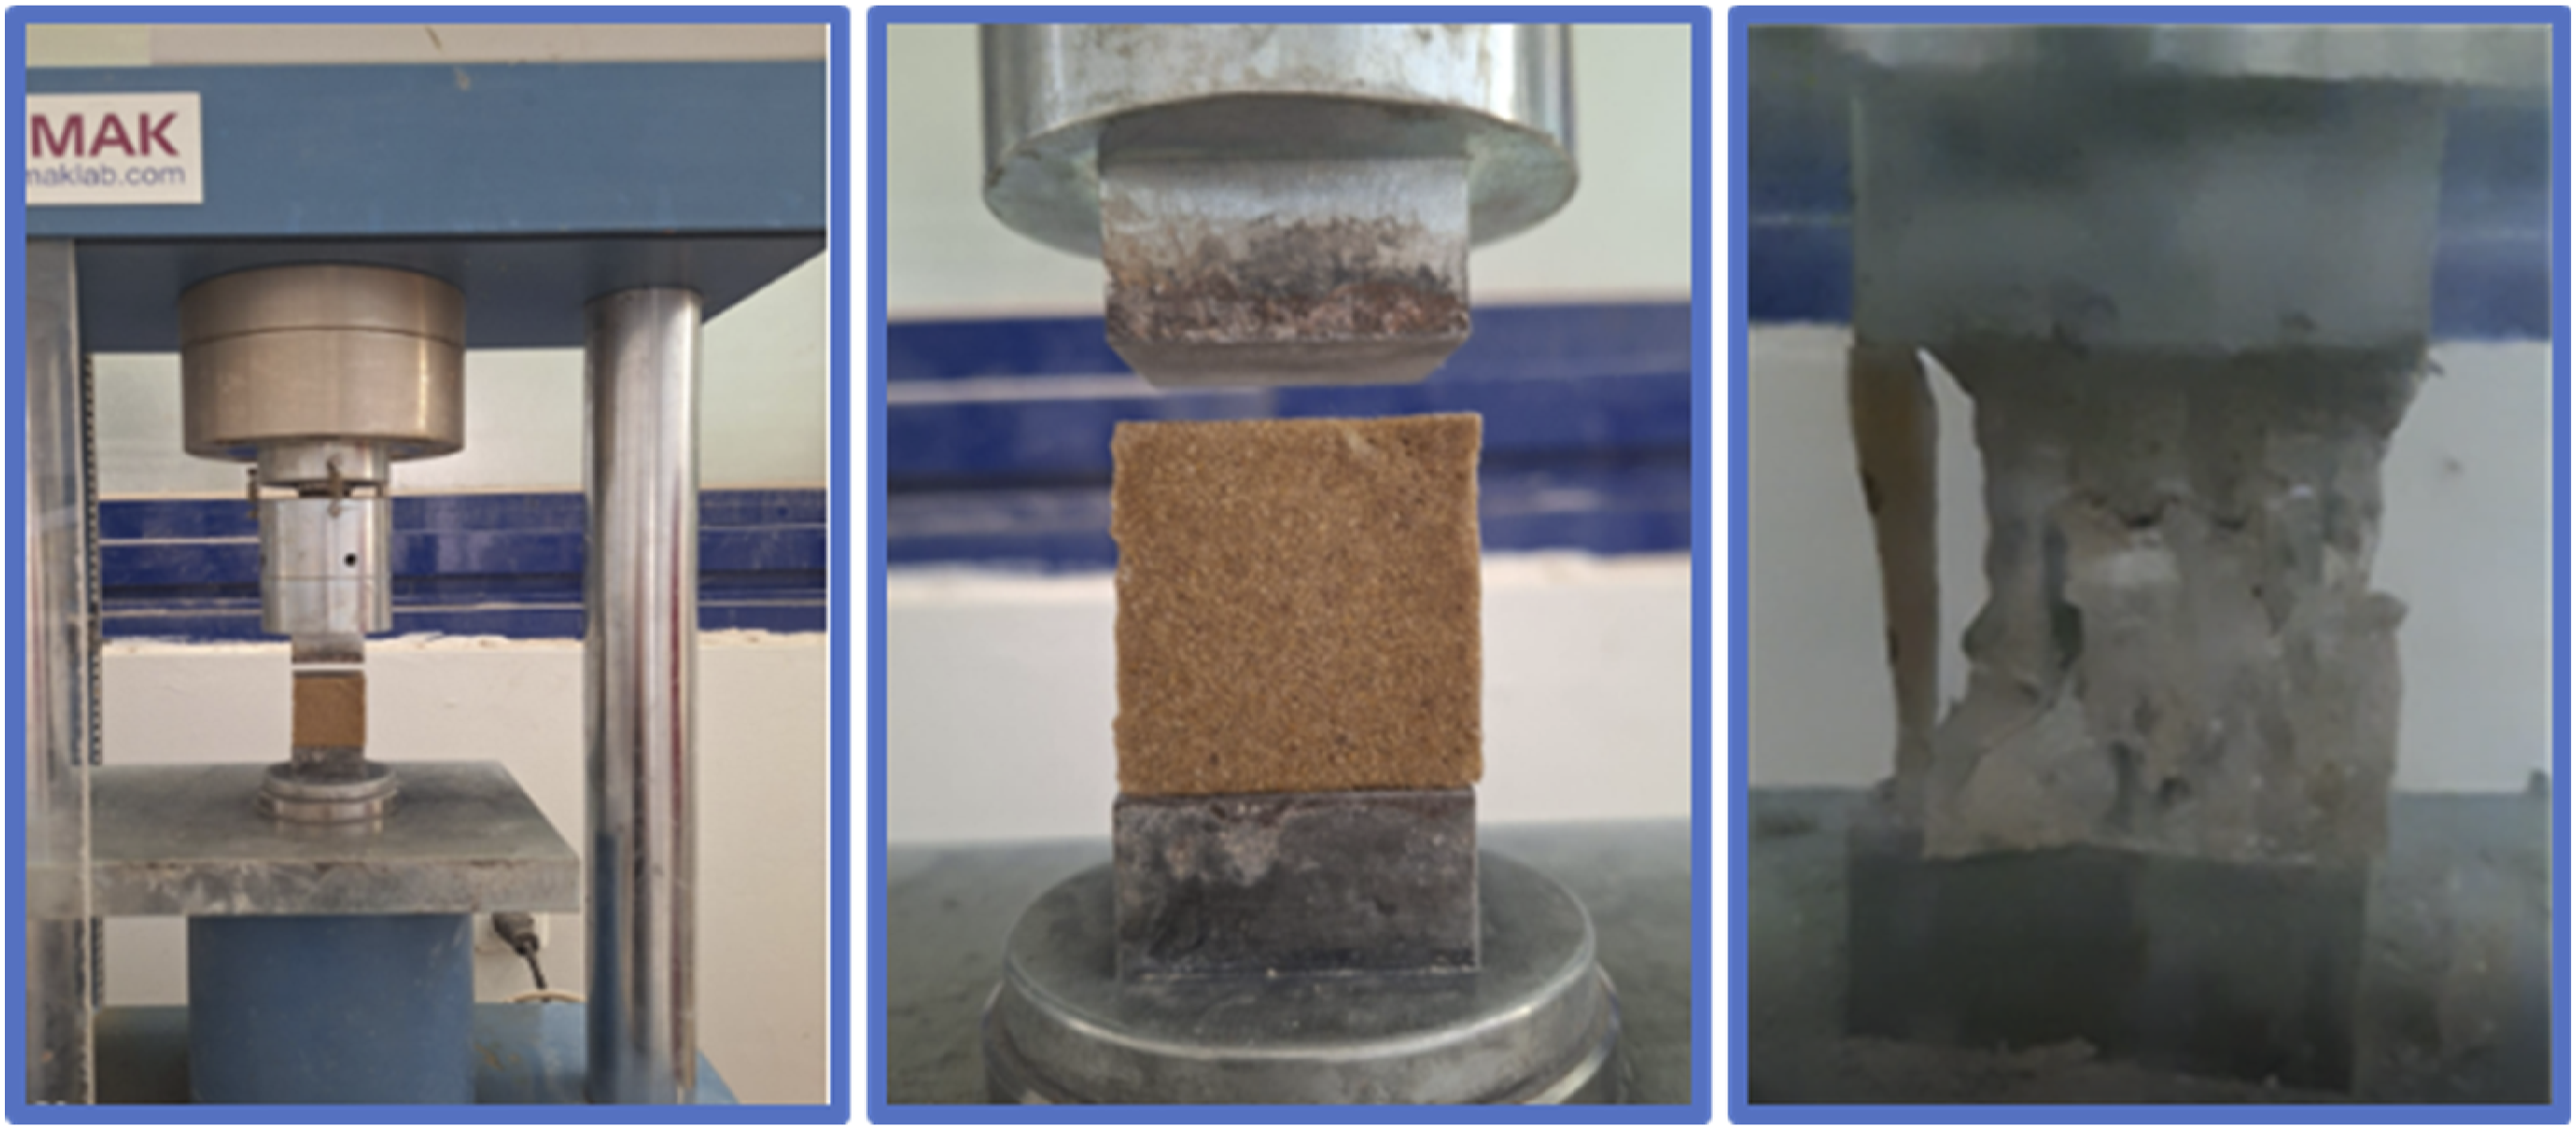
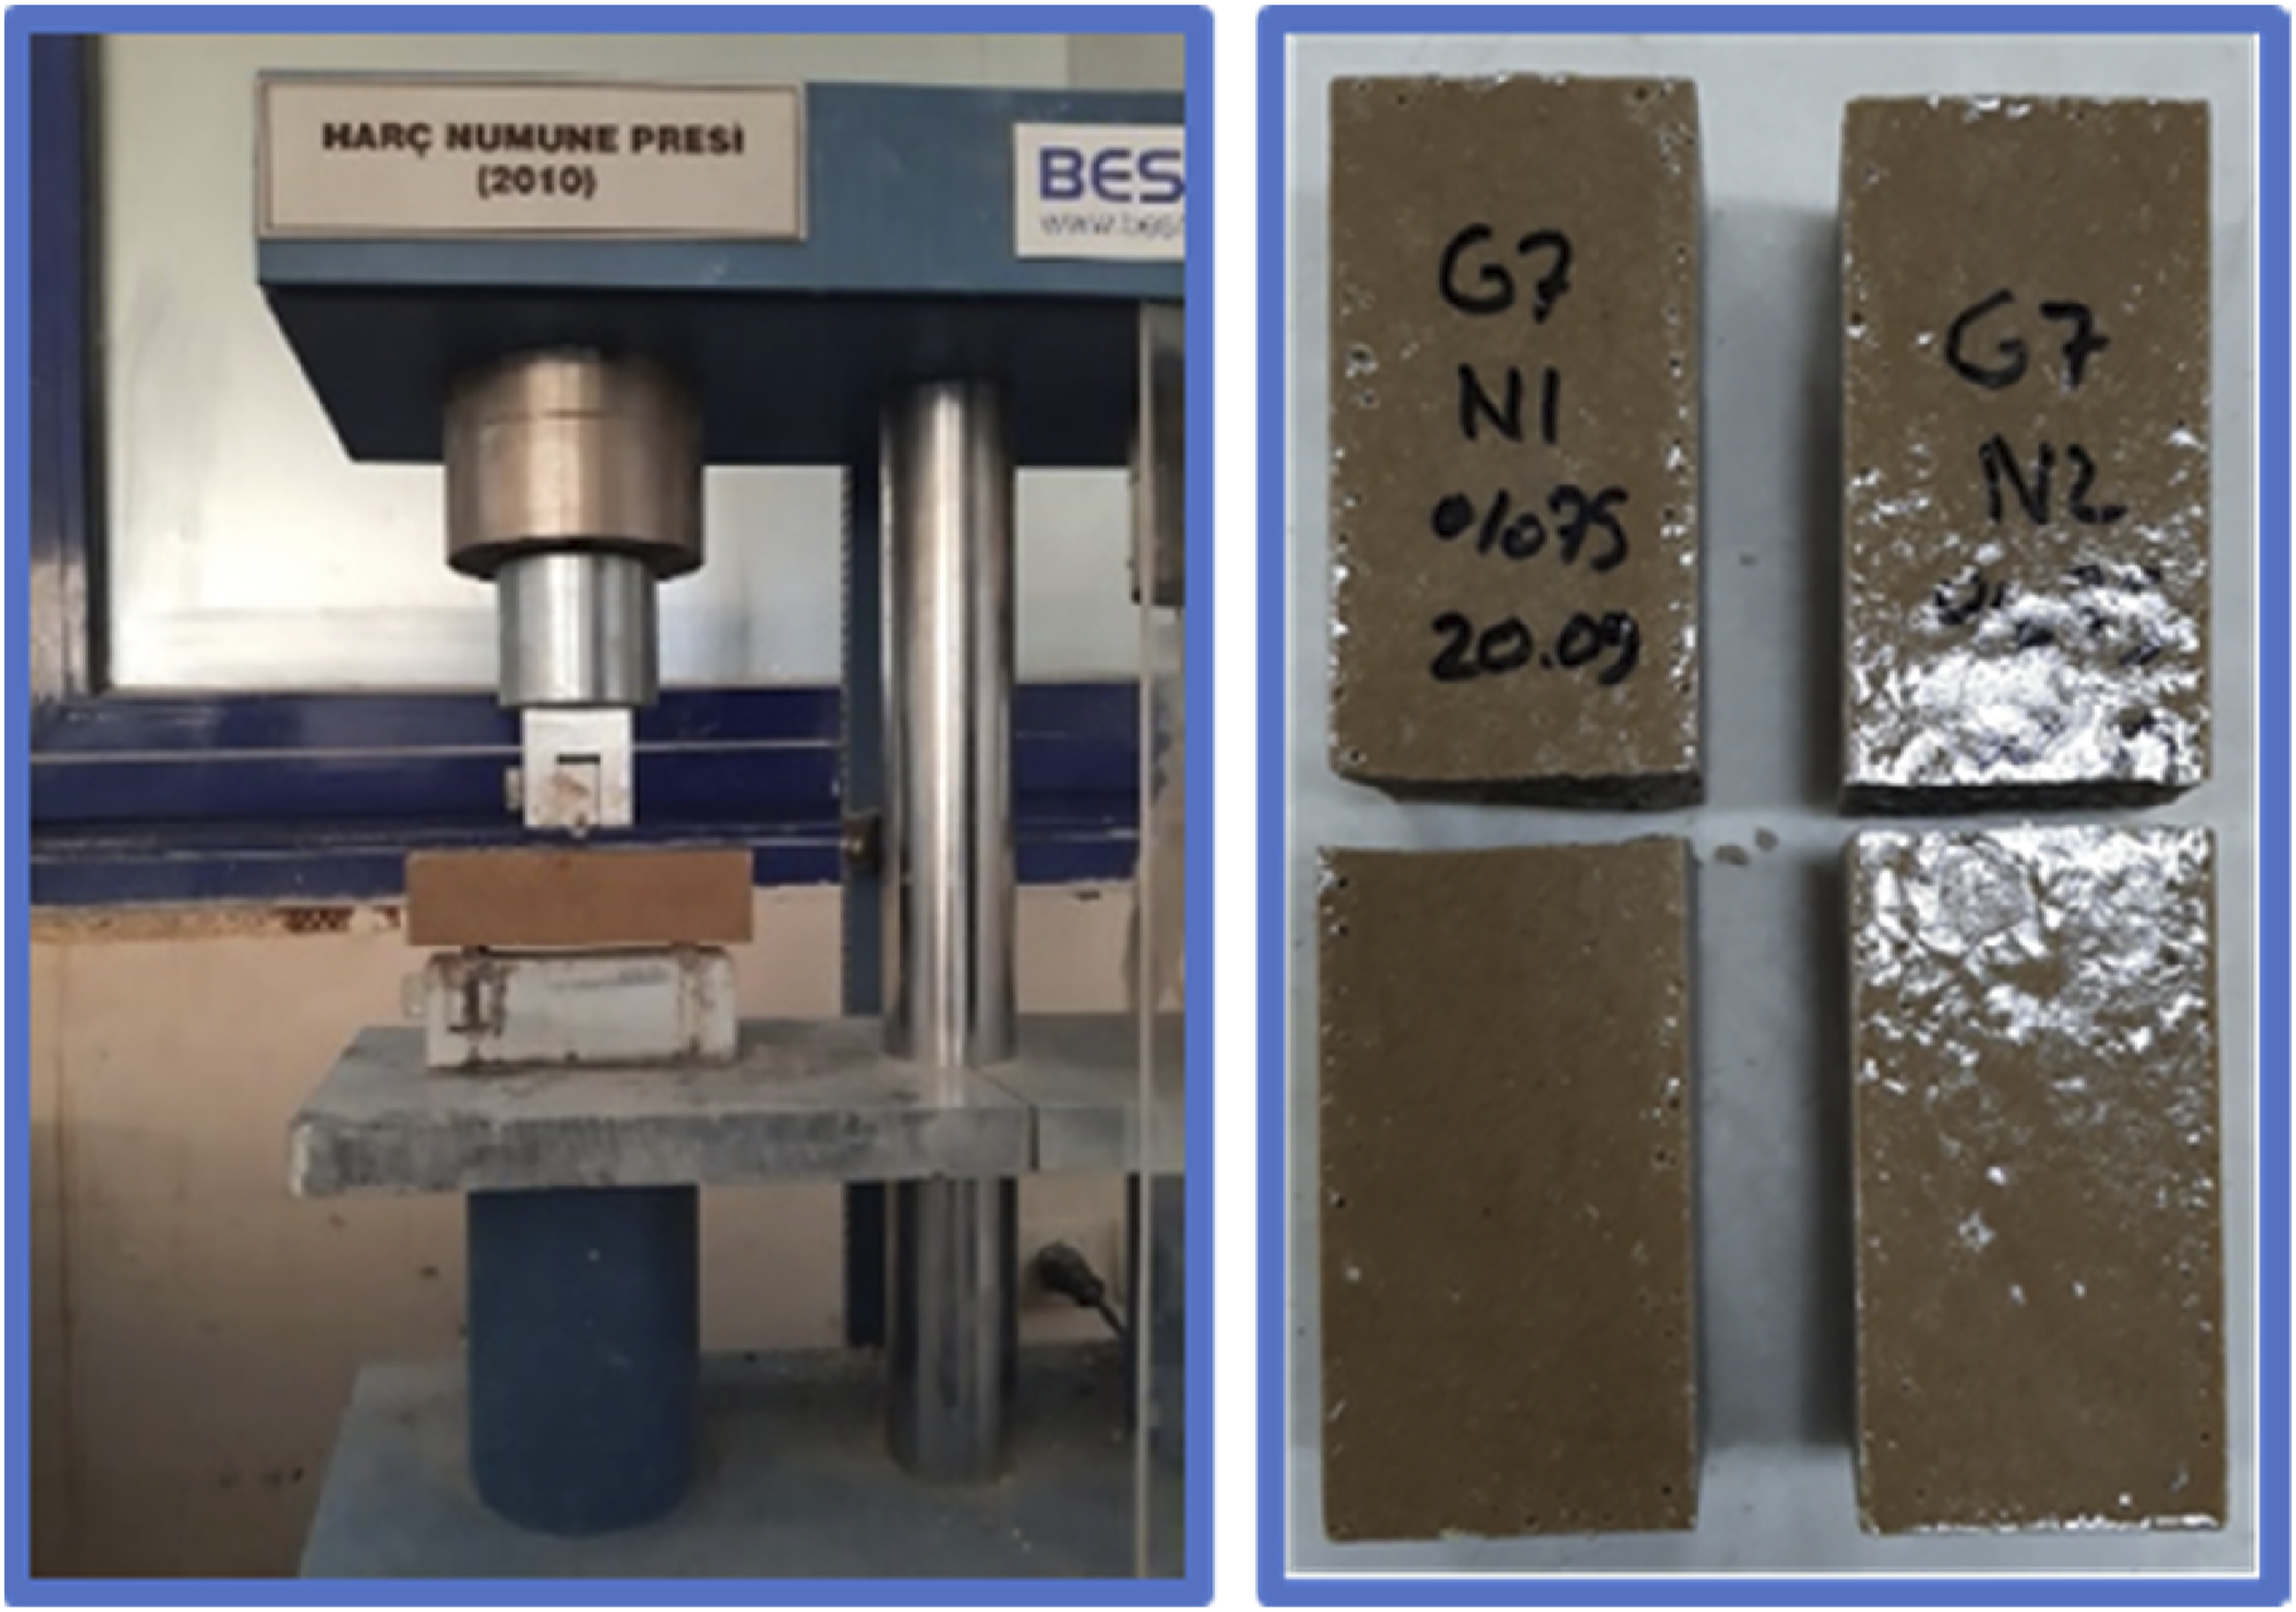
The loading rate was applied as a uniform load with a constant speed of 2.4 kN/s. The compressive strength corresponding to this load was found by reading the force P that broke the sample (Figure 7). Compression test setup and failure behavior of concrete.

Bending test
Bending tests were carried out by taking into account TS EN 12390-5,
34
and DIN 51,290-3
35
standards with the help of the 3-point load test method. As shown in Figure 8, loading was made from the midpoint of the 4 × 4 × 16 cm mortar samples. The load causing the concrete sample to break was read on the test device screen, and the bending strength of the beam sample was calculated with the following formula. Flexural test setup and failure behavior of concrete.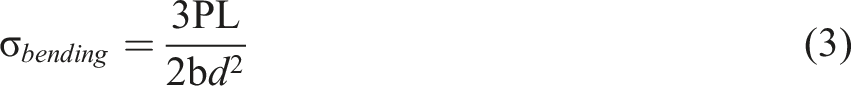
Ultrasonic pulse velocity (UPV) test
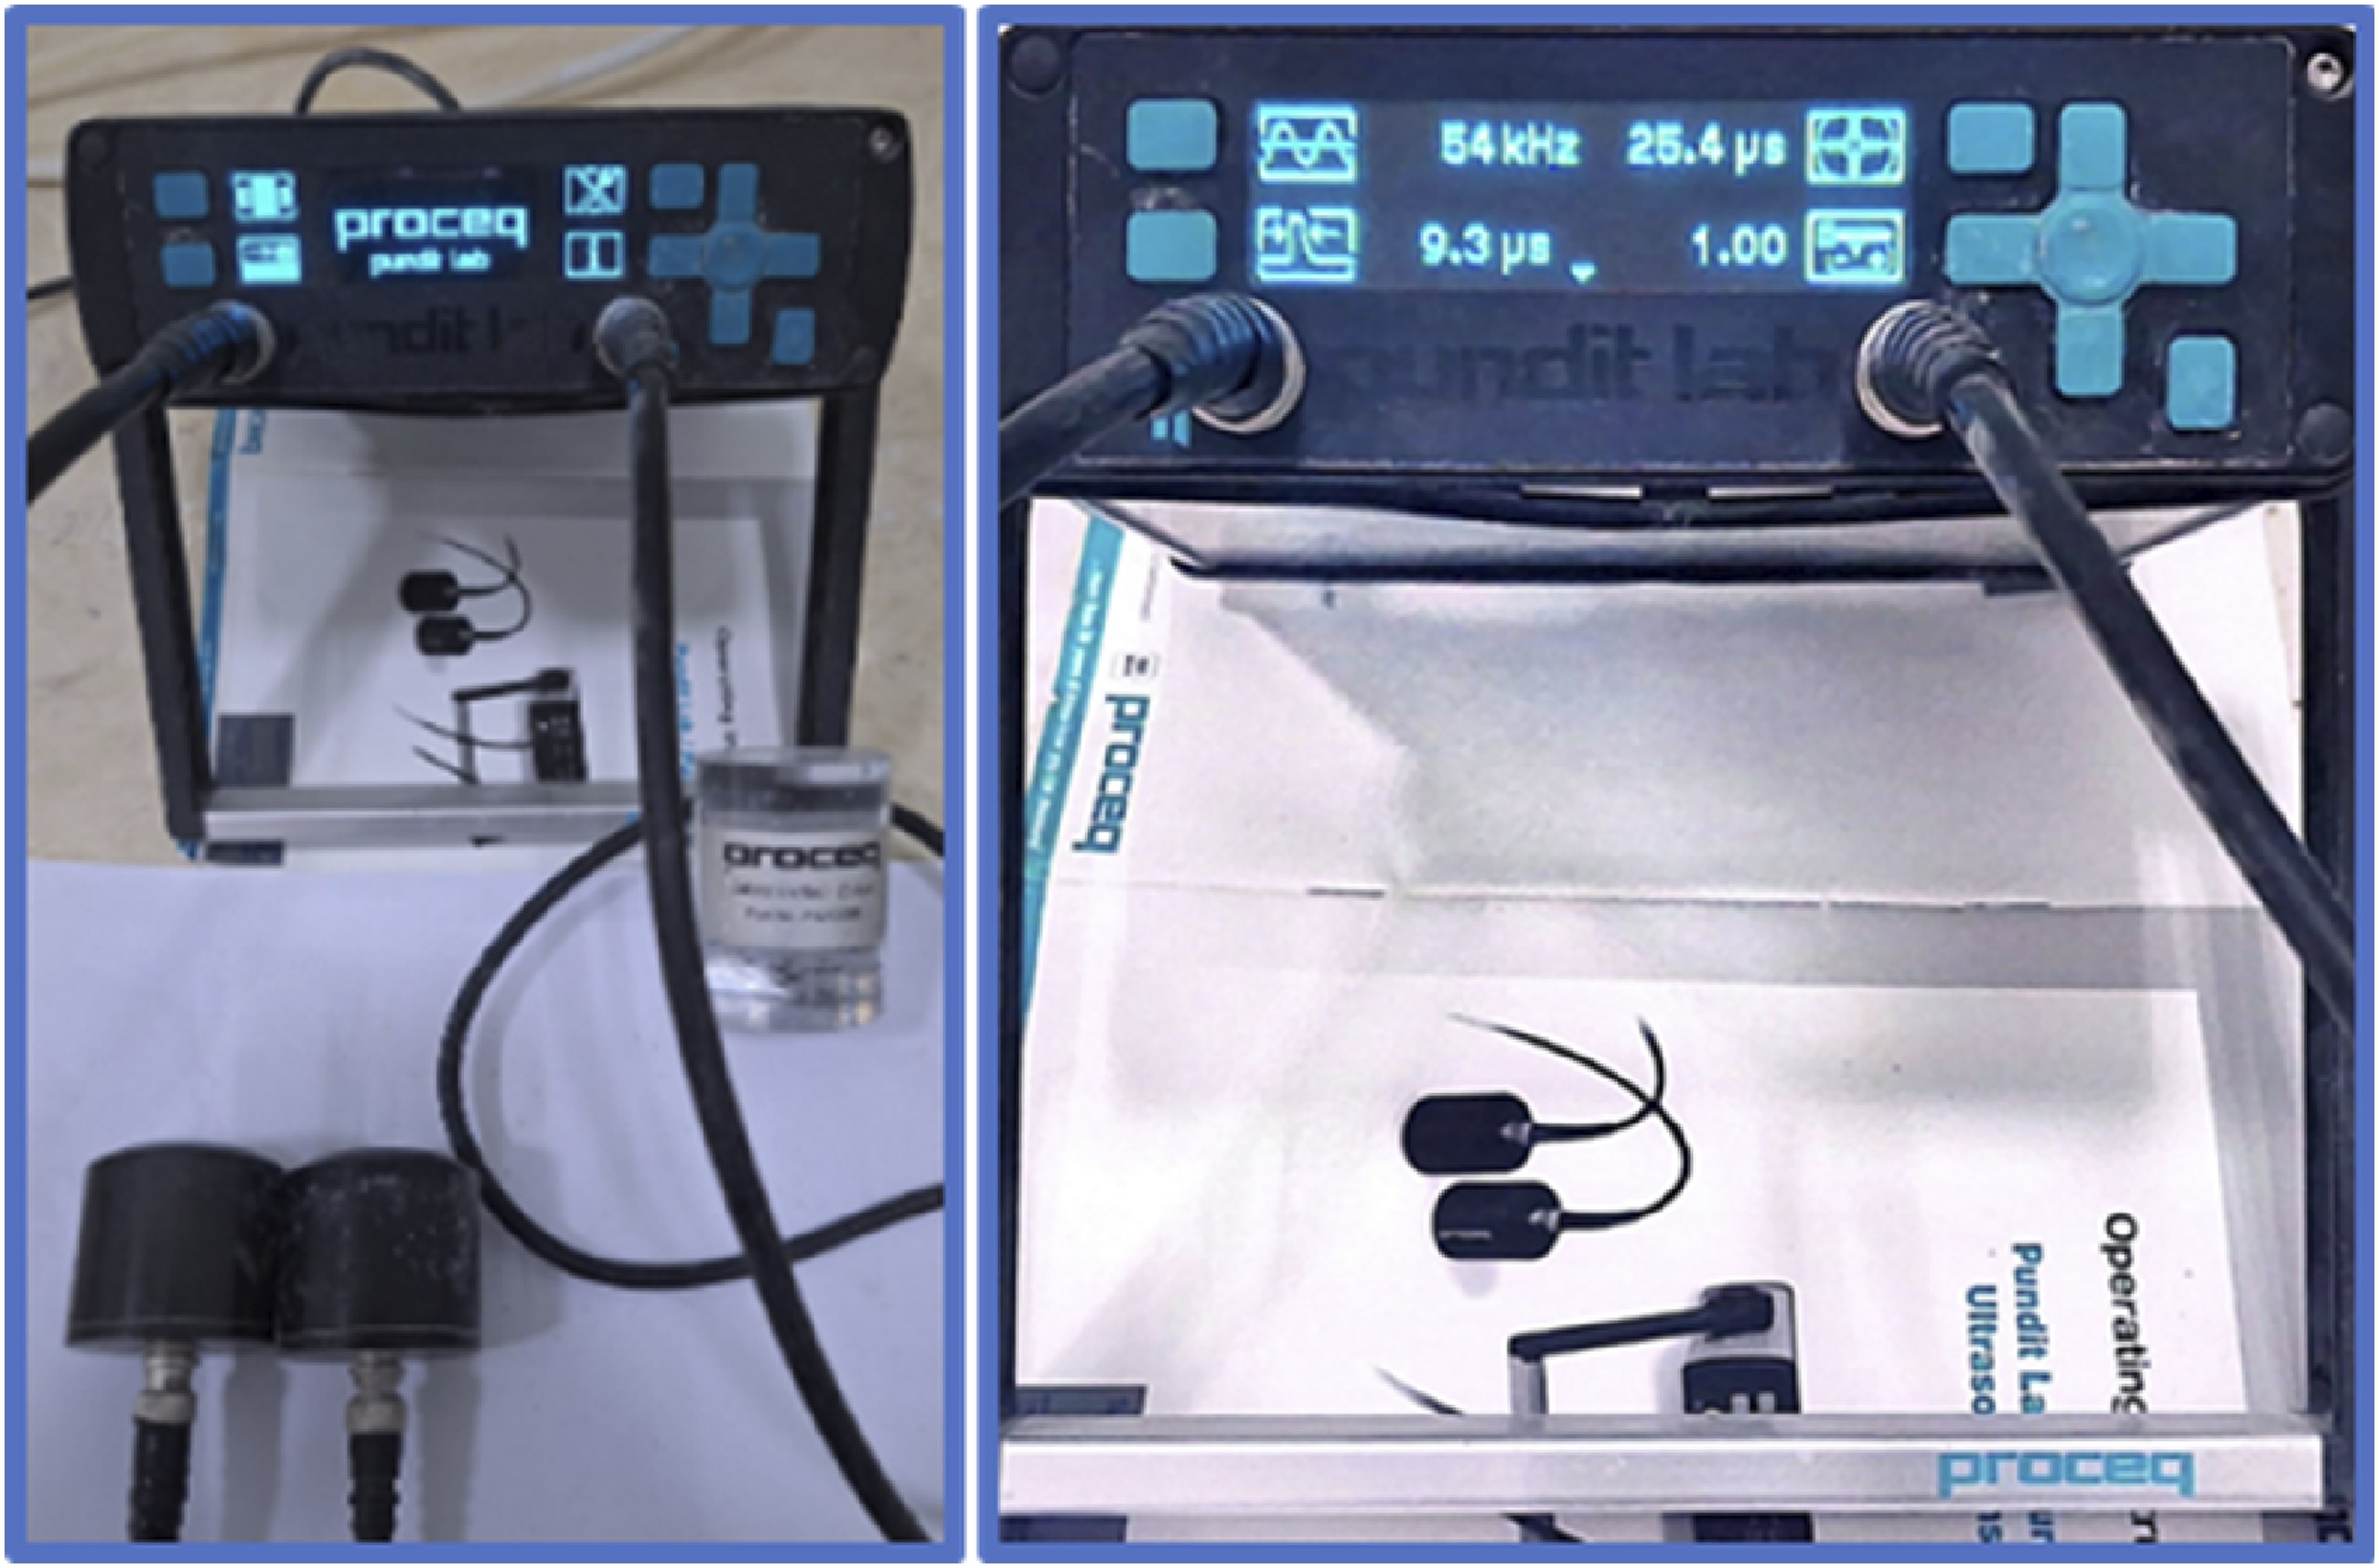
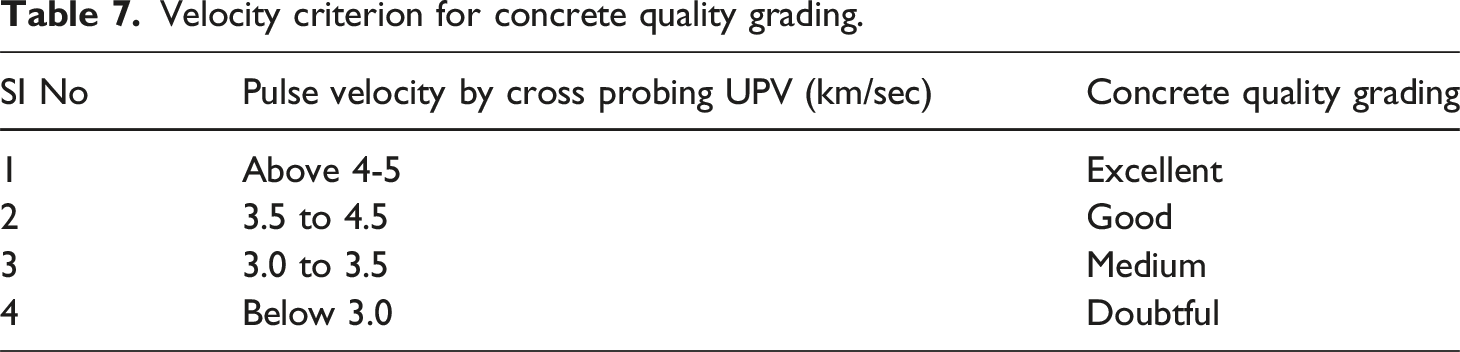
Ultrasound transmission velocity test was applied to mortar samples measuring 4 × 4 × 16 cm. The ultrasound transmission rate test was calculated with the following formula. UPV test setup of concrete. Velocity criterion for concrete quality grading.
Scanning electron microscope (SEM) test
Following compressive and bending tests, microstructural analysis was applied to various samples using Quanta 250 model SEM. One of the aims of this research is to investigate the ITZ between the aggregates and the cementitious matrix between the aggregates and the polymer matrix. The other is to research the internal structure of cement concrete and polymer concrete.
Experimental results
The performance of the mixtures improved in this study was evaluated in terms of density, compressive strength, flexural strength, ultrasonic pulse velocity, microstructural properties, and analysis of efficiency for cement and polymer concrete.
Density of fresh and hardened concrete
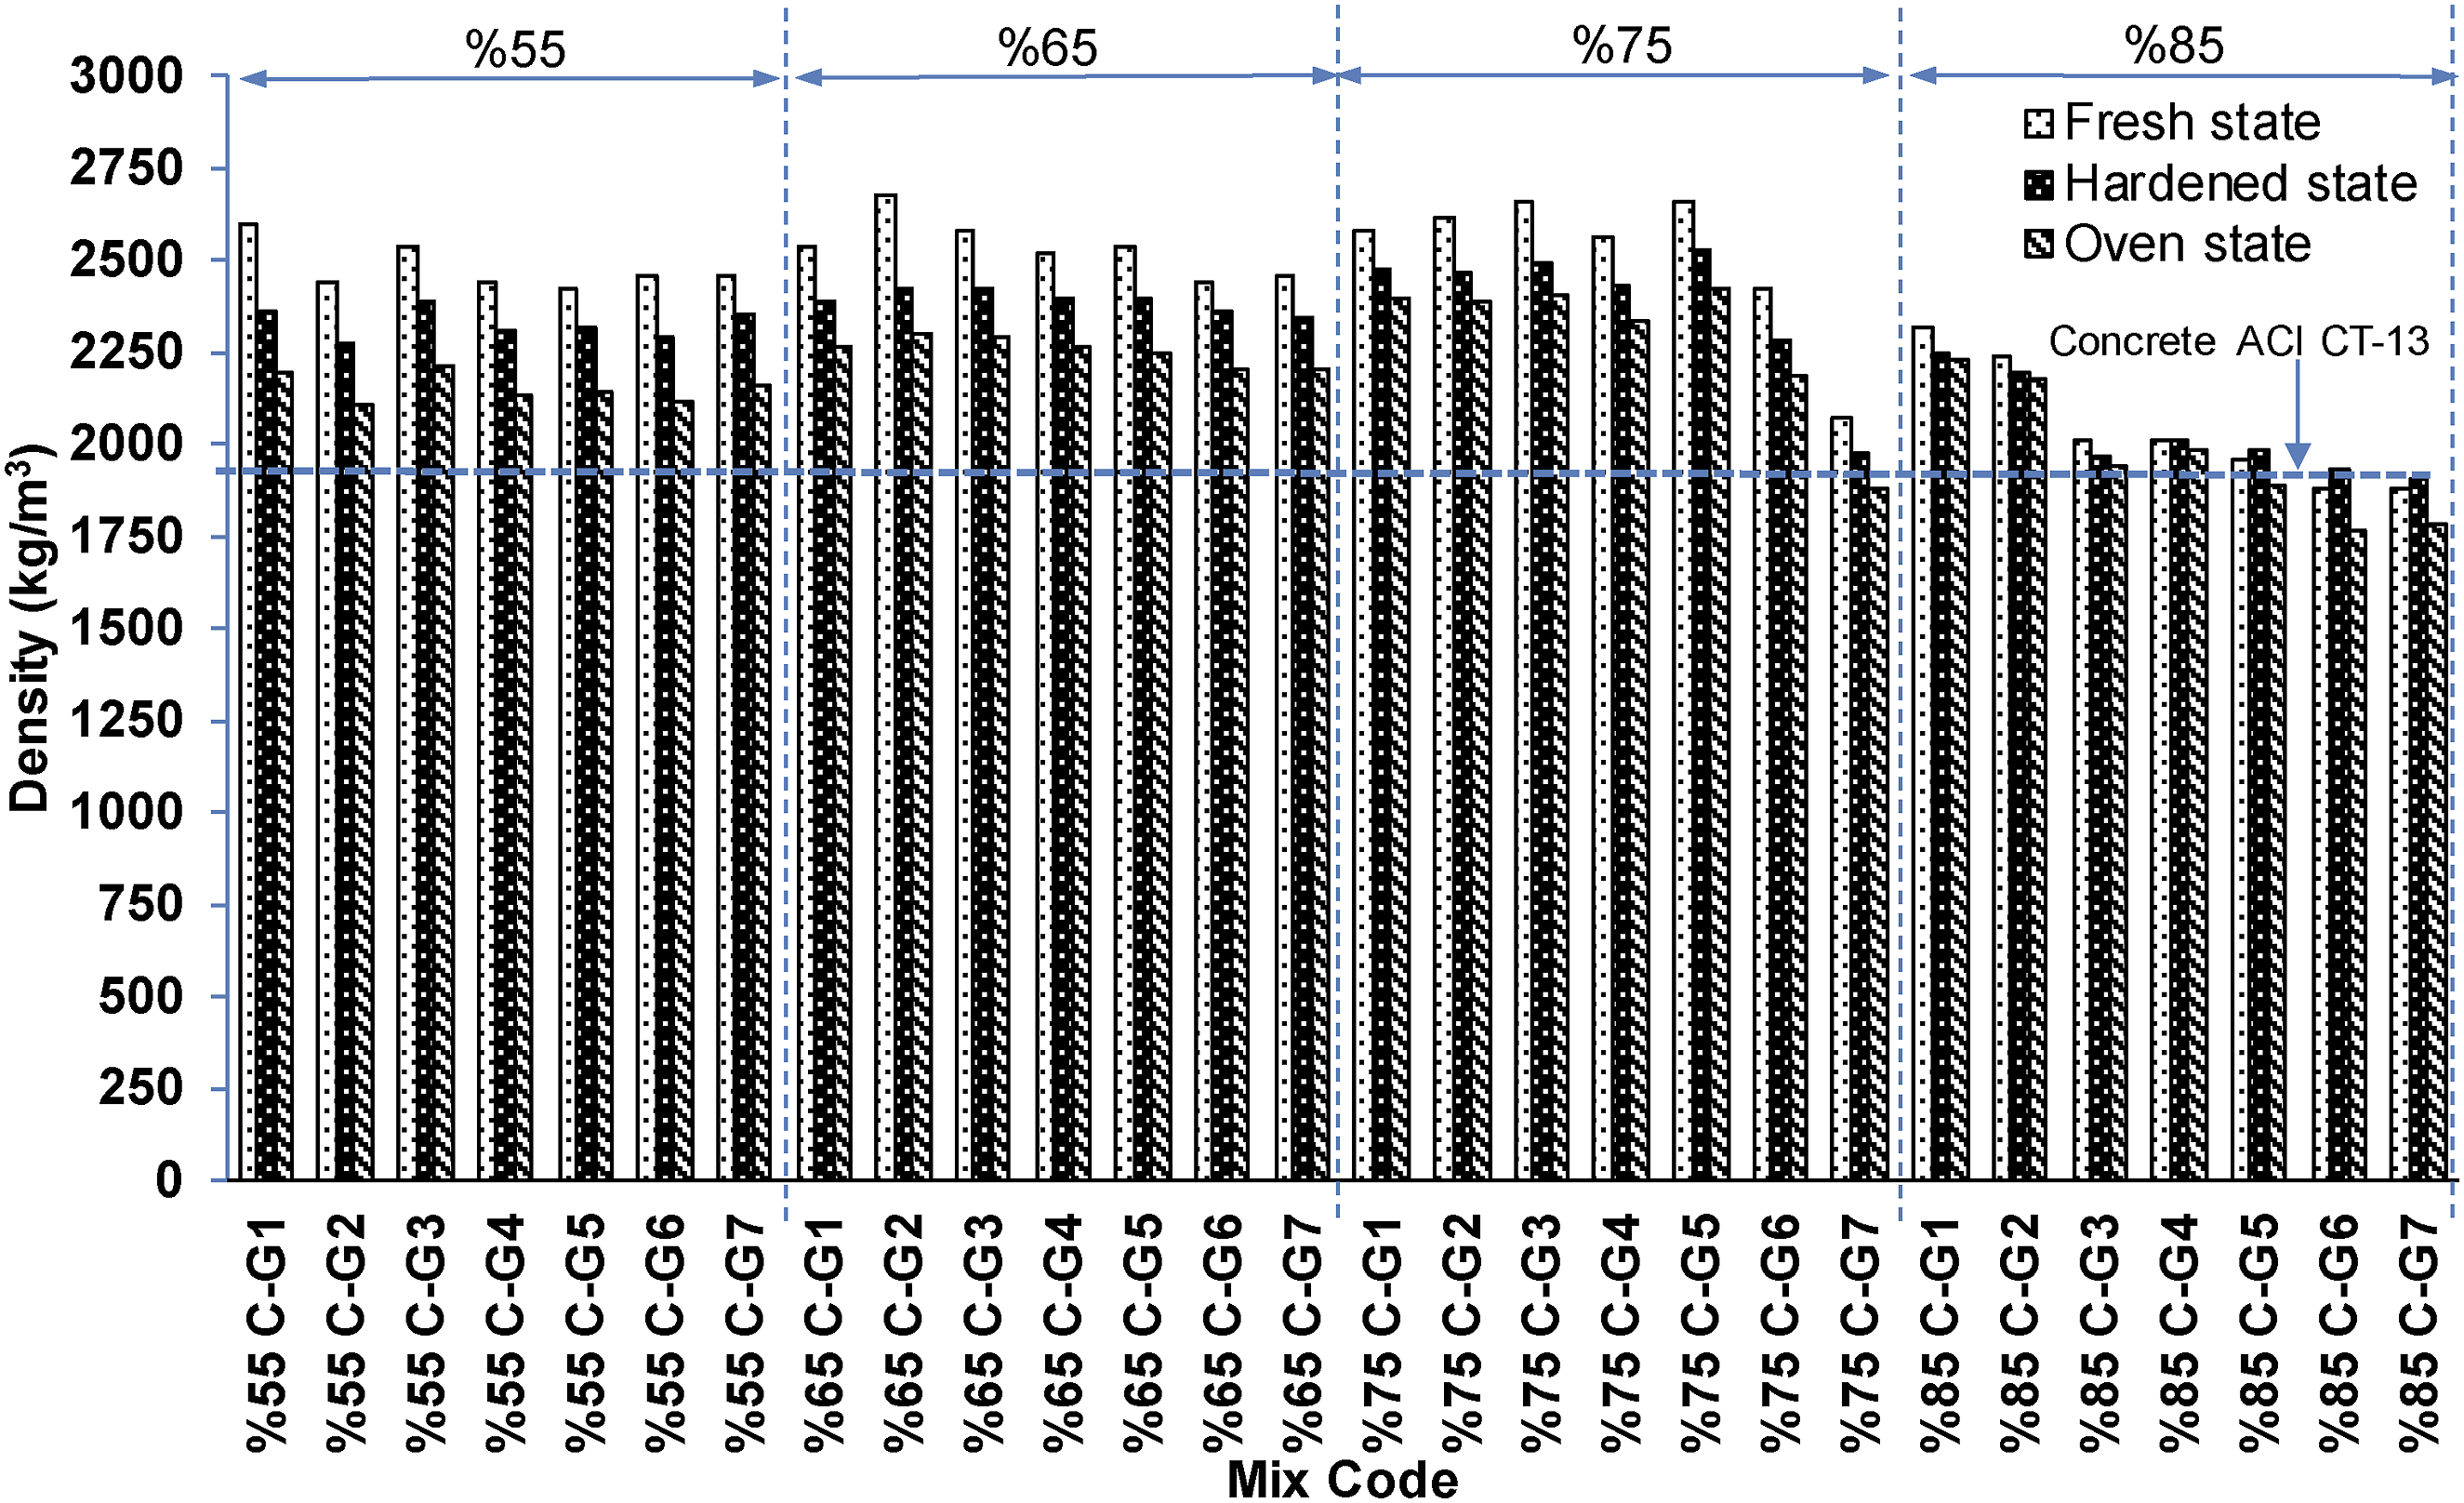
The density criterion for concrete quality classification was compared according to the ACI CT-13
38
standard. Figure 10 depicts the densities of the fresh and cured mixes for polymer concrete. It is seen that the concrete unit weight with polymer-bindered is inversely proportional to the amount of polymer substitution. The biggest decrease in hardened concrete densities occurred in %55P-G samples. These samples have high levels of plastic binder substitution. This value is 1750 kg/m3 and 30% lower than the 2275 kg/m3 density of the reference concrete (%55C-G). It is clear that this decrease in the density of the polymer concrete is due to the low density of the plastic binder. The reason for the decrease in density for %85C-G samples in cement-bindered concrete is thought to be due to the increase in the porosity rate as a result of the increase in the aggregate percentage in the mixture Figure 11. Fresh and hardened polymer concrete density. Fresh and hardened cementitious concrete density.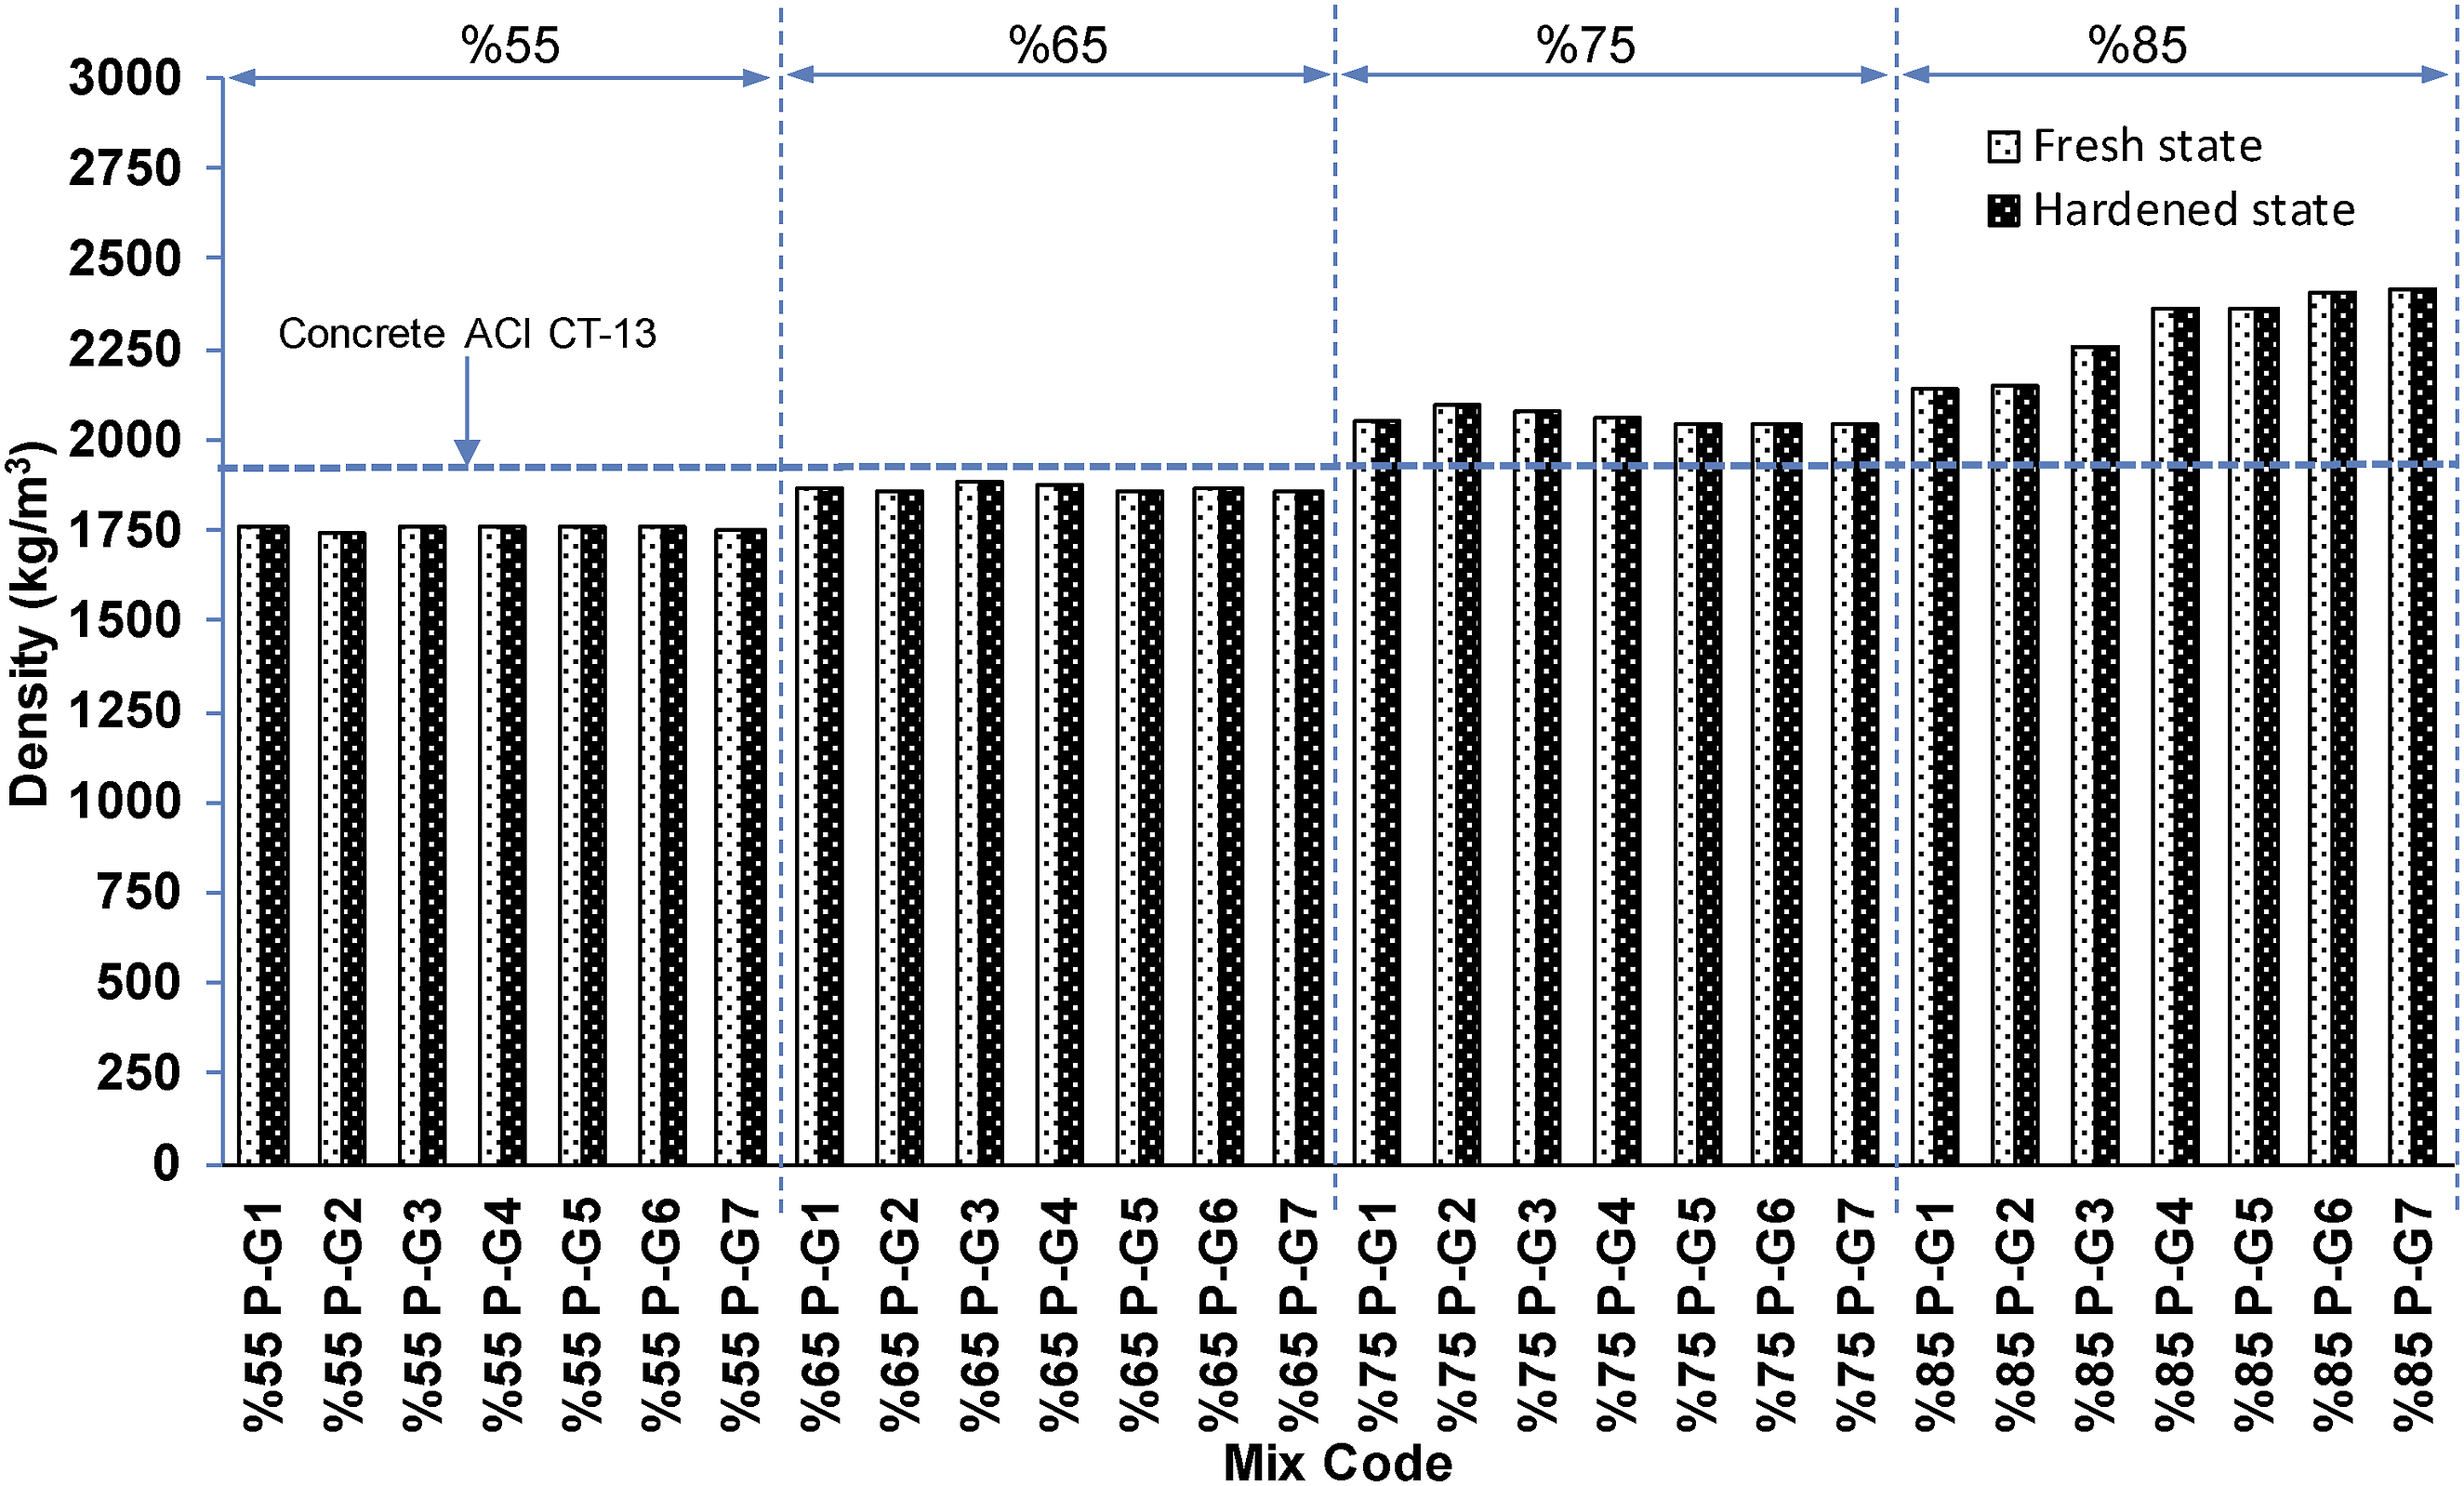
Compressive strength
When the compressive strength graph is examined in Figure 10, a serious decrease is observed in the strength of cemented concrete samples after the 75%G2 sample. On average, the best compressive strength occurs in concrete containing 65% aggregate. Although the cement ratio is low in G1 and G2 mixtures containing 75% aggregate, a good strength value has been achieved (75%G1-G2). This indicates that the mix granulometry has a significant effect on the concrete strength. In Figure 10, when the polymer concrete samples are examined, it is seen that the best strength occurs in the samples containing 75% aggregate. The effect of granulometry change is more visible in samples containing 55% and 65% aggregates. For example, the compressive strength values difference between the 55%G1 sample and the 55%G7 sample are more than double. The same situation is observed between 65% G1 and 65% G7 samples. However, the effect of granulometry change on the concrete compressive strength is the highest in the samples obtained at 55% aggregate mixture ratio. This effect decreases in samples with 65% aggregate mixture ratio and the effect of granulometry change on compressive strength is minimal in samples with 75% aggregate mixture. This shows that the effect of aggregate granulometry on compressive strength is at the highest level in samples with high polymer content, i.e., less aggregate amount. On the other hand, the compressive strength of 85% G1 and 85% G2 samples in samples with 85% aggregate mixture remains very low compared to samples with other granulometry. On the other hand, when the samples with 85% aggregate mixture are examined, the compressive strength of 85% G1 and 85% G2 samples is very low compared to the samples with other aggregate granulometers (85% G3-G4-G5-G6-G7). However, the compressive strength of 85% G3-G4-G5-G6 and G7 samples is at a good level. This proves that the effect of granulometry on the compressive strength of the plastic concrete mixture is very high. Despite using the same amount of binder polymer, the strength varies tremendously. Considering this situation, it is concluded that the amount of aggregate and especially the change in granulometry must be examined efficiently in the production of more efficient concrete. The concrete compressive strength in the samples obtained for the P85% condition, especially for 85% G3-G4-G5-G6 and G7, is more efficient than the samples with 55%, 65% and 75% aggregate mix ratios using more polymers. The most efficient concrete compressive strength was obtained with the least polymer. However, the highest strength values are in the samples with 75% aggregate mixture.
When all aggregate percentage ratios and mixture granulometry are examined for polymer concrete, the strength values are at the lowest levels in G1 and G2 granulometry mixtures in all mixture percentages. When the granulometry curve (Figure 4) is examined, it is seen that the granulometry of G1 and G2 contains a high percentage of coarse aggregate. On the other hand, the samples with the highest strength are the G6 and G7 samples. G7 contains the highest percentage of fine aggregate. As you go from G1 to G7, the amount of fine aggregate in the mixture increases. Thus, the following deduction can be made; As the amount of fine aggregate in the mixture increases, the compressive strength of the polymer concrete also increases. In addition, the percentage of aggregate amount in the mixture affects strength. The presence of resin in the mixture in excess does not always increase the strength. The compressive strength of the samples with suitable granulometry and suitable aggregate percentage in the mixture is much higher than the compressive strength of the samples with more polymer binder. The compressive strength of 55%G samples with 45% polymer content is lower than 75%G samples with 25% polymer content. As a result, it is seen that it is more important to have the aggregates in the mixture in the optimum ratio and appropriate granulometry with the polymer-binder rather than the amount of binder polymer in the mixture (Figure 10). When the cementitious concrete and polymer concrete samples are compared, the obvious superiority of polymer concrete in compressive strength stands out. In cement-based concrete, while the aggregate mixing ratio increases from 55% to 85%, the strength decreases. On the other hand, in polymer concrete, the strength increases up to 75% aggregate mixing ratio. Even if the compressive strength of polymer concrete with 85% aggregate mixture is slightly lower than that of polymer concrete with 75% aggregate mixture, the best concrete with an average efficiency and strength is polymer concrete with 85% aggregate mixture. Aggregate-mixed polymer concrete is generally lighter than aggregate-mixed cementitious concrete. This lightness feature can have a positive effect on structures produced using polymer concrete. Polymer concrete with 55% aggregate mixture is the lightest concrete. However, in terms of strength, the compressive strength of 55% aggregate mixed polymer concrete is lower than 65%, 75% and 85% aggregate mixed polymer concretes. Considering the strength/weight ratio, it is seen that the most efficient concrete is polymer concrete with 55%G7 aggregate mixture (Figure 12). Weight efficiency values for compressive strenght of polymer concrete.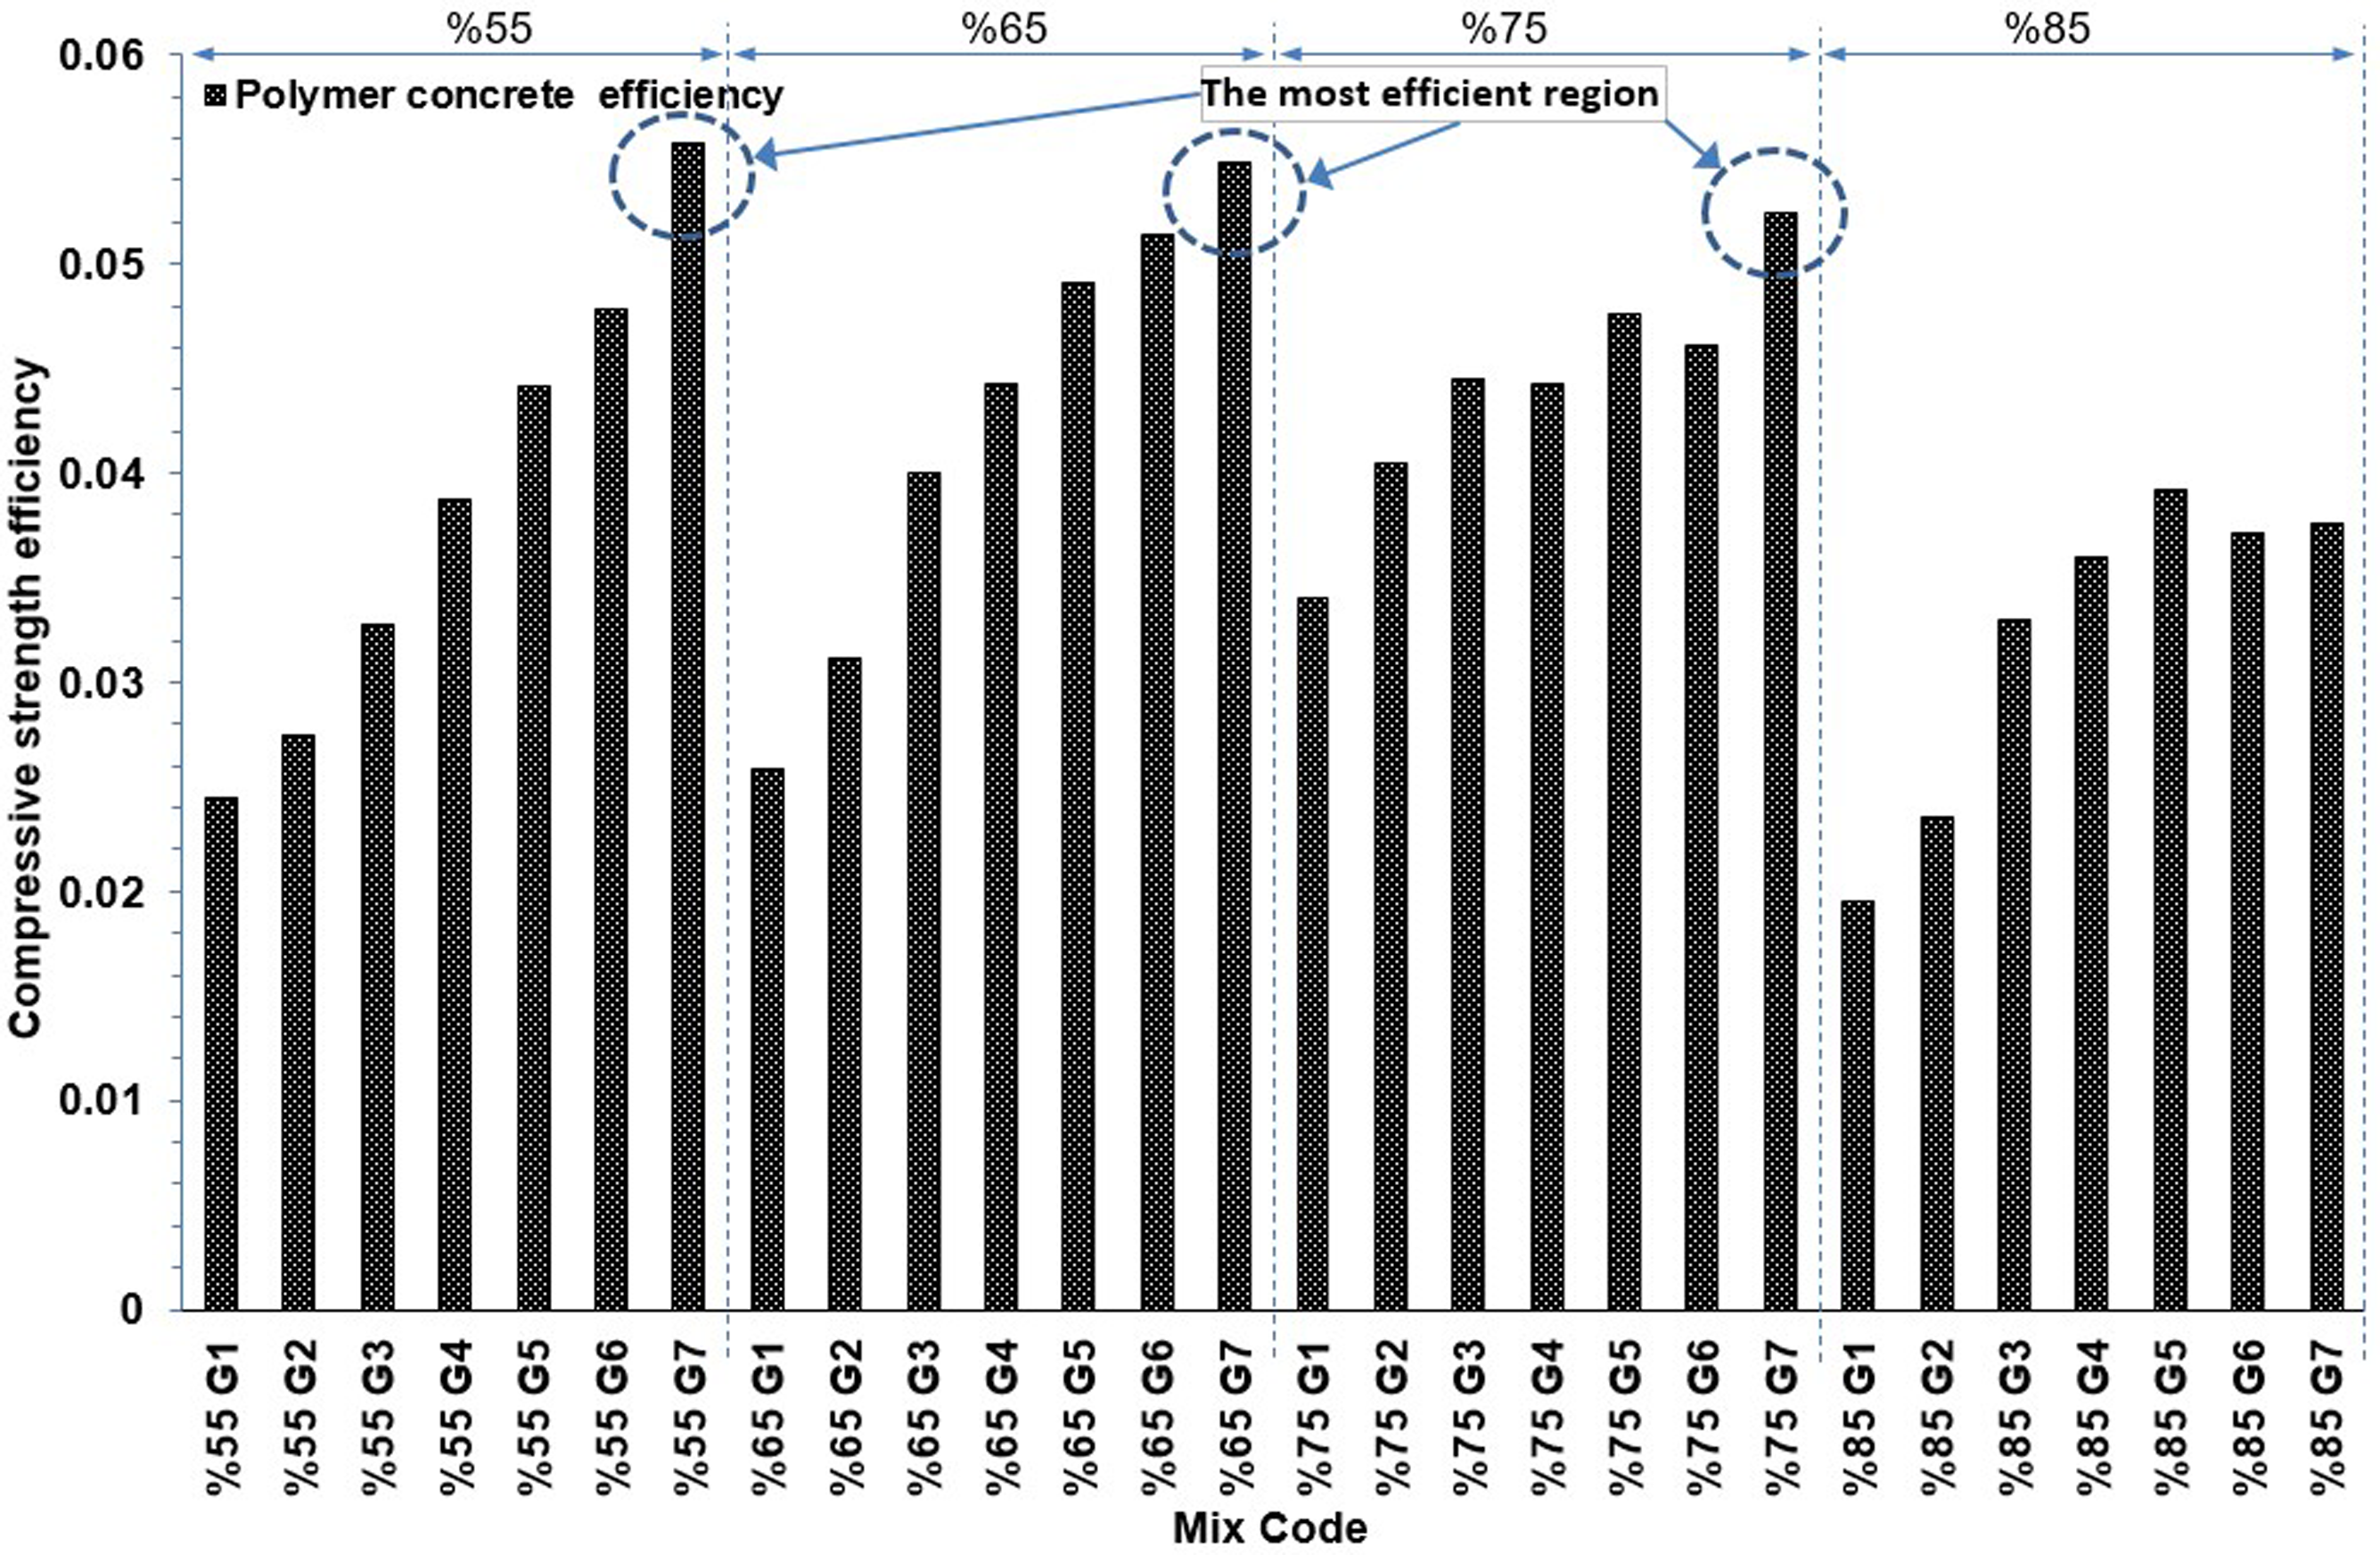
It is seen from SEM analysis that in cement-binder concrete, the amount of cement binder is very important in terms of micromechanical properties rather than the type of aggregate. Especially when 55% G samples are examined, it is seen that the change in the granulometry curve does not negatively affect the compressive and flexural strengths. The amount of binder in the mixture decreases as the mixing ratio values from 55%G to 75%G are increased. In this case, the effect of the granulometer curve on the strength is clearly seen. In 75%G samples, the strength decreases from G1 to G7. The reason for this situation can be explained as follows; the amount of fine aggregate in the mixture increases from G1 to G7 and this reduces the contact surface of the cement and the coarse aggregates. Thus, since the coarse aggregates cannot create sufficient contact surface (ITZ) with the cement binder, a loss of adhesion occurs. The inadequate coating of the coarse aggregates with the binder causes the formation of air voids and pores. As a result, the coarse aggregates in the sample break away and the porous structures in the sample increase even more (Figures 13 and 14). SEM picture of pores of cement pastes after 28 days of hydration. SEM picture of ITZ in cement pastes after 28 days of hydration.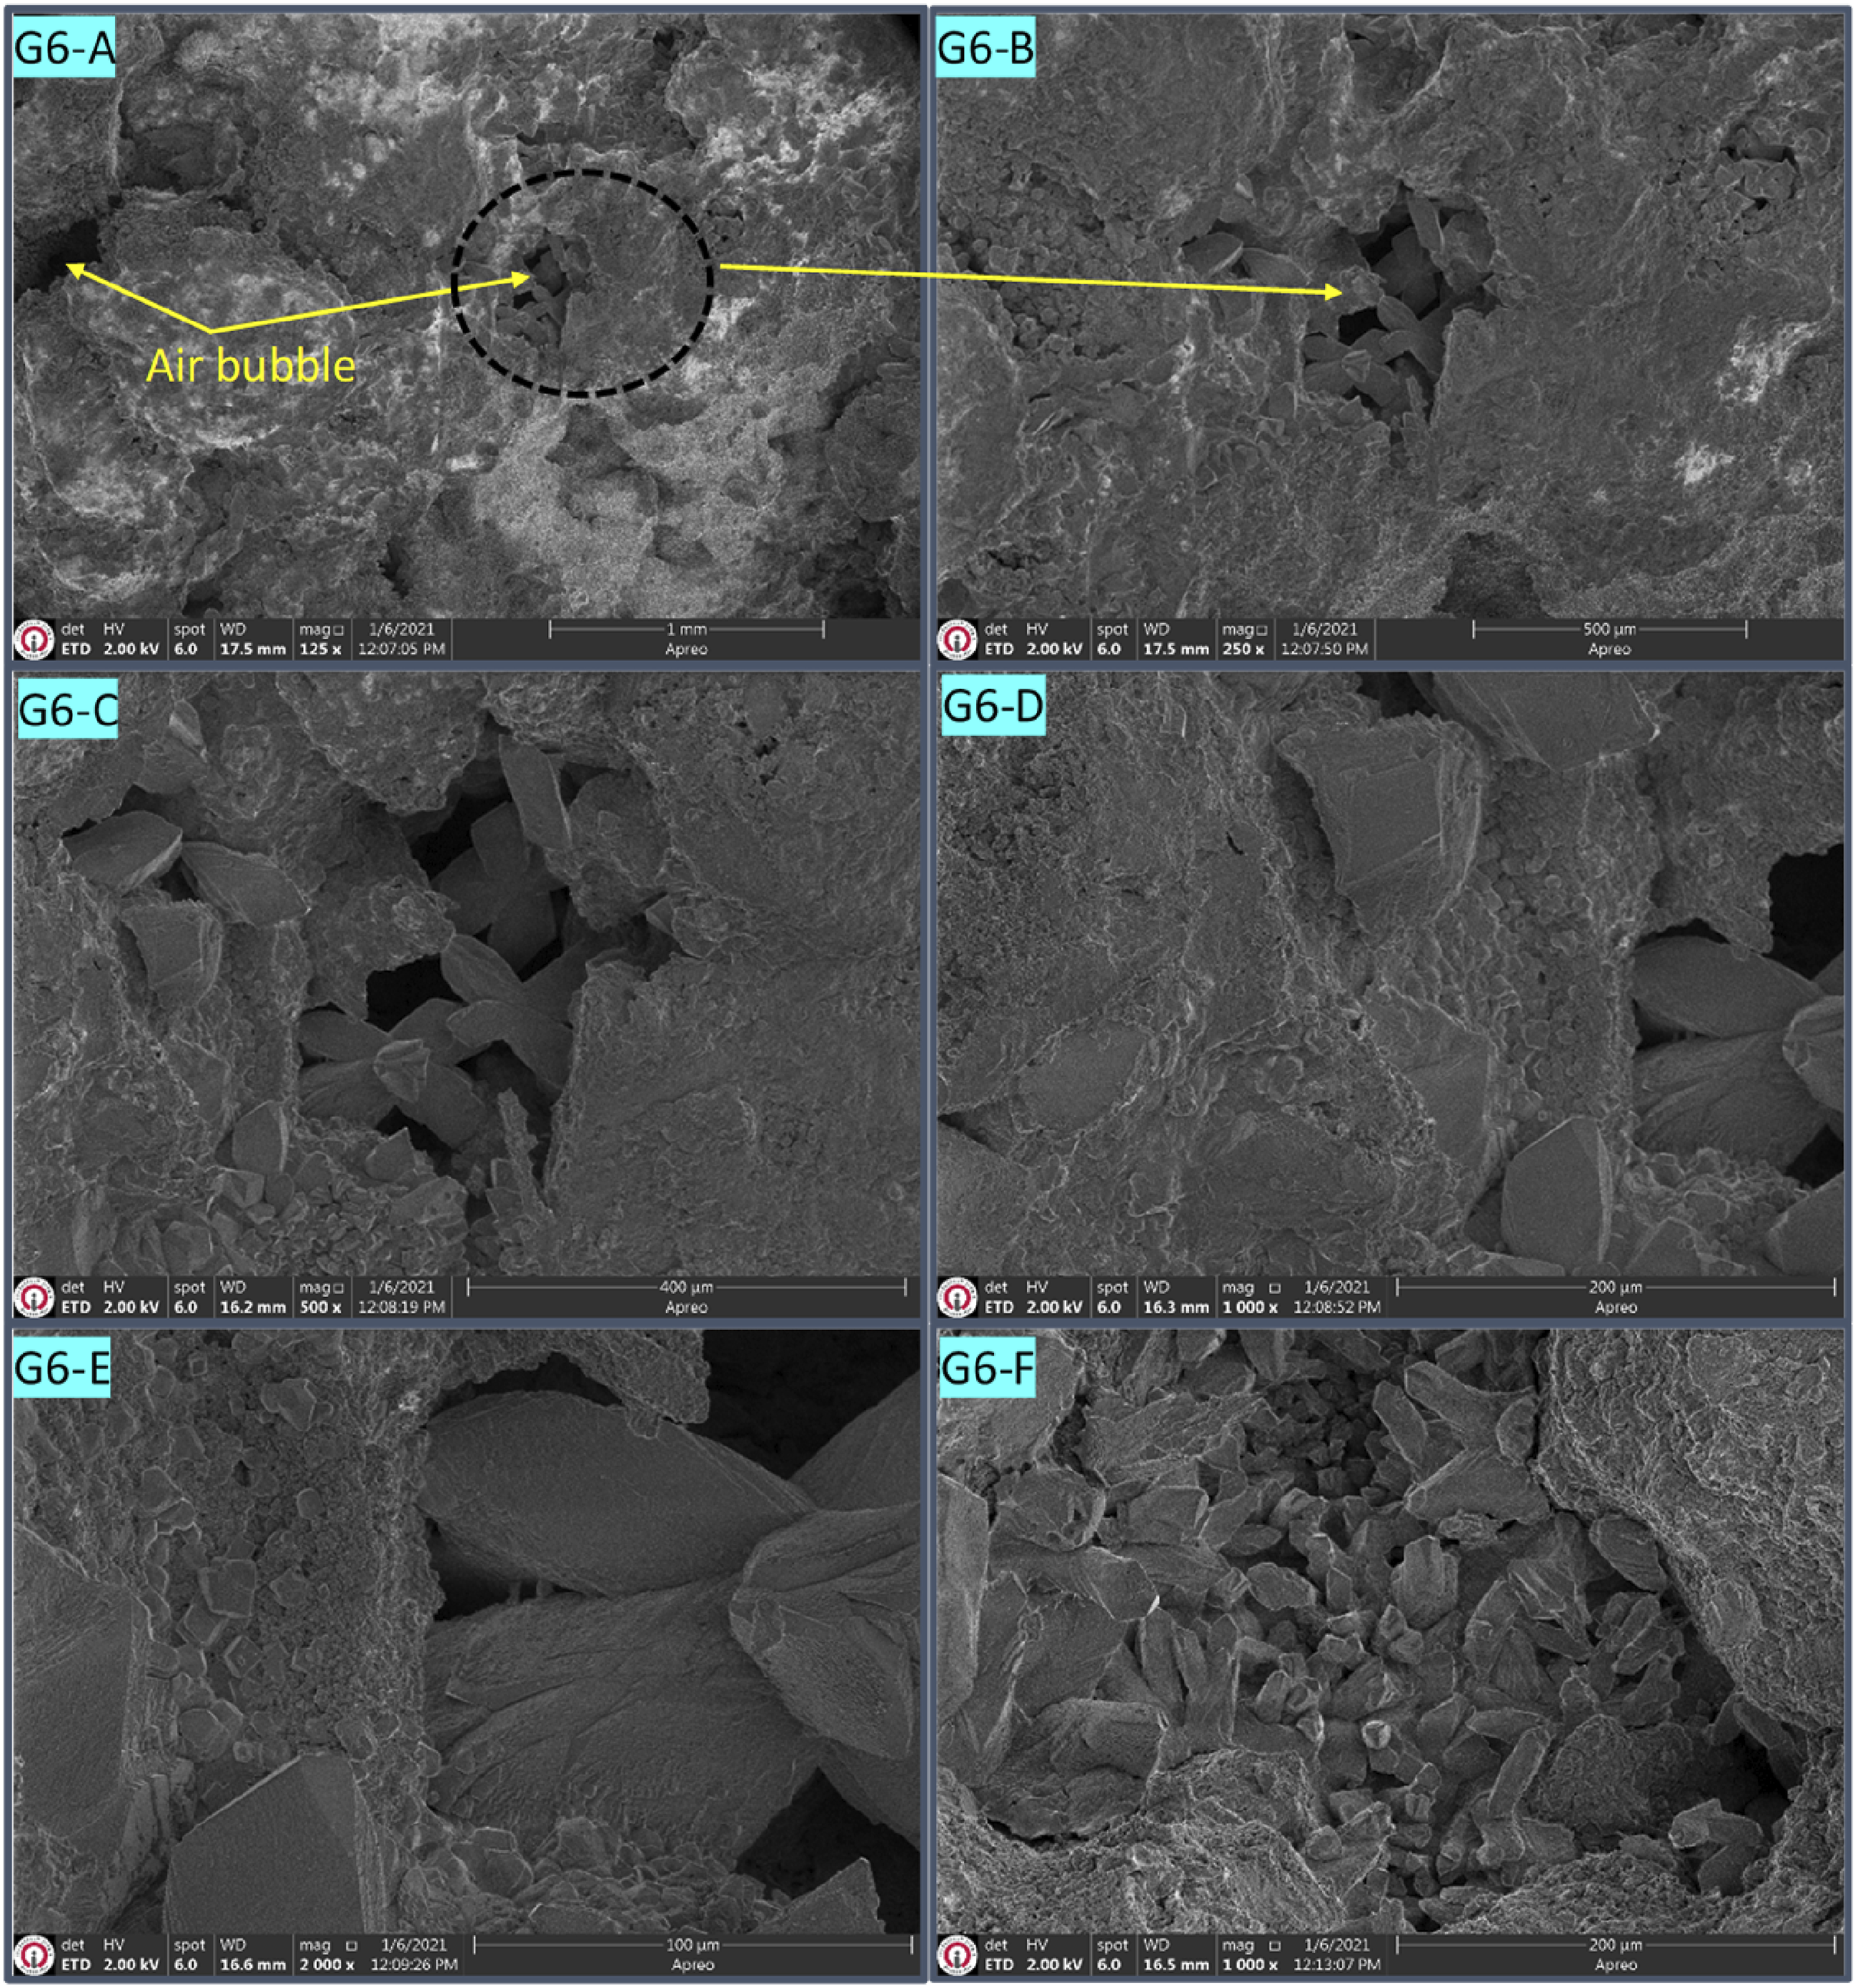
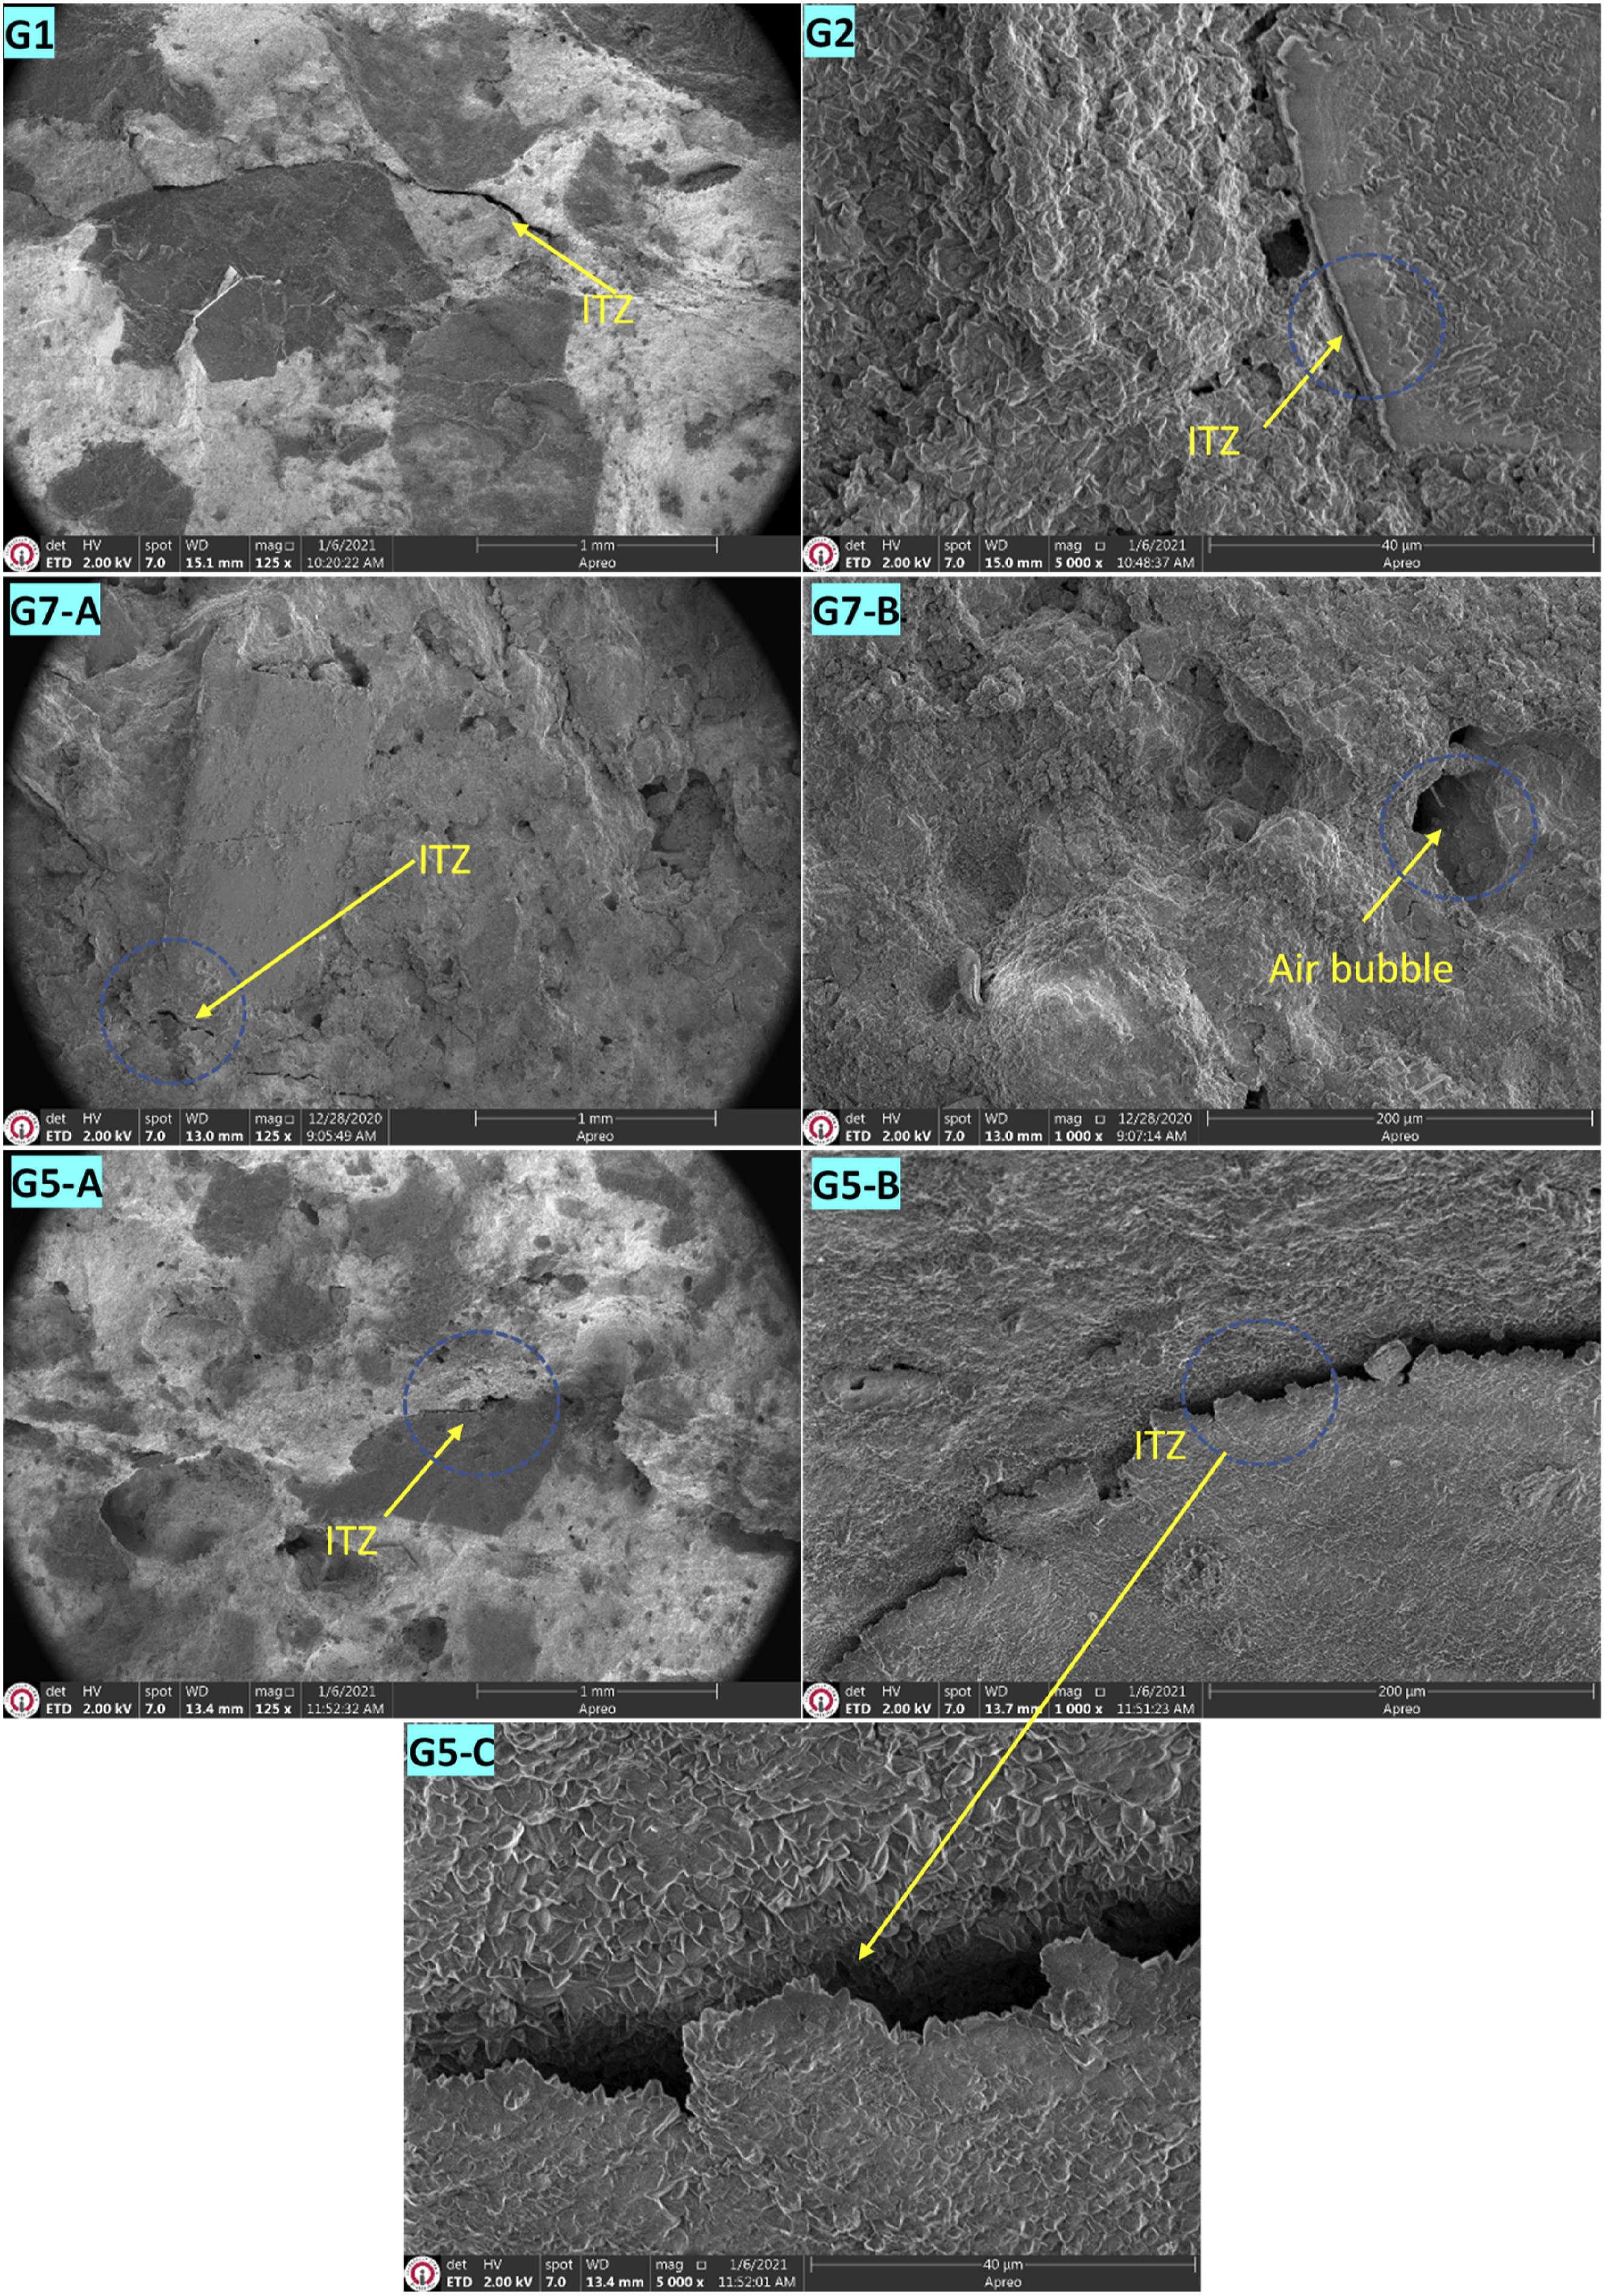
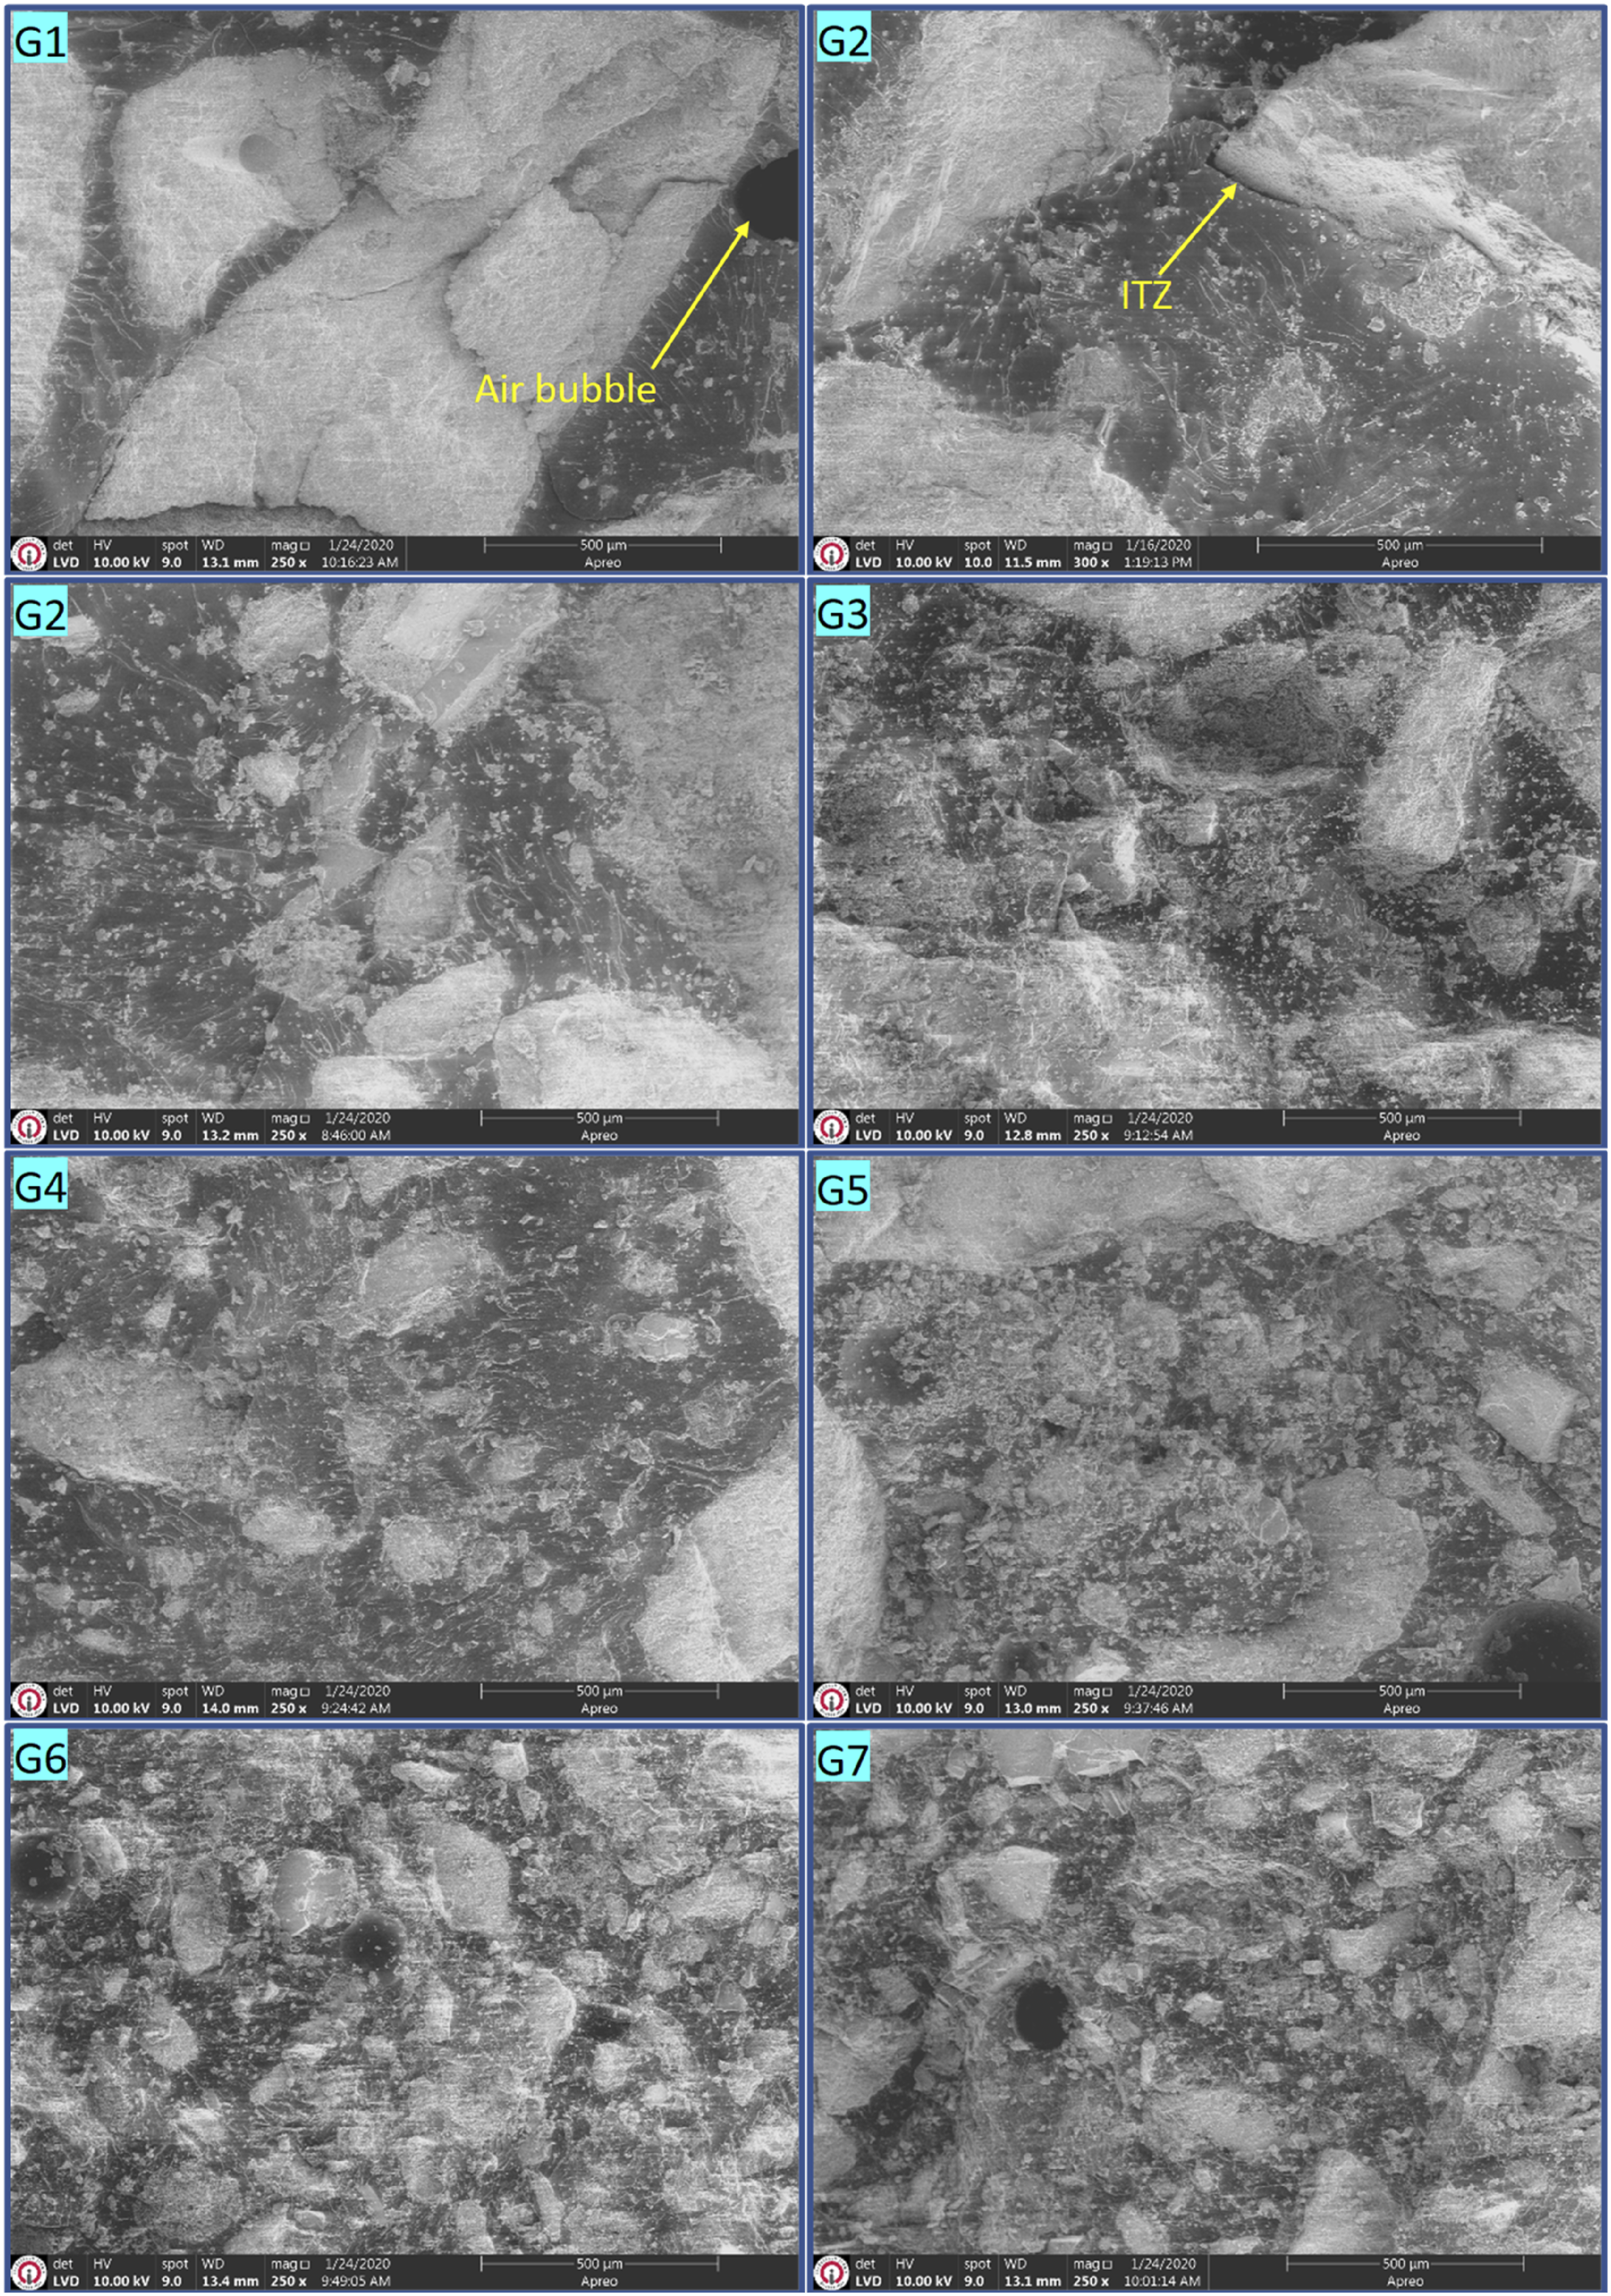
In polymer concrete, the type of granulometry curves plays an important role on strength as much as the amount of binder. For polymer concrete, the effect of granulometry curves on strength is clearly seen especially in 55%G samples (Figure 15). As the mixing ratios increase from 55%G to 85%G, the effect of the type of granulometry curves on strength decreases. When 75%G samples are examined, the strengths of 75%G3-G4-G5-G6-G7 samples are almost close to each other. The high amount of resin in polymer concrete causes the separation of coarse and fine aggregates and as seen in 55%G samples, serious strength differences occur between 55%G1 and 55%G7. Because in the G1 granulometry curve, coarse aggregates are dense and when the amount of resin is high, a heterogeneous mixture is formed as seen in the SEM image and this negatively affects the strength (Figures 15–17). In the G7 granulometry curve, the amount of fine aggregate is high and fine aggregates are very well coated with resin and move together with the resin to form very strong contact surfaces (ITZ) (Figure 17). As a result, the strength is very high (Figures 15 and 16). Compressive strength graph of cementitious concrete and polymer concrete samples. Flexural strength graph of cementitious concrete and polymer concrete samples. SEM picture of polymer pastes for various granulometry aggregate.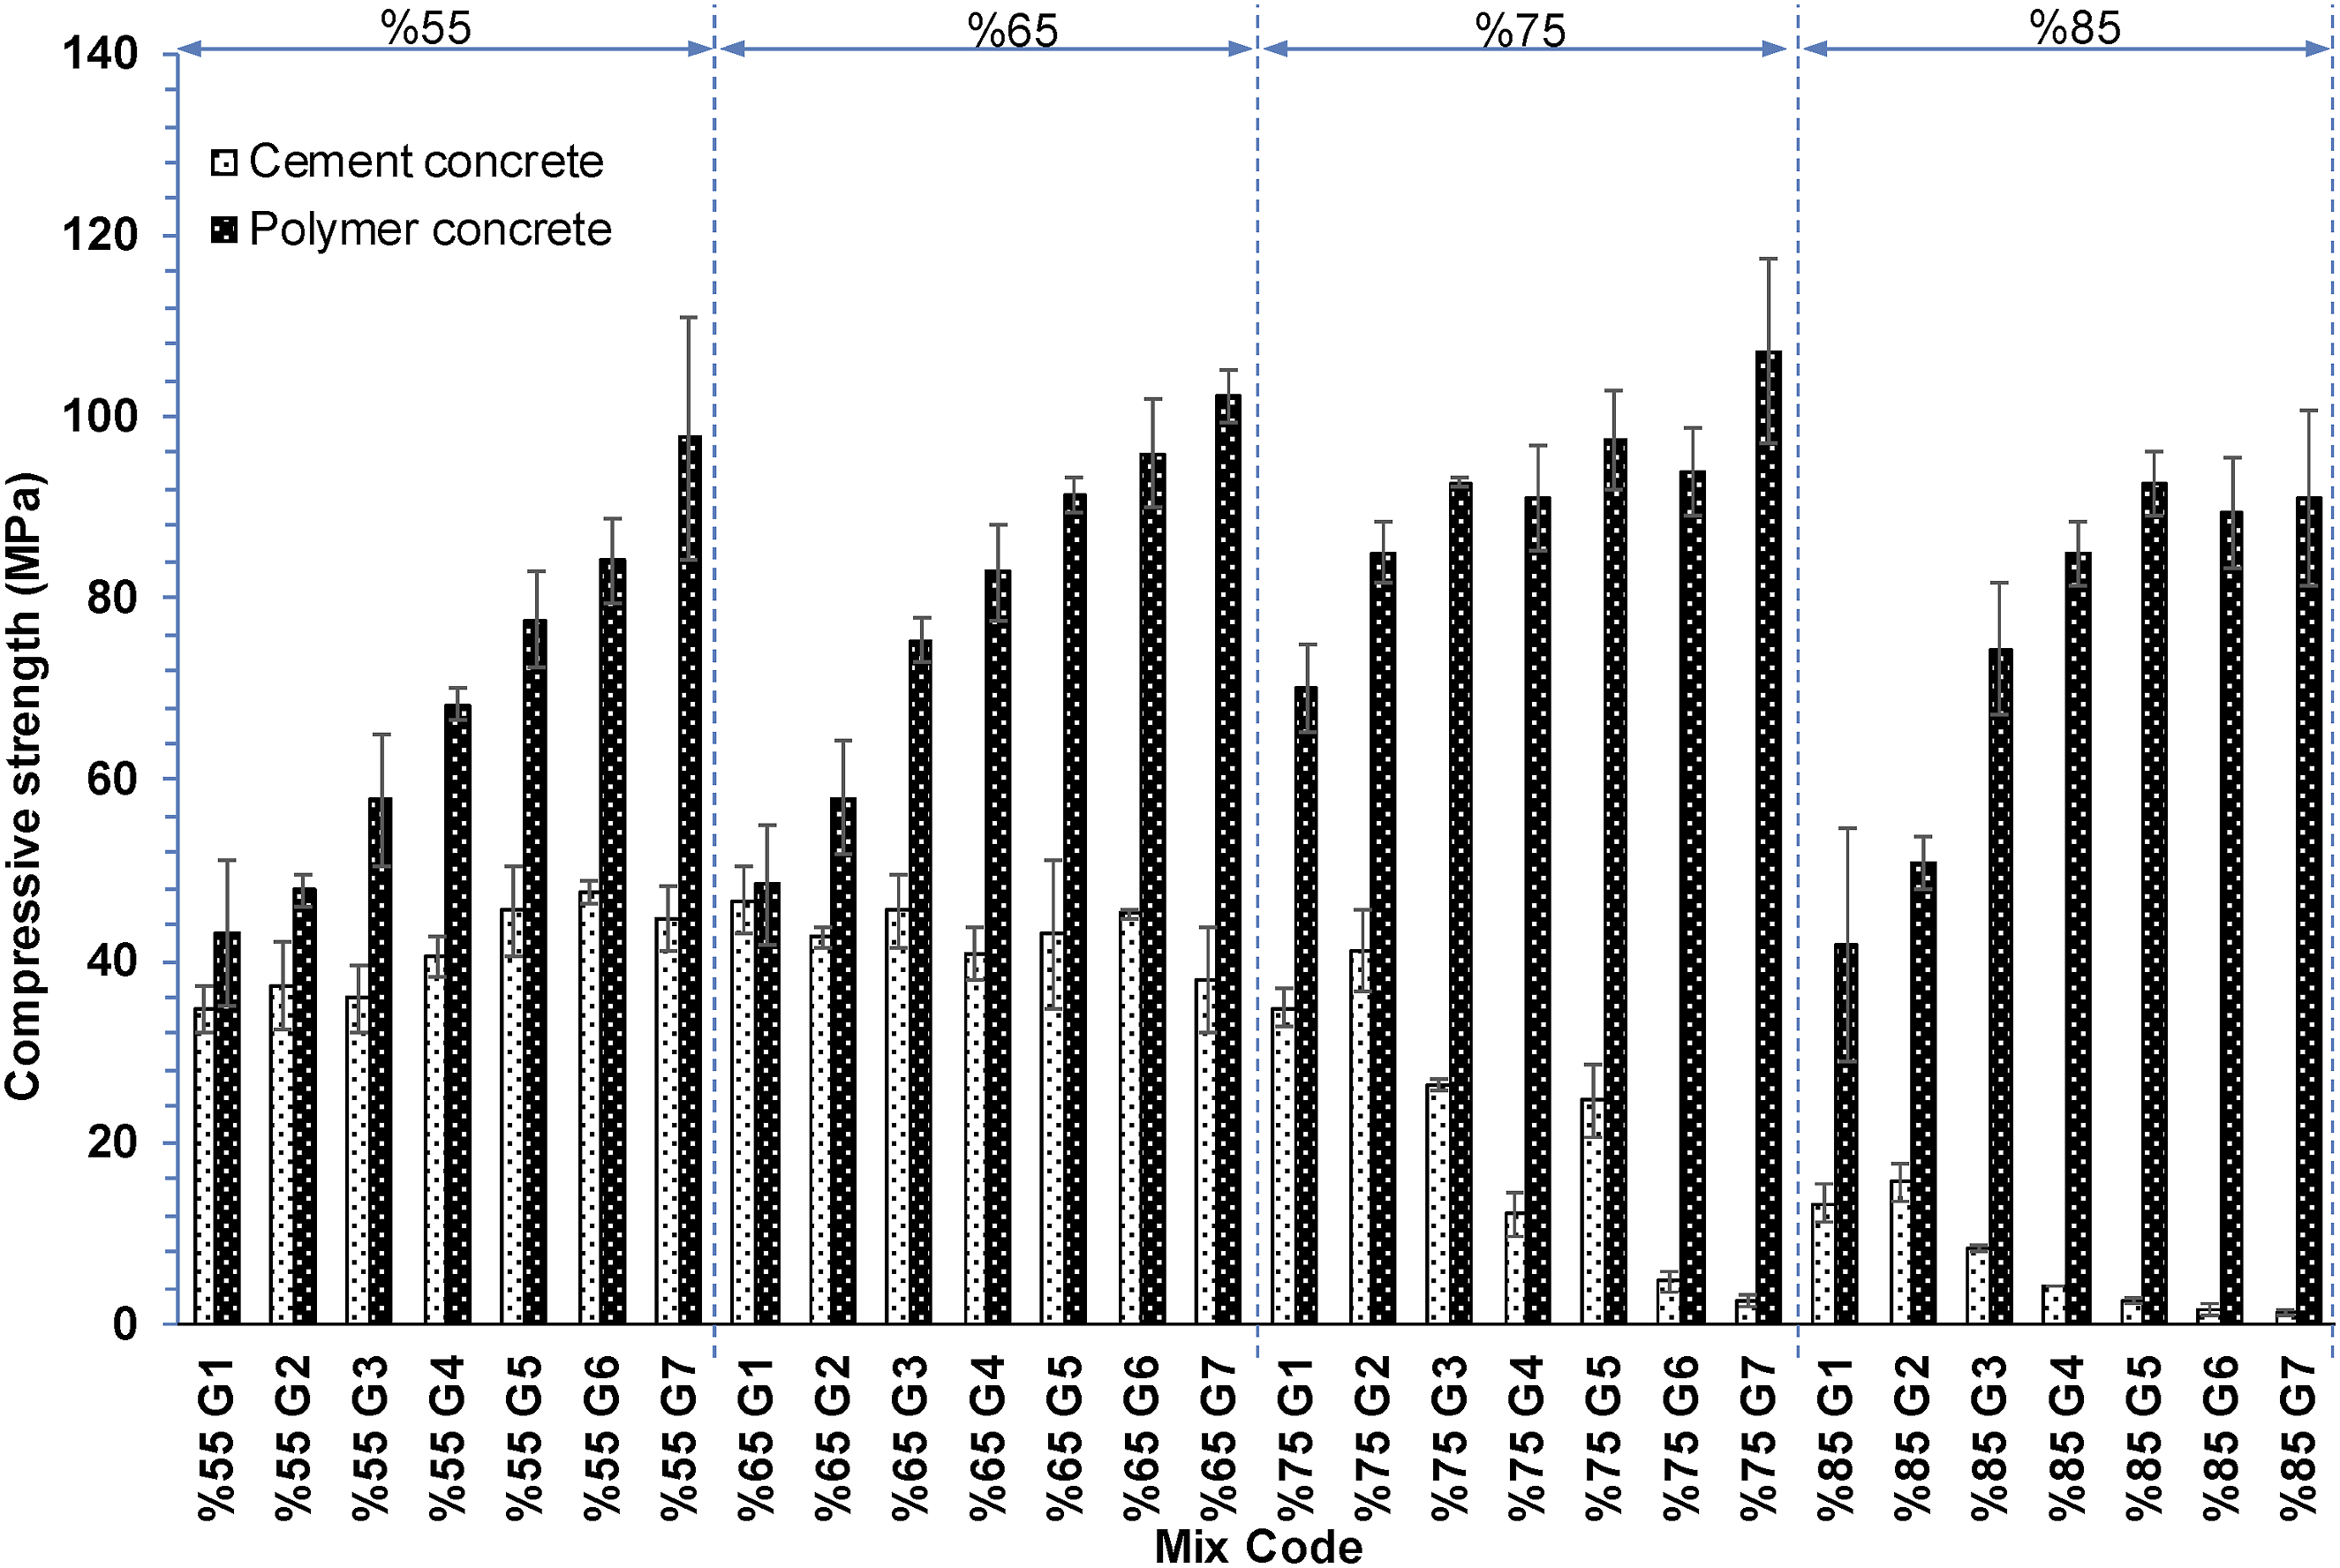
The amount of resin binder decreases from 55%G to 85%G mixture. The fact that the resin in the mixture is not too much prevents the separation of coarse and fine aggregates and results in a more homogeneous mixture. Homogeneous mixed concrete prevents the formation of excessive porous structure and causes the elimination of negative contact surface problems and naturally increases the strength (Figures 15 and 17). In this case, the effect of the type of granulometry curve on the strength decreases. The compressive strengths of 85%G3-G4-G5-G6-G7 samples are close to each other. These strength values are very different from each other in 55%G samples where the resin is too much.
Bending strength
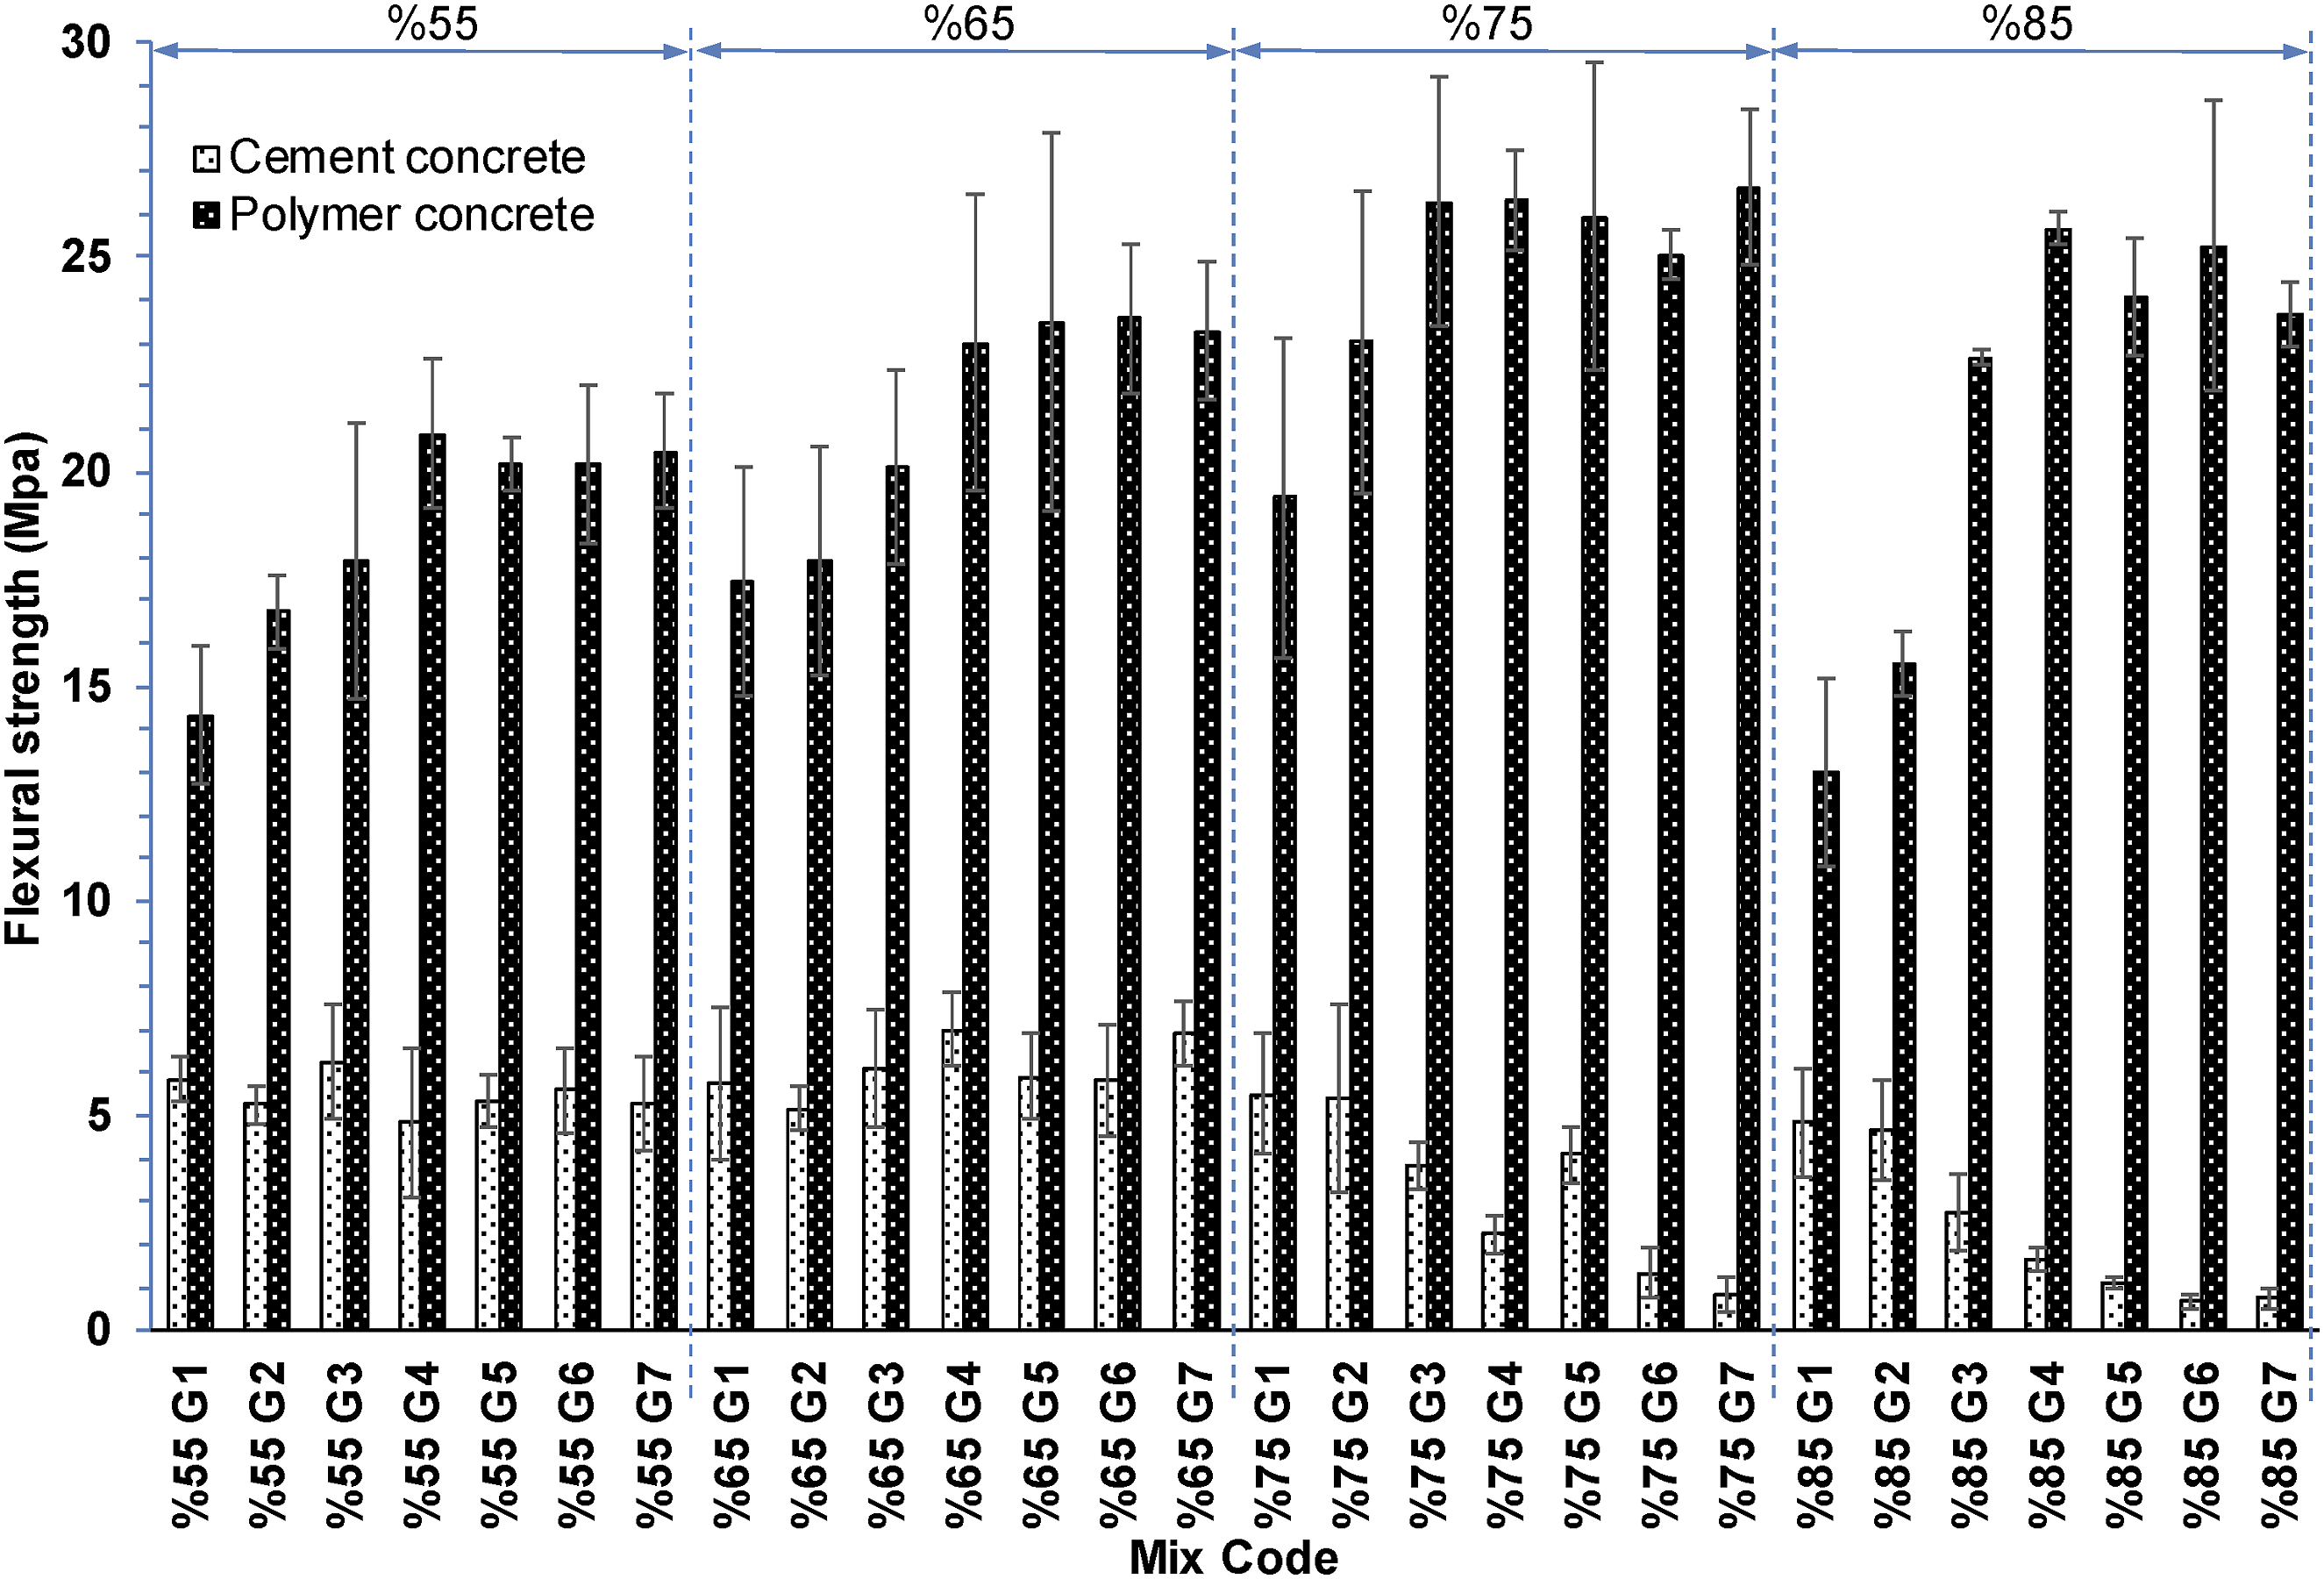
In Figure 16, the flexural strength of concrete produced using cement and polymer binder is examined. In the produced concretes, the flexural strengths of the cementitious concrete samples with 55% and 65% aggregate ratios are close to each other. The flexural strength reaches the highest values in cementitious concrete samples with 65% aggregate ratio. However, the bending strength of the samples with 75% aggregate ratio decreases after 75% G2 mixture. The flexural strengths of polymer concrete samples have the highest strength values for samples with 75% aggregate ratio. When the samples with 85% aggregate ratio are examined, the flexural strengths of 85% G1 and 85% G2 samples are lower than the flexural strengths of samples with other granulometry values. The flexural strength is lower in coarse aggregate polymer concretes. In concrete containing 55% aggregate (45% polymer), the difference in strength between 55% G1 concrete and 55% G7 concrete is 50 percent. Even though the amount of polymer decreases, that is, as you go from %55 aggregate ratios (concrete containing 45% polymer) to 75% aggregate (concrete containing 25% polymer), the flexural strength increases in polymer concrete samples. The flexural strengths of 75% aggregate polymer concrete in all granulometry types are greater than the samples at 55% and 65% aggregate mix ratios. Although the amount of polymer binder used is minimal, the flexural strengths obtained for G3, G4, G5, G6 and G7 in 85% aggregate concrete samples are very high. The high amount of polymer is not sufficient to increase the flexural strength. The factors that determine the flexural strength are the balance between the aggregate amount and granulometry in the mixture. In other words, the increase in the amount of polymer, which is a strong binder, does not always increase the strength, although it increases the production cost.
There are differences up to four times between the flexural strength of cementitious concrete and the flexural strength of polymer concrete. The bending strength of polymer concrete is very high. In this context, the idea of using polymer concrete instead of cementitious concrete in building elements where flexural strength is important gains more importance. The reason for this large difference in flexural strengths is thought to be the porosity and flexibility differences between cement-binder concrete and polymer-binder concrete.
In this study, in concretes containing cement as binder, the strength is good for all samples in G55 samples where the sum of cement and water amount is 45% and G65 samples where the sum of cement and water amount is 35%. For G75 samples where the sum of the water and cement amount is 25%, although the strength of the samples in G1-G2 granulometry is good, the strength decreases as the aggregate granulometry goes from G1 to G7 (Figures 15 and 16). It is understood from this that the effect of aggregate granulometry on the strength becomes dominant in G75 samples, where the ratio of cement and water in the mixture decreases.
As it is known, due to the presence of excess water in the mixture of cement-bindered concretes causes separation between the fine aggregates and the coarse aggregates of the cement-water mixture and causes segregation. Similarly, in plastic resined polymer concrete, when producing polymer concrete, where the resin percentage in the mixture is high, there may be separation between the resin and fine and coarse aggregates. In order to minimize or prevent this negative situation, the mixture should be mixed very well. When the resin amount is high, the fine aggregates try to float in the resin and move together, and the resin/fine aggregate mixture flows between the coarse aggregates, causing the fine and coarse aggregates to separate. Another reason for this situation can be shown as the resin density being too low (ρ = 1.1235 g/cm3). When the amount of resin is high, the excess resin tends to settle to the bottom of the mold, and it settles down under the effect of gravity by covering the fine aggregates. When the resin percentage in the mixture is too low, pores and ITZ defects may occur in the samples, because the amount of binder decreases. Since polymer concrete sets (hardens) very quickly and due to the negative conditions mentioned above, the production of polymer concrete containing polyester and epoxy is more difficult than cement concretes. However, the strengths of polymer concretes are much higher (3-4 times more) than cement-binder concretes (Figures 15 and 16).
Scanning electron microscope observations
The internal structure of cementitious concrete (CC) and polymer concrete (PC) samples was investigated using Scanning Electron Microscopy images.
Microstructure (SEM) analysis of the hydrated cement pastes
It is seen that the change in granulometry does not affect the concrete strength excessively in 55% and 65% mixtures samples where the cement amount is high in cementitious concrete (Figures 15 and 16). A SEM picture of cement mortars matured in normal water cure after 28 days of hydration is shown in Figure 18. When these images were examined, it was determined that C-S-H gels were prominent and covered the internal structure. When Figure 18 was examined, it was observed that the density of the C-S-H gels increased and completely covered the C-H gels. SEM image of CH crystals, C-S-H gels and Ettringites in cement pastes after 28 days of hydration.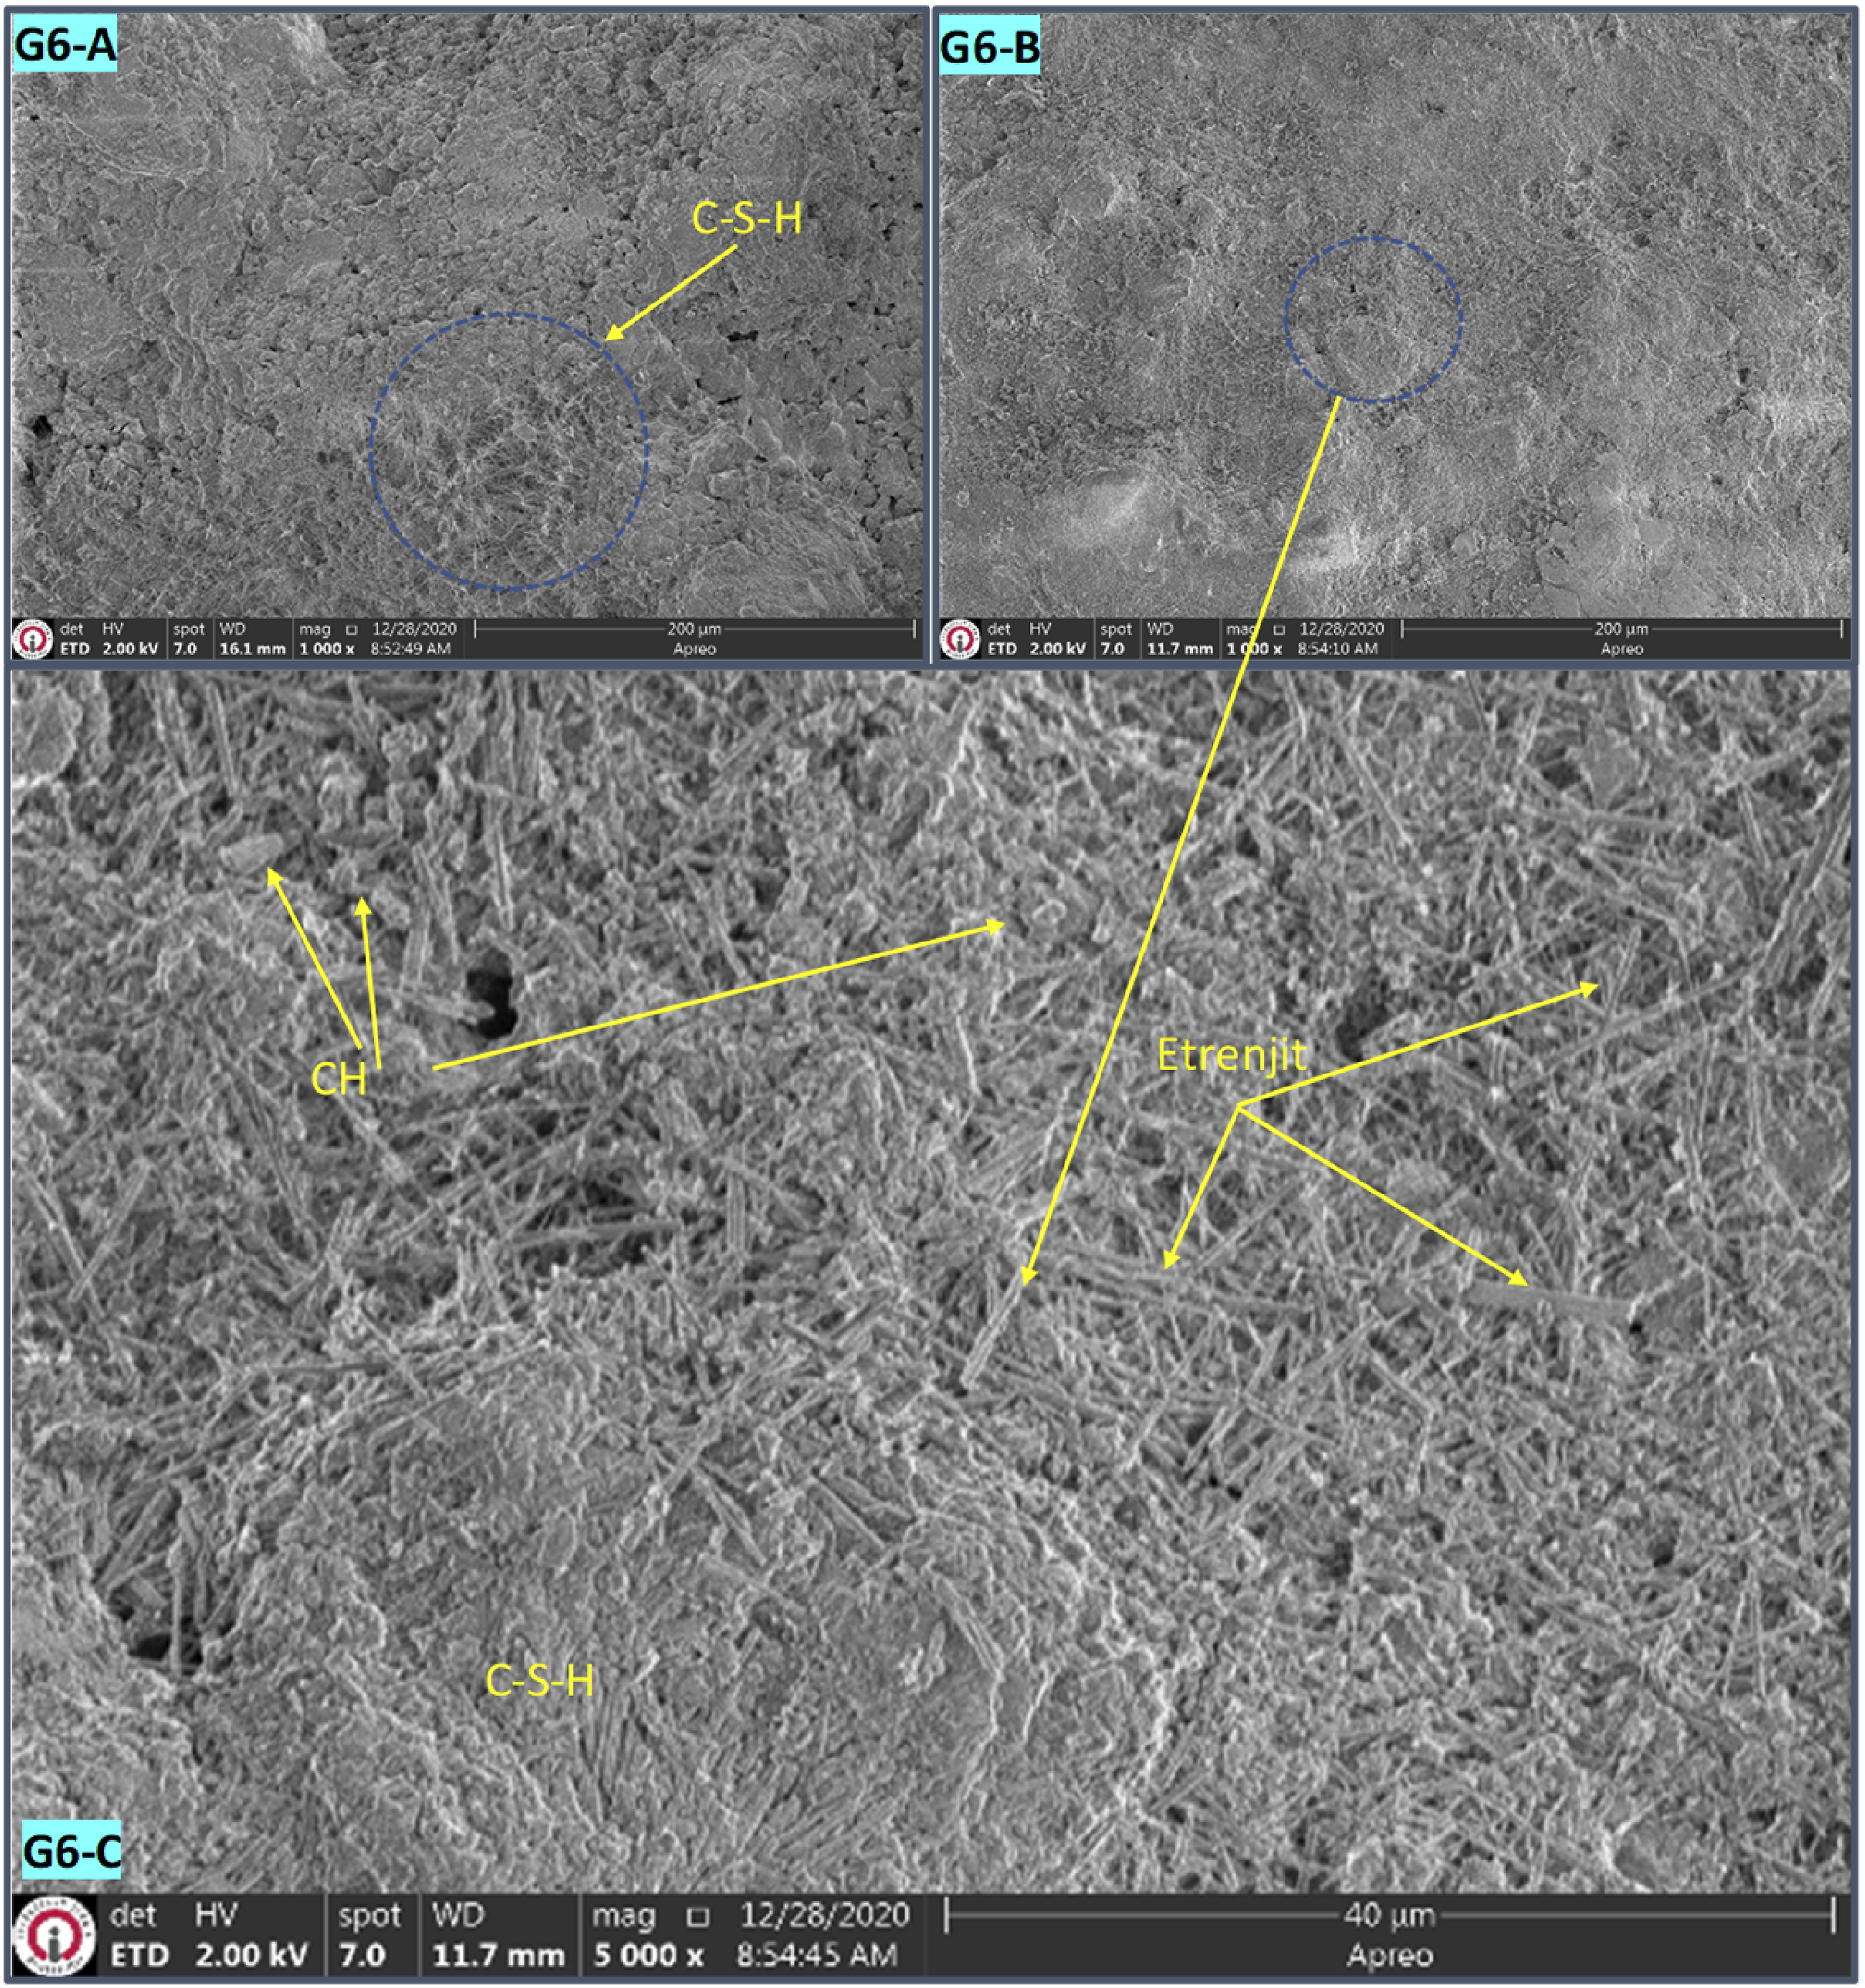
In Figure 13, huge air bubbles were seen in the cementitious concrete paste prepared by increasing the amount of aggregate in the mixture and the coarse aggregate granulometry in the cementitious concrete. The presence of these pores can cause a decrease in the compressive strength of composite concretes and also in unit weight. As a result of this situation, weak bond/adhesion occurs between aggregate and cement matrix. It has been understood that the decrease in the mechanical properties of cemented concrete is due to this.
In polymer concrete, the amount of ITZ and pore formation is much less than cement concrete. For this reason, the strength of polymer concrete is higher and more stable. In Figure 14, when the interfacial transition zone (ITZ) between the cementitious matrix and the aggregates is examined, as seen in the SEM images, the interfacial transition zones are seen more and also more prominent in the cemented concrete samples. In polymer-binding concrete, on the other hand, the interfacial transition zone (ITZ) is less (Figure 14). This causes the strength of cement-bindered concretes to be lower than the strength of polymer-bindered concretes.
Microstructure (SEM) analysis of the polymer concrete pastes
When Figure 17 is examined, the distribution of the aggregate in the polymer concrete paste is seen. In the images, it is understood that the polymer paste completely covers the aggregates and the pore ratio is very close to zero. In addition, the change in aggregate granulometry enables polymer concrete to be produced more homogeneously. It is seen that the finer grains of the aggregate in the polymer concrete mixture make the mixture more homogeneous. Coarse aggregates are more in the G1 mixture, and much less in the G7 mixture. When it goes from G1 to G7, the fine aggregate ratio increases (Figure 4 and Table 3) and the polymer causes the concrete to mix more homogeneously. It is seen that the flexural and compressive strength of PC increases as it goes from G1 to G7 (Figures 15 and 16). Figures 15 and 16 shows that the granulometry of the aggregates in the mixture has a decisive effect on the strength. It is understood from Figure 13 that this effect is related to the homogeneous distribution of the granulometry of the aggregates in polymer concrete.
In polymer concrete, the defects that occur during the reaction in cement concrete do not occur. In addition, the amount of ITZ and pore formation is much less than cement concrete. For this reason, the strength of polymer concrete is higher and more stable. However, polymer concrete production is more expensive and more precautions must be taken in order not to cause health problems at the time of production.
Polyester-based thermoplastic binder resin is used as a binder when producing polymer concrete. This resin is a thermoset, that is, a heat-emitting polymer, and expands during production time. In this way, it tightly covers the aggregates. This situation brings the porosity ratio in polymer concrete close to zero, prevents the aggregates from breaking away from the concrete, and thus increases the strength (Figures 15–17). In addition, this resin covers the surfaces of the aggregates much more than the cement binder. This situation increases the adhesion between the aggregate and the binder, and the resistance of the tested samples against compression and bending (Figures 15 and 16).
Results of ultrasonic pulse velocity tests
When the values obtained as a result of the ultrasonic test are examined, the concrete quality classification for G1, G2, G3, G4, G5 mixtures in cemented concrete samples is excellent and at a good level. For G6 and G7 mixes, it is at a good level in the case of concrete with 55% and 65% aggregate mix. It is medium quality or poor quality level for samples with 75% and 85% aggregate mixture ratios (Figure 19). When the ultrasonic test data obtained for polymer concrete is examined, it is subject to good level classification in all mix codes and mix percentages (Figure 19). The reason for this situation is thought to be because the air ratio in polymer concrete is almost zero. Ultrasonic pulse velocity test results for polymer and cement concrete.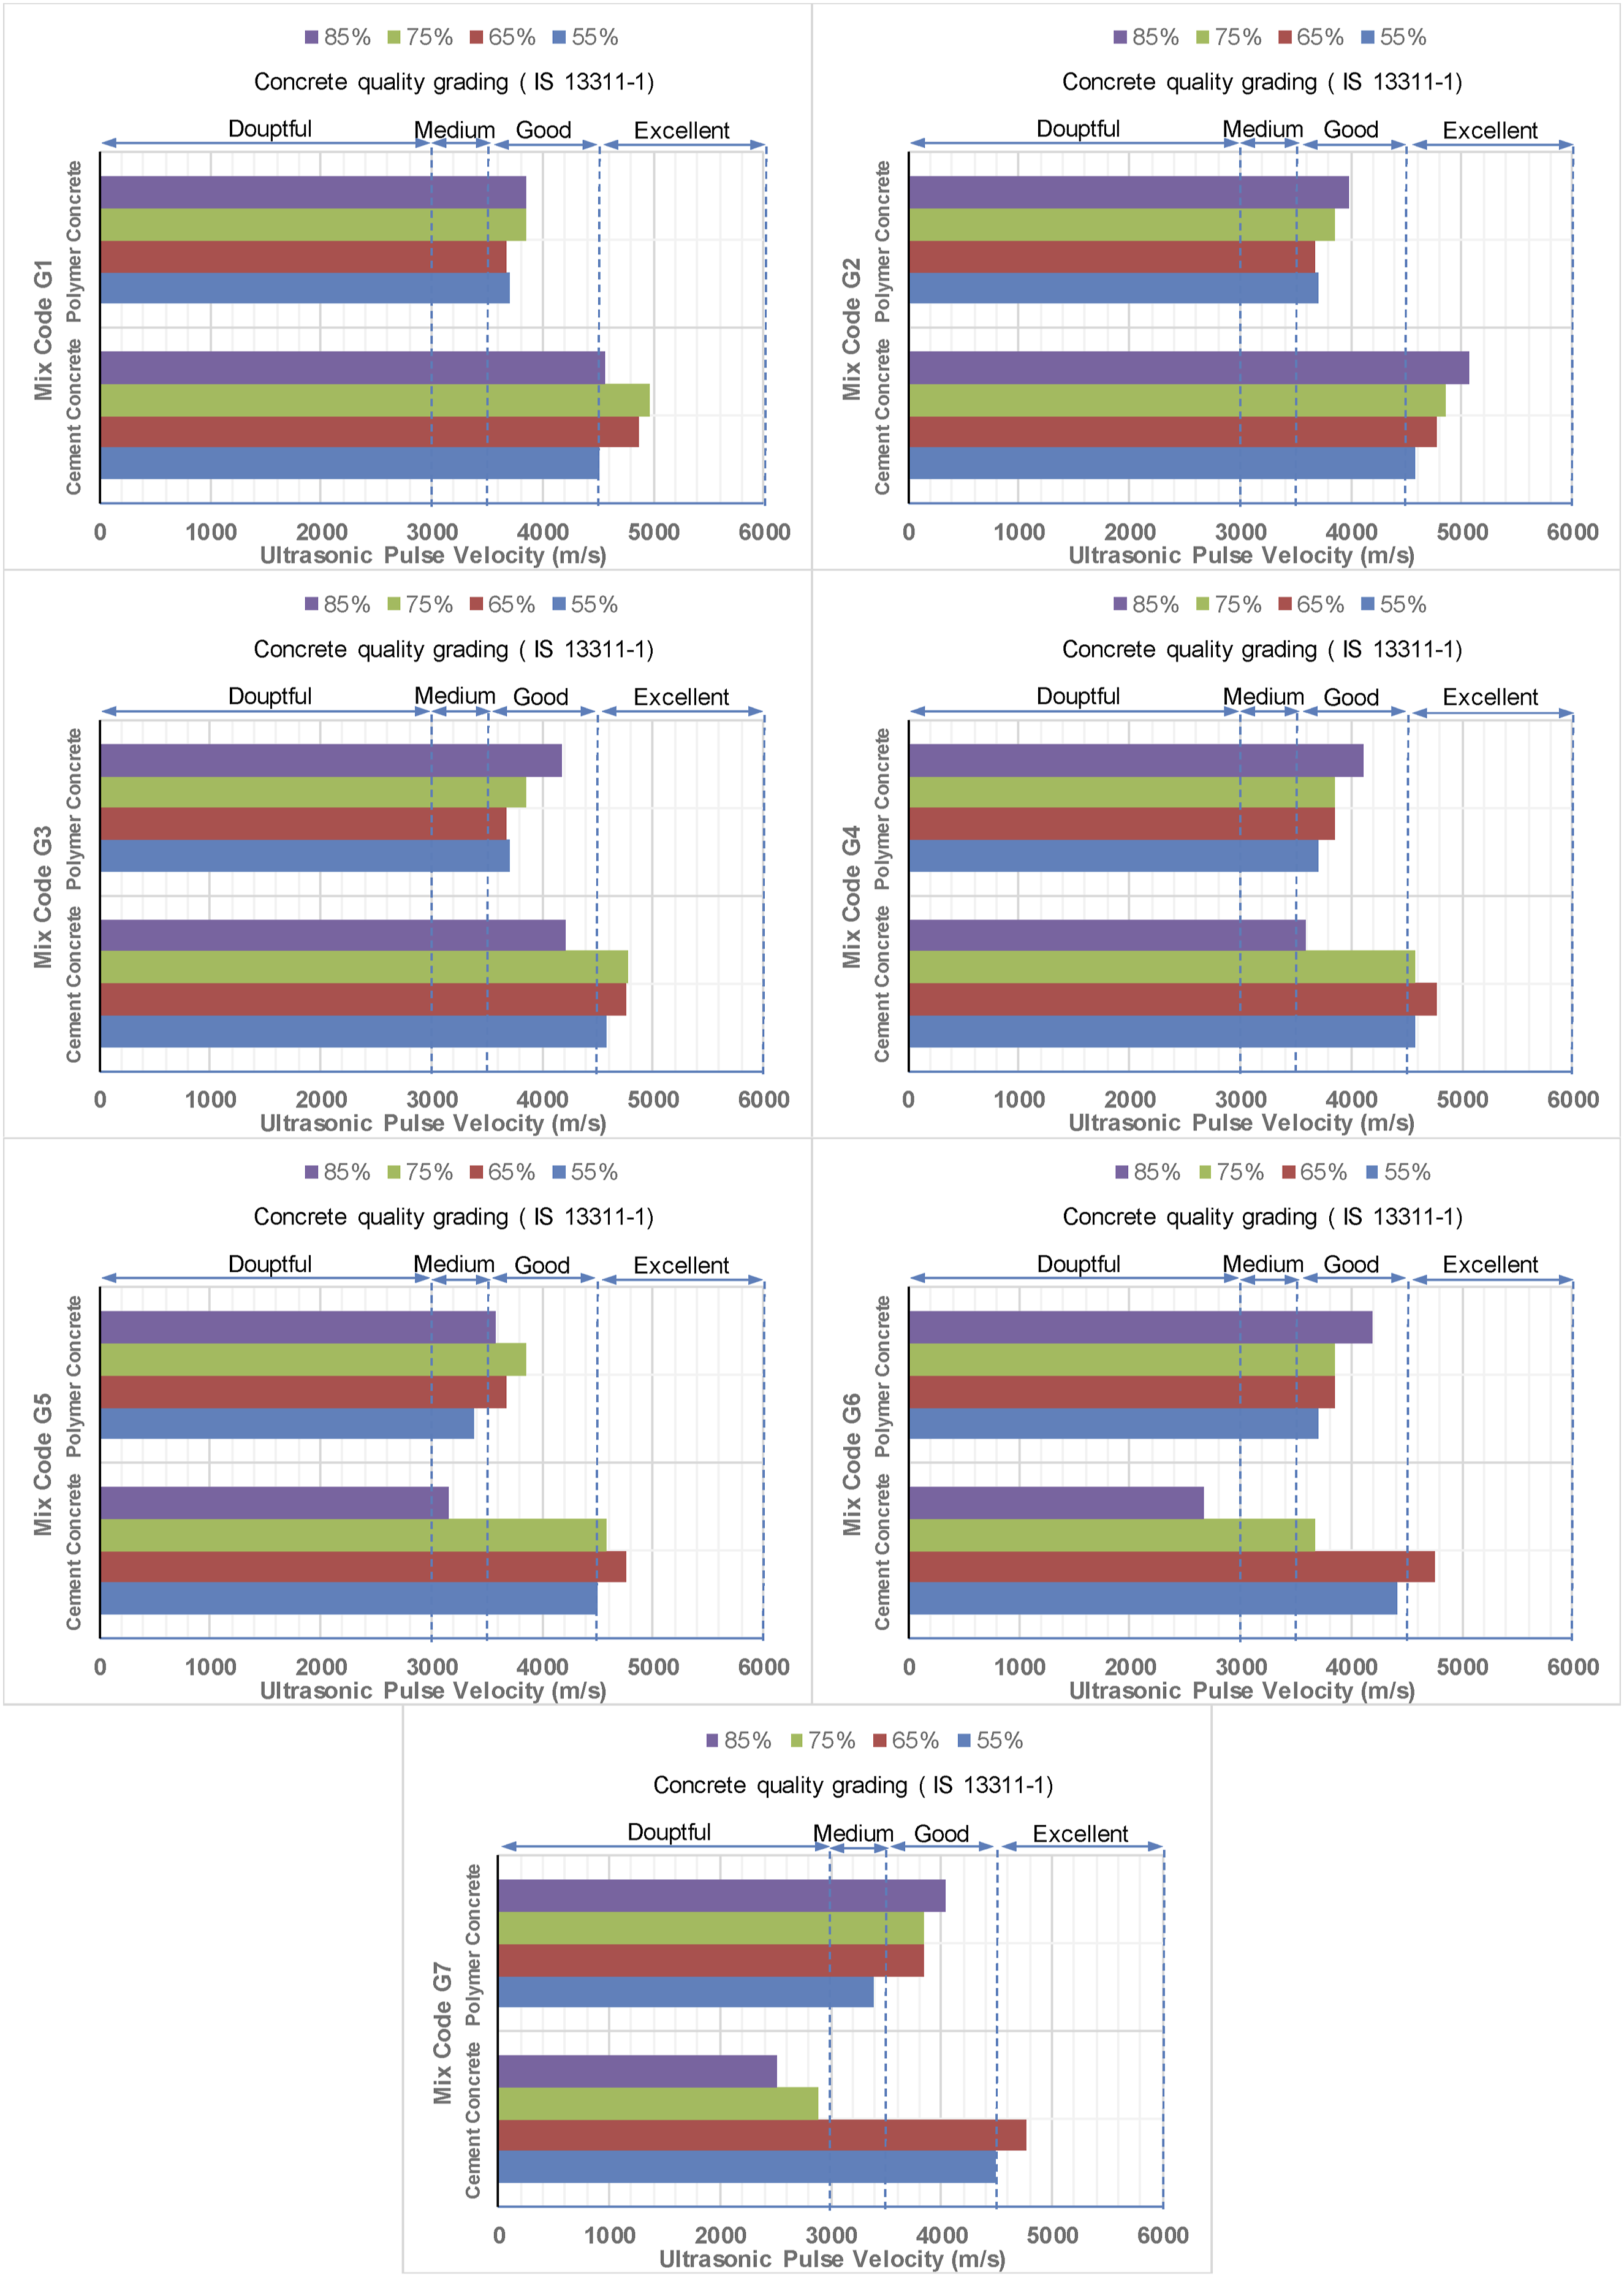
When the ultrasonic test results are examined, the graphs obtained by considering the ultrasonic speed are shown in Figure 19. It is understood from the graph that the compressive strength of cementitious concrete and ultrasonic velocity are compatible with each other. As the ultrasonic speed decreases, the compressive strength also decreases. When the compressive strength graph is examined, remarkable decreases in compressive strength are seen in samples %75G6 and %75G7 (Figure 15). In the ultrasonic test graph shown in Figure 19, the velocity value decreases in these samples (Figure 19) and is compatible with the compressive strengths of cementitious concrete seen in Figure 15. For polymer concrete samples, velocity values for ultrasonic test results are compatible with polymer concrete compressive strength values. Polymer concretes have more balanced ultrasonic velocity values than cement concretes (Figure 19).
Ultrasonic pulse velocity (UPV) tests provide important information about the pulse transmission rate in concrete samples. It should be noted that UPV is indirectly related to the porosity of the concrete. Figure 19 shows the ultrasonic pulse velocity (UPV) values of concrete samples. The results obtained showed that there was a decrease in the ultrasonic pulse velocity as the percentage of plastic binder in all mixtures increased. In cement-binder concrete, it was determined that the type of granulometer is more important than the binder percentage. At %55G, %65G, UPV speeds are almost equal. After %75G5, UPV speed starts to decrease. At %85G, UPV speed decreases significantly after %85G2. In parallel with this situation, the compressive and flexural strengths also decrease. The behaviors of UPV speeds and compressive and flexural strengths of all samples in cement-binder concrete are consistent. When UPV speed increases, strength increases, and when UPV speeds decrease, strength decreases. In cement-binder concrete, increasing the percentage of fine-grained aggregate in the mixture decreases strength. However, this negativity is eliminated as the percentage of cement-binder concrete in the mixture increases. For cement-binder concrete, UPV speeds decrease from G1 to G7 in the %75G and %85G samples, and the strength decreases accordingly. In the %55G and %65G samples, UPV speeds almost do not change from G1 to G7. Strength values are also almost the same. The reason for this situation is that due to the high amount of cement in the %55G and %65G mixtures, the expected decrease in strength does not decrease from G1 to G7. In other words, the strength values that should decrease from G1 to G7 are prevented by increasing the amount of cement in the mixture. At %85G mixture percentage, the cement and aggregates cannot adhere well to each other as the amount of cement binder decreases, and thus segregation and pores occur in the mixture (Figures 13 and 14). This situation reduces the strength to an extreme level (Figures 15 and 16). Due to these pores, the transmission of the UPV wave in the mixture becomes difficult and as a result, the speed values also decrease (Figure 19). In line with the decrease in speed values, the strength values also decrease (Figures 15 and 16).
In plastic-binder concrete, it has been determined that the type of granulometry and the amount of fine aggregate in the mixture are more important than the percentage of binder in the mixture. Increasing the percentage of fine aggregate in the mixture significantly increases the compressive and especially the flexural strength. In %55G and %65G samples, UPV speeds are almost equal. After %75G5, UPV speed started to increase. In the %85G, UPV speed increased slightly after %85G2. In parallel with this situation, compressive strengths in the %55G and %65G samples increased very little or were almost similar, while there was an increase in flexural strength from %55G to %65G. In the %75G mixture ratio, compressive strength is similar to those in 55%G and 65%G mixture ratios, while flexural strengths increased. In %85G mixture percentage samples, there is a decrease in strengths in G1 and G2, but strengths increase from G3 to G7. It was understood that the reason for this increase in strength despite the decrease in the binder percentage in the mixture is the increase in the fine aggregate percentage in the mixture from G1 to G7. As we go from %55G to %75G, the strength increases despite the decrease in the plastic binder percentage in the mixture. This explains the following; the plastic binder and fine aggregates are mixed more homogeneously (Figure 17) and thus the strength increases (Figures 15 and 16).
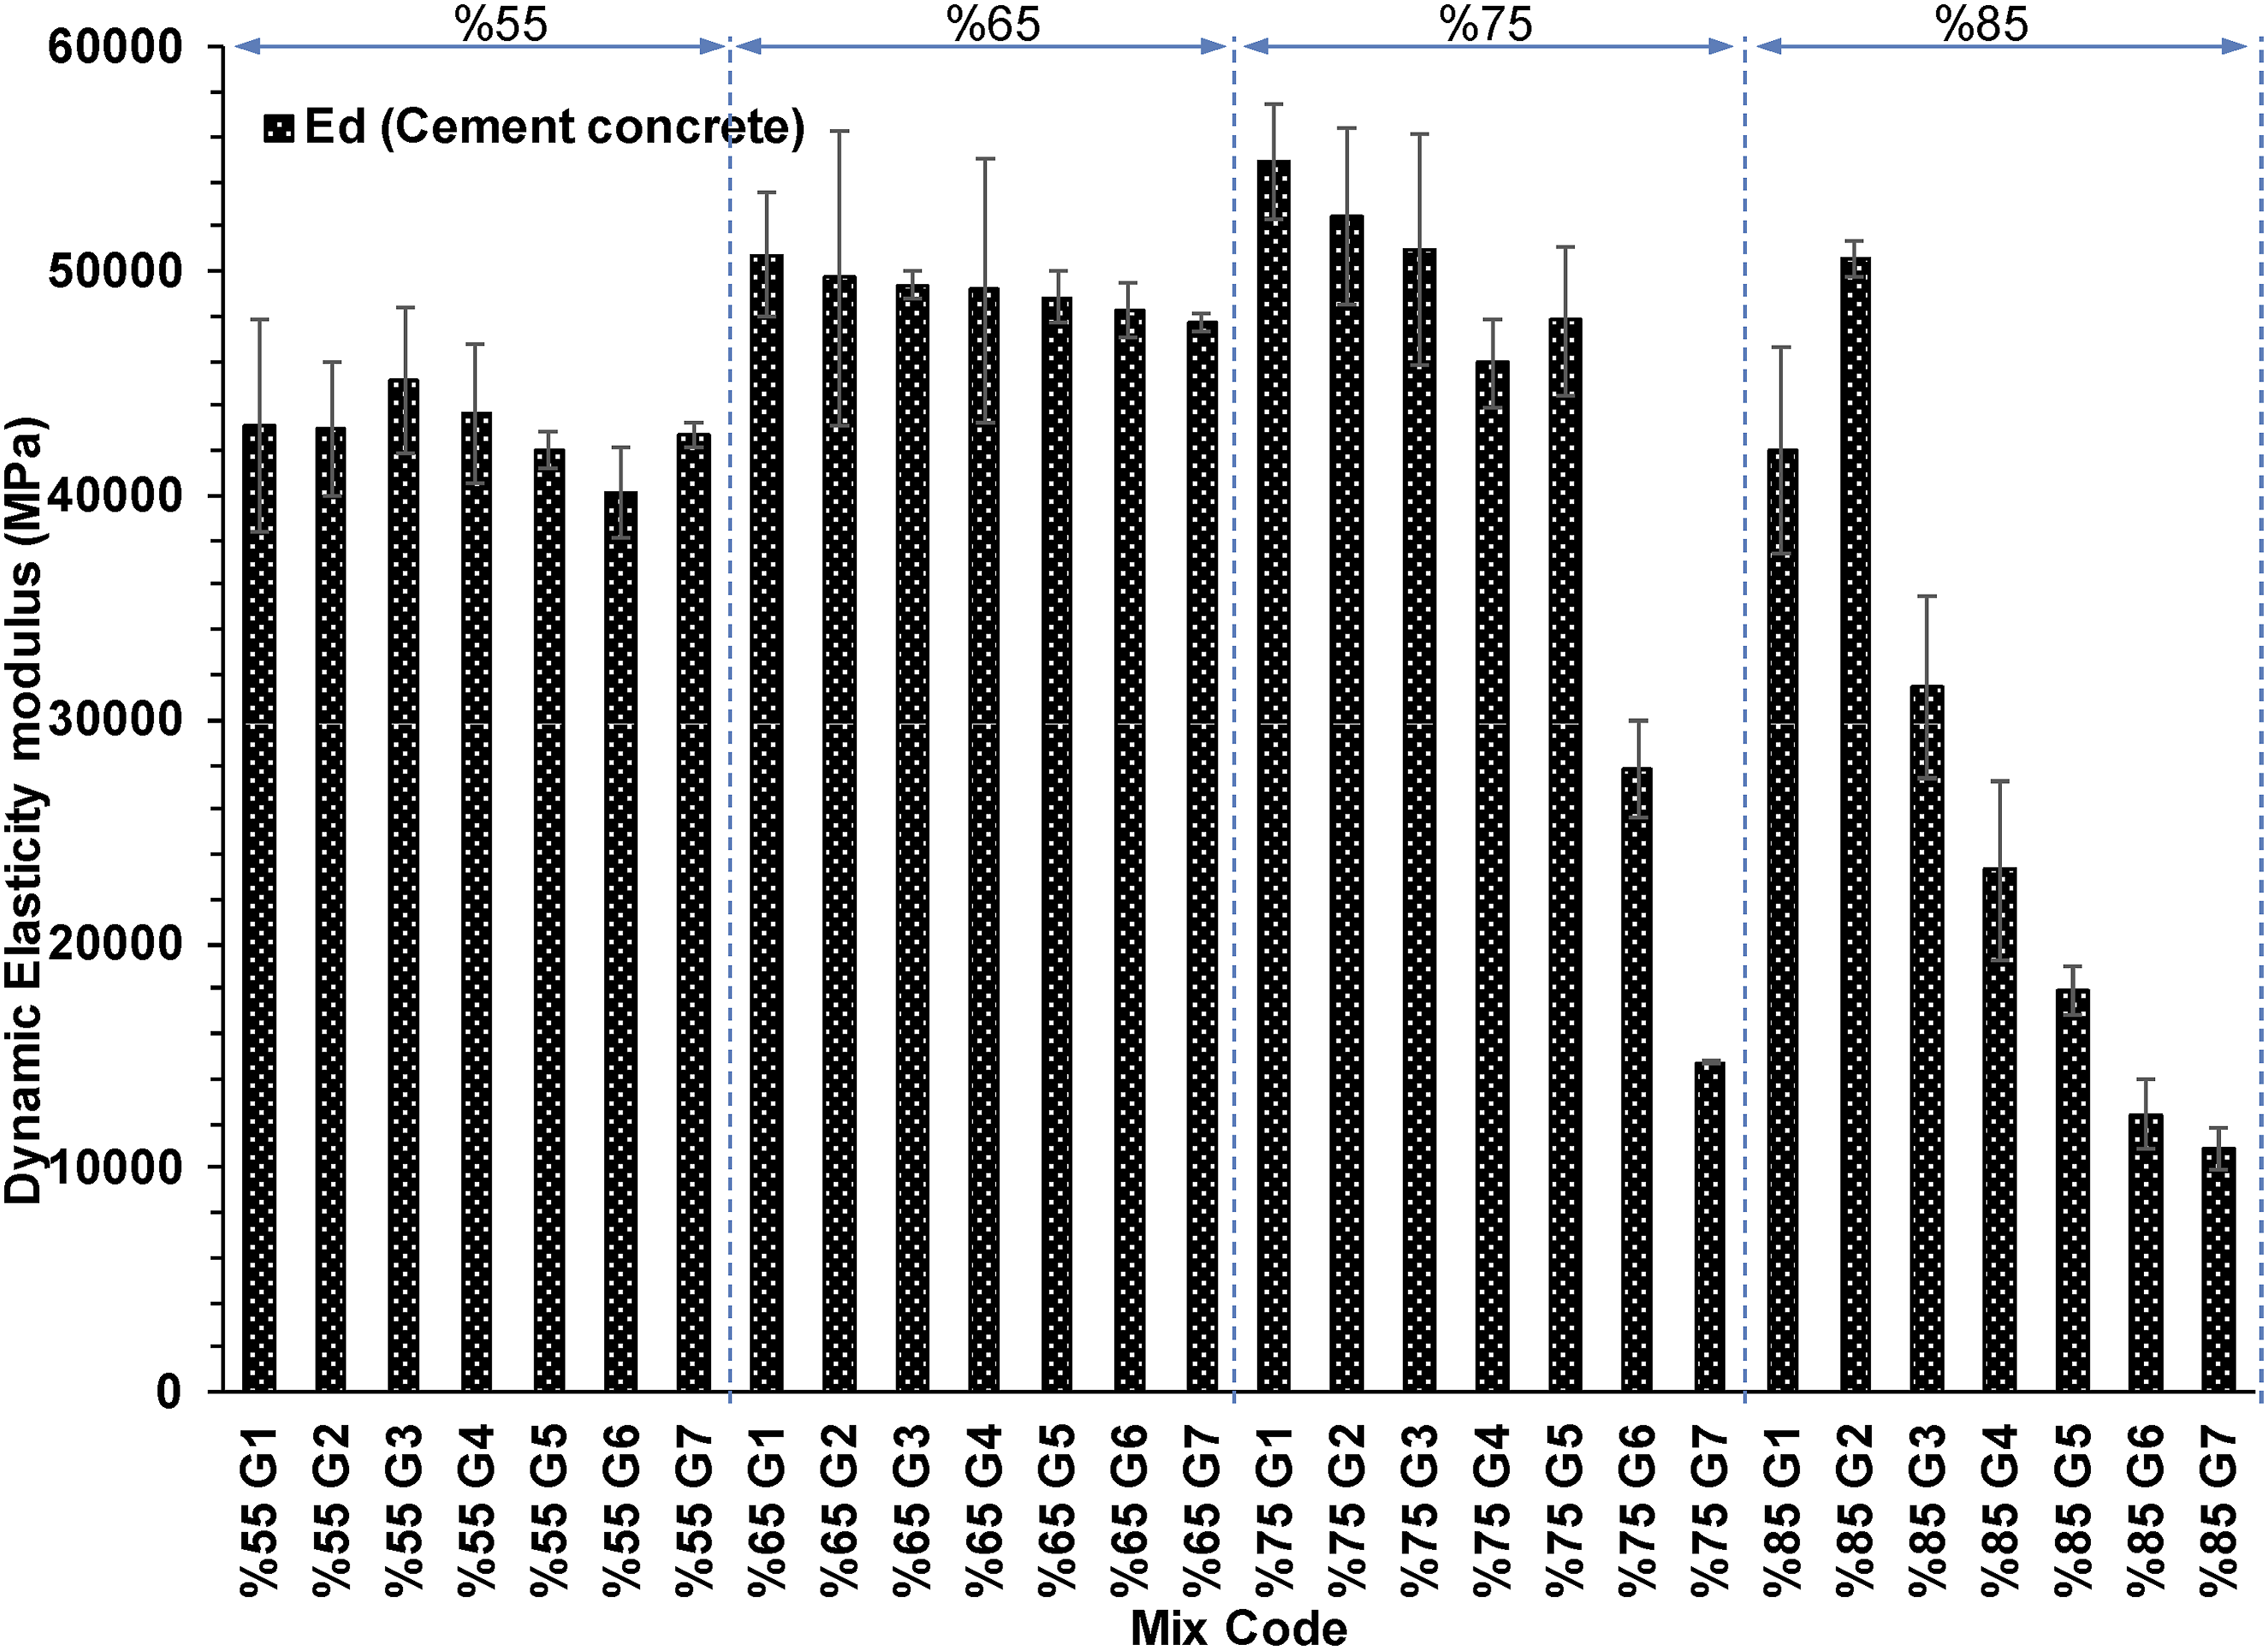
In this study, the theoretical formula was used in the calculation of the dynamic elasticity modulus. In this formula, the UPV wave speed is a parameter. In other words, the calculated dynamic elasticity modulus values are directly dependent on the UPV wave speed. In cement-binder concretes, the UPV speed and the dynamic elasticity modulus behavior are compatible (Figure 21). When the obtained results are examined, it is seen that the formulation given for the dynamic elasticity modulus gives more realistic results in cement-binder concretes than in polymer concretes (Figures 20 and 21). This formula needs to be developed for polymer concretes. In the following studies, it is planned to develop a formula for the dynamic elasticity modulus for polyester and epoxy resin concretes. The dynamic elasticity modulus of polymer concrete. The dynamic elasticity modulus of cement concrete.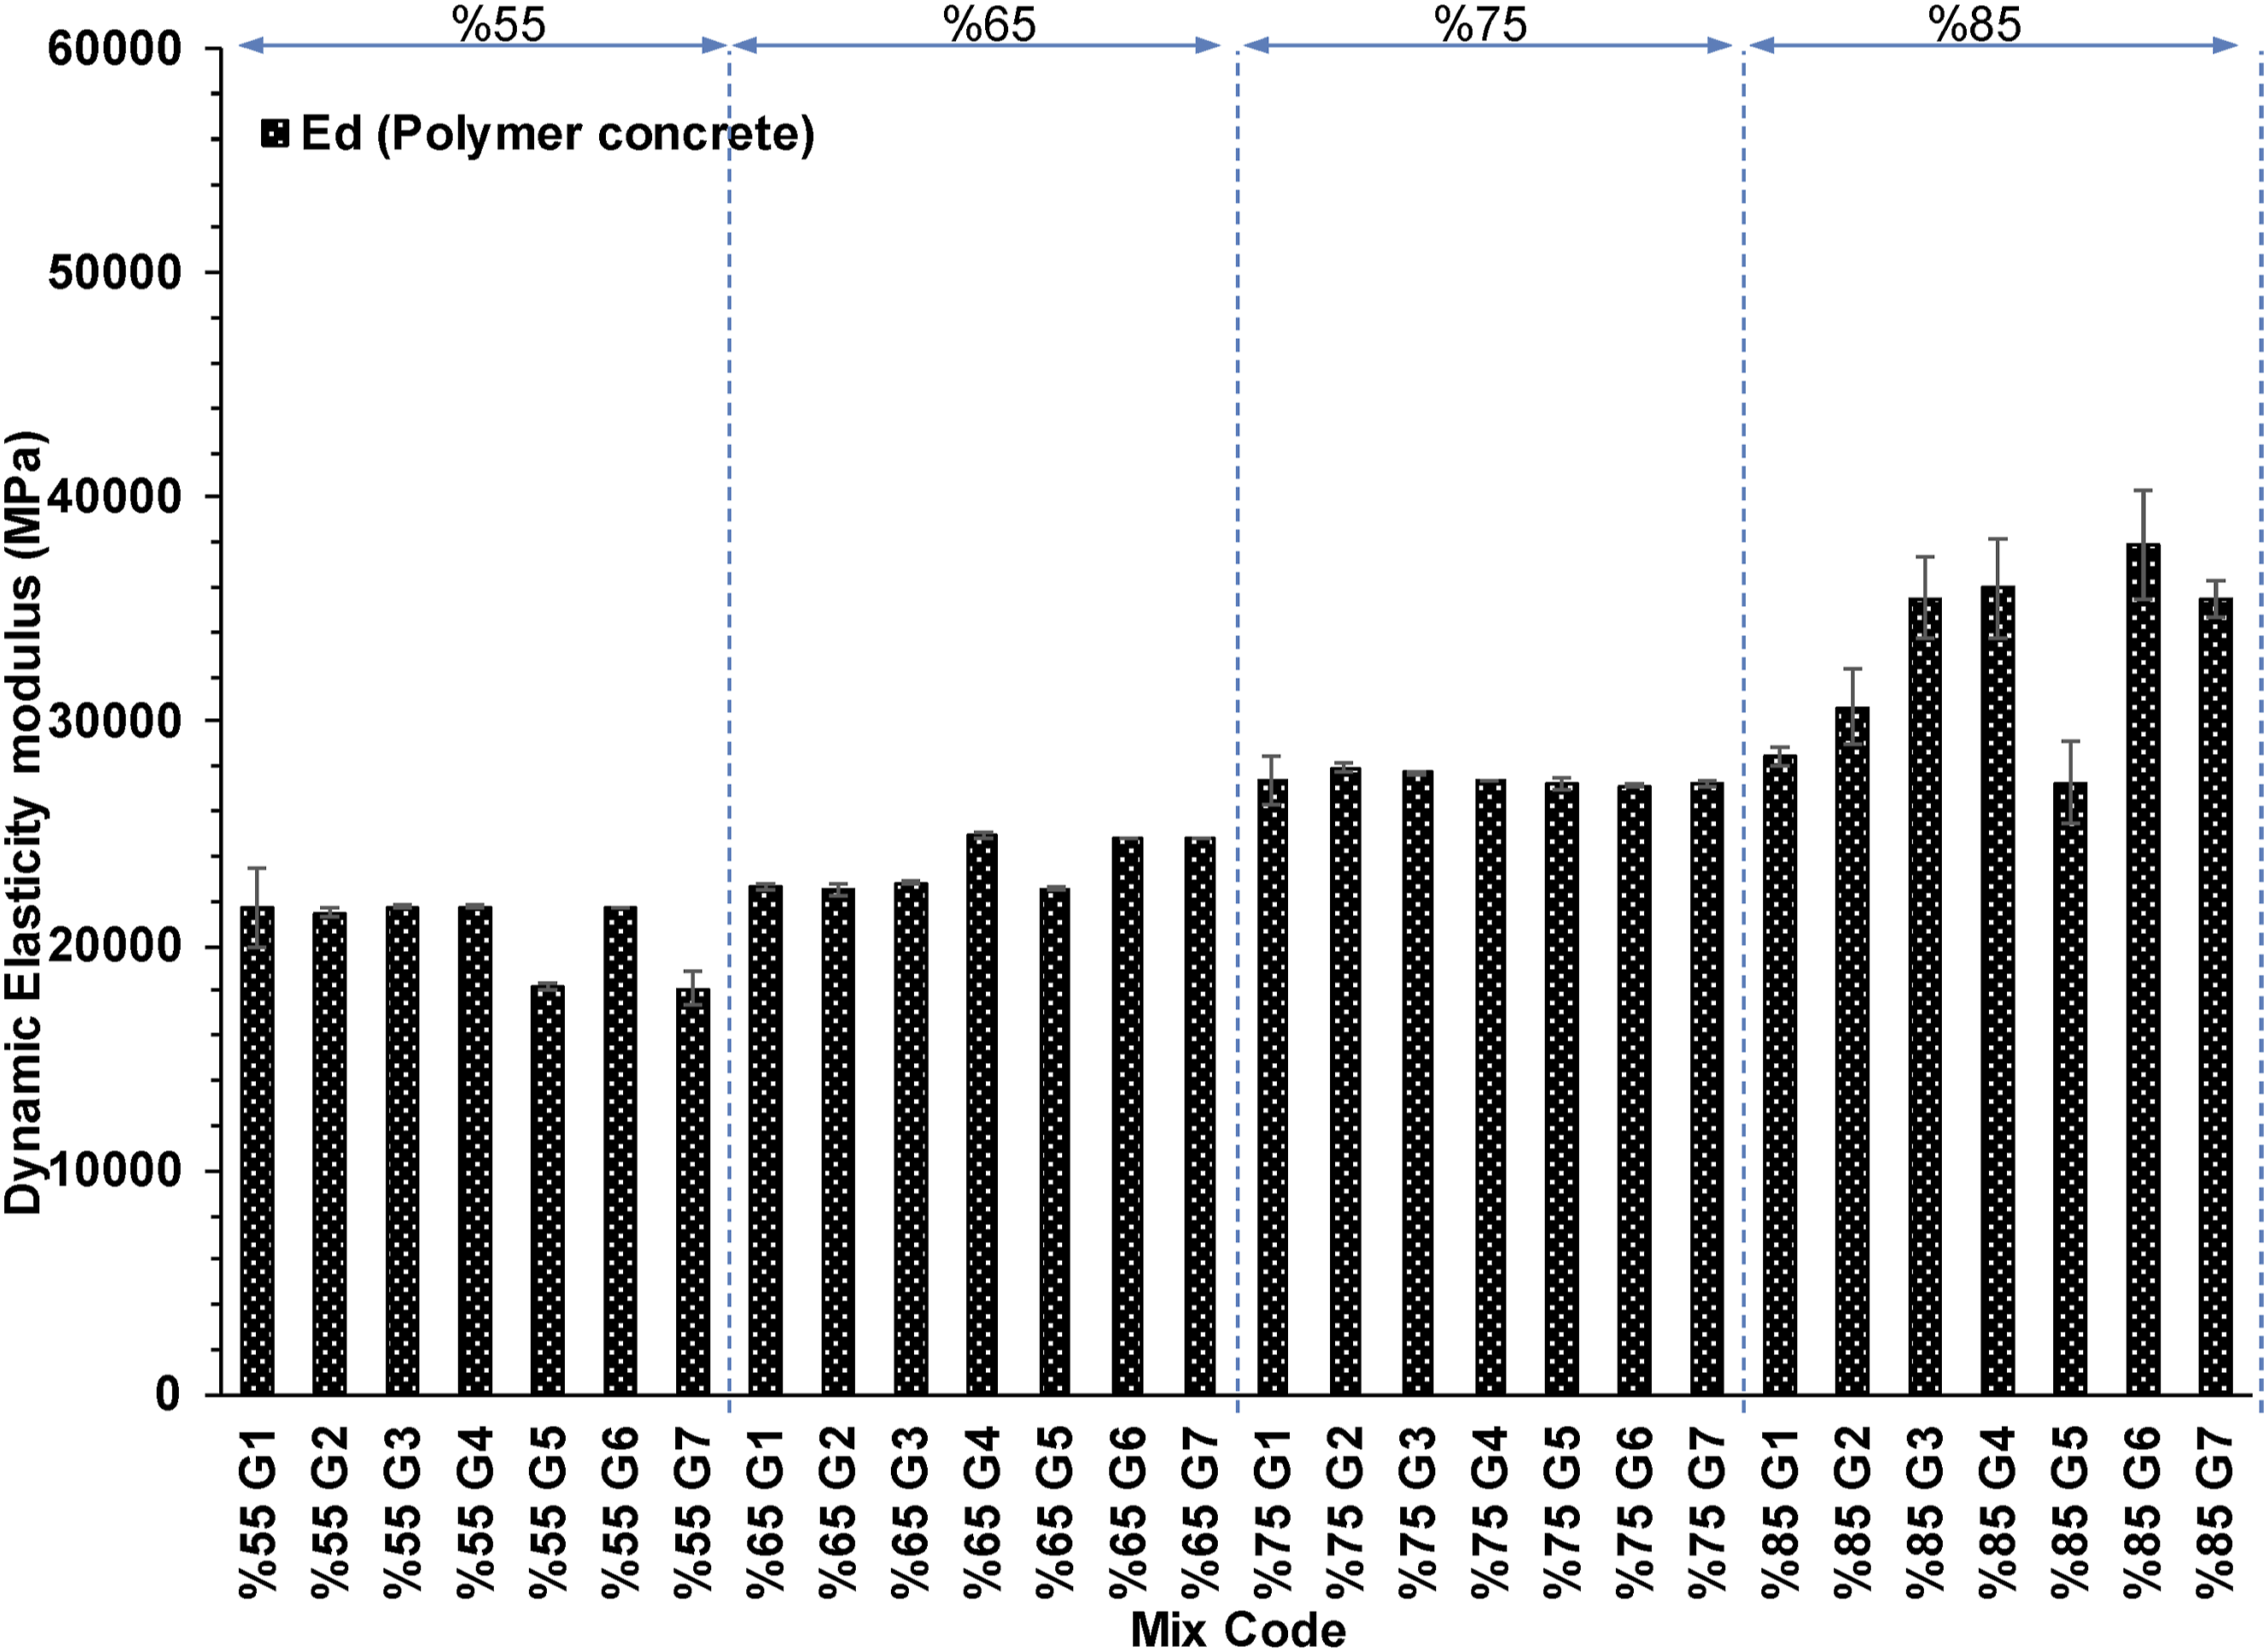
The dynamic modulus of elasticity
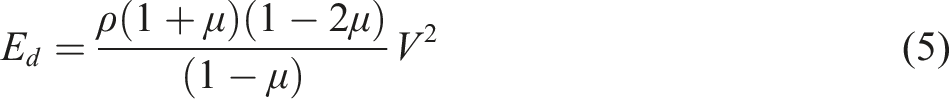
Dynamic elasticity modulus was determined with the help of equation (5) using ultrasonic velocity values. The change in the dynamic elasticity modulus for plastic concrete is displayed in Figure 20. It shows that as the percentage of plastic in the mixture increases (or the aggregate ratio decreases), the dynamic modulus of elasticity increases. On the other hand, in Figure 21, the dynamic elasticity modules of the samples at various mixing ratios in cementitious concrete are seen. The dynamic elasticity modulus values are at the highest levels in the samples with 55% and 65% aggregate mixture ratio. A decrease occurs at 75% aggregate mixing ratios.
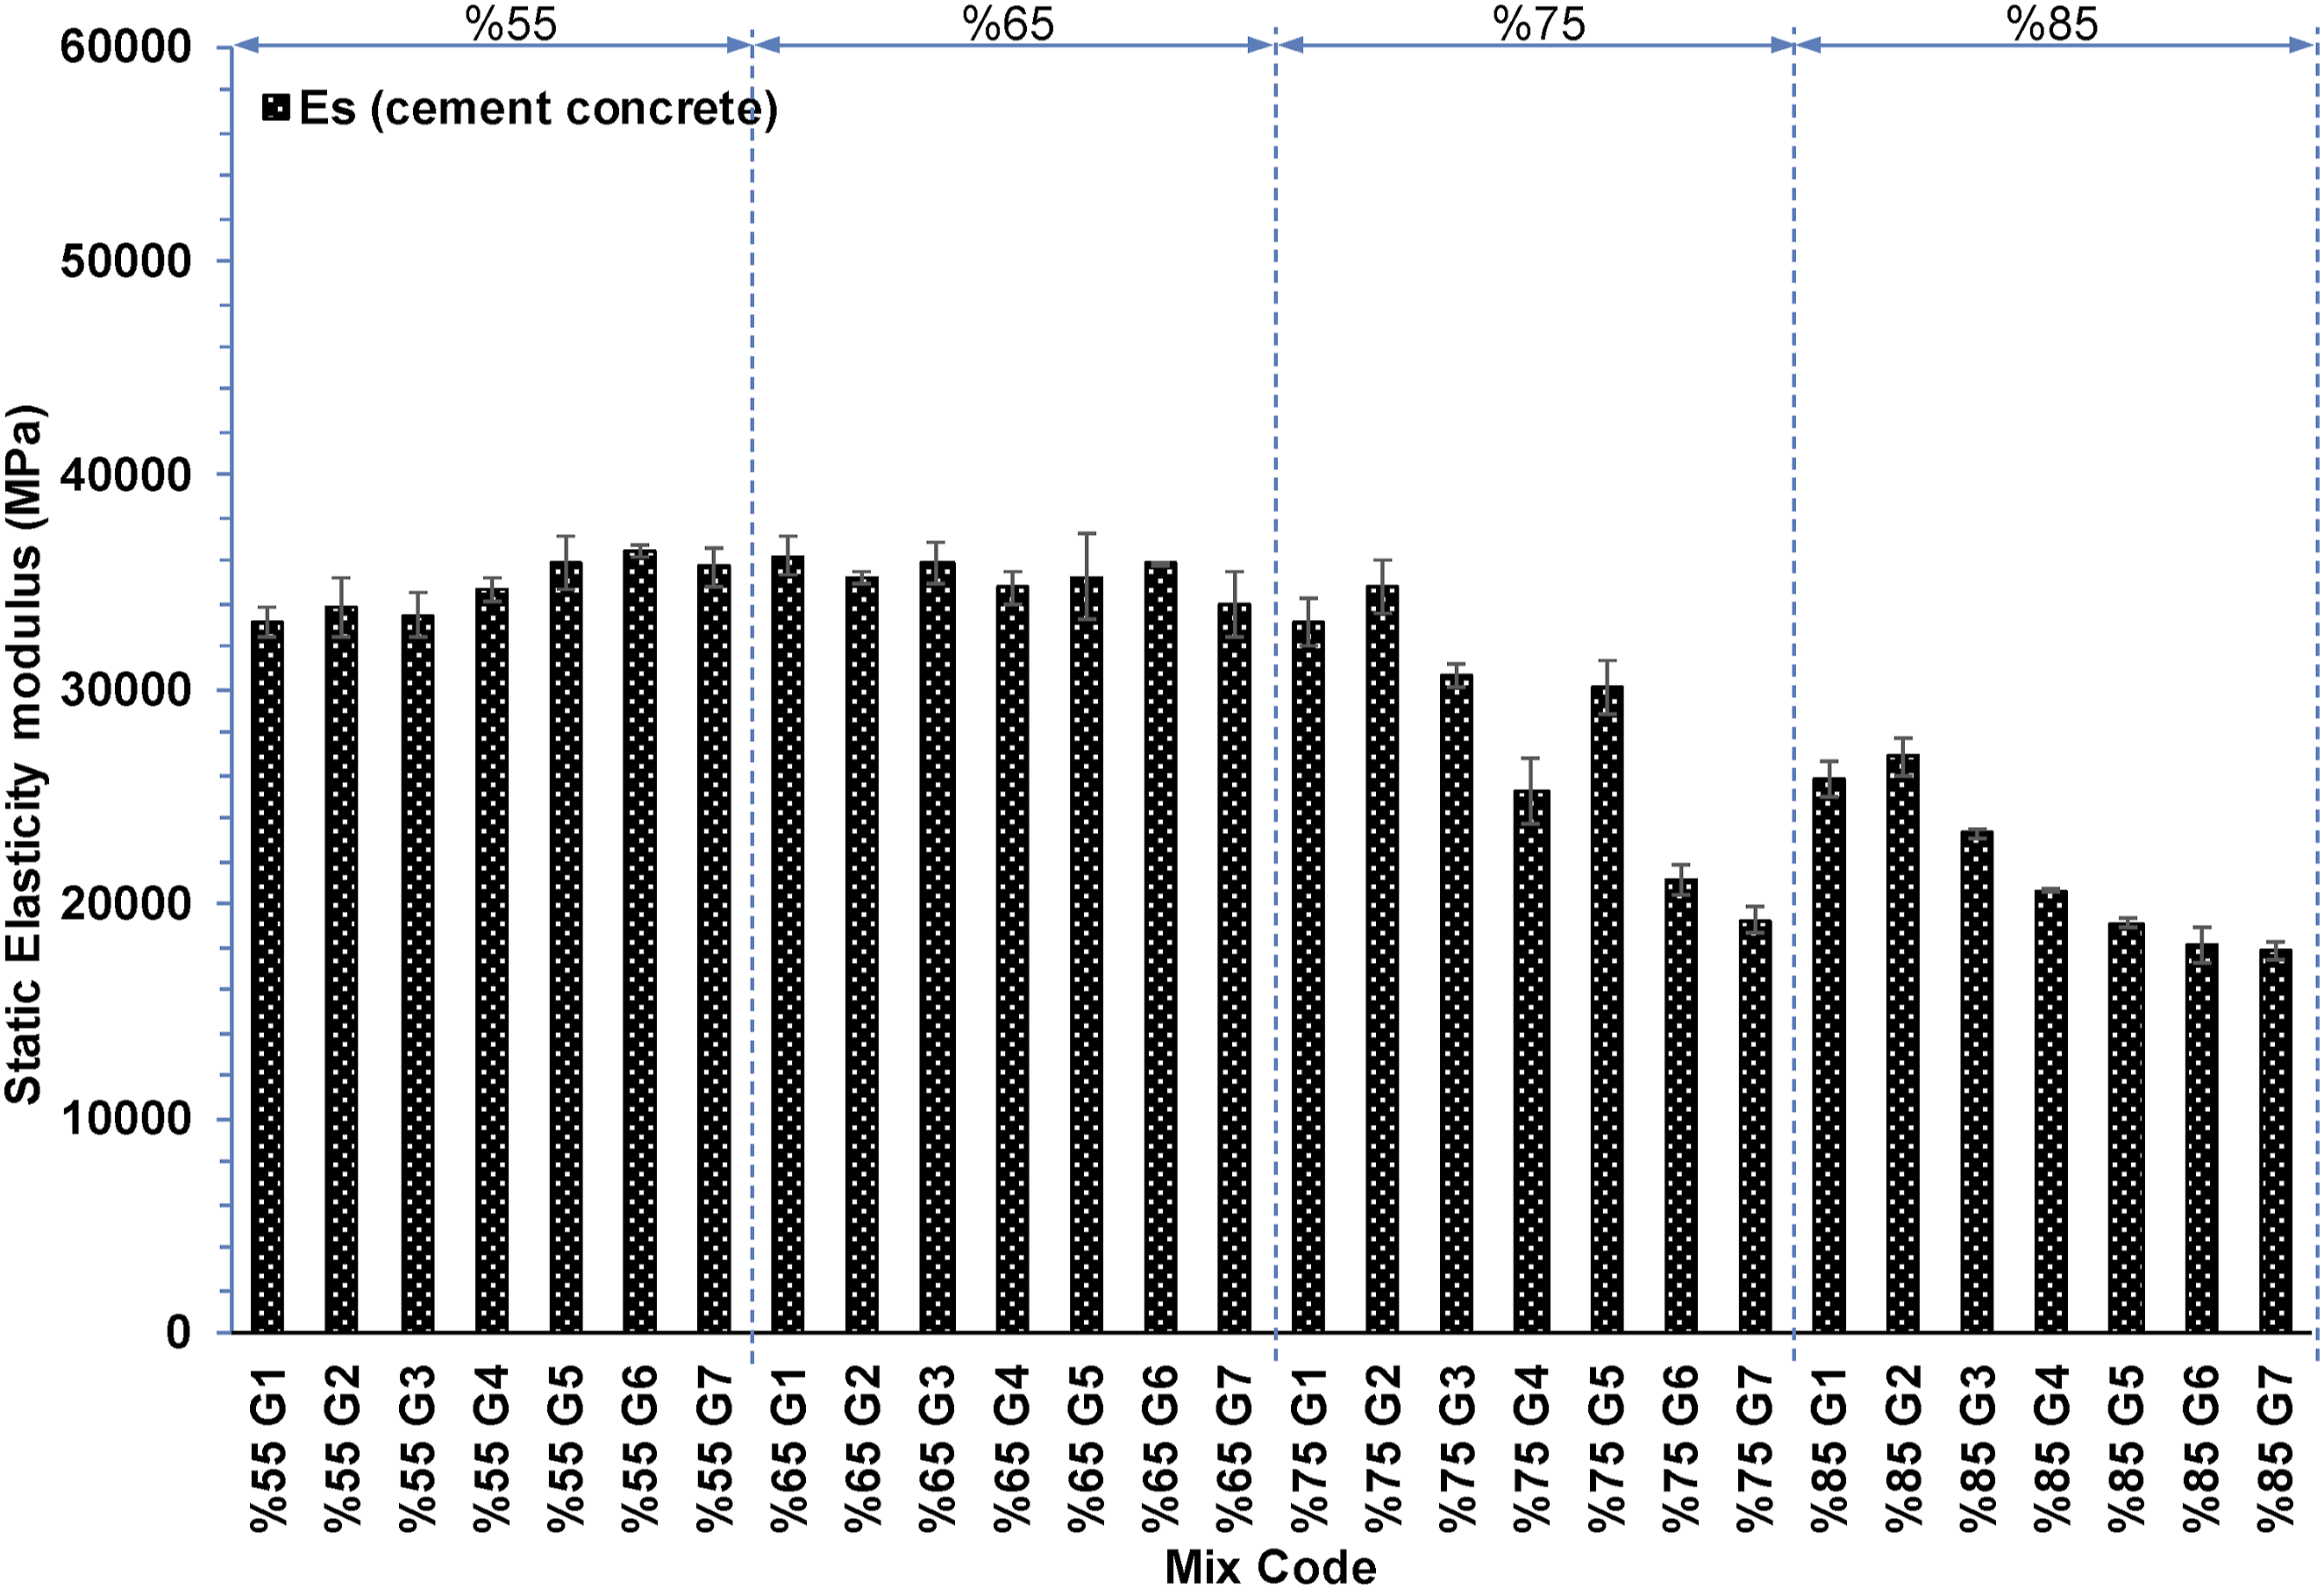
The static modulus of elasticity
The static elasticity modulus was determined with the help of equation (2). When Figure 22 is examined, the static modulus of elasticity increases from G1 to G7. In all mixtures, the increase in the ratio of polymer binder does not affect the static elasticity modulus much. Granulometry change appears to be more effective. Figure 23 shows the static modulus of elasticity of cementitious concrete according to various mixing ratios. The static elasticity modulus values are at the highest levels in the samples with 55%G and 65%G aggregate mixture ratios. A decrease occurs after 75%G aggregate mixing ratios. The static modulus of elasticity for polymer concrete. The static modulus of elasticity for cement concrete.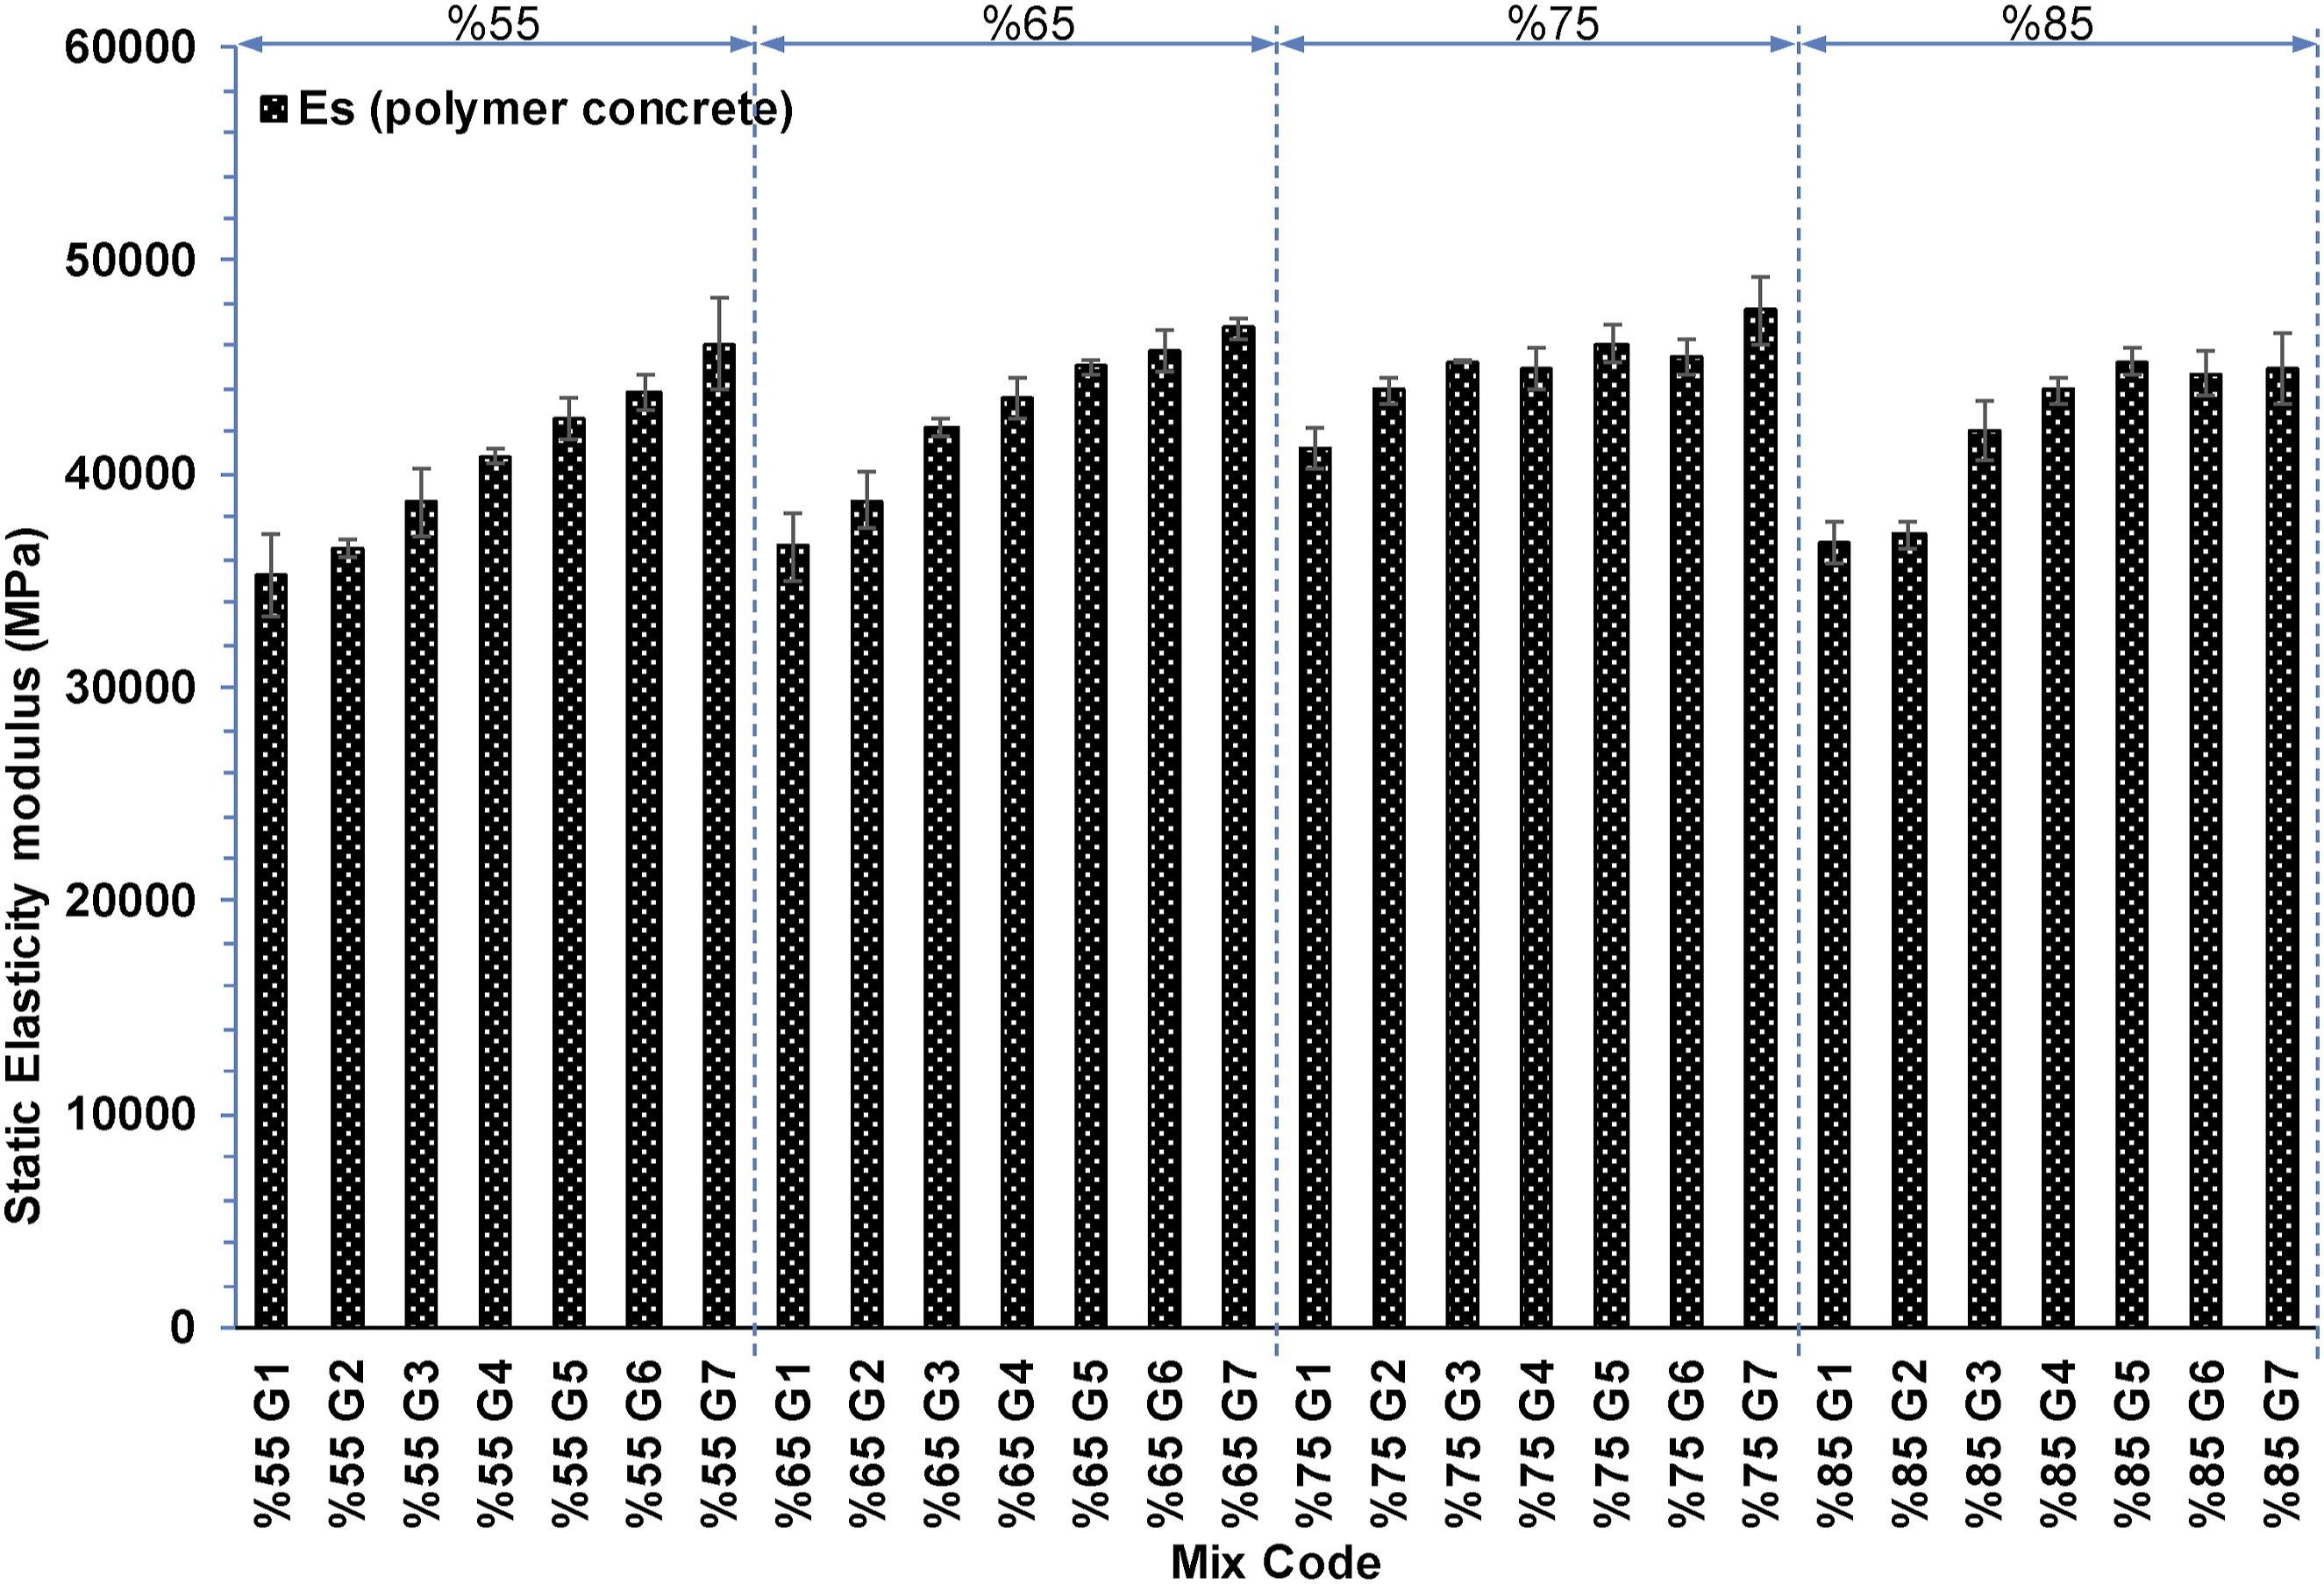
Analysis of efficiency for cement and polymer concrete
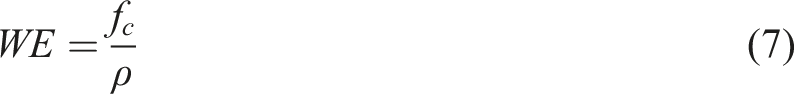
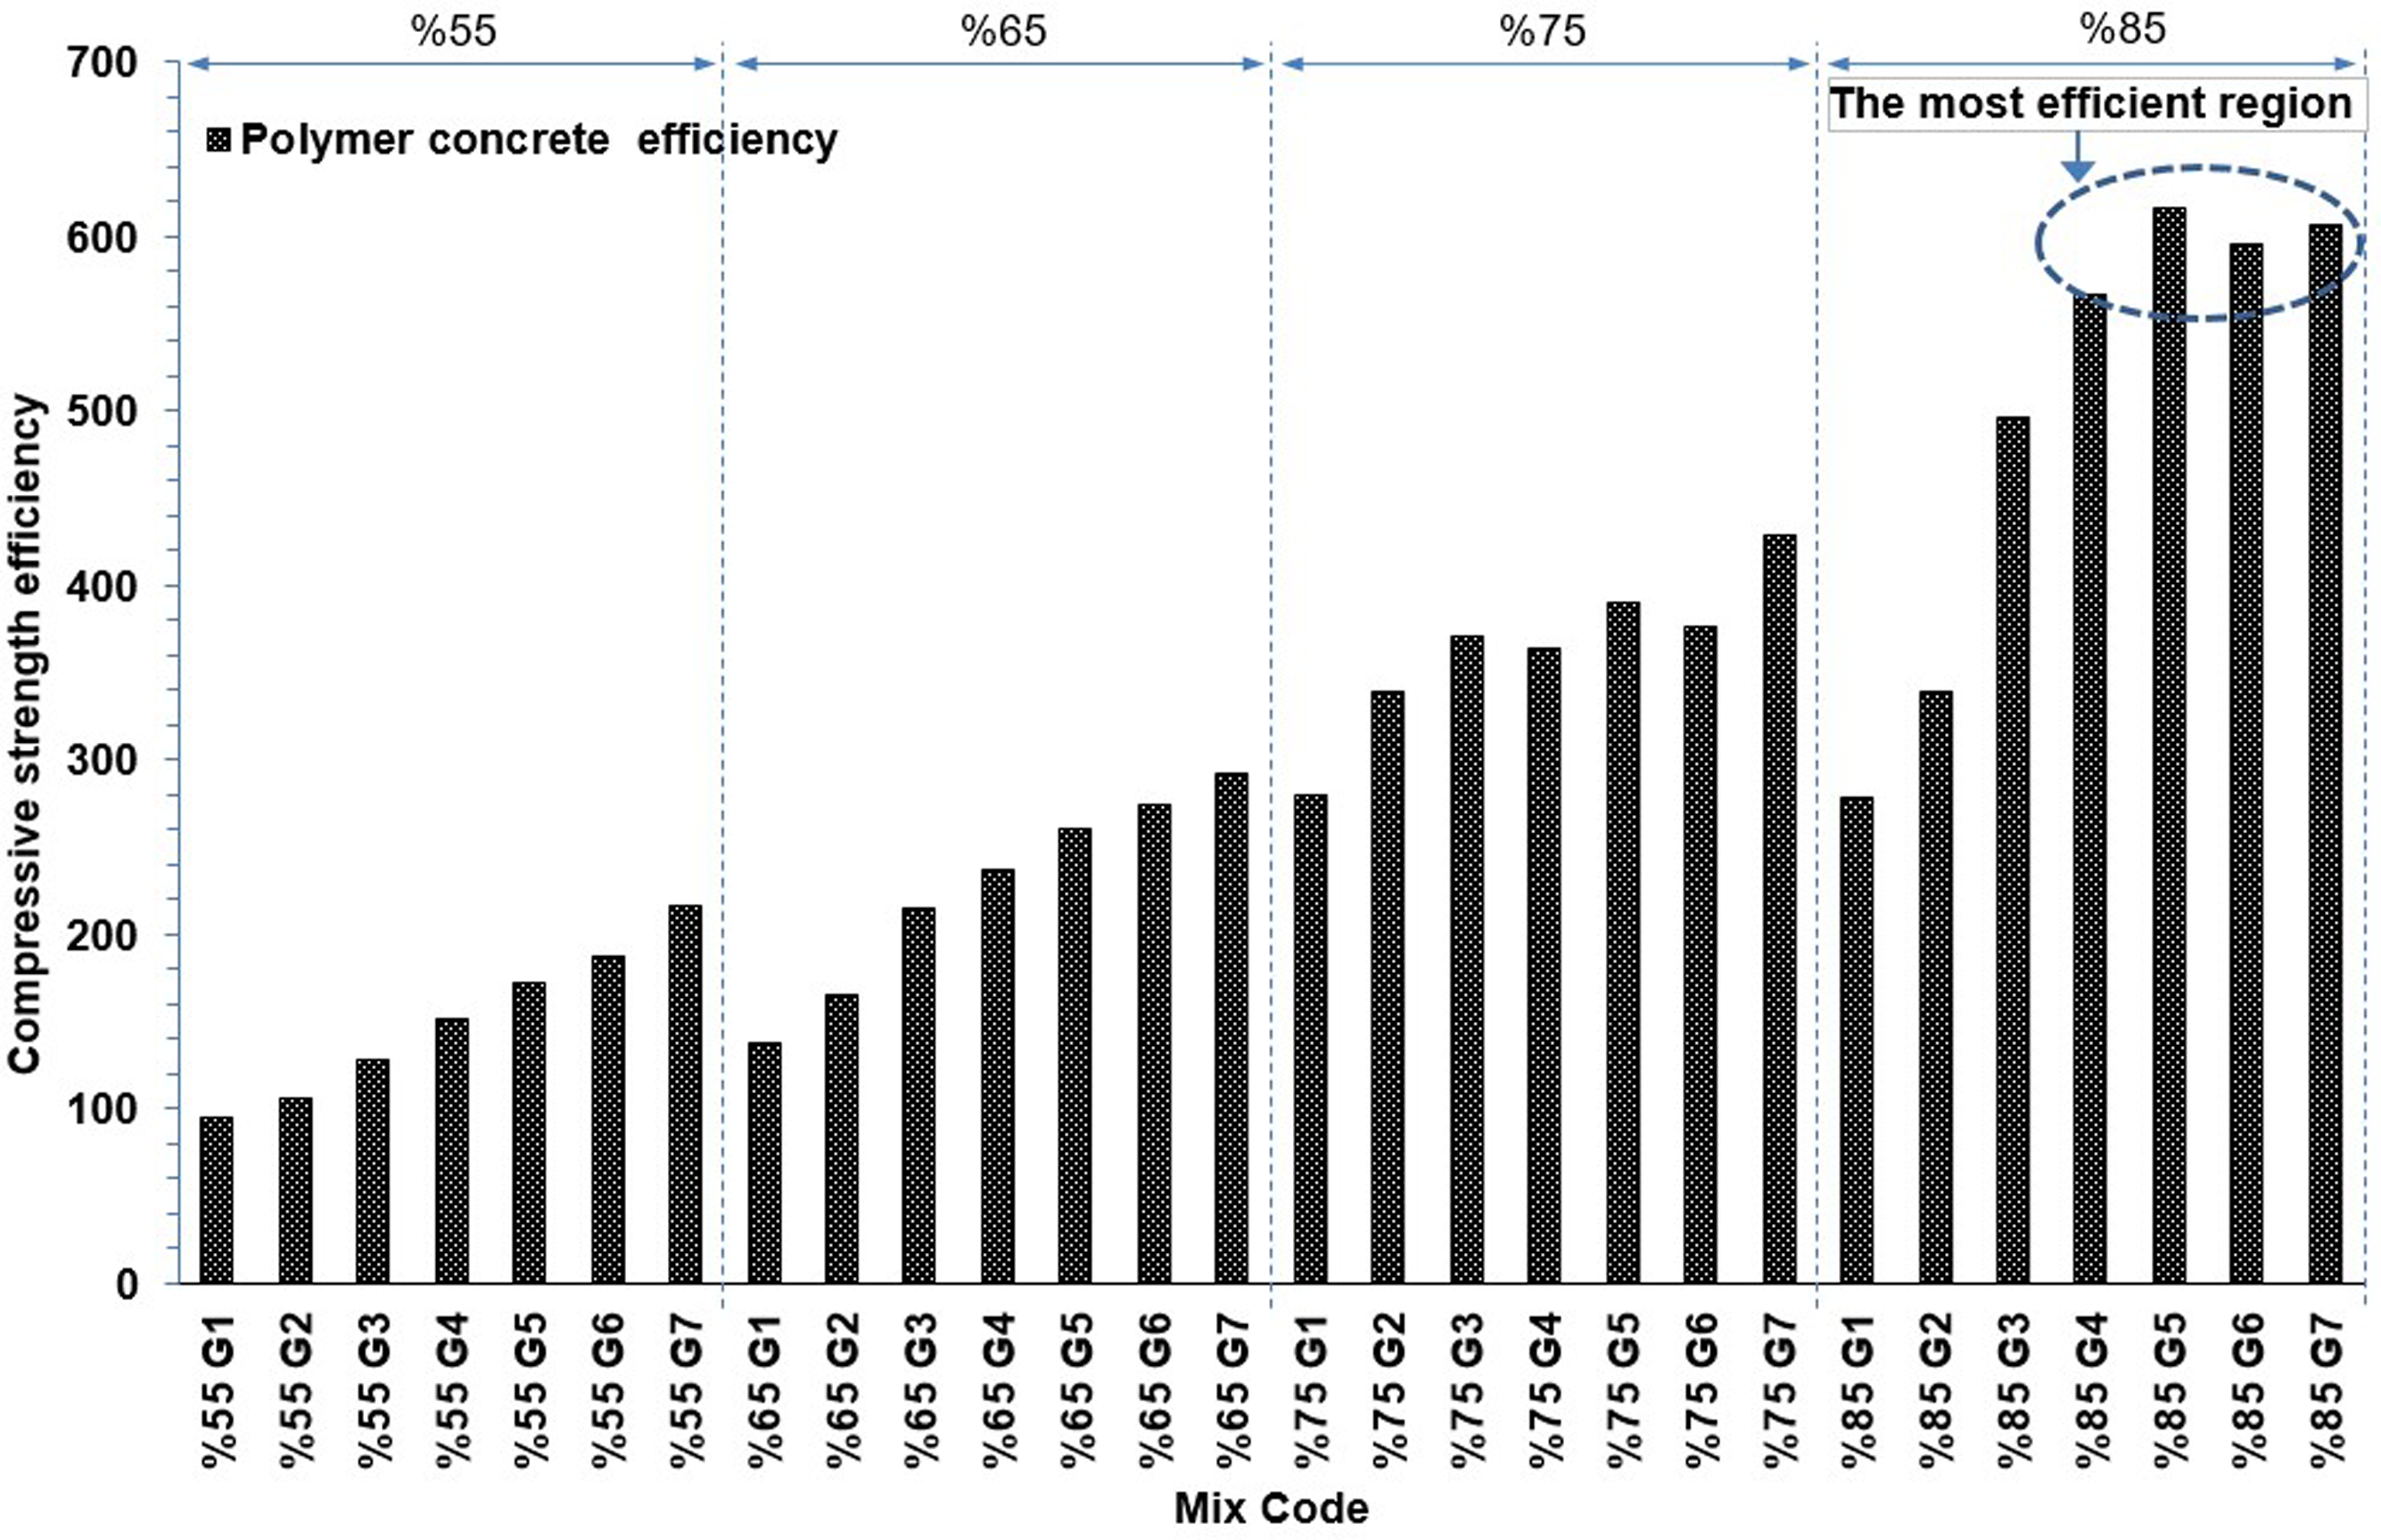
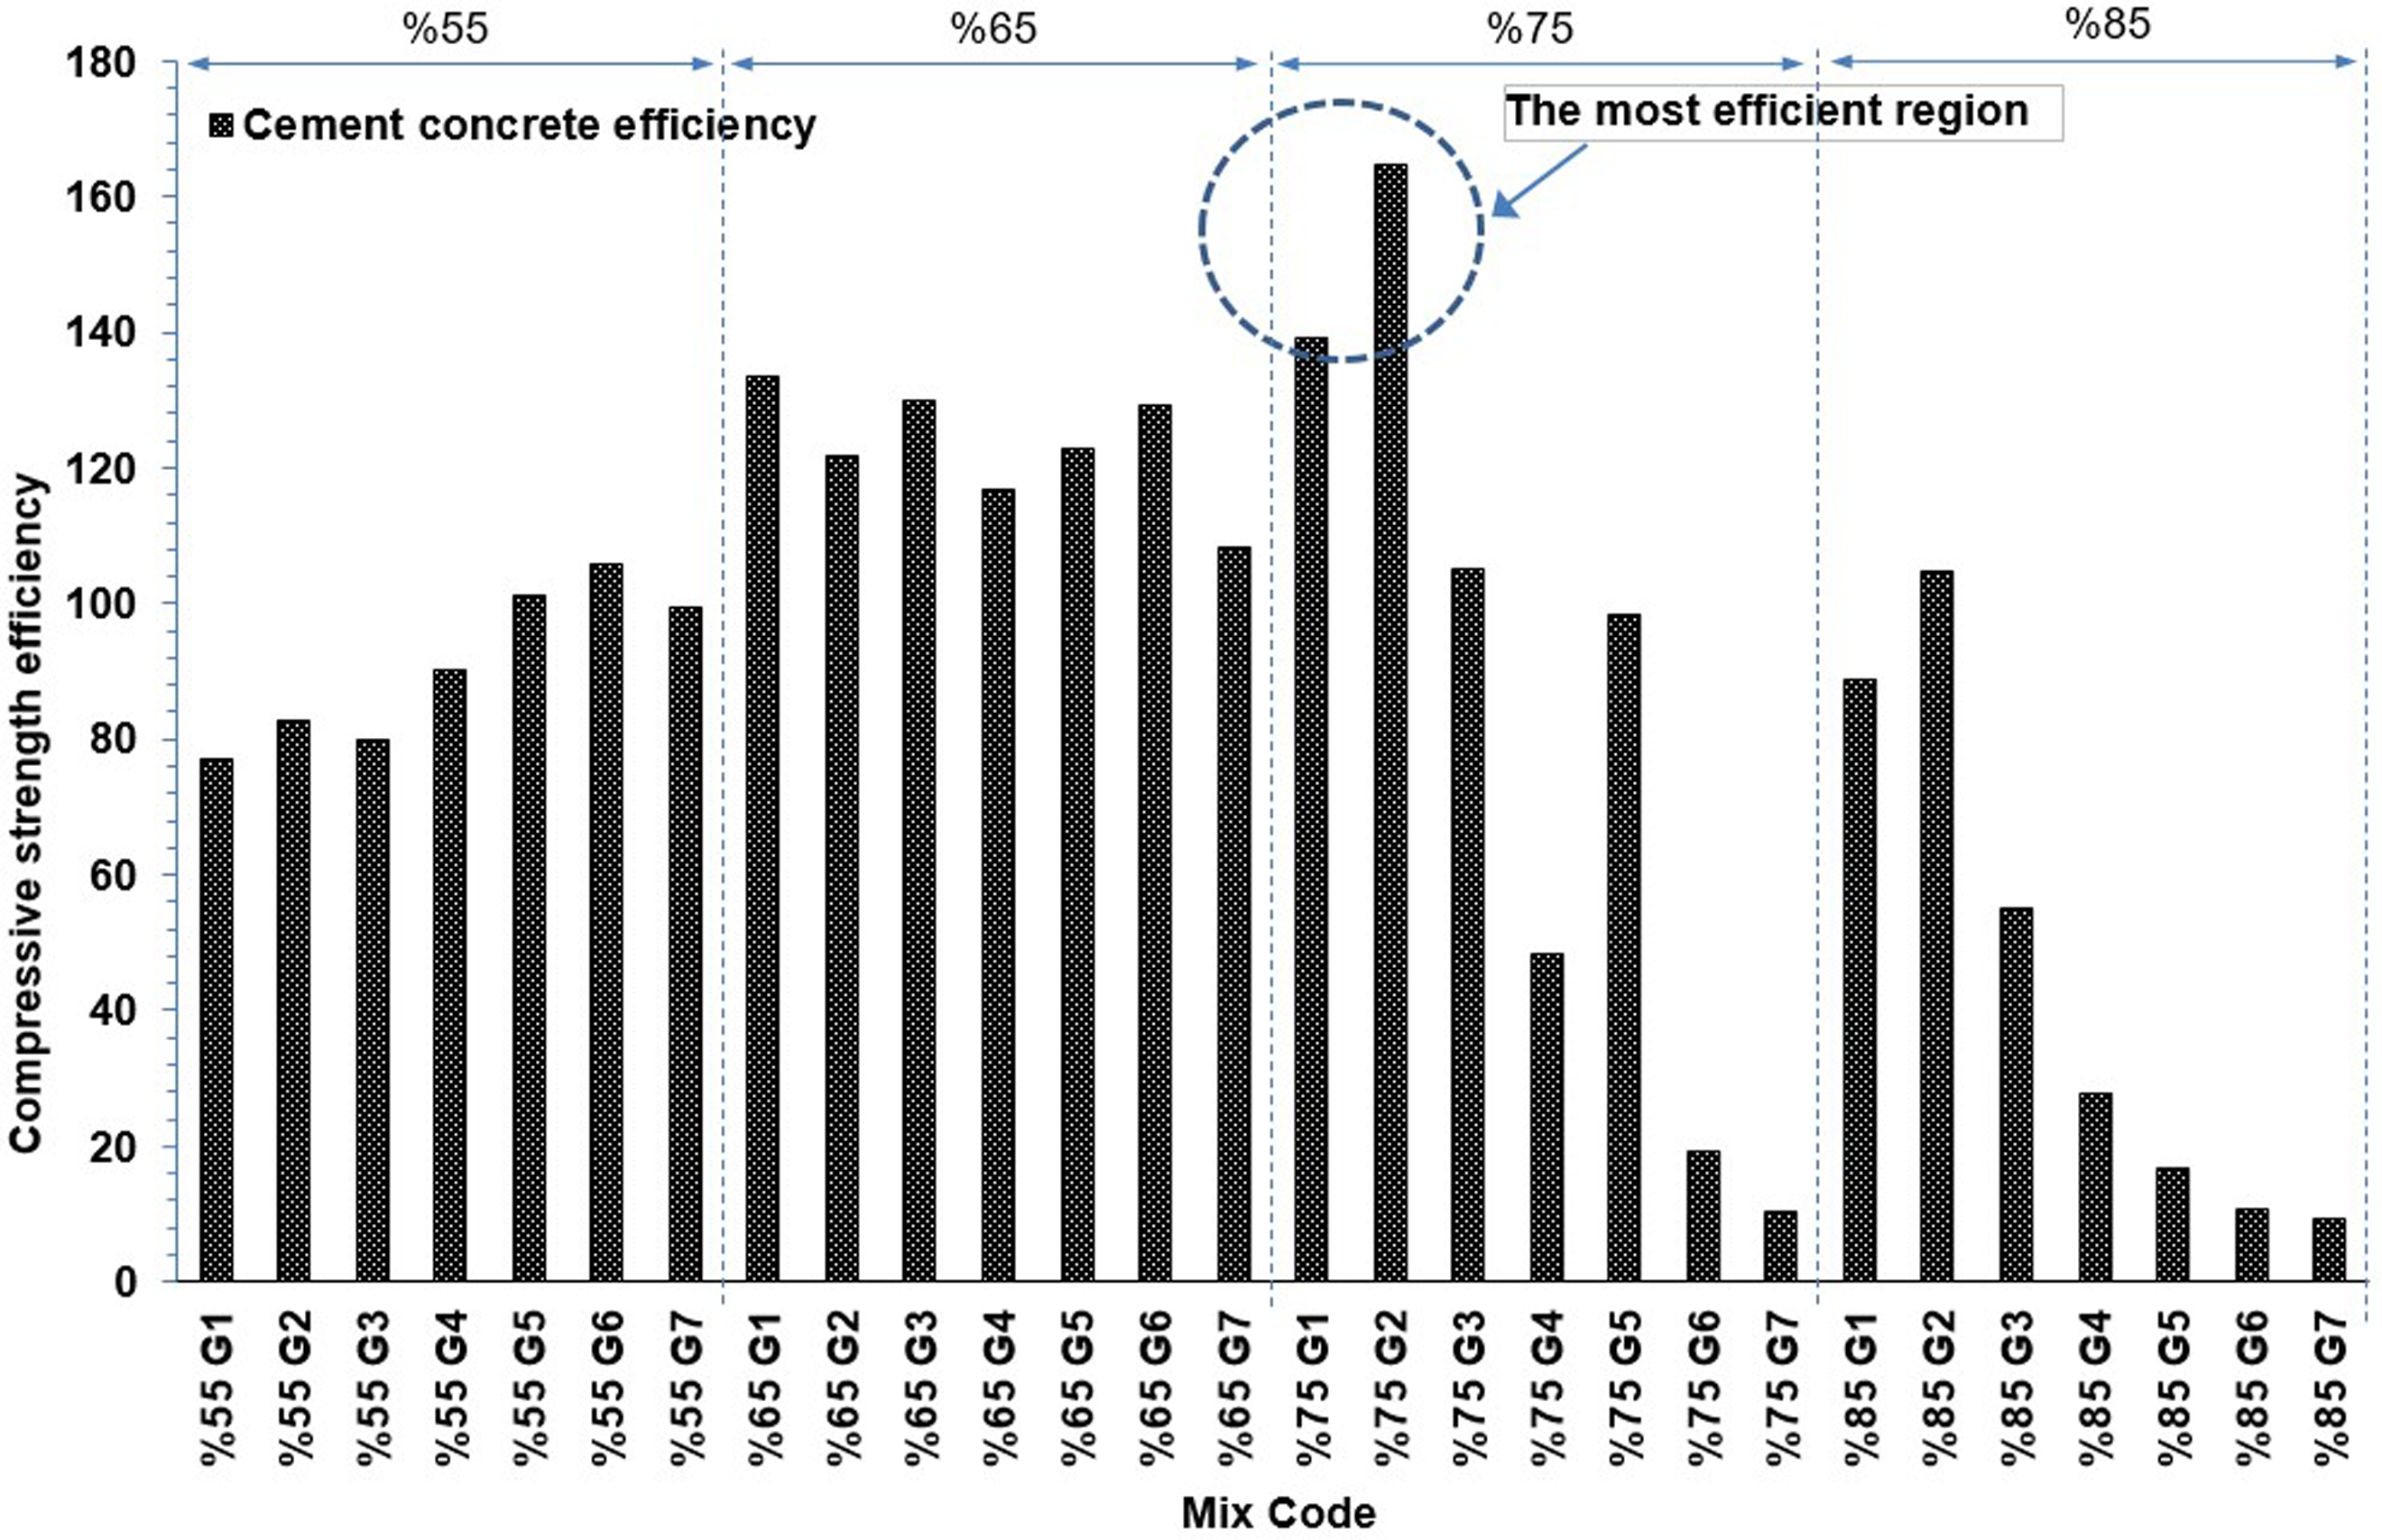
In this study, the effectiveness of concrete strength was investigated according to various parameters, and two new formulas named Binder quantity efficiency (BQE) equation (6) and Weight efficiency (WE) equation (7) were derived and proposed by the author. The effect of the binder ratio on the concrete strength was examined. The concrete type that has a more efficient strength ratio by using less binder can be determined. It is seen in Figure 24 that the compressive strength-binder amount efficiency of polymer concrete is seen. The most efficient concrete is 85% G4-G5-G6-G7 mixtures. Although 85% aggregate and 15% polymer are used, the compressive strength is very good (Figure 15). It is seen that the quantity efficiency of polymer concrete is four times higher than cement-binder concrete (Figures 24 and 25). In Figure 25, the productivity graph obtained for cementitious concrete is shown. The most efficient mixture is in the 75% G2 sample. Binder quantity efficiency values for compressive strenght of polymer concrete. Binder quantity efficiency values for compressive strenght of cement concrete.
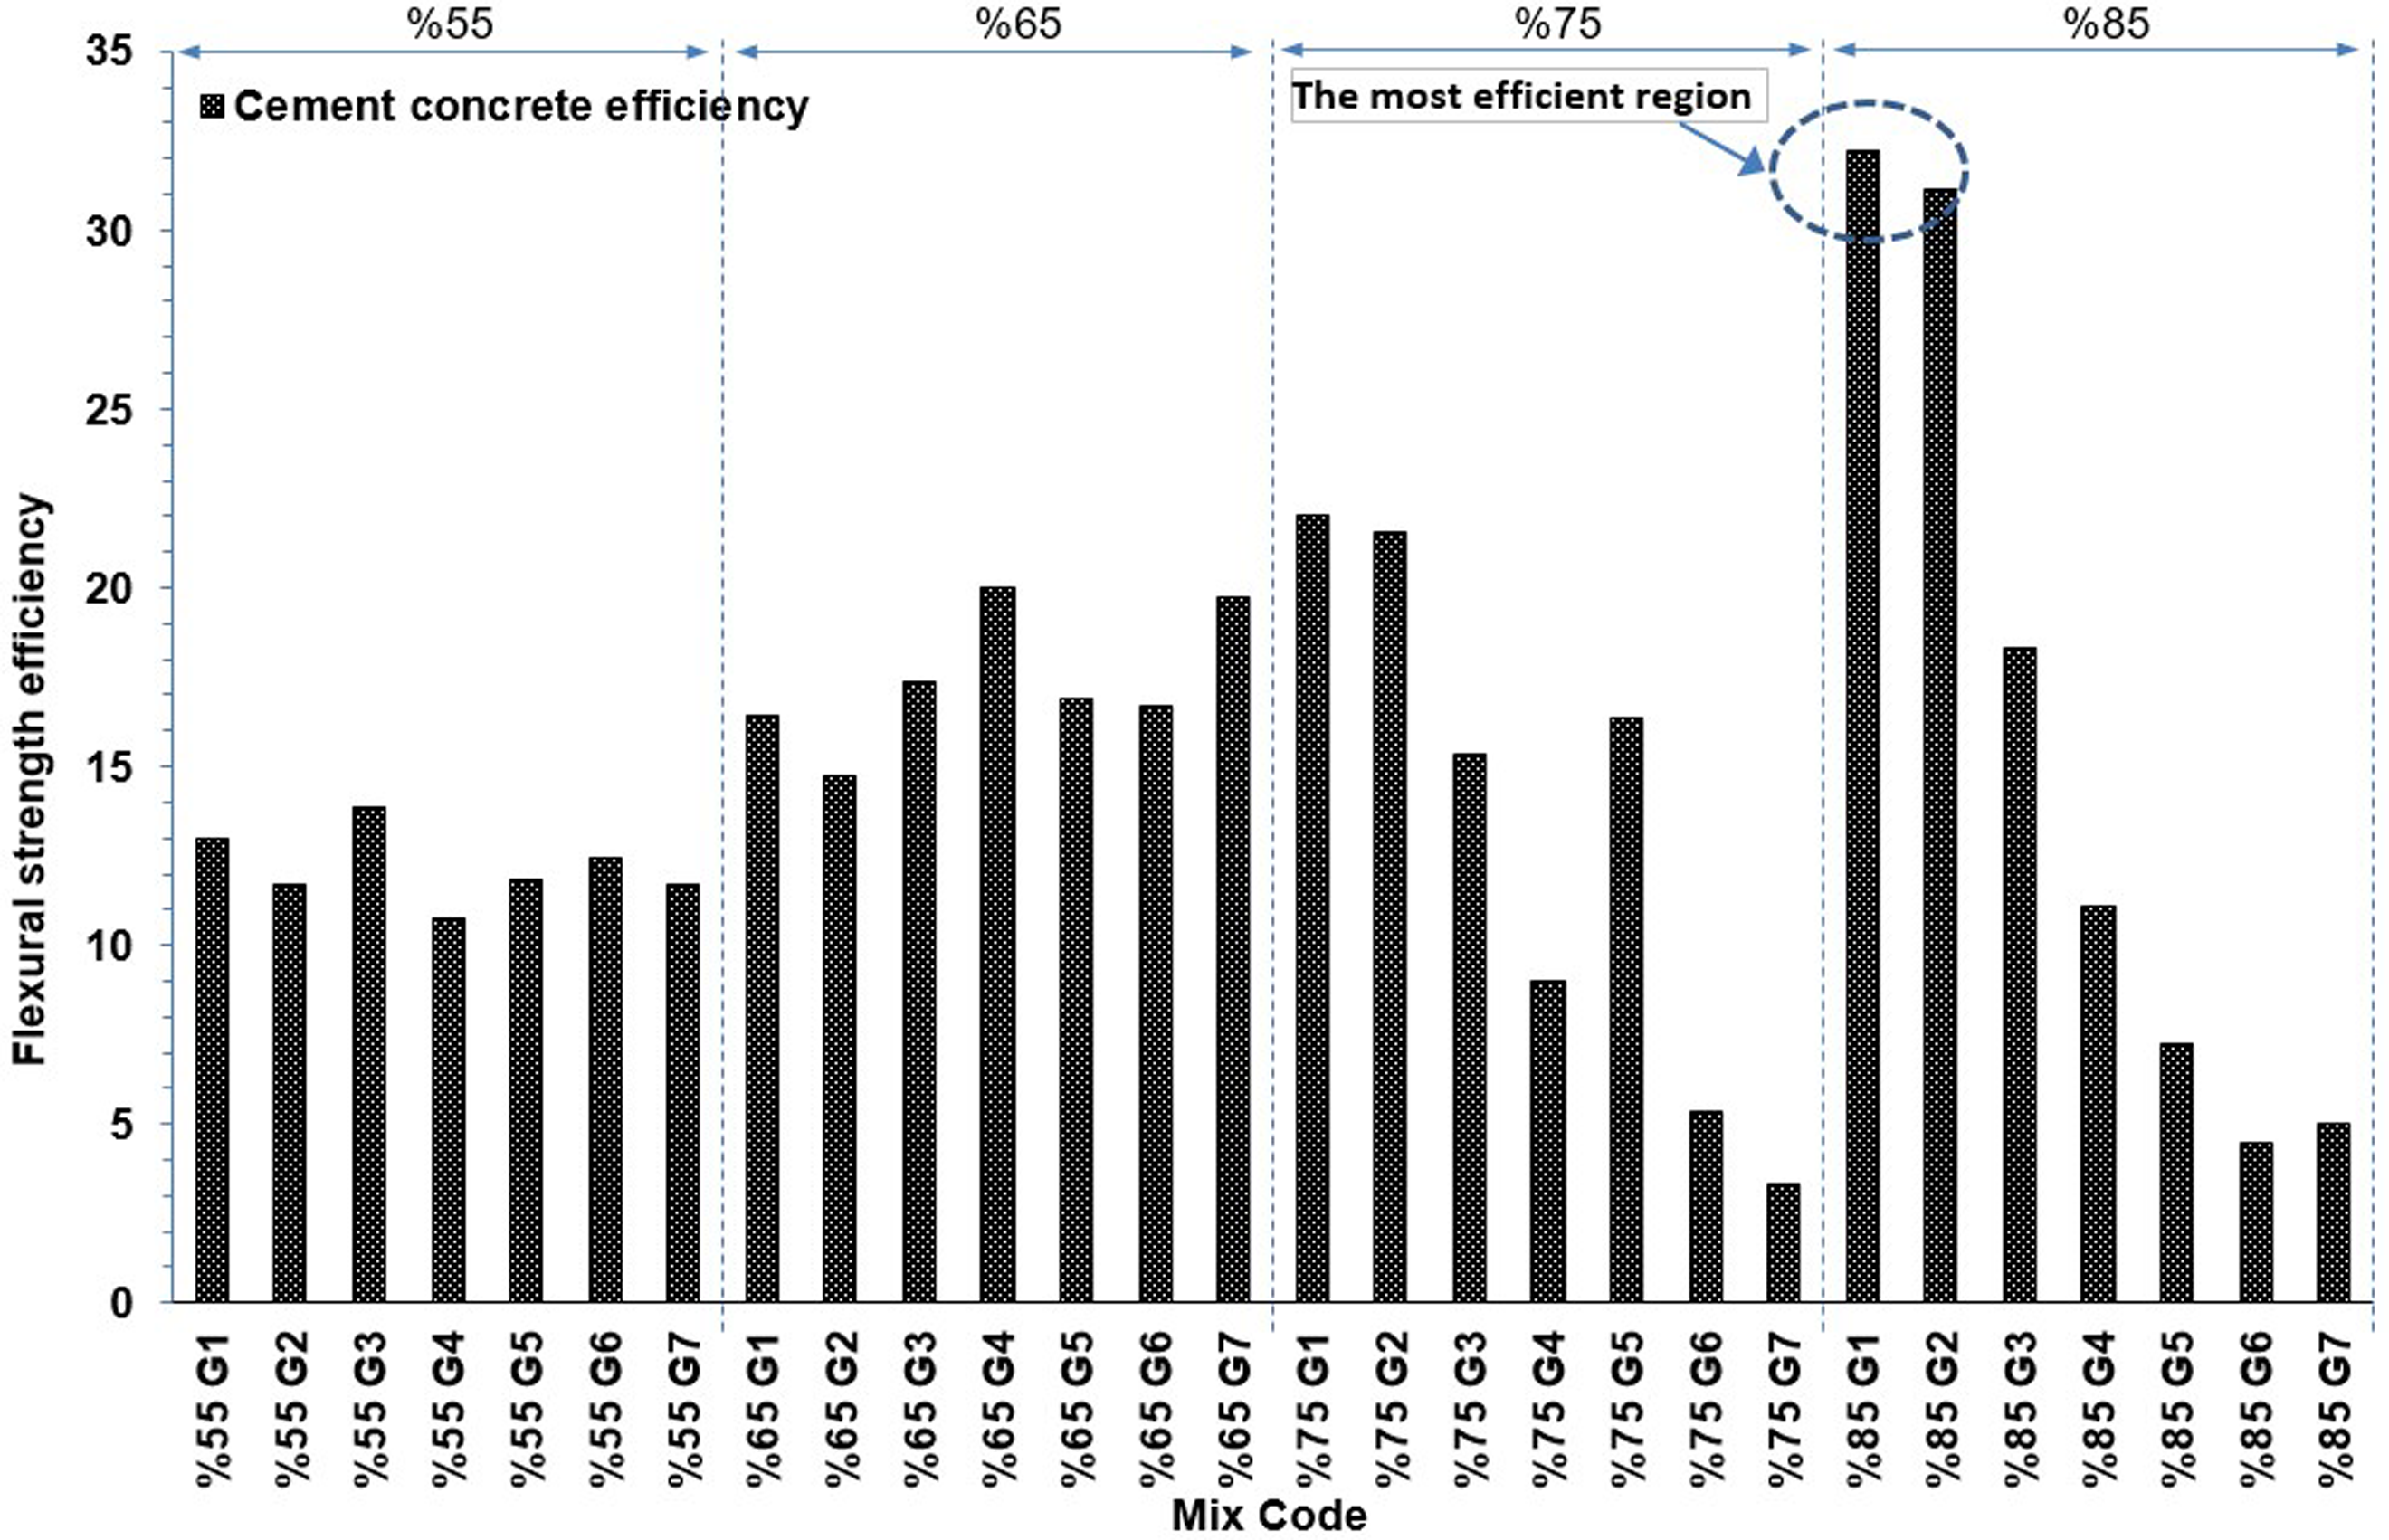
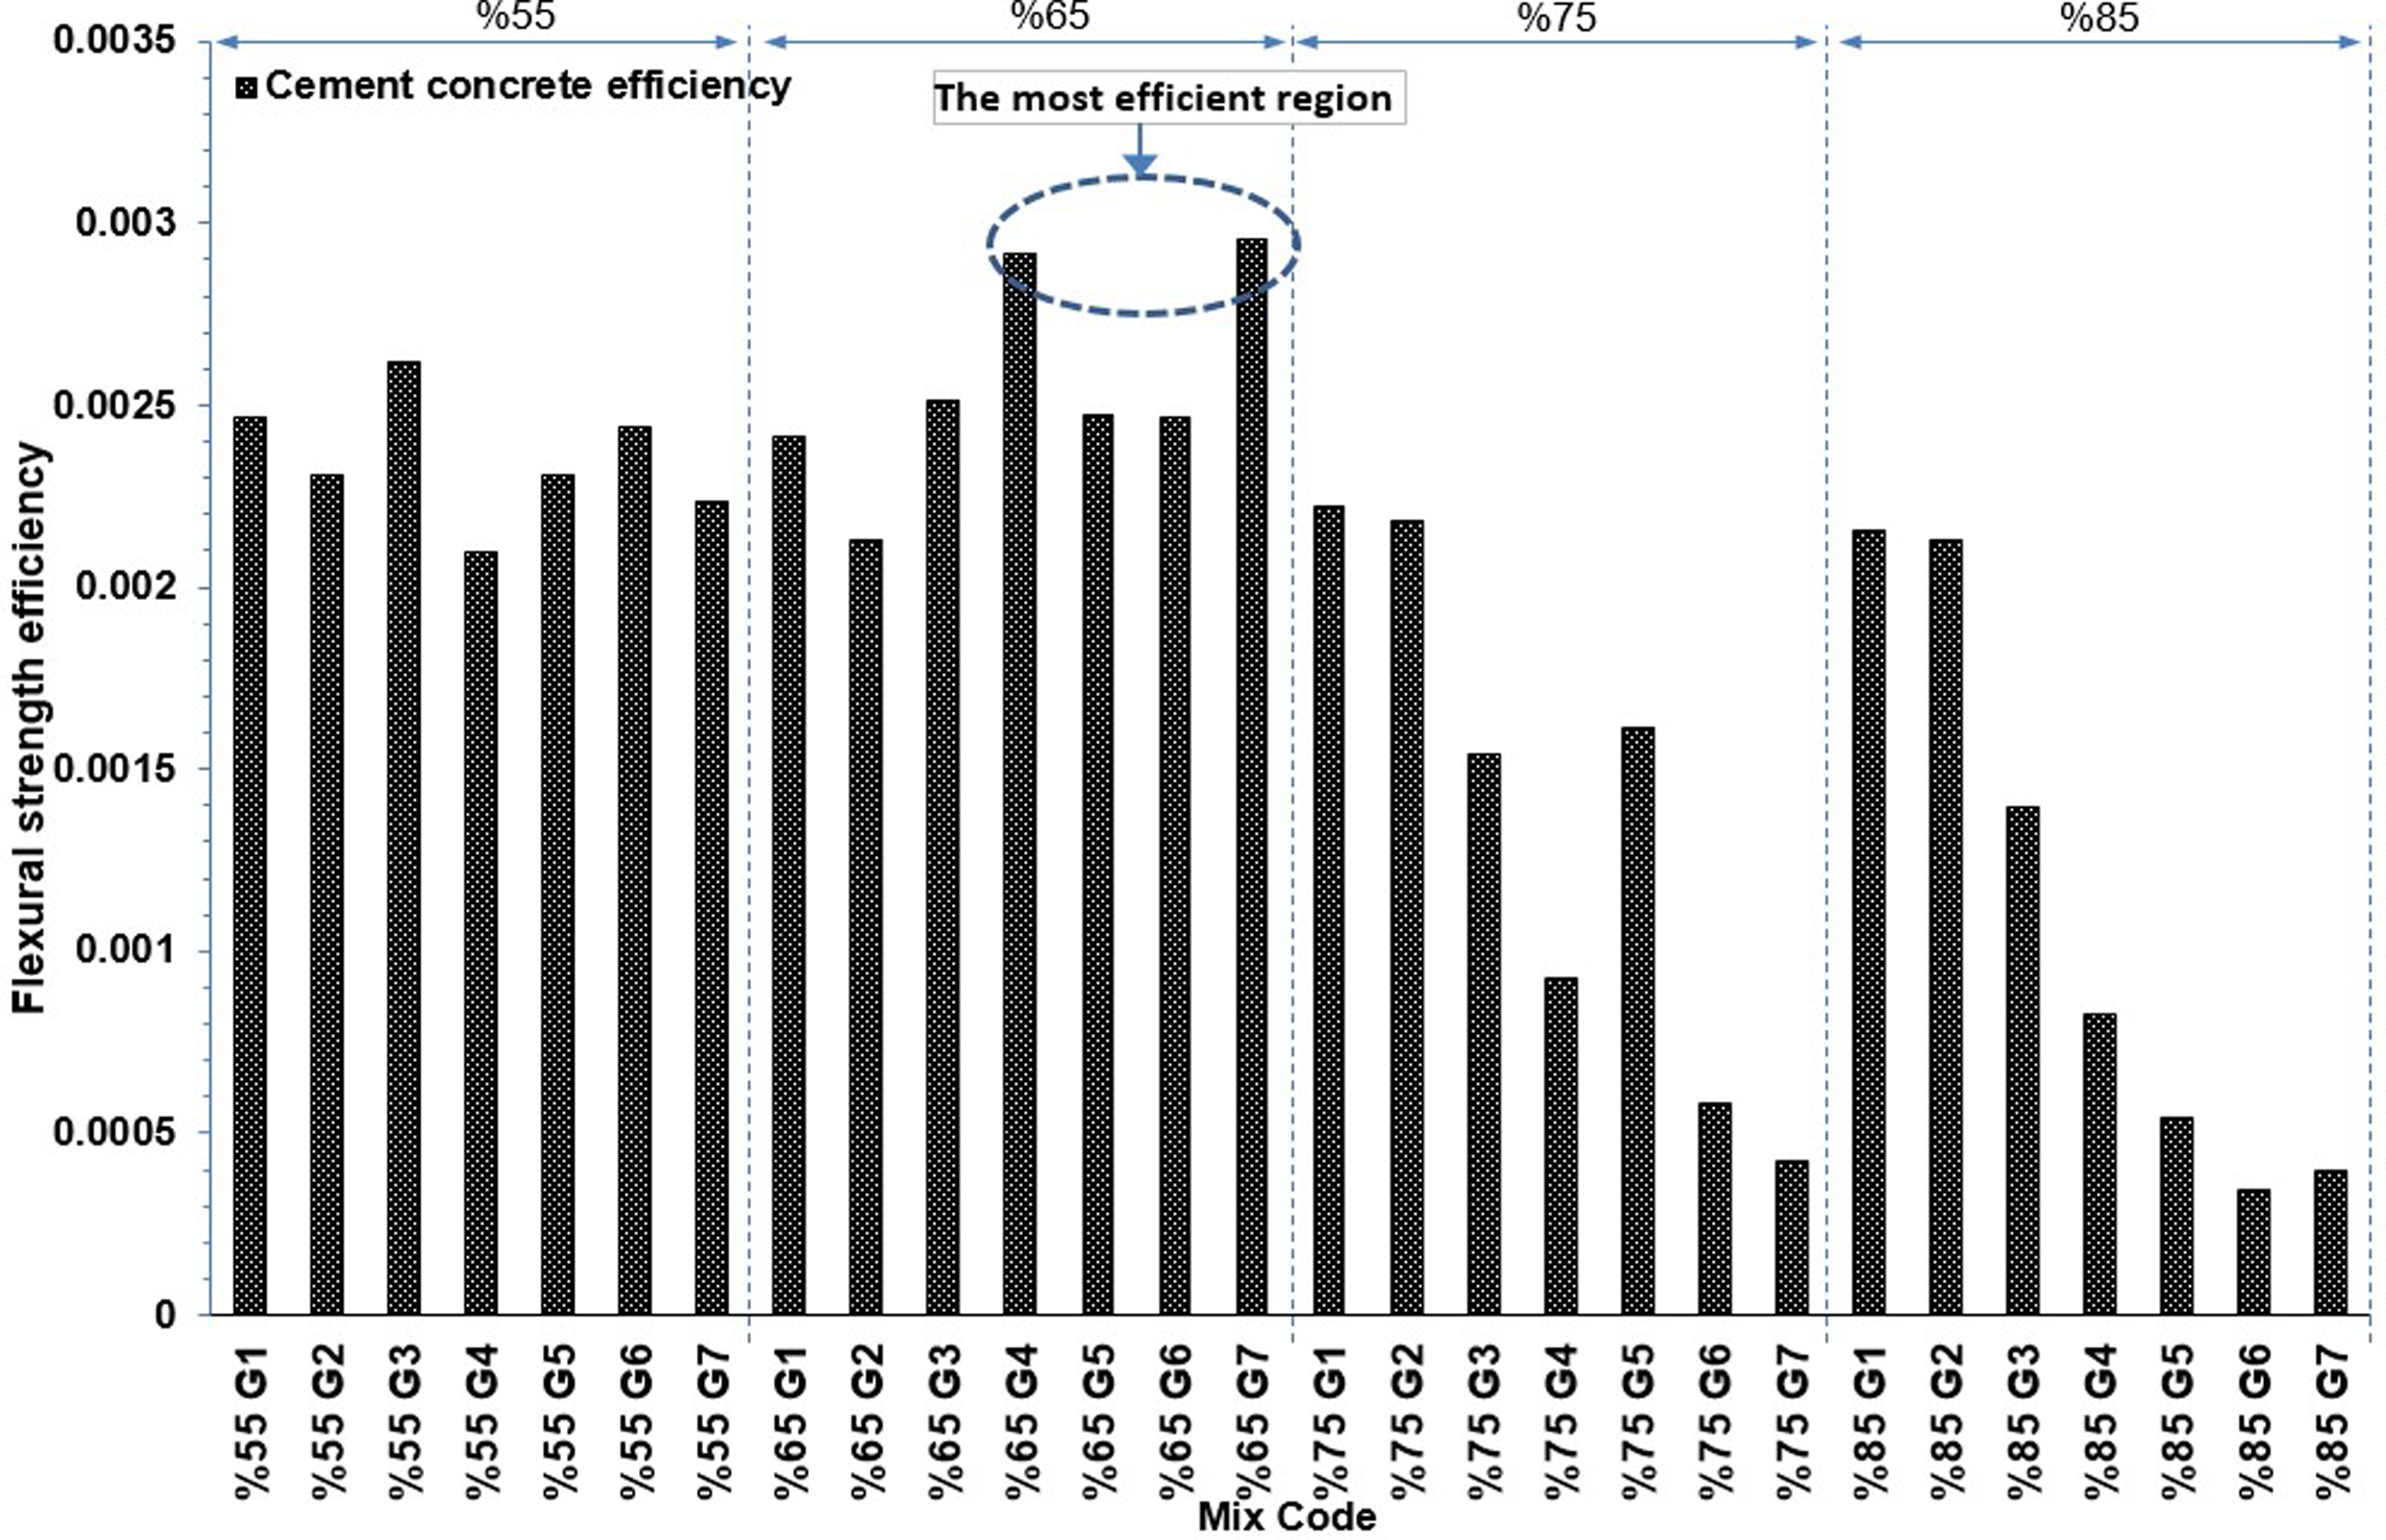
The flexural strength-to-concrete binder ratio efficiency is examined in Figures 26 and 27. The bending strength-polymer binder amount efficiency of polymer concrete is shown in Figure 24. The most efficient concrete is 85% G3-G4-G5-G6-G7 mixtures. Although 85% aggregate and 15% polymer are used, the bending strength is very good (Figure 16). Figure 26 shows the productivity graph obtained for cementitious concrete. The most efficient mixture is in the 85% G1 sample. When Figures 26 and 27 are compared, it is seen that polymer concrete is more efficient than concrete containing cement binder, even when the amount of binder is very low. It is seen that the quantity efficiency of polymer concrete is six times higher than cement concrete (Figures 26 and 27). Binder quantity efficiency values for flexural strenght efficient values of polymer concrete. Binder quantity efficiency values for flexural strenght efficient values of cement concrete.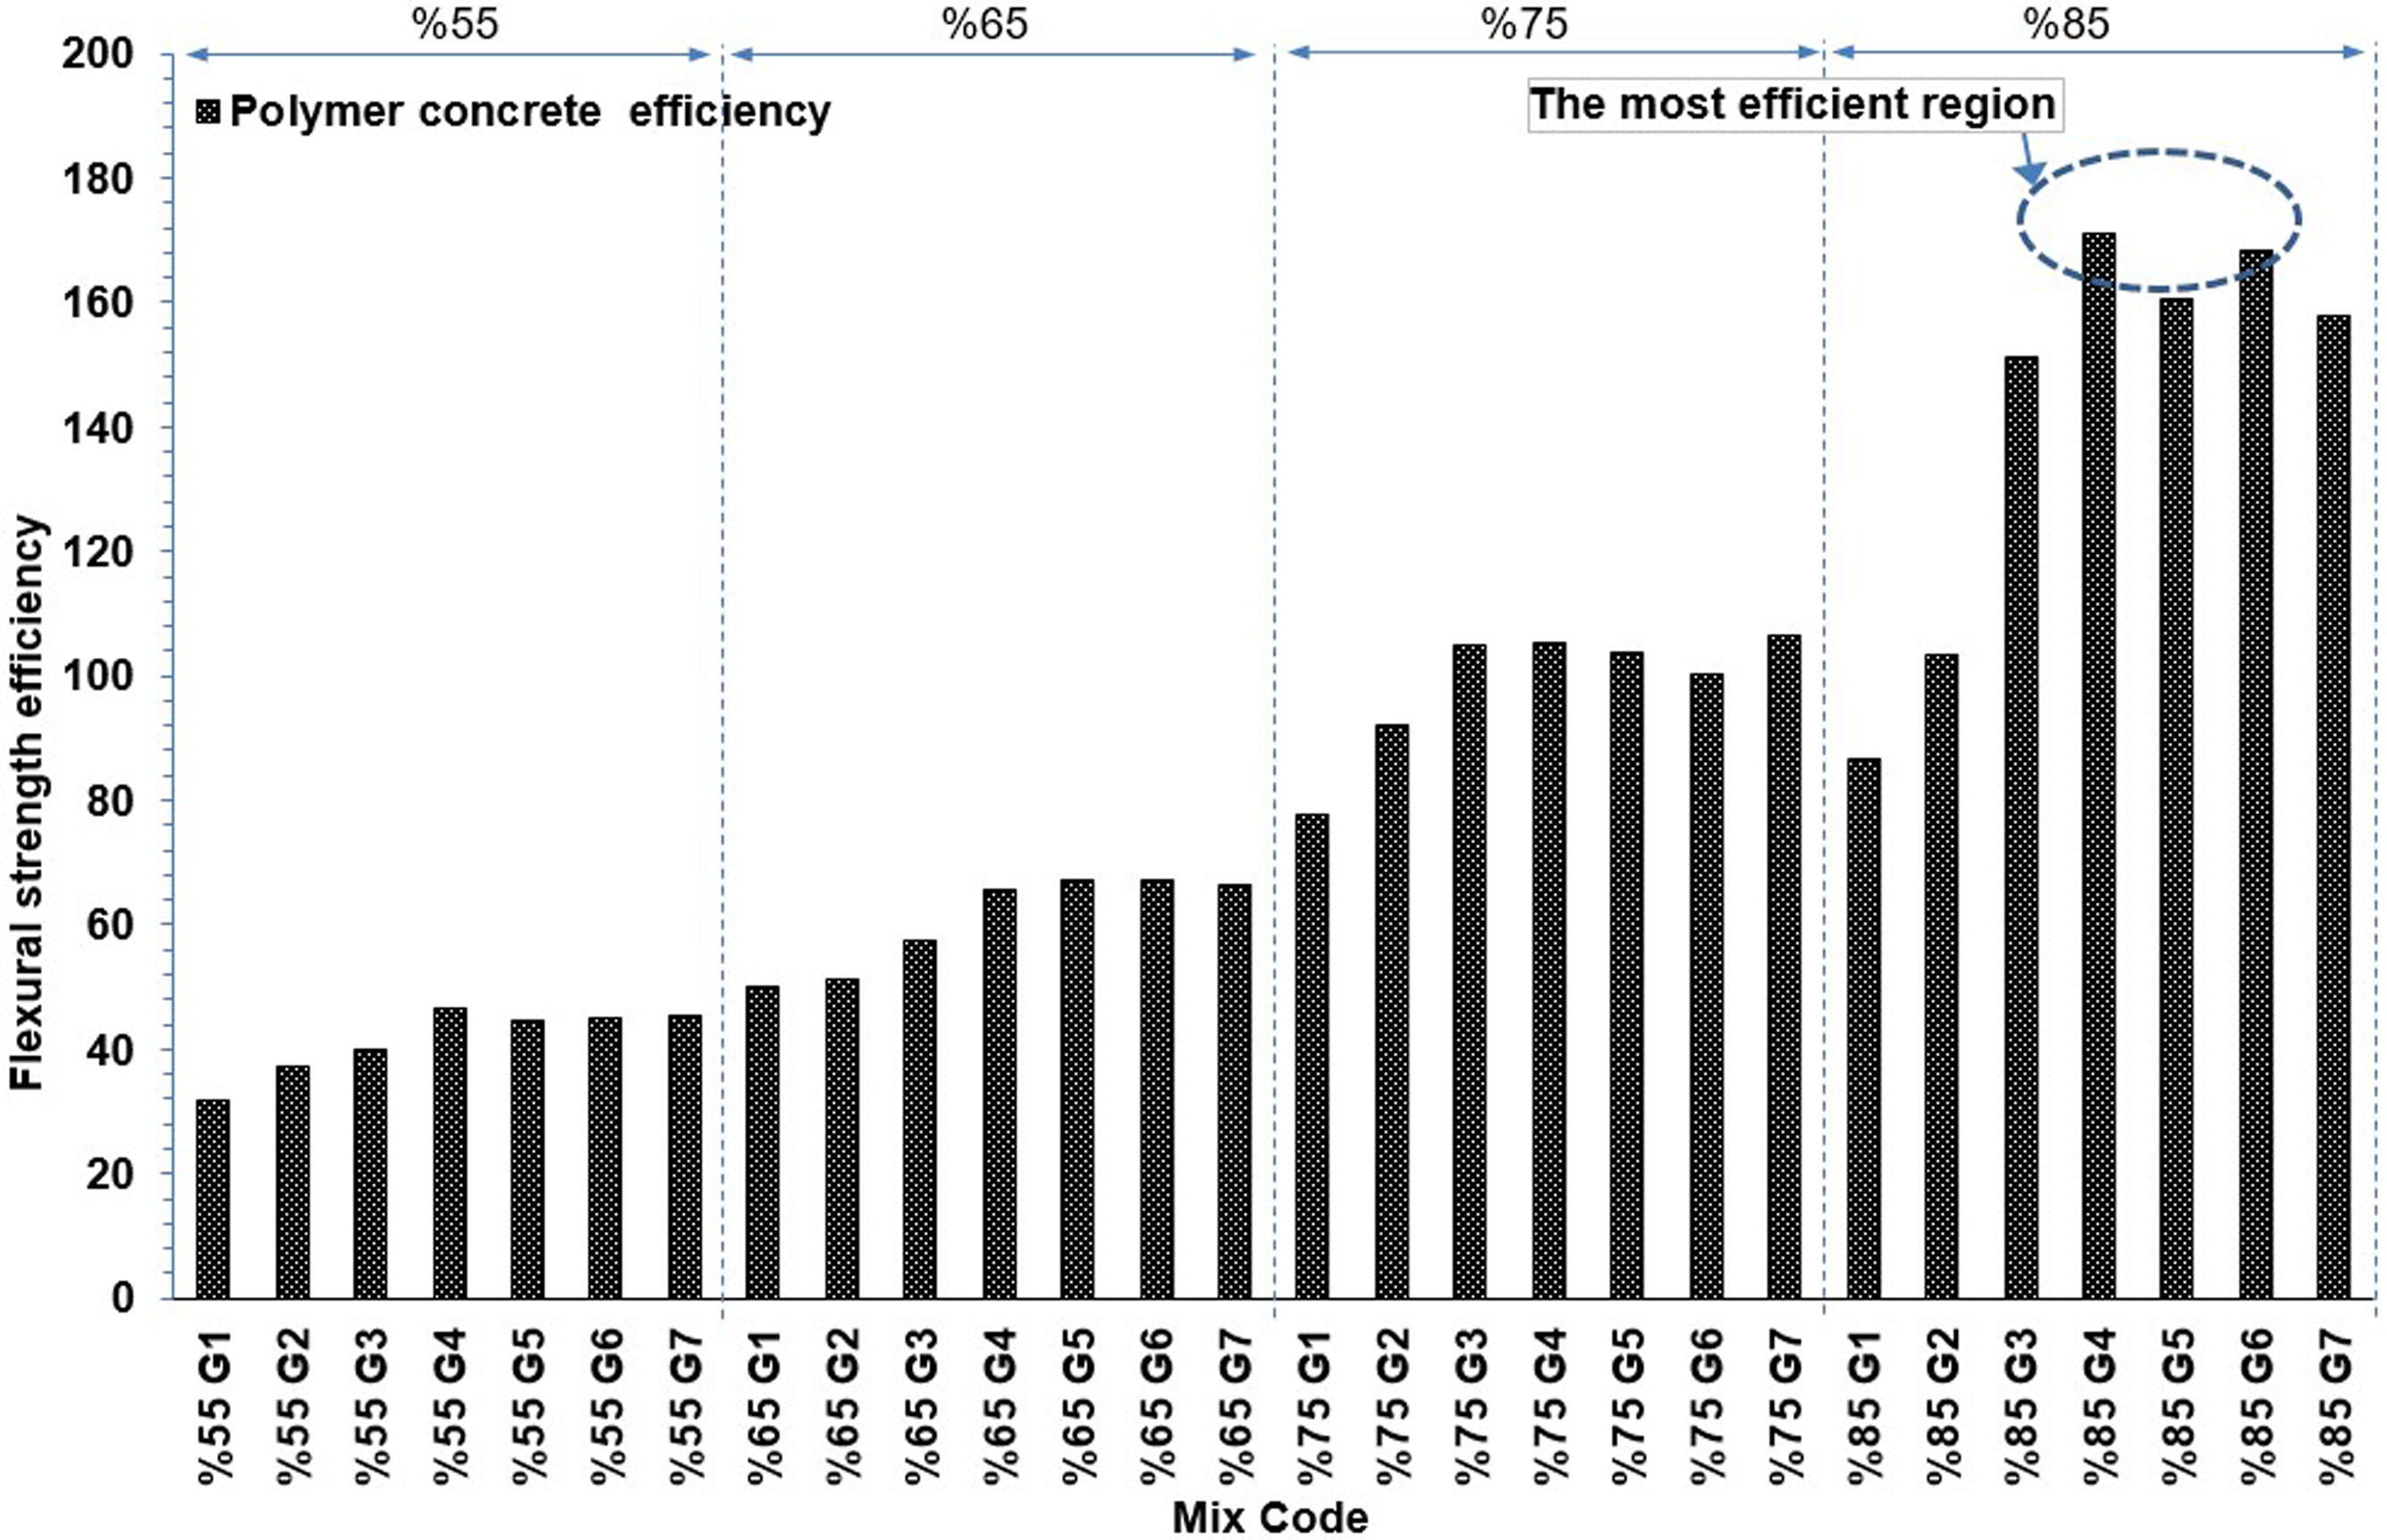
Another efficiency situation is determined by examining the relationship between the lightness of concrete and its strength. As it is known, in many studies, it is aimed to produce lighter concrete than conventional concrete. However, as conventional concrete becomes lighter, its strength decreases. Increasing the strength of lightweight concrete increases, the efficiency between weight and strength. The change of this situation for various mix codes according to concrete granulometry was investigated. Figure 12 shows the compressive strength-to-weight efficiency of concrete containing polymer binders. The most efficient mix code occurred for the 55%G7 sample, it can be mentioned as the most efficient mix code among the 55%G7, 65%G7, and 75%G7 samples. Figure 28 shows the weight efficiency of concrete containing cement. The most efficient mixture occurred in the case of 55%G6 mixture. When polymer concrete and cementitious concrete are compared, it is seen that the compressive strength-weight efficiency (0.055) of polymer concrete is higher than that of cementitious concrete (0.021). Weight efficiency values for compressive strenght of cement concrete.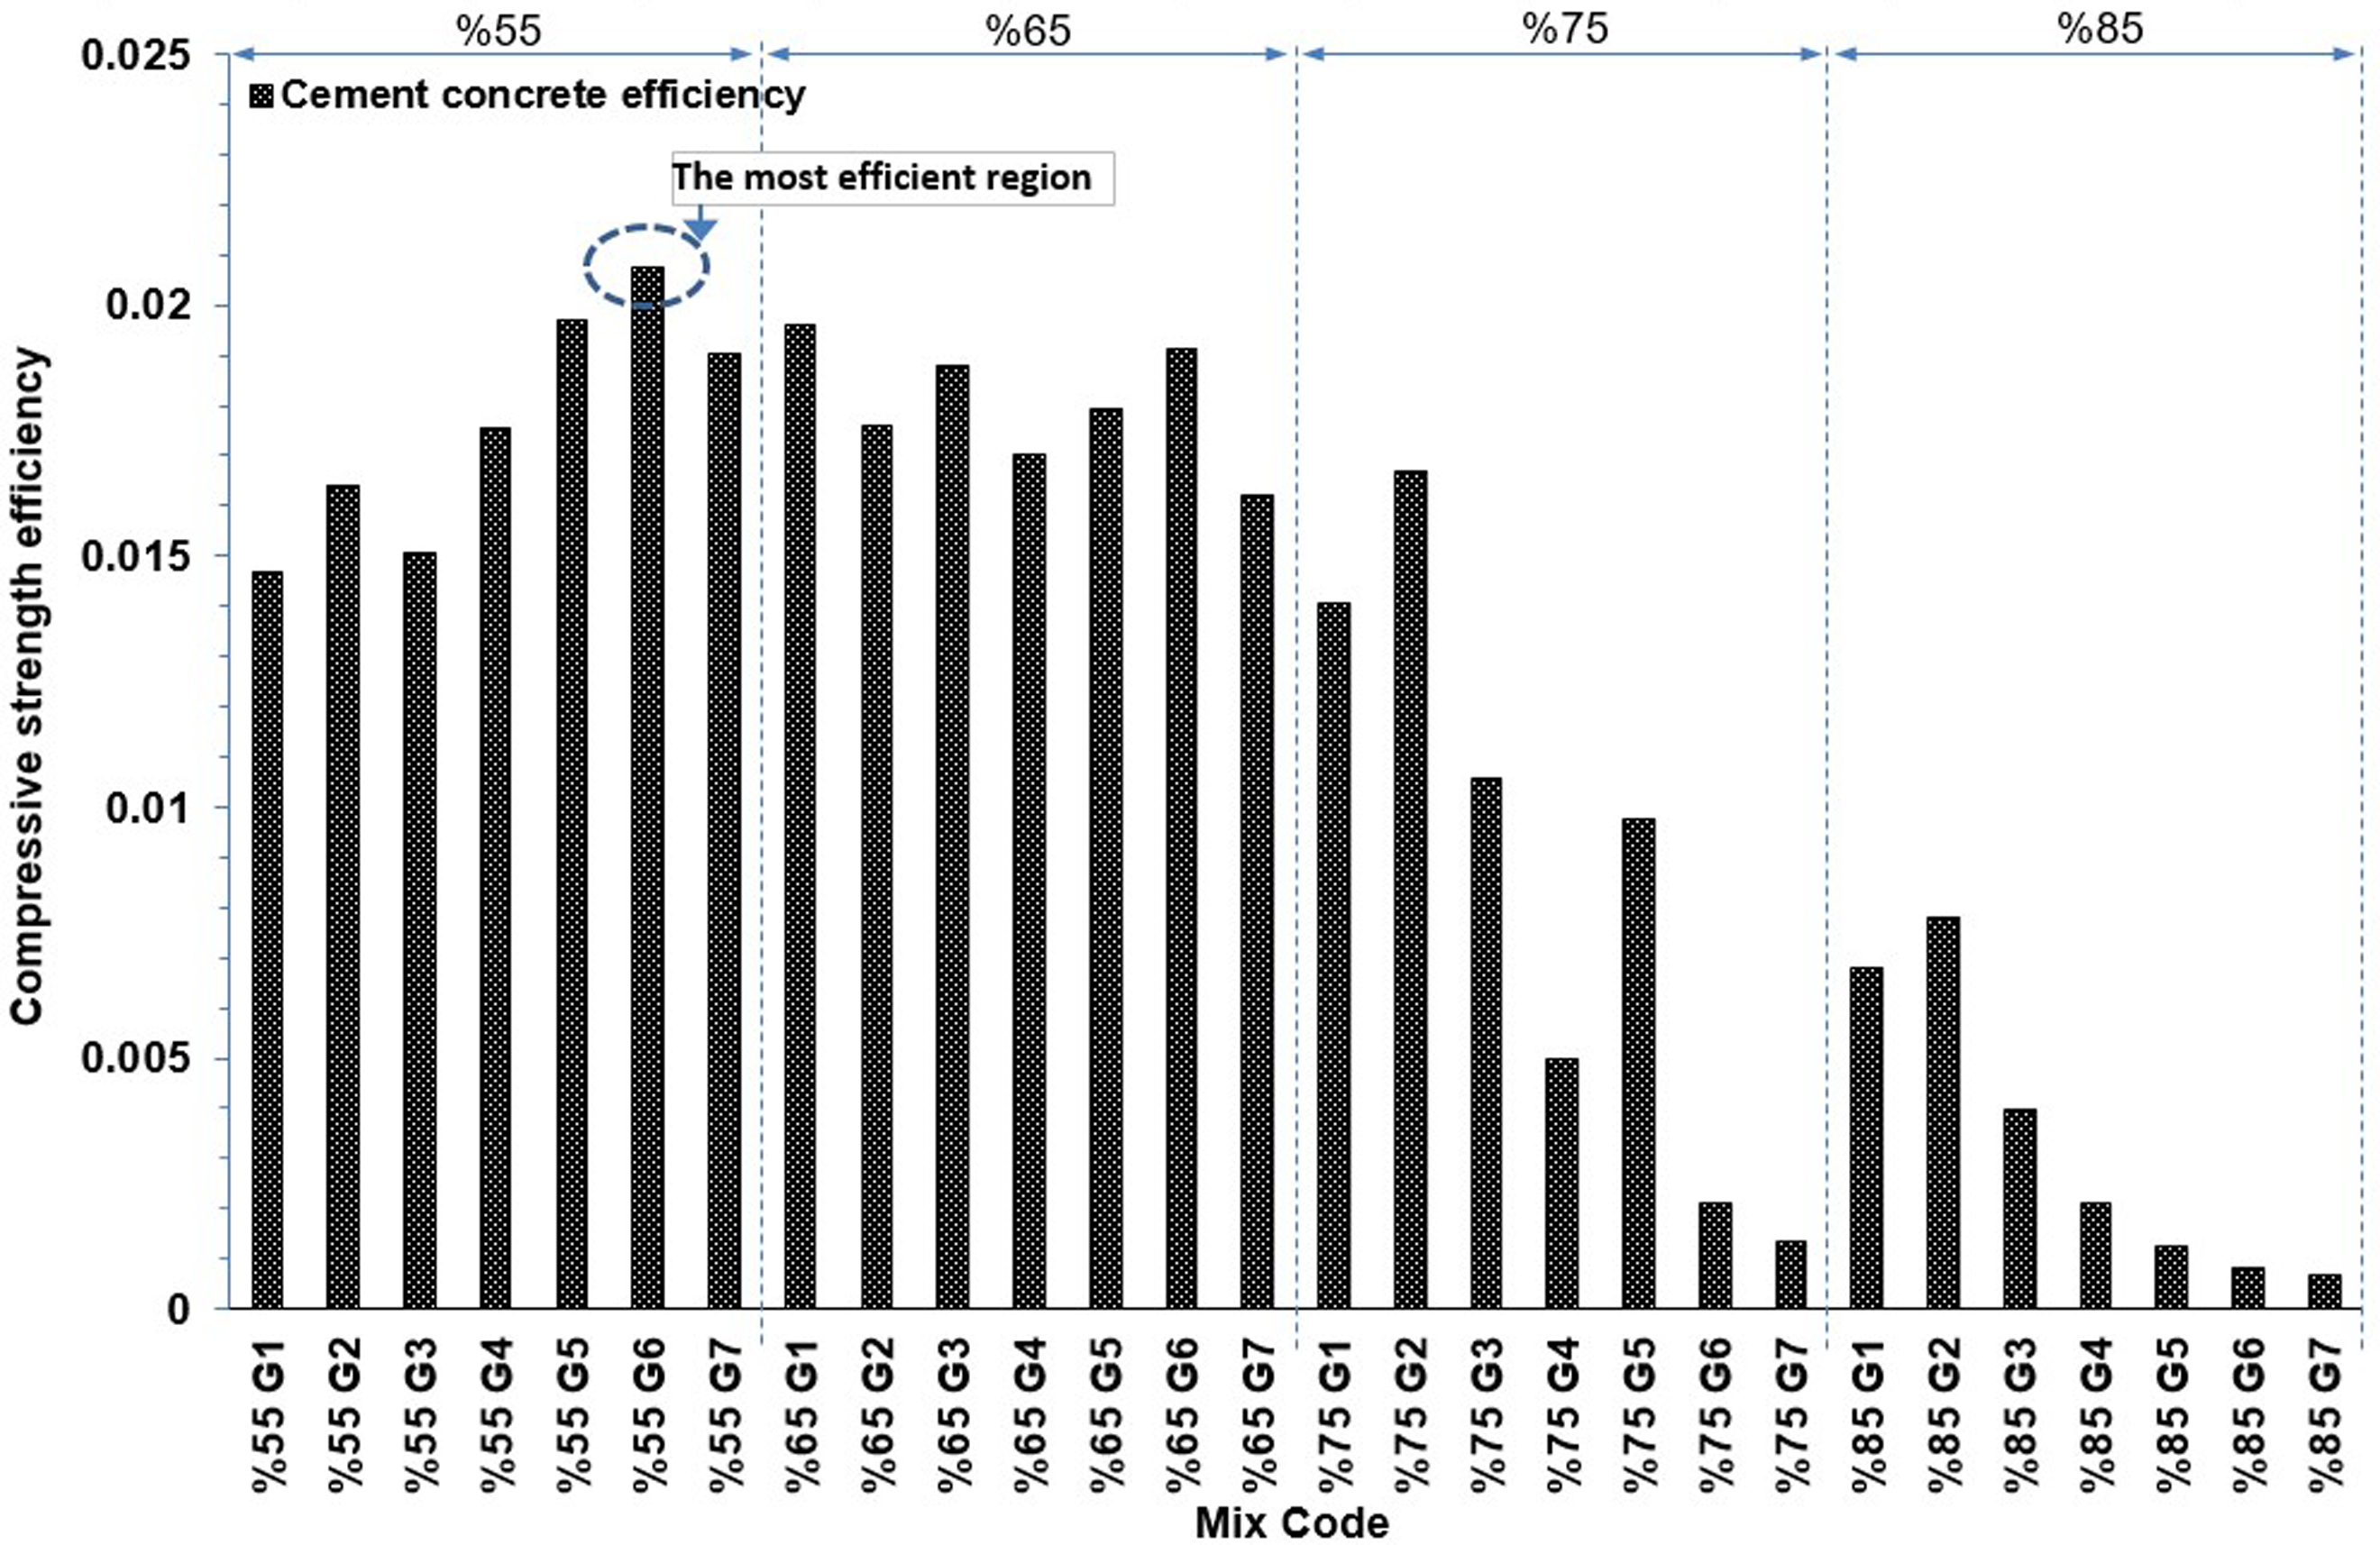
Figure 29 shows the flexural strength-to-weight efficiency of concrete containing polymer binders. The most efficient mix code occurred for 65% G4-G5-G6-G7 and 75% G3-G4-G5-G6-G7 samples. The 75% G7 sample with a binder content of 75% aggregate and 25% polymer can be considered as the most efficient sample type according to the sample weight. Figure 30 shows the flexural strength-to-weight efficiency of concrete containing cement. The most efficient mixing occurred in 65% G4-G7 mix code conditions. When polymer concrete and cementitious concrete are compared, it is seen that the strength-weight efficiency of polymer concrete (0.013) is much higher than that of cementitious concrete (0.003). Weight efficiency values for flexural strength of polymer concrete. Weight efficiency values for flexural strength of cement concrete.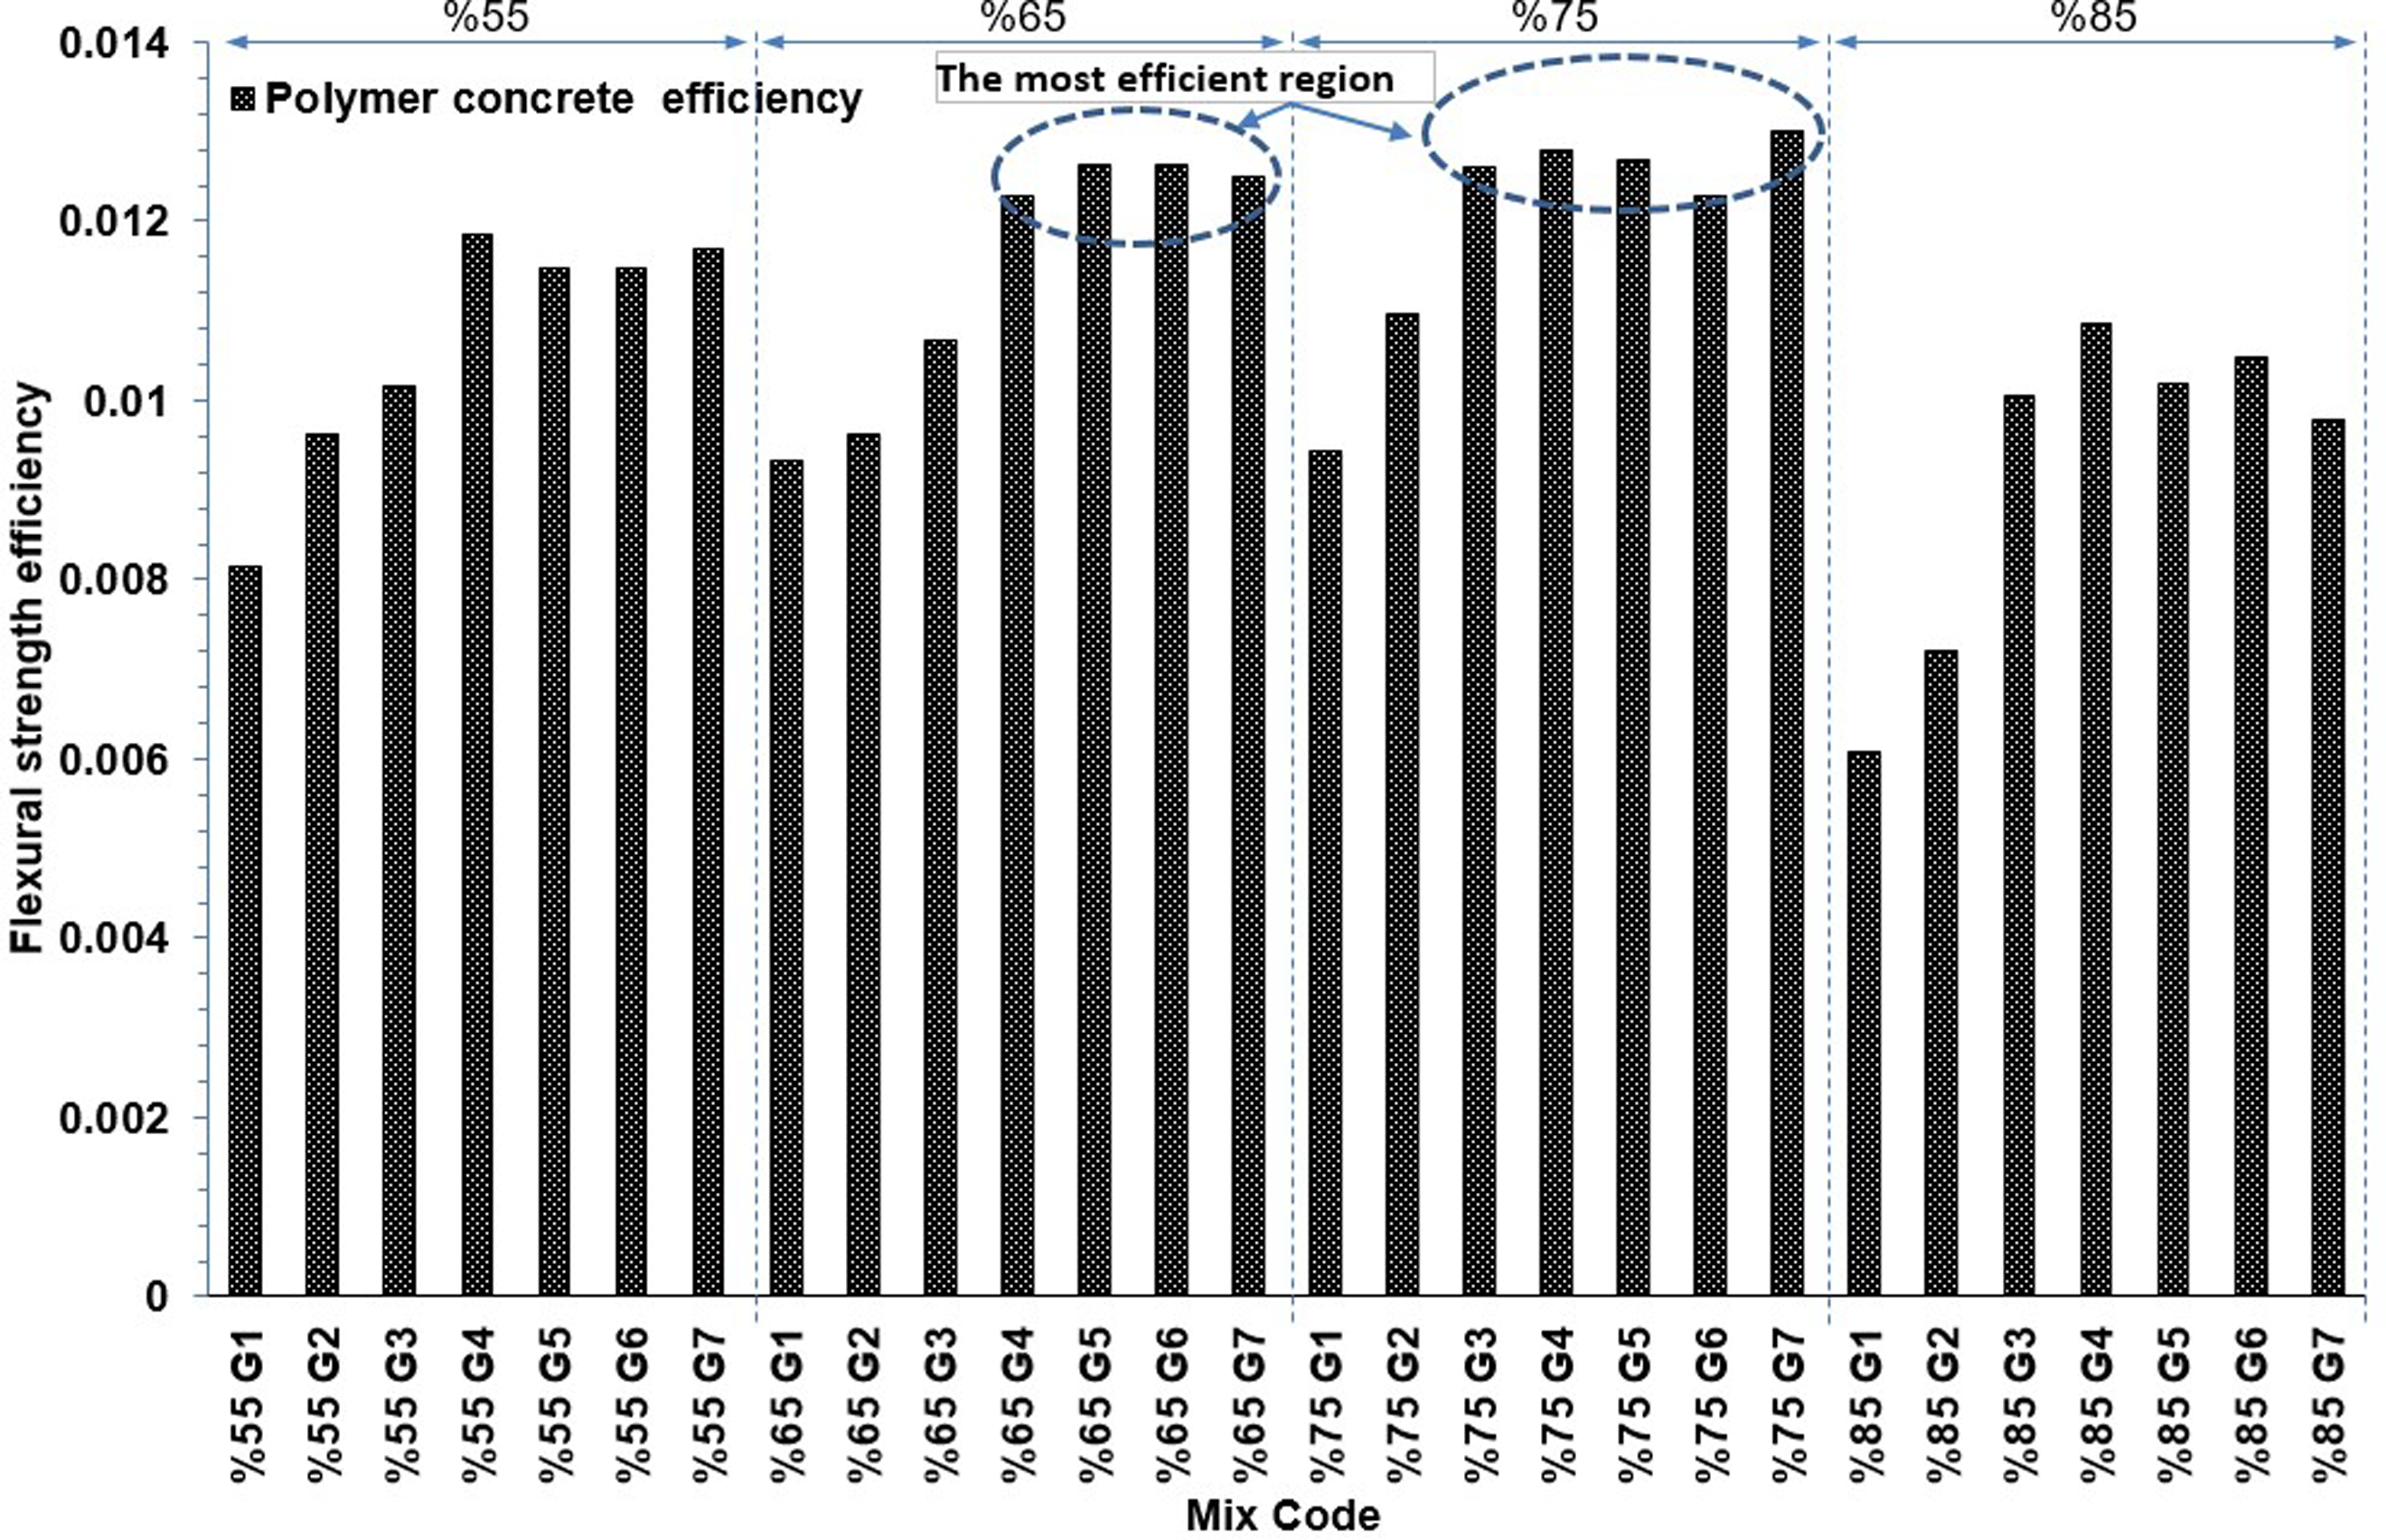
Results and conclusion
This study investigated the effect of aggregate granulometry and mixing ratio on the strength of concretes with cement-based and thermoplastic polyester-based binders. Seven different aggregate granulometry was used in the study. In addition, the aggregates in the concrete mix are included in various proportions (55%, 65%, 75%, and 85%) in the concrete mix. The obtained samples were subjected to compression and bending tests. It has been observed that polymer concrete has better mechanical properties than cementitious concrete’s behavior. In order to understand the reason for this situation, SEM images were taken from polymer concrete samples. It has been observed that the pore ratio in the polymer concrete is minimal and the polymer grasps the aggregates better. In addition, it has been observed that aggregate granulometry greatly affects the compressive strength of polymer concrete. It has been determined that the bending strength of polymer-binder concrete is much higher than cement-binder concrete. The obtained values were compared in tables and graphs. In light of the findings from the proposed study, the following conclusions may be reached: • Polyester-based resin is used as a binder when producing polymer concrete. This resin is a thermoset, that is, a heat-emitting polymer, and expands during this time. In this way, it tightly covers the aggregates. This situation brings the porosity ratio in polymer concrete close to zero, prevents the aggregates from breaking away from the concrete, and thus increases the strength. In addition, this resin covers the surfaces of the aggregates much more than the cement binder. This situation increases the adhesion between the aggregate and the binder, and the resistance of the tested samples against compression and bending. • In the study with polyester resin, the highest compressive strength and flexural strength occurred in the %75G7 sample with a 25% resin ratio in the mixture. Moreover, when all polymer concrete samples were examined, the highest compressive strength values were obtained in all mixture models (G1-G2-G3-G4-G5-G6-G7) of the mixtures containing 25% resin. However, although the compressive strength is slightly lower in %85G samples with a resin ratio of 15% in the mixture, it is more economical than other mixtures because it contains less resin. In addition, the compressive and flexural strength of polymer concrete containing 15% resin is more efficient than polymer concrete containing 45% resin. This efficiency can be explained as follows; Polymer concrete samples with 45% resin content are costlier than polymer concrete with 15% resin content, but the compressive strengths of polymer concrete samples with 45% resin content and polymer concrete samples with 15% resin content are almost the same. Moreover, the flexural strength efficiency of polymer concrete samples with 15% resin content is higher. This shows that increasing the amount of resin does not increase the strength at the same rate. • Appropriate optimization of mixture percentage and granulometry is the main parameter that determines strength. More economical polymer concretes can be obtained by using less resin by making optimization arrangements considering the most suitable aggregate granulometry and the most appropriate mixture percentage. In terms of compressive strength-resin content optimization, the most efficient sample is %85G5. In terms of flexural strength-resin amount optimization, the most efficient sample is the %85G4 sample • The lightness of the structure is as important as the strength of the structures. For this reason, strength-weight optimization was made. It was determined that the most productive polymer concrete variety was found in the %55G7, %65G7 and %75G7 samples in terms of compressive strength. It was determined that the most productive polymer concrete variety was found in the %75G7 sample in terms of flexural strength. If we evaluate the binder resin amount-strength and strength-weight optimizations together, it is seen that the most efficient sample is the %75G7 mixture coded sample in terms of bending and compressive strength. This sample is lighter and contains less resin than the others. Thus, it is both advantageous in terms of lightness and a more economical solution. Moreover, it has high strength. • When the cementitious concrete samples are examined. Amount of cement in cementitious concrete is not always the main parameter to increase the strength. The type of granulometry and Appropriate optimization of mix percentage has a decisive influence on strength. It is seen that the compressive strength of the %55G and %65G samples, whose ratio of total cement and water in the mixture to the total mixture is 45% and 35%, is better than the other mixture ratios. The compressive strength of the %55G samples, where the amount of cement binder in the mixture is high, is close to the compressive strength of the %65G samples. Furthermore, the compressive strengths of G1 and G2 samples from the %75G sample group, where the amount of binder is low compared to the %55G and %65G mixtures, are nearly equal to the compressive strengths of %55G and %65G samples with higher cement content. However, in G3-G4-G5-G6-G7 mixtures, the compressive strength values are very low. It also is seen that the flexural strength is better for the samples with a ratio of 35% of the total cement and water in the mixture to the total mixture compared to other mixture ratios. It is seen that especially %65G4 samples have the highest flexural strength. However, the flexural strength of the %55G samples, where the amount of cement binder in the mixture is high, is close to the flexural strength of the %65G samples. Furthermore, the flexural strengths of G1 and G2 samples from the %75G and %85G sample groups, where the amount of binder is very low compared to the %55G and %65G mixtures, are nearly equal to the flexural strengths of %55G and %65G samples with higher cement content. This shows that the amount of cement in cementitious concrete is not always the main parameter to increase the strength. The type of granulometry has a decisive influence on strength. Moreover, %75G1 and %75G2 samples, which are %75G samples, are more efficient in terms of strength-binder amount compared to %55G samples, which contain three times more cement and are costlier. This shows that increasing the amount of cement does not increase the strength at the same rate. • Appropriate optimization of mix percentage and granulometry is the main parameter determining strength. Using less cement, concrete with almost the same strength and more economical can be obtained. The lightness of the structure is as important as the strength of the structure. For this reason, strength-weight optimization was made. It was determined that the most efficient variety of cementitious concrete occurred in the %55G6 sample in terms of compressive strength. It was determined that the most productive cementitious concrete variety was found in %65G4 and %65G7 samples in terms of flexural strength. If we evaluate the binder cement amount-strength and strength-weight optimizations together, it is seen that the most efficient sample in terms of bending strength is %65G7. This sample is lighter than the %55G samples, contains less cement and has high flexural strength. Thus, it is both an advantageous solution in terms of strength-lightness and a more economical solution. • The ultrasonic test results show that cementitious concrete’s compressive strength and velocity are compatible. As ultrasonic speed decreases, compressive strength decreases. Significant decreases are observed in samples %75G6 and %75G7. For polymer concrete, velocity values are compatible with compressive strength values, with polymer concretes having more balanced ultrasonic velocity values. • The etringite, which is a reaction product formed as an outcome of the hydration of C3A, one of the major components of concrete, invites a sulfate effect in concrete. It is the substance that causes expansion in the cement microstructure and causes the concrete to crack and disintegrate like flour cookies. As a result of this situation, decreases in strength occurred. In polymer concrete, the defects that occur during the reaction in cement concrete do not occur. In addition, the amount of ITZ and pore formation is much less than cement concrete. Therefore, the strength of polymer concrete is much higher strenght and its behavior is more stable than cement concrete. However, polymer concrete production is more expensive and more precautions need to be taken to avoid causing health problems at the time of production. • It is seen from SEM analysis that in cement-binder concrete, the amount of cement binder is very important in terms of micromechanical properties rather than the type of aggregate. In polymer concrete, the type of granulometry curves plays an important role on strength as much as the amount of binder. • In polymer concrete, the type of granulometry curves plays an important role on strength as much as the amount of binder. For polymer concrete, the effect of granulometry curves on strength is clearly seen especially in 55%G samples (Figure 15). As the mixing ratios increase from 55%G to 85%G, the effect of the type of granulometry curves on strength decreases. When 75%G samples are examined, the strengths of 75%G3-G4-G5-G6-G7 samples are almost close to each other. • The amount of resin binder decreases from 55%G to 85%G mixture. The fact that the resin in the mixture is not too much prevents the separation of coarse and fine aggregates and results in a more homogeneous mixture. Homogeneous mixed concrete prevents the formation of excessive porous structure and causes the elimination of negative contact surface problems and naturally increases the strength (Figures 15 and 17). In this case, the effect of the type of granulometry curve on the strength decreases. The compressive strengths of 85%G3-G4-G5-G6-G7 samples are close to each other. These strength values are very different from each other in 55%G samples where the resin is too much. • The results obtained showed that there was a decrease in the ultrasonic pulse velocity as the percentage of thermoplastic binder in all mixtures increased. In cement-binder concrete, it was determined that the type of granulometer is more important than the binder percentage. • In thermoplastic-binder concrete, it has been determined that the type of granulometry and the amount of fine aggregate in the mixture are more important than the percentage of binder in the mixture. Increasing the percentage of fine aggregate in the mixture significantly increases the compressive and especially the flexural strength.
Footnotes
Declaration of conflicting interests
The authors declared no potential conflicts of interest with respect to the research, authorship, and/or publication of this article.
Funding
The authors received no financial support for the research, authorship, and/or publication of this article.