
Abstract
The present study aims to study the effect of various infill patterns (Rectilinear, Triangular, and Honeycomb) on the mechanical properties of 3D-printed polylactic acid (PLA) composites by reinforcing the wollastonite mineral fillers at 2, 4, and 6 wt% ratios. The triangular infill pattern printed samples displayed the highest tensile and flexural properties due to the fact that trigonal unit topologies exhibit more serrated cycles than rectilinear ones. Units with a triangle infill pattern are stiffer and less ductile than those with honeycombs. Tensile and flexural modulus values are therefore shown to increase in tandem with an increase in the filler ratio. The impact strength analysis showed that the rectilinear pattern performed better regarding energy absorption. The hardness values were found to increase as the filler ratio due to the particle’s rigidity, which made it impossible to resist the indentation deformation on the surface. The triangle pattern samples show no signs of deformation fracture, and appeared with smooth fractured surface in the morphologies. Comprehensively, this study confirms that the triangular infill pattern outperformed in mechanical properties as compared to honeycomb and rectilinear patterns in 3D printed wollastonite reinforced PLA composites, and could be suggested for lightweight frictional materials applications.
Keywords
Highlights
• Development of eco-friendly wollastonite filler reinforced PLA composites using FDM 3D printing. • Comprehensive investigation on the effect of both infill patterns and filler ratio on the mechanical properties. • The triangular infill pattern samples show higher mechanical properties than rectilinear and honeycomb infill patterns. • The reinforcement of wollastonite filler at higher concentrations has positively influenced strength and modulus values.
Introduction
The expeditious developments in 3D printing technologies highlighting comparatively lower cost, flexibility in design, and rapid production have led to the manufacturing of lightweight products. For multi-domain applications, 3-D printing is highly desirable due to the ease with which the printing profile may be customized. 1 In the late 1980s, 3D printing was primarily utilized in additive manufacturing (AM) and integrated with other domains such as materials science, mechanical engineering, computer technologies, and digital sectors. Among the variety of available technologies, fused deposition modeling (FDM) emerged as a popular one because of its laser use exemptions together with lower maintenance and economic parameters. 2 For industrial manufacturing, fused deposition modeling is a superior option due to its inexpensive printing equipment and thermoplastic material prices. The FDM has been used to print a variety of devices and components. 3 FDM used to only work with pure thermoplastics, nevertheless these days, reinforced material is now sold commercially. However, there is never an assurance that such feedstock is legitimate, and the majority of practitioners voluntarily create their customized feedstock using appropriate processing techniques. Eventually, multi-material printing is a general tendency with composite materials by reinforcing a variety of fillers and fibers. Although the kinds of printing processes often influence the option of composite production, both methods can impart unique physicochemical characteristics to the final products. 4 Alternatively, the different infill patterns like cubic, rectilinear, triangular, honeycombs, and others also improve the multifunctional properties of the 3D printed parts. Additionally, the patterning of materials makes it possible to create flexible composites with mechanical characteristics that are heterogeneous and adjustable. 5
Currently, most of the research works are being focused on the utilization of biodegradable polymers in the interest of environmental protection for applications like biomedical, packaging, and semi-structural parts. Among this category of polymers, poly (lactic acid) (PLA) knowledge is crucial for the current environmental requirements.6–8 By providing more end-of-life scenarios, PLA, a biodegradable polymer, is viewed as a possible substitute for tackling the issue of disposing of municipal solid waste (MSW). In the previous two decades, the research and publications on PLA have expanded tremendously because of growing market penetration, global interest, and PLA manufacturing. 9 Simultaneously, it has become the most dominant material in FDM 3D printing technique studies both from domestic and commercial points of view. These extensive studies aim to increase interface bonding, mechanical characteristics, and accuracy by optimizing critical process parameters through technical research. Research on PLA modification offers an alternative viewpoint. It focuses on improving the mechanical characteristics of PLA components through the reinforced phase and increasing the cross-linkage phase along with the crystallinity. 2 The prolonged developments in 3D printing utilize various kinds of reinforcements in the form of fillers and fibers for the properties improvements. It may be organic, inorganic, or mineral-based reinforcements. 4 The procedure of bio-degradation end-of-life way of eco-friendly polymers is less negatively impacted by mineral filler reinforcement because the ejection of these fillers during biodegradation has little influence on the general concentrations that are usually present in nature. Moreover, the cost of the polymers can also be reduced with these mineral fillers as potential reinforcements.10,11 Among different kinds of mineral materials, wollastonite is a naturally occurring silicate-based mineral that is broadly utilized in polymers, ceramics, paints, and frictional products. This wollastonite with higher aspect ratios is more popular fire fire-resistant and frictional product manufacturing as a replacement for asbestos. Wollastonite is generally white in color, but it can also be found in different shades of colors like brown, gray, and light yellow. 12 It is favored in paints, coatings, building supplies, and brake pads because of its great brightness and whitening as well as its minimal absorption of moisture and oils. Wollastonite’s surface chemistry is quite simple because of easy surface modification. This allows for the homogeneous dispersion of inorganic wollastonite in organic polymers, resulting in improved characteristics and decreased compounded viscosity. 13 Hence, it is preferred as a good reinforcement material with various polymer matrices, especially with biodegradable polymers.
In literature, many researchers have reported the utilization of various fillers as a reinforcement with PLA using additive manufacturing. 14 Zhao and team 15 utilized carbon nanotube-coated glass fibers as a reinforcement with PLA and analyzed the impact on tensile properties with two different raster angles. Composite filament-printed tensile specimens performed better than those of neat PLA filaments due to the more effective stress transmission among the matrix and filler reinforcement. Also, the raster angle has no significant influence on the tensile properties due to absolute fusion among neighbor rasters while printing. As an intriguing study, Kain and group 16 explored the infill orientations (0°, 15°, 30°, 45°, 60°, 75°, and 90°) influence on the wood-reinforced PLA composites. They found that there is an intensive correlation between infill orientation and mechanical performance, which are mutually dependent on each other. Moreover, the maximum weight ratio of 25 wt% wood loading gives better mechanical performance than a lower amount of reinforcement. Kim et al. 17 also reported the effect of graphene nanoplatelets (GNPs) on the FDM-printed PLA composites by varying the filler concentration. The 3D printed PLA/GNP composite has shown enhanced mechanical performance even at the lower GNP threshold ratio of 2 wt%. The implanted GNPs appropriately function as a reinforcing filler since the structural examinations of these composites demonstrate that PLA was not physically or chemically altered. Chuayjuljit and Ketthongmongkol 18 examined the mechanical and thermal properties of wollastonite reinforced polyurethane composites. The have found that the wollastonite particles significantly improved the stiffness and thermal stability of the matrix upon different reinforcement ratios. Also, they have observed both isotropic and anisotropic morphologies in the samples. To analyze the shape memory and mechanical properties, Singh and team 19 reinforced the zinc oxide fillers into a PLA matrix for the functional prototypes. They found that the maximum peak strength and break strength of respectively 14.32 MPa and 12.89 MPa were observed with an infill density of 80% printed in a honeycomb pattern. Whereas the highest toughness modulus of 0.883 MPa was observed with an infill density of 80% printed in a rectilinear pattern. Finally, they concluded that the perimeter, infill densities, and printing patterns have a direct impact on the tensile characteristics of printed samples. In the case of research done on bamboo-filled PLA biocomposites, 20 the tensile fractured surfaces confirm that there is a strong interaction among bamboo particles and matrix when the composite samples were printed at 0.4 and 0.6 mm nozzle diameters. Also, they have reported the significant influence of infill densities on the static tensile characteristics. Overall, the literature confirms that there is an impact of printing parameters over the 3D printed samples. Fewer works were found with the utilization of wollastonite as a filler for 3D printing applications and the effect of various printing patterns. Hence, an attempt is made here to analyze the effect of both wollastonite concentration (0, 2, 4, and 6 wt%) and printing patterns (rectilinear, triangular, and honeycomb structures) over the mechanical properties of additively manufactured PLA composites. Since wollastonite is an eco-friendly material and PLA is a biopolymer, this project helps in the development of products for 3D printing applications.
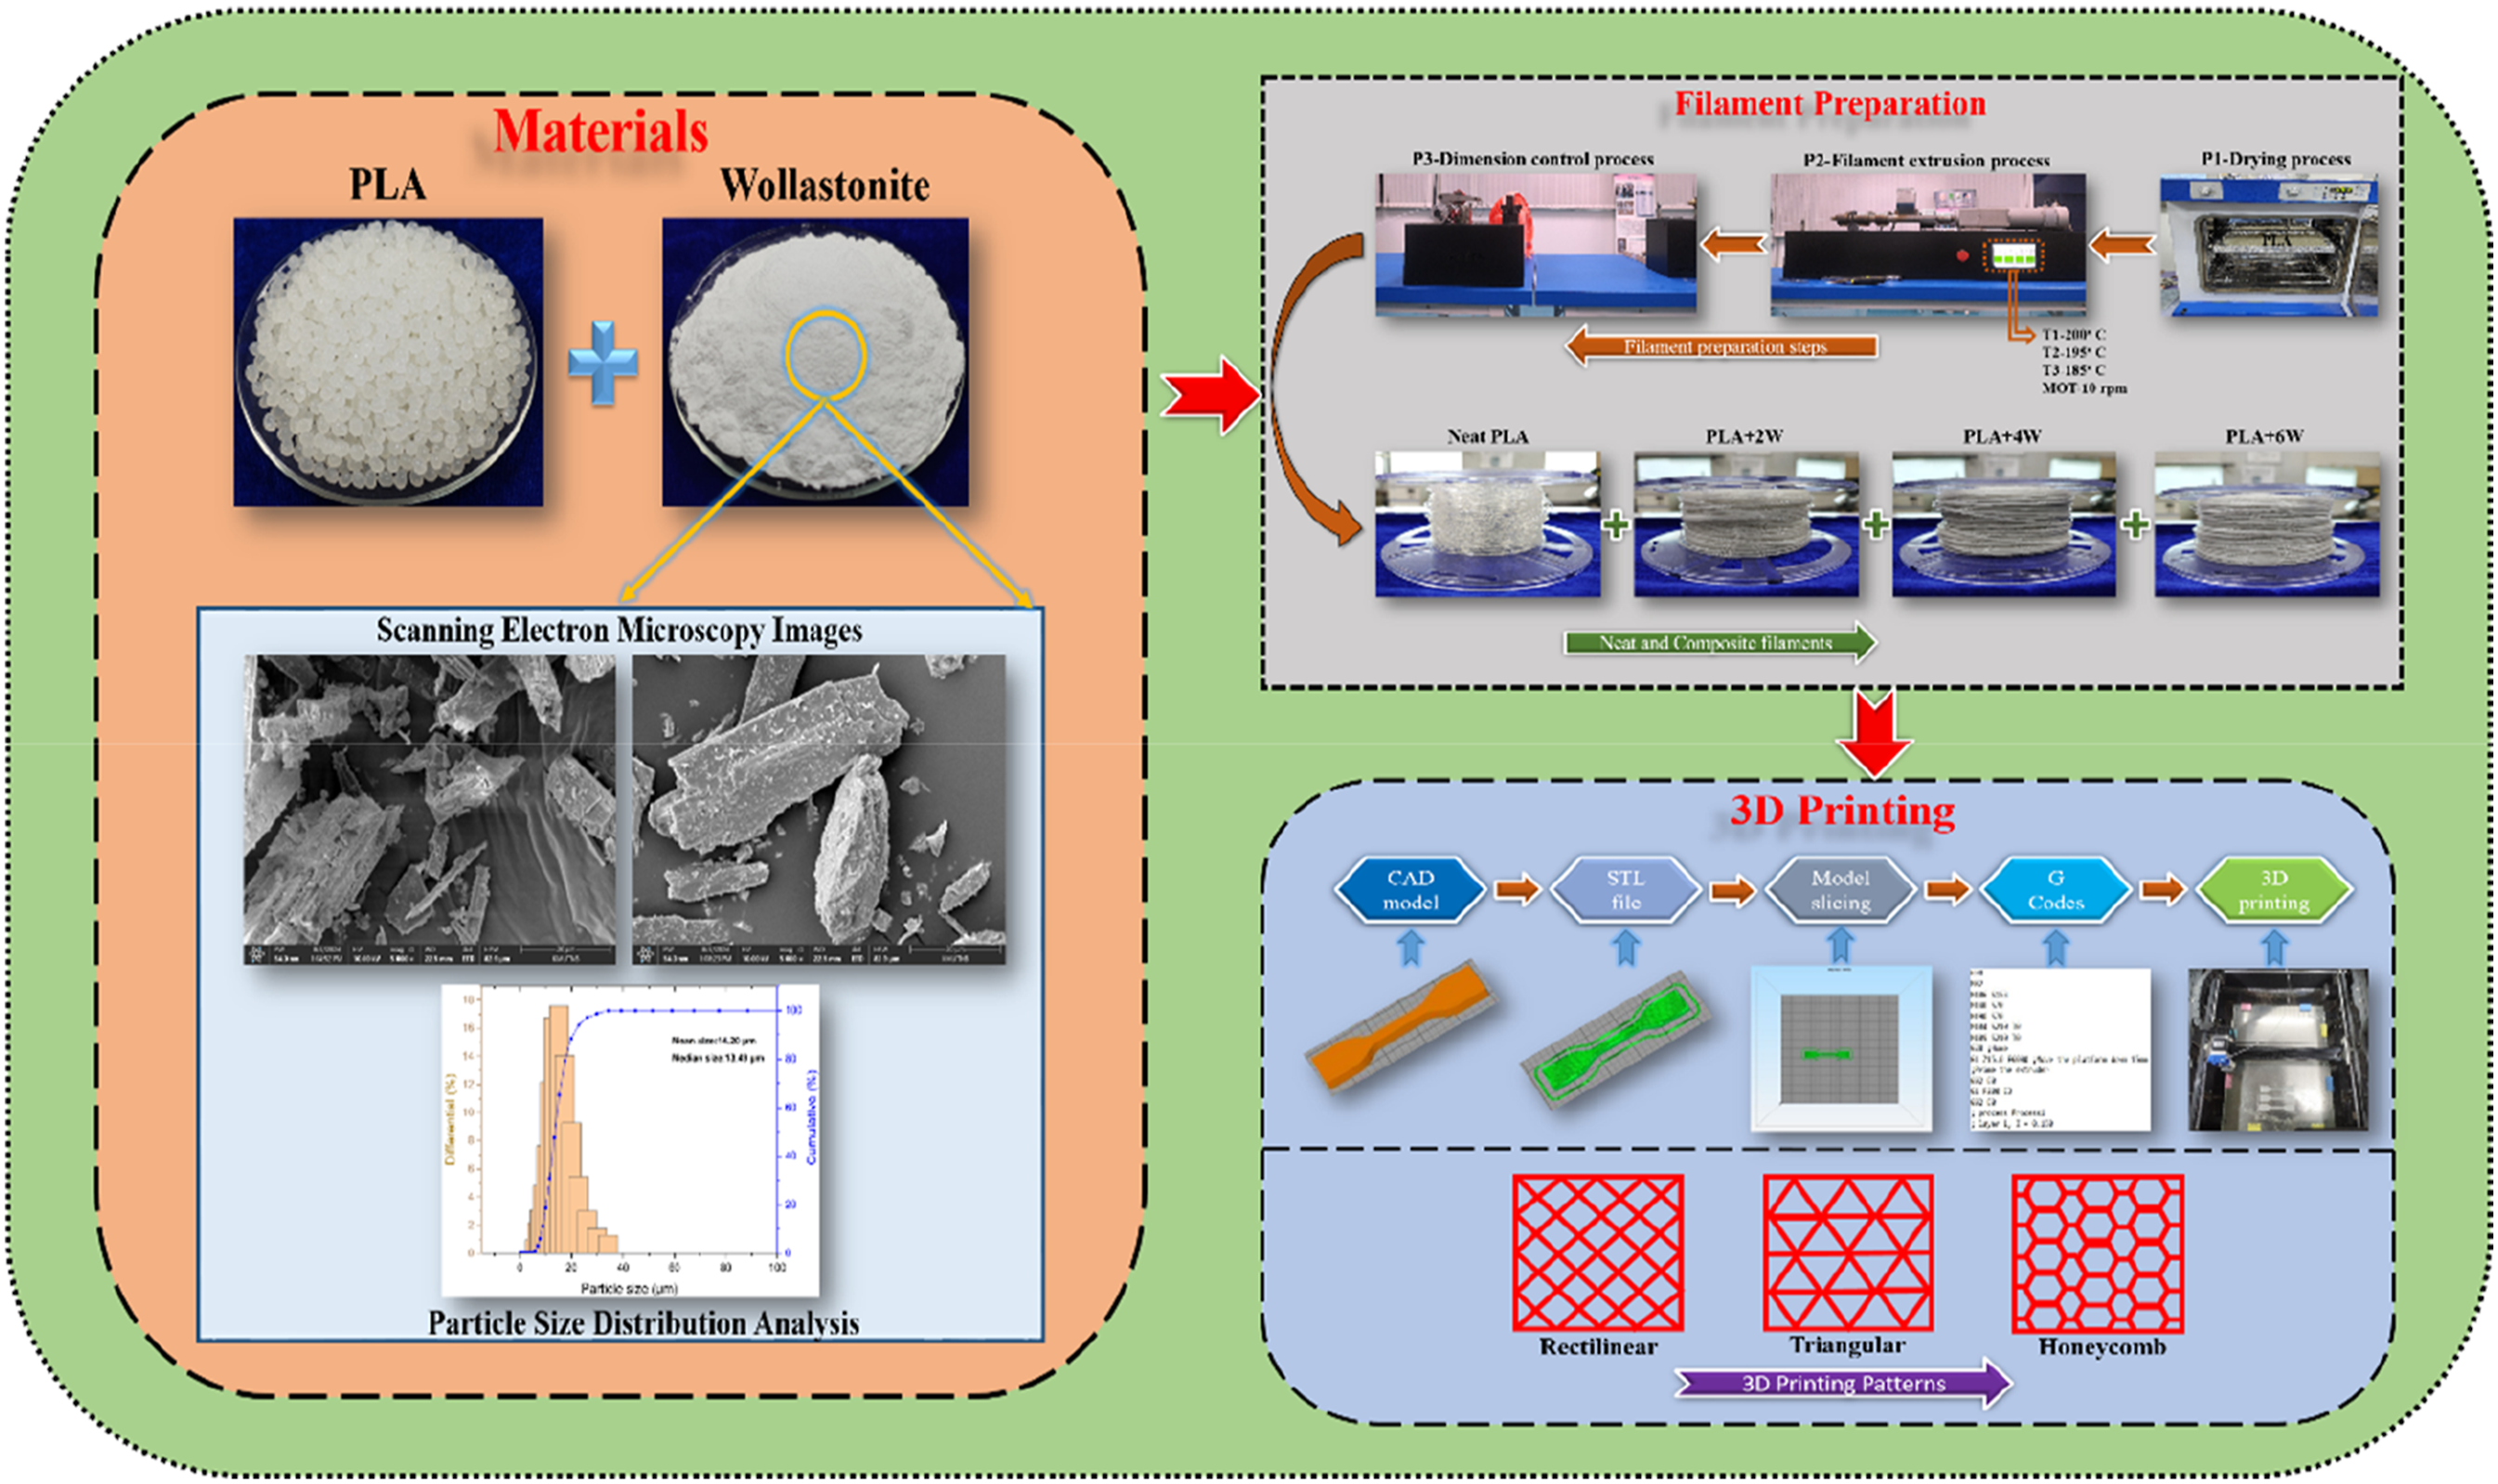
Materials and Composites Preparation
Materials
In this research work, the polylactic acid (PLA) polymer of 4043 grade was used as a matrix material, which was purchased from Nature Works Limited. It is a general-purpose 3D printing grade transparent material having a relative viscosity of 4.0 (From the supplier’s technical data sheet). It has a specific gravity of 1.24 g/cc, a heat distortion temperature of 55°C, and an MFR of 6 g/10 min. The PLA polymer of pellet form is shown in Figure 1(a). As a second phase of the composite system, the wollastonite mineral filler was used as a reinforcement at different weight ratios. It was purchased from Cernic International Co. LTD, Thailand in the form of powder as shown in Figure 1(b). After procurement, this filler was subjected to SEM analysis (Figure 1(b1)) using AxiaTM ChemiSEMTM Thermo Scientific equipment after gold coating over the material surface. The particles appear to be less than 50 μm in size with fiber-like structures. The brittle behavior may be confirmed by the existence of sharp edges at the particle edges.
21
In another way, the size of the particles was analyzed with the help of LA350 analyzer equipment, and the result is shown in Figure 1(b2). The mean and median sizes were 14.20 μm and 13.49 μm respectively. Also, it indicates that the majority of particle sizes exist below 50 μm size as illustrated in a column chart. (a) Polylactic acid (PLA) polymer, (b) Wollastonite filler: (b1) Scanning Electron Microscopy (SEM) images and (b2) Particle size distribution analysis.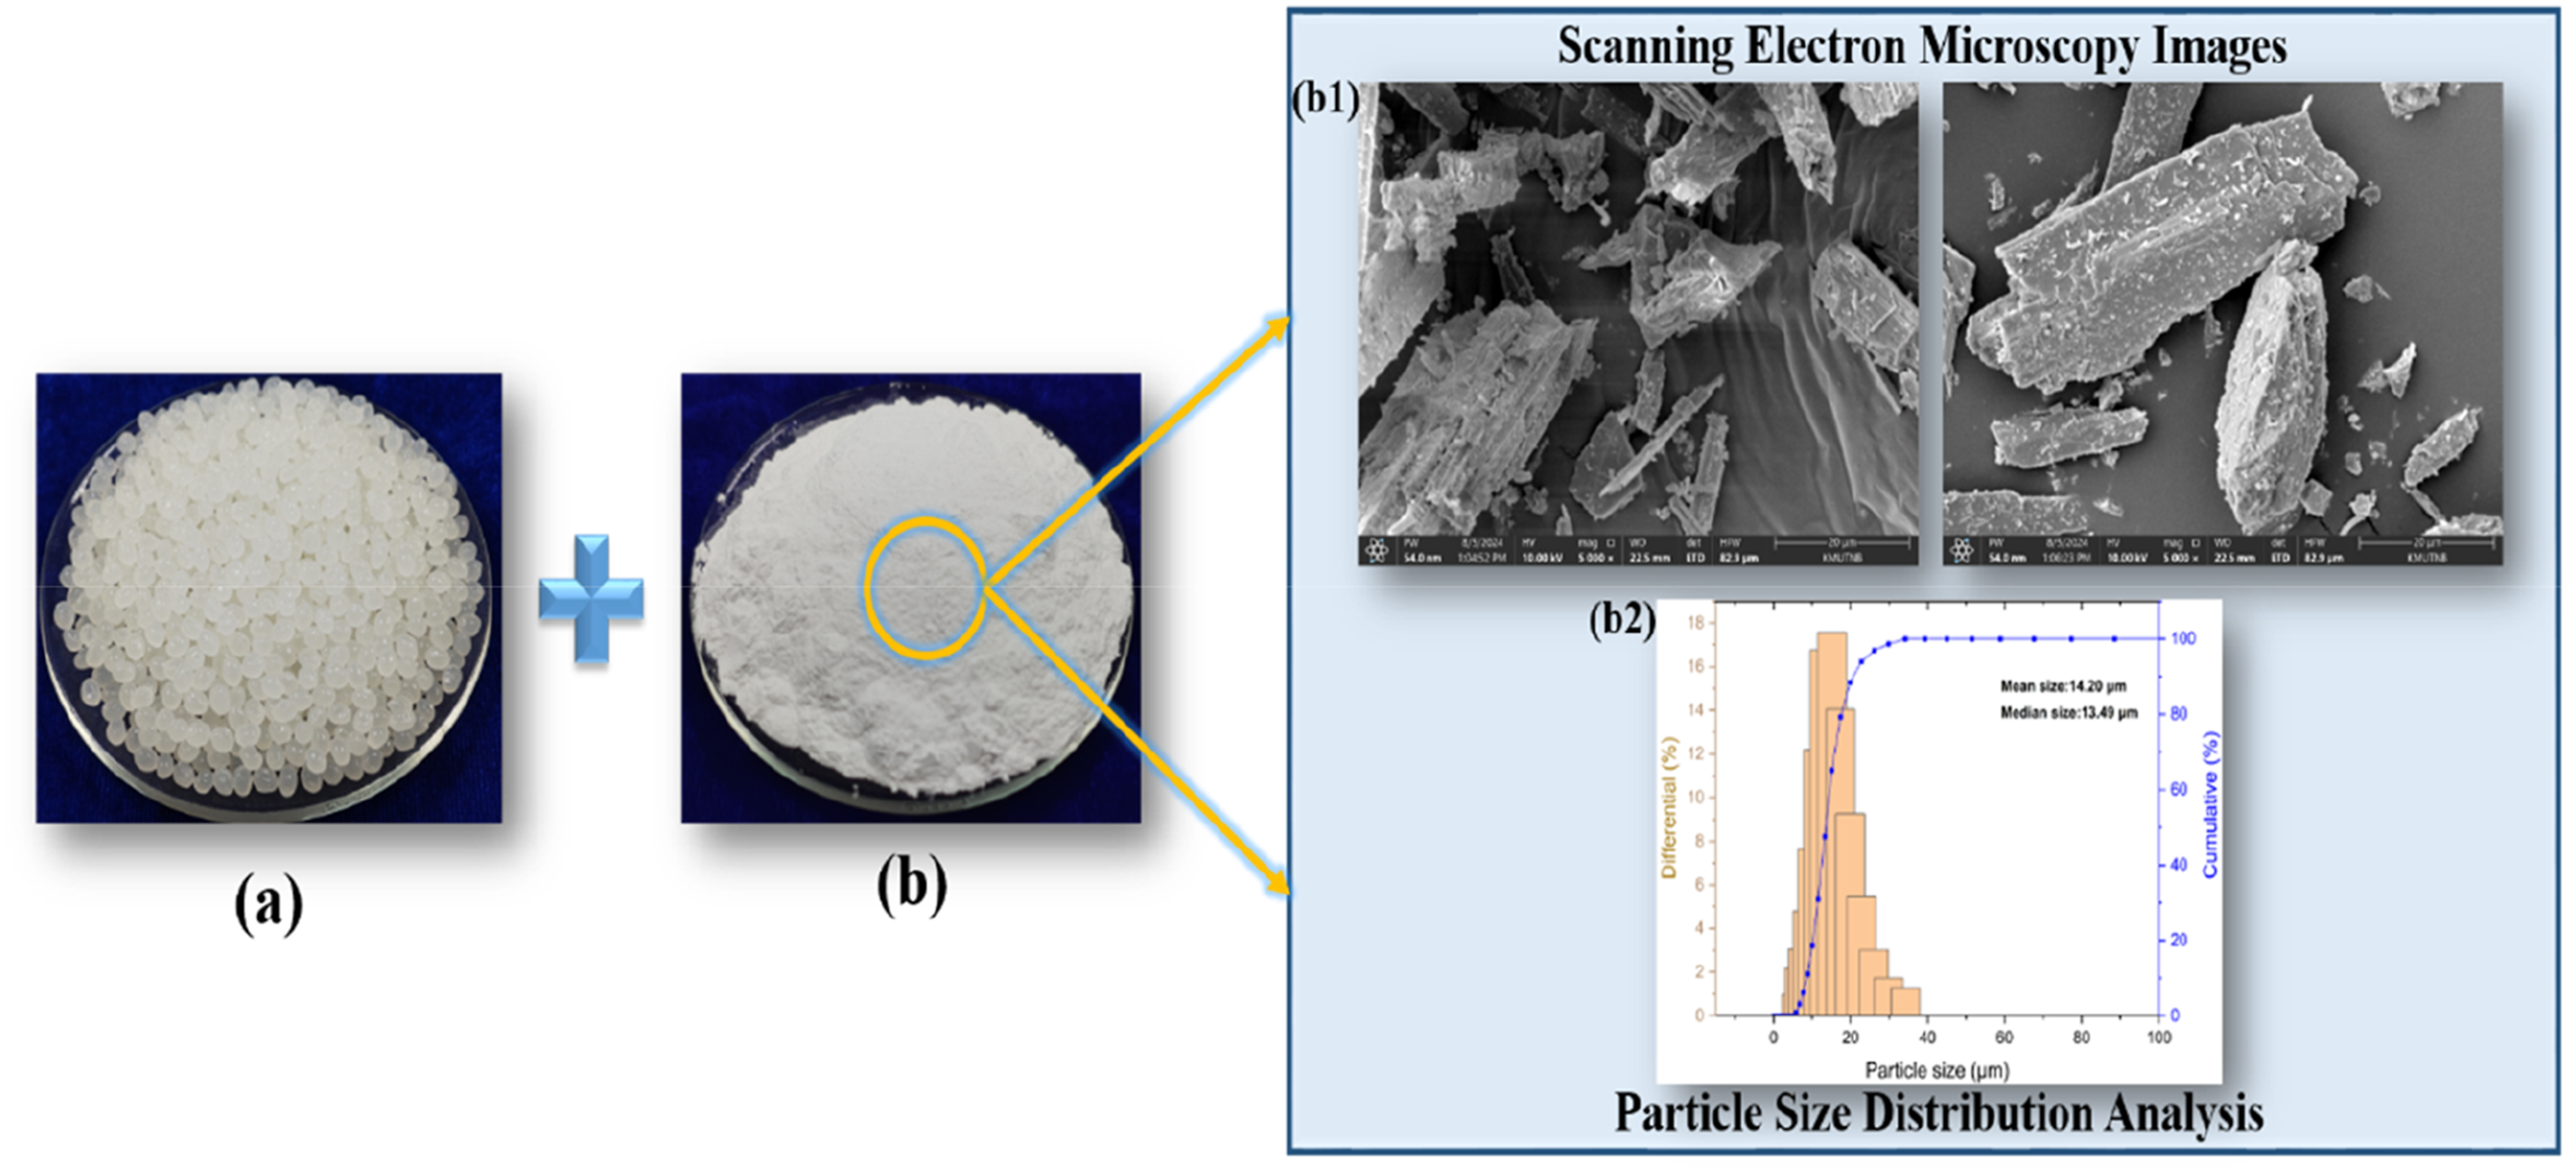
Composites Preparation
Filament Preparation
The filament process along with prepared neat and wollastonite reinforced (0, 2, 4, and 6 wt%) PLA composites are shown in Figure 2. Initially, the obtained PLA polymer pellets were dried in a hot air oven (P1) for a duration of overnight at 50°C to ensure moisture free pellets for the proper processing. Once it dried, it was subjected to a single screw filament extruder (P2) along with a calculated amount of wollastonite filler. The extrusion process was done at temperatures of 200°C (T1), 195°C (T2), and 185°C (T3) at 10 r/min motor speed. The cooling of the extruded filament was done at an atmospheric temperature without external cooling. In phase P3, the dimensioning of the extruded filament is done by adjusting the drawing speed with the dimensional controller. The drawing speed was maintained at 130 cm/min to ensure the compatible filament diameter between 1.6 mm and 1.75 mm. Finally, the obtained filaments were rolled over a plastic spool using a filament winder. Flowchart of the filament preparation process.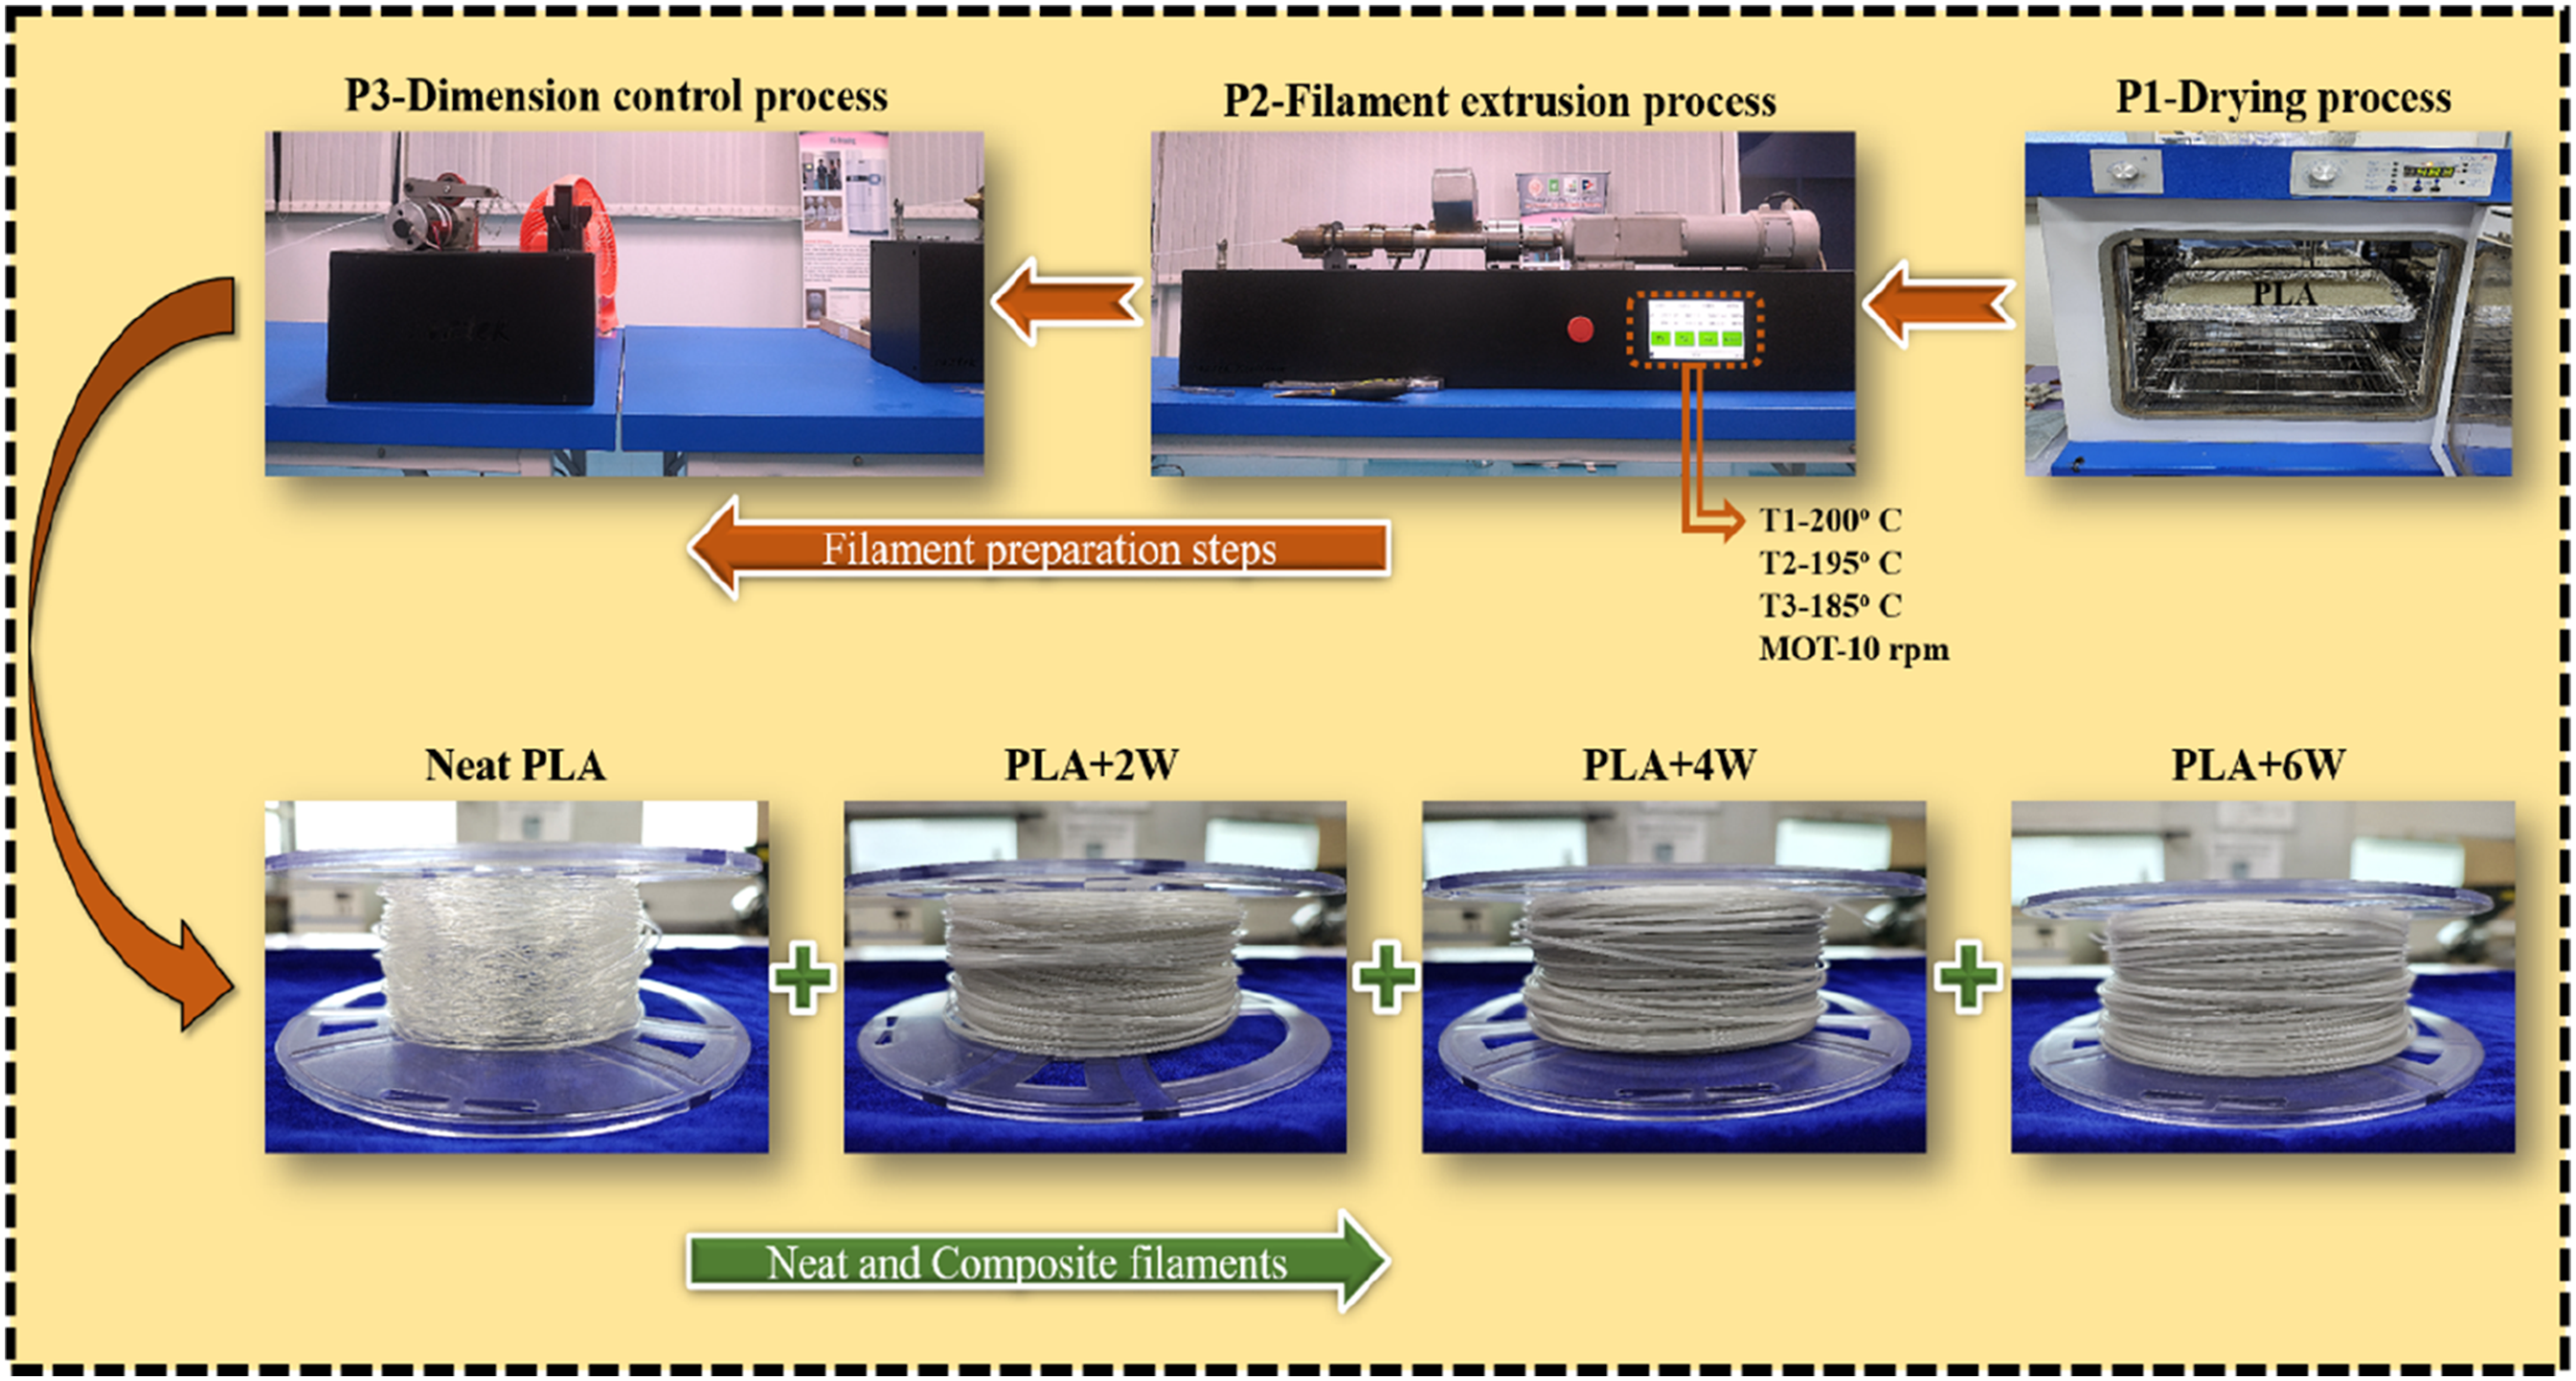
3D Printing
The 3D printing process of composites and different infill patterns are illustrated in Figure 3(a) and (b) respectively. Initially, the Computer-Aided Design (CAD) of the testing samples have been created using Solid Works 2021 software. Once the model is ready, it is exported in STL format to feed into the next step. Simplify3D, a 3D slicing software was employed to slice the testing models which have been imported in STL format. In this stage, the process parameters like nozzle diameter (0.6 mm), the layer height (0.15 mm), the top and bottom solid layers (2 + 2), the infill patterns (rectilinear, triangular, and honeycomb), the outline overlap (21%), the infill percentage (100%), the bed temperature (60°C), and the filling angle (45°) has been feeded before slicing. After this stage, the positioning coordinates and parameters were converted into G codes to feed into the 3D printer. The Ocean Blue Bangkok Ltd model BBC3040 3D printer was utilized to print the samples at a constant speed. Before printing, all the filaments were dried at 50°C in an oven overnight to ensure moisture-free filaments. Since the study is focused on different infill patterns, each testing sample is printed with three kinds of patterns with different filler ratios at a printing speed of 45 mm/s. The detailed 3D printed composite compositions concerning filler ratio and infill patterns are provided in Table 1. Illustration of (a) 3D printing process, and (b) Infill patterns. PLA composite combinations concerning infill pattern and filler ratio.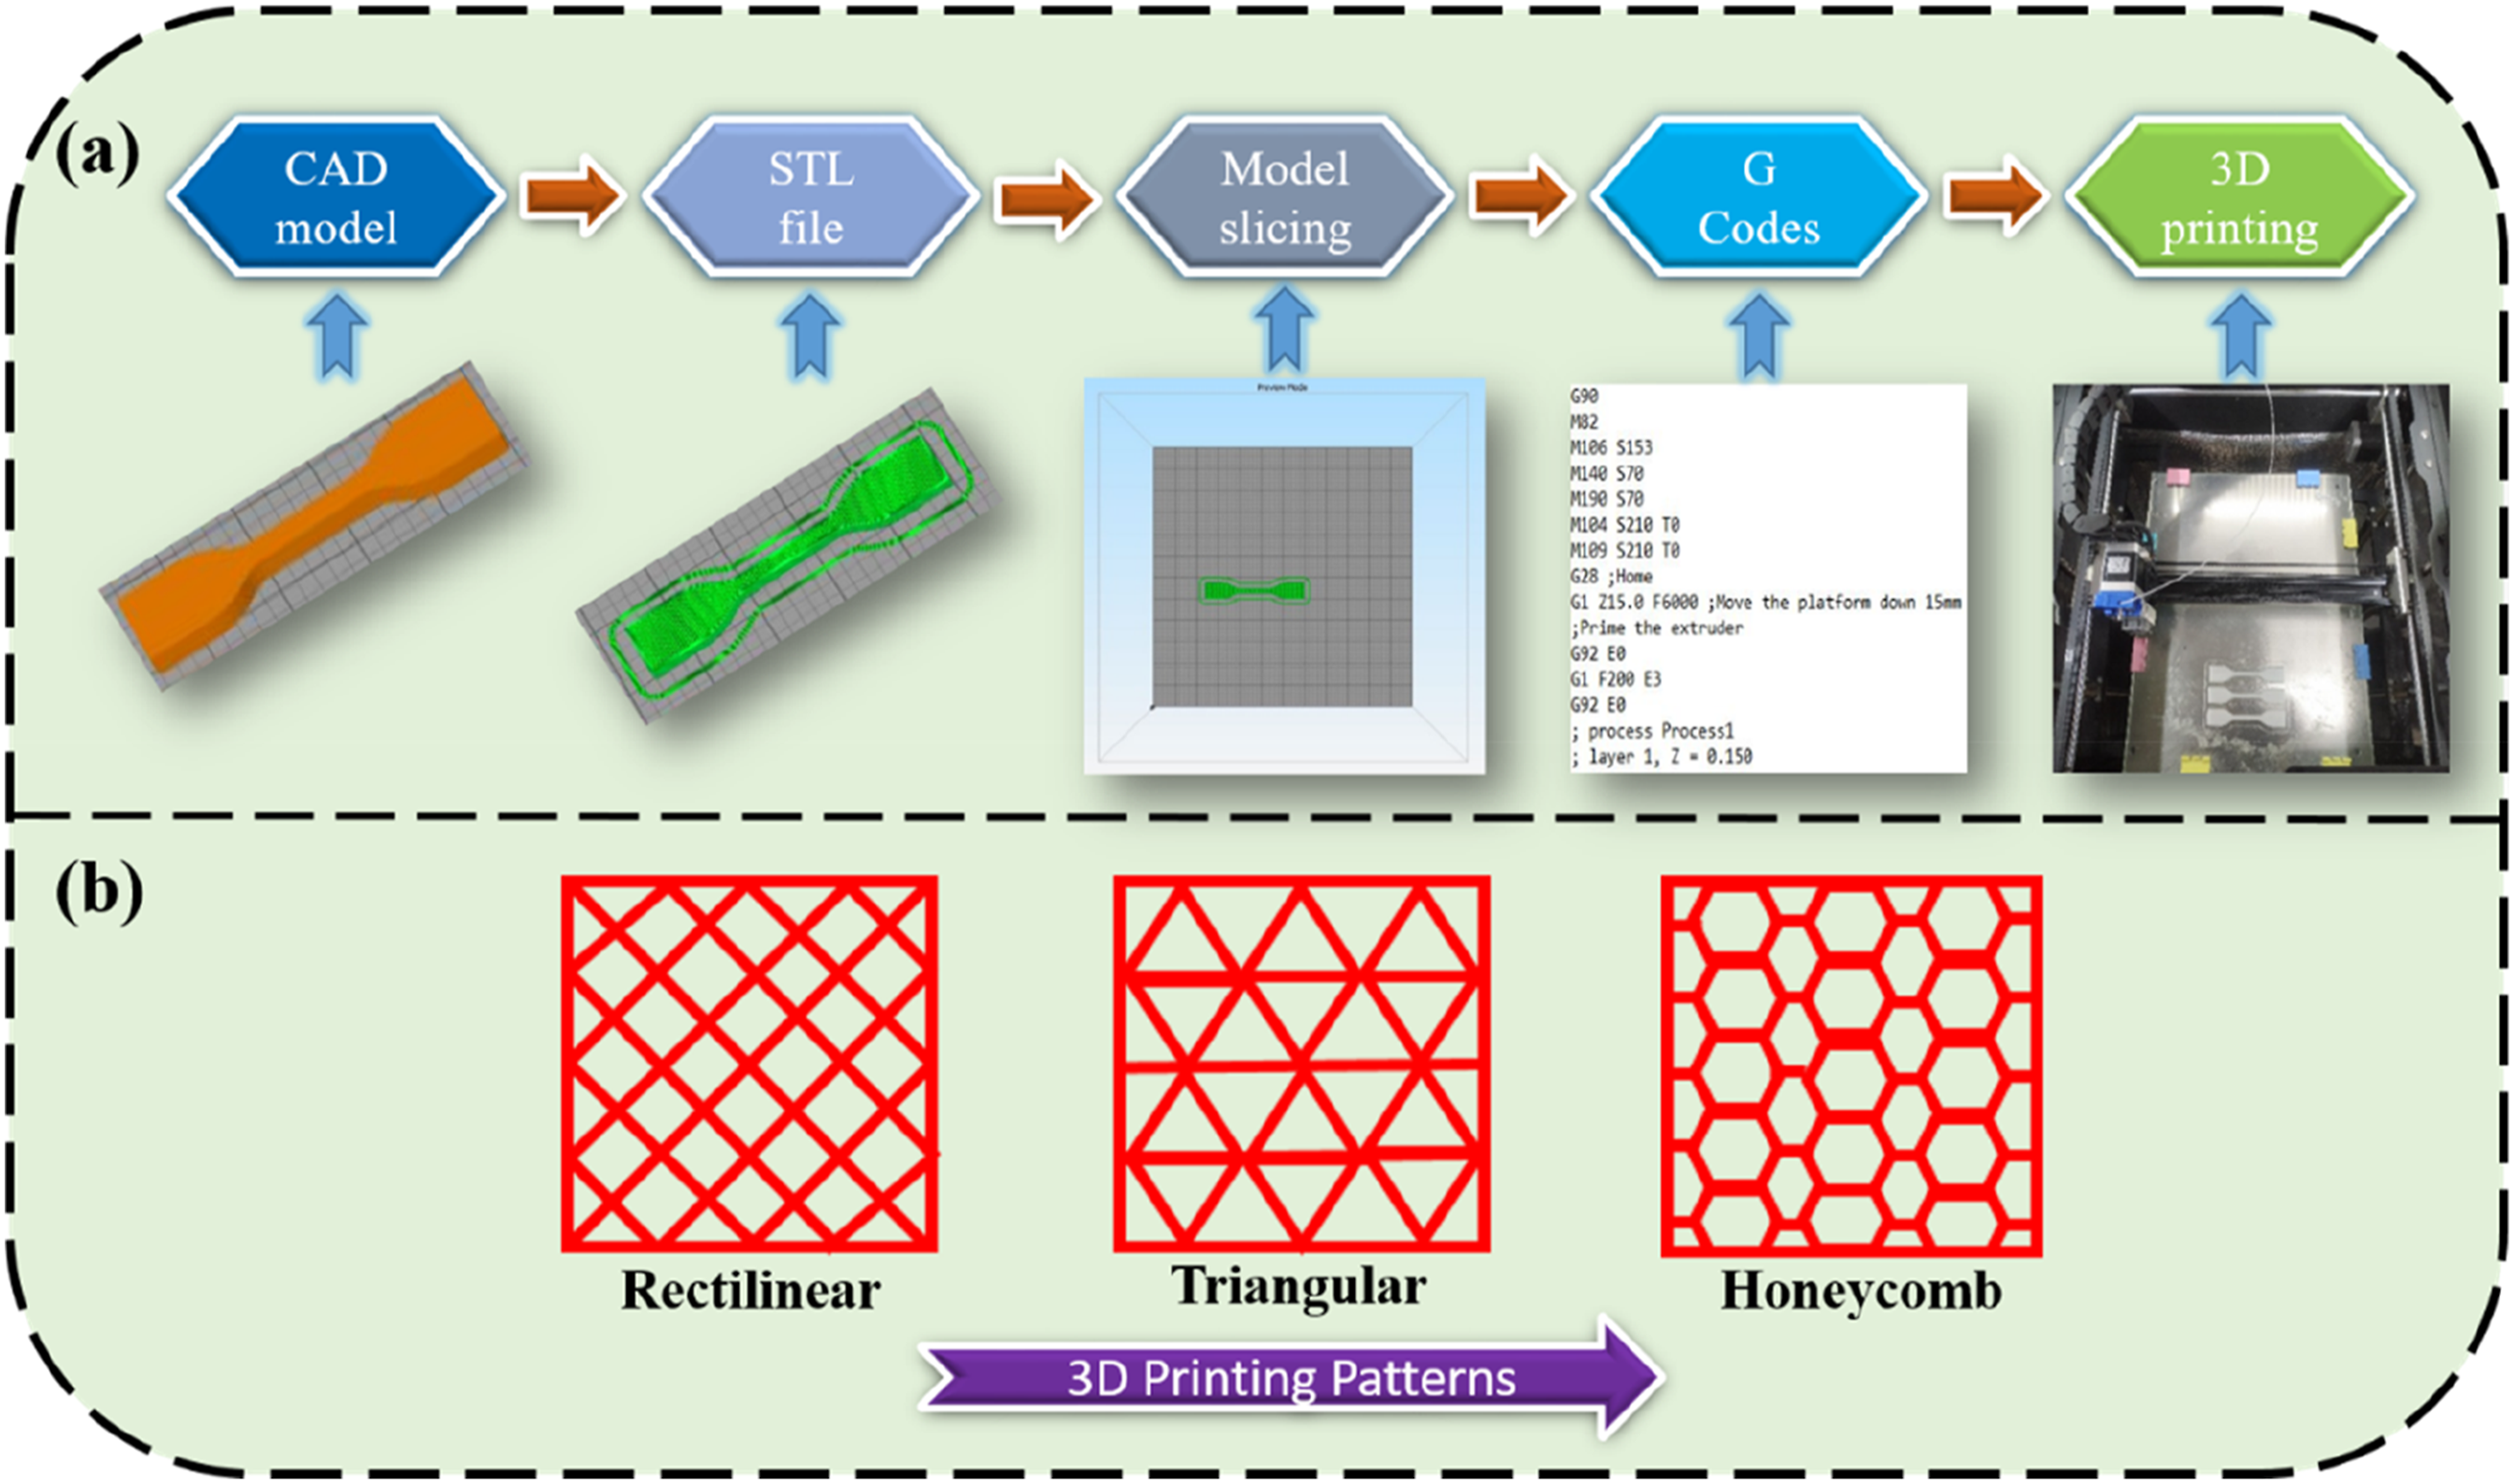
Testing and Characterization
Density and Void Fraction
Typically, the characteristics of Fused Deposition Modeling (FDM) printed 3D materials are not yet completely extinguishable as compared to compression and injection molding techniques because of more porosity and dimensional instabilities. The main parameters responsible for these voids are thermodynamic factors, contact angles, phase transformations, and spreading orientation. 22 In this context, an analysis has been done to calculate the void fraction through the density values by considering both theoretical and experimental readings. The gravimetric buoyancy method, which applies Archimedes principle by taking into account weight in liquid and air media, was used to get the experimental density (ρe) results. 23 Whereas the theoretical density (ρe) was calculated with the consideration of both wollastonite and polylactic acid densities. The variations of these densities give rise to the voids fraction (V%). 24
Mechanical Testing
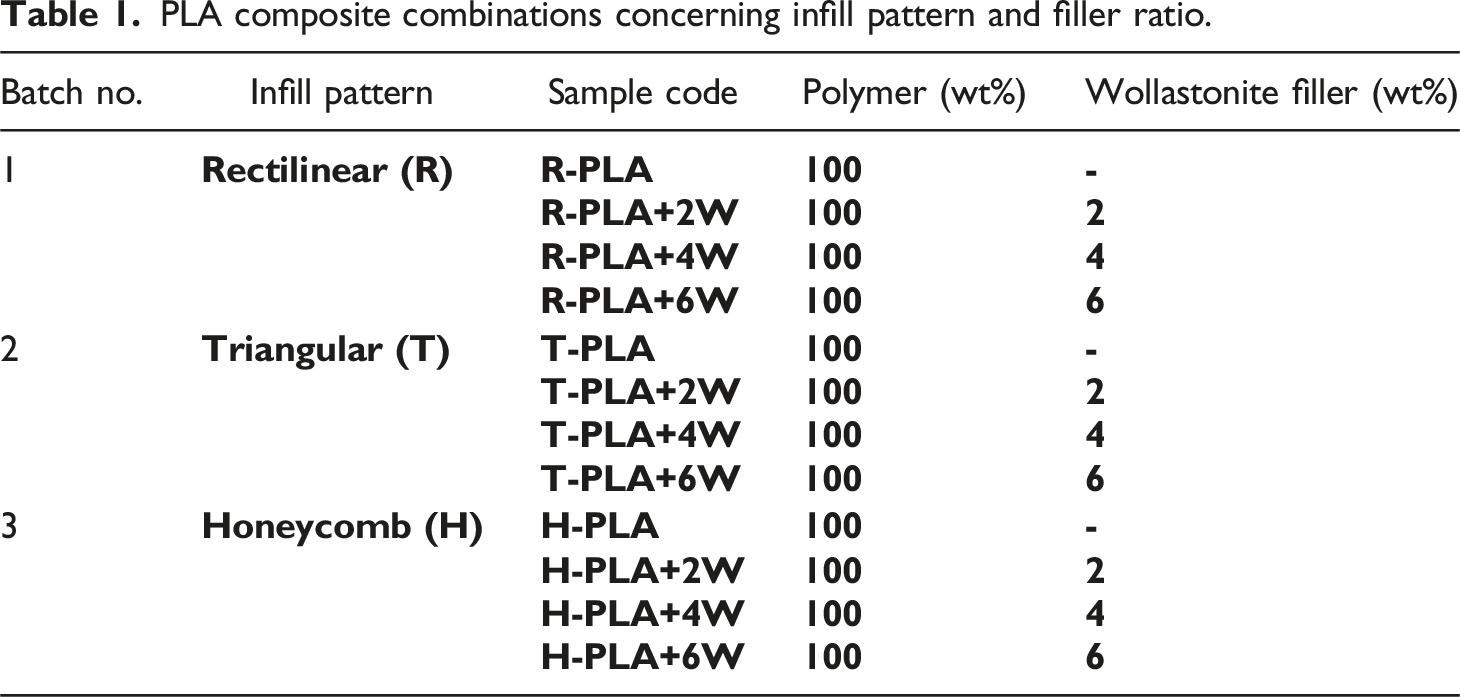
As per the research plan, this study mainly focused on the effect of infill pattern and wollastonite filler concentration on the mechanical properties of 3D printed PLA composites. Mechanical tests like tensile test, flexural test, impact test, and hardness were done for both neat and composite PLA samples. The tensile and flexural tests were conducted in a Universal Testing Machine (UTM-10 kN limit) according to ASTM D638-IV and ASTM D790 standards with a crosshead speed of 3 mm/min and 5 mm/min respectively. The 3D-printed tensile and flexural specimens are shown in Figure 4(a) and (b) respectively. The load v/s displacement plots were obtained from both tensile and flexural tests, which are being used for the calculation of stress v/s strain plots. The stress values were calculated at each point by considering the force at that moment with respect to area. Whereas the strain values were calculated by recording the dimensional change with respect to original dimension. The impact test was conducted the analyze the energy absorption by the specimen under the impact load using a Zwick/Roell impact tester having a 5.5 J pendulum. The ASTM D256 standard was utilized for the test, and the specimen images are shown in Figure 4(c). The impact strength was calculated by dividing the energy absorption by the sample to its crossectional area. To avoid the effect of manual errors on the testing, a minimum of three trials were conducted for each kind of sample. Since it is a polymer material, the Shore-D (Rex OS-1) durometer was utilized to record the hardness number at the different locations of the samples. For each type of material, the 10 readings were recorded and the mean value was considered for comparison purposes. 3D printed neat and composite testing samples: (a) Tensile, (b) Flexural, and (c) Impact.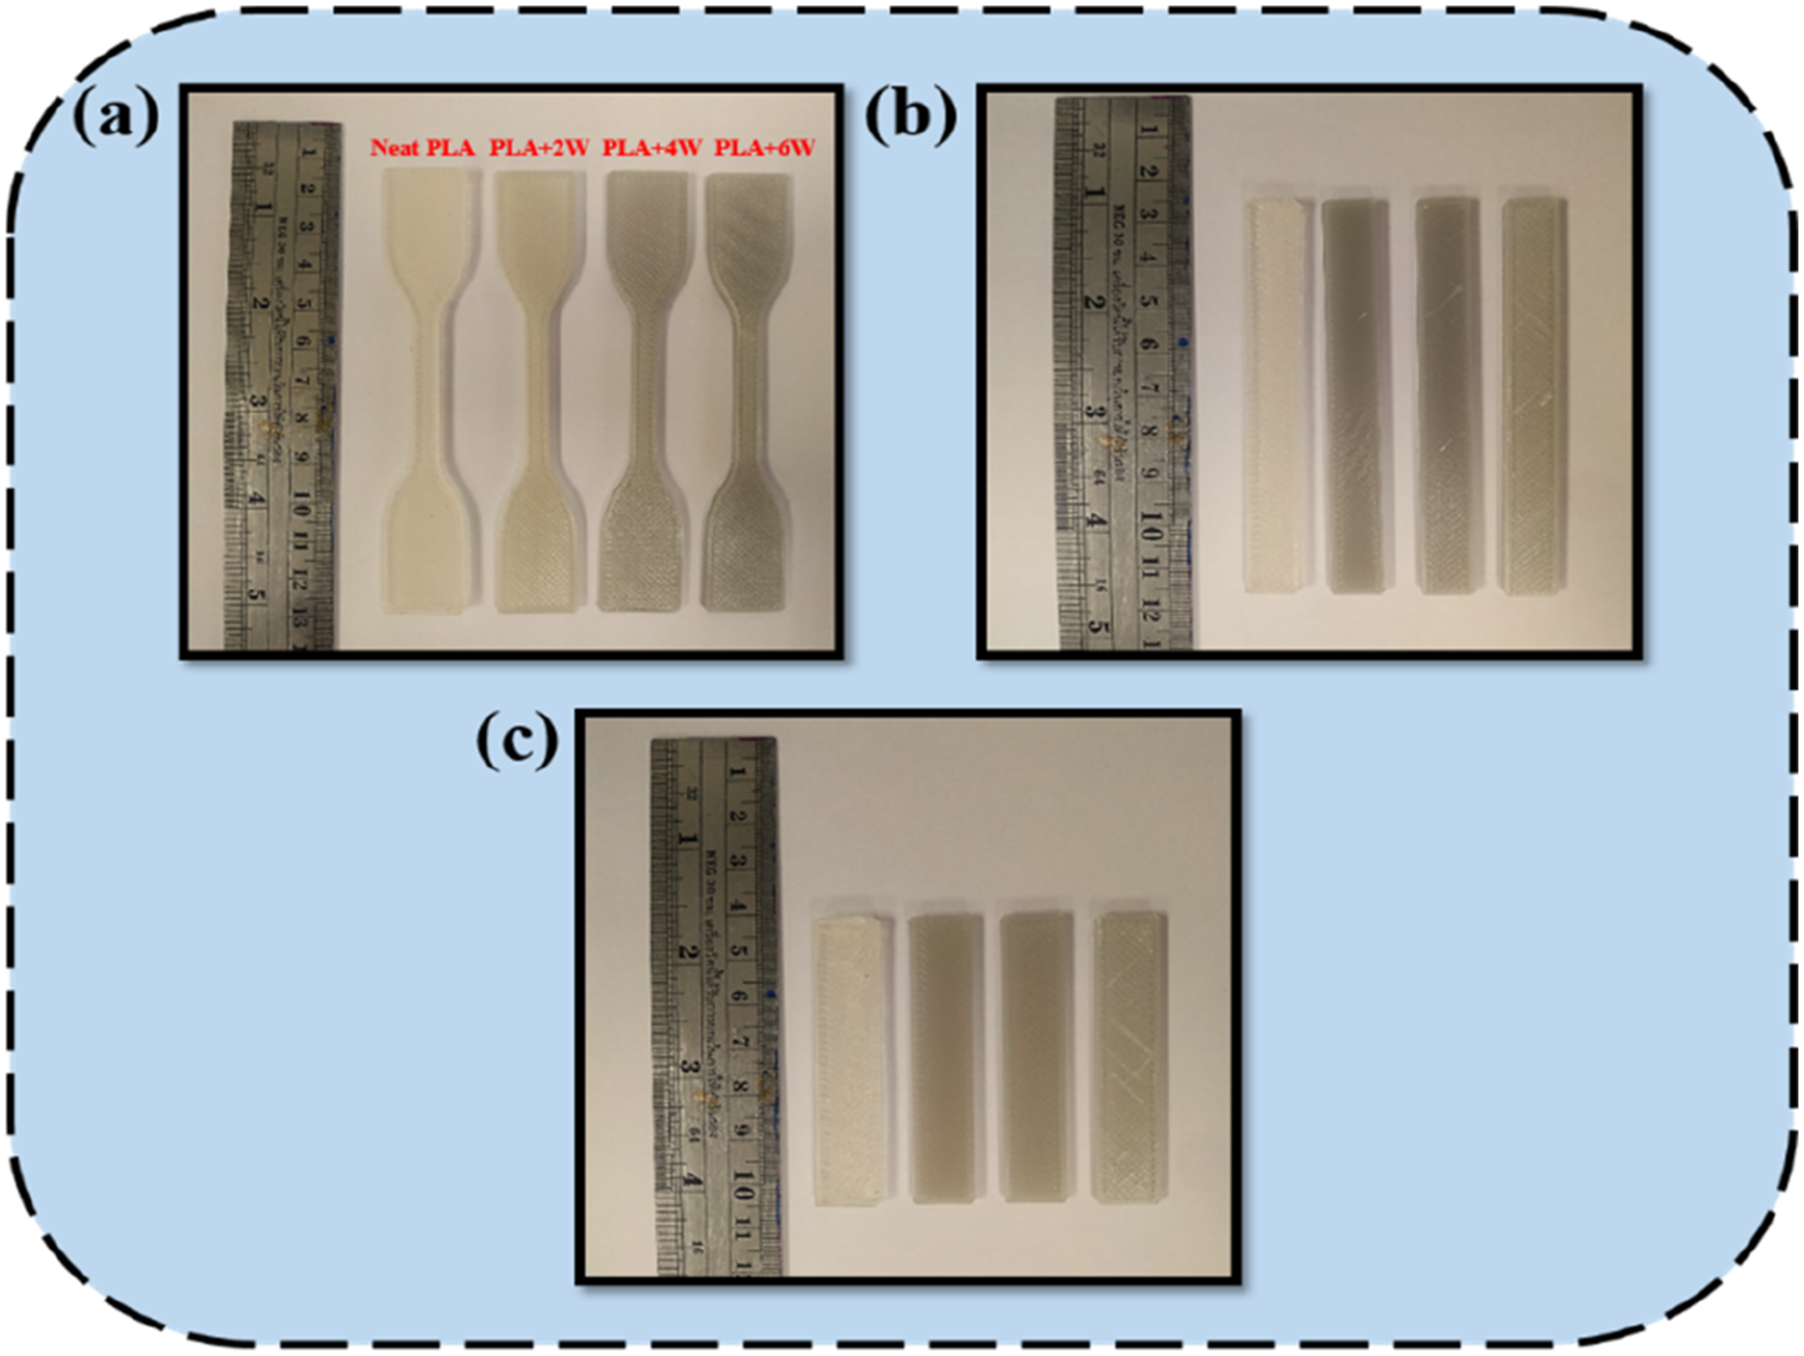
Morphology Analysis
The tensile fractured morphology of composite samples was analyzed using Scanning Electron Microscopy (FEI Quanta 450) equipment. Before the analysis, the gold sputtering was done on the fractured edges to ensure good conductivity and to get high-resolution images. The sputtering was done for 50 seconds using plasma technology. The comprehensive pictures from the SEM study were essential for establishing a correlation between the mechanical performance and the microstructural properties of the composite.
Results and Discussions
Density and Void Fraction
Theoretical densities, experimental densities, and void percentage of composites.
R-Rectilinear, T-Triangular, H-Honeycomb.
Mechanical Properties
Tensile Properties
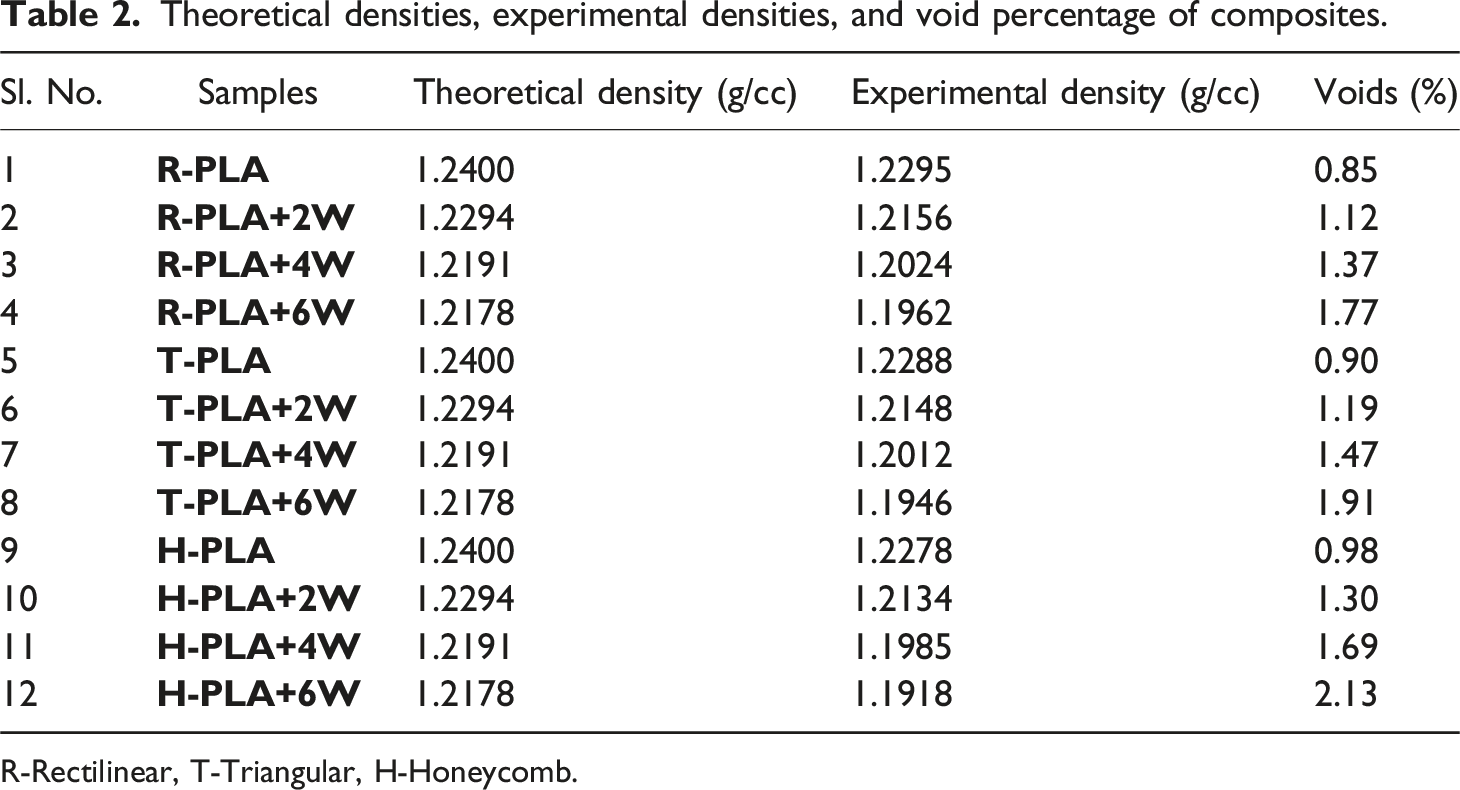
Figure 5 shows the evolution of tensile stress-strain plots for the neat PLA and PLA/wollastonite composites concerning three infill patterns. The graphs reveal that there is a significant impact of infill pattern on the slope of stress-strain curves about modulus of elasticity. The graphs also suggest that the observed stress values are maximized for every sample at the yielding point; as a result, the resulting yield strength measurements are always the same as the ultimate tensile strength. Among these three patterns, the triangular infill pattern printed samples have shown a maximum stress value and the rectilinear pattern exhibited the lowest stress withstanding ability. This might be because trigonal unit configurations have more serrated cycles than rectilinear structures. Also, the triangular infill pattern units have higher stiffness and lower ductility than honeycomb structure units.
33
The curves in Figure 5(c) present a slightly ductile fracture with a prolonged strain rate due to inherent honeycomb structures. The strain region between 0.04 and 0.08 was where the stress-strain curves were serrated following the initial strut rupture. This similar behavior can also be found with rectilinear patterns (Figure 5(a)), especially for PLA+4W and PLA+6W composite samples. Whereas the triangular pattern samples exhibited brittle fracture after reaching the peak value with a reduced strain rate. The common observation in all three graphs is that the 6 wt% wollastonite filler reinforced PLA composite withstands maximum stress than other combinations. In a different aspect, the continuous slope in all these curves owing to the PLA matrix broke, whereas the further variations in slope attributed to the presence of filler particles.
34
It is clear from the plot that there a ductile to brittle transitions in most of the samples due to stress concentration developments concerning both infill structure and filler ratio. The curvature of every infill pattern demonstrated that breaking happened right after the final tensile strength was attained. According to Saniman and team
35
study, the rectilinear 3D printed PLA samples withstand more stress than the other infill patterns such as honeycomb, concentric, octagram spiral, and Hilbert pattern. They discovered that, because PLA thermoplastic is thought to have a low Young’s modulus, there is no obvious linear elastic area at the beginning of the curves. Also, they found the common behavior of immediate fall of stress after the ultimate failure has been reached irrespective of the infill pattern. Such behavior, independent of infill patterns, suggests that PLA thermoplastics have minimal ductility at ambient temperature. This exceptional ductility has two causes. First off, cracks that begin at failure sites and spread quickly across the body’s cross-section are a common occurrence in inhomogeneous bodies, such as injection-molded samples. However, because of the restricted interfacial contact, the propagating fractures only lead to filaments within the 3D printed sample breaking; they are less likely to spread to the nearby ones. From a second point of view, the less adhesion of reinforcement with the matrix also causes rapid failure within the composites.
36
In this work, the first reason seems to be appropriate for the ductile behavior in most of the composite specimens. Another intriguing study done by Dou and team
37
demonstrated that when the composites are printed at low layer height, there is a possibility of proper alignment and incorporation of fiber/filler particles at each layer that contributes to maximum stress value. The study was conducted from 200 to 400 microns layer height. In the current research work, the layer height maintained was 150 microns, hence it is one of the main reasons for attaining the maximum stress in 6 wt% loaded PLA samples as shown in Figure 5(a)–(c). Tensile stress v/s strain plots of neat PLA and PLA/wollastonite composites with different infill patterns: (a) Rectilinear (R), (b) Triangular (T), and (c) Honeycomb (H).
Figure 6(a) and (b) reveal the average tensile strength and tensile modulus of the neat PLA and PLA/wollastonite composites concerning different infill patterns. Because of their great consistency and reproducibility, the error bars show the standard deviation of the calculated tensile strength, which is lower for all infill designs. It can be seen in Figure 6(a) that the triangular pattern exhibits maximum ultimate tensile strength (UTS) 55.24 MPa followed by honeycomb (52.4 MPa) and rectilinear (50.22 MPa) patterns at 6 wt% wollastonite reinforced PLA composites. Its interior mesostructure, which features numerous crossings of two layers in opposite directions, is responsible for the triangular infill pattern’s strength and high-stress tolerance at the fewest materials possible. The honeycomb infill structure, in contrast, used an extensive amount of material that was focused at the nearby borders with lots of empty areas in between since it was made up of hexagonal geometries next to one another is responsible for low UTS as compared to triangular pattern.
35
Even Khan and team
37
also reported that the rectilinear pattern for PLA exhibited the maximum UTS as compared to concentric and honeycomb structures. According to their assessment, using honeycomb is not recommended because it wastes materials. With the interest of filler ratio, the increment of filler loading from 2 to 6 wt% in all the infill patterns has shown positive UTS values and is comparatively higher than the neat PLA sample. The addition of 2, 4, and 6 wt% wollastonite into rectilinear pattern PLA has increased the UTS values by 8.94%, 14.07%, and 18.19% respectively. Whereas the reinforcement of 2, 4, and 6 wt% wollastonite into triangular pattern PLA has increased the UTS values by 6.05%, 11.16%, and 18.10% respectively. Also, the reinforcement of 2, 4, and 6 wt% wollastonite into honeycomb pattern PLA has increased the UTS values by 6.08%, 12.08%, and 17.67% respectively. This increment in UTS concerning filler ratio is owing to the lower filament layer thickness, which promotes the proper and well-organized distribution of fillers at each printed layer that supports good interfacial adhesion and effective transfer of stress at each layer. Conversely, when it comes to patterns, it is quite difficult to compare the triangular with the honeycomb pattern. This is because, despite the specified filling percentage of 100, rasters might not bond in numerous places, and as a result, the process of nozzle movements and raster deposits prevents a full bonding among the rasters in the honeycomb structure.
38
Even Ali and team
39
also reported that the better potentiality of triangular infill lattice structure boosted the tensile strength of 3D printed carbon/nylon composites. They discovered that contrary to hexagonal and rectangular infill patterns, a robust lattice structure and fewer vacancies led to increased bond formation, which in turn produced better tensile strength in triangular infill composites. The triangular patterns have the strongest inherent shape of triangles, according to Tandon et al.,
40
and this geometric structure is the least likely to distort and offers the greatest supporting structure. When it comes to the strength comparison among the rectilinear and honeycomb structures, the rectilinear pattern tops because of its bonding mechanism. Every subsequent layer in the honeycomb design rests upon a layer that is identical to it. Conversely, in the rectilinear sequence, the bonding zone across each layer only matches the locations wherein the filament crosses the filaments of the preceding layer.
41
Also while studying the effect of the pattern, the distance below each sheet plays a major role in determining the UTS value. For instance, ribs may emerge in each direction in a triangular infill pattern, and the strong bonding strength among the prints is higher than in honeycomb and rectilinear patterns, which might cause a higher UTS value. (a) Tensile strength and (b) Tensile modulus of neat PLA and PLA/wollastonite composites with different infill patterns.
The variation of tensile modulus values concerning the wollastonite filler ratio and infill pattern is shown in Figure 6(b). The modulus values are strongly correlated to the stiffness and the reinforcement material. Among all the infill patterns, the triangular pattern possesses a maximum tensile modulus followed by honeycomb and rectilinear patterns. The neat PLA possesses a modulus value of 1816.08 MPa for rectilinear pattern, however, the addition of wollastonite by 2, 4, and 6 wt% to this PLA has enhanced the modulus values by 9.7%, 30.16%, and 38% respectively. Whereas in concern to neat PLA in a triangular pattern (2178.35 MPa), the addition of fillers by 2, 4, and 6 wt% gives an improved modulus value of 6.34%, 12.06%, and 20.77% respectively. Moreover, in concern with honeycomb pattern PLA (2059.23), there is a significant rise in modulus by 2.82%, 16.18%, and 25.27% respectively for 2, 4, and 6 wt% filler loading. The increment in modulus for triangular patterns has three main reasons. The first explanation is that the neat and composite samples with triangular infill structures were less ductile and stiffer than the ones with rectilinear patterns and hexagonal units. 33 This can be easily verified with the stress-strain plots shown in Figure 5. The second reason is the addition of wollastonite fillers, which are stiffen in nature and reduce the ductility of the reinforced polymers. Hence, the modulus values are found to be uplifted by increasing the filler ratio. Thirdly, the beam hypothesis was the cause for the increased tensile modulus of composite constructions with triangular infill patterns. 42 This modulus and deformation can also explained with the interest of geometric properties, failure modes, and manufacturing aspects. One of the predictable elements for failures and strain modes was the infill pattern. It is mostly the result of printed path flaws. The breakdown of triangular-unit composite constructions began at an internal node and spread to adjacent internal nodes. Overlapping printing routes might have resulted in manufacturing flaws that led to the start of internal node failure. 33 Hence, there is less strain on these structures. Whereas, the failures in honeycomb structures begin from the circumstantial walls and experience more strain rate with a reduced tensile modulus value. Similarly, Moradi and team 43 also studied the effect of different infill patterns over the modulus of 3D-printed PLA composites. Their results show that the triangular pattern exhibited the highest Young’s modulus than rectilinear, honeycomb, grid, and wiggle patterns. According to their report, a triangular pattern is a two-dimensional grid composed of triangles that exhibits great resistance and strength when a vertical force applies to the material’s surface. Honeycomb and rectilinear structures vary greatly in their deposition trajectories and, as a result, in the interstitial bonding zones. This could justify the elastic modulus discrepancy. 41 Most importantly, the higher stiffness of an inorganic wollastonite filler and uniform distribution at each printed layer has contributed more to the improvement of the tensile modulus of PLA polymer irrespective of the infill patterns following the filler ratios.
Flexural Properties
Figure 7 shows the flexural stress-strain behavior of neat PLA and wollastonite-reinforced PLA composites considering different infill patterns. It is observed that there is no sharp drop in the curves after reaching the threshold stress value, instead prolonged elongation is seen concerning all three patterns. Usually, in all the infill structures, the thin walls first undergo elastic deformation as the bending stress rises. But because of their thinness and intricate geometry, they eventually hit a crucial buckling barrier. When this threshold is crossed, the cell walls crumple or collapse locally, which significantly lowers their ability to support loads and eventually causes structural failure.
44
A staircase-like behavior was also seen in several of the curves, which was explained by the struts gradually breaking down. Among all the patterns, the maximum bending stress-withstanding ability is shown by the triangular pattern due to the strong structures of the triangular elements and effective tangential stress transfer ability at the successive layers. To put it simply, the primary cause of this improvement is the axial strut of the triangular lattice filling. When it comes to the triangular bending phenomenon, the combined effect of axial struts stretching and bending action of the inclined struts at the junction area plays a dominant role. A linear regime is depicted in the triangle pattern, accompanied by a plateau of roughly constant stress until the specimen breaks.
45
The presence of high node connectivity in the triangular pattern is the main reason for its best performance.
45
There is continual yielding before failure in a rectilinear pattern, and neither the yield point nor the threshold point, nor the necking, can be precisely defined. Even though the honeycomb has a more infill wall, the voids present inside the lattice structure minimize the bending stress withstanding capability where more force is being concentrated at the infill walls of the structure. In correlation to this study, Gebrehiwot and team
46
compared the stiffness geometry in the 3D printed PLA samples with different patterns. They discovered that the beams with the triangle stiffener show signs of brittleness, breaking after 2.53 mm of deviation in comparison to square, wiggle, and diamond structures. In a similar way as depicted in Figure 7(b), there is not much yielding in the curves of triangular patterns and most of them experienced brittle failure. In a comparative study, Kesavarma
47
also proved the better flexural properties of 3D printed copper-reinforced PLA composites in rectilinear patterns than the honeycomb, concentric, and grid structures. When it comes to the effect of reinforcement, the filler reinforcement of a maximum of 6 wt% attained the maximum stress value irrespective of the infill patterns. The inherent stability, mechanical integrity, and resistance offered by these fillers inside the composites are responsible for these improvements. The curves PLA+6W and PLA+2W offer unique behavior after reaching the threshold stress value in a sinusoidal mode. The reason might be that the composite does not fail immediately after applying the bending force. The successive delamination failure at the printed layers
48
is responsible for absorbing the load even after reaching the threshold stress. Hence, the curve does not experience a tangential drop; instead, it carries some stress before complete breakdown. Flexural stress v/s strain plots of neat PLA and PLA/wollastonite composites with different infill patterns: (a) Rectilinear (R), (b) Triangular (T), and (c) Honeycomb (H).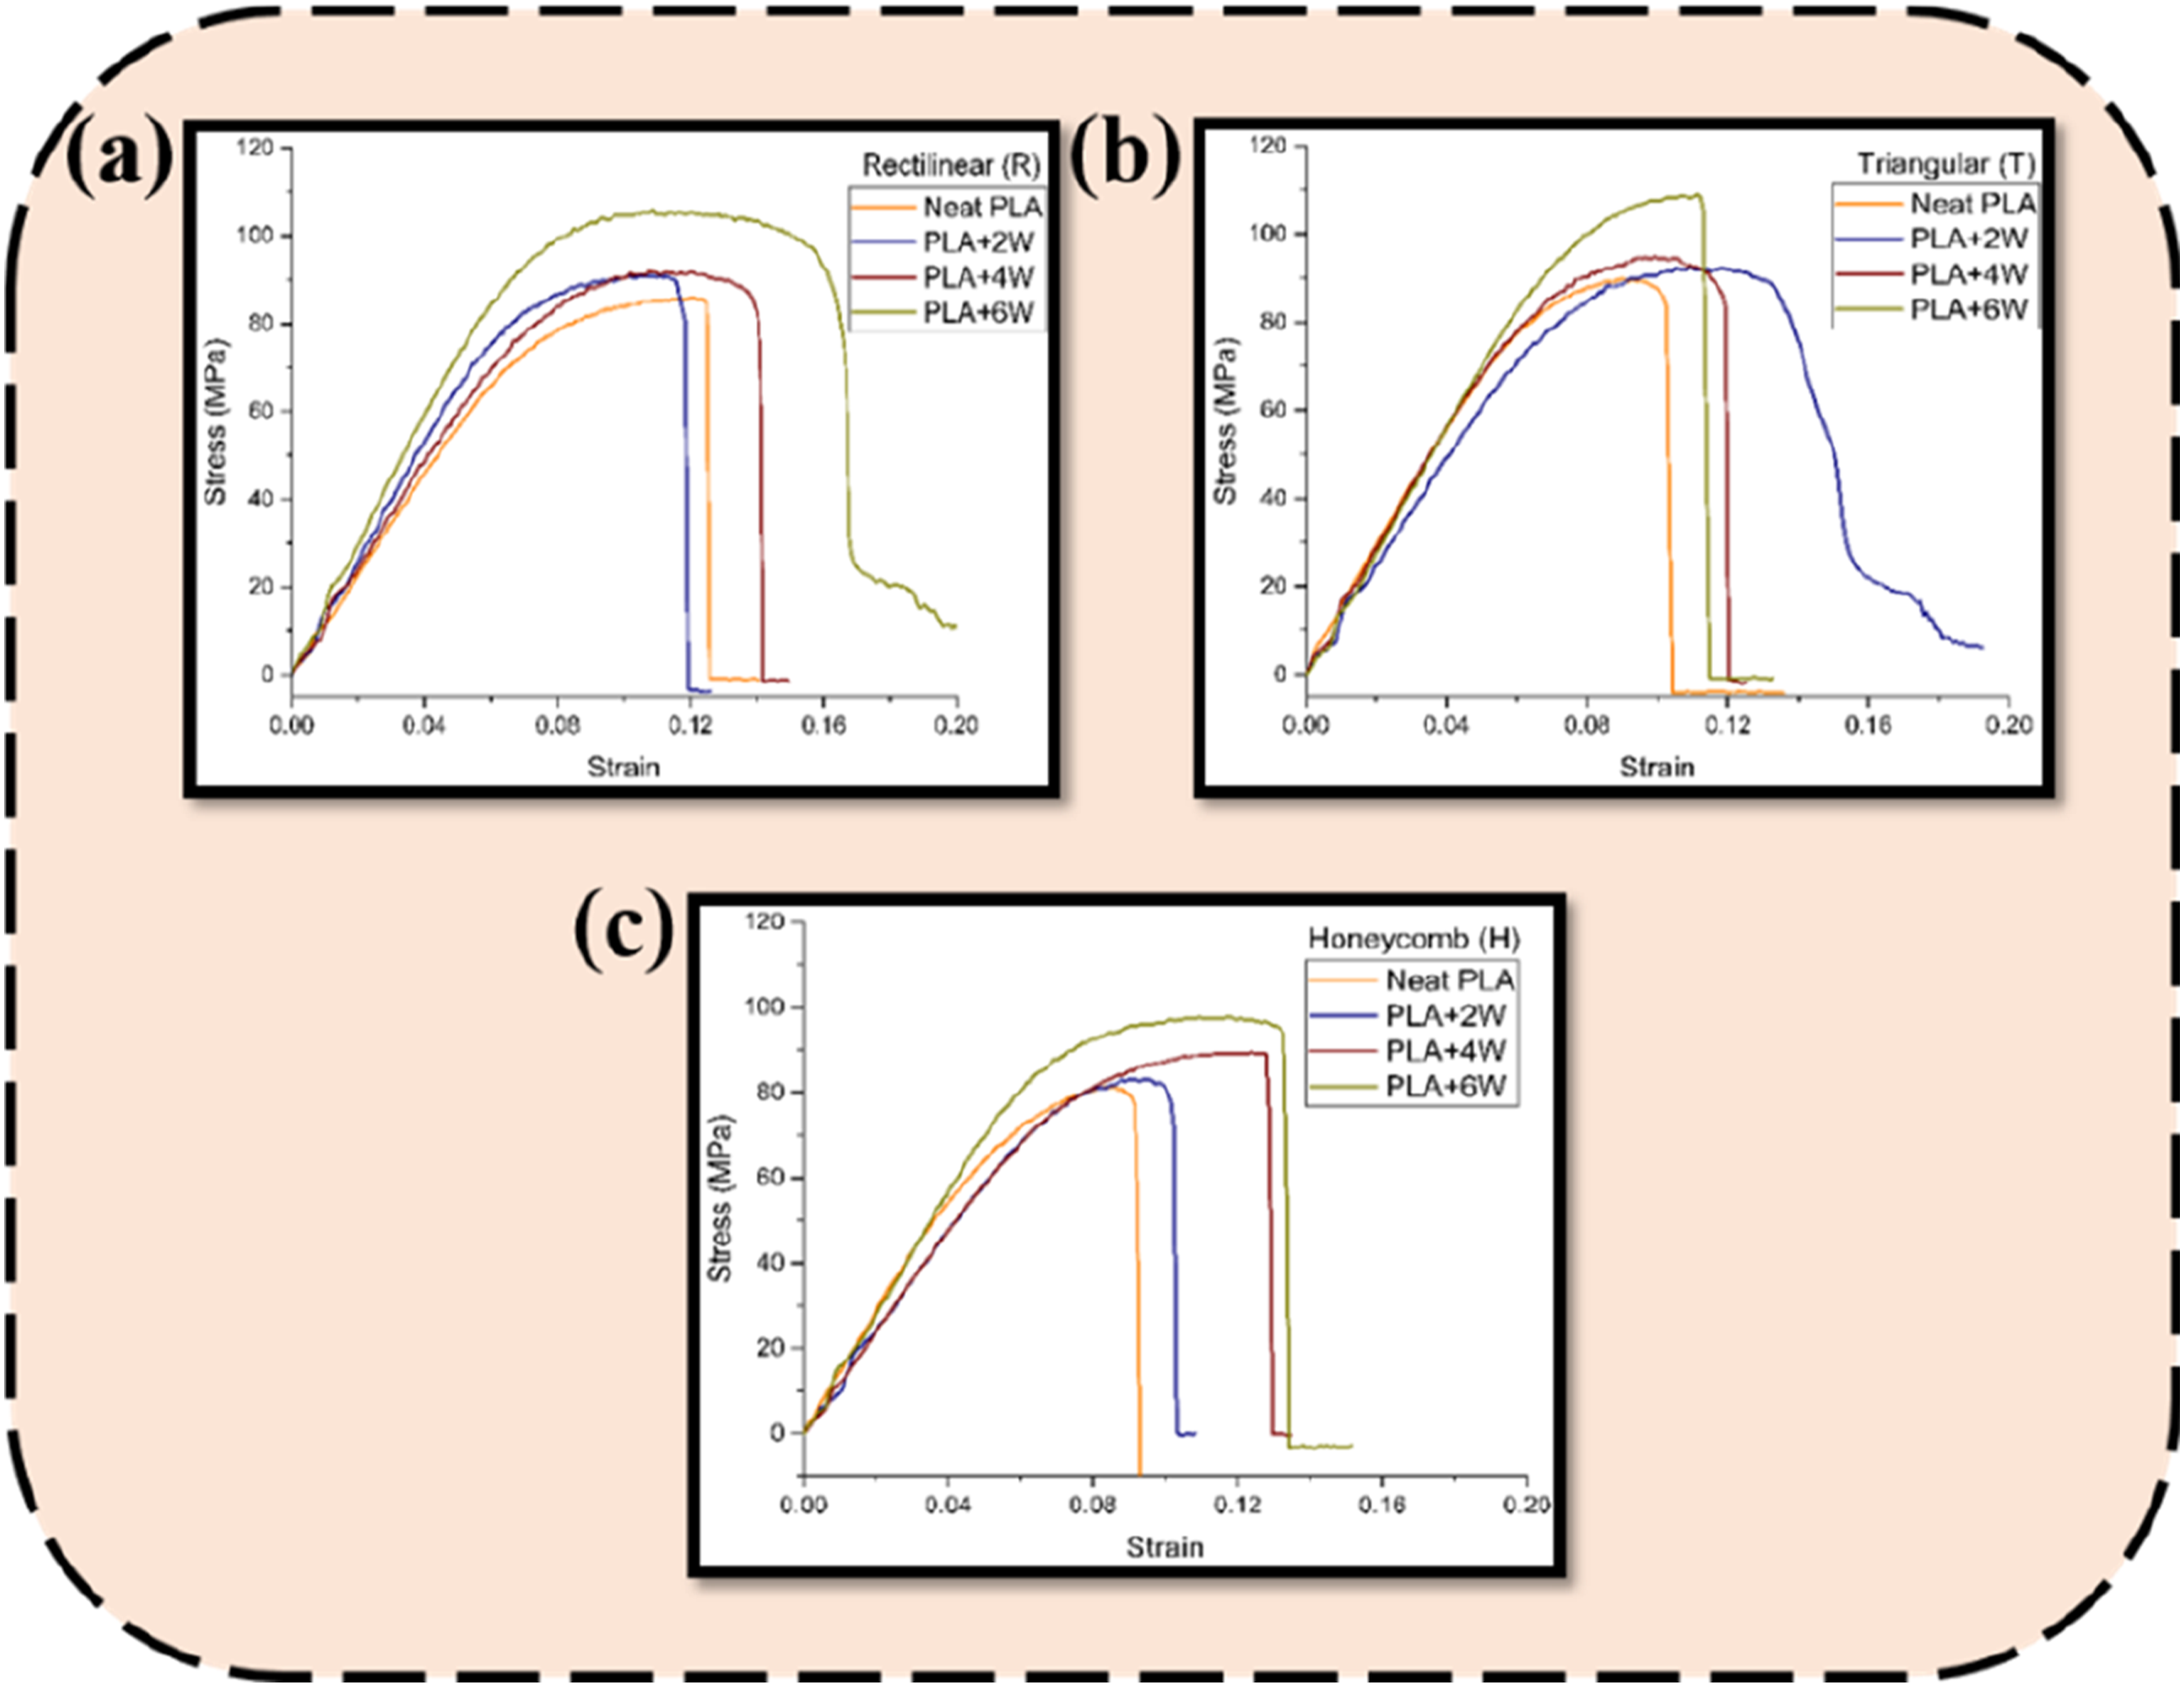
Following the three-point bending method, the flexural strength has been calculated along with error bars for 3D printed neat PLA and PLA/wollastonite composites and is shown in Figure 8(a). Among the three infill patterns, the triangular pattern samples have more flexural strength than rectilinear and honeycomb infill patterns. The neat PLA having a rectilinear pattern has obtained an 85.28 MPa of flexural strength value, whereas upon the addition of 2, 4, and 6 wt% of wollastonite filler the strength got elevated by 5.87%, 7.91%, and 23.81% respectively. The phenomenon of increment in flexural strength upon the addition of filler has also continued for triangular patterns. The neat PLA with a triangular pattern possesses a value of 90.35 MPa, whereas the 2, 4, and 6 wt% addition has shown elevated values of 93.05 MPa, 95.52 MPa, and 106.04 MPa respectively. There are not many variations in the values obtained between rectilinear and triangular pattern samples. However, the honeycomb structured samples have a serious reduction in flexural strength of neat PLA (80.9 MPa), PLA+2W (82.94 MPa), PLA+4W (89.54 MPa) and PLA+6W (97.74 MPa) samples. As mentioned in the tensile properties, the triangular infill structures are highly stiffen in nature, and less ductile, and hence they can withstand more bending stress resulting in higher flexural strength values. Conversely, the failure started from one side of the perimeter wall for the composites that included hexagonal units in the honeycomb structures, which is mainly responsible for lower flexural strength. The perimeter wall deforming more than the cell edges and the hexagonal unit’s cellular joints having fewer flaws than the triangular unit’s respectively may have caused this failure.
33
As identified in the density test, more voids are present in the honeycomb samples. The lightness and the development of ridges are visible signs of localized yielding, also known as crazing. One characteristic of crazing is interconnected voids present inside the structures, which eventually lead to filament microcracking and macro-cracking failure with even more propagation. In addition to directly influencing the strength value, voids among layers and the weakest bonds have an impact on the crack propagation route.
49
In addition, these voids are responsible for the discontinuity in the matrix material and cause ineffective stress transfer inside the composites.
50
Considering all these factors, the honeycomb structure samples have the lowest flexural strength values of the other two patterns. Because of its dense interior structure formation and possible reinforcing mechanisms inside the infill pattern, the rectilinear pattern, which follows a triangle pattern, demonstrates a greater flexural strength than the honeycomb pattern. A literature report by Dubey and team
29
demonstrated the effect of infill pattern on the 3D printed short CF-reinforced nylon composites. They have obtained flexural strengths in the order of 23.45 MPa, 20.91 MPa, and 15.11 MPa respectively for triangular, rectilinear, and honeycomb patterns. These reported results on the infill patterns effect agree with the current research work. Another reason is that the triangular and rectilinear patterns possess fewer voids than the honeycomb structures. These fewer voids provide the material with a more solid and continuous network, which improves its ability to withstand deformation when the bending stresses are applied. Because of the improved stiffness, a higher force is needed to accomplish the same displacement with this improved structural integrity.
44
When it comes to the effect of fillers, the contribution is upheld as shown in the flexural strength column plot. The good compatibility of the filler through mechanical interlocking at the successive layer and proper dispersion within the filament is responsible for resisting the bending stress of the PLA composites while increasing the filler concentration.
51
(a) Flexural strength and (b) Flexural modulus of neat PLA and PLA/wollastonite composites with different infill patterns.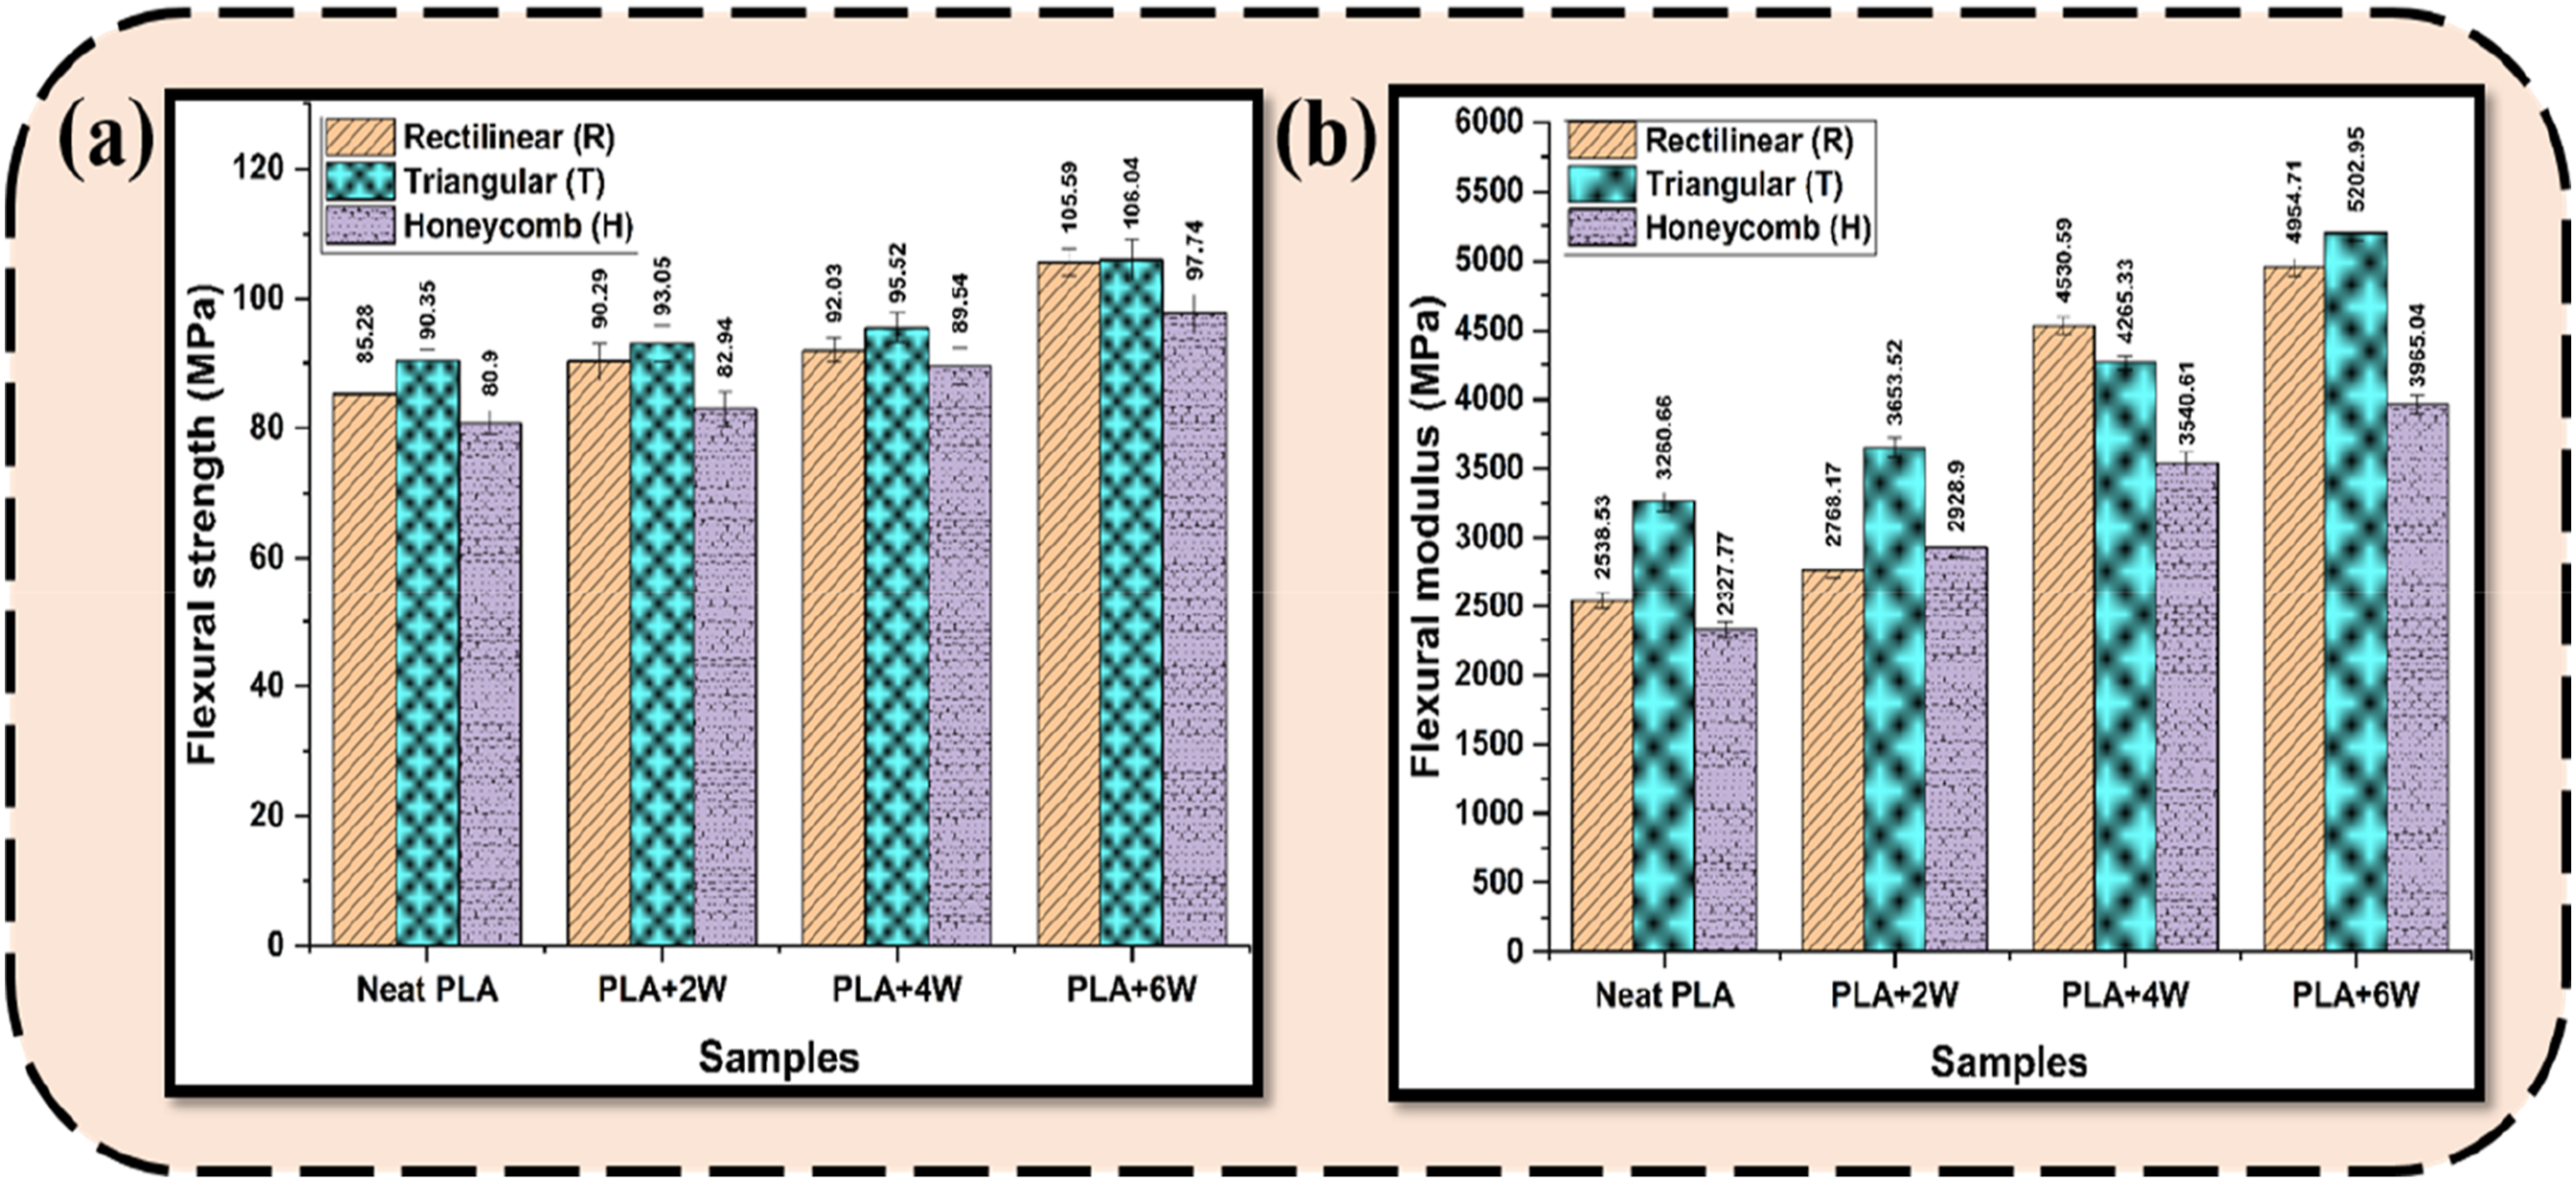
The effect of infill pattern and wollastonite filler concentration on the flexural modulus of PLA polymer is provided in Figure 8(b). Irrespective of all infill patterns, the flexural modulus values are considerably improved with the increasing reinforcement ratio of wollastonite fillers. These modulus values are not significantly impacted by the inherent defects of the composites like voids, because it is calculated in the elastic region of the stress-strain plot. 38 Here also, the triangular pattern samples obtained the maximum flexural modulus of 5202.95 MPa at 6 wt% filler loading, whereas the neat PLA, PLA+2W, and PLA+6W samples recorded optimum values of 3260.66 MPa, 3653.52 MPa, and 4530.59 MPa respectively. This proved an excellent resistance of infill pattern for deformation against the bending load. This high flexural modulus may be explained by several variables, including the triangle pattern’s superior stiffness and stiffness over other patterns due to its more effective distribution of applied stresses. 29 Whereas the rectilinear pattern attains the second highest flexural modulus following the triangular pattern, which is 2538.53 MPa, 2768.17 MPa, 4530.59 MPa, and 4954.71 MPa respectively for neat PLA, 2 wt%, 4 wt%, and 6 wt% wollastonite reinforced PLA composites. The lowest flexural modulus is recorded with honeycomb infill pattern samples of 2327.77 MPa, 2928.9 MPa, 3540.61 MPa, and 3965.04 MPa respectively for PLA, PLA+2W, PLA+4W, and PLA+6W samples. Because of their less effective distribution of stresses and structural integrity, these patterns have a low flexural modulus. 29 However, the trending phenomenon of increasing modulus with raising filler content is the same for all the patterns. This increment is due to the good interfacial adhesion of filler with the polymer matrix wherein more chances of stress distribution and resistance to the bending action. Another reason might be the orientation of polymer molecules wherein these are aligned in the printing direction that causes more flexural modulus of elasticity in 3D printed samples than in the conventional manufacturing techniques. 52 Also, these filler’s higher stiffness led to the reduction of flexural deformability of these composites. This similar behavior was also reported by Scaffaro and team 53 when the 3D-printed PLA was reinforced with anchovy waste fillers. The flexural modulus has increased as a result of their confirmation that the stress is effectively transmitted between the PLA polymer and the filler. Similarly, the work done by Vidakis et al. 54 also confirms the increment of flexural modulus with the addition of ZnO particles with ABS matrix in a micrometer scale. They found that the particles with a micrometer scale improved the flexural properties by 1.3% than the nanoscales.
Impact Strength
Using pendulum-style Izod impact equipment, impact strength was assessed for pure PLA and PLA/wollastonite composites with various infill patterns of rectilinear, triangular, and honeycomb printed samples. The test results were recorded and presented in Figure 9 along with the error bar. The impact test was mainly conducted to measure the energy needed to break the sample to provide a broad idea of the material’s toughness. Izod is the energy required to completely shatter a specimen as a consequence of both the thickness and the area of the shattered cross-sectional region.
55
Among the three printed patterns, the rectilinear pattern outperformed in energy absorption followed by triangular and honeycomb patterns. The neat PLA with rectilinear printed sample has an impact strength of 2.55 kJ/m2, whereas the reinforcement of wollastonite filler to this PLA by 2, 4, and 6 wt% has shown an improvement impact strengths of 2.89 kJ/m2, 3.01 kJ/m2, and 3.04 kJ/m2 respectively. This resulted from a stronger interfacial interaction between the matrix and filler. Interfacial bonding occurs when the filler and matrix adhere to one another by mechanical keying, resulting in a near between the two surfaces.
55
Subsequently, the impact strengths were found to be reduced for triangular and honeycomb patterns due to flaws and voids present in the composite filaments. The filament is driven out of the nozzle by the 3D printing extruder gear’s incapacity to grasp most likely brought on these voids. These flaws cause a discontinuity among layers when 3D-printed things are added, making them incapable of withstanding impact force.
51
Except for this fact, the strength is found to be increased with the addition of 2, 4, and 6 wt% filler particles by 7.63%, 12.85%, and 13.65% respectively for triangular pattern specimens. Although wollastonite filler also improved toughness in this instance, the improvement was rather slight and consistently fell within the variance limit.
36
The impact strength was increased by the filler particles in the polymer acting as an intermediate to absorb energy and hinder the impact force’s transmission. Similar to these results, Shahar and team
55
also reported in their work that the greater amount of fillers in PLA improved its even distribution stress concentrations inside the composite specimen. Consequently, it was anticipated that the composite’s impact resistance would improve with increasing powder loading inside the matrix. Impact strength of neat PLA and wollastonite/PLA composites concerning different infill patterns.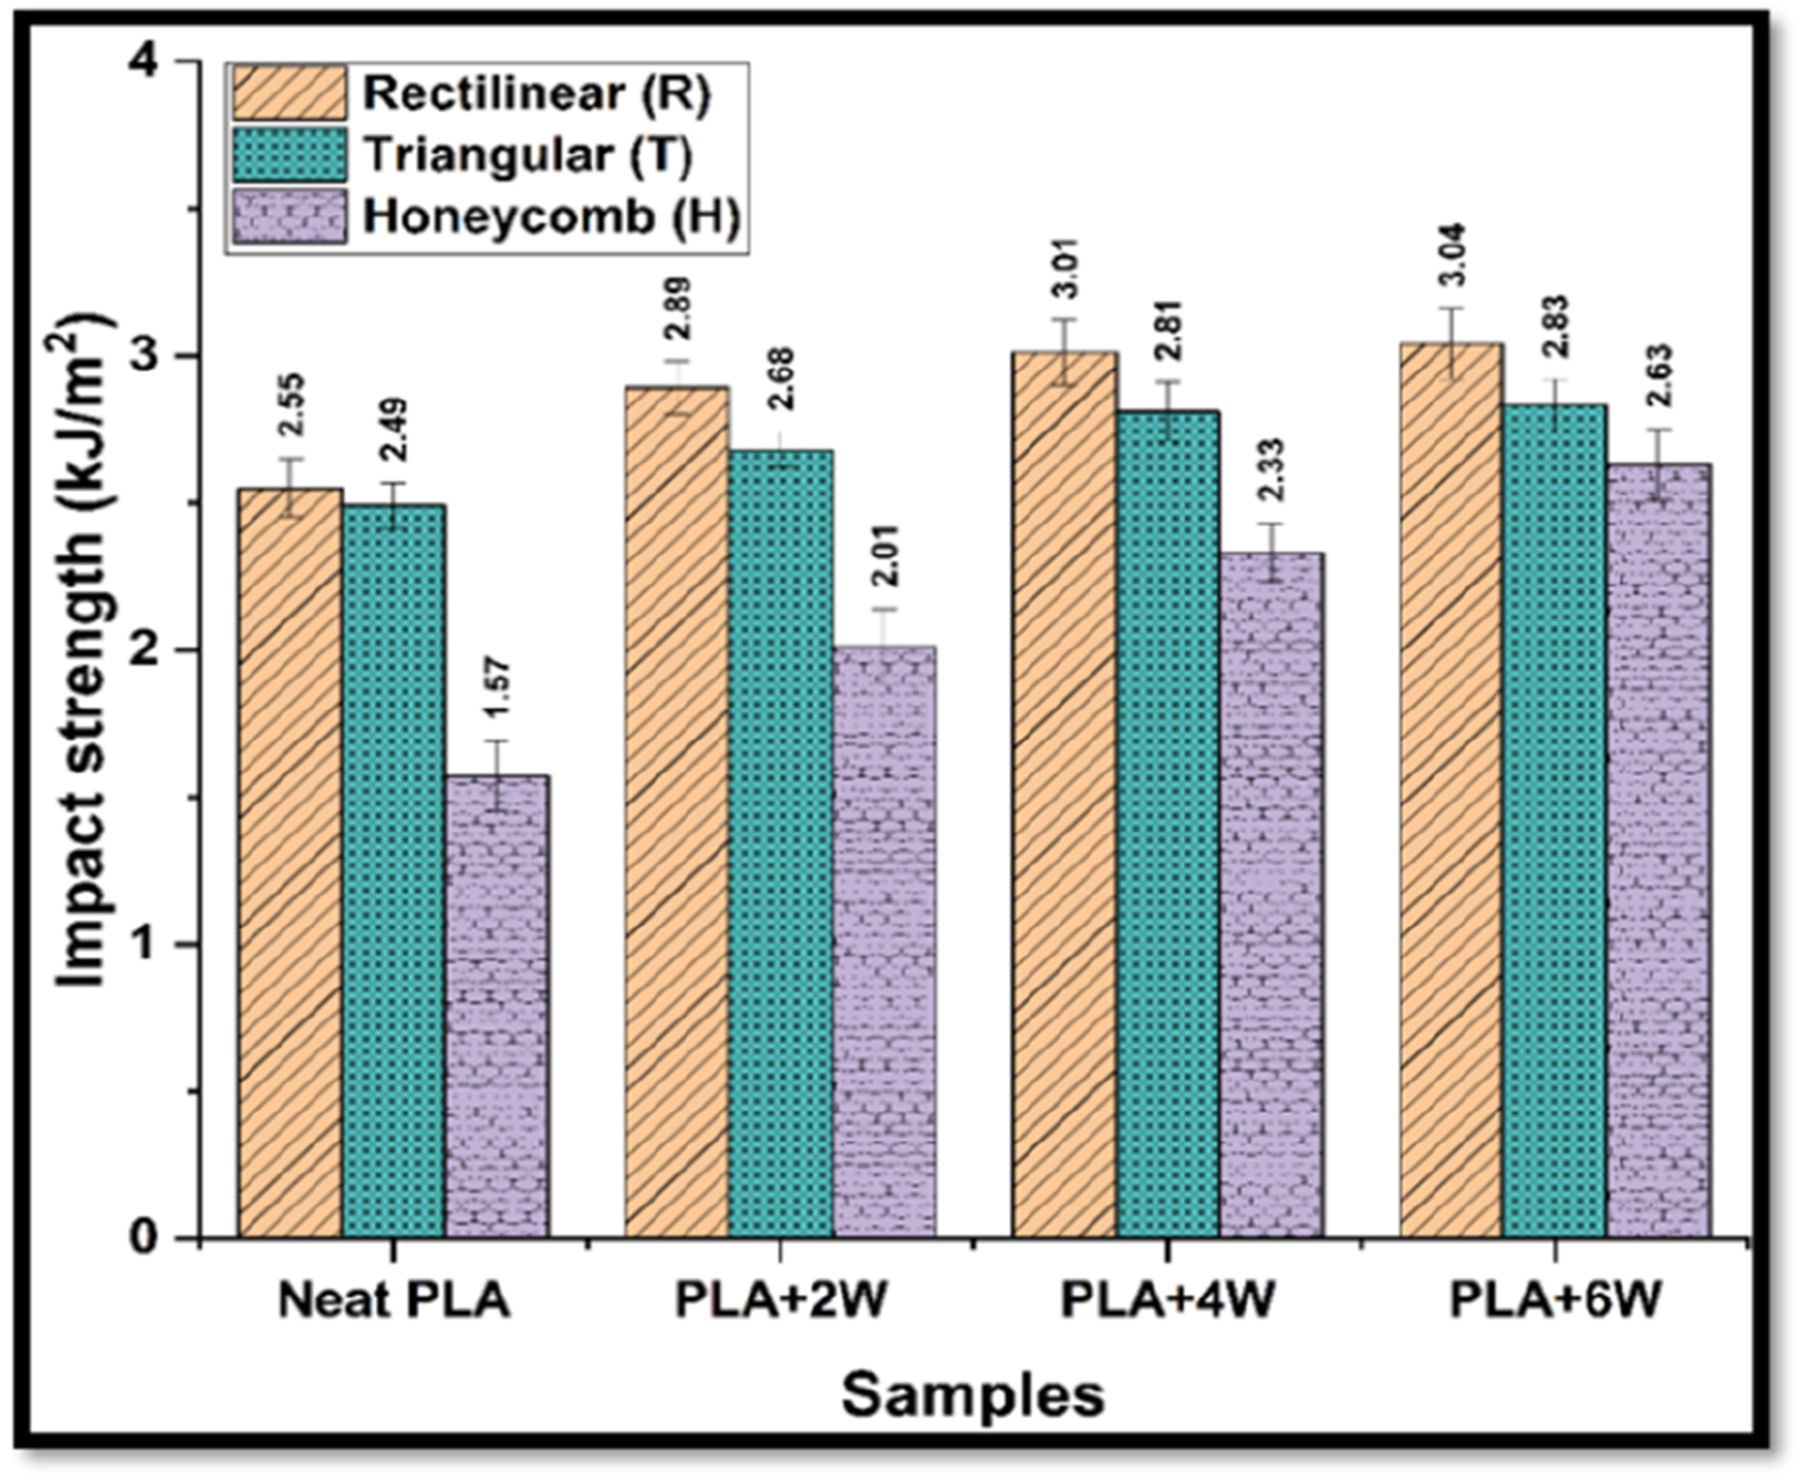
Out of three patterns, the honeycomb infill pattern has obtained the lowest impact strengths of 1.57 kJ/m2, 2.01 kJ/m2, 2.33, and 2.63 kJ/m2 respectively for neat PLA, PLA+2W, PLA+4W, and PLA+6W samples. In this case, the internal hollow space present in the lattice structure reduced the energy absorption along with the developed voids during the 3D printing. As compared to the rectilinear pattern, the debonding that occurs between the core and face sheet is more significant in a honeycomb structure that leads to easy failure of the specimen due to sudden impact by the pendulum. Also, the stress concentrations brought on by filler agglomeration or fractures may be too great for the base material’s deformation abilities and toughness to withstand in honeycomb structured composites. Conventional honeycomb constructions also have the drawback of losing all of their protective qualities after just one pendulum impact, which reduces their structural integrity and ability to transfer and absorb energy continuously. Similar to this work, the author Srinidhi 56 analyzed the effect of grid, rectilinear, honeycomb, and cubic structures on the impact strength of carbon-reinforced polymer composites. It was noticed that the grid structure printed composites have shown more impact strength values followed by rectilinear and honeycomb patterns. They discovered that the uniform distribution and improved bonding of reinforcement would raise the hardness expressing the energy absorption over the printed specimen’s fracture phase. The 3D printing of the present research work has been done with the 45° raster angle. The work by Mishra and colleagues 57 states that a larger impact strength may be achieved at a 0° raster angle and that it decreases as the raster angle increases. Because the deposited layers are perpendicular to the impact plane and the rasters showed good interlayer bonding, the test component constructed at 0° raster deposition offers increased resistance to affect blows. However, in the honeycomb case, since the raster angle is 45°, the deposit layer plan varies with the impact plane in a significant way. Moreover, the crack propagation direction may also change because of this phenomenon under the pendulum impact load. Another explanation might be because the honeycomb pattern’s design limitations, like the inclination lines and vertices that are not at 90°, prevented it from printing at 100% infill. 58 Since the structure fails to attain 100% infill practically, the energy absorption capacity might have reduced as compared to triangular and rectilinear patterns.
Hardness
The Shore D hardness measurement values of both neat PLA and Wollastonite/PLA composites are shown in Figure 10 corresponding to the different infill patterns. The measurements were taken at 10 different locations on the sample surface and the mean value is considered for the evaluation. As illustrated in the column chart, the obtained hardness values are nominal for the different infill patterns. However, the hardness is found to be increased with the incorporation of more wollastonite fillers due to its higher stiffness. This stiffness of the particles resists the indentation on the surface against the applied load through the indenter pin. The in-depth evaluation of these results confirms the higher hardness in the rectilinear pattern samples followed by triangular and honeycomb patterns. In the rectilinear pattern, PLA, the addition of 2, 4, and 6 wt% particles enhanced the hardness by 1.69%, 3.55%, and 4.45% respectively. Because of the internal structure and fewer voids, the triangular pattern experienced less deformation against the indentation and exhibited more Shore D values. Similarly for the triangular pattern, the increment by 2.31%, 3.22%, and 4.97% respectively for 2, 4, and 6 wt% wollastonite reinforcement. The added advantage of these filler particles is their higher load-bearing ability, which inhibits the indentation force. Additionally, the fillers strengthen their bond with the PLA matrix and boost their ability to withstand plastic deformation.
51
Another reason for obtaining the optimum hardness is the infill density of 100%. According to Maguluri et al.,
59
hardness rises as fill density rises from 50% to 100%. This is because when the fill density rises, the rate of air gaps falls, and the quantity of layers rises, the inter-layer bonding potential among the deposited layers is developed. Shore D hardness of neat PLA and wollastonite/PLA composites concerning different infill patterns.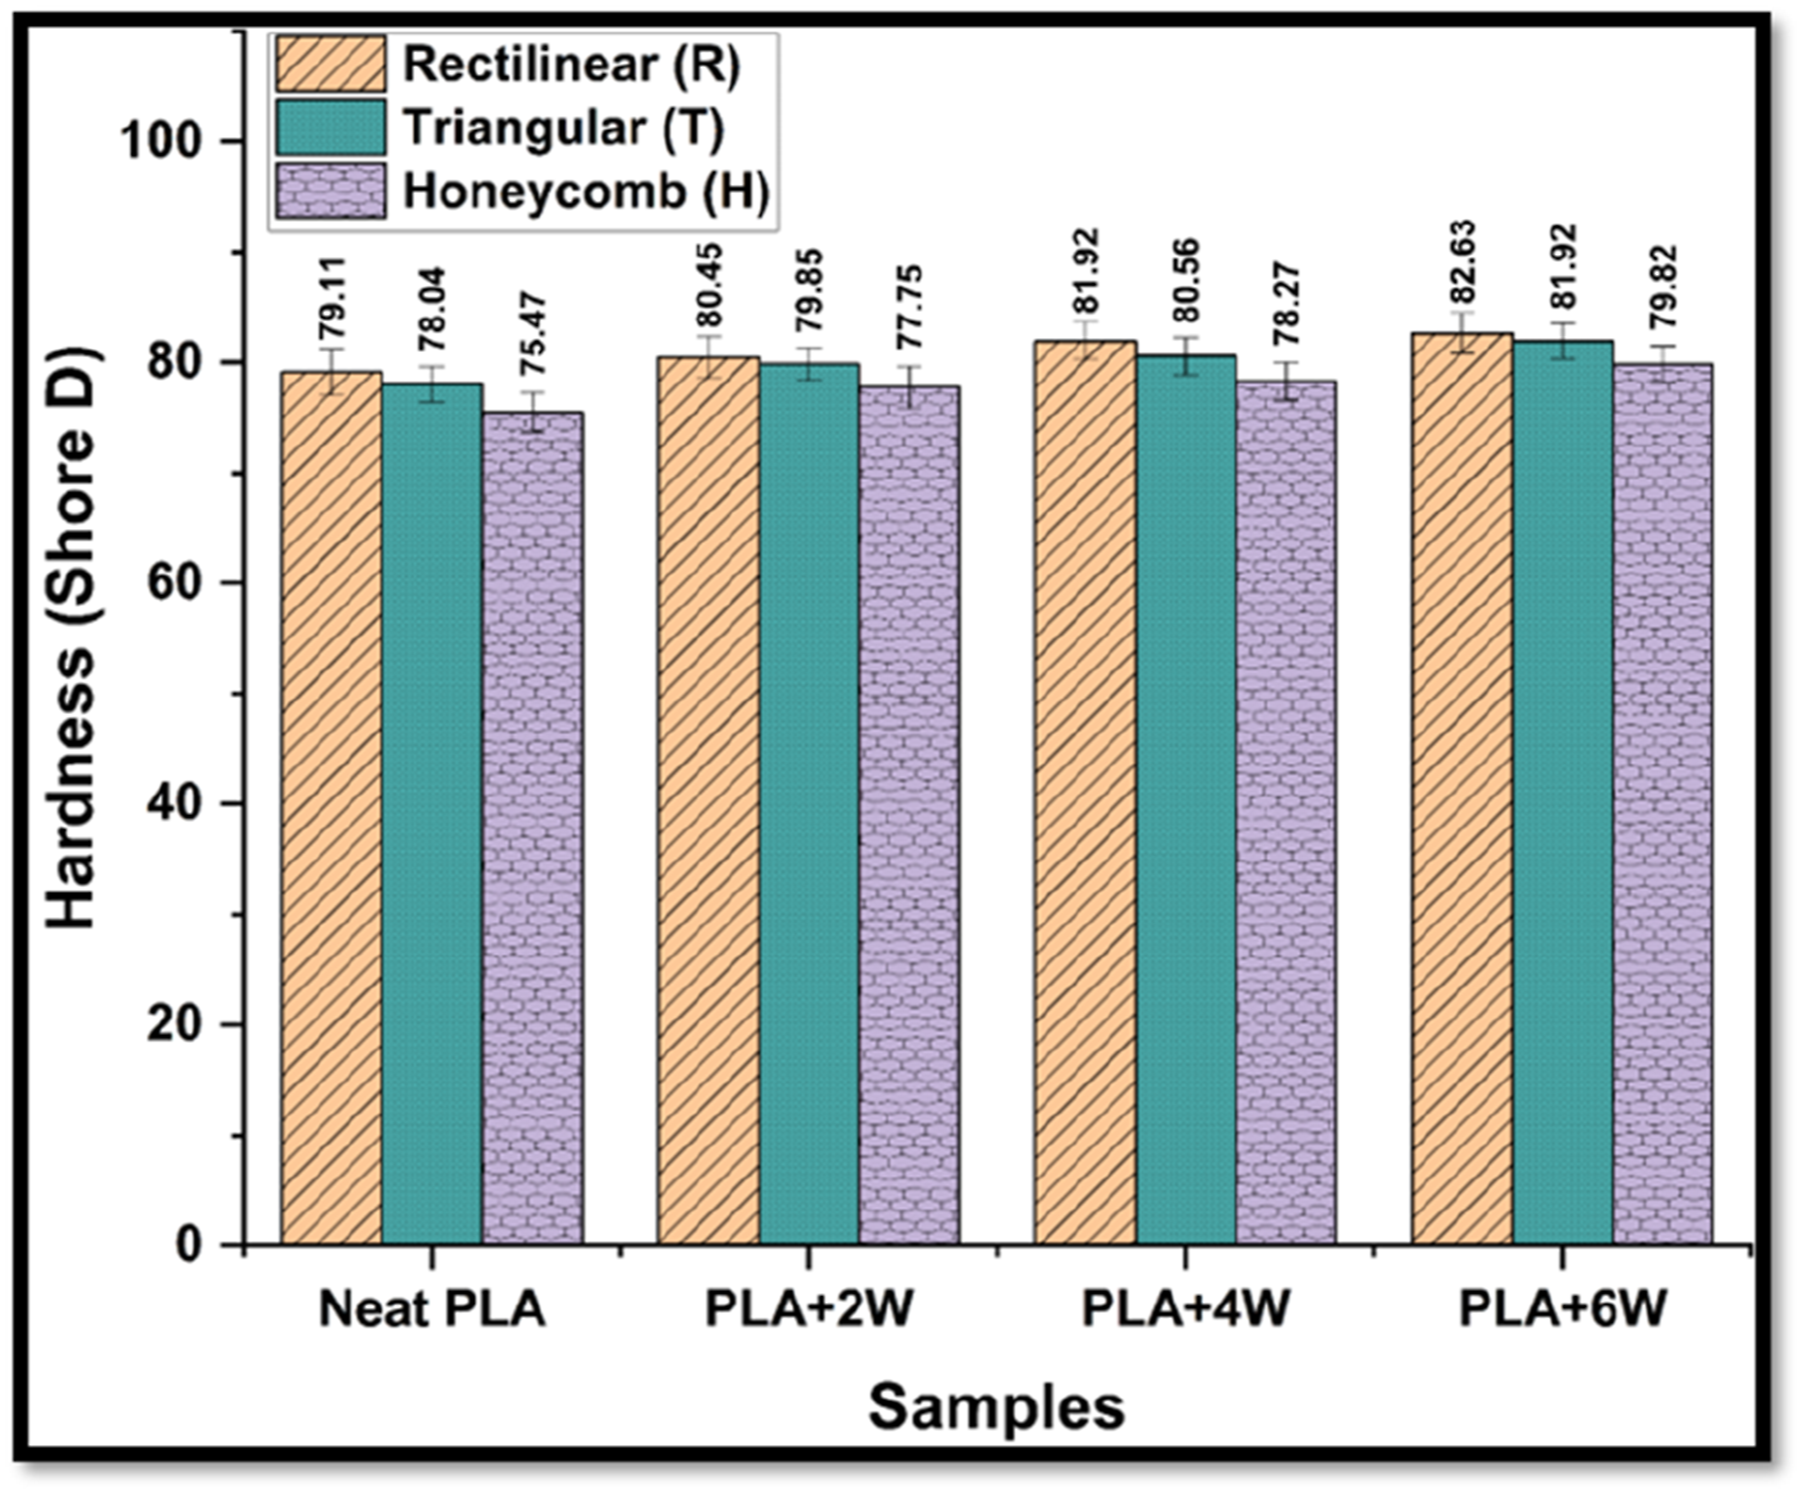
Among the three infill patterns, the honeycomb structured sample has the lowest hardness values because of its built structure. As explained previously, the 100% infill density is not possible with the honeycomb structure and hence there exist some hallow lattice spaces inside the core structure. Hence, when the indentation is applied over the surface during hardness testing, there is a greater chance of material deformation instead of resistance against the indenter pin. Owing to this easy deformation, the stiffness has been reduced and the lowest hardness values were recorded during testing. Even in the literature, 56 the authors have confirmed the lower hardness of honeycomb infill printed samples than the triangular pattern samples because of their internal structure. Apart from the pattern impact, the wollastonite fillers have shown a positive response to the hardness of the composites. The hardness values were increased by 3.02%, 3.71%, and 5.76% respectively with 2, 4, and 6 wt% filler loading into the neat PLA sample printed with a honeycomb pattern. Correlating to this study, Vishal and team 51 reported the Shore D hardness of silicon-filled PLA biocomposites. The neat PLA was found to have a Shore D hardness value of 78. Nevertheless, for biocomposites that included the most silicon filler, the highest hardness was achieved. Overall, it appears that the hardness values are closer at the infill pattern point; nevertheless, of the pattern, the addition of stiffened reinforced particles has more impact and offers increased resistance to the indentation by lowering the micro-level deformation of the polymeric material.
Morphological Analysis
The morphology and interfacial properties between the matrix and reinforcement are the utmost characteristics that influence the mechanical properties. In this work, the tensile fractured morphologies will be analyzed concerning infill patterns and filler ratio by the different scales of SEM images. Figure 11 illustrates the fractured morphologies of 3D printed neat PLA samples printed at rectilinear, triangular, and honeycomb patterns. According to the morphology, the void formation and cracks development in the 3D printed sample are found to be less, which correlates with the results of void fraction analysis. In addition, the neat PLA’s printing capability seems to be higher and hence preferred in FDM printing of polymer composites. Because of the orientation effect, it is seen that the pristine PLA bead has a smooth broken surface with minimal undulation.
22
In the neat PLA sample, the brittle fracture is more pronounced with the micro-cracks than the voids. In addition, it is also possible to observe more sharp edges at the fractured surfaces irrespective of the infill patterns. The tiny-chipped edges on the surface at the honeycomb pattern sample can be seen in 10 μm scale magnification in Figure 11. Although there was very little necking when the clean PLA fractured, the fracture surfaces reveal ductile processes that preceded unstable crack development.
60
As compared to triangular and rectilinear patterns, the honeycomb-structured samples have more fractured edges and tiny fractures due to perimetric failure at the sides of the honeycomb structure. Fractured surface morphologies of neat PLA sample with a different infill pattern at different scales.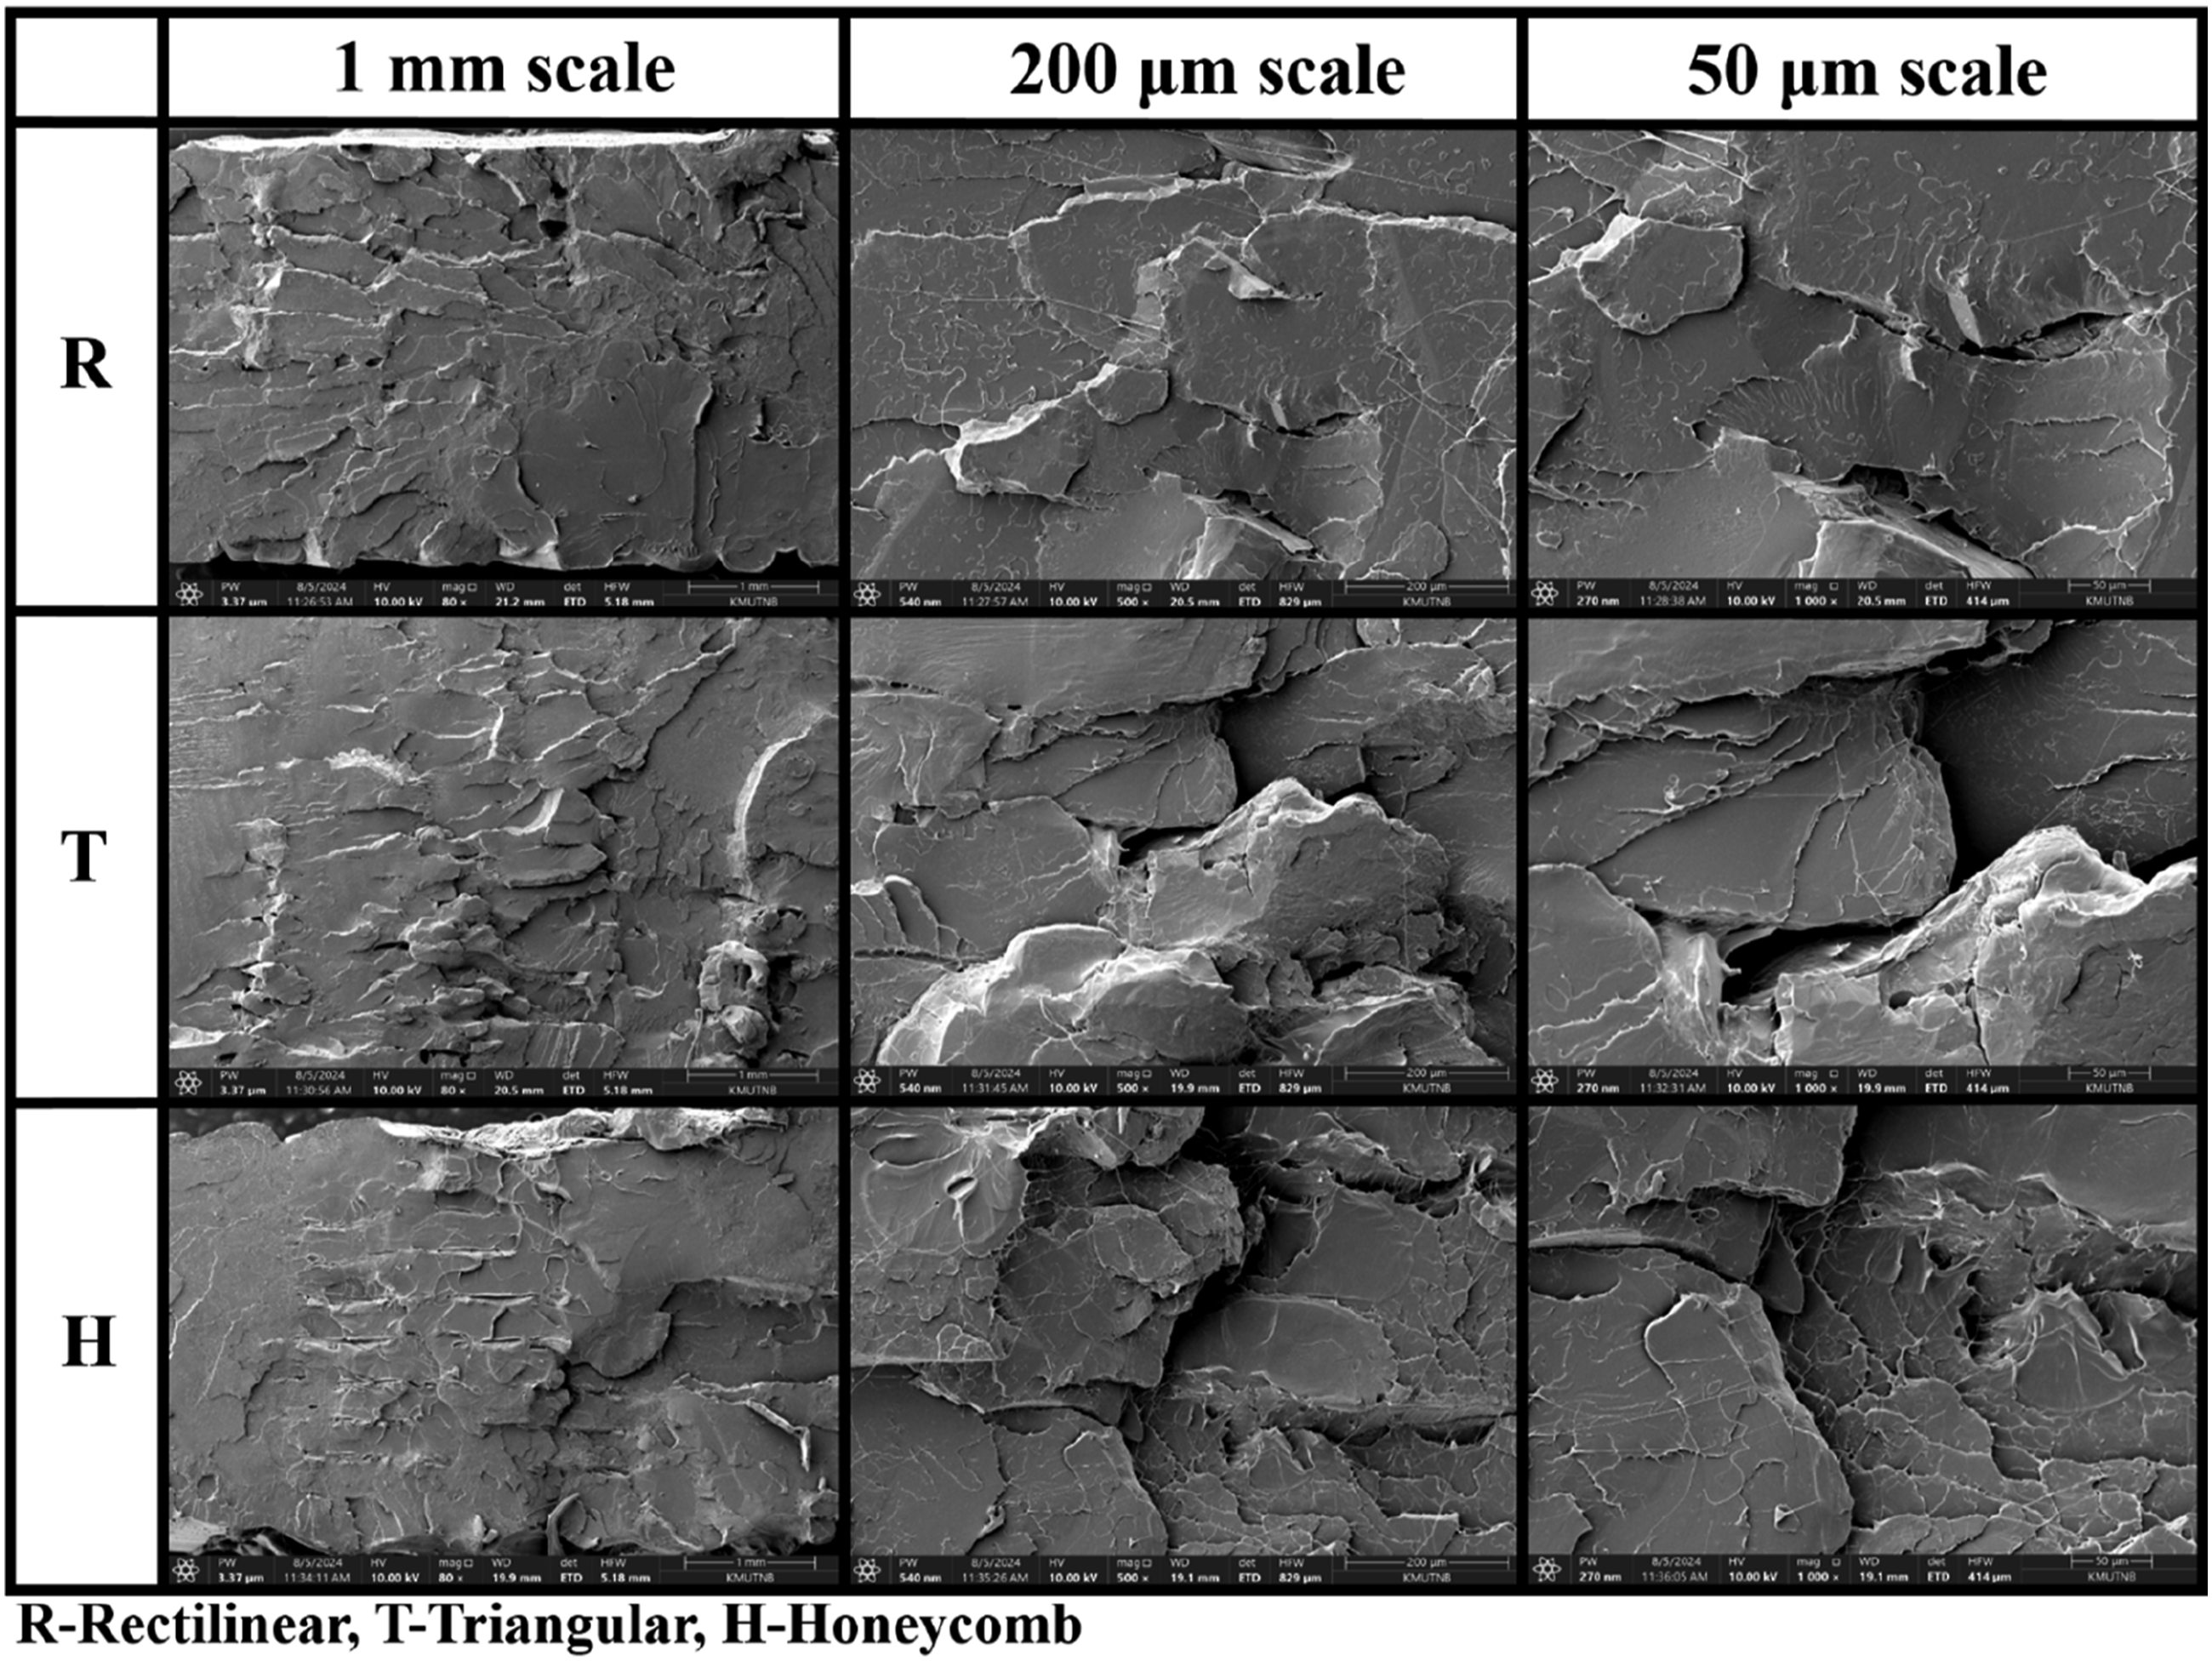
In the rectilinear pattern sample (50 μm scale), the 3D printed layers appeared with spherical droplet shapes of wollastonite fillers on the surface and at the interface of the successive layers. Because the thread-like macromolecules elongate and reorient, exerting significant deformation on the material, thermoplastic components typically fracture ductilely.
61
These micro threads deformation and pulled threads can be seen in all the infill patterns at the 50 μm scale. The sample’s filamentous character is also seen in both the smooth as well as rough areas of the fractured surfaces.
60
In contrast to other composite samples, the broken surface micrographs in Figure 12 indicate that the adherence between filaments is less complete, which will affect the sample’s mechanical performance. Furthermore, crack propagation may occur across these bridging lines because of the tiny damage zones that indicate the bonding’s strength is very poor in comparison to the energy dissipated during fracture.
62
Especially when it comes to the triangular pattern in Figure 12, the deformation fracture is absent due to the flat fractured surface appearance during the application of load. Additionally, the lack of ratchet lines, smaller voids, and good raster and multilayer bonding are all visible. As a result, the triangle pattern sample had better tensile properties than the other two patterns.
63
In the honeycomb samples, the printed layers appear as squeezed layers due to design constraints at 100% infill density. However, the printed layers in rectilinear and triangular patterns look like orderly arranged layers without much compression or deformation at the layer’s interfaces. The filler particle inclusion can be observed on the printed layer surface and inside the printed layers. More threads-like structures can be seen at the fractured edges because of the issues raised during the printing process while at full infill density. Fractured surface morphologies of PLA+2W sample with a different infill pattern at different scales.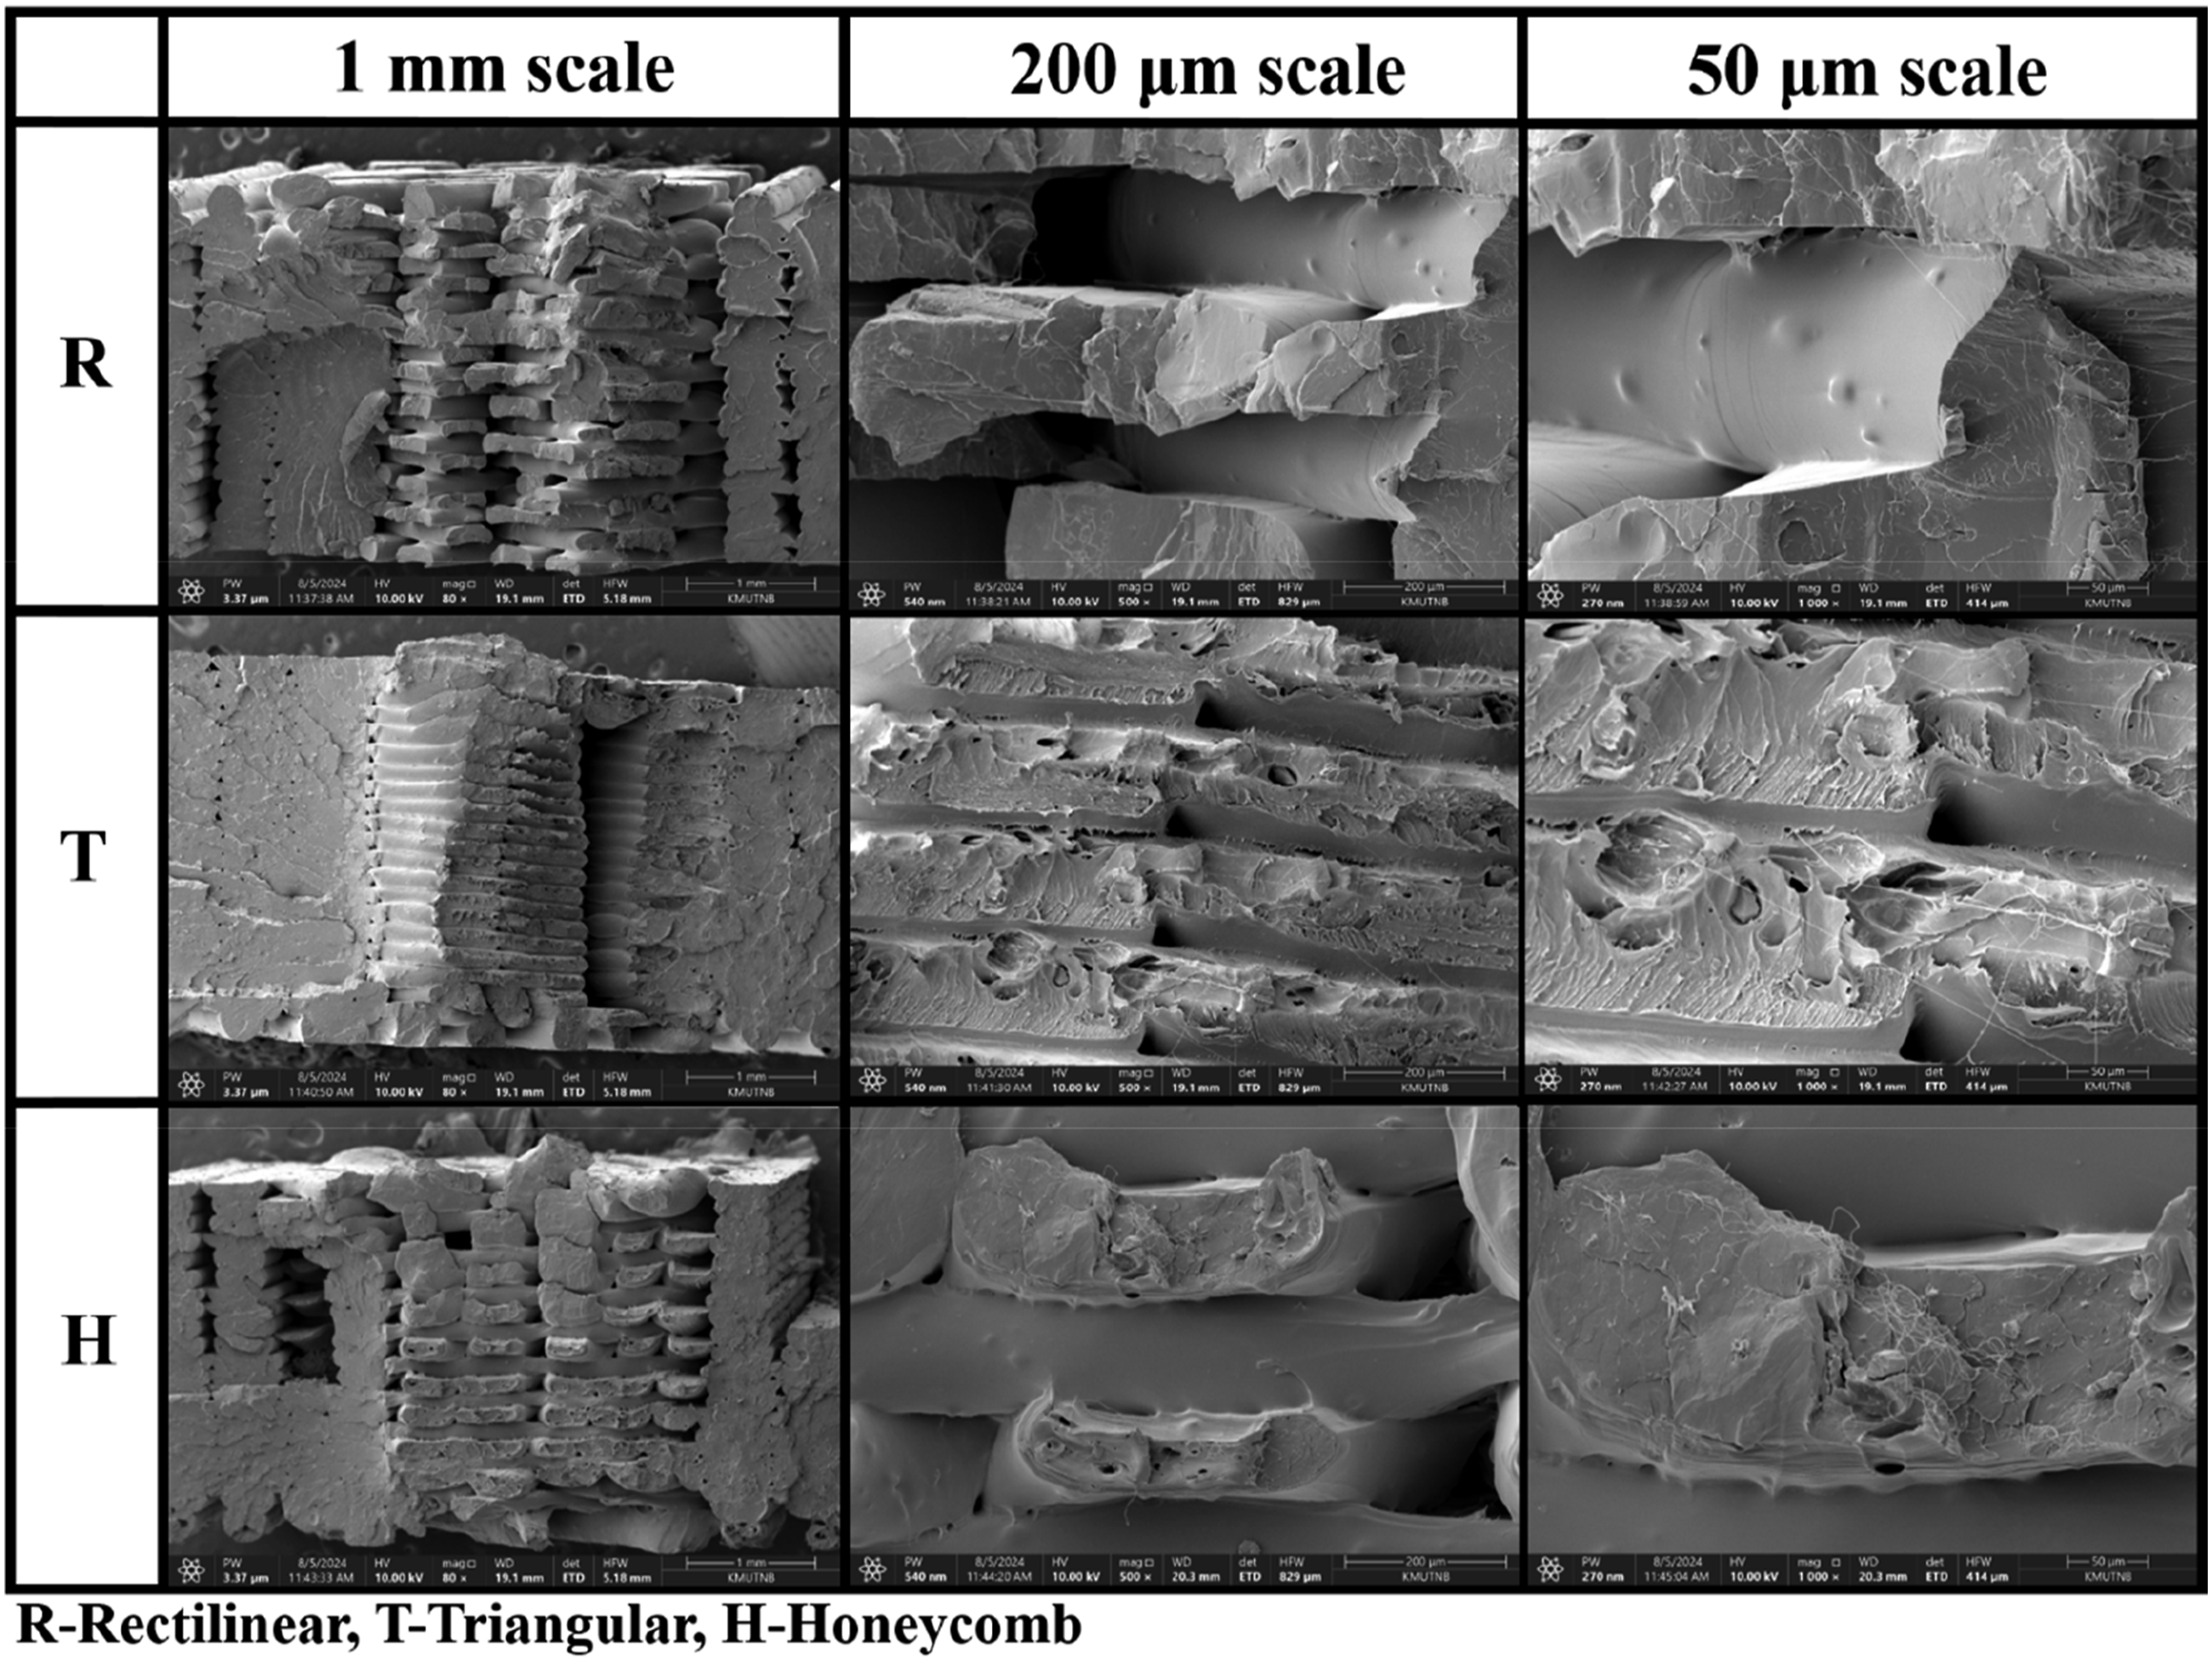
According to the morphologies (200/100 μm) displayed in the 4 wt% filler-loaded sample, the layer contains significant printing-induced micro-holes and cavities that are nearly impossible to eliminate due to each raster’s quick cooling is linked to shrinkage, which results in an imperfect connection among the rasters. However, in addition to this, the quantity and dimension of these cavities may be effectively decreased or increased by adjusting printing settings, material qualities (such as rheology and melting strength), and their interactions.
64
There are several fractures in the triangular pattern morphology with 4 wt% filler loading. These include intra-laminar fractures (among the two successive layers) caused by a natural gaping during layer placement, intra-laminar fractures (inside a layer) caused by discontinuities ingested by the fillers throughout the matrix, and an amalgamation of intra- and inter-laminar ruptures caused by the preferred sequence of crack propagation.
65
When it comes to the orientation of the filler particles, it is probably aligned with the printing direction as observed in Figure 13. When the printer nozzle melts PLA during layer deposition, the fillers within the deposited material tend to align with the direction of the molten PLA’s extrusion.
60
More voids can be seen in the honeycomb-structured samples especially at the broken layer surface due to the inclusion of filler particles. Anyway, the particles are distributed uniformly inside the material irrespective of the patterns, hence the combination PLA+4W achieved more tensile performance than the neat and PLA+2W samples. Here also in the honeycomb structure, the layers are forcibly adhered to one another and deformed the previously printed layers through bending action because of design constraints. Moreover, the layer’s thickness is possibly changed after the successive printing layers which can be seen in a 200 μm scale SEM image of the honeycomb structure. Fractured surface morphologies of PLA+4W sample with a different infill pattern at different scales.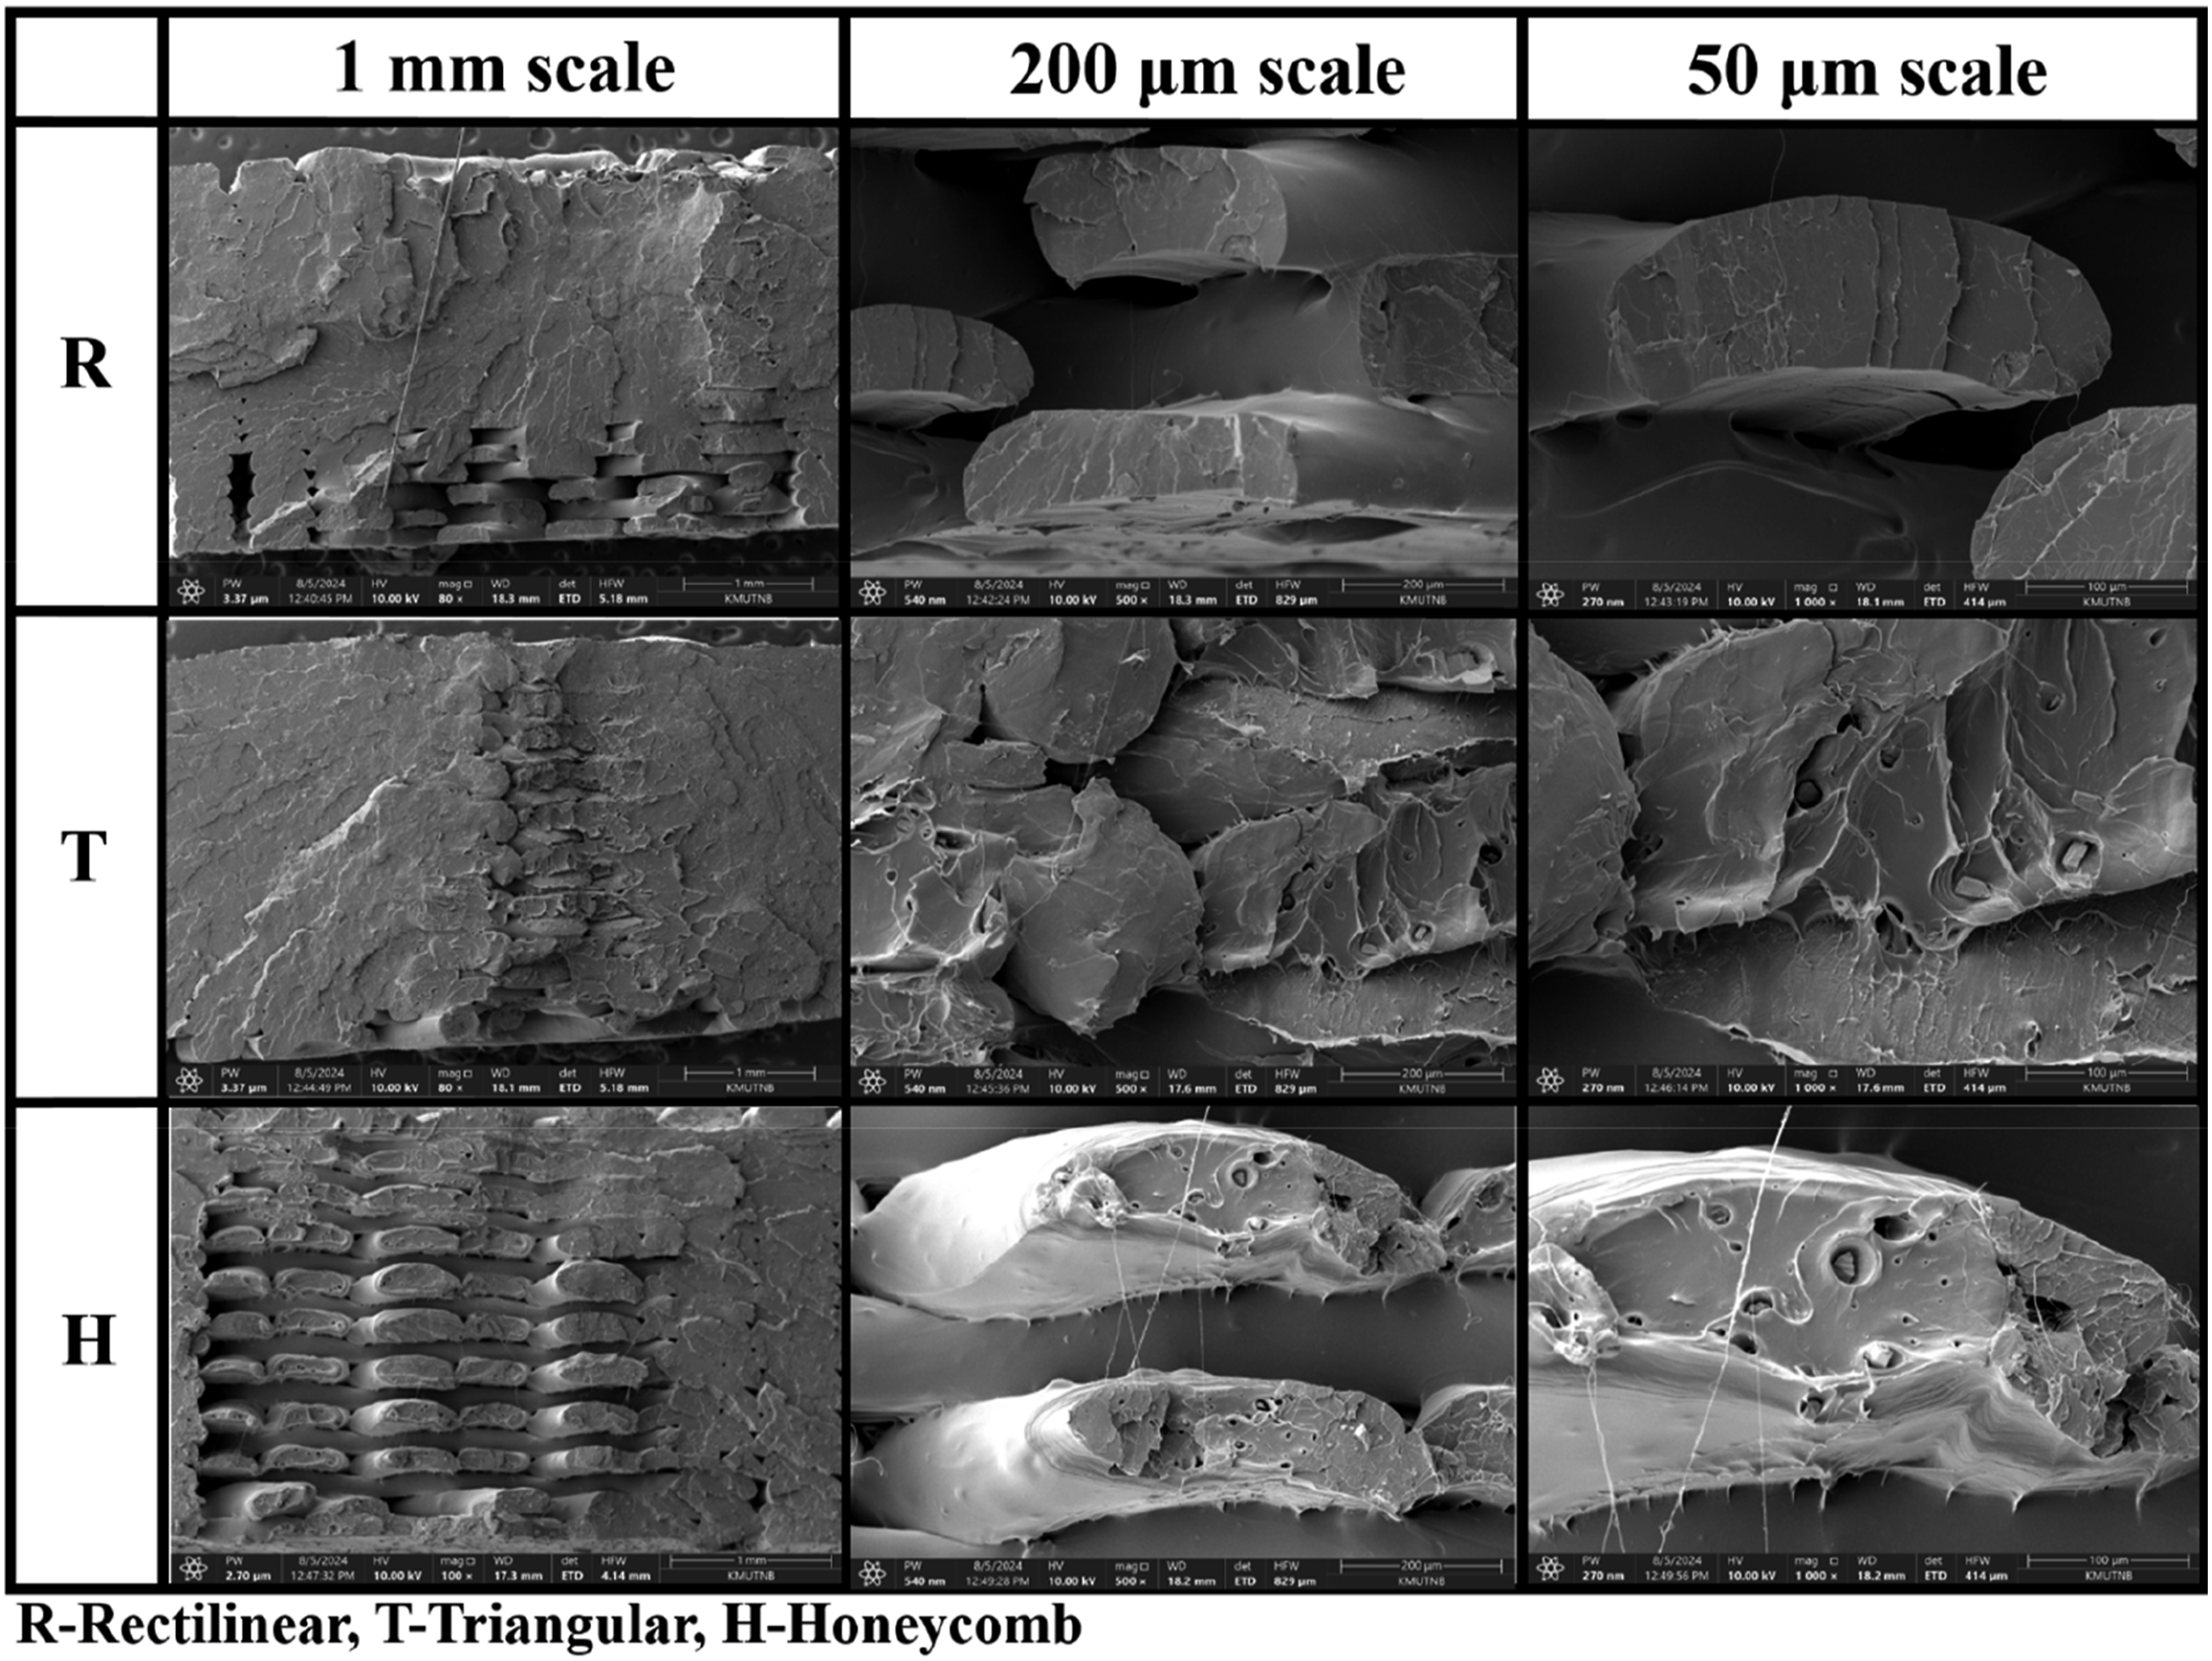
The printing process created several micro-holes and voids on the surface and within the printed layer in the honeycomb printed morphology image, which in some way reflects the raster’s inter- and intra-layer bonding strength and printing capability for high-concentration filler-loaded composite. Because of concentrated stresses and porosity, these voids are mostly responsible for strength loss.
64
Increased filler concentration results in increased melt strength under similar printing circumstances that are linked to more significant difficulties. Since printing issues including inadequate melting, nozzle clogging, and buckle are more likely to occur when the melt strength is increased, the feeding rate decreases and its fluctuating stoppage during printing occurs.
64
These parameters will have a direct impact on the printability of composites and are more pronounced in honeycomb infill pattern samples. The more brittle fracture can be seen in this 6 wt% filler loaded samples specifically more with rectilinear infill pattern samples. Particle concentrations that are higher serve as barriers to the spread of micro-fractures created in the matrix when the sample is plastically deformed. The resultant ductility is decreased when the fractures reach a particle because they can no longer advance. After the rupture happens, a brittle macro-fracture will eventually result from the buildup of micro-fractures inside a specific area.
61
Even though the filler concentration is high, there is no appearance of the agglomerations in the printed sample. This uniform distribution and proper adhesion have improved the tensile properties of the PLA+6W sample as compared to others. However, the more concentration effect can be spotted on the hill-like structures of the printed layers where it has given a free surface area to adhere over the next printed layer. Another added advantage for the tensile property improvement is the smallest particle size where these are capable of producing a more reinforcing effect and successive incorporation within the molten PLA. In the triangular pattern sample, the failure at the adhered particle surface can be seen with the less pulled printed surface area. Even though the honeycomb structures have a lattice space inside the perimeter, the 100% infill density printing covered these spaces through deformed printed layers along with the compression as revealed in the 200 μm scale fractured image of the honeycomb sample (Figure 14). Fractured surface morphologies of PLA+6W sample with a different infill pattern at different scales.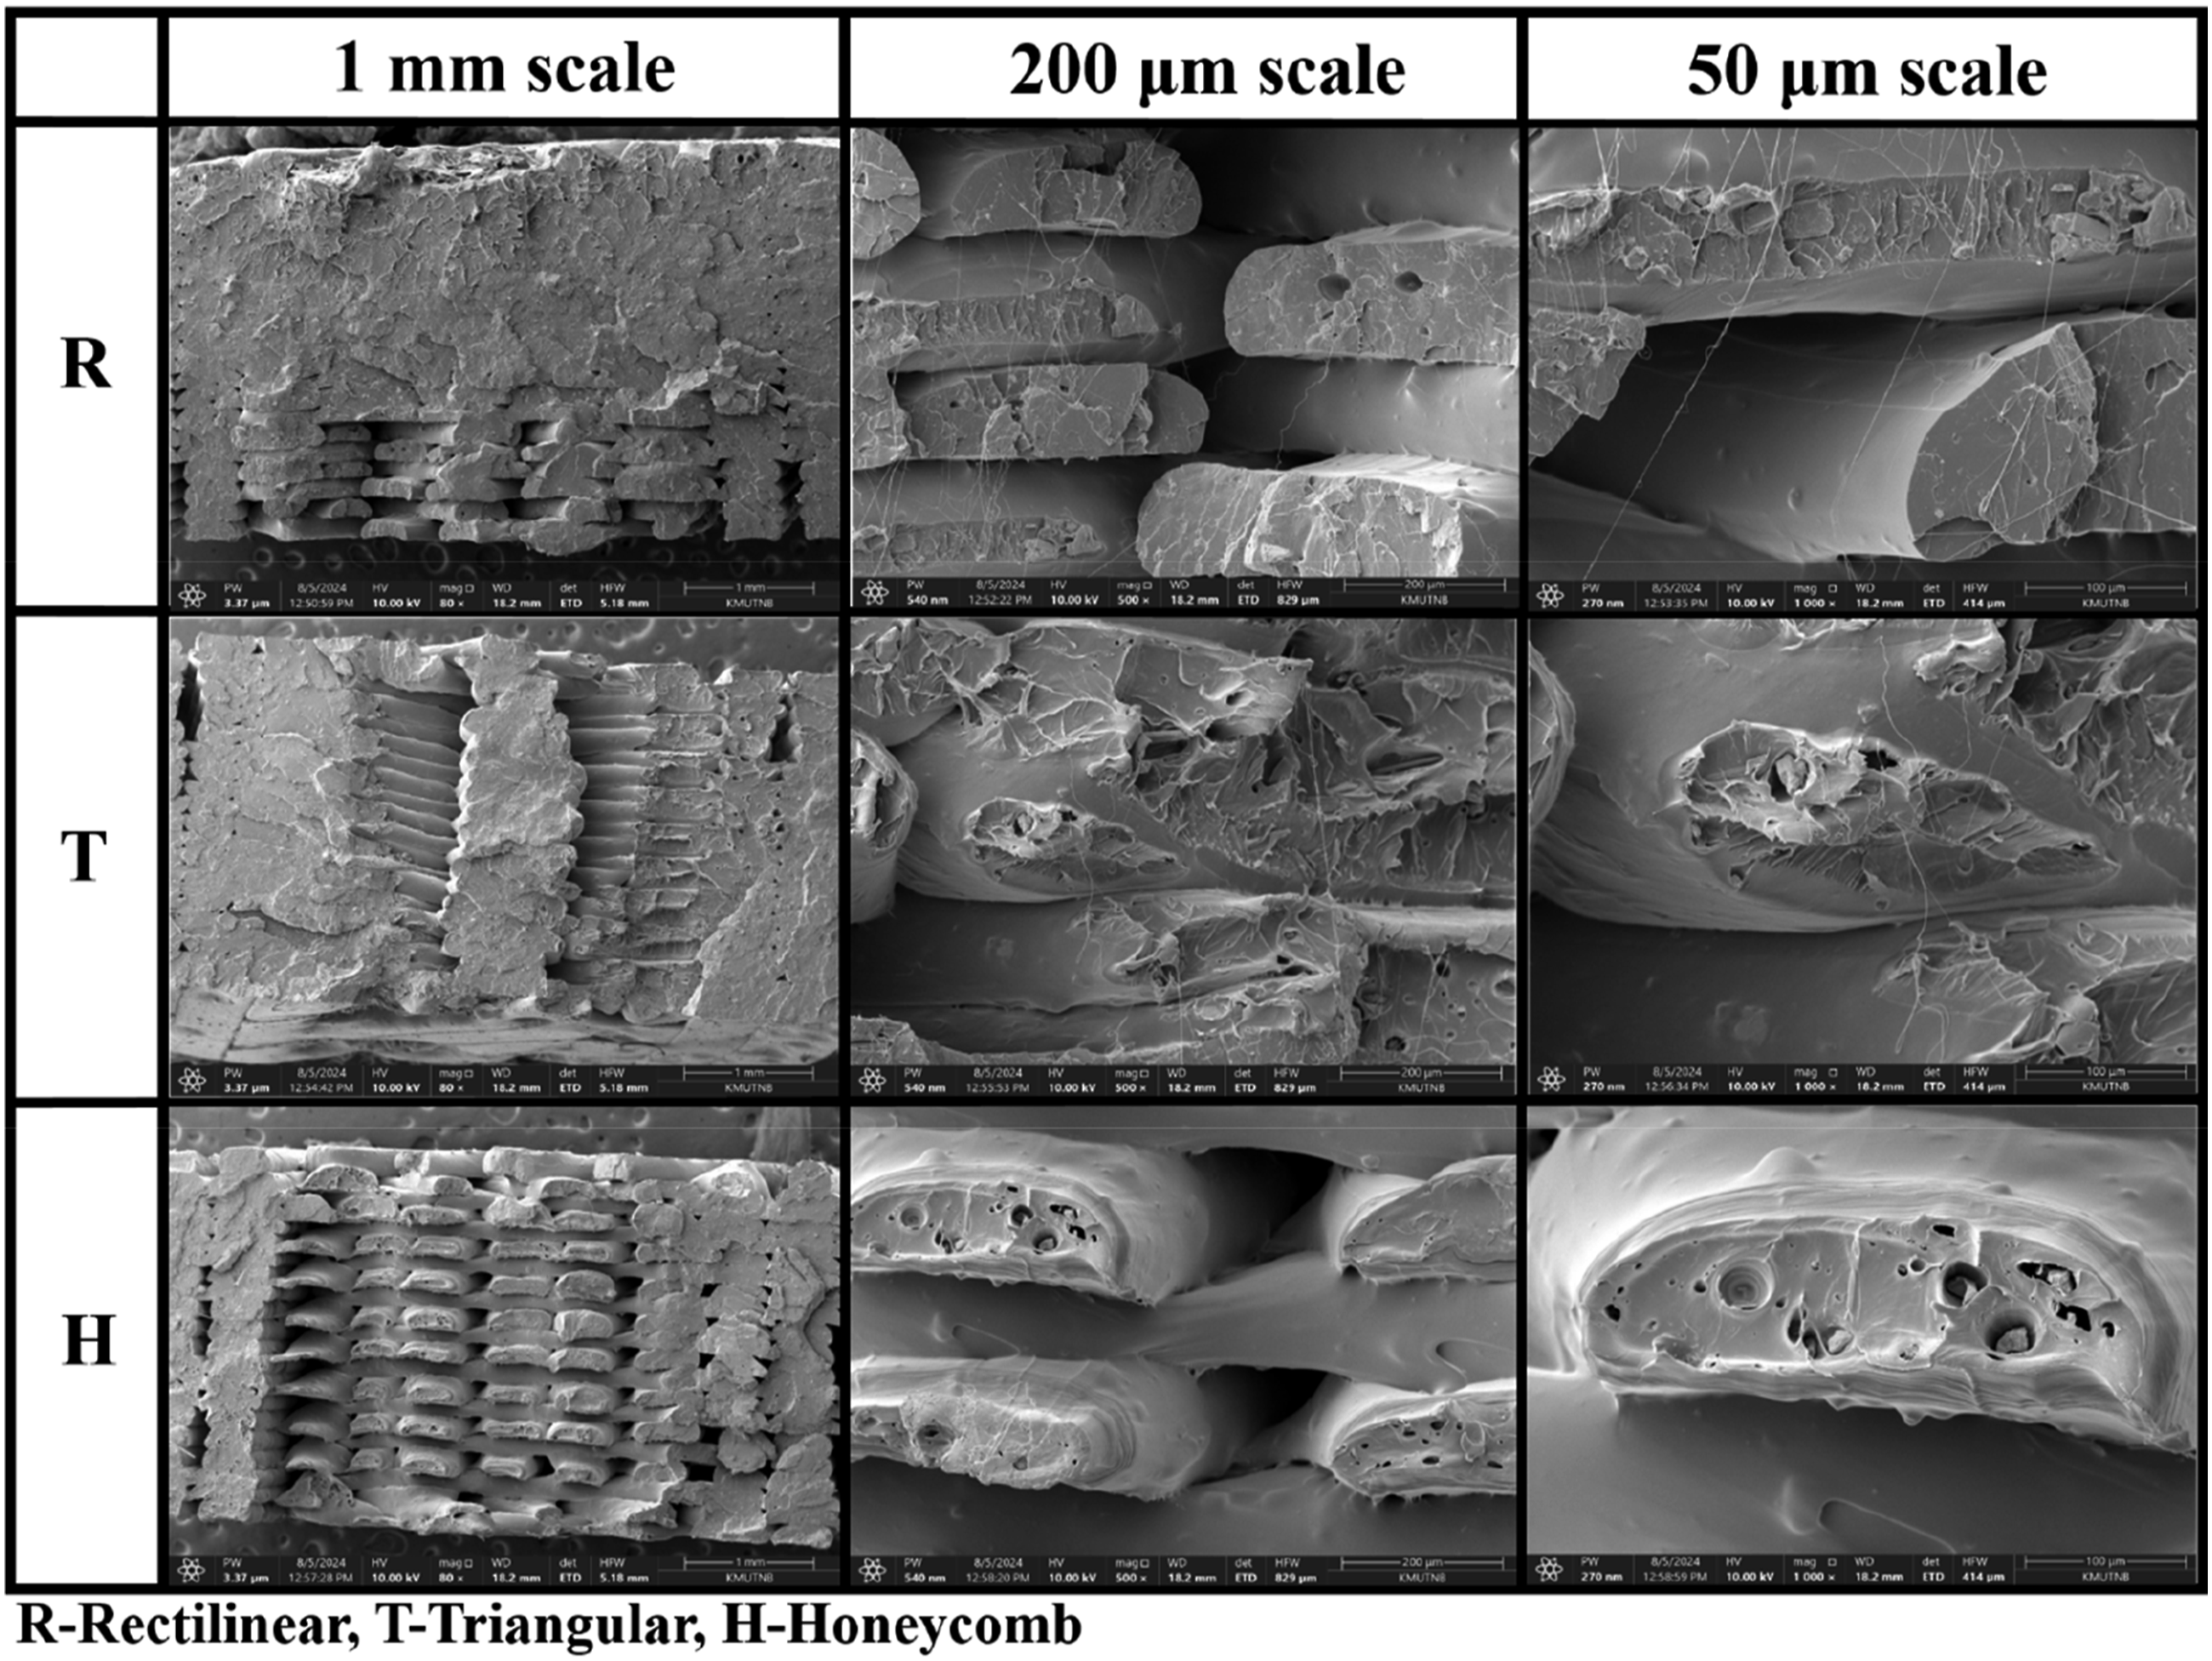
Conclusion
The current research revealed that the higher percentage of fillers resulted in notably improved mechanical characteristics, especially more improvement in the triangular infill pattern. Out of three, the rectilinear pattern had the lowest capacity to endure tensile stress, while the triangle infill pattern printed samples showed the highest tensile stress value because of more serrated cycles are seen in triangular unit topologies. With the least amount of materials, the triangular pattern’s strength and high-stress tolerance are due to its internal mesostructure, which has several crossings of two layers in opposing directions. It is found that when the filler ratio increases, the tensile and flexural modulus values increase as well. The triangle pattern exhibits the highest bending stress-withstanding capacity of all the patterns because of the robust triangular element structures and efficient tangential stress transmission capability at the successive layers, resulting in a greater flexural strength of 106.04 MPa (6 wt% filler). In terms of energy absorption, the rectilinear pattern fared better than other patterns. The hardness values were improved with increasing filler ratio because of their stiffness and rigidity. The smooth cracked surface morphology appearance during load application indicates that there is no deformation fracture in the triangular pattern samples.
Footnotes
Declaration of Conflicting Interests
The author(s) declared no potential conflicts of interest with respect to the research, authorship, and/or publication of this article.
Funding
The author(s) disclosed receipt of the following financial support for the research, authorship, and/or publication of this article: This research was funded by King Mongkut’s University of Technology North Bangkok (KMUTNB) with Contract No. KMUTNB-Post-68-05. This research budget was allocated by National Science, Research and Innovation Fund (NSRF) (Fundamental Fund 2024), and King Mongkut’s University of Technology North Bangkok (Project no. KMUTNB-FF-68-A-01).