
Abstract
This study investigated the attributes of blending of recycled crushed polypropylene plastic coarse aggregates (PPCA) and fly ash (FA) towards the fresh and hardened properties of concrete. Natural coarse aggregate was partially replaced with PPCA at volumetric replacement levels up to 30% and cement was replaced with FA up to 20%. Initially, the performance of PPCA and FA in concrete was investigated distinctly. The incorporation of 30% of PPCA in concrete rather impaired the workability (from 95 mm – 50 mm: 47%) and the compressive strength (from 44.6 MPa to 31.4 MPa: 29.7%). By appropriate using of a superplasticizer, the loss in the workability could be recovered. Microstructural investigation was conducted employing scanning electron microscope analysis; it showed that the formation of a weak interfacial transition zone between PPCA and cement paste to be the reason for strength reduction in PPCA concrete. In contrast, the addition of 10 – 20% of FA in concrete improved the workability by 63.2% – 100%, but yet again, the 28-day compressive strength reduced by 15.8 – 35.6%. Meanwhile, thermal conductivity results and constitutive relationships proved that the use of PPCA enhanced the thermal insulation property and ductility of PPCA concrete, respectively. Eventually, a total of six concrete batches with binary blended PPCA and FA were cast to find the optimum replacement levels. The optimum binary combination with reasonable strength and workability at a minimal cost was achieved to be 10% PPCA and 20% FA.
Keywords
Highlights
• Thermal conductivity reduction of 39.4% was achieved with 30% polypropylene plastic coarse aggregate content compared to conventional concrete. • Constitutive relationship showed that the ductile capacity increases as the polypropylene plastic coarse aggregate content increases. • The addition of fly ash enhances the workability of polypropylene plastic coarse aggregate concrete. • The optimum combination for sustainable concrete was 10% polypropylene plastic coarse aggregates and 20% fly ash.
Introduction
Worldwide growing need for concrete necessitates an annual requirement of 51.7 billion metric tons of natural aggregates in 2018, 1 and it is expected to reach 62.9 billion metric tons in 2024, consequently driving up the demand and cost of them. 2 In 2022, the total annual cement consumption reached 4.16 gigatons. 3 Projections suggest that in 2050, cement demand will increase to 4.68 gigatons per year. 4 Further, the primary challenge confronting the cement industry is to decrease CO2 emissions while fulfilling global demand. Hence, the trend of utilizing waste materials instead of conventional concrete constituents is on the rise as it offers the dual benefit of mitigating environmental impact and lowering material scarcity and costs.
Currently, recycled crushed plastic waste aggregates are evolving as eco-friendly construction materials among researchers.5–16 Global plastic production increased from about 348 million tons in 2017
17
to about 400.3 million tons in 2022.
18
Geyer
19
estimated that the total plastic waste accumulation in landfills in 2050 will be about 12000 million metric tons. Therefore, utilizing plastic waste as aggregates through recycling presents a potential solution to address the natural aggregate scarcity and plastic waste management.
20
The primary benefits of using plastic waste in concrete include low unit weight, low cost, high sound insulation, and enhanced ductile behaviour.21,22 Also, the thermal conductivity of concrete reduces as the plastic content increases.23,24 In contrast, impaired compressive strength is the major drawback of plastic concrete. As per past studies, the reasons for impaired compressive strength are as follows: • The bonding strength between plastic aggregate and cement paste is low.
6
• The modulus of elasticity (MoE) of plastic aggregate is less than natural coarse aggregates (NCA).
6
• The hydrophobic nature of plastic aggregate (causes for controlled cement hydration near the plastic aggregate’s surface).
6
• Crack formation around plastic aggregates due to the variation of elastic modulus between plastic aggregates and surrounding cement paste.
25
The ability to use plastic aggregate concrete in structural applications decreases as the plastic replacement ratio increases. 26 Moreover, various types of plastic have a significant effect on the performance of concrete. For instance, different types of plastic resins have different densities which affect the unit weight of plastic concrete.27,15 Additionally, the way plastic aggregates are produced, including both the direct utilization of shredded plastic and the altered plastic aggregates involving melting, cooling and crushing, has a substantial effect on concrete performance. 7 Mohd Nasir 28 stated that the production of polymer concrete using modified waste plastic resin was uneconomical. Hence, shredding the plastic waste and directly adding it to concrete or mortar is an economical way of recycling. 29 Prior to its direct incorporation into concrete, plastic waste undergoes a recycling process comprising collection, cleaning, sorting, shredding, washing, and drying. According to Ono, 30 small-scale recycling centres in Sri Lanka recycle more polypropylene (PP) waste than other types of plastics because of the easiness during collection and availability of waste. In a global scale, PP plastic accounts for highest proportion in plastic waste accumulation among various plastic resins. 7 Hence, the current study focused on PP plastic coarse aggregates (PPCA) for the investigation. Further, the current study examined the direct inclusion of shredded plastic waste as aggregates, acknowledging its potential environmental and cost benefits than altered plastic aggregates, i.e., the production of altered plastic aggregates may involve greenhouse gas emissions and energy consumption during the modification process.
On a global scale, coal-fired electricity production results in more than 500 million tons of fly ash (FA) annually, with just 25 to 30% being reused across various industries. 31 Despite its existing usage in cement industries, there is a need to amplify its application. The environmental threats due to the dumping of FA in landfills include air pollution, water pollution and soil contamination. 32 Reusing FA as cement replacement decreases the cement production, cost of concrete production and land space required for dumping. 33 Moreover, addition of FA in cement reduces the heat of hydration and increases the durability. 34 In this context, the current study utilizes pozzolanic material like FA as a partial replacement for cement in PPCA concrete (PPCAC) and evaluates the synergistic effect of PPCA and FA in concrete. Considerable attention was given towards PPCA, as there was sufficient study done for FA. The novelty of this research work lies in using FA to improve the workability which was adversely affected by the addition of PPCA in PPCAC. As such, this study will attempt to recommend an optimum combination for binary addition of PPCA and FA.
Research significance
This study utilizes two major solid wastes in Sri Lanka such as recycled plastic waste and industrial by-product – FA to produce sustainable concrete with the aim of mitigating the waste management problems and contributing to the economic development of the country. Researchers around the globe are actively pursuing ways to reduce the natural aggregate depletion and carbon footprint associated with concrete production. The current study also contributes significantly to these endeavours. Furthermore, existing past studies primarily highlight the benefits of individual incorporation of plastic aggregates and FA as concrete constituents. Only a few studies have addressed the synergistic effects of the binary addition of PPCA and FA, 10 and none have explored the optimal combination for binary blended sustainable concrete (BBSC). Hence, the current study fills this significant research gap.
Experimental program
Methodology
Figure 1 shows the adopted methodology. Initially, material collection, material testing, mix proportioning and preliminary castings for the selection of mix proportion were carried out. Material testing was carried out to find the suitability of the materials to use in concrete. Then, experimental work was carried out under two major categories such as PPCAC and FA concrete (FAC), on the impact of fresh and hardened properties of concrete. A major consideration was given to PPCAC by investigating thermal conductivity behaviour and stress–strain relationship, as its application is still questionable in the construction industry. The PPCA was used to partially replace the NCA volumetrically with replacement levels of 0%, 10%, 20%, and 30%. FA was used to replace 0%, 10%, and 20% of cement by weight. Here, a replacement level of 0% denotes the conventional concrete (CC) that was cast to compare the performance over PPCAC and FAC. Through this comparison study, possible improvements or reductions in the performance of concrete can be investigated. Further, the addition of superplasticizer (SP) in the performance of PPCAC was examined. Here, the homogeneous distribution of the PPCA in superplasticized concrete (SPC) is also discussed. Flowchart for the adopted methodology.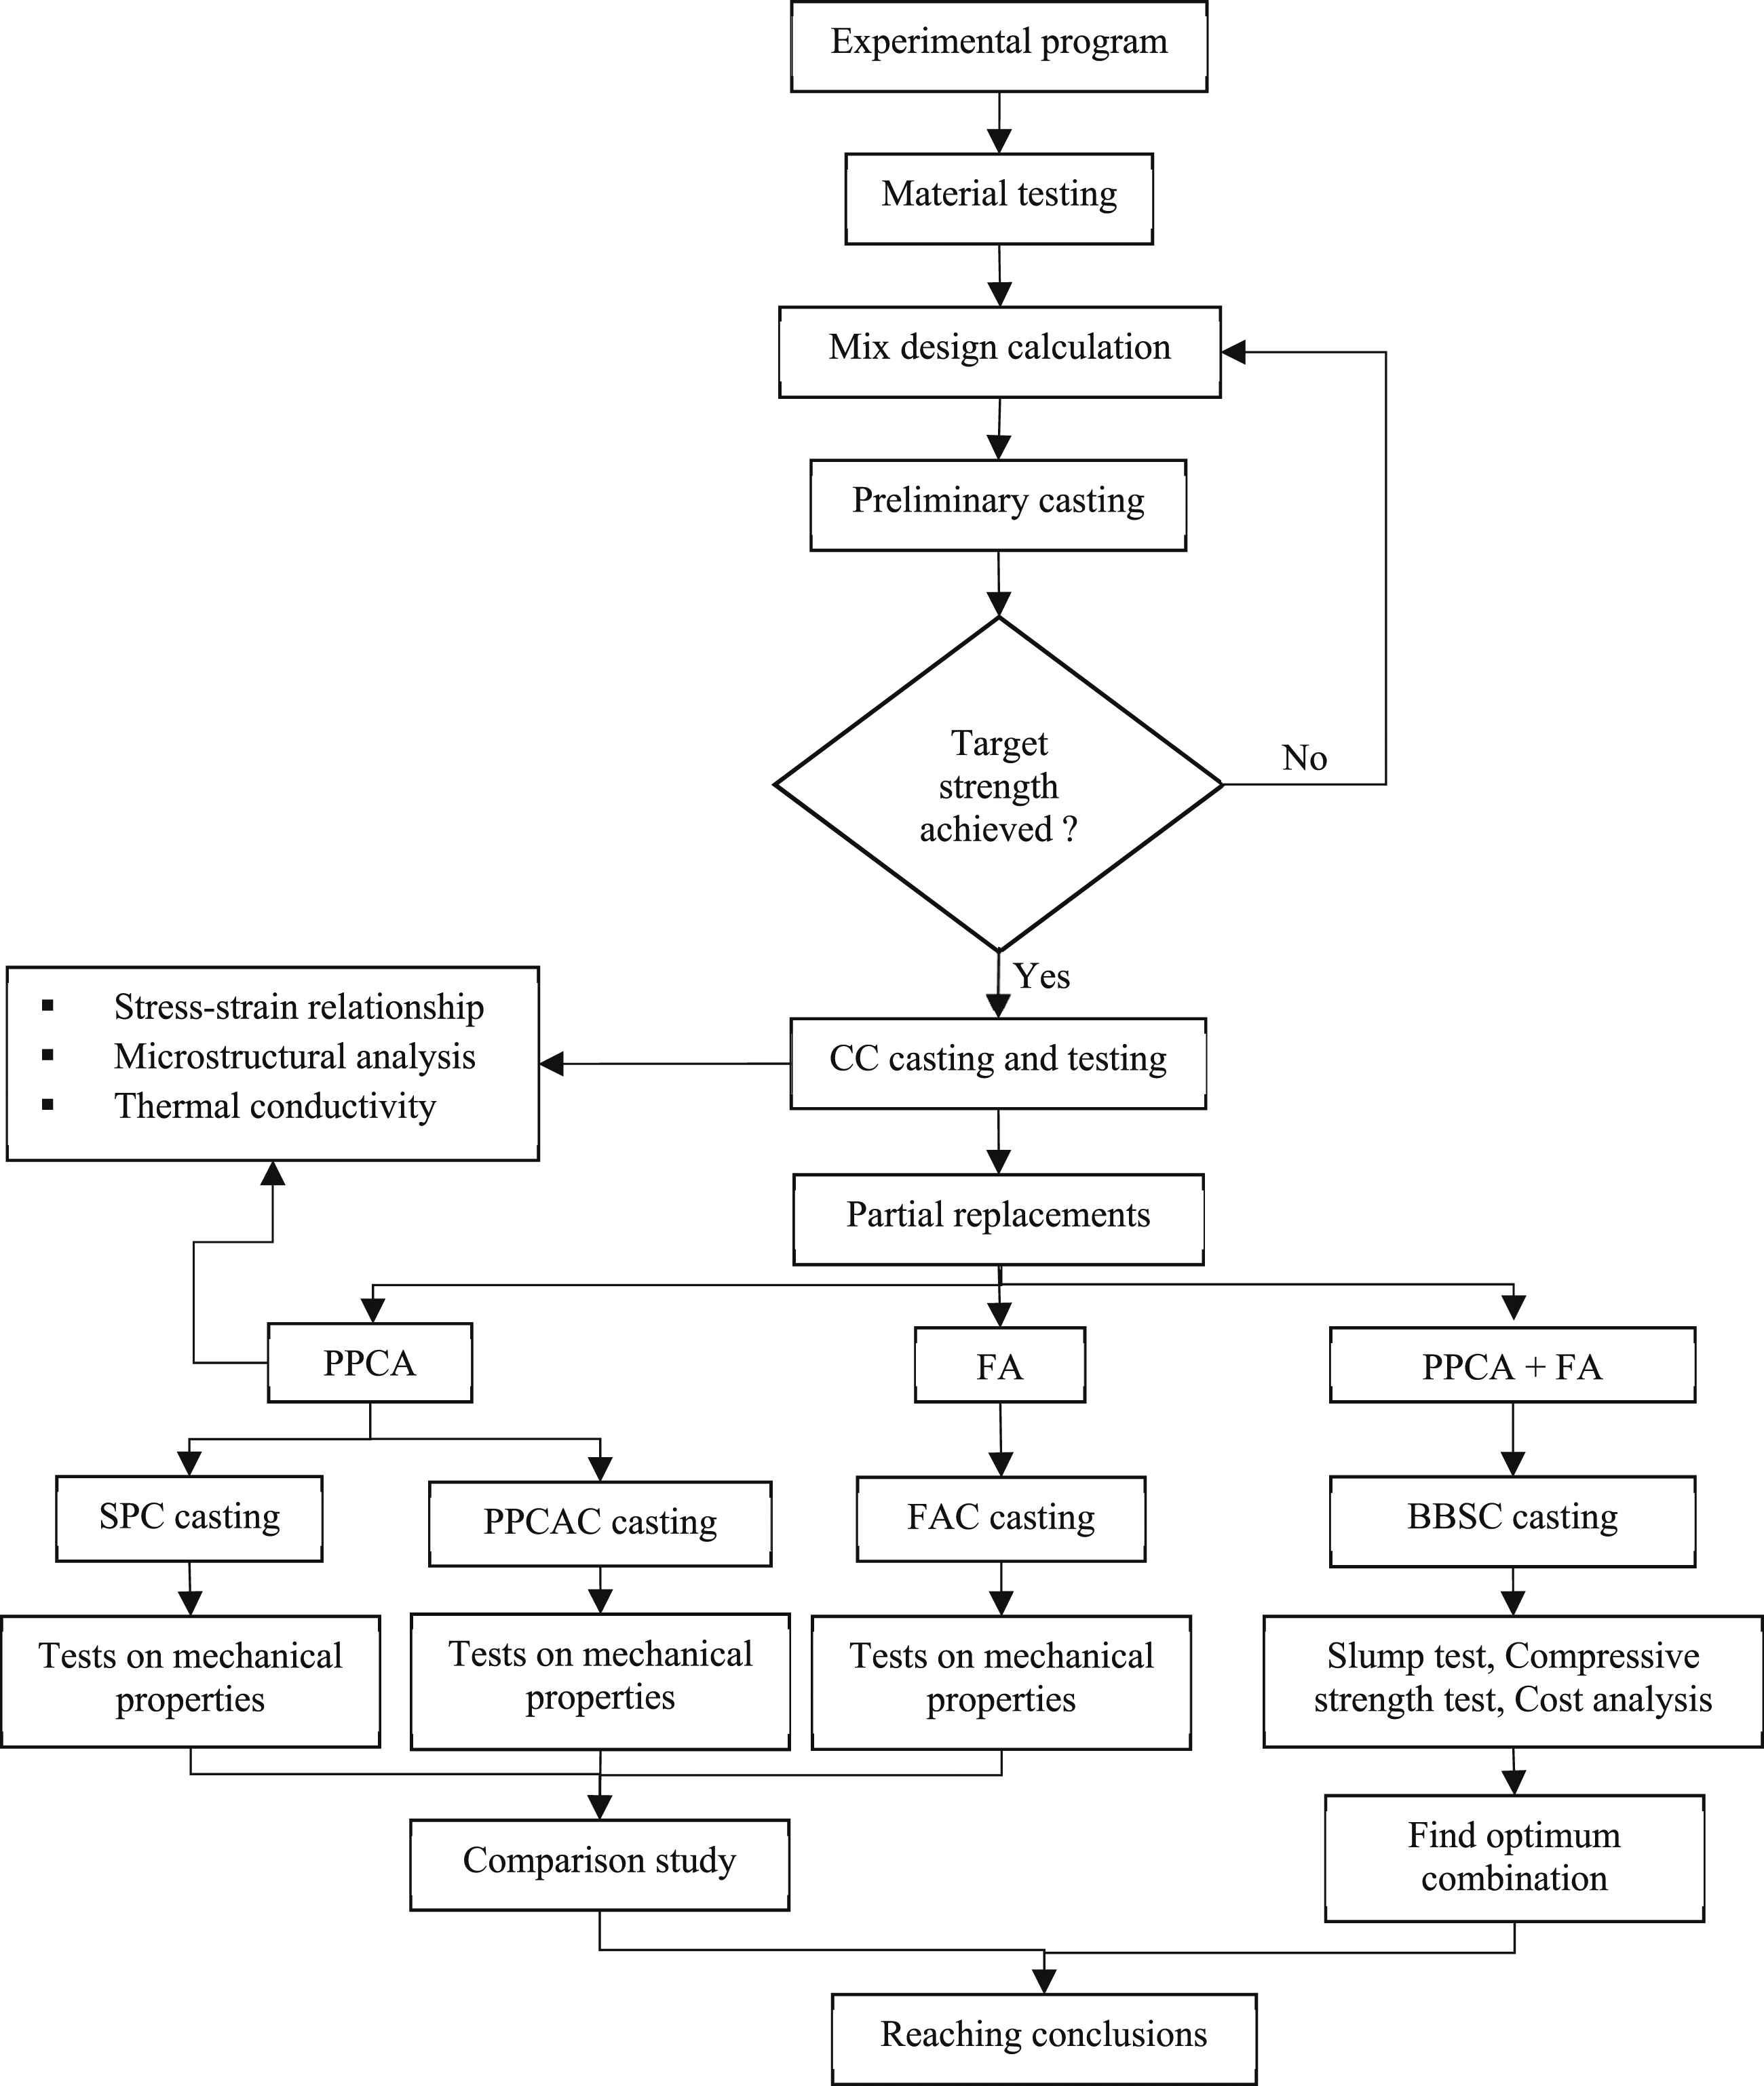
The combined addition of PPCA and FA was carried out to produce BBSC. After that, using mechanical performance and cost analysis, a suitable combination of PPCA and FA was proposed as sustainable concrete.
Materials
Cement
Ordinary Portland Cement of CEM I 42.5N classification was utilized for all the mixtures.
Fine aggregate
Properties of river sand.
Particle size distribution of fine aggregate.
Coarse aggregate
Properties of coarse aggregates.
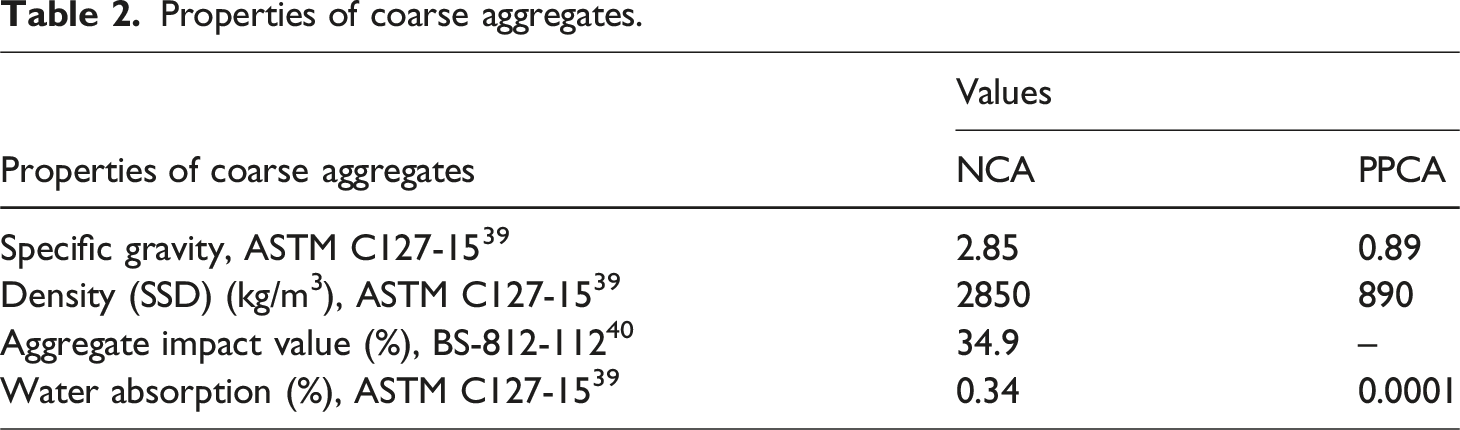
PPCA: Recycled crushed plastic waste was utilized as coarse aggregate in this research work. These PPCAs as displayed in Figure 3 were acquired from the plastic and polythene waste recycling centre, Gohagoda, Kandy municipal council, Sri Lanka. PPCA was made by shredding waste plastic into small pieces using a mechanically operated plastic shredder. The physical properties of PPCA can be seen in Table 2. Most of these properties were evaluated in accordance with ASTM standards. Recycled crushed polypropylene plastic coarse aggregates.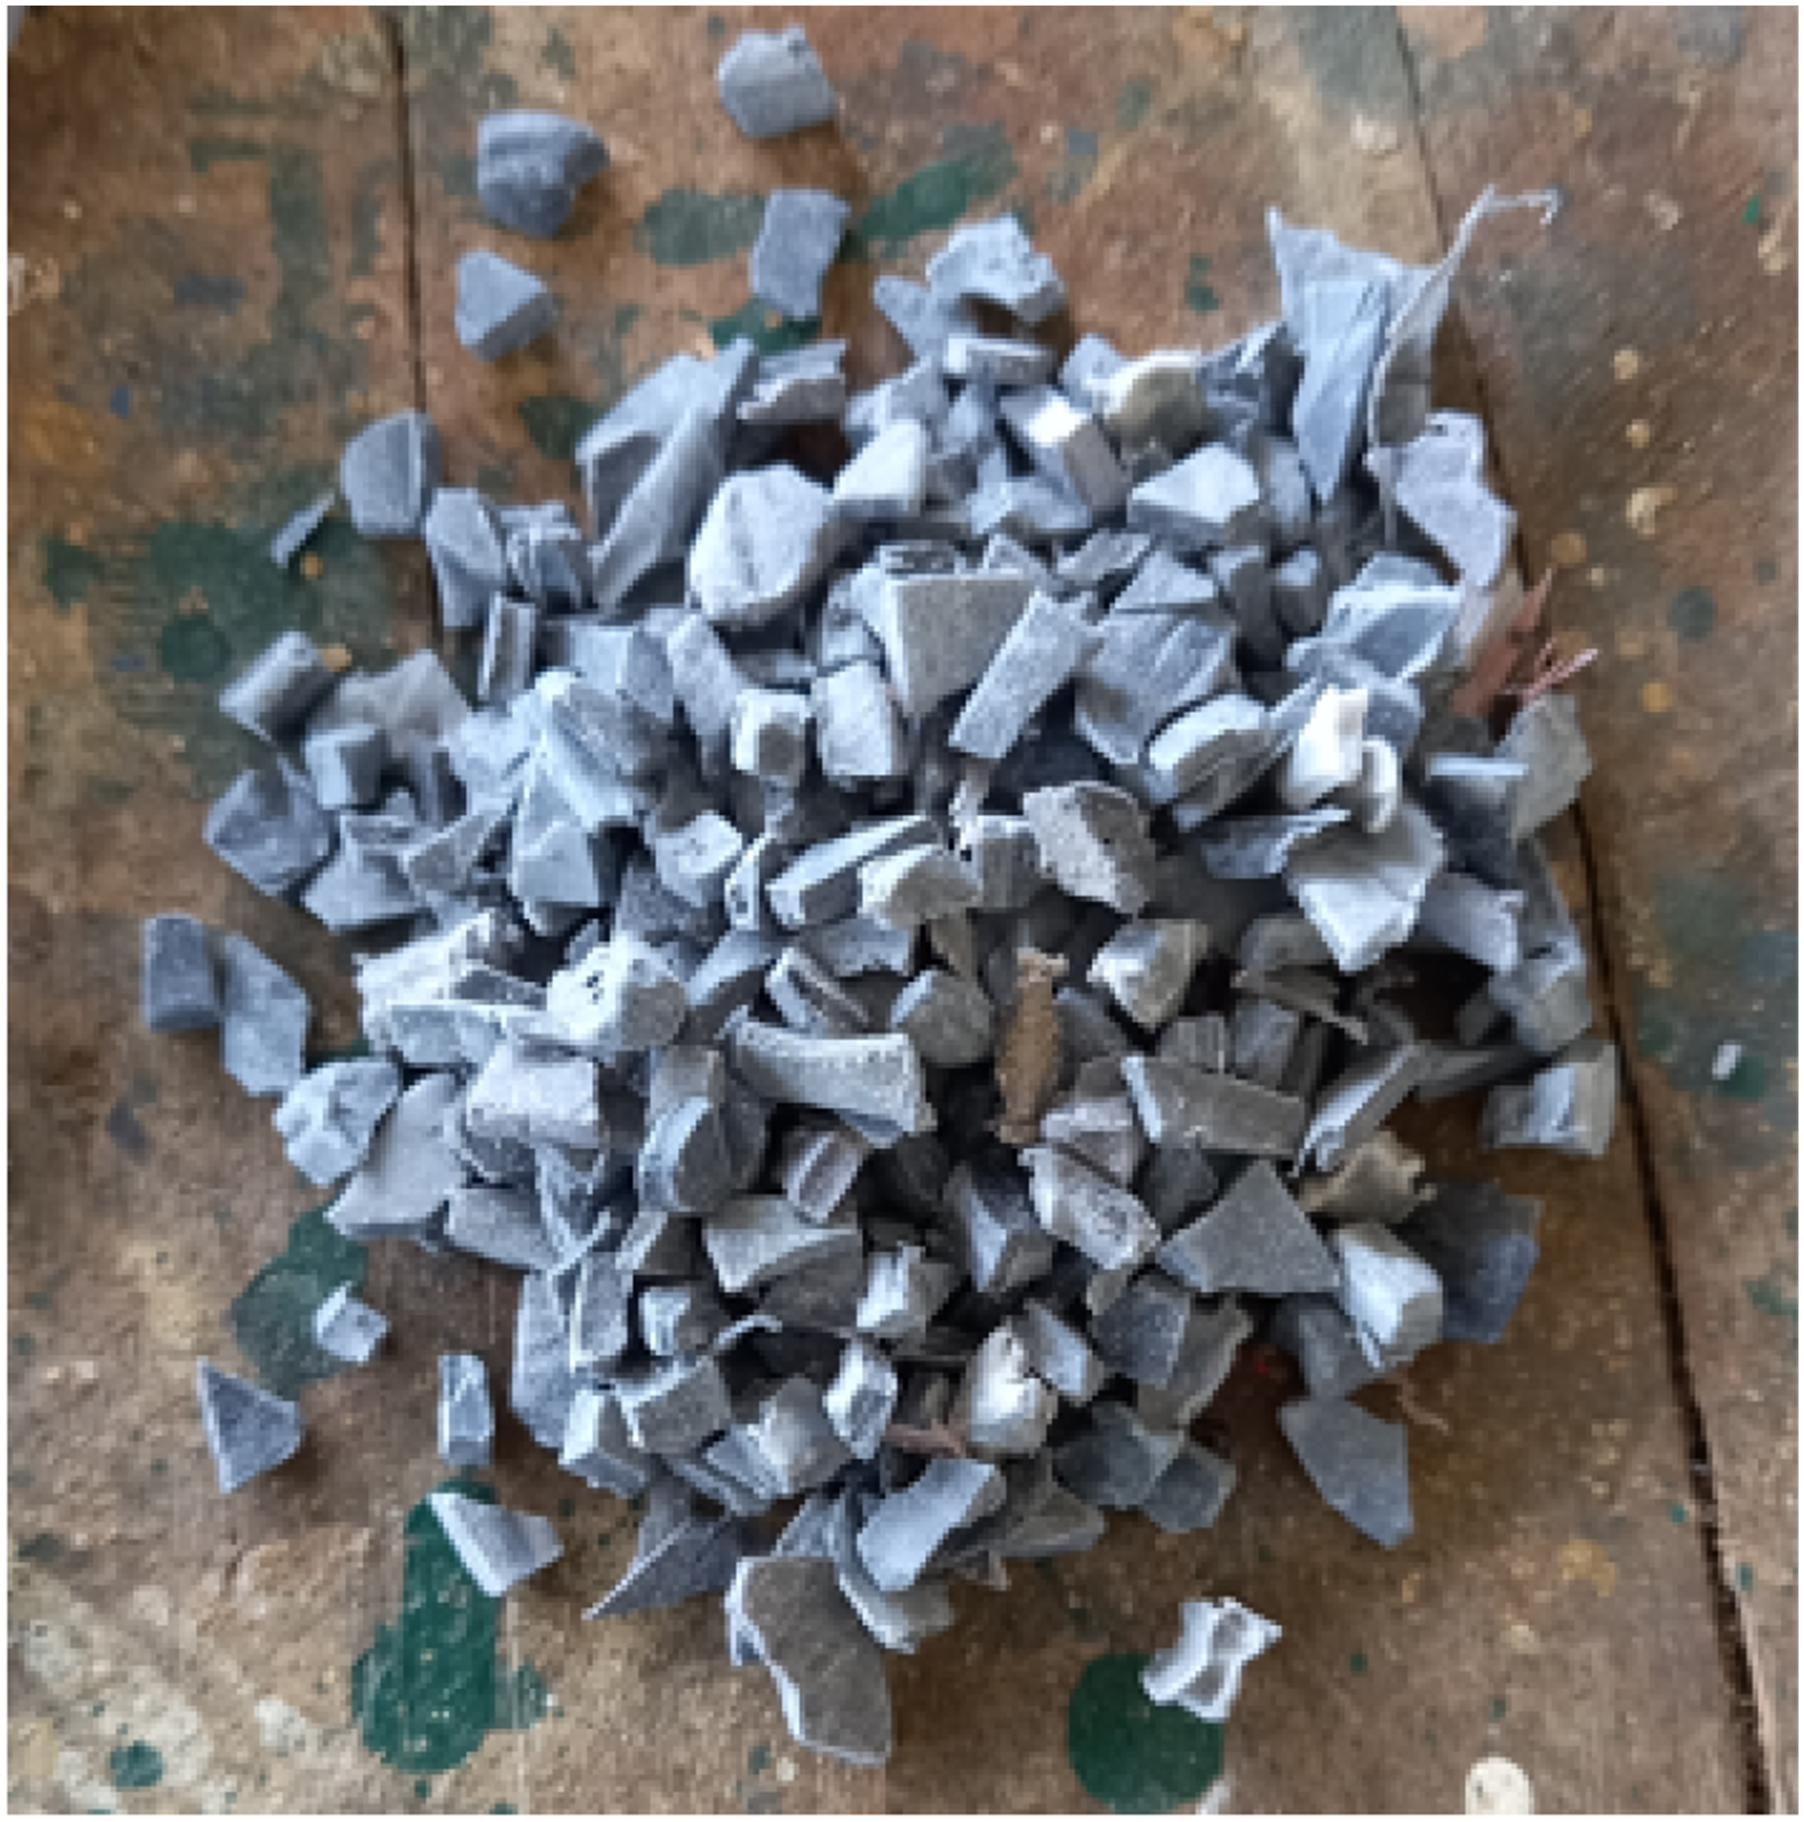
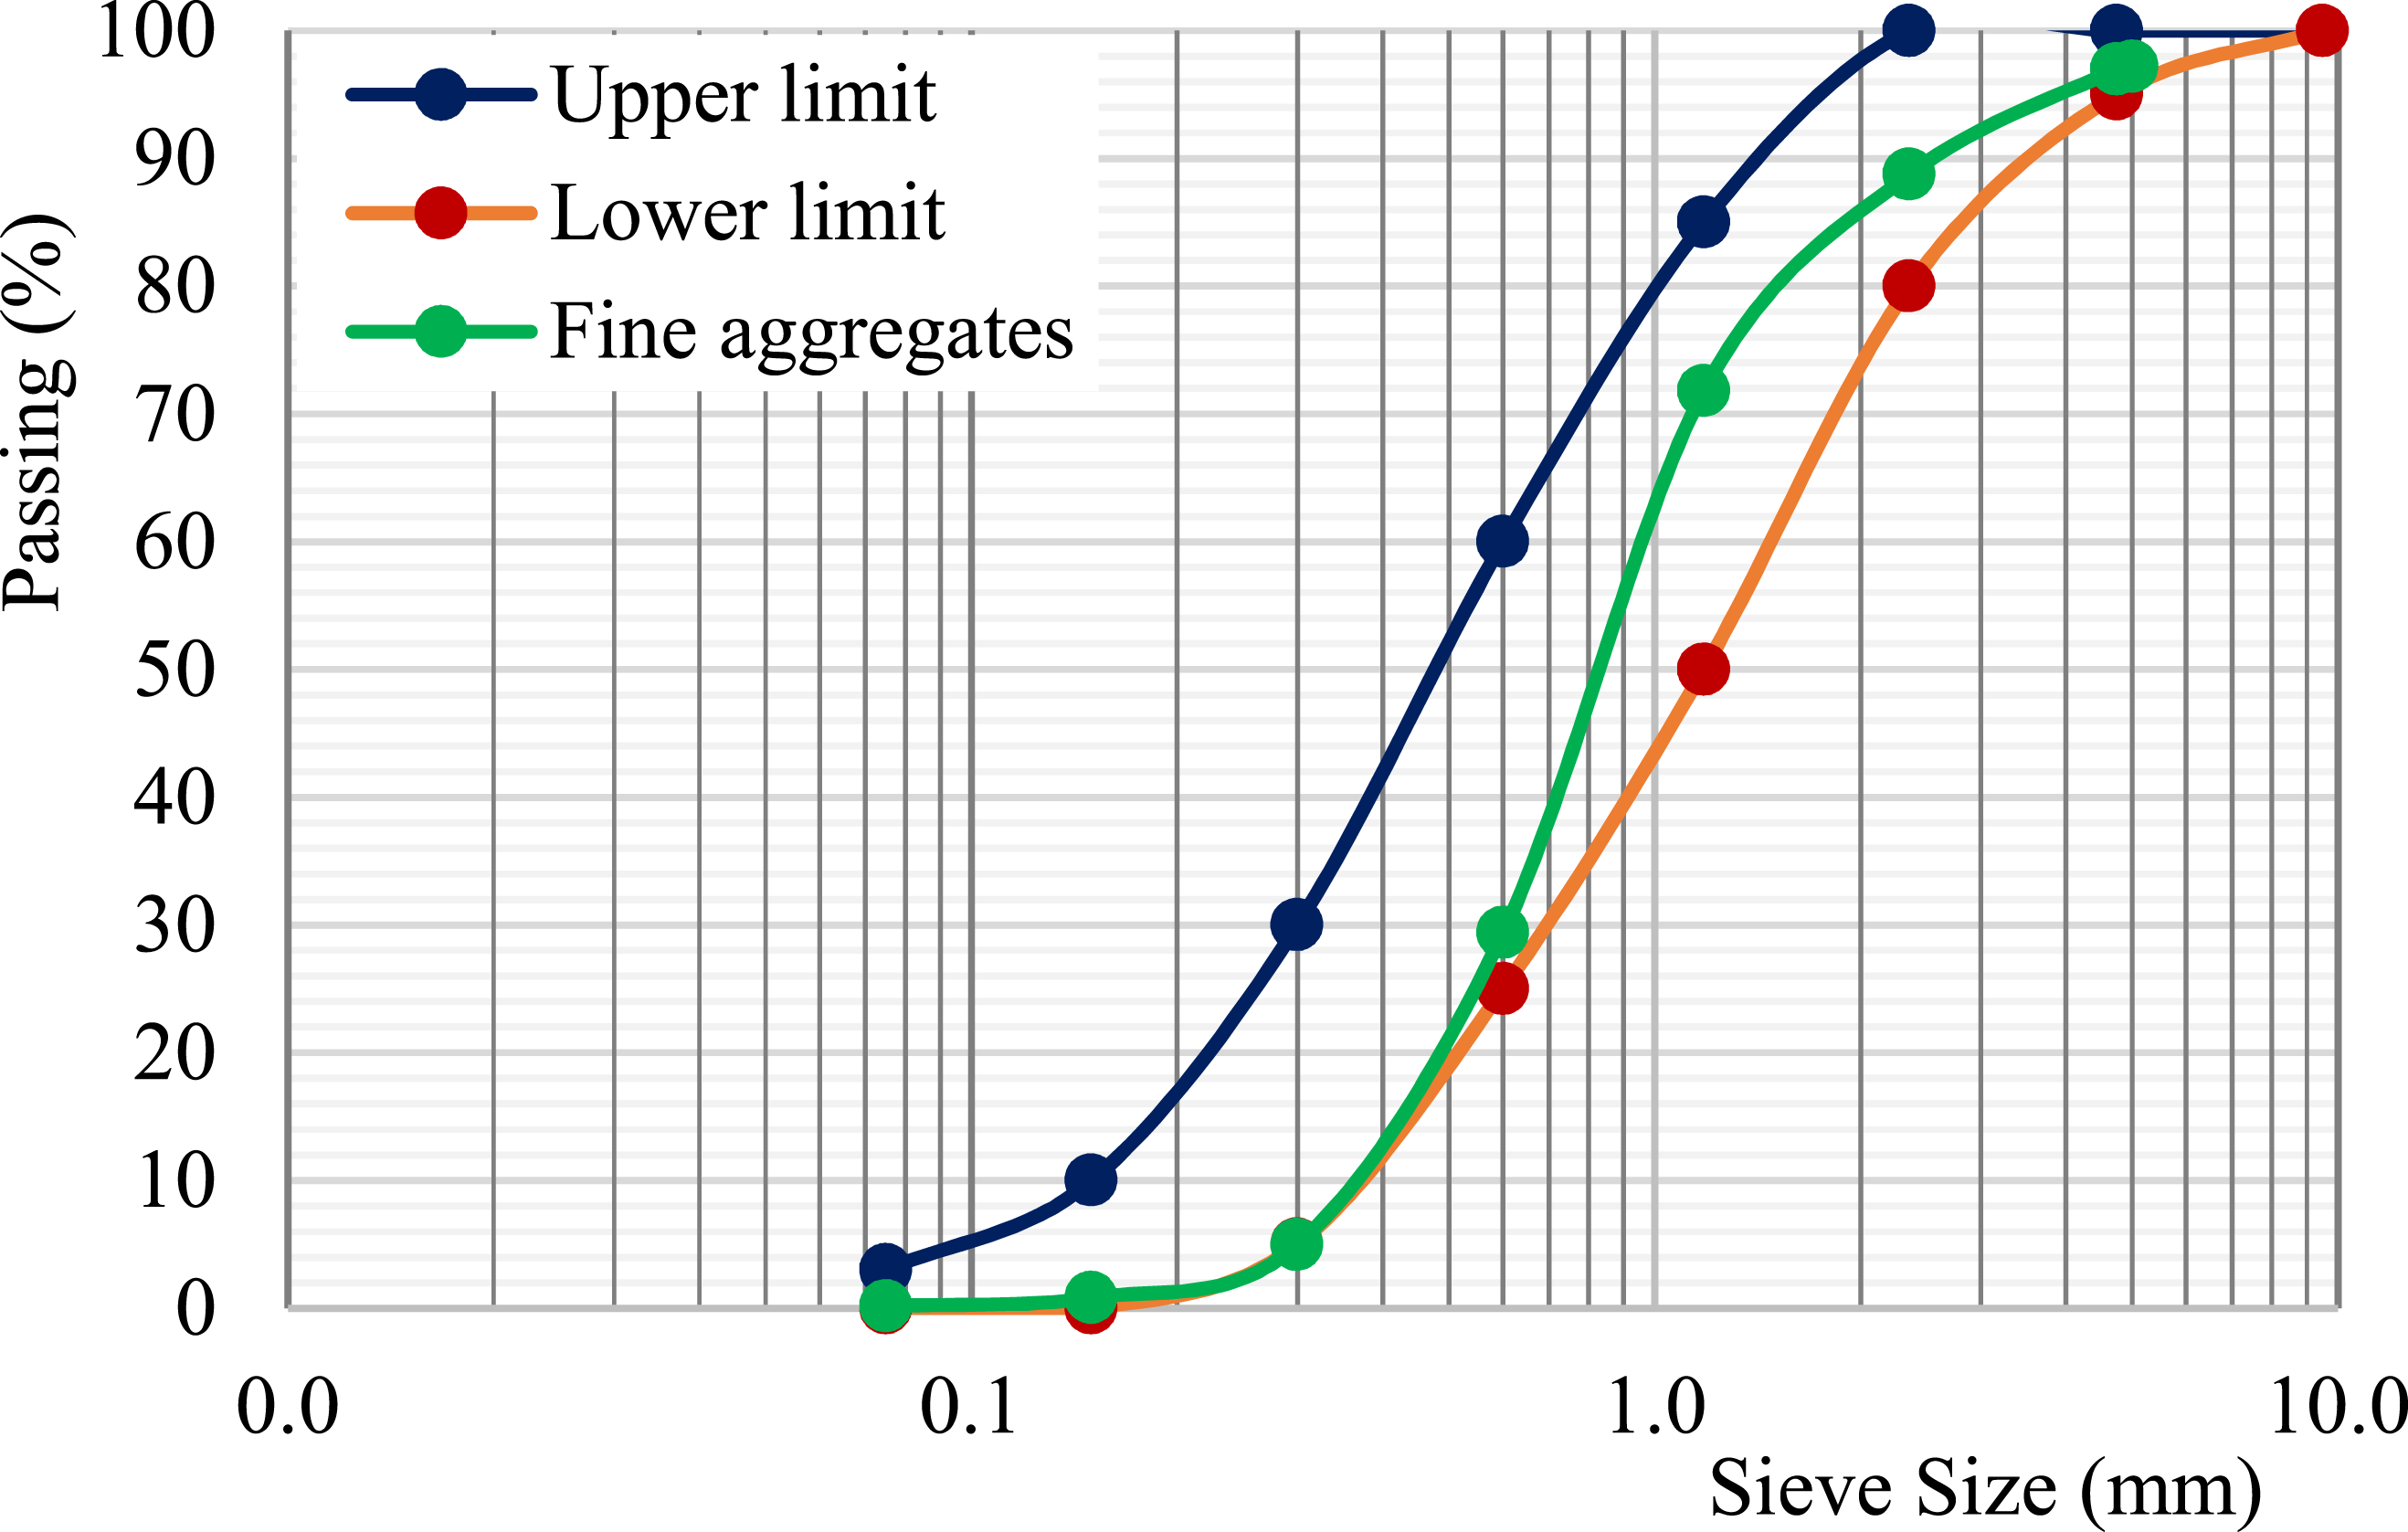
The particle size distribution of PPCA and NCA along with ASTM C33-18
35
standard limits are shown in Figure 4. Here, it should be noted that the gradation curves of PPCA and NCA lie within the coarse aggregate limits of 9.5 mm - 1.18 mm and 19 mm - 4.75 mm, respectively. Thereby, during the replacement more medium size PPCAs were added to concrete in place of regular size NCAs. In addition, PPCAs were sieved through a 4.75 mm sieve to eliminate the aggregates size less than 4.75 mm. Particle size distribution of coarse aggregates along with ASTM standard limits.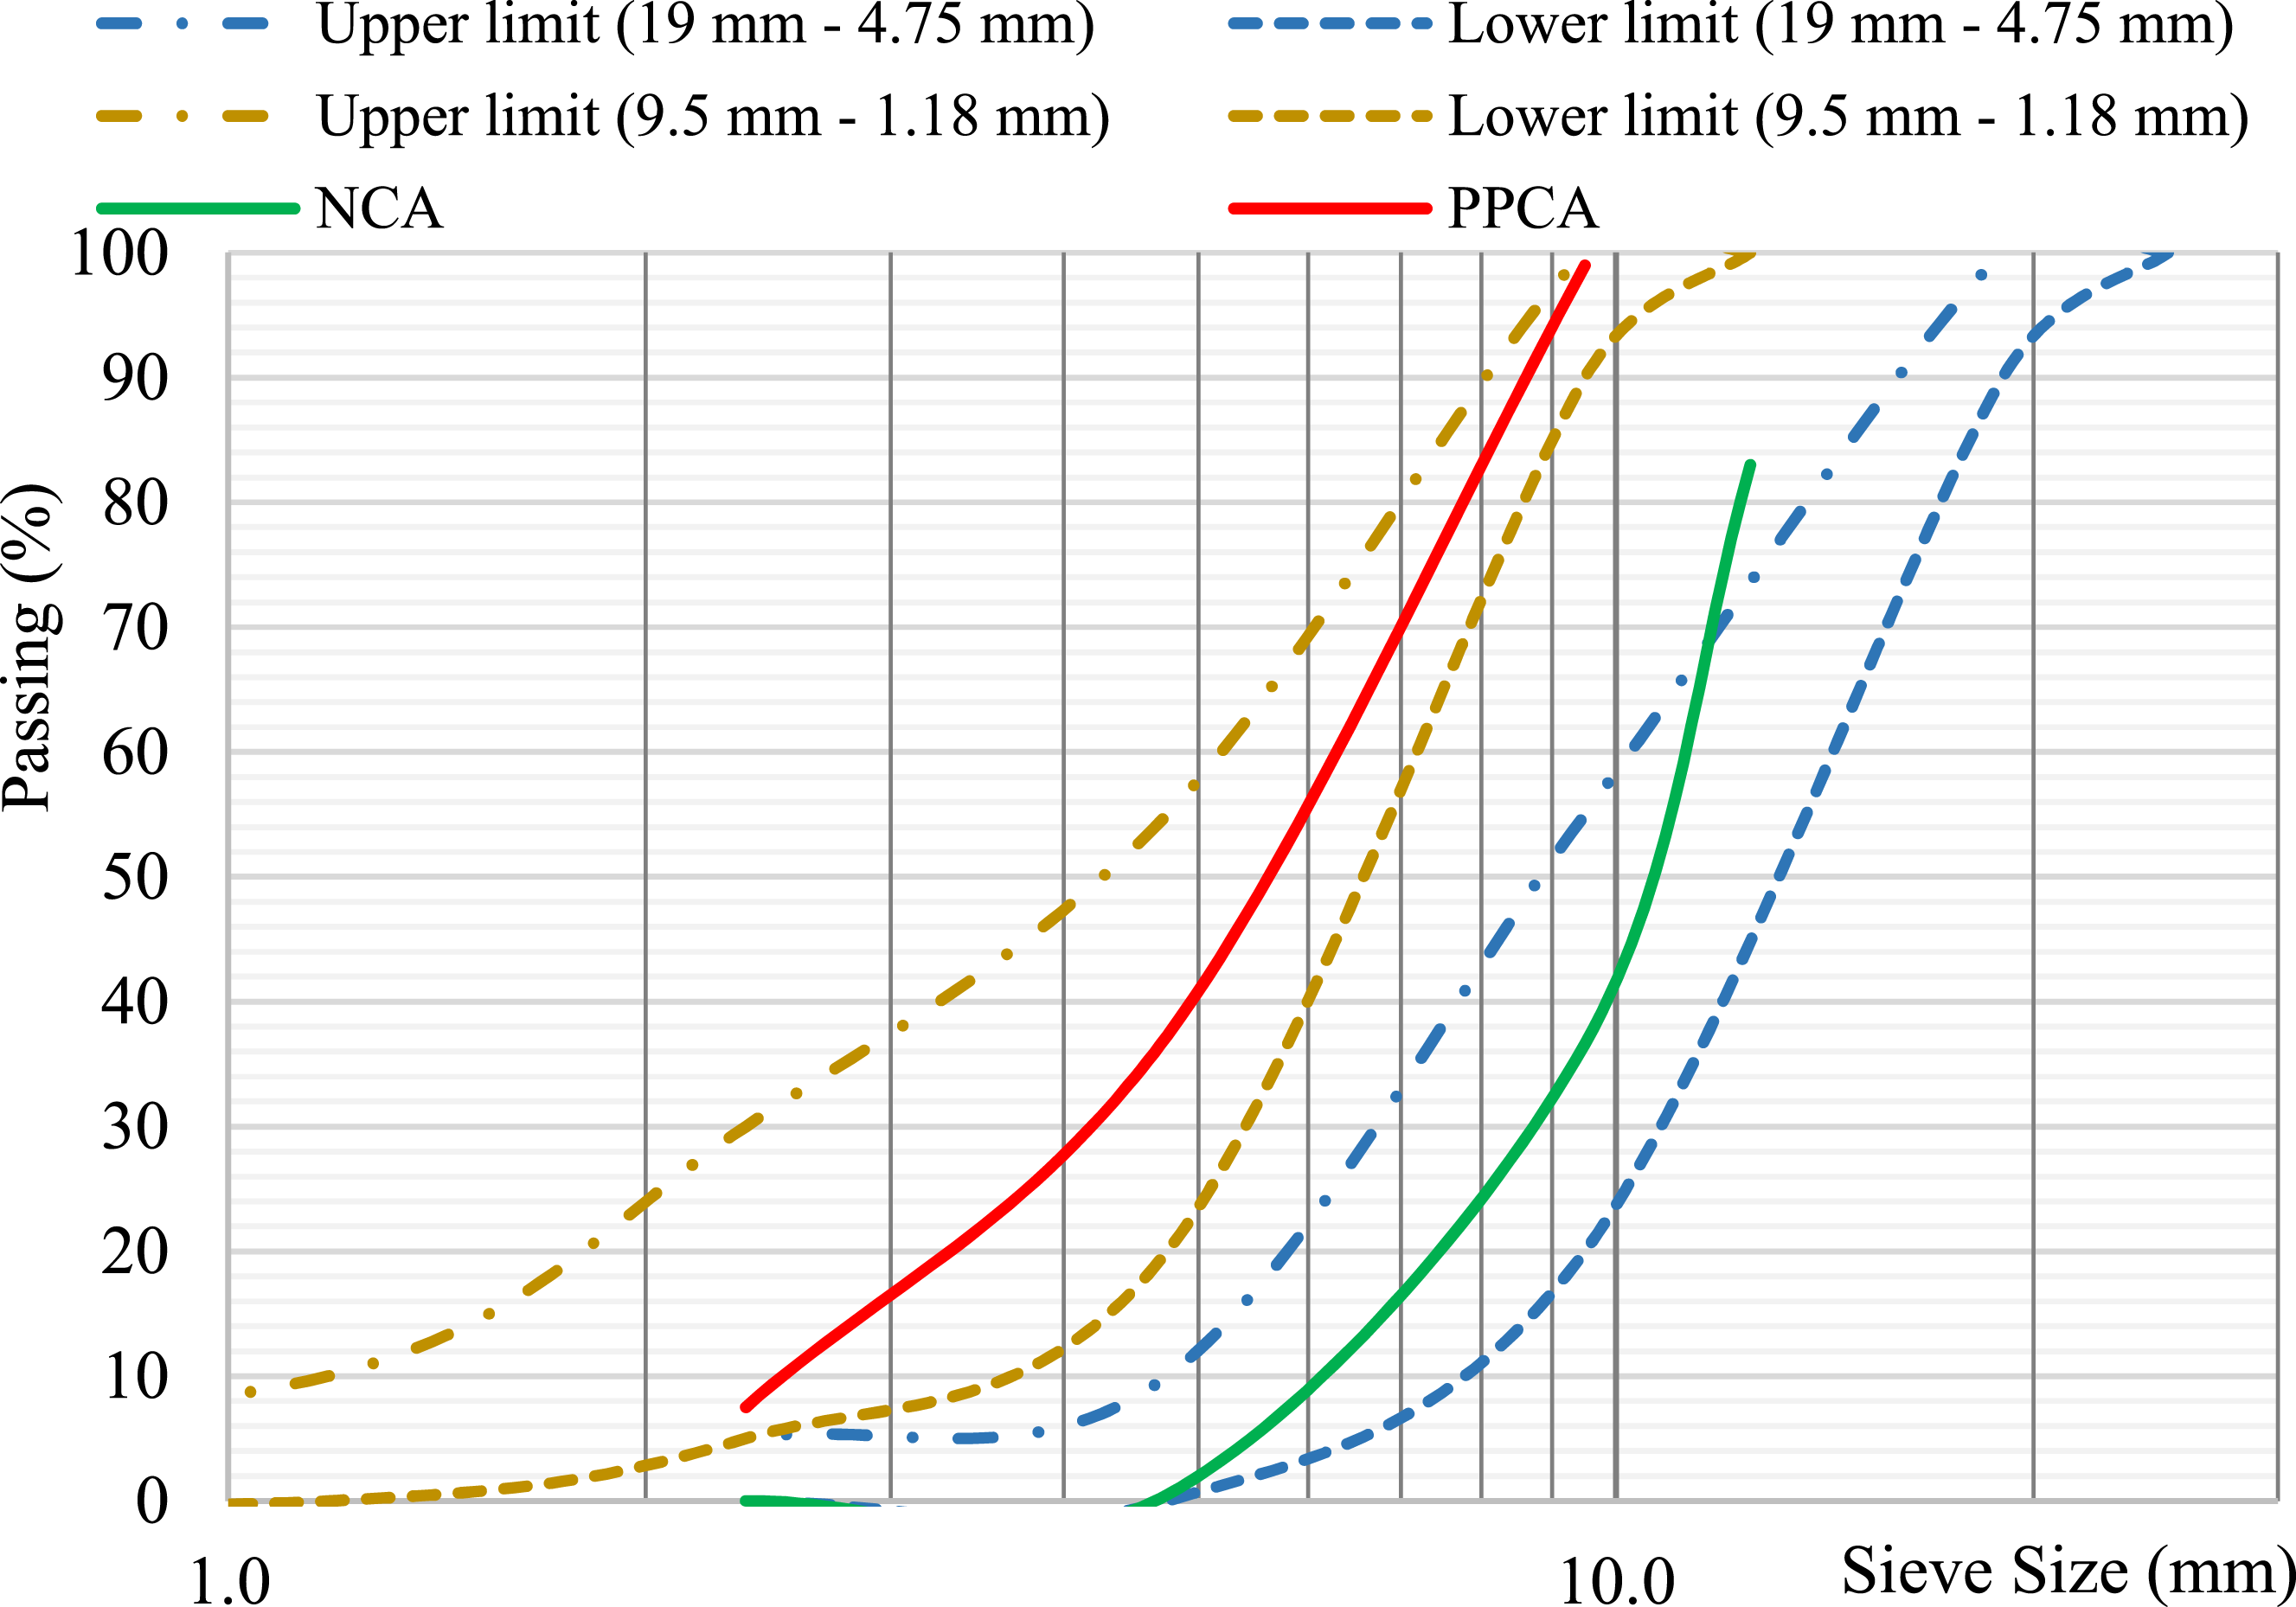
Fly ash
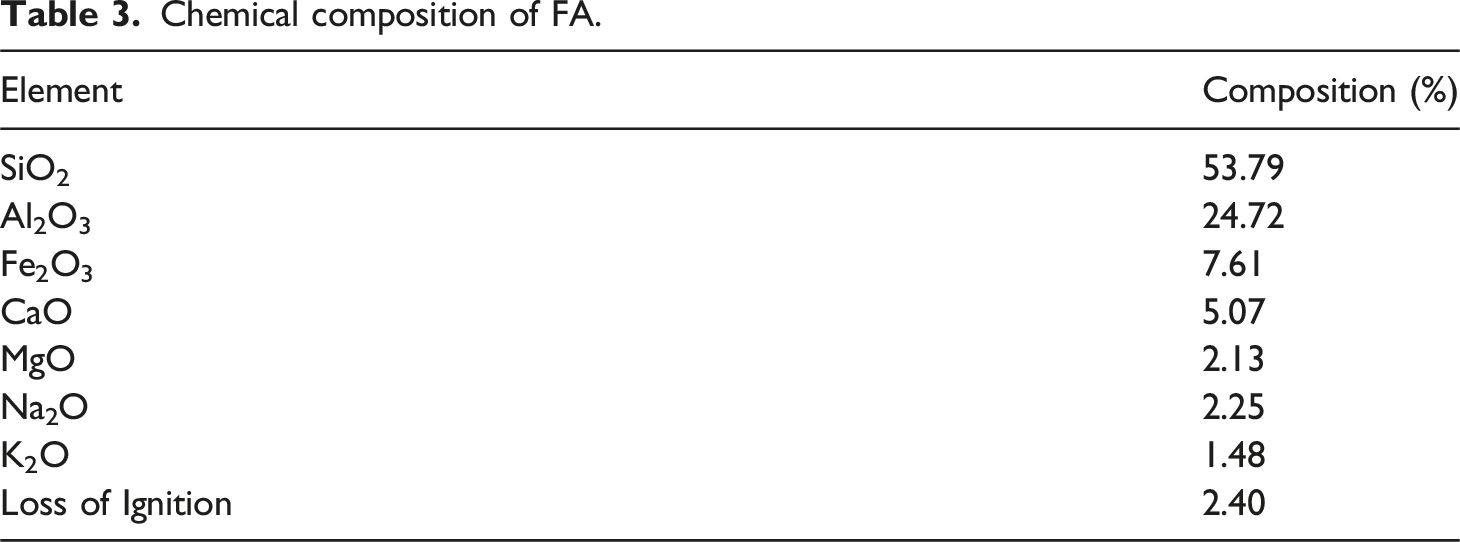
Chemical composition of FA.
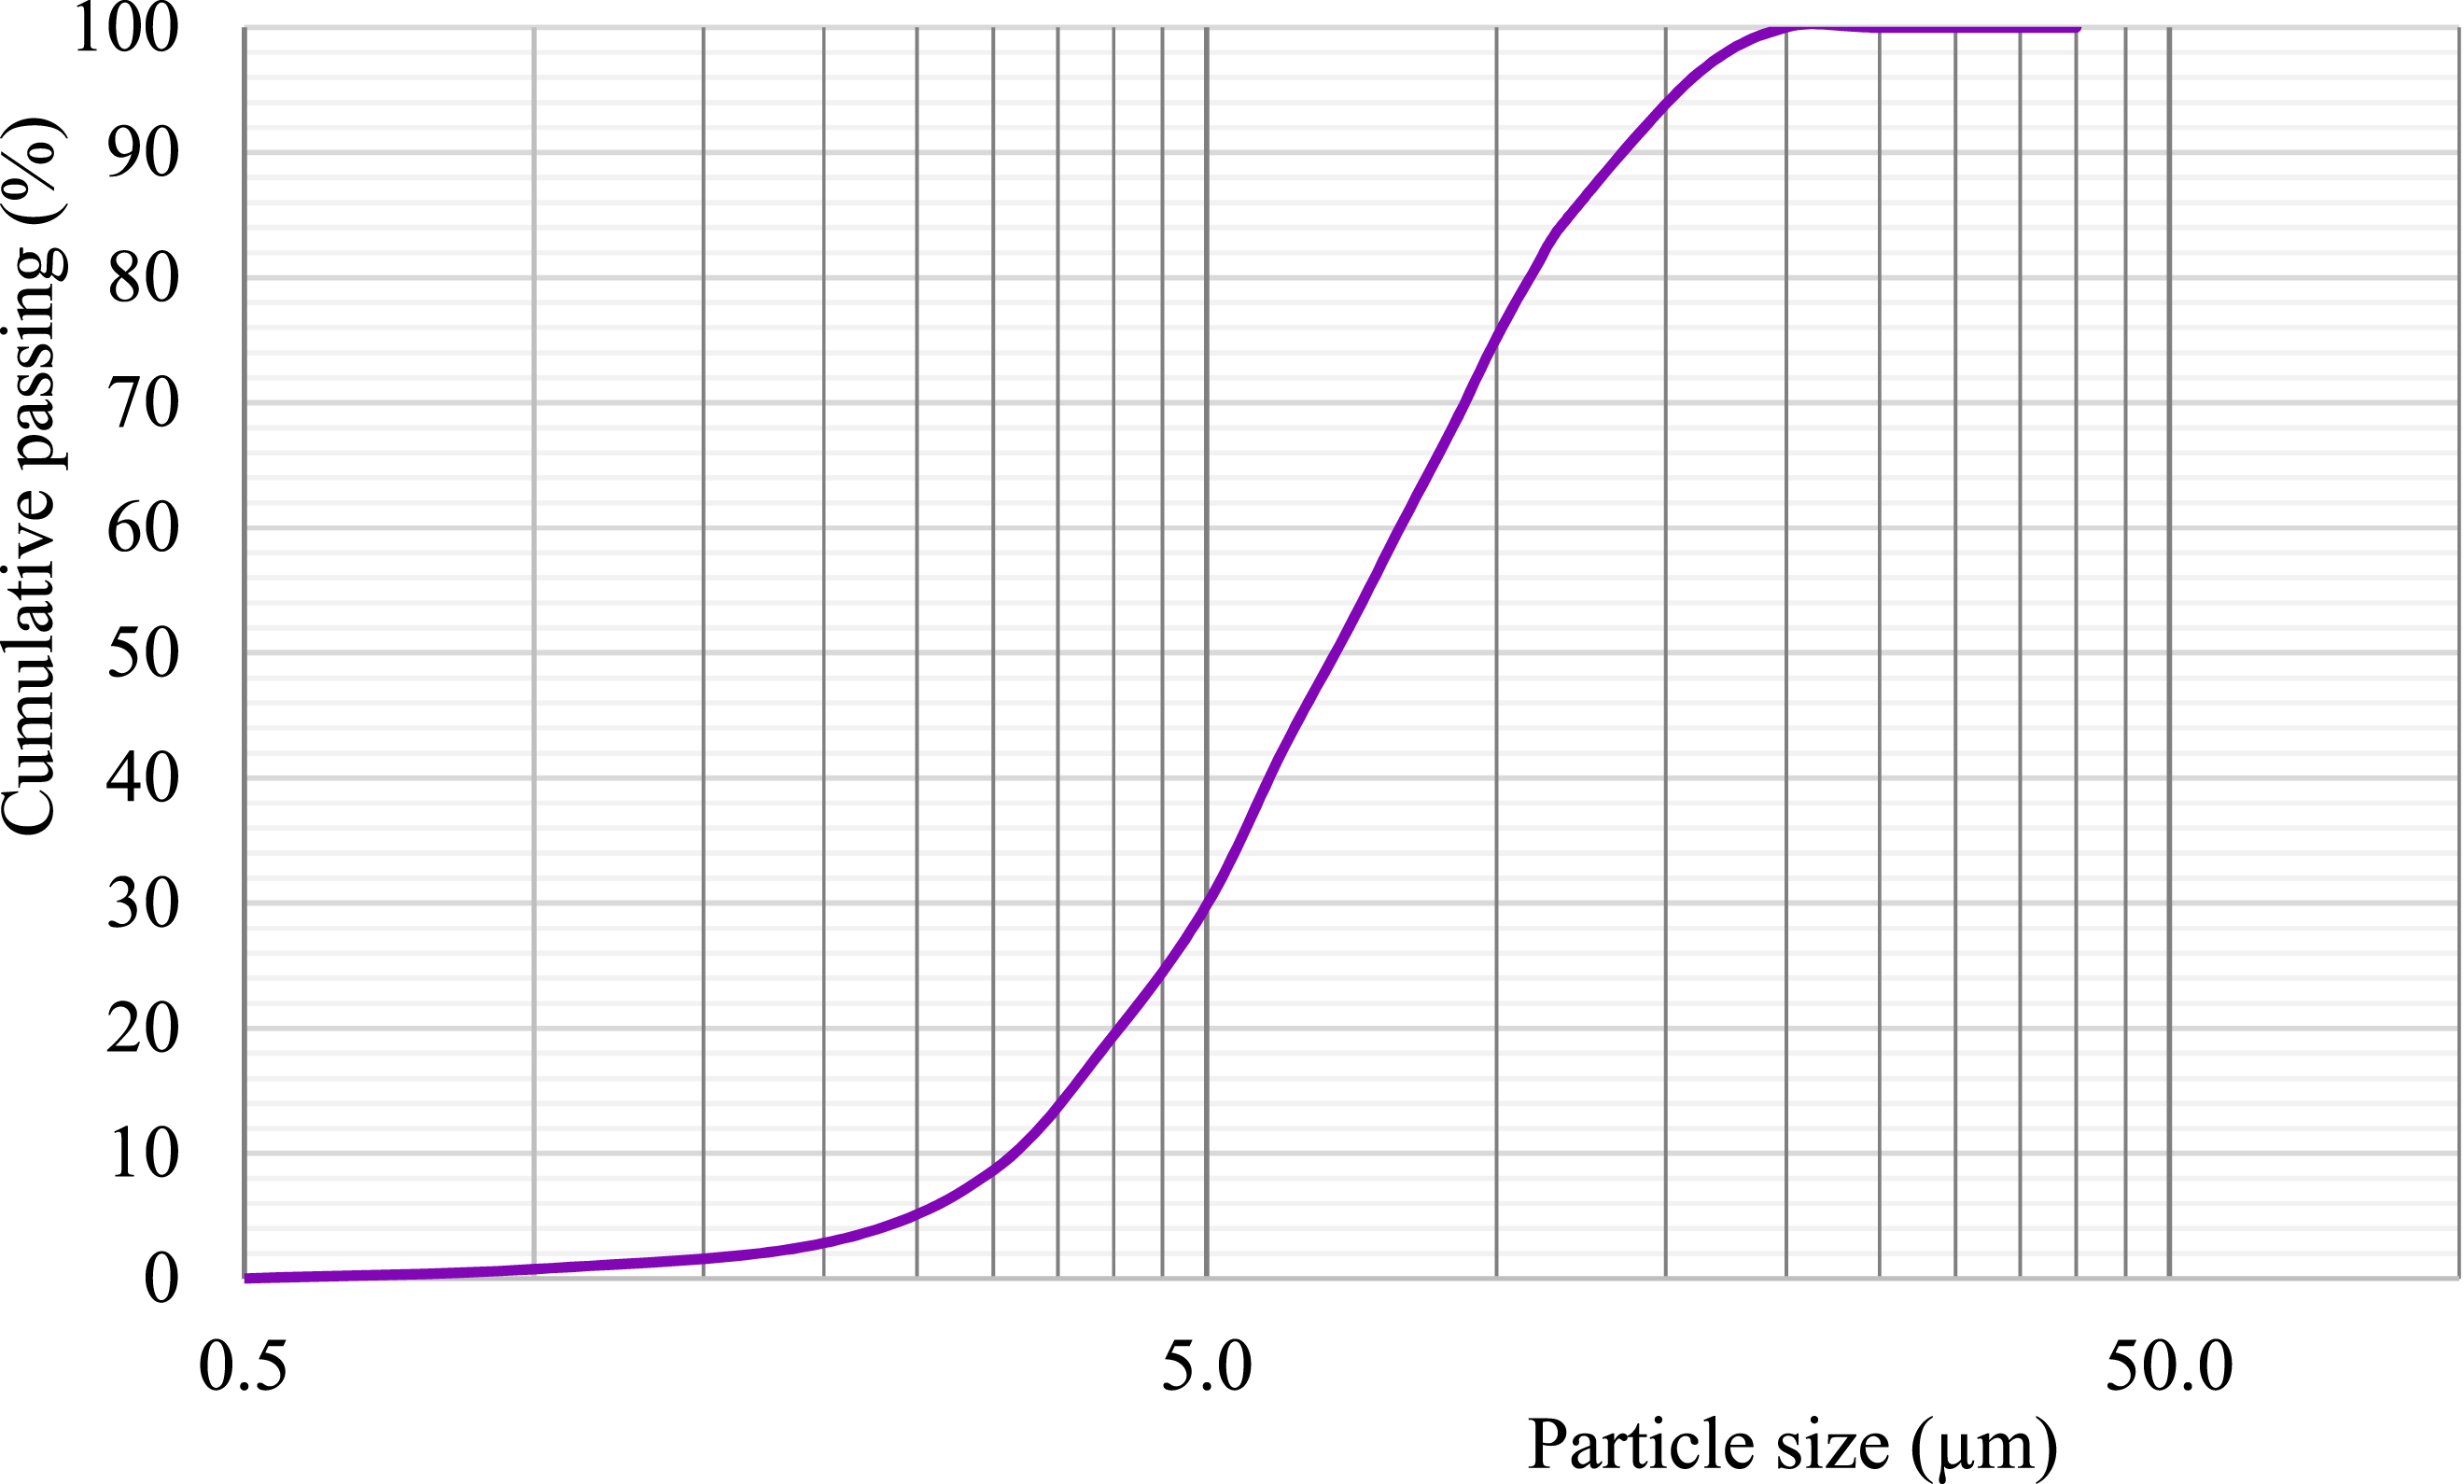
Particle size distribution of fly ash.
Water
Regular portable water was used for the mixing and curing of concrete.
Superplasticizer
A high-range water-reducing Plastobuild ES type SP was used to evaluate the performance of PPCA in SPC. The SP met the requirements of the ASTM C494 41 standard.
Mix proportioning
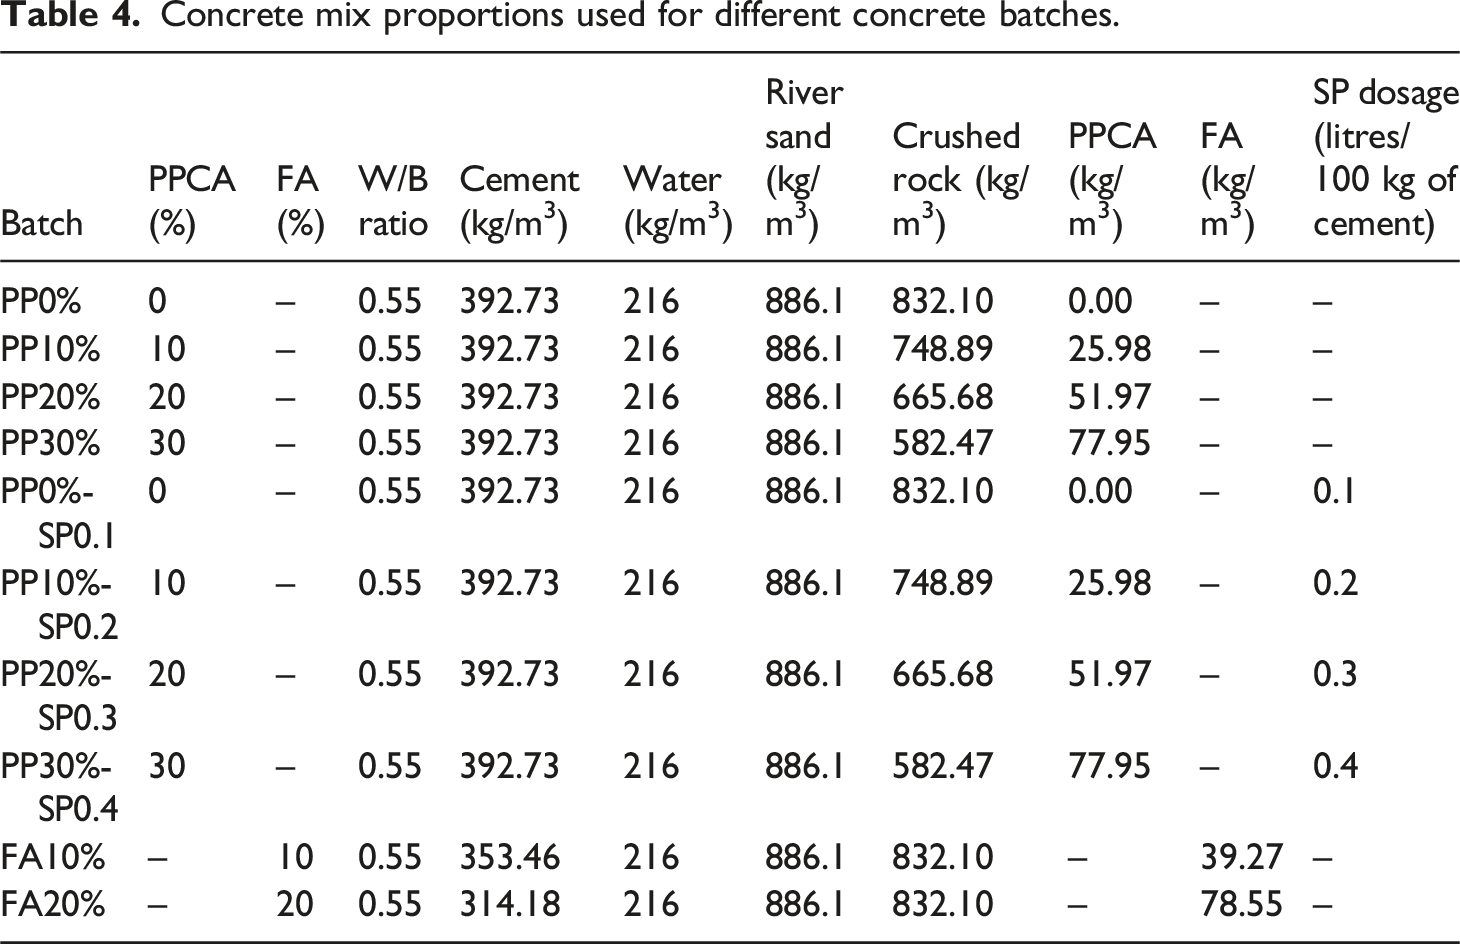
Concrete mix proportions used for different concrete batches.
Mixing of concrete
Mixing was done using a pan type of concrete mixer and the procedure given in ASTM C192/C192M-02 43 standard was adopted with slight modifications. Initially, all dry constituents such as NCA (PPCA was added for PPCAC batches), river sand and cement (FA was added for FAC batches) were thoroughly mixed. Then, half of the mixing water was added and mixed for 3 min (SP was dispersed in the mixing water at this stage for SPC batches). After that, the rest of the water was added and mixed for another 3 min. Finally, the mixer was stopped, and remixing was carried out by trowel for 2 min to ensure uniform mixing of concrete. Here, the fine aggregate was kept in dry condition during mixing and the coarse aggregate was maintained under the SSD condition (pre-soaked in water for 24 h and surface water was removed just before mixing).
Specimen fabrication
Upon mixing of concrete, workability and fresh density were measured. In each batch, nine concrete cube specimens of size 100 mm × 100 mm × 100 mm for cube compressive strength test and dry density test; one additional cube specimen was cast to observe the PPCA arrangement inside the specimen; four cylinder specimens of diameter 150 mm and height 300 mm for MoE test and splitting tensile strength (STS) test; three prisms of size 100 mm × 100 mm × 500 mm for flexural strength test; and six cylinder specimens of diameter 100 mm and height 200 mm to obtain stress–strain relationship and to get samples for microstructural and thermal analysis were cast into respective steel moulds as shown in Figure 6. During the casting freshly mixed concrete was poured layer by layer into steel moulds. Standard hand compaction was applied for each layer because, during the trial preliminary castings of highly workable concrete it was observed that the PPCA tended to float when applying compaction using a vibrating table and resulted in a nonuniform distribution of PPCA as per Figure 7. Therefore, hand compaction was done carefully to produce a uniform mix and SP dosage was limited to prevent the segregation of PPCA. Fabricated specimens for PP30% batch. Top surface of cube specimen with floated PPCA after compaction using a vibrating table.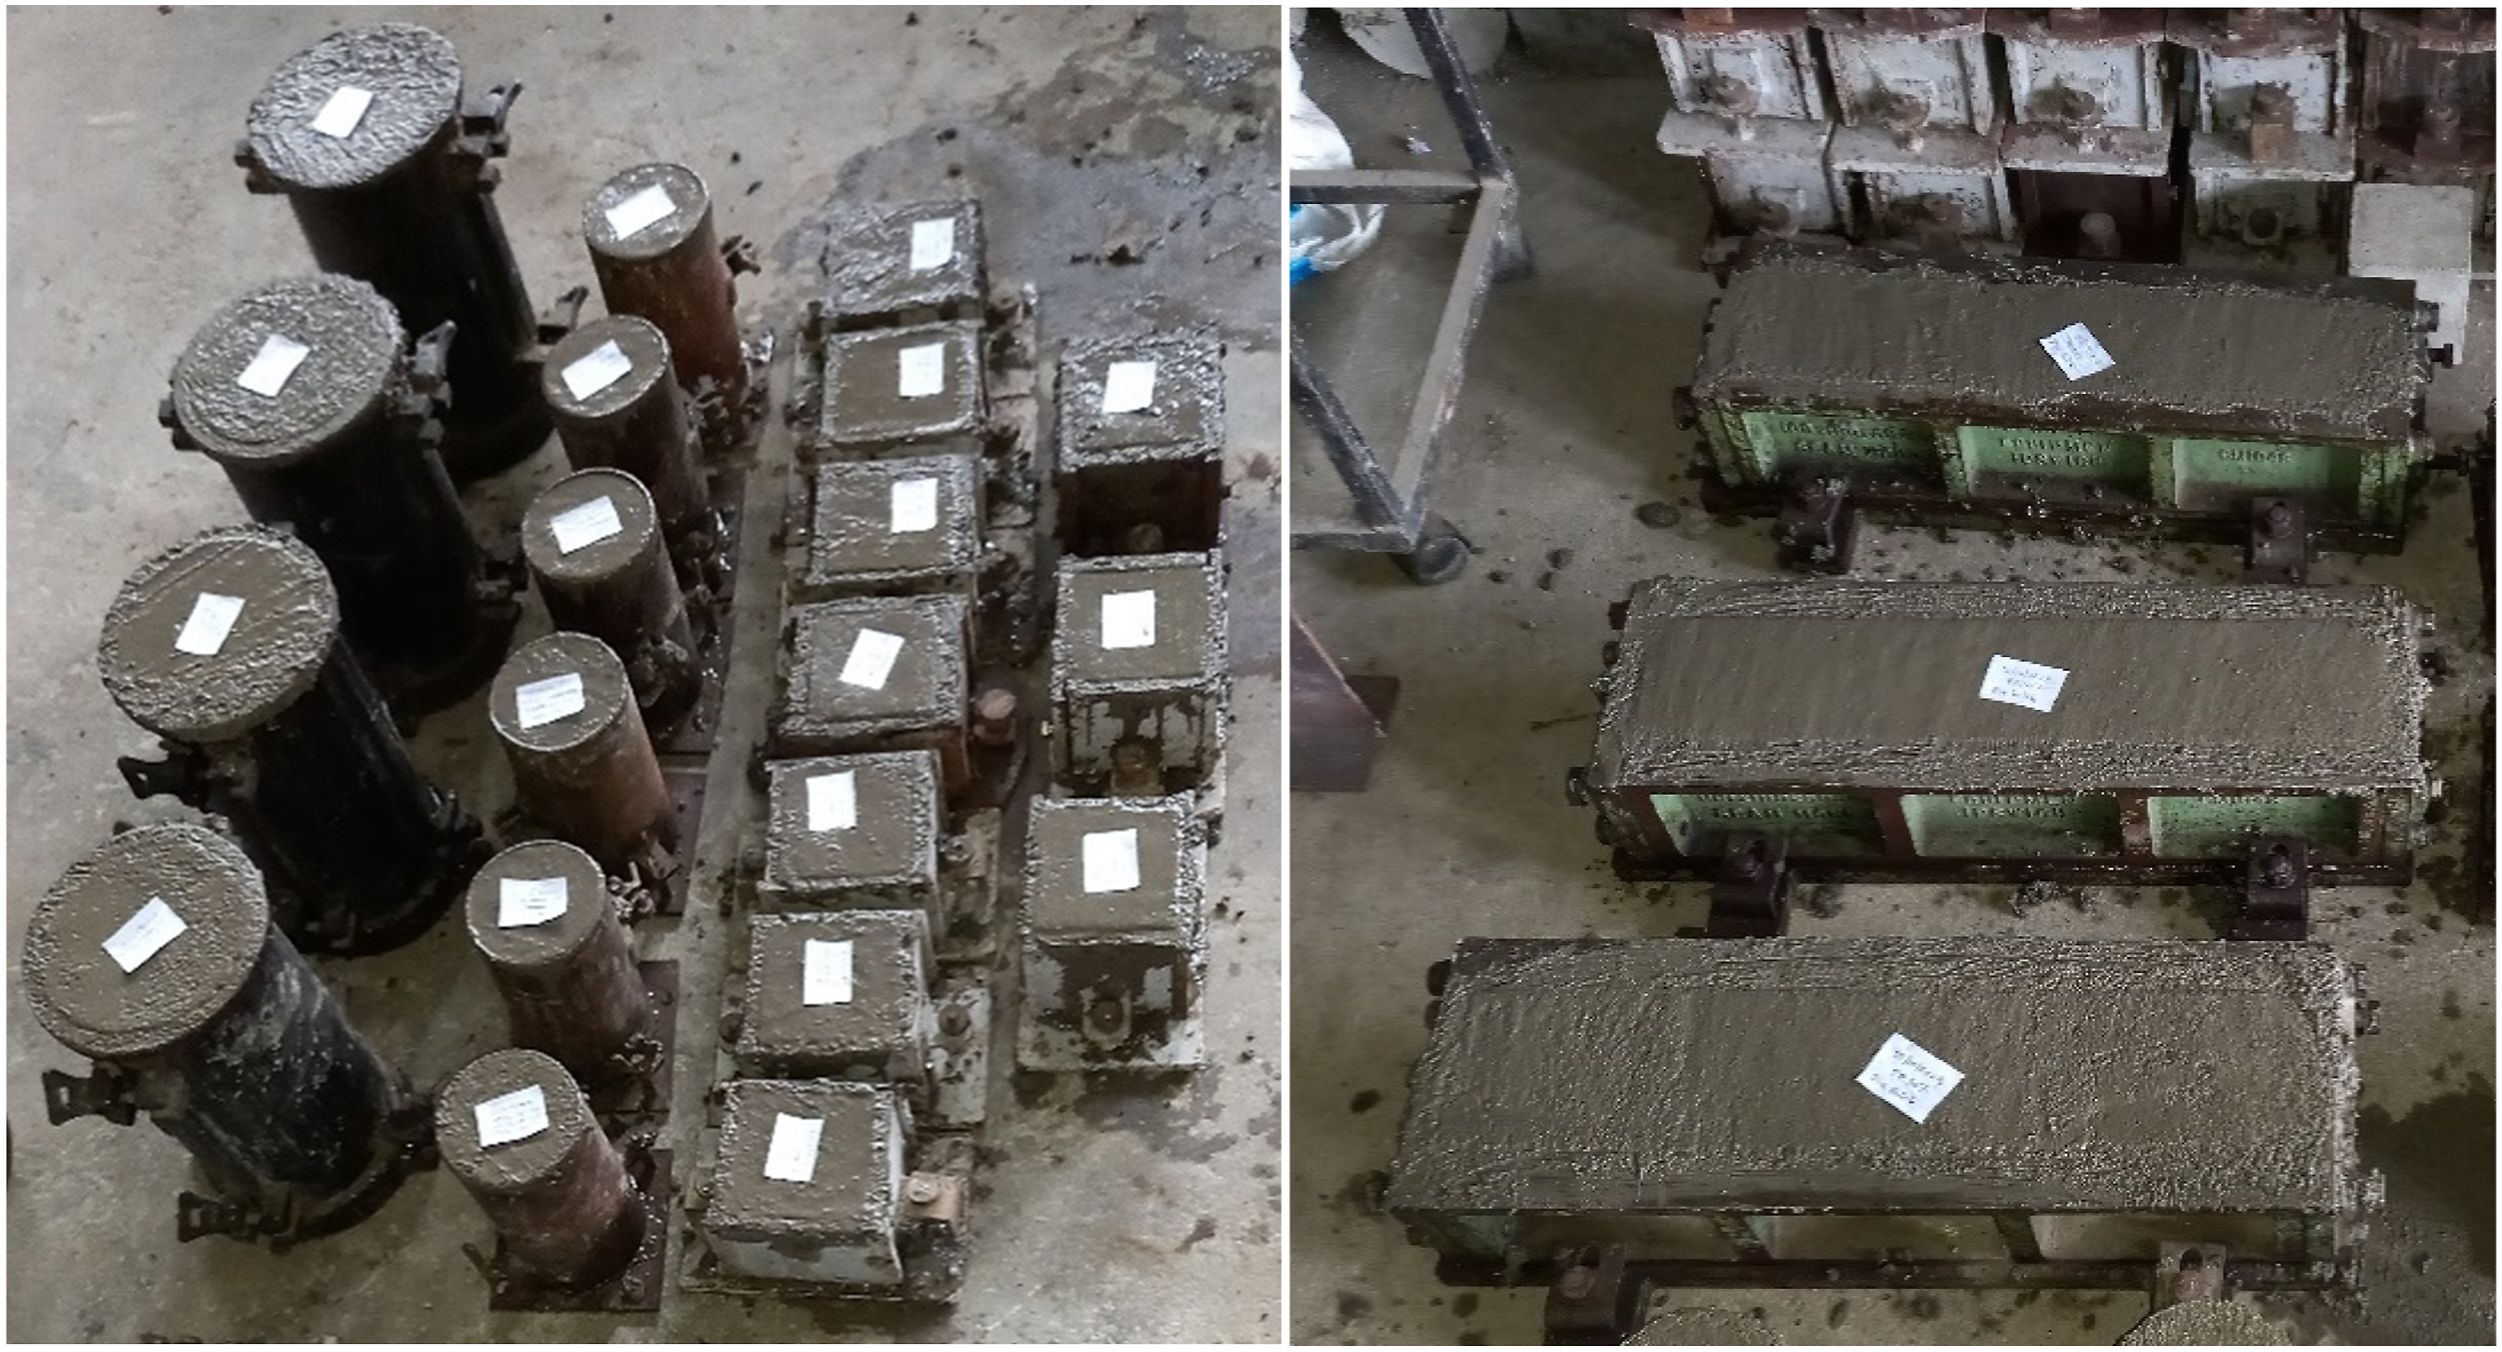
After that, the specimens were covered using a polythene sheet, and to maintain the humidity, a bowl with water was placed inside the cover. Then, the samples were allowed to harden for 24 h in the laboratory environment before demoulding. Next, curing was done by submerging the hardened concrete specimens in the water tank until the day of testing. For each test, three specimens were cast and tests on these specimens were carried out at 28-days. Additionally, 7-days test was carried out for the compressive strength test.
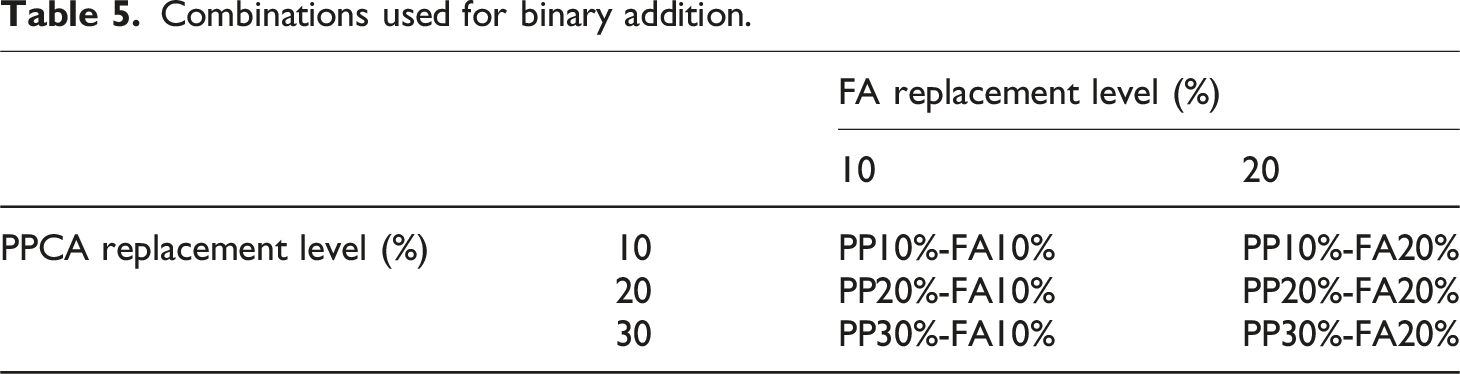
Binary addition of PPCA and FA
Combinations used for binary addition.
Testing of concrete
The method of testing and respective standards to find short-term mechanical performance of concrete batches are presented in this section.
Fresh concrete properties
The consistency of freshly mixed concrete was assessed through the standard slump cone test conforming to ASTM C143/C143M
44
standard. Figure 8(a) and (b) show the slump measurements of PPCAC (PP30%) and FAC (FA20%), respectively. In addition, wet density was measured conforming to ASTM C138/C138 M
45
standard. Slump of (a) Polypropylene plastic coarse aggregate concrete, (b) Fly ash concrete.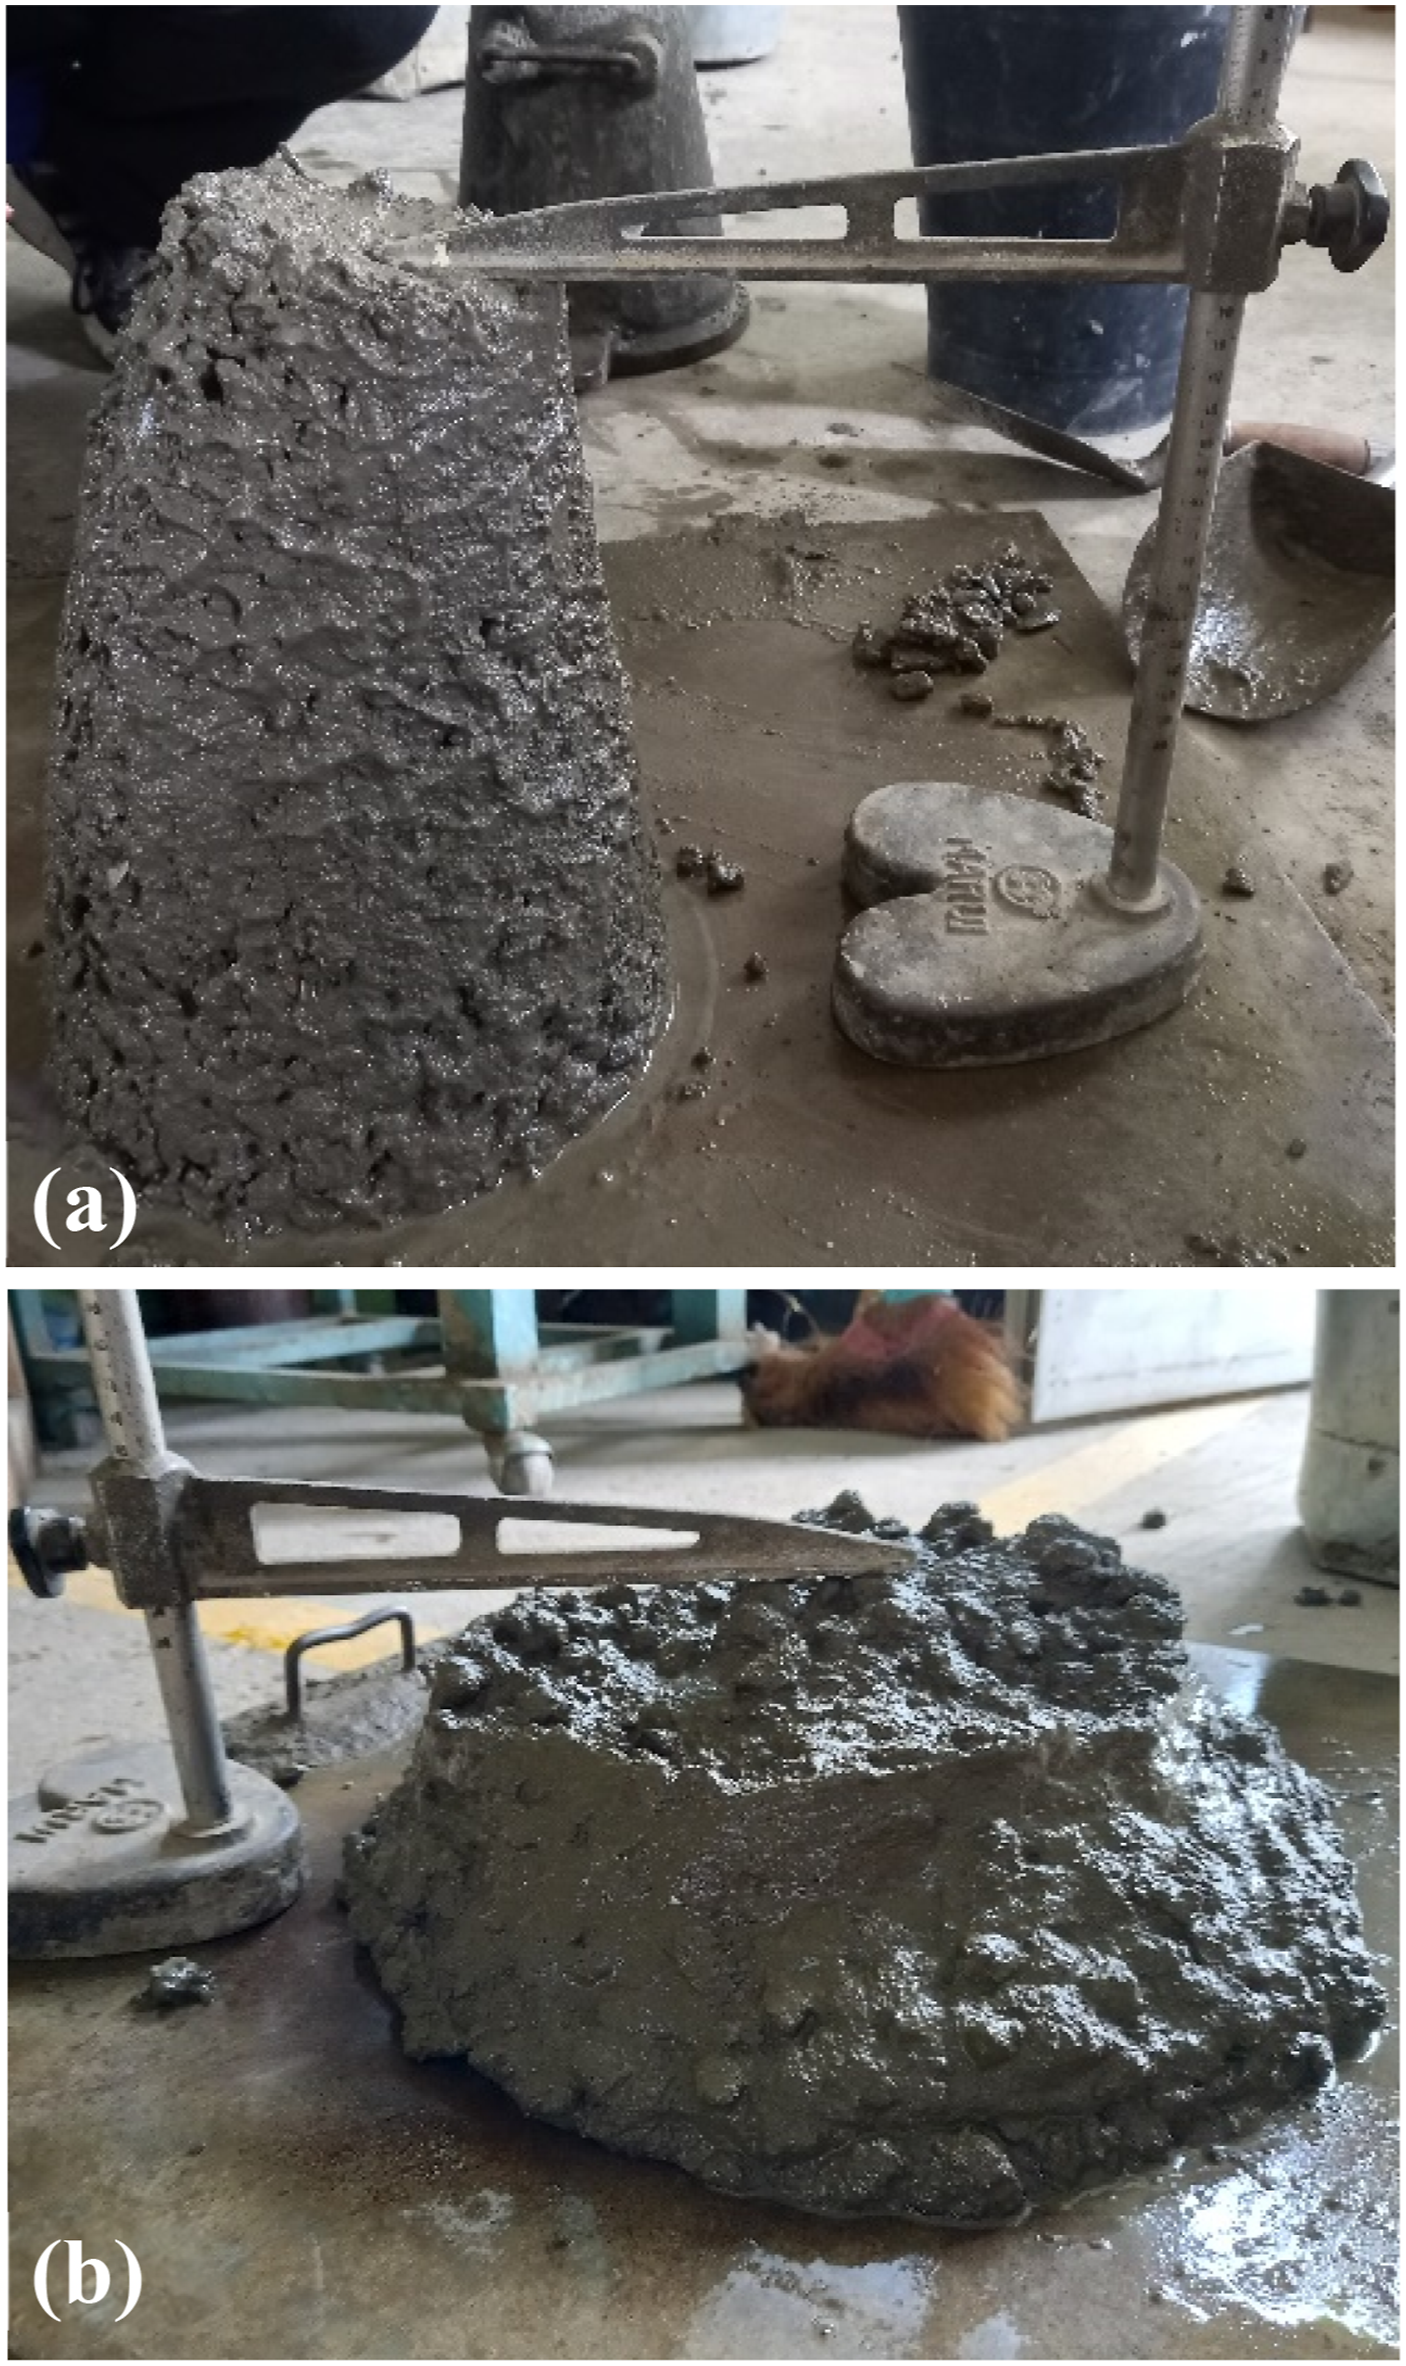
Hardened concrete properties
The dry density of concrete was measured as per the ASTM C642-13 46 standard using the 100 mm cube specimens. The compressive strengths of the cube specimens were determined at 7 and 28 days using a 3000 kN universal compressive testing machine at a loading rate of 2.5 kN/s conforming to EN 12 390-3 47 standard. STS tests for all concrete batches were performed as per ASTM C496/C496M 48 standard. A centre point loading test of simple beams as per ASTM C293/C293M 49 standard was conducted to assess the flexural strength. ASTM C469/C469M 50 standard was followed to find the MoE of concrete.
Microstructural analysis was performed to investigate the bond strength of the interfacial transition zone (ITZ) between cement paste and coarse aggregates. Scanning electron microscopical (SEM) analysis was used for this purpose. Additionally, SEM images of FA and cement particles were examined. During the sample preparation of solid concrete, a sample size of less than 10 mm × 10 mm × 5 mm was obtained due to the restriction of the electron microscope chamber of the SEM machine. These samples were exposed to an oven temperature of about 50°C for at least 1 h to remove moisture from them before the SEM analysis. However, powder samples such as FA and cement were employed directly without any alternation. Afterwards, samples were mounted securely on a holder with carbon tape and dried using an air dryer. Then, they underwent vacuum treatment to remove moisture and received a gold-palladium coating with sputter coater for conductivity and imaging enhancement. Eventually, coated samples were transferred to the SEM chamber for imaging with electron beams by adjusting magnification for analysis.
Thermal conductivity analysis
The thermal conductivity of the composites was measured using THERMTEST TLS 100 transient thermal conductivity meter with a 50 mm needle probe, based on the ASTM D5334–14 51 standard. For the sample preparation, 100 mm concrete cubes were cut using a diamond blade concrete saw, to make small cubes with the size of 50 mm × 50 mm × 60 mm. Then, a 4 mm diameter with a 50 mm length hole was made at the centre of the face of the 50 mm × 50 mm side. Afterwards, a probe was inserted in the hole and thermal conductivity was measured following the standard procedure.
Stress–strain relationship
The stress–strain variations of CC and PP30% concrete batches were assessed using three replicates of 100 mm × 200 mm concrete cylinders. Two strain gauges, each with a length of 90 mm, were externally mounted in pairs at equal intervals along the mid-height and opposite ends of the specimen’s surface, aligned with its longitudinal direction. The compressive loading test using ASTM C39/C39 M-09a 52 standard was conducted with a constant load rate of 0.25 MPa/s.
Results and discussion
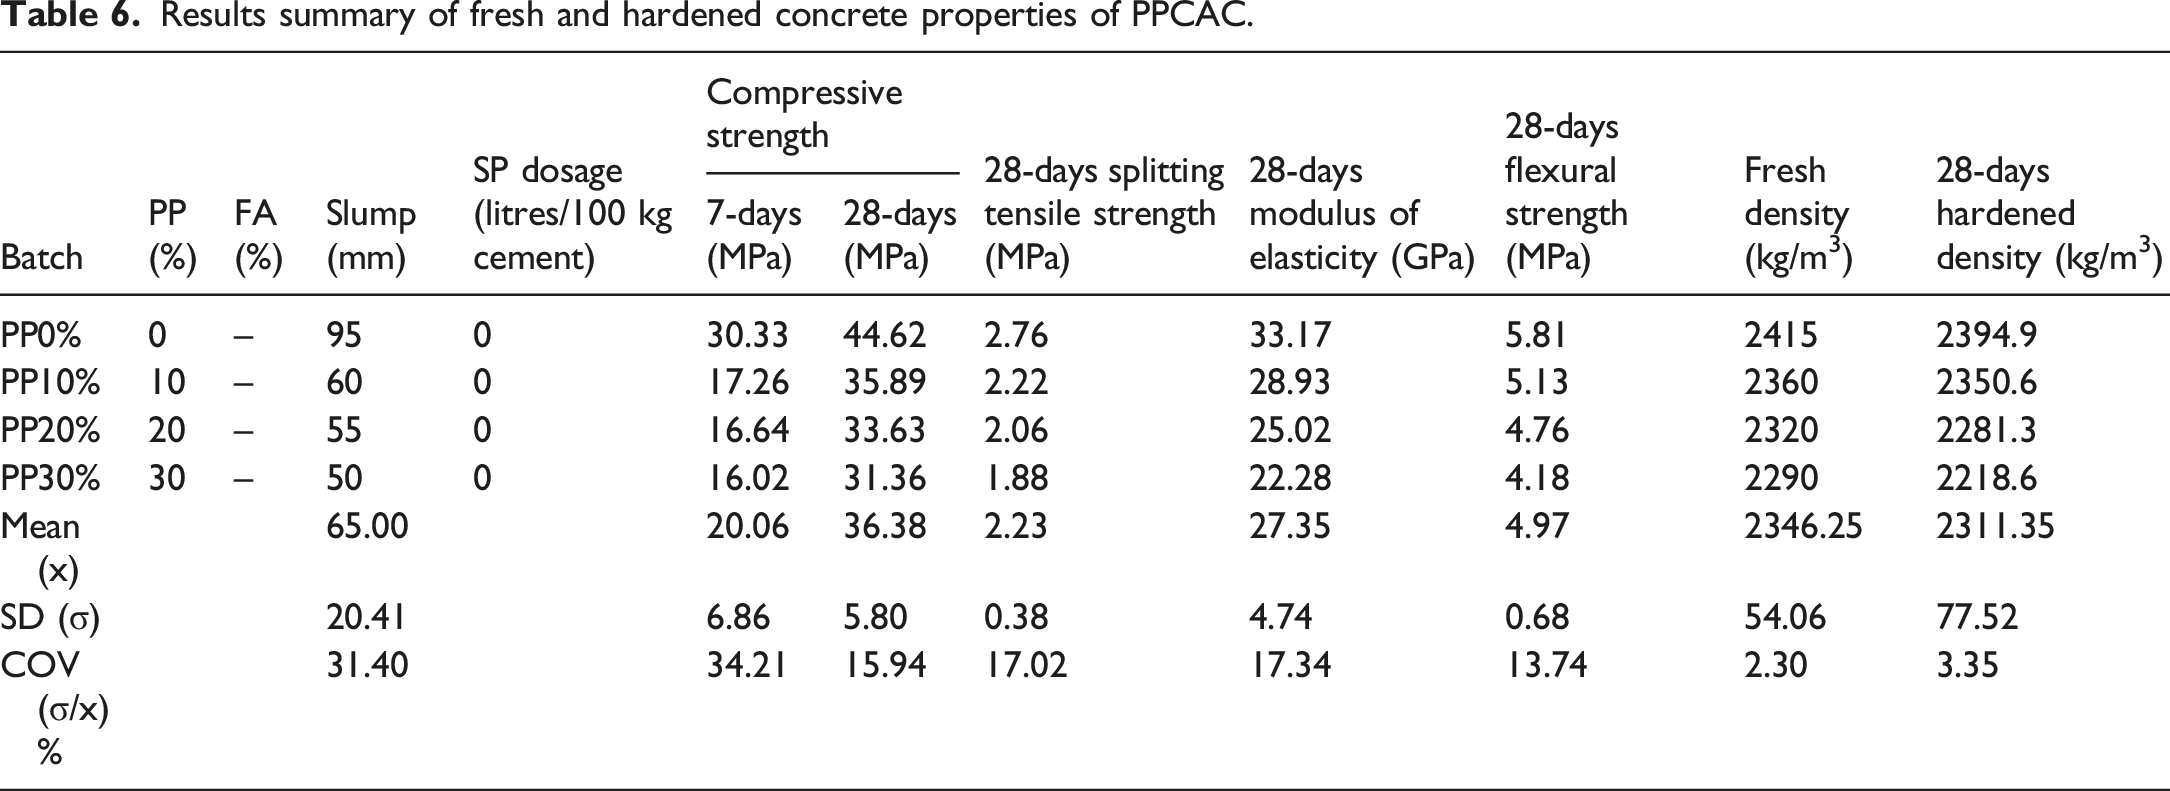
Results summary of fresh and hardened concrete properties of PPCAC.
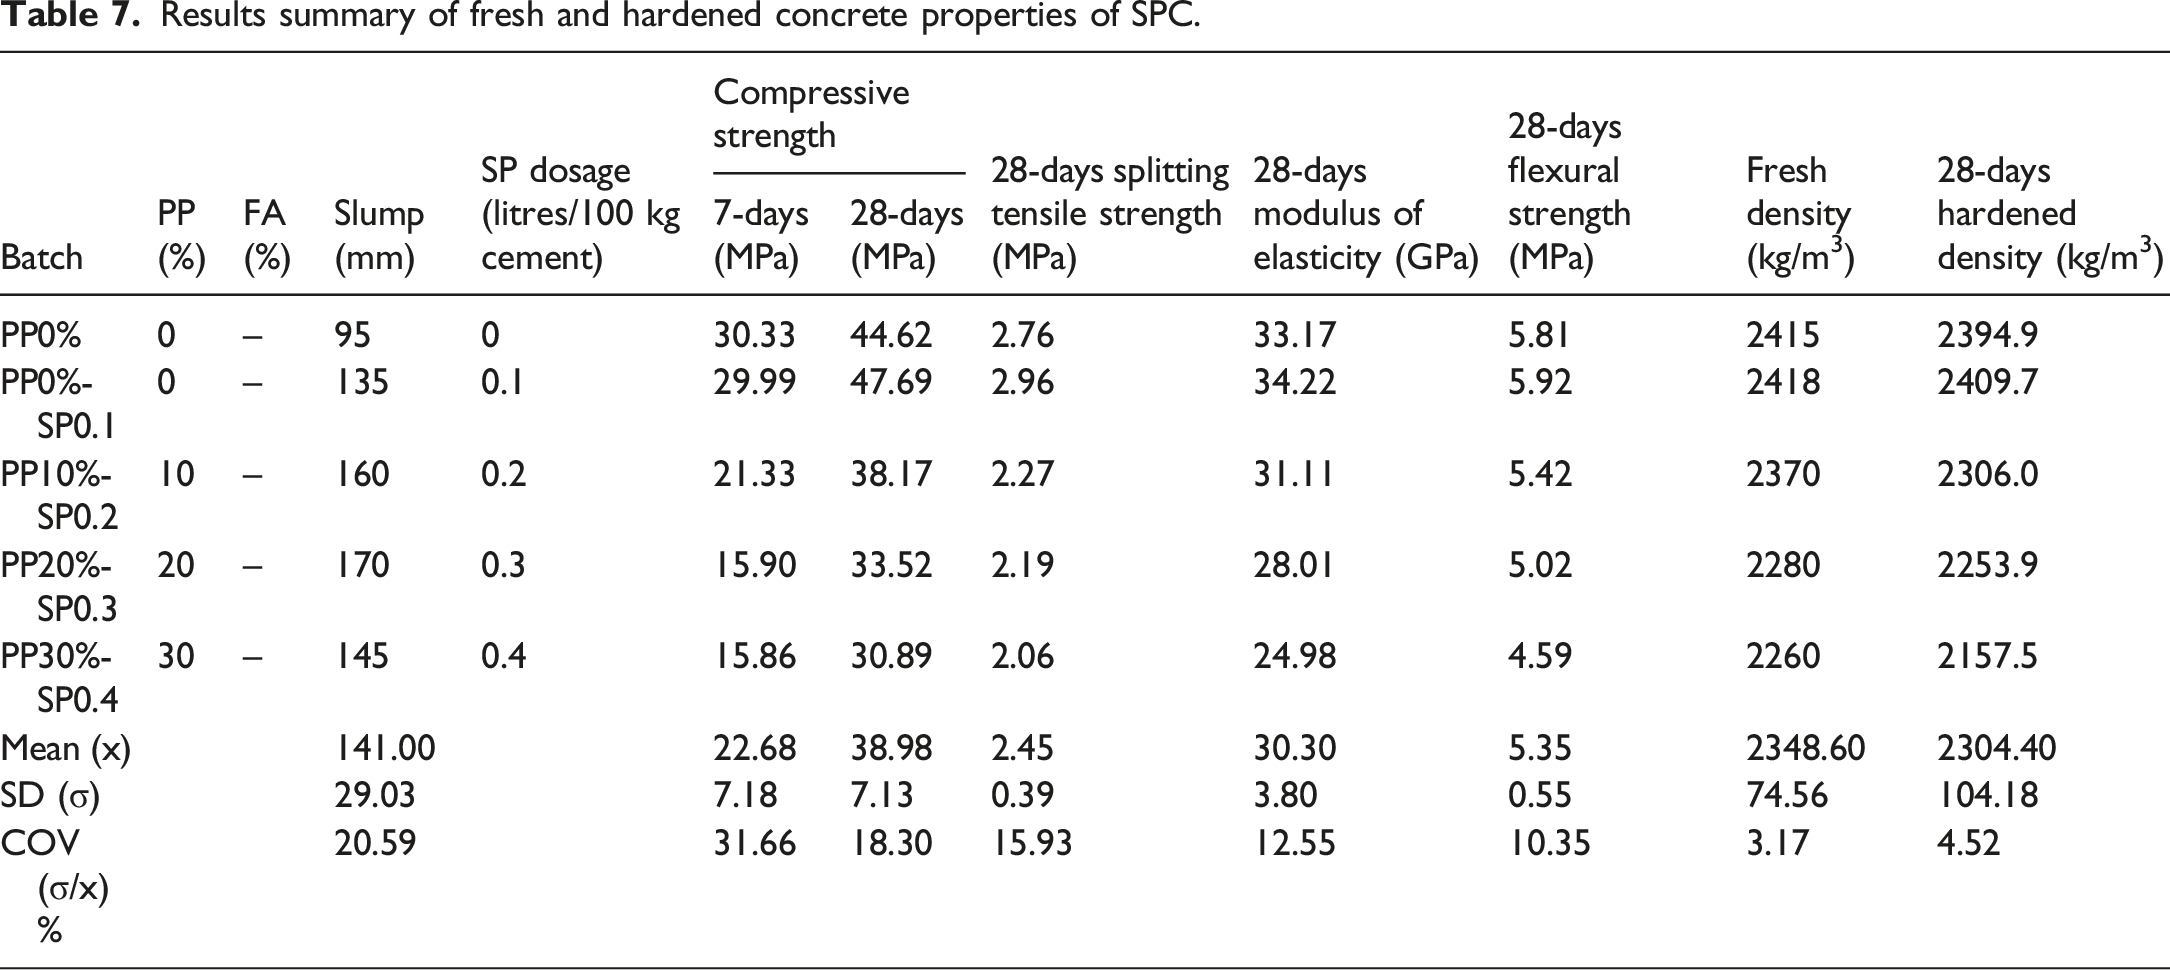
Results summary of fresh and hardened concrete properties of SPC.
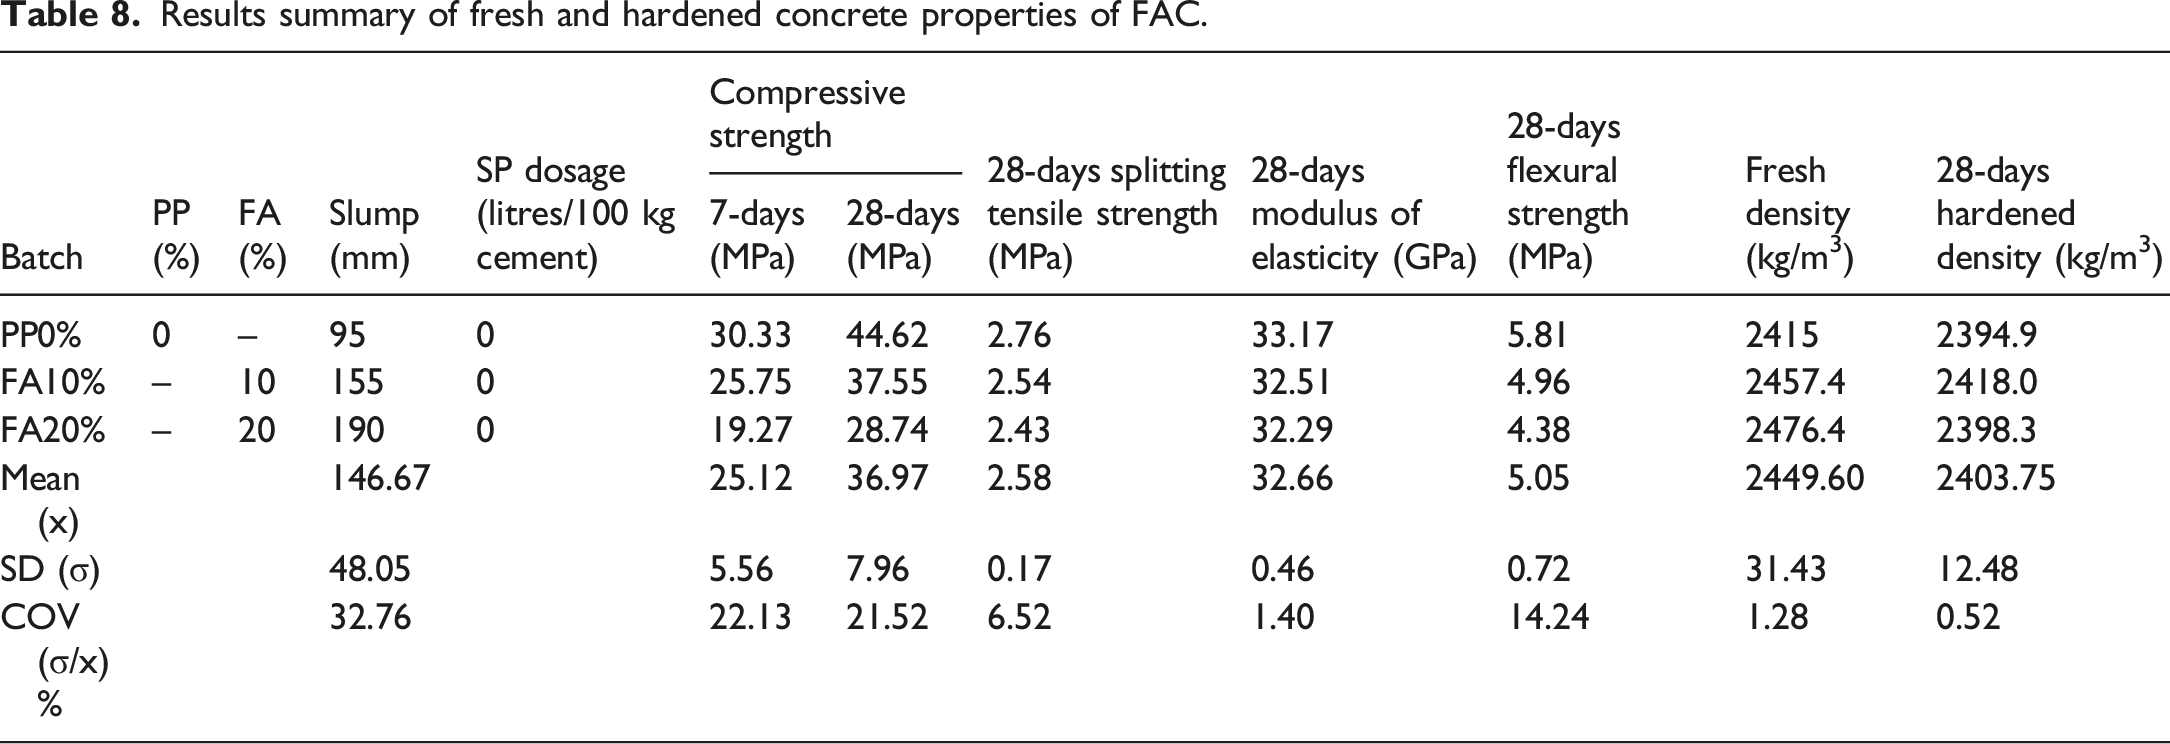
Results summary of fresh and hardened concrete properties of FAC.
Workability
The workability of PPCAC decreased with the increased content of PPCA (Figure 9). The loss of workability was mainly attributed to the presence of irregular shape PPCA with considerably sharp edges. When 10% of PPCA was added to CC, workability reduced drastically by about 37%. Succeeding PPCA additions however resulted in relatively lower reduction of slump: about 5% for each 10% PPCA increment. This particular scenario was observed to coincide with many of the past studies that used irregular shapes and sharp PPCA.6,11,54 In contrast, some other studies observed an opposite behaviour between the workability and the addition of PPCA when compared to CC. The literature has attributed such behaviour to the presence of excess water in the matrix of PPCAC, resulting from the hydrophobic nature of PPCA which led to a nearly zero water absorption capacity.11,13 In the current study, the effects on workability by the irregular shape/sharp PPCA should have dominated over the hydrophobicity property of PPCA. Slump variation with increasing PPCA and FA replacement levels.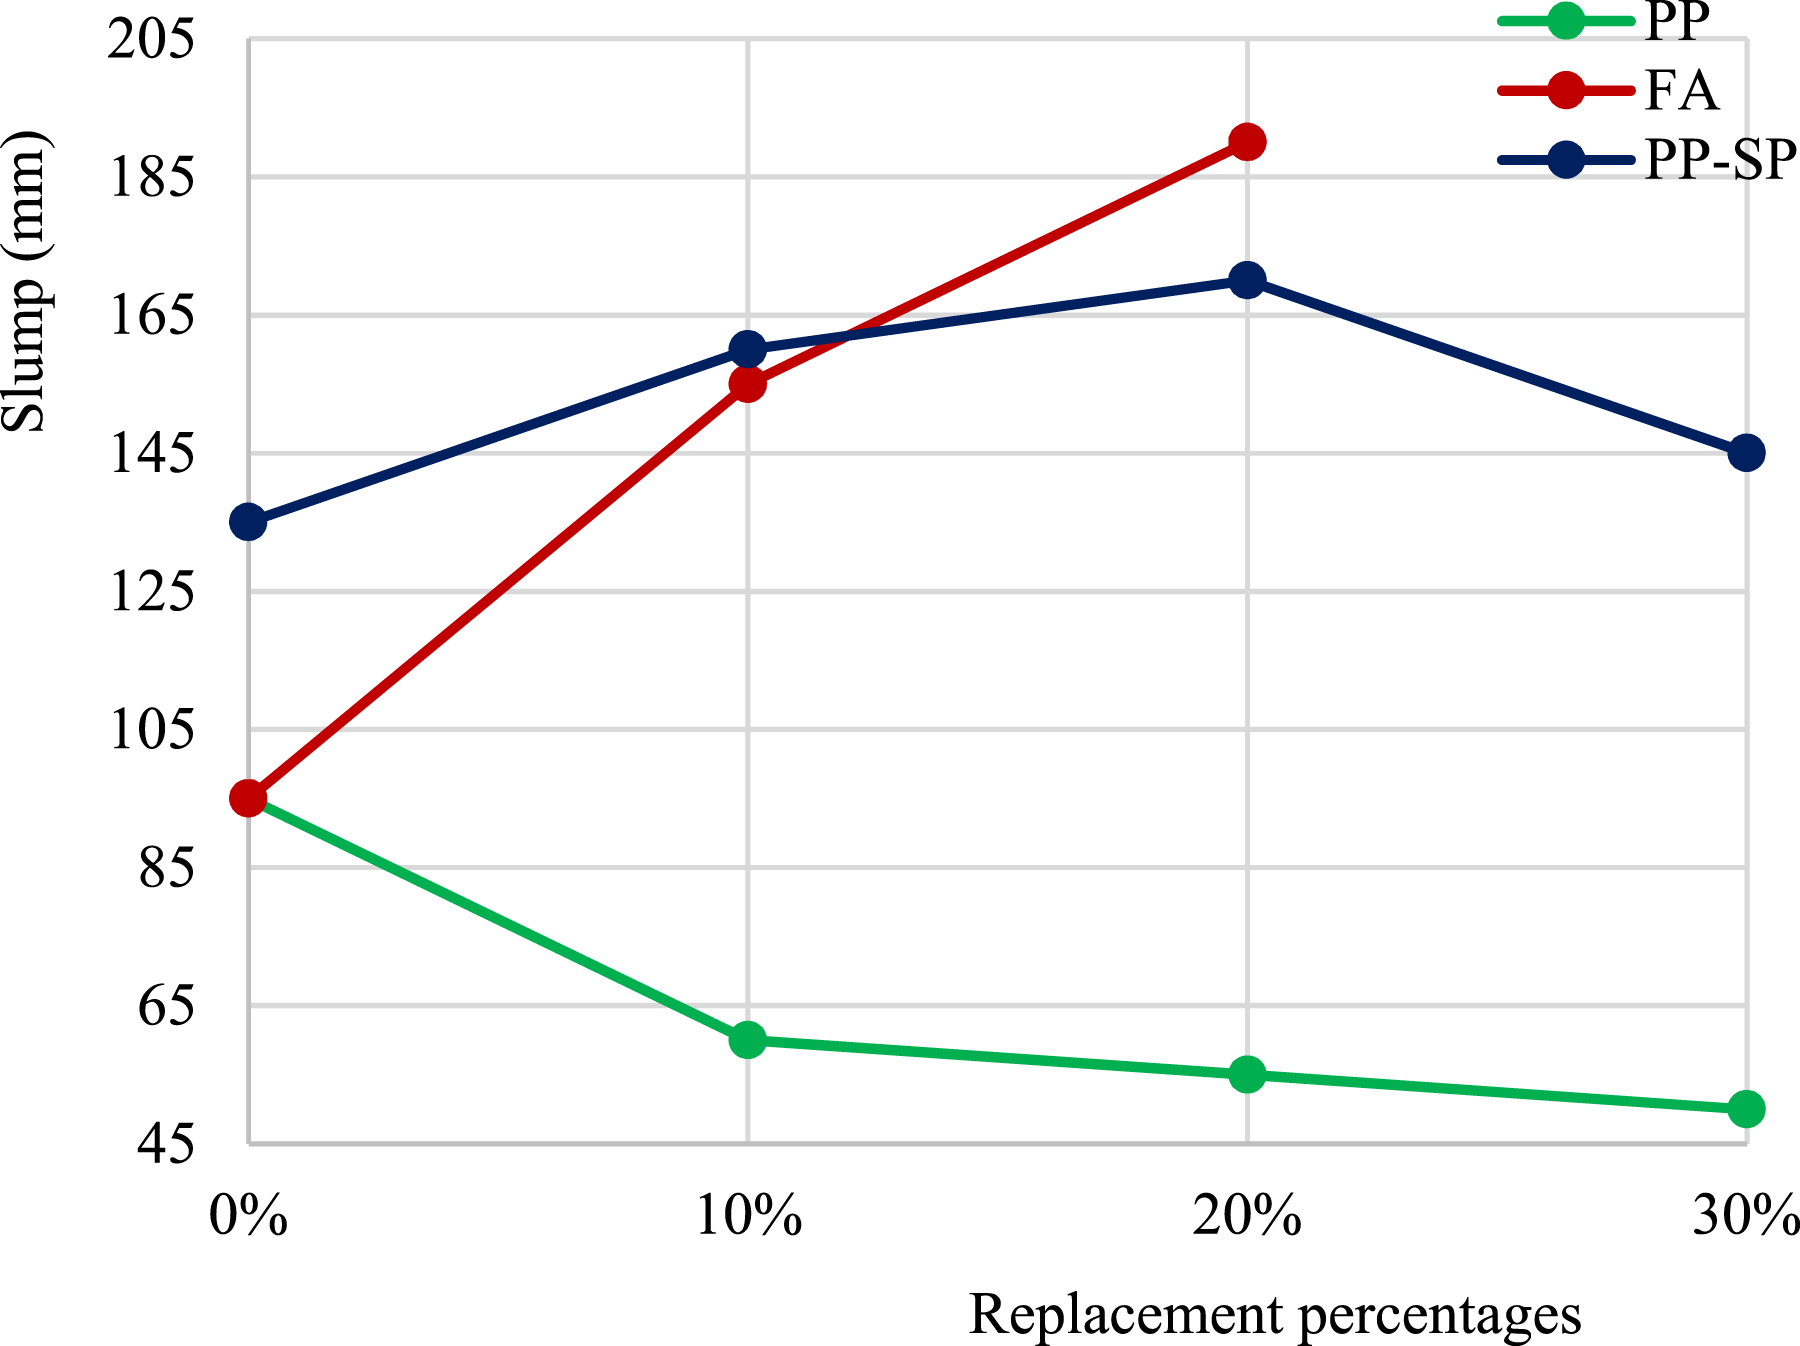
On the other hand, the addition of FA from 10% to 20% increased the workability considerably as per Figure 9. It was attributed to the spherical shape and fine size of FA particles when compared to cement particles. It can be validated using the microstructural analysis as presented in Section of Microstructural analysis. When considering SPC with PPCA, the slump was maintained at 150 mm ± 25 mm for all batches by adjusting the SP dosages as shown in Figure 9. Therefore, the use of SP has a notable positive effect on the workability of PPCAC, making it possible to maintain the slump value within a target range. A small SP dosage of 0.4 L per 100 kg of cement, improved the workability of PP30% concrete from 50 mm to 145 mm. Thus, the challenge of reduced workability from the inclusion of PPCA can be overcome by incorporating SP. However, overdosage of SP was not advisable, as discussed in Section of Specimen fabrication.
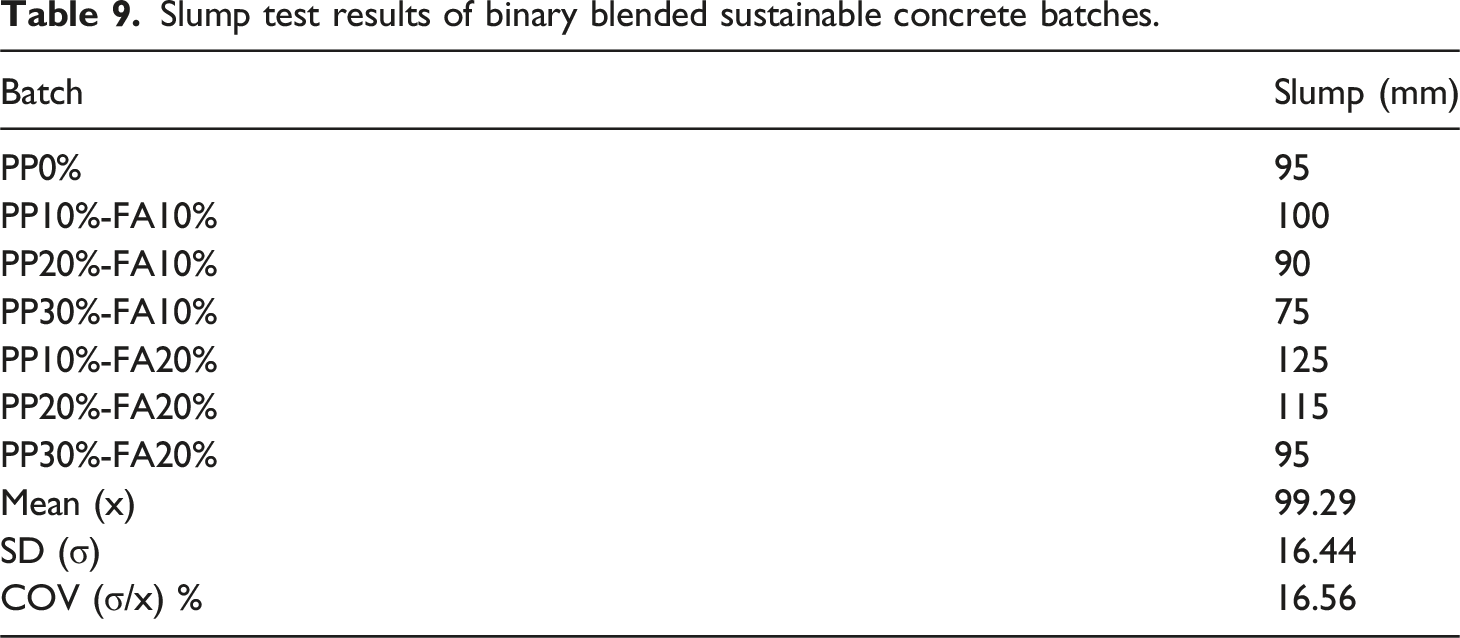
Slump test results of binary blended sustainable concrete batches.
Concrete density
The behaviours over PPCA content on the density properties of CC and SPC are reported in Figure 10 for the wet and dry densities. When using 10%, 20%, and 30% of PPCA, 2.1%, 3.7%, and 5% of wet density reduction and 1.8%, 4.7%, and 7.4% of dry density reduction from CC were obtained. It was attributed to the low unit weight and specific gravity of PPCA when compared to NCA.6,8,20,13 Here, the maximum hardened density reduction was achieved at a high replacement level of 30% and the value of density was 2218.6 kgm−3. Possibilities for the application of PPCAC as lightweight concrete should be considered to make use of the density reduction. According to EN 206-1: 2014,
55
a bulk density of less than 2000 kgm−3 can be classified as lightweight concrete. Hence, the density reductions up to 30% replacement levels were not adequate to be taken as lightweight concrete. To obtain lightweight concrete, the PPCA replacement level should be approximately more than 75% and further research is needed in this area. For the FAC, the wet density increases continuously as the FA content increases from 0% to 20%. But there is not much difference in the dry density with the addition of FA in concrete as displayed in Figure 10. Wet and dry density variations with increasing PPCA and FA replacement levels.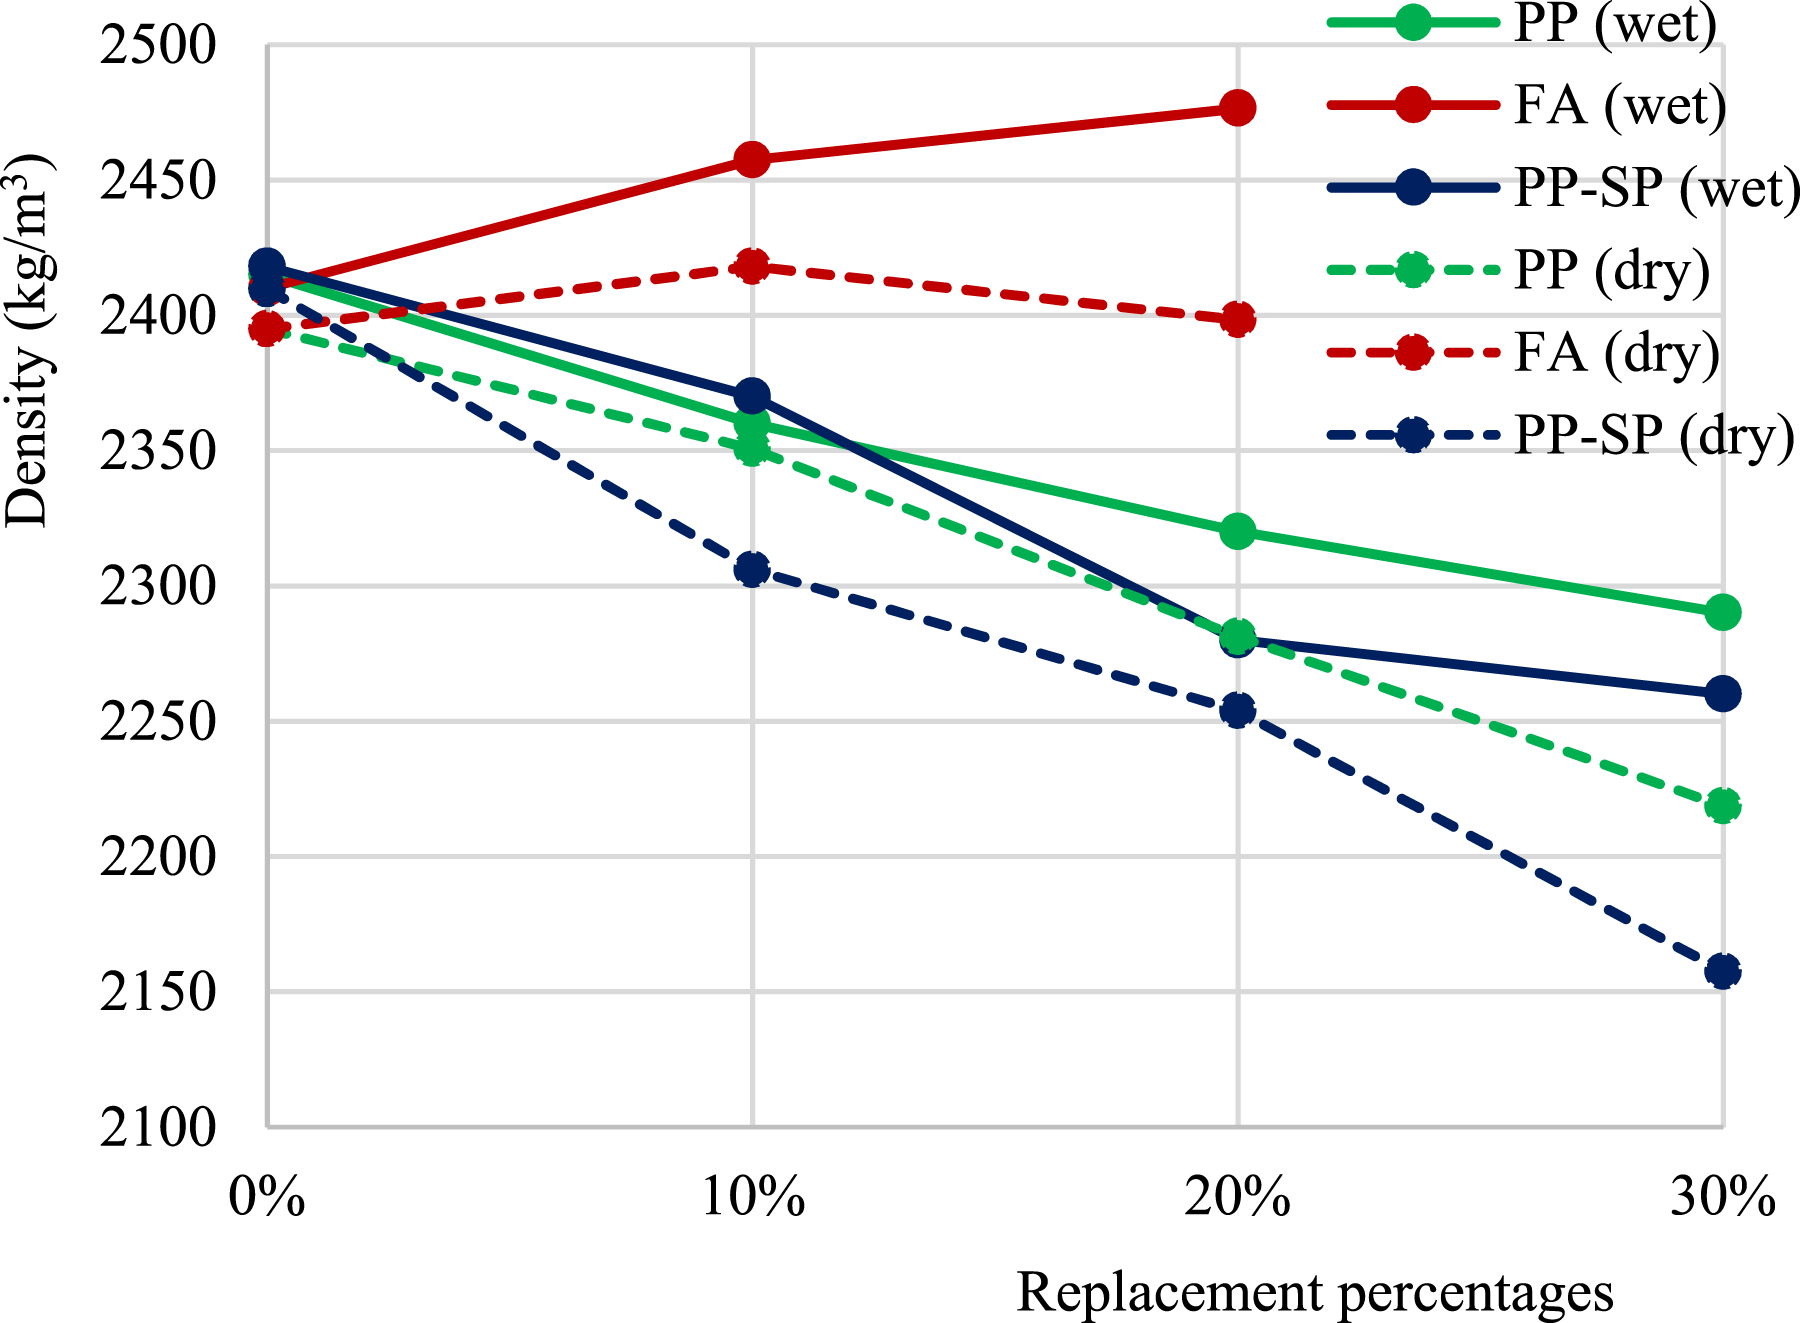
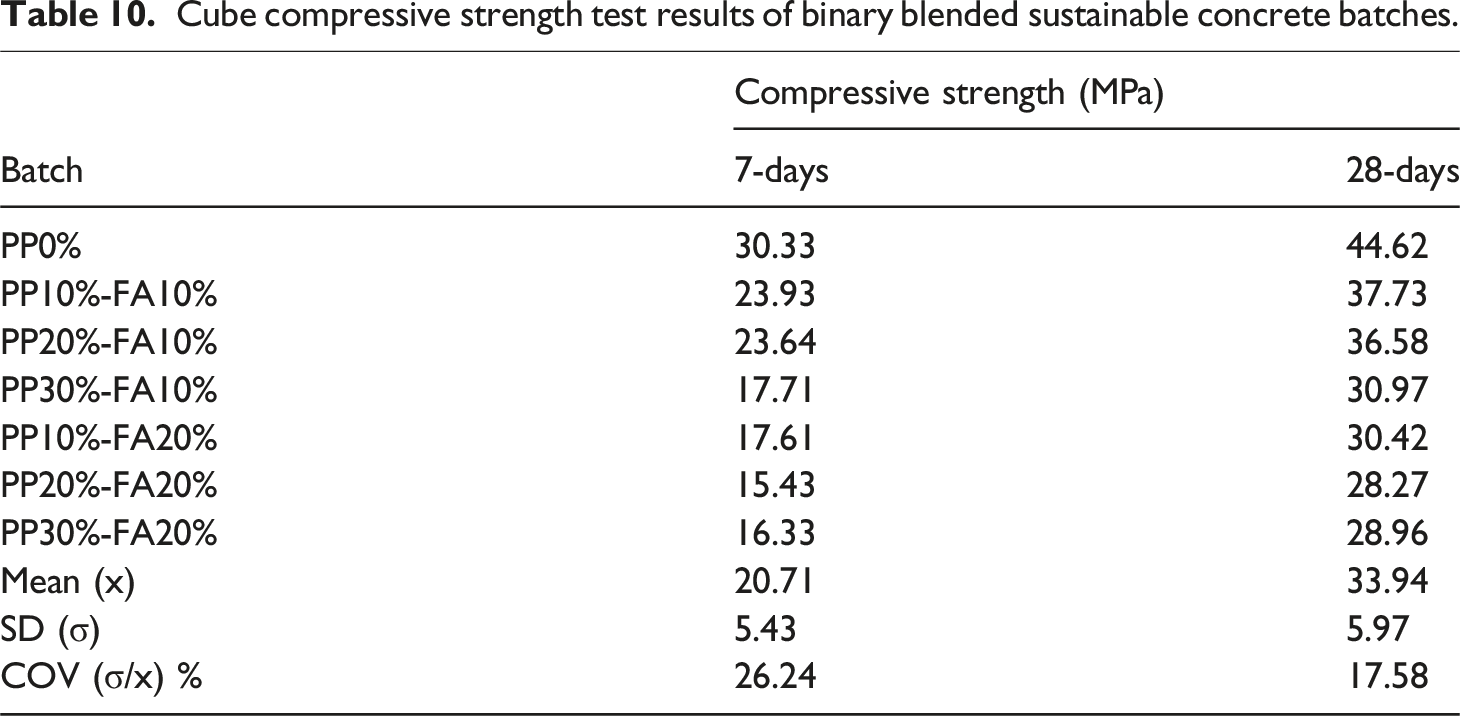
Compressive strength
Regardless of the concrete type (CC or SPC), increasing replacement levels of PPCA reduced the 7-days and 28-days cube compressive strength as shown in Figure 11. It was mainly attributed to the weak bonding between PPCA, and cement paste as there was not any chemical reaction. Most of the past studies also reported similar behaviour.6,56,8,11,10,13,56,16 The 28-days compressive strength of CC came out to be 44.6 MPa (average of three cube specimens). In relation to CC, 28-days compressive strength exhibited a reduction of 19.6%, 24.6%, and 29.7% at 10%, 20%, and 30% replacement levels of PPCA, respectively. The performance of PPCA within the SPC closely resembled that of CC. Cube compressive strength variation with increasing PPCA or FA replacement levels.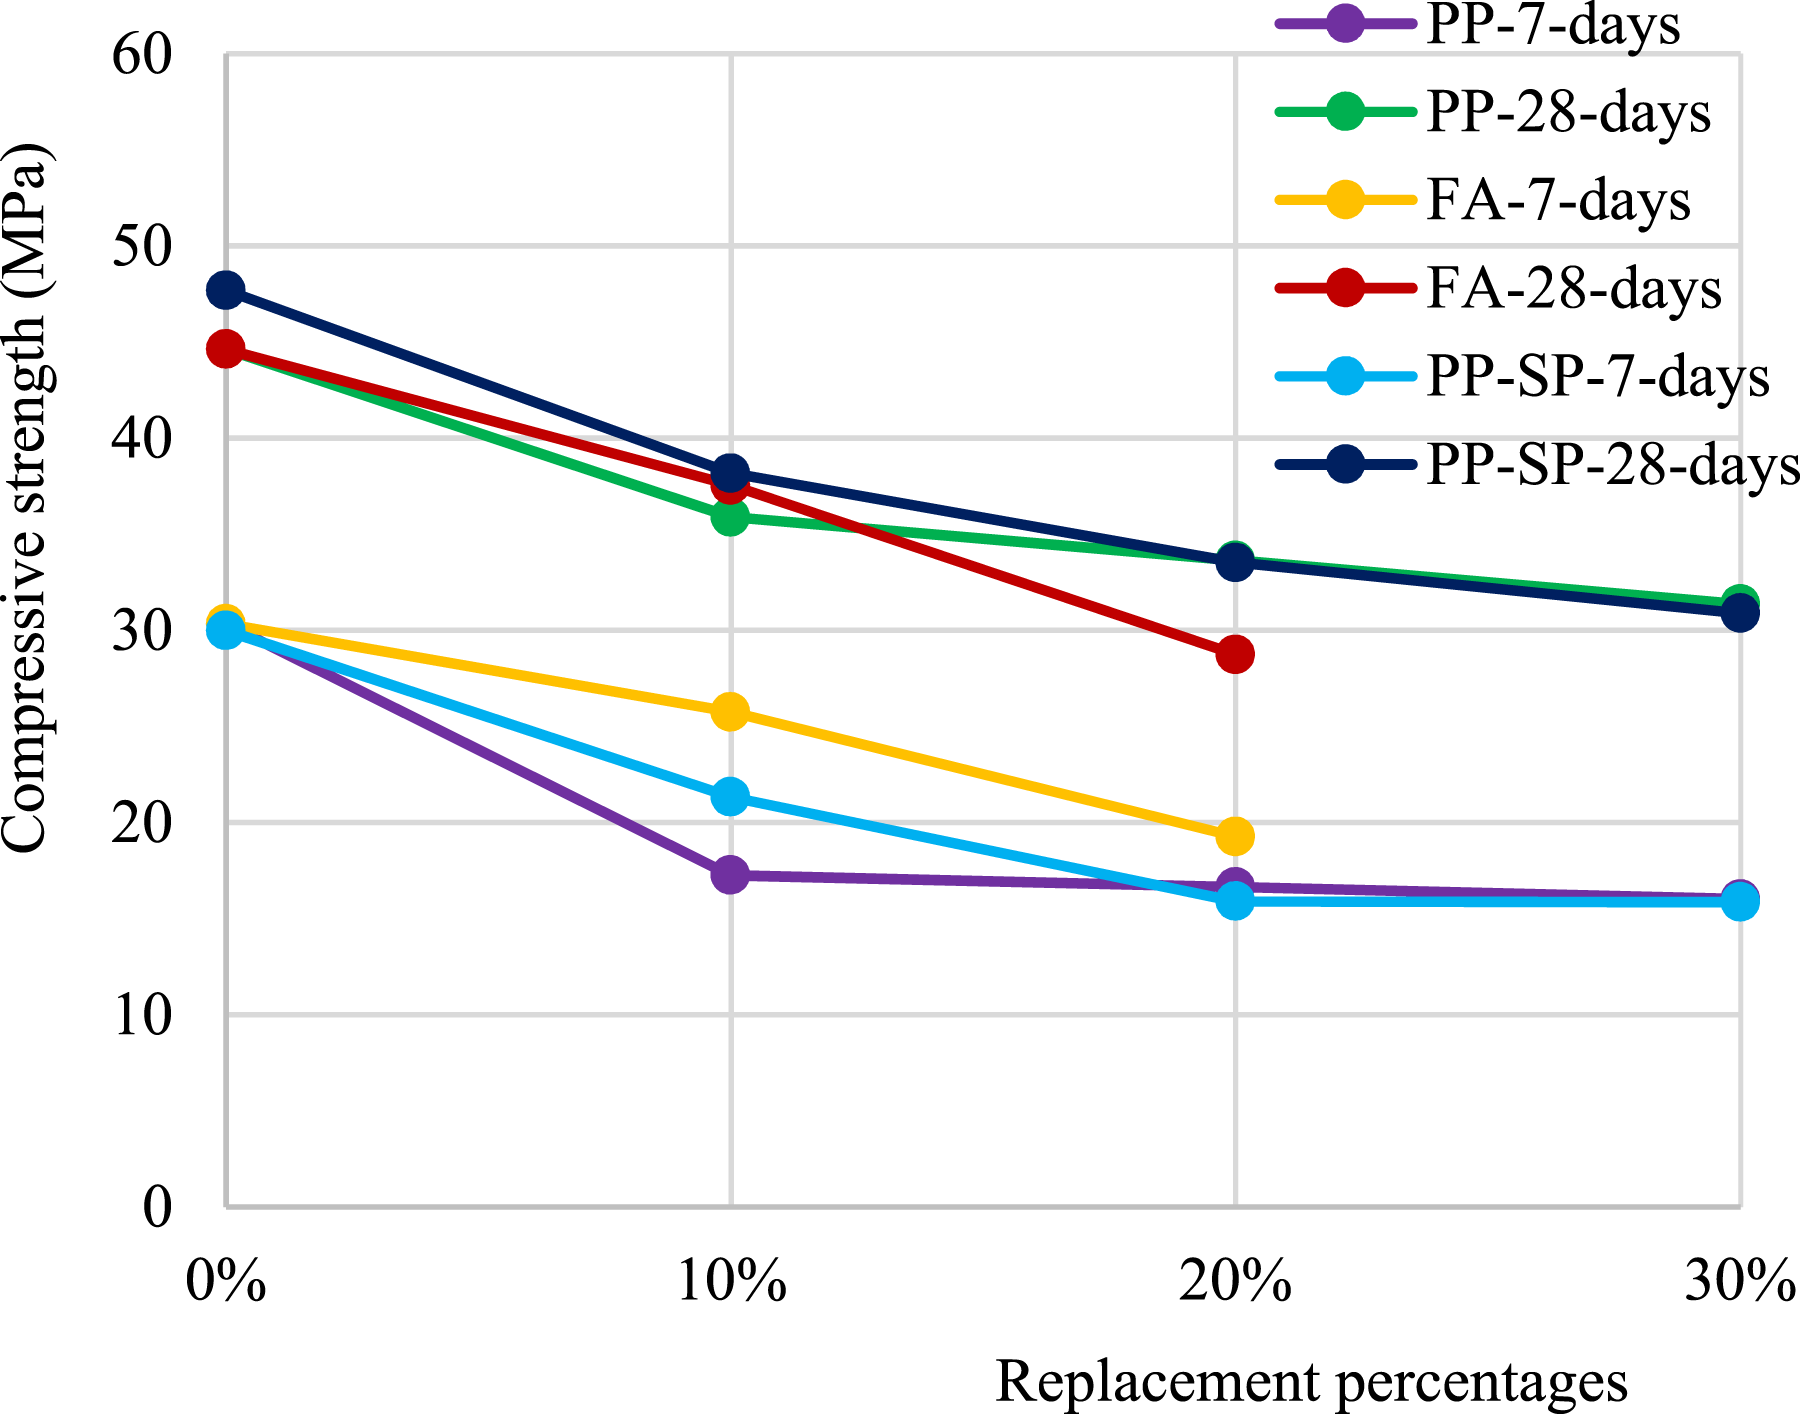
Further, 7-days and 28-days compressive strength declines as the FA content increases in the FAC as per Figure 11. At 10% and 20% replacement levels of FA, there was a 15.8% and 35.6% decrease in the 28-days compressive strength. It was attributed to the low calcium oxide (CaO) content in class F type FA. Hence, the contribution of FA in strength development was low when compared with cement. 32
Cube compressive strength test results of binary blended sustainable concrete batches.
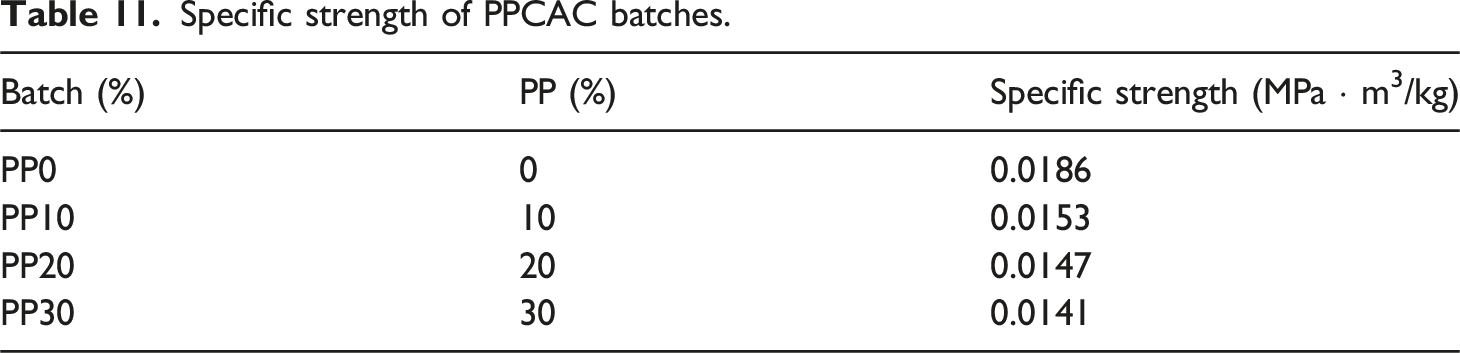
Specific strength
Specific strength of PPCAC batches.
Splitting tensile strength
Figure 12 shows the 28-days STS variation with increasing PPCA and FA. STS reductions in PPCAC when compared to CC were noted in all PP10%, PP20%, and PP30% batches, with decreases reaching up to 19.6%, 25.4%, and 31.9%, respectively. Most of the previous research also observed the same performance.6,59,20,13,57,60 These reduction percentages are almost closer to those observed in compressive strength variation. Hence, it can be concluded that the compressive strength variation with increasing PPCA content is approximately linearly proportional to that of STS. Islam and Shahjalal,
20
and Naveen
57
also observed a similar trend in their study. STS variation with increasing PPCA or FA replacement levels.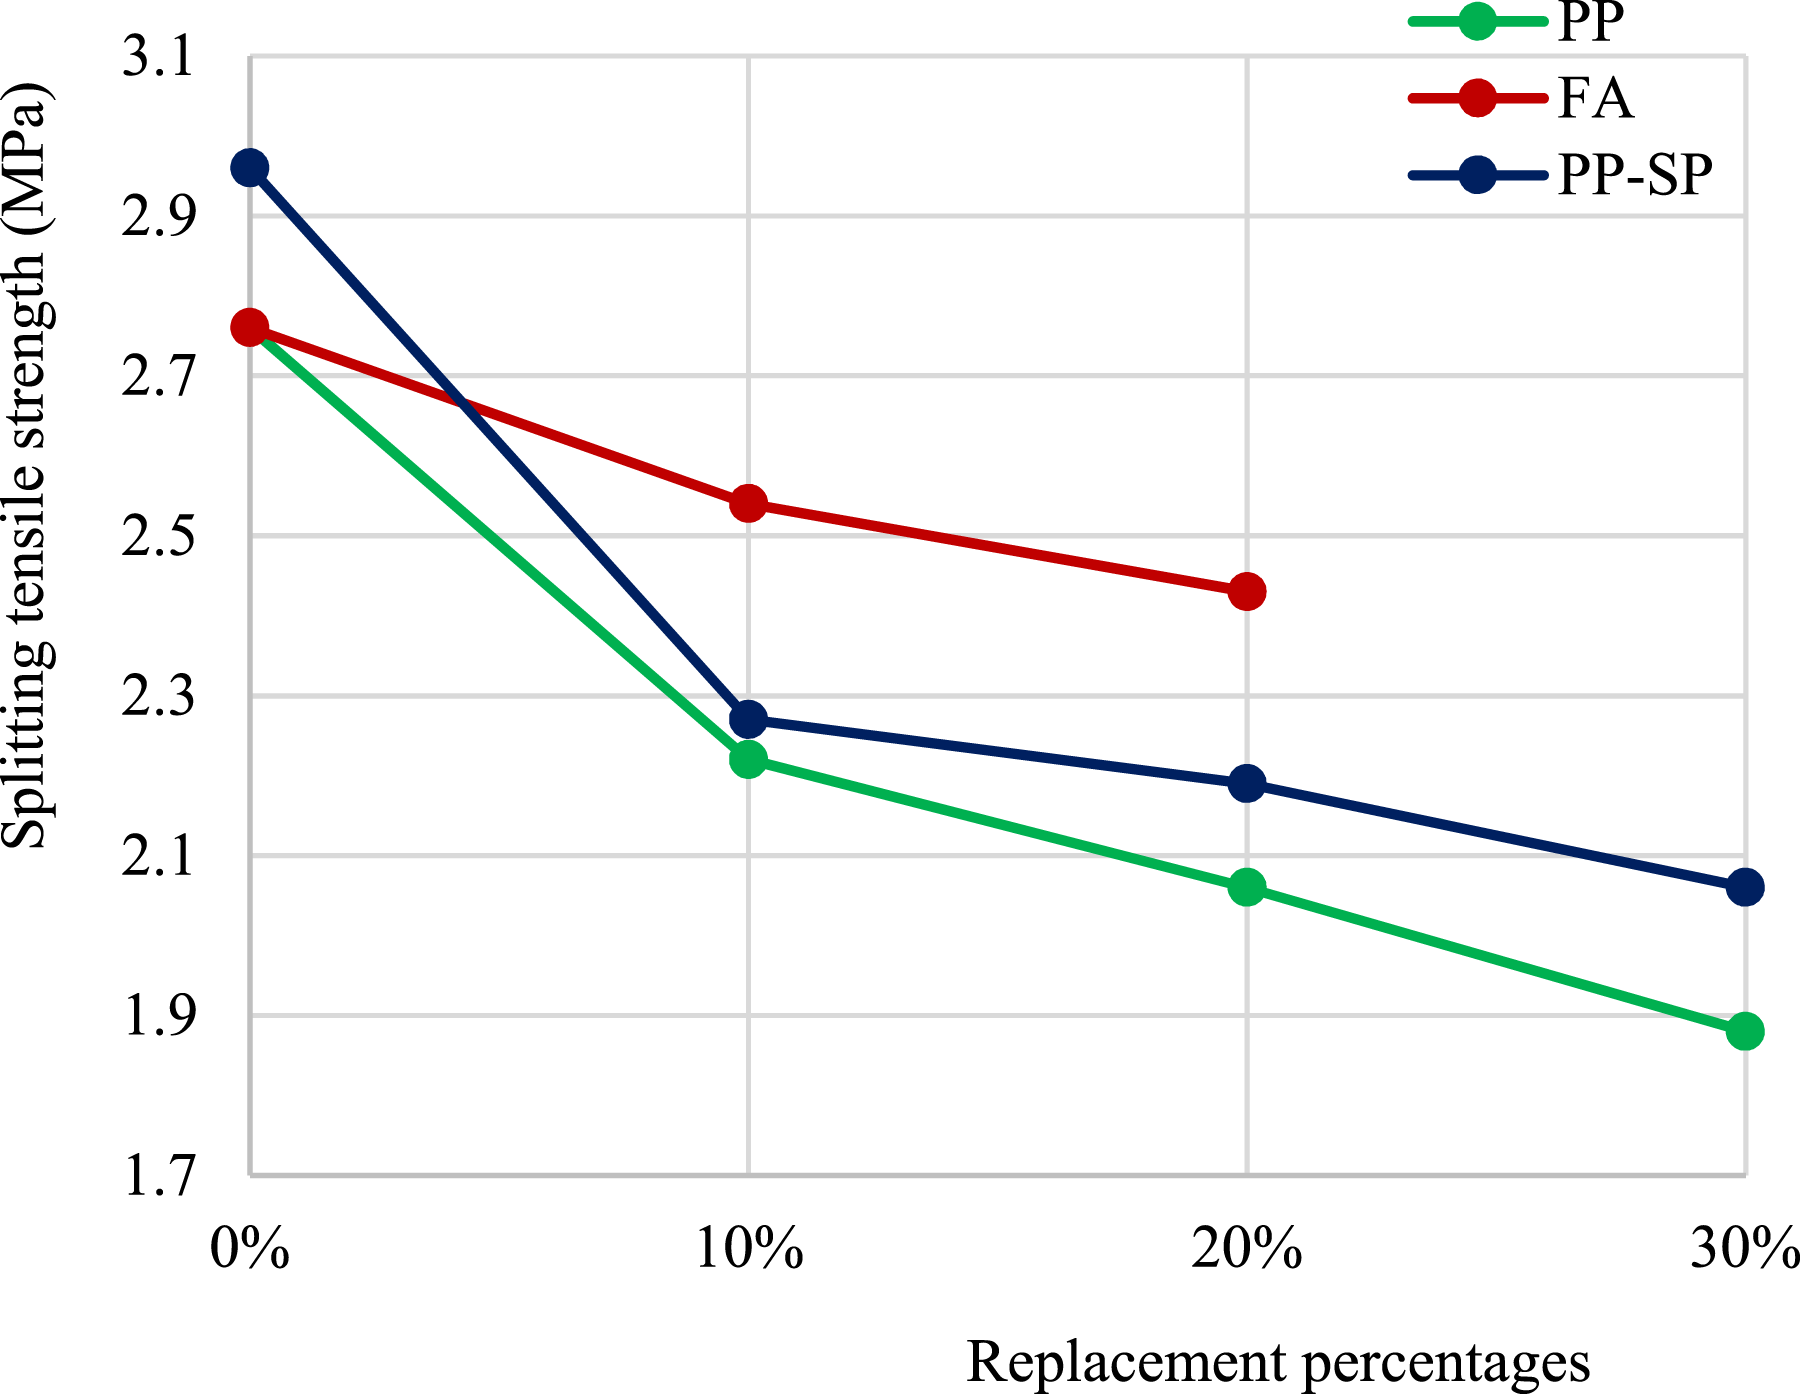
The addition of FA in concrete showed impaired STS values and further increasing the FA replacement levels continuously reduced the STS. Increasing the FA content from 0% to 20% declined the STS from 2.76 MPa to 2.43 MPa. Moreover, the performance of PPCA in SPC also resulted in reduced strength properties as per Figure 12.
Flexural strength
The flexural strength of PPCAC, FAC, and SPC showed a decrease as the replacement levels increased (Figure 13). Adding 10%, 20%, and 30% of PPCA led to flexural strength reduction of 11.7%, 18.1%, and 28.1%, respectively, in comparison with CC. This variation trend matches with several past studies.6,56,13 When considering PP10% and PP20% batches, the flexural strength performance is better than compressive strength and STS as the flexural strength reduction percentages are lower. However, the reduction percentage of flexural strength in the PP30% batch closely resembles the behaviour of compressive strength. Here, the PP30% replacement level achieved the lowest flexural strength of 4.18 MPa. In FAC, there was a reduction of 14.6% and 24.6% were obtained for 10% and 20% substitution levels of FA, respectively. Flexural strength variation with increasing PPCA or FA replacement levels.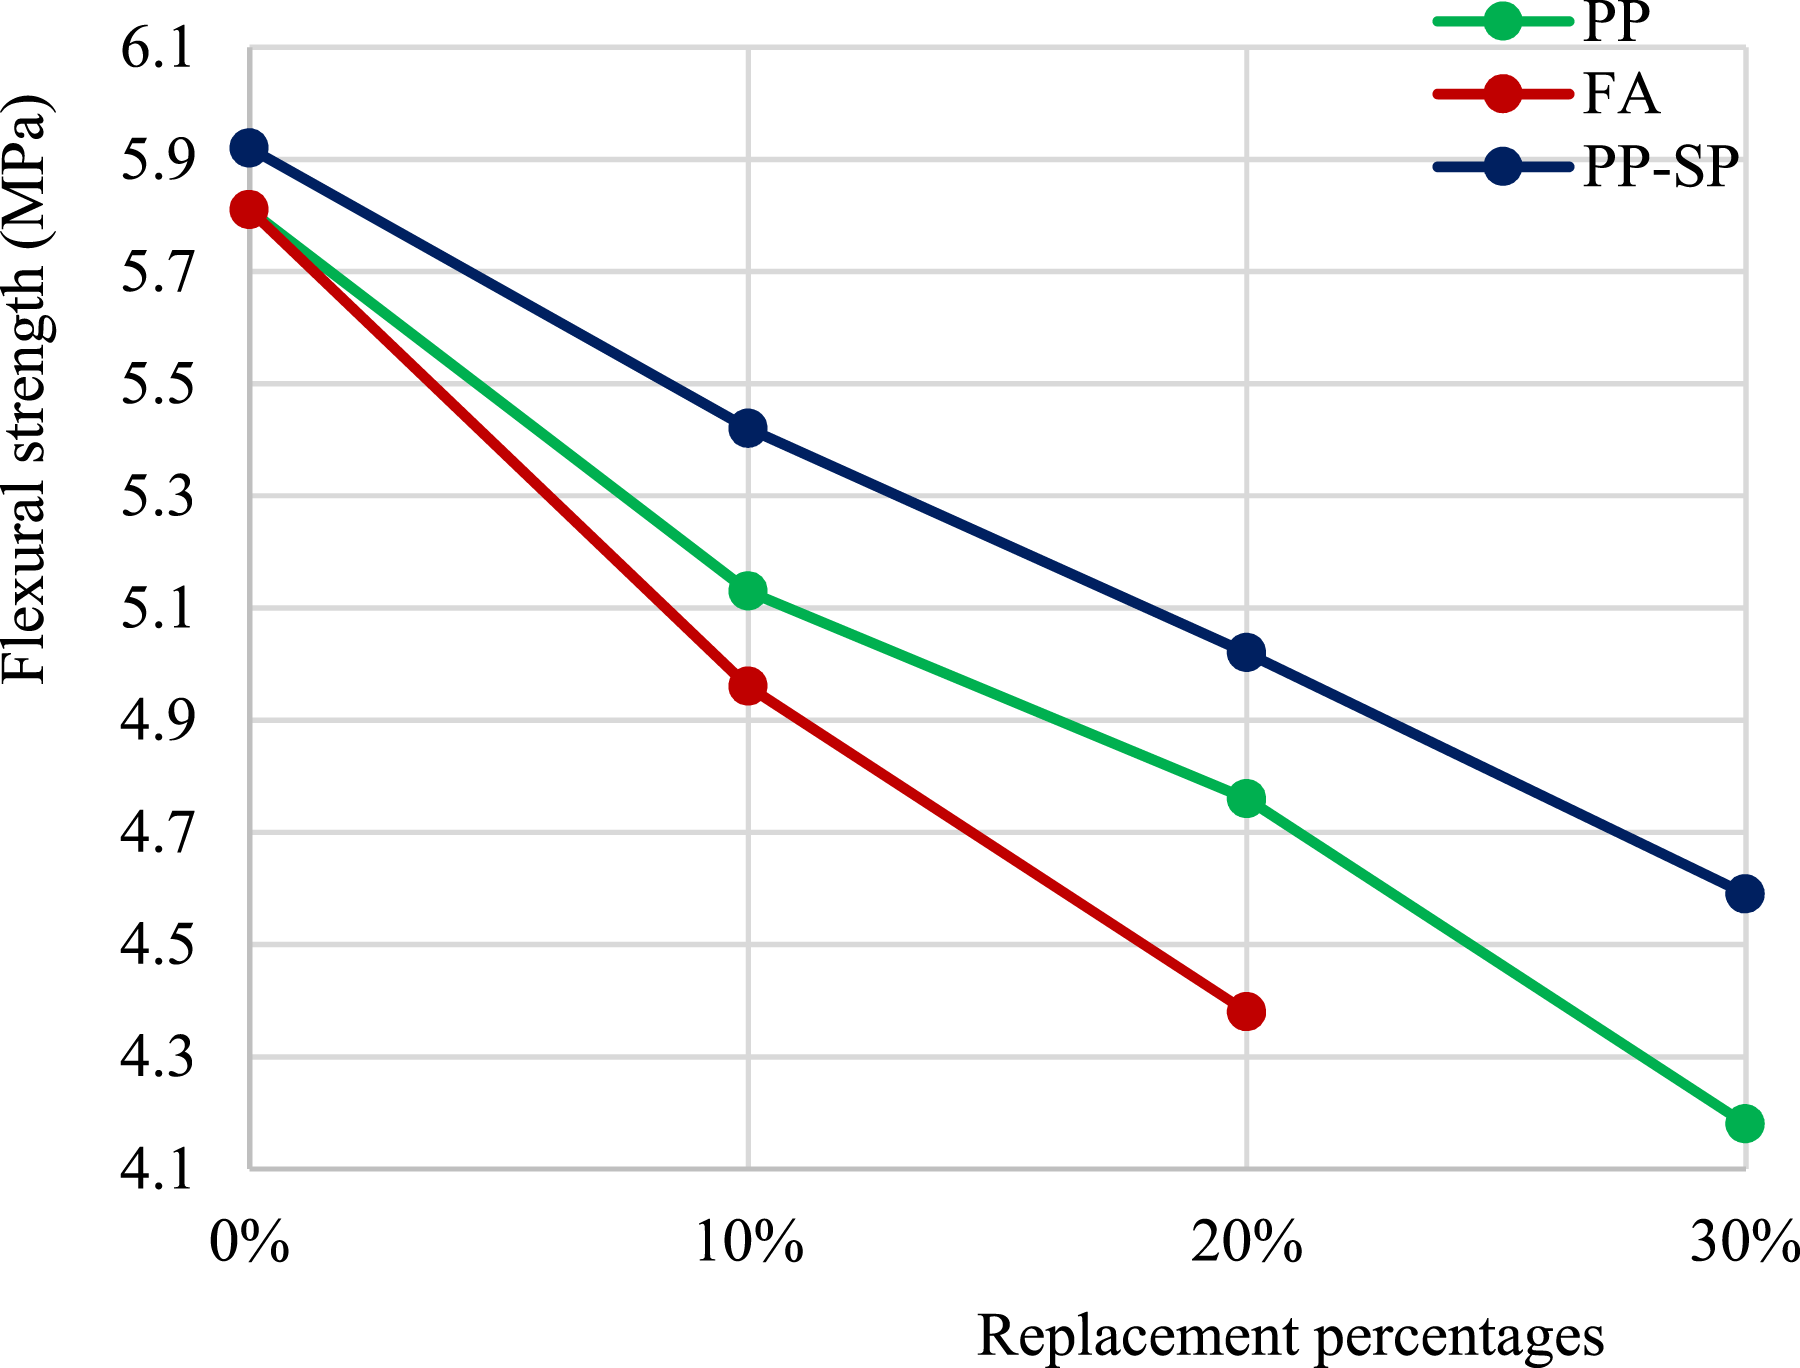
The SPC exposed linear reduction in flexural strength when increasing the PPCA replacement levels. Flexural strength values of 5.42 MPa, 5.02 MPa, and 4.59 MPa were gained at 10%, 20%, and 30% of PPCA replacement levels, for SP dosages of 0.2, 0.3, and 0.4 L per 100 kg of cement, respectively. Also, all the strength values were higher when compared with corresponding PPCAC and FAC batches.
Modulus of elasticity
MoE values from 22 MPa to 34 MPa were reached in this study. The highest MoE value was gained from SPC which was 34.22 MPa. Results presented in Figure 14 display that the MoE decreases with the increasing replacement levels of PPCA in CC and SPC. The major reason behind this reduction was the low MoE value of PPCA than that of NCA. Similar observations were seen elsewhere.6,56,20 For 10%, 20%, and 30% of PPCA replacement levels, 12.8%, 24.6%, and 32.8% of MoE reductions were observed, respectively. When comparing FAC with CC a slight reduction in MoE was observed as the FA content increases. Moreover, linear MoE reduction was observed in SPC as the PPCA content increased. MoE variation with increasing PPCA or FA replacement levels.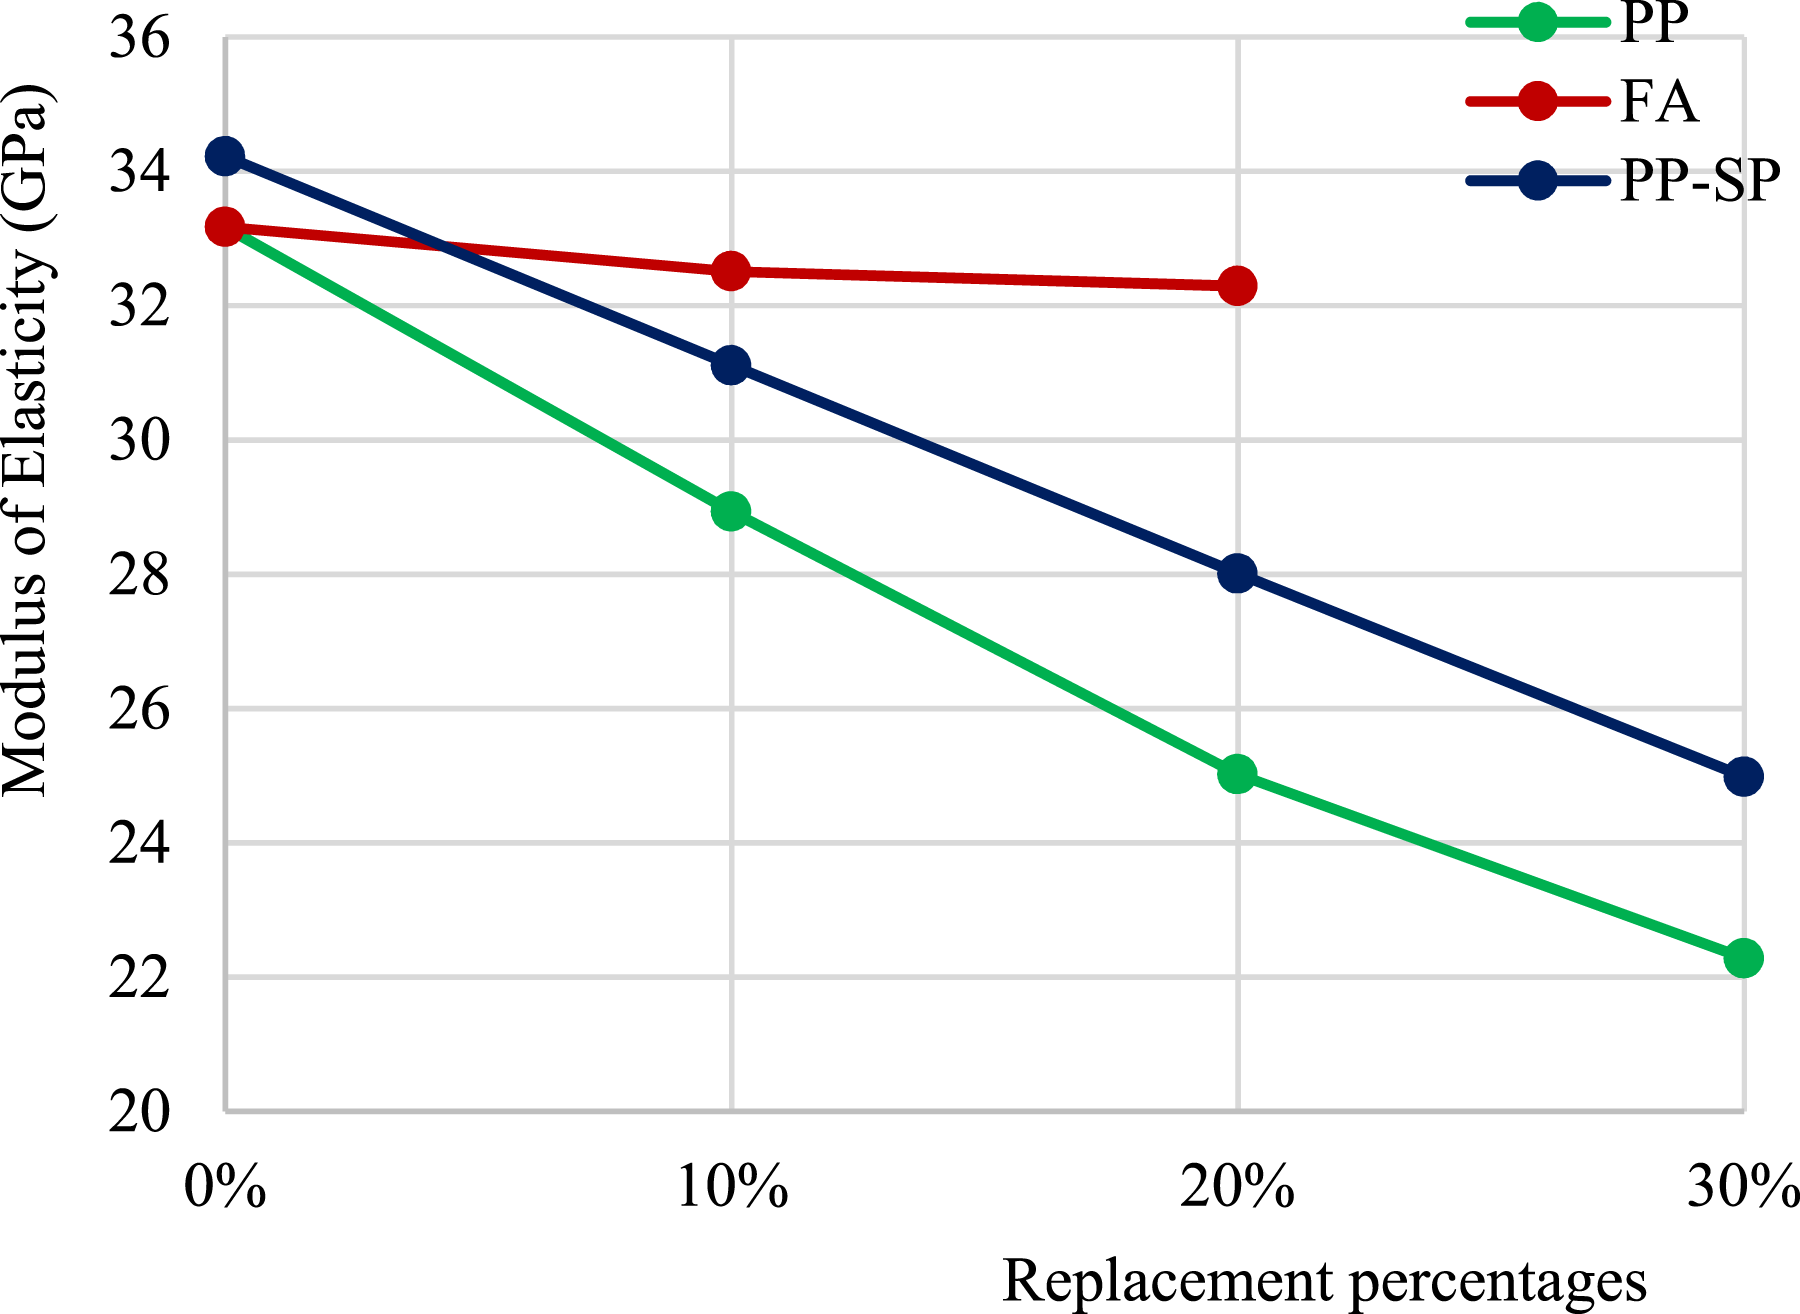
Stress–strain relationship
Figure 15 displays the 28-day cylinder compressive stress–strain behaviours of conventional and plastic aggregate concrete obtained from current experimental work in comparison with past studies. In the current study, CC and PP30% concrete specimens failed at ultimate stains of 0.00235 and 0.00314, respectively. Similarly, the strain at peak stresses were 0.00205 and 0.00314, respectively. Here, the addition of PPCA increased the ductile capacity of concrete by about 38.3% after the peak stress. Similar behaviour was observed by Islam.
13
However, Abu-Saleem
61
did not observe such behaviour, where they utilized the combined addition of 10% of PPCA and 20% of other types of plastic aggregates such as polyethylene terephthalate and high-density polyethylene. According to the current study, an ultimate strength reduction of 12.9 MPa was observed in PP30% concrete when compared to CC. This result is in good agreement with the result obtained by Abu-Saleem
61
where the reduction was 11 MPa. Compressive stress–strain variations at 28-days: in current and past studies.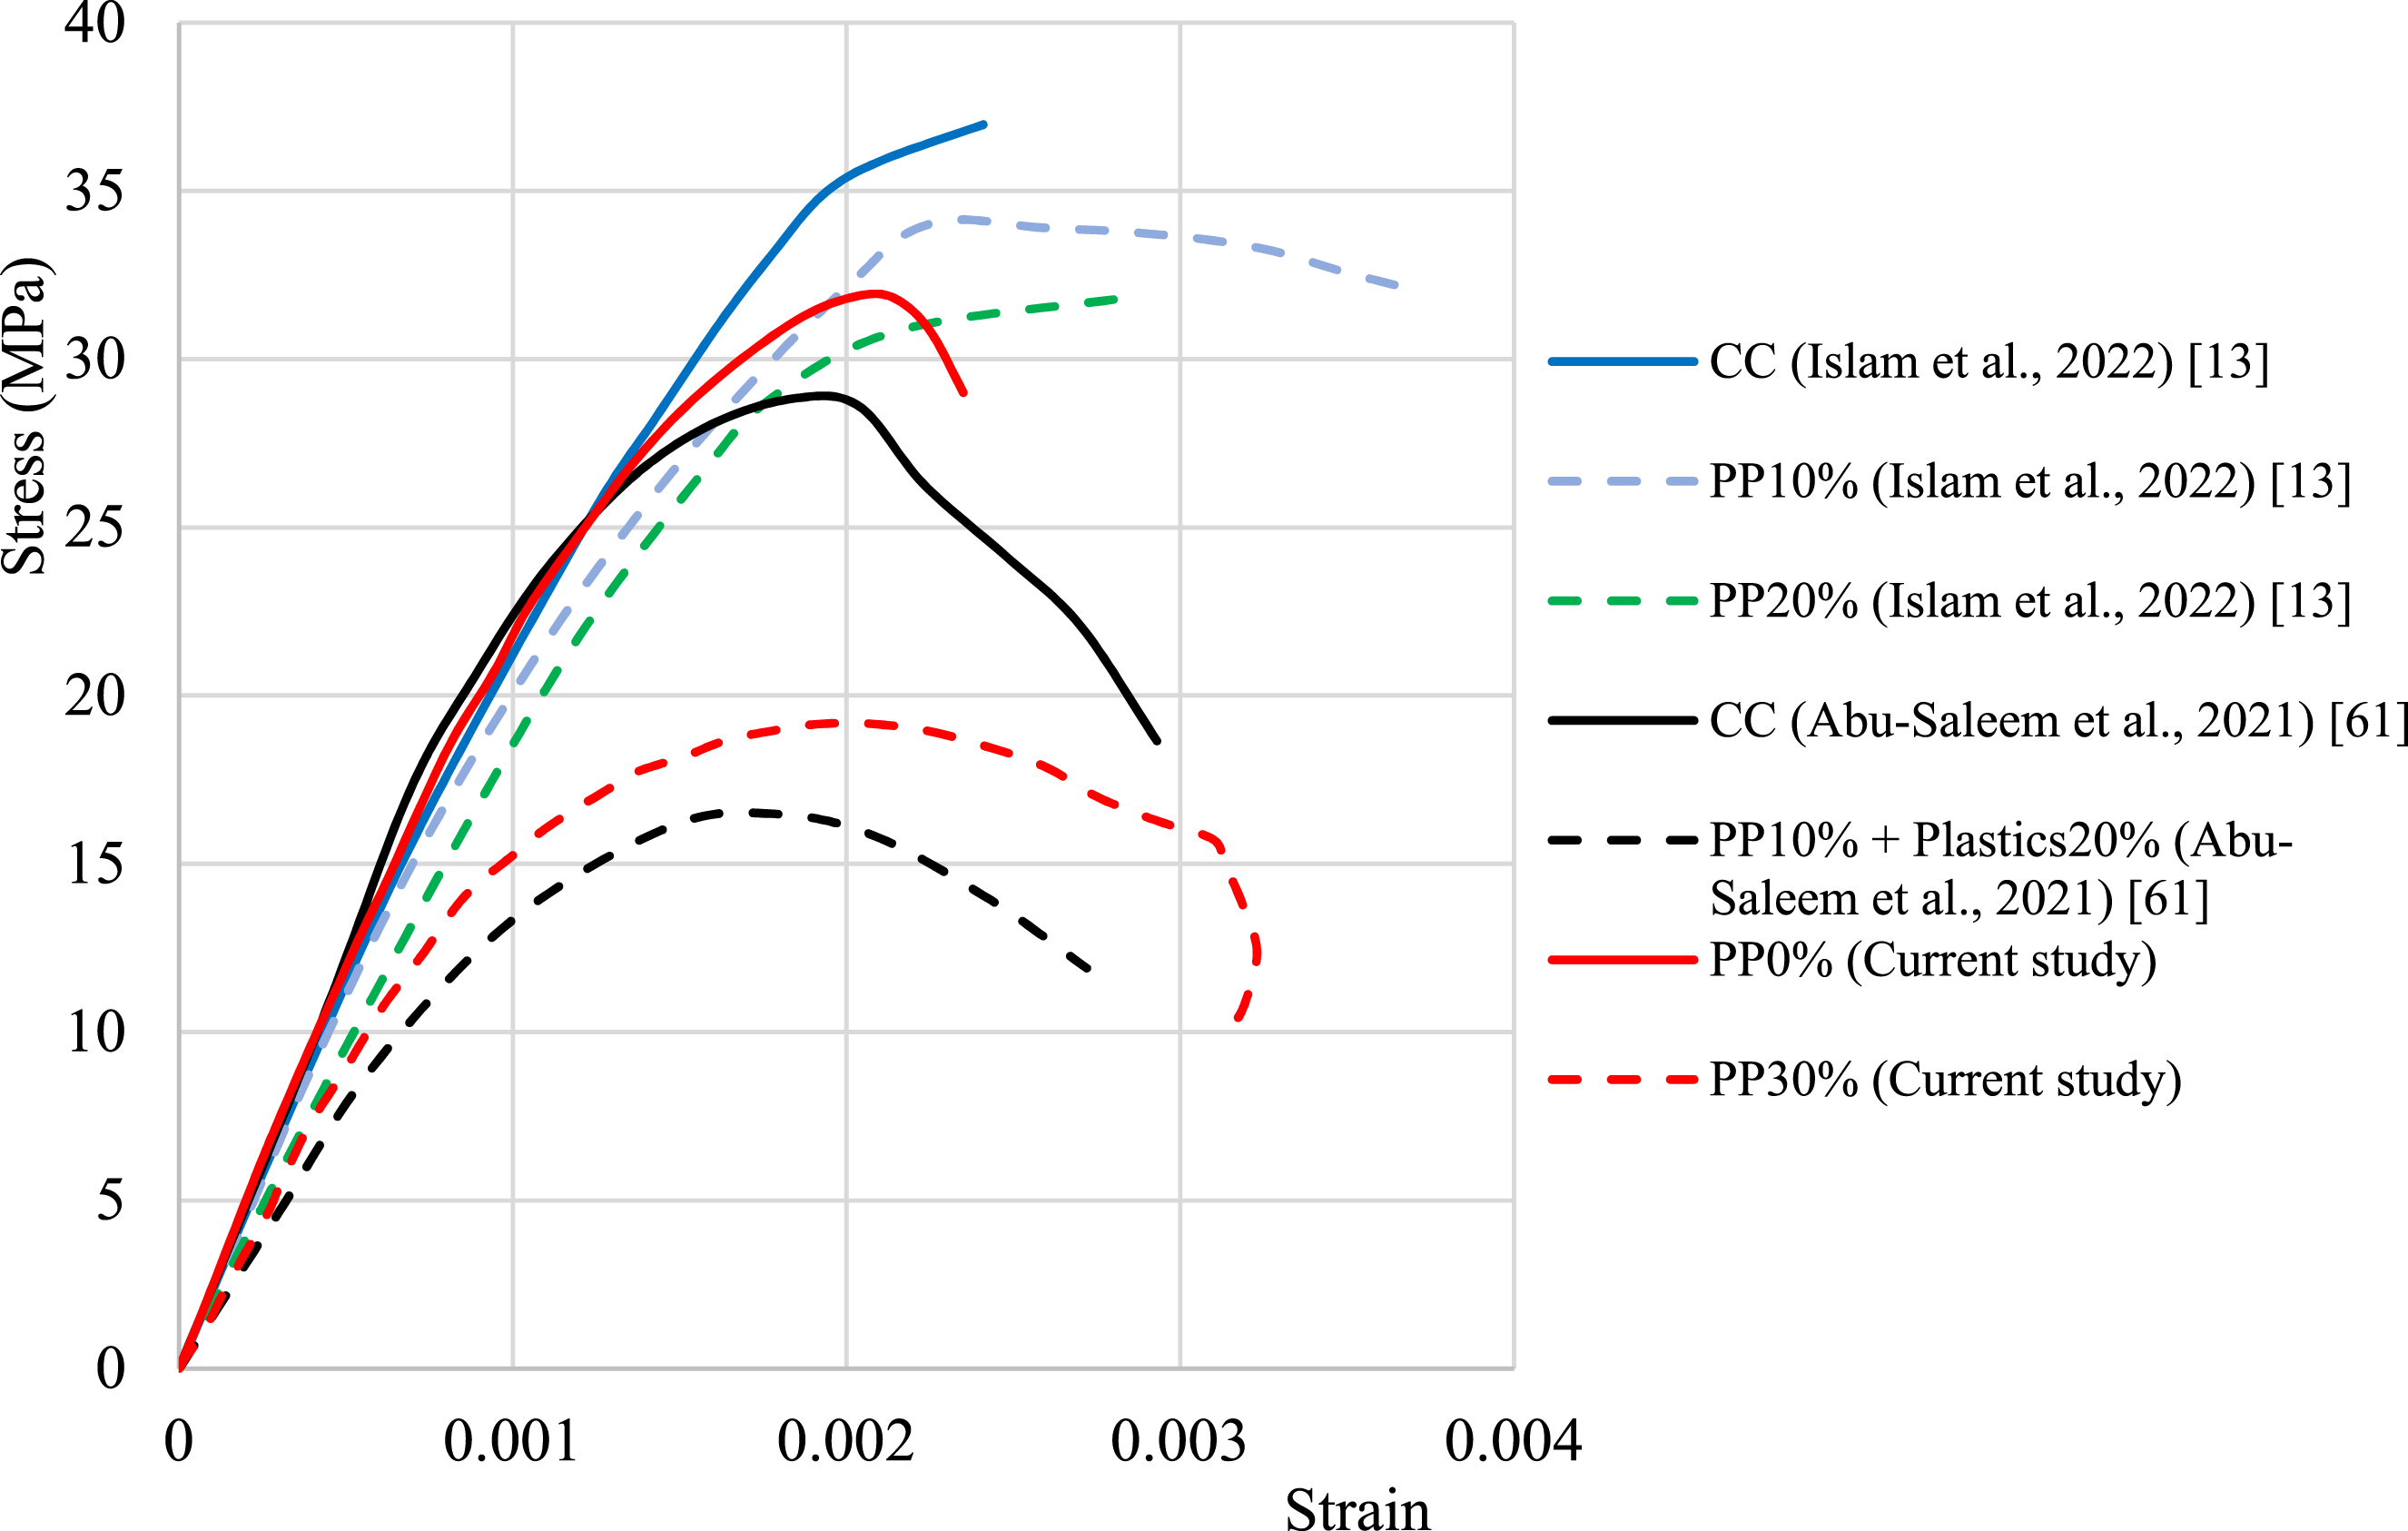
Microstructural analysis
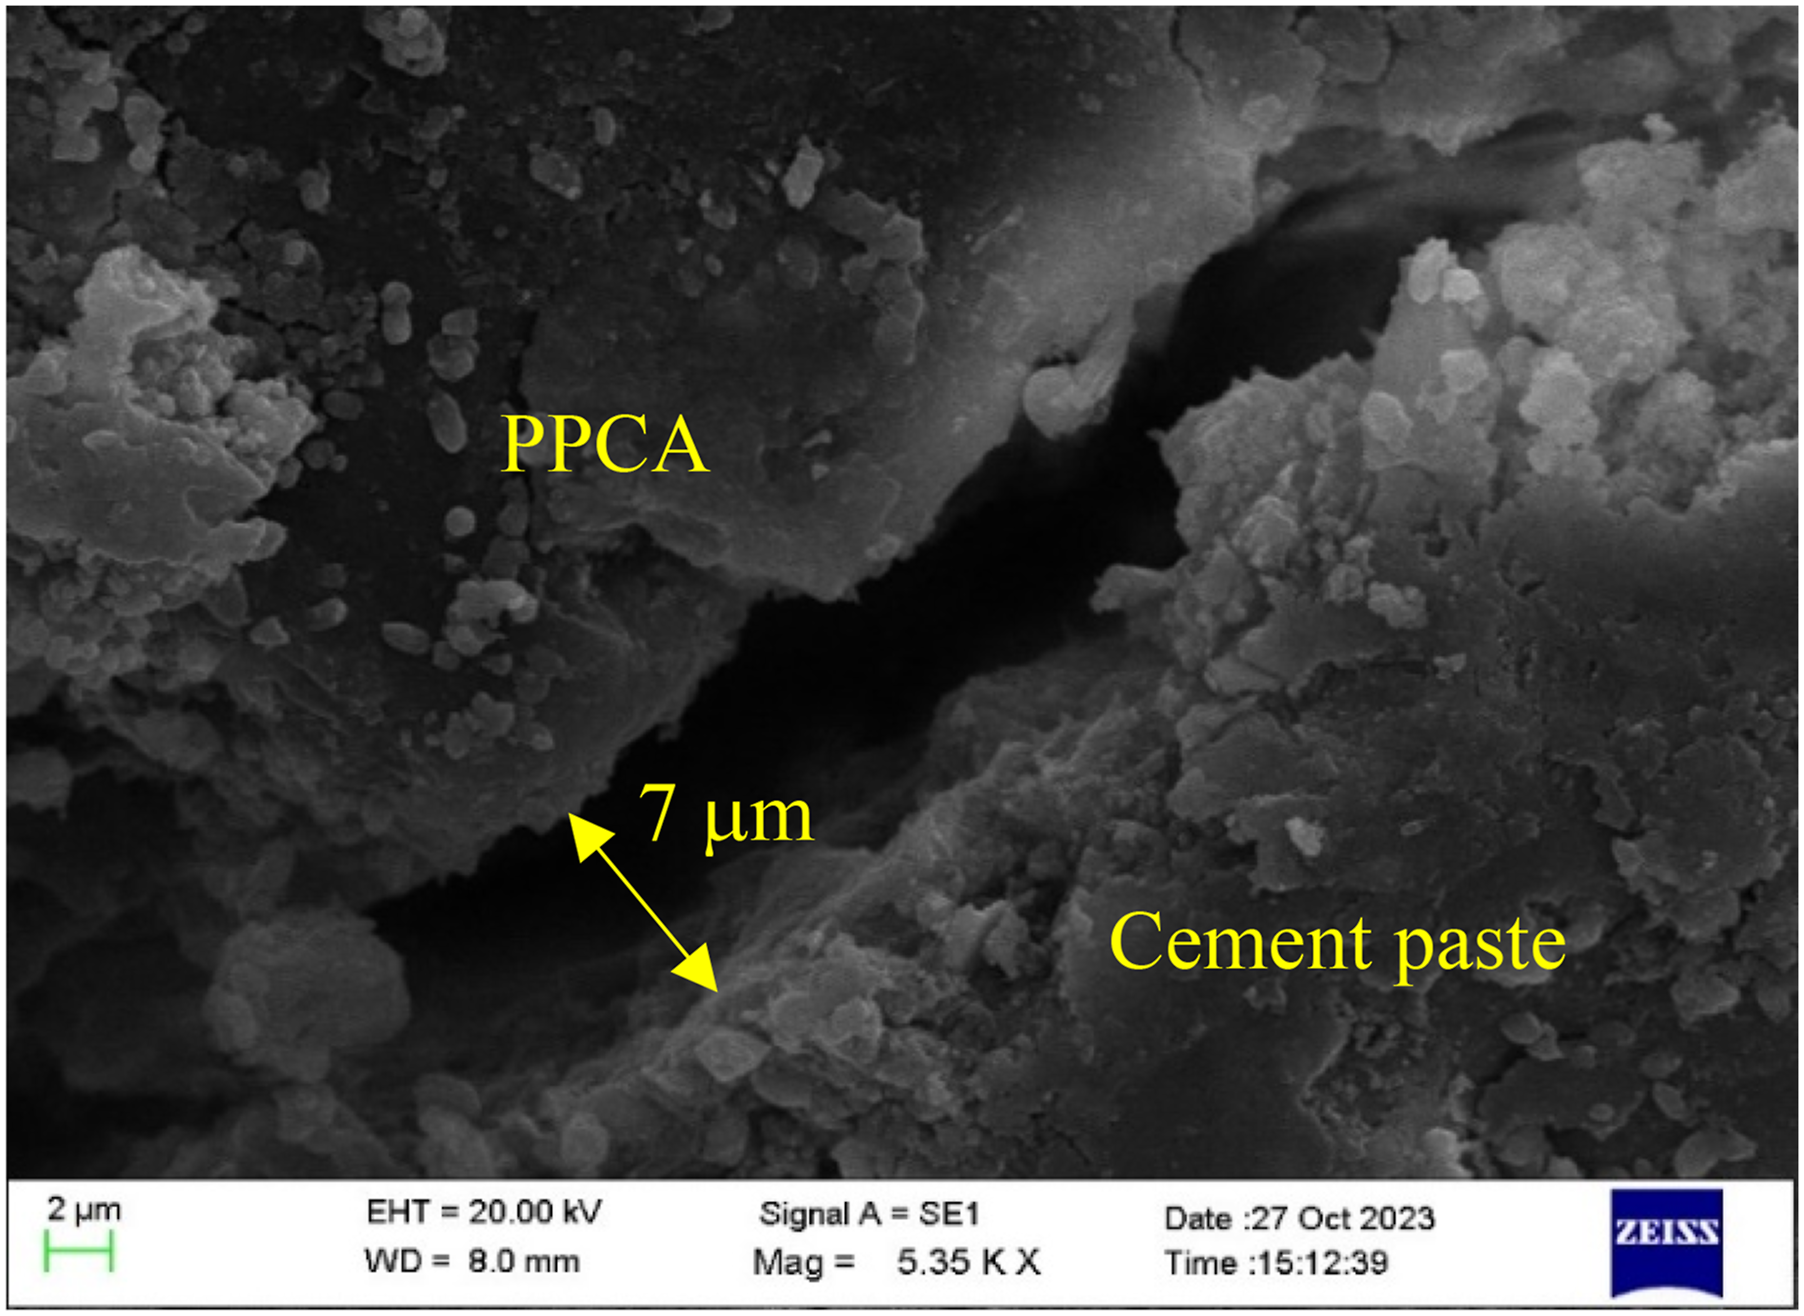
In this study, SEM images of ITZ between coarse aggregates (NCA, PPCA) and cement paste were obtained to examine the bonding between them. Figure 16 shows the SEM image of ITZ between NCA, and cement paste where a clear ITZ could not be identified due to the proper bonding between NCA, and cement paste through hydration. On the other hand, a wide ITZ with an average thickness of 7 μm was identified between PPCA, and cement mortar as displayed in Figure 17. It reveals that there is a weak adhesion between PPCA, and cement mortar when compared to NCA and cement mortar. Also, it is obvious that the plastics are unable to chemically interact with cement paste. Hence, it can be concluded that one of the key contributing factors for strength reduction in PPCAC when compared to CC was attributed to weak ITZ between PPCA and cement paste. Moreover, when increasing the PPCA replacement levels, the weak bonding formation also increases, and the strength property reduces. The aforementioned findings were observed by some of the authors in the past.8,9,11 ITZ between NCA and cement paste at a magnification of 5000 ITZ between PPCA and cement paste at a magnification of 5350 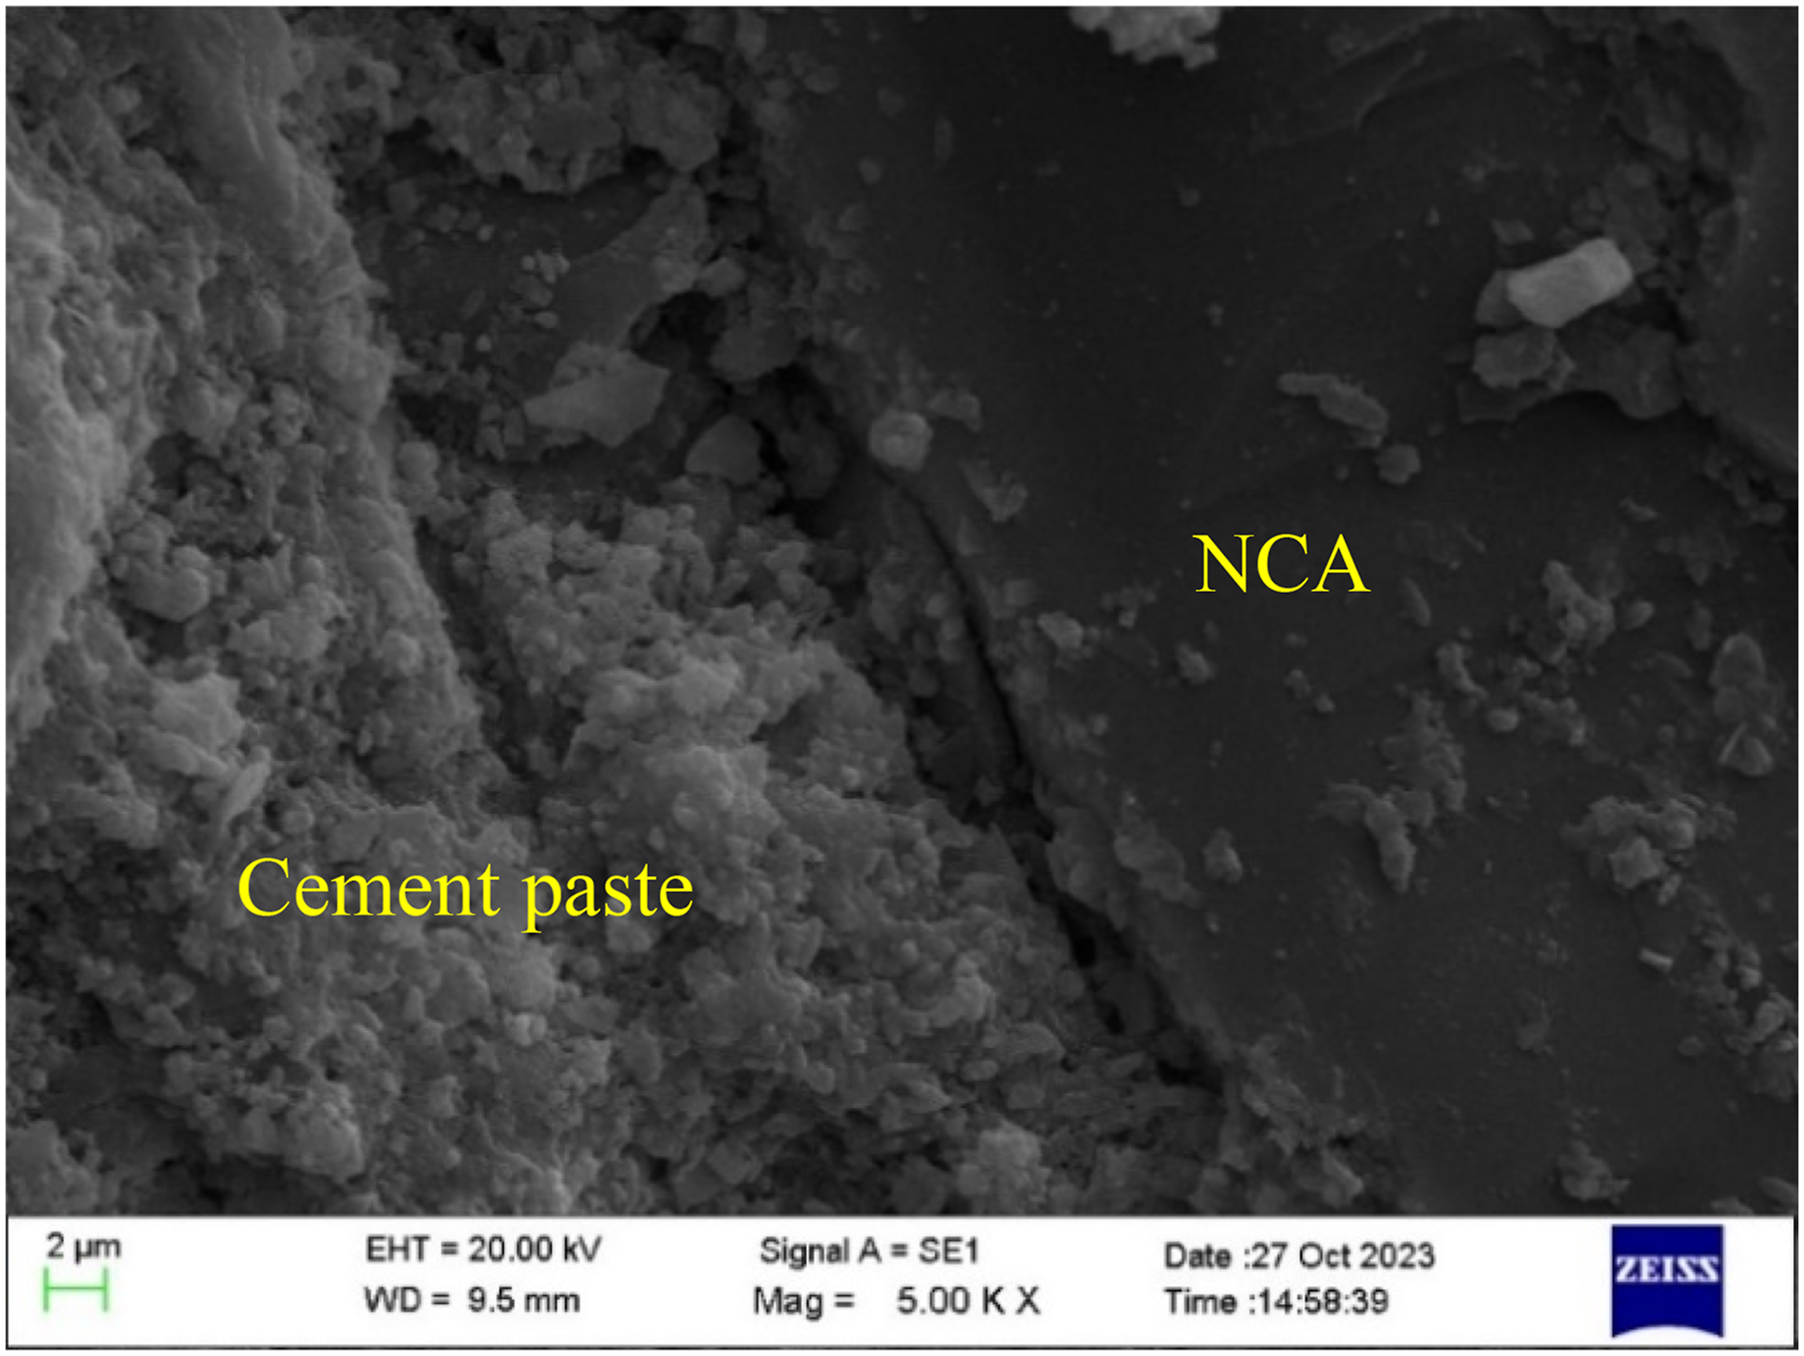
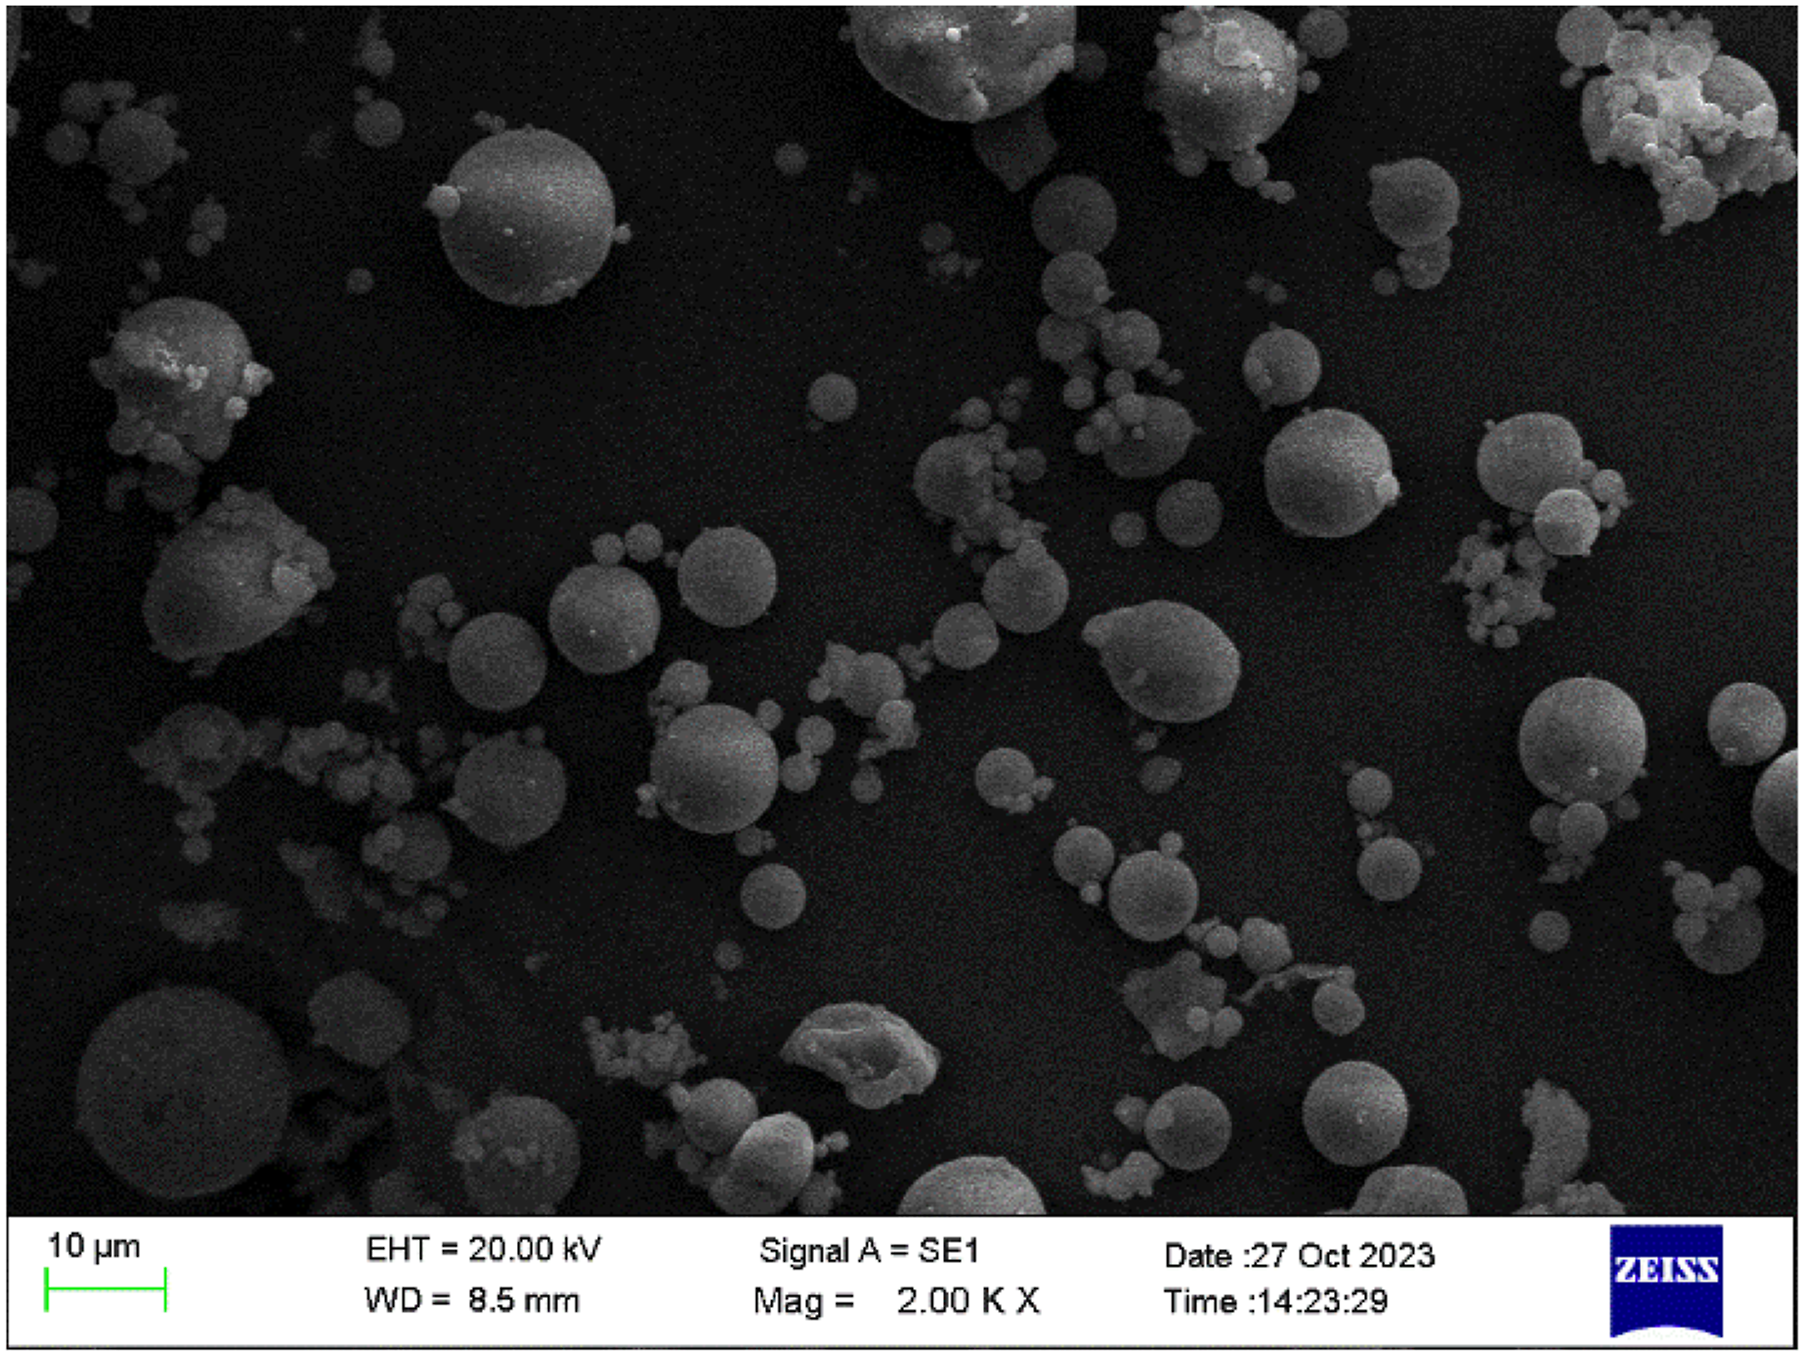
Further, the microstructural properties of cement and FA particles were investigated through SEM images. Figures 18 and 19 show the SEM images of cement and FA particles, respectively at a magnification level of 2000 SEM image of cement particles at a magnification of 2000 SEM image of fly ash particles at a magnification of 2000 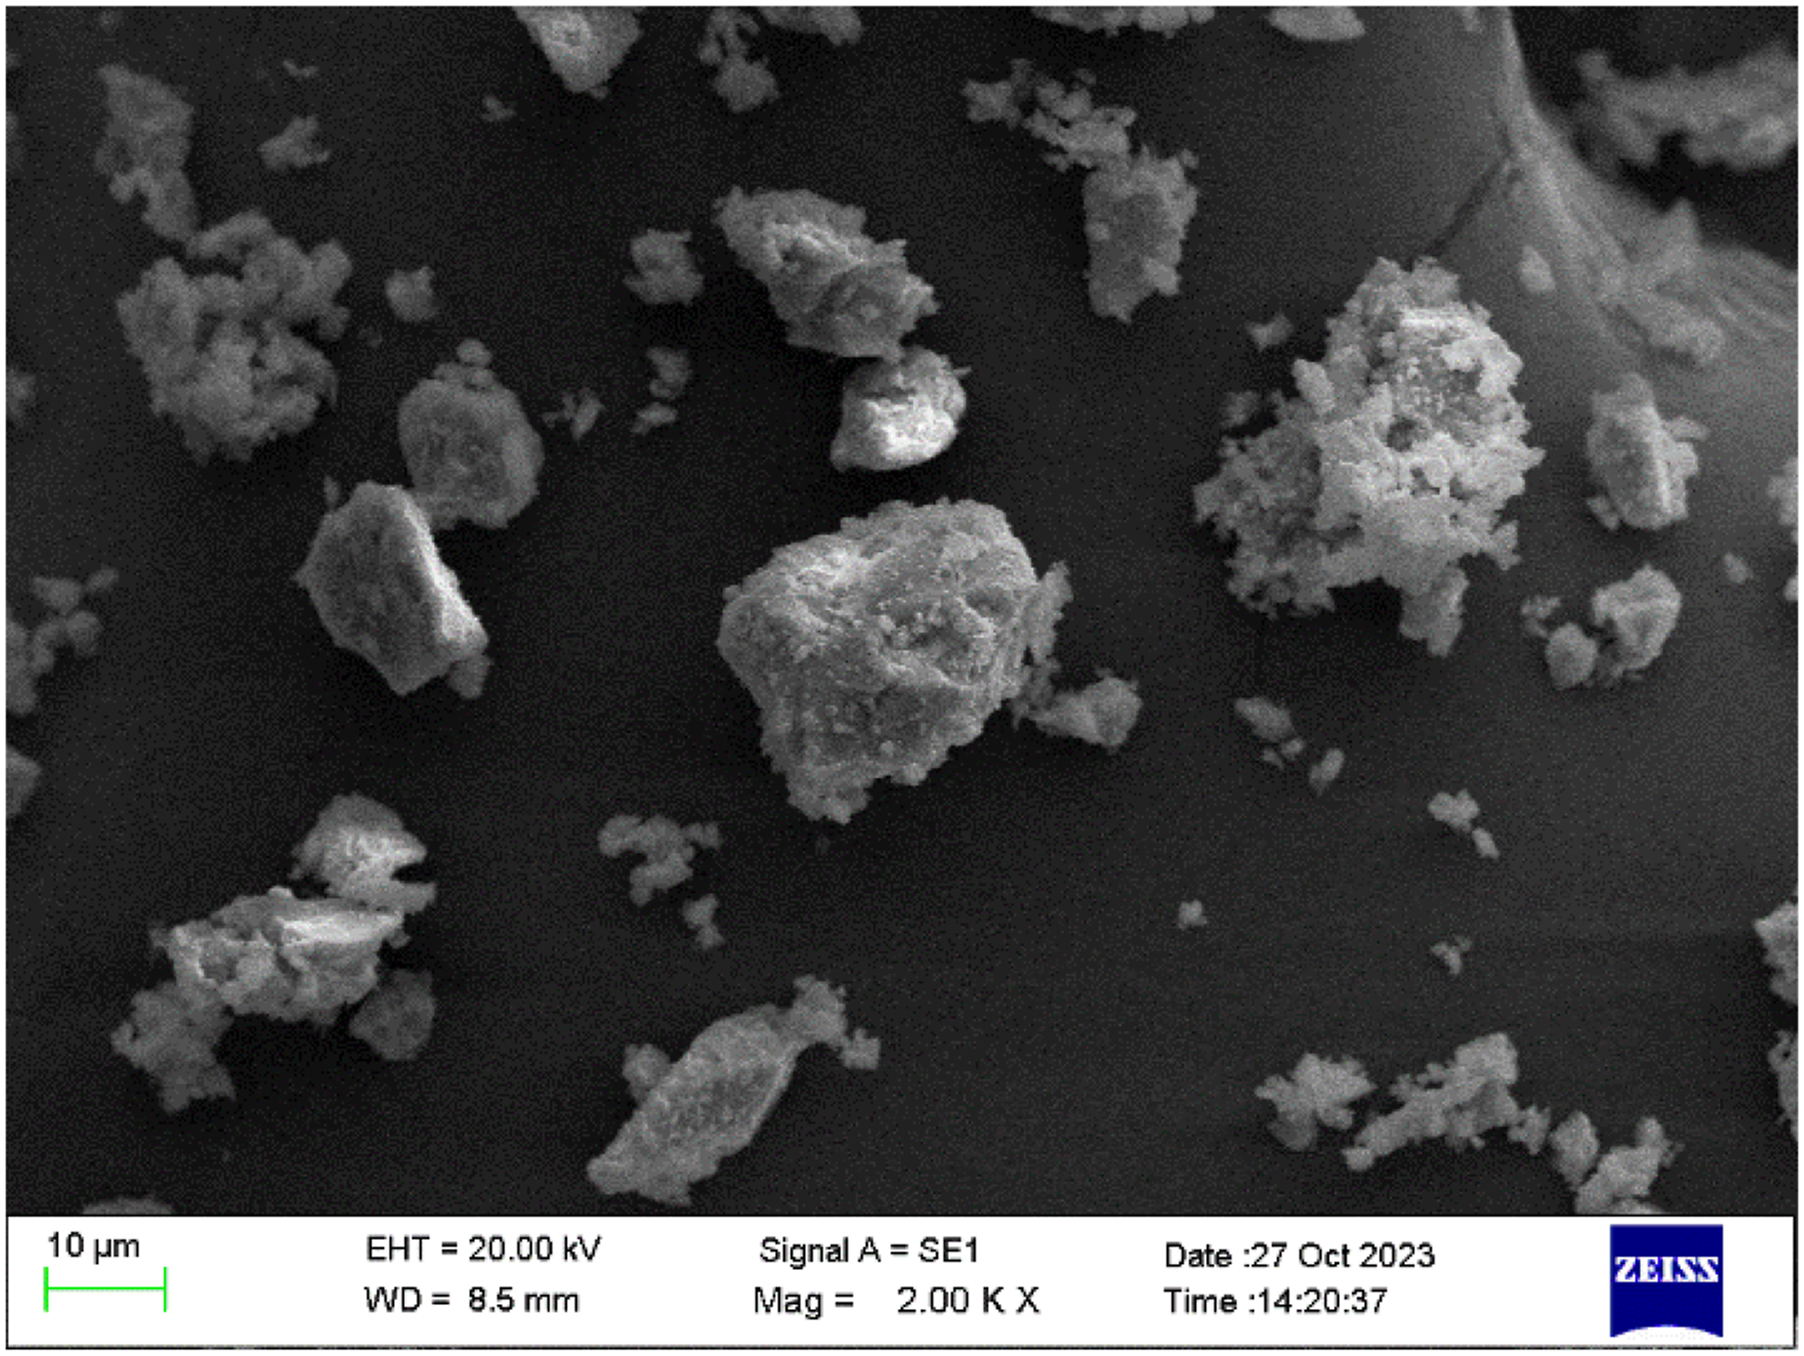
Thermal performance
Figure 20 shows the thermal conductivity variation of concrete with different PPCA replacement levels. It clearly expresses that all concrete batches having PPCA underwent a decline in thermal conductivity in comparison with CC. The thermal conductivity reduced continuously as the PPCA content increased from 0% to 30%. The reductions of 15.2%, 27%, and 39.4% were achieved at 10%, 20%, and 30% replacement levels of PPCA respectively in contrast to the CC. These reductions were attributed to the fact that the PPCA has lower thermal conductivity than that of NCA
8
and the formation of more pores with the addition of PPCA. Variation of thermal conductivity with increasing PPCA replacement levels.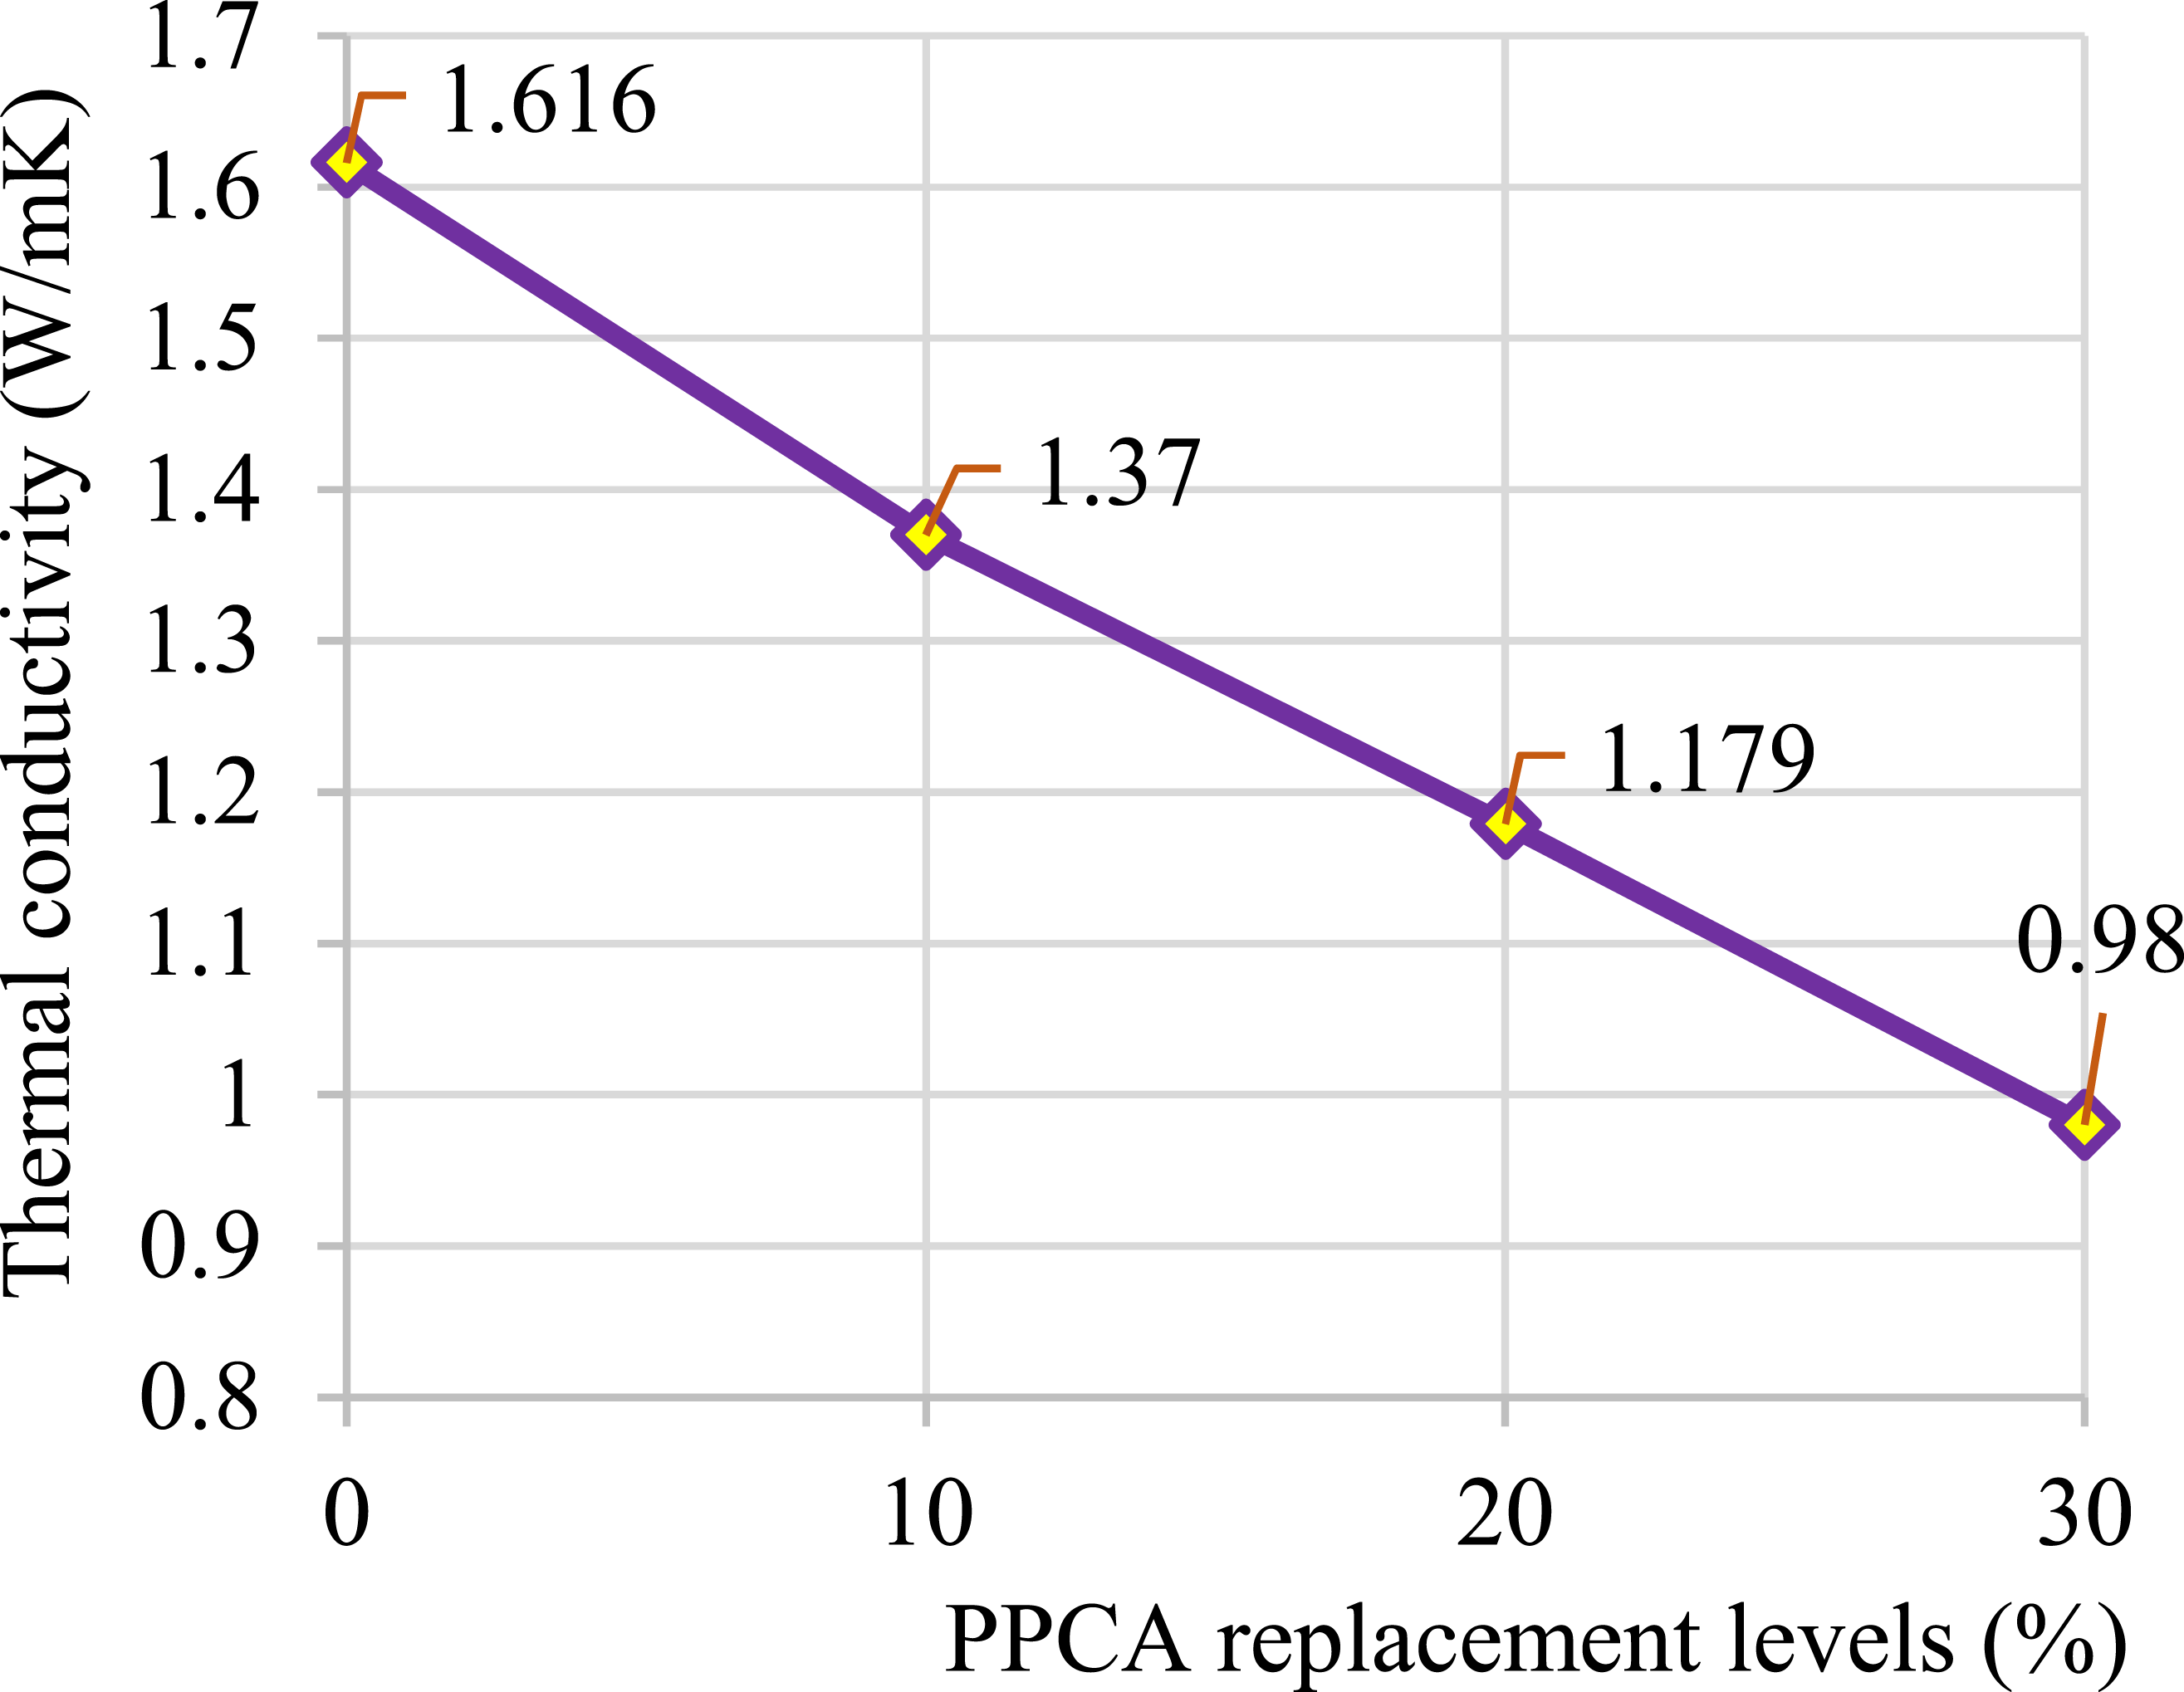
The lowest thermal conductivity was 0.98 W/mK with the use of 30% PPCA. It satisfies the standard thermal conductivity requirement for lightweight structural concrete ranging from 0.4 to 1 W/m/K. 62 Therefore, PPCAC can be used as a green building material in partition wall panels, façade cores, and insulation boards, where lightweight and thermal insulation performance is highly required. 9 Also, the reduced thermal conductivity can lead to significant energy savings for heating and cooling from room temperature, resulting in lower operational costs for buildings.
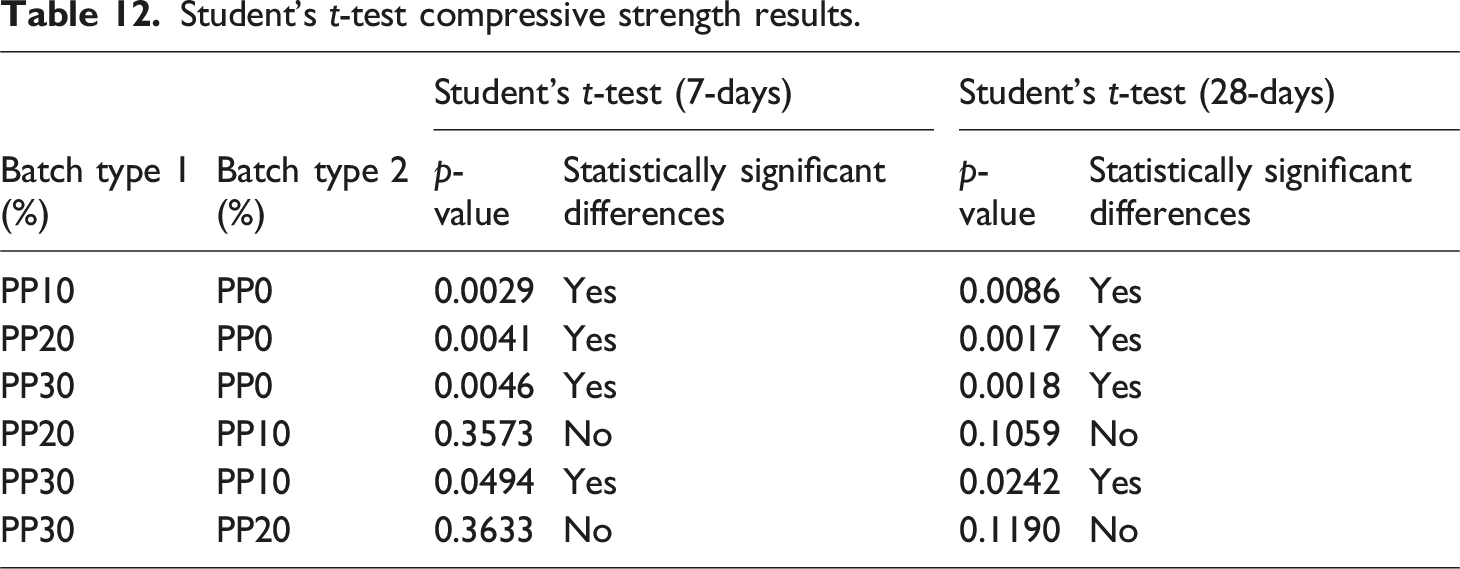
Statistical variations in the material properties
Student's t-test compressive strength results.
Correlation between mechanical properties
Major scope of this section was to predict the splitting tensile strength, flexural strength and modulus of elasticity from compressive strength results using available past equations and then, compare the predicted values with current experimental results. Hence, the applicability of the past equations to current study was investigated. Previously proposed equations in past literatures and well-established standards were used for this purpose. In addition, it solely considers the PPCAC without SP and FA. When considering the few available empirical equations to predict the mechanical properties based on the compressive strength, the research team of Islam20,60 incorporated the effect of PPCA in those equations. They used experimental results and regression analysis to find the mechanical properties where compressive strength and PPCA contents were considered as predictors. All other equations only considered compressive strength as predictors.
Correlation between compressive strength and splitting tensile strength
The proposed relationships by Islam & Shahjalal
20
: equation (1), Islam
60
: equation (2), Purnomo
59
: equation (3) and standard code of practices such as ACI 318-14
64
: equation (4), EC2
65
: equation (5), and AS 3600
66
: equation (6) were used for the prediction of 28-days STS where 28-days compressive strength and PPCA replacement levels (in few equations) of current study were used as input parameters. The current STS results are plotted against predicted STS results from various past equations as shown in Figure 21 for PP0%, PP10%, PP20%, and PP30% batches. It clearly shows that all equations except equation (6) overestimate the current STS results. The percentage of overestimation increases in the order of equations (1), (5), (4), (3), and (2). The AS3600
66
standard accurately predicts the experimental STS values of PP10% and PP20% batches. However, the predictions underestimate the STS of PP0% and overestimate the STS of PP30%. In summary none of the past equations accurately predict the STS values for all four batches. Experimental splitting tensile strength results comparison with predictions from past studies and standard codes (♢: PP30%, ☐: PP20%, Δ: PP10%, о: PP0%).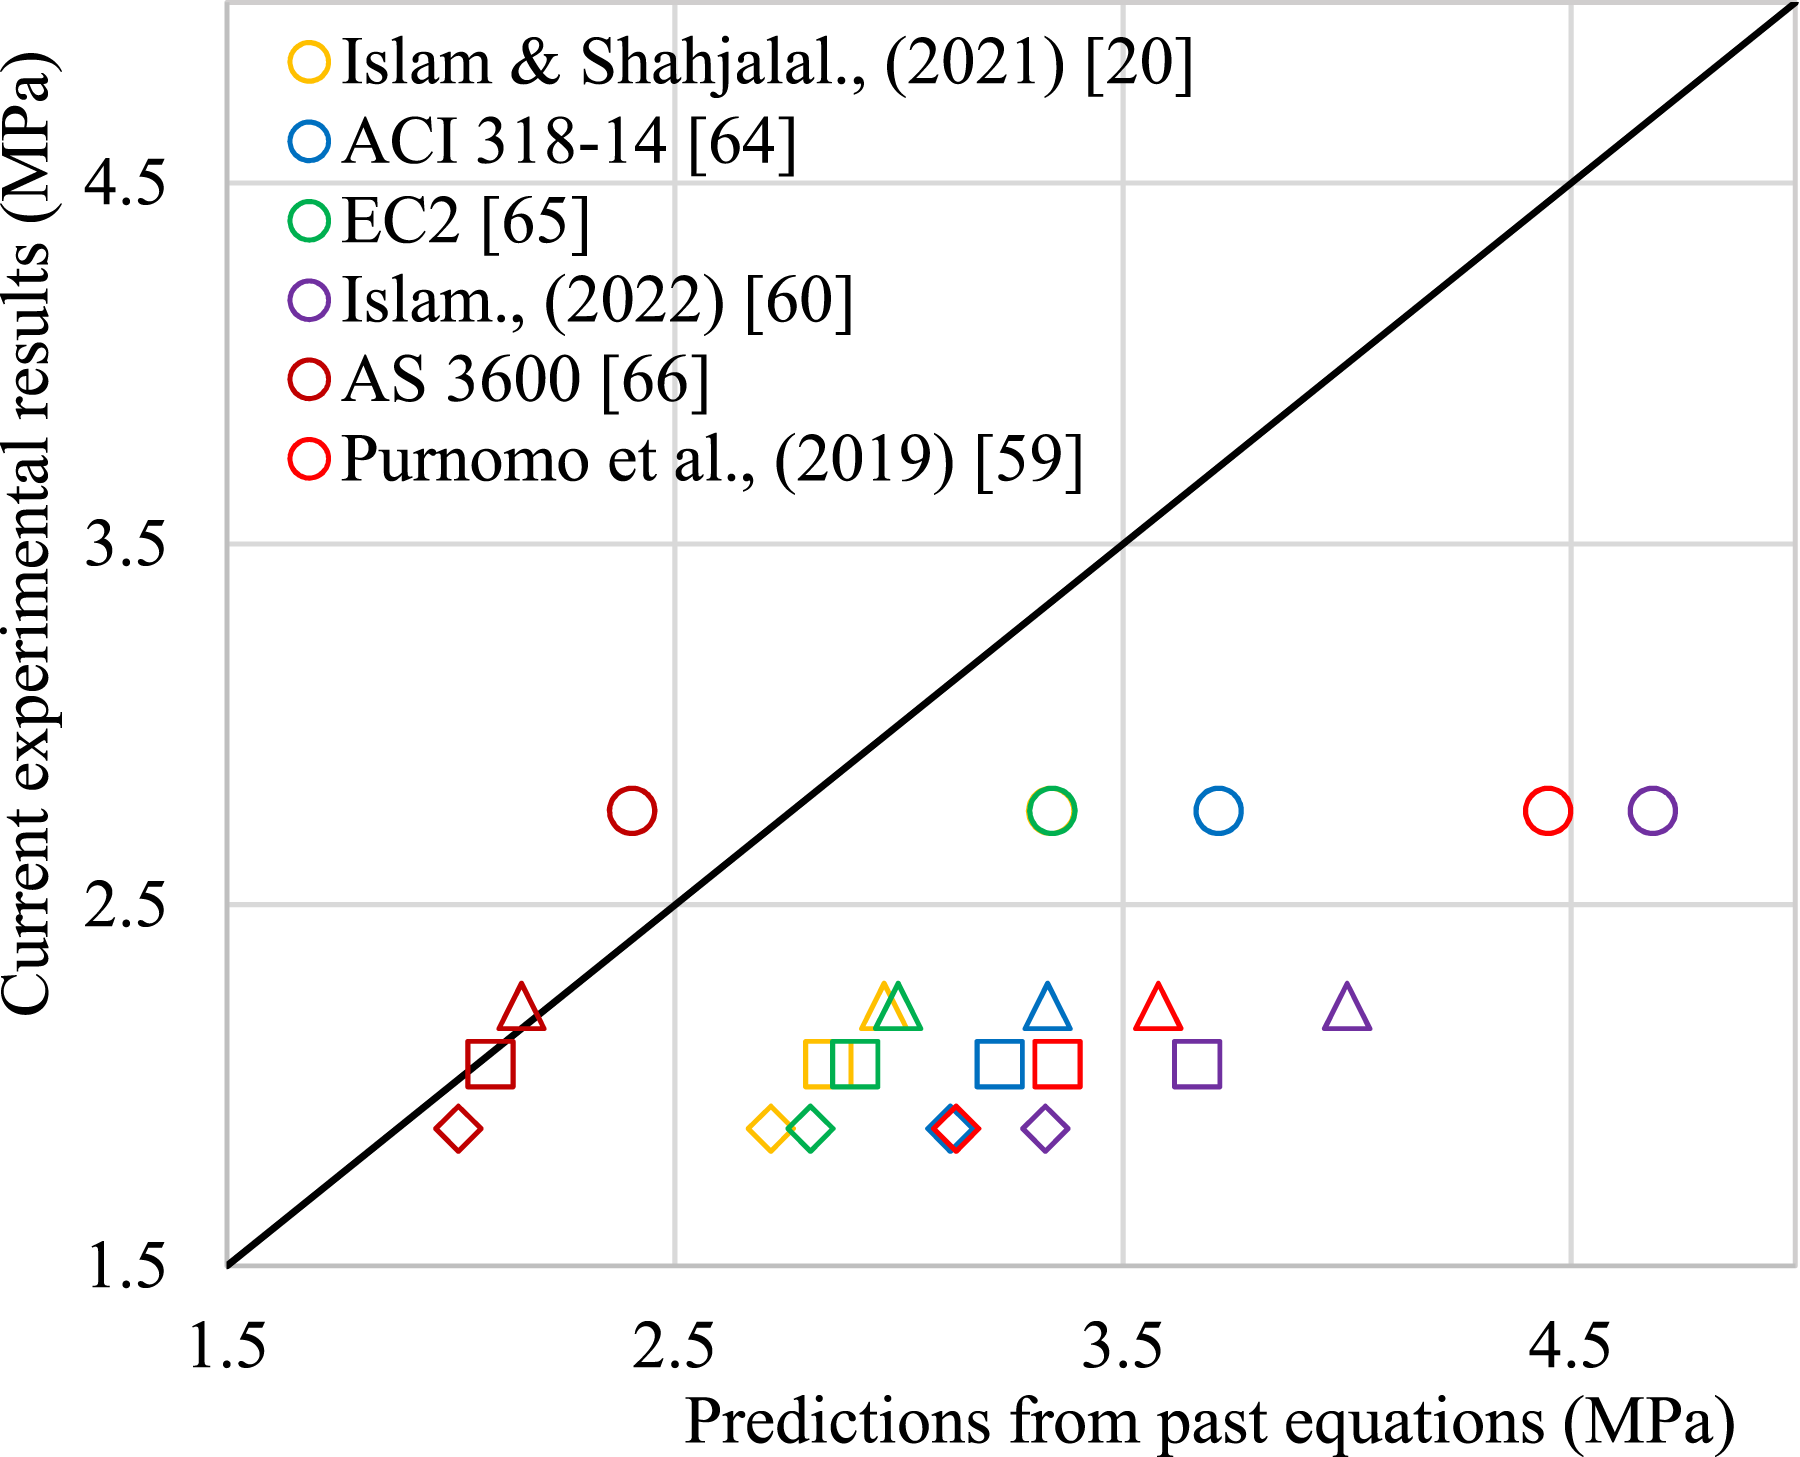
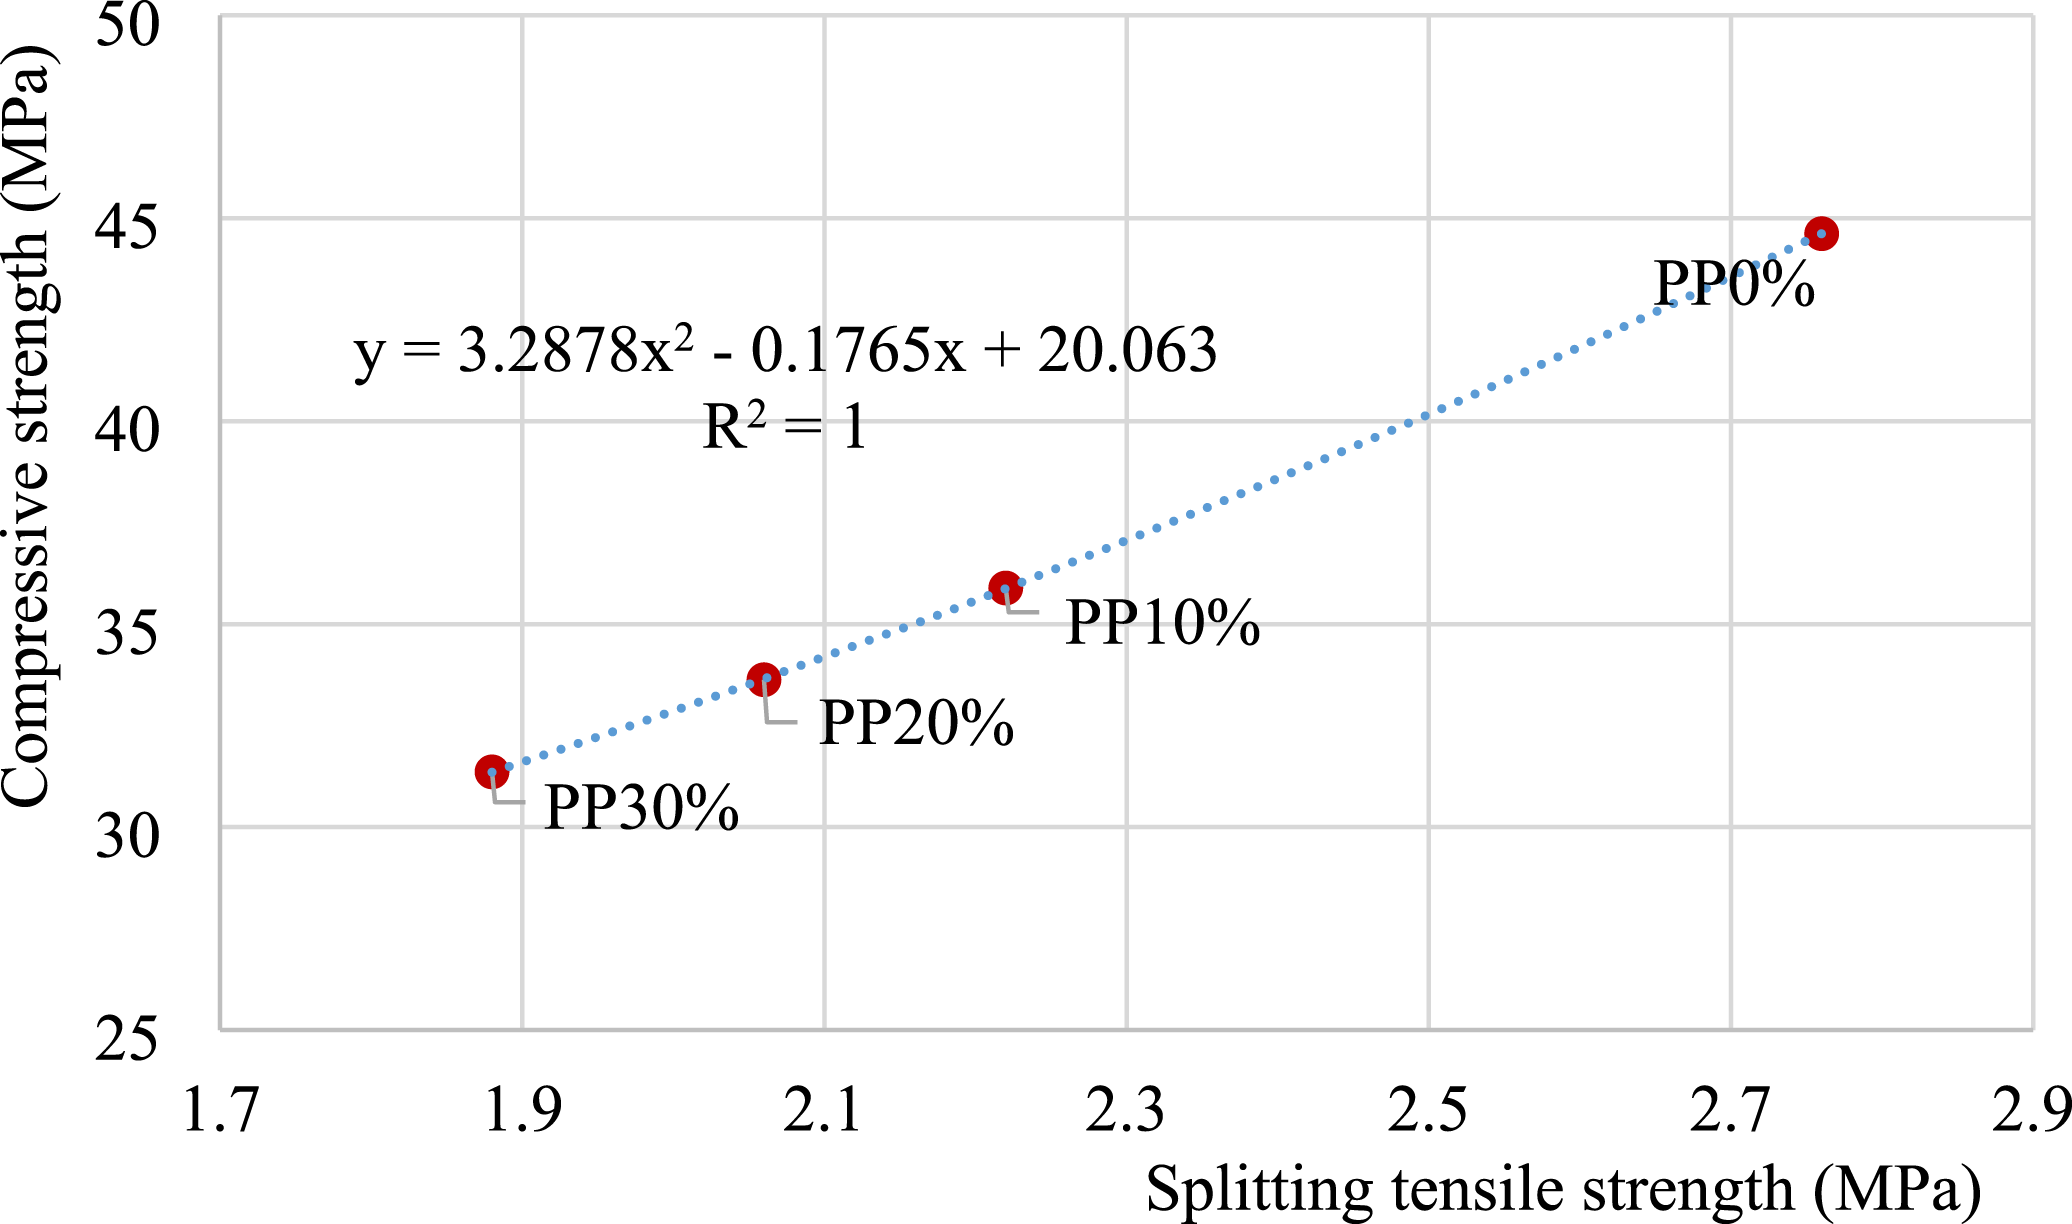
In addition, correlation between 28-days compressive strength and 28-days STS of current study is shown in Figure 22, which displays a strong proportional relationship with almost linear trend and correlation coefficient (R2) of 1. Out of various forms of relationships, the second order polynomial function well suited for the comparison when analysing the R2. Correlation between 28-days compressive strength and 28-days splitting tensile strength.


Correlation between compressive strength and flexural strength
The suggested relationships by Islam & Shahjalal
20
: equation (7) and standard code of practices such as ACI 318-14
64
: equation (8), EC2 (BSI 2004)
65
: equation (9), and AS 3600
66
: equation (10) were utilized for the prediction of 28-days flexural strength based on 28-days compressive strength and PPCA replacement levels (in some equations). The variation of current flexural strength results plotted against predicted values of flexural strength are shown in Figure 23. It shows that the equation (7) provided by Islam & Shahjalal
20
overestimates the flexural strength of PP0%, PP10%, PP20%, and PP30% batches. On contrary, the proposed equations of ACI 318-14
64
and AS 3600
66
underestimate the current flexural strength values. In EC2 (BSI 2004)
67
prediction, the flexural strength of PP30% was overestimated and PP0%, PP10% and PP20% were underestimated. Experimental flexural strength results comparison with predictions from past studies and standard codes (♢: PP30%, ☐: PP20%, Δ: PP10%, о: PP0%).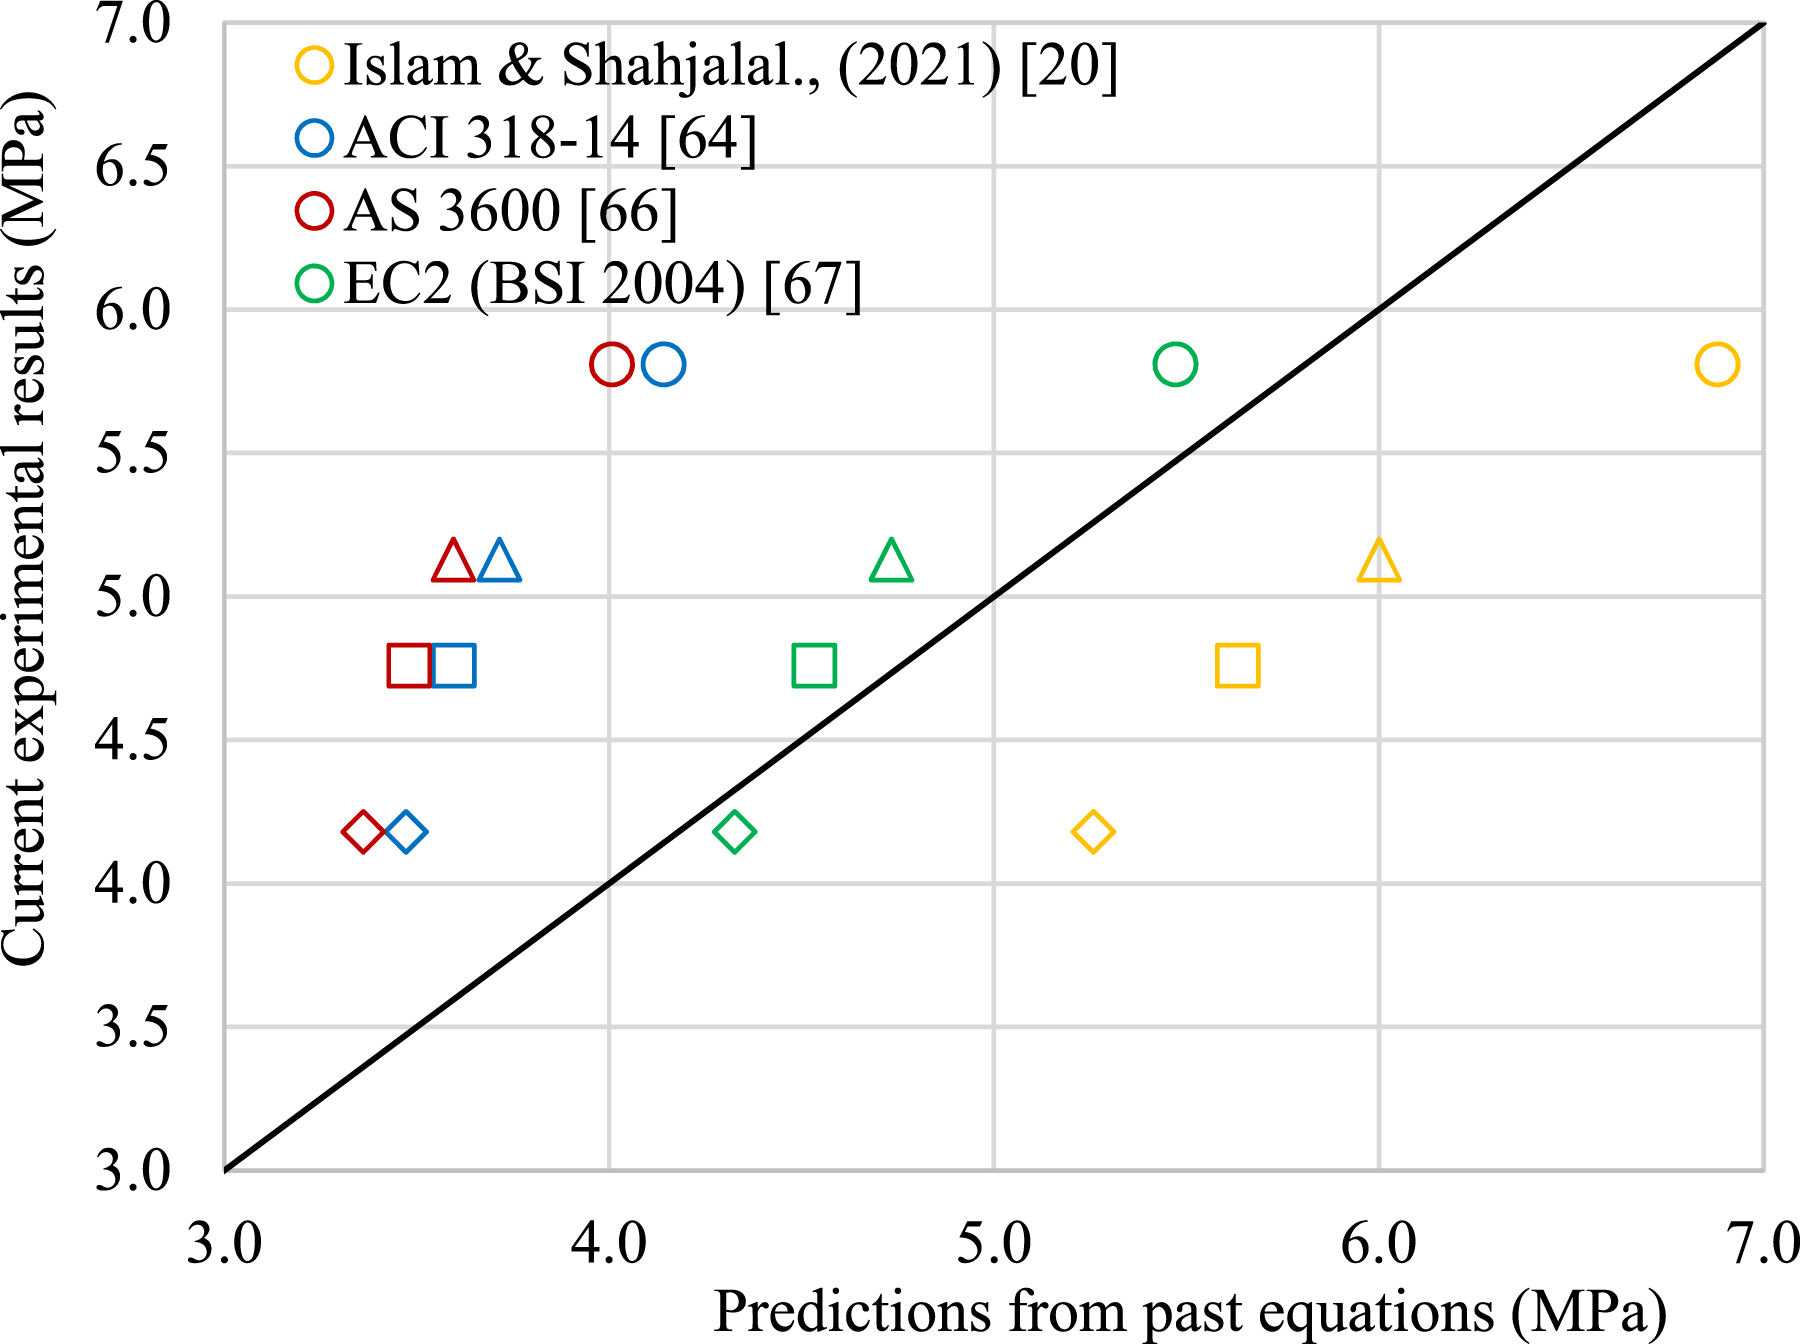
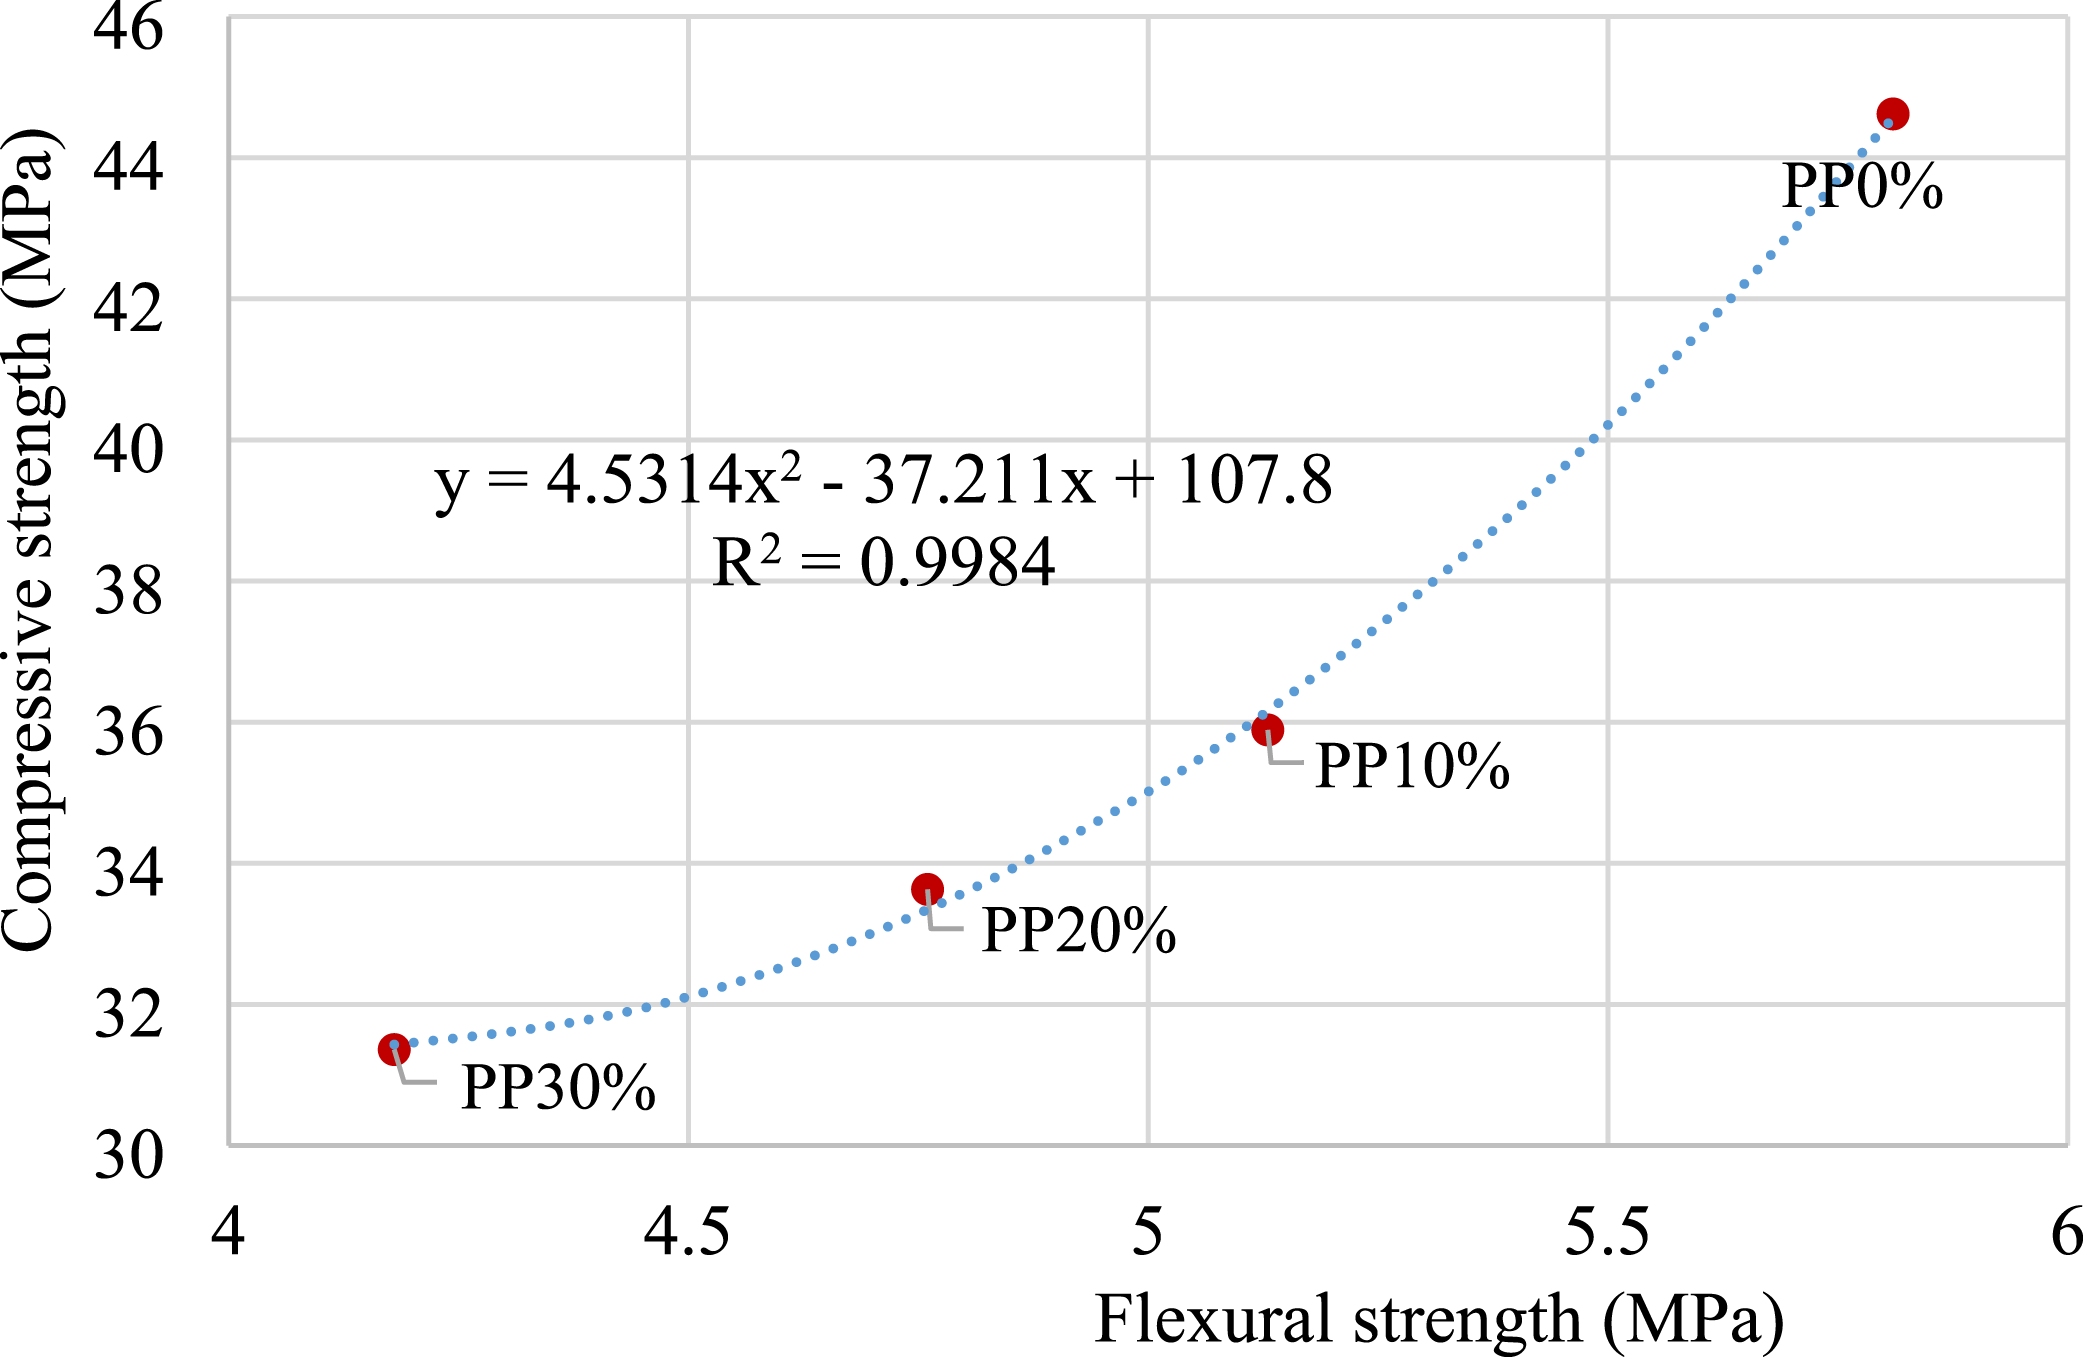
Further, Figure 24 displays the correlation between 28-days compressive strength and flexural strength. The variation is not linear, and the value of R2 is 0.9984. Correlation between 28-days compressive strength and 28-days flexural strength.


Correlation between compressive strength and modulus of elasticity
The suggested relationships by Islam & Shahjalal
20
: equation (11) and standard code of practices such as ACI 318-14
64
: equation (12), AS 3600
66
: equation (12), and CSA A23.3-14
68
: equation (13) were used for the prediction of 28-days MoE using 28-days compressive strength, density of concrete and PPCA replacement levels (in some equations). The MoE results of current study plotted against predicted MoE values are presented in Figure 25. Similar to STS and flexural strength, the equation (11) proposed by Islam & Shahjalal
20
overestimates the experimental MoE values. Further, the ACI 318-14
64
and AS3600
66
standards overestimate the MoE of PP20% and PP30% batches, whereas closely predicts the PP0% and PP10% batches. The CSA A23.3-14
68
standard overestimates the MoE of PP20% and PP30% batches. In contrast, underestimates the MoE of PP0% and PP10%. Experimental modulus of elasticity results in comparison with predictions from past studies and standard codes (♢: PP30%, ☐: PP20%, Δ: PP10%, о: PP0%).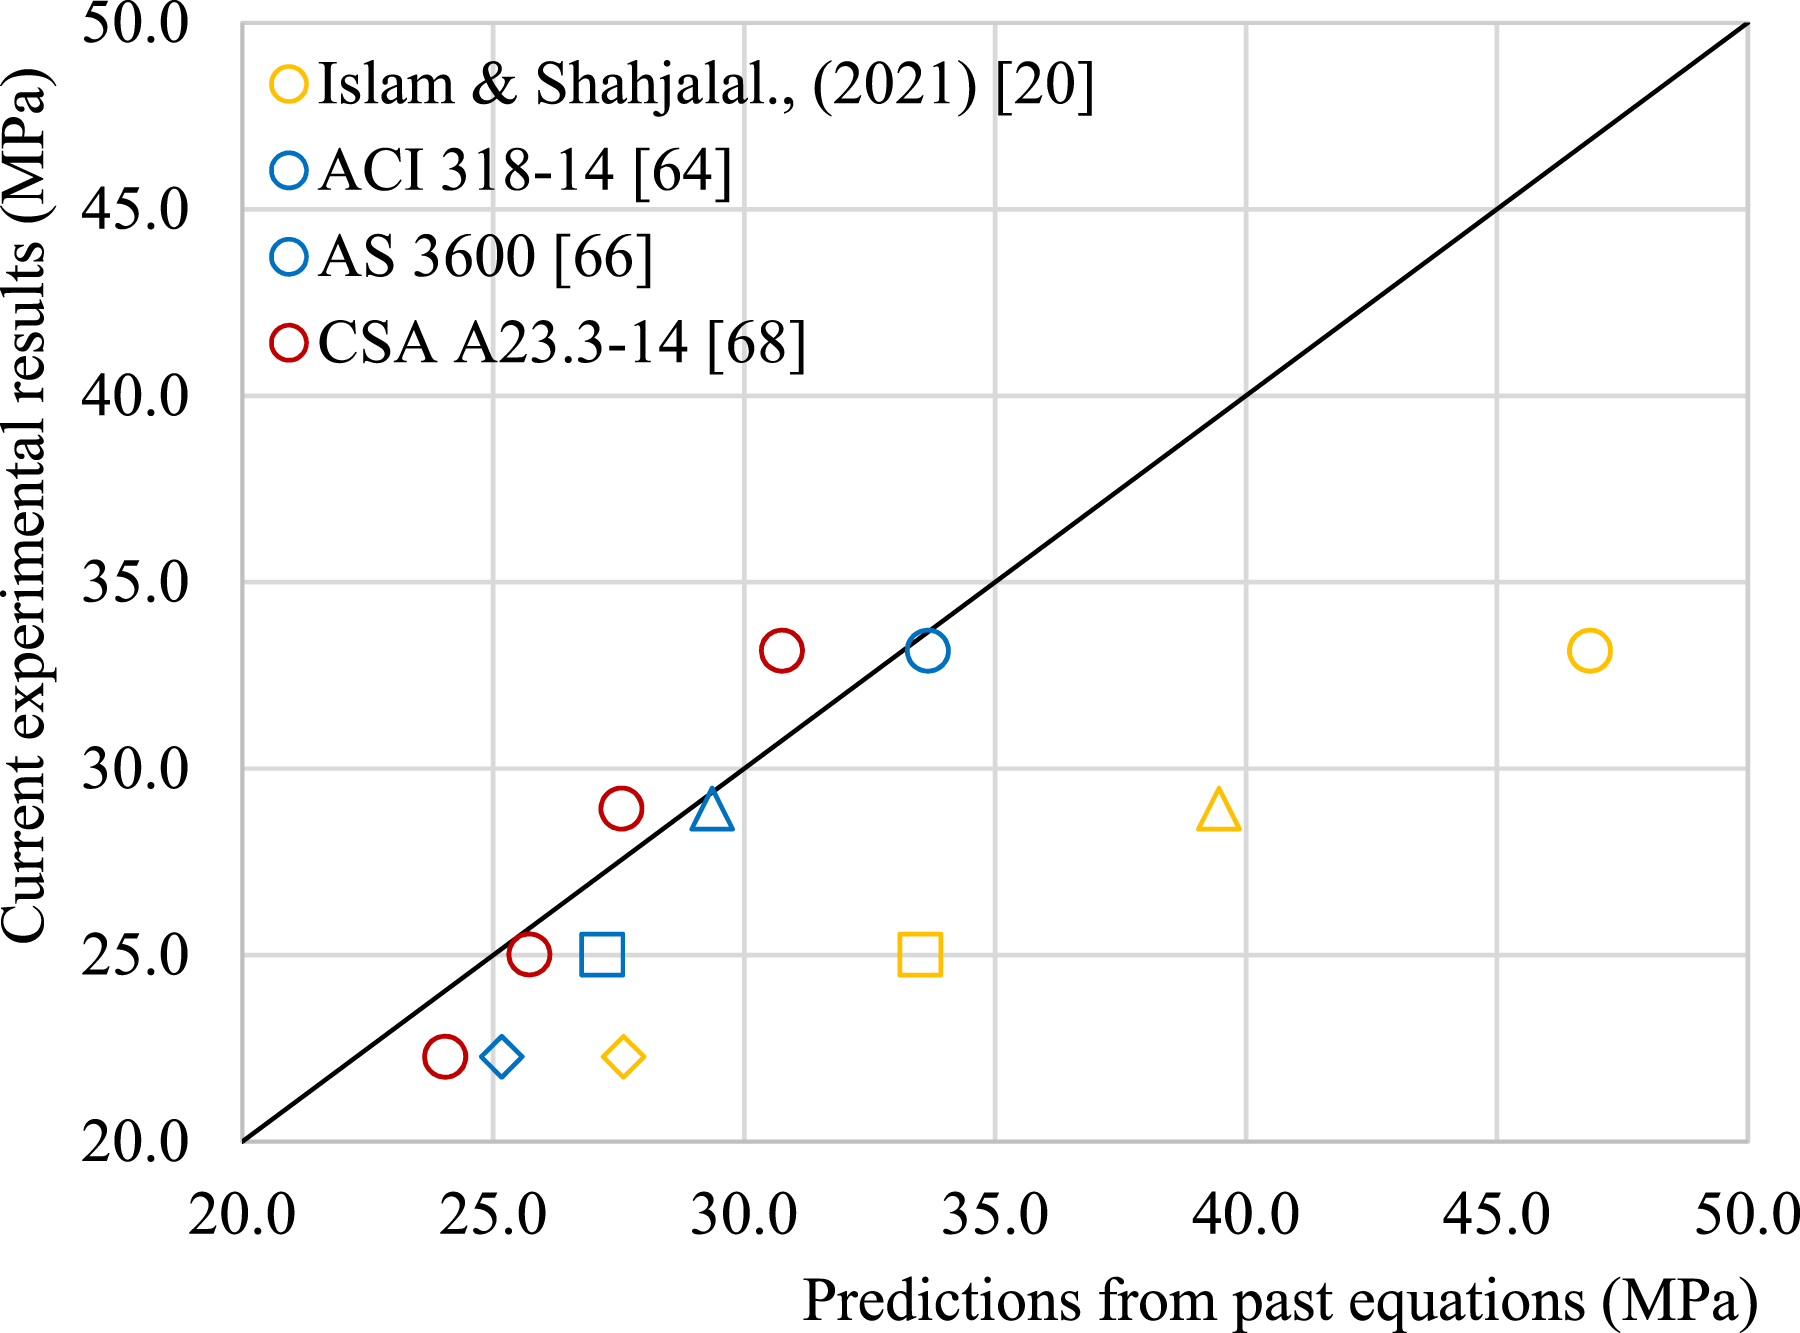
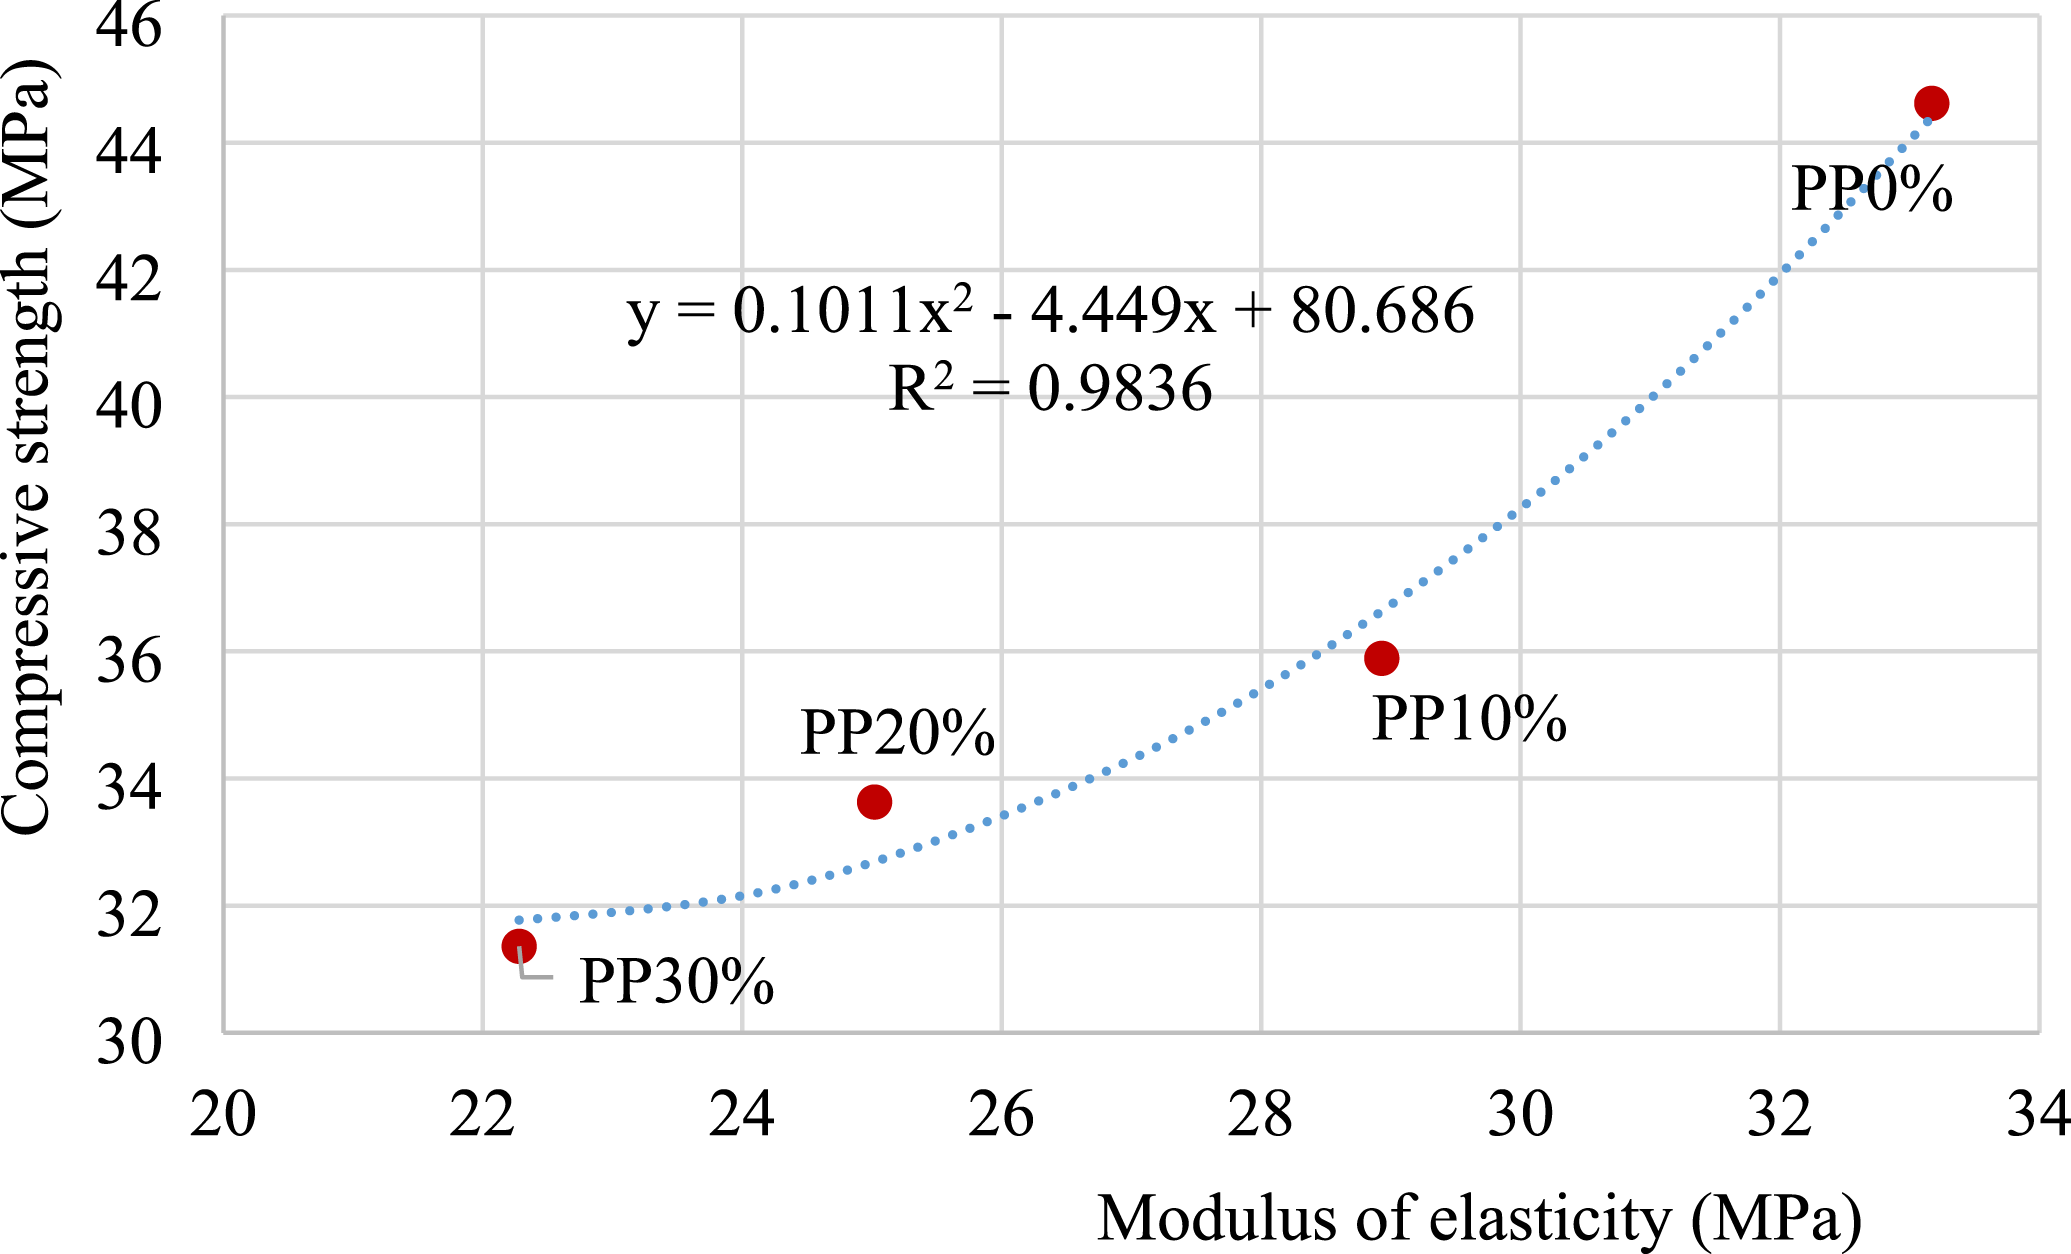
Figure 26 shows the correlation between 28-days compressive strength and 28-days MoE. It displays a non-linear second order polynomial function with R2 value of 0.9836. Correlation between 28-days compressive strength and modulus of elasticity.


Economical aspects
Cost analysis is useful for assessing the sustainability of concrete.20,60 There was no raw material cost for both PPCA and FA as they were waste. However, the collection, cleaning, categorization, preparation and shredding of PPCA needed a cost of 160 LKR/kg (in 2024). Figure 27 illustrates the unit cost for different concrete batches with various replacement levels of PPCA and FA. This bar graph shows that the addition of FA reduces the cost of BBSC batches. Here, unit cost was considered as cost per m3 of concrete. The unit cost reductions of 3.5% and 7% were achieved with 10% and 20% replacement levels of FA, respectively in PP10% concrete while reductions of 3.3% and 6.6% were achieved with the same replacement levels in PP30% concrete. Out of all BBSC batches PP10%-FA20% can be considered as cost-effective and eco-friendly concrete with optimum replacement levels. Further, the expenses for PPCA can be minimized by large-scale production. Moreover, cost-saving techniques can be implemented in the future if the industries get on board with this kind of novel material by improving the collection and recycling rate of plastic waste. When assuming the processing cost of PPCA is similar to NCA, the maximum cost reduction will be achieved in PP30%-FA20% batch. This offers benefits not only from an economic perspective but also from an environmental point of view. Because more solid waste can be managed when using 30% of PPCA and 20% of FA. Unit cost for concrete batches (2024).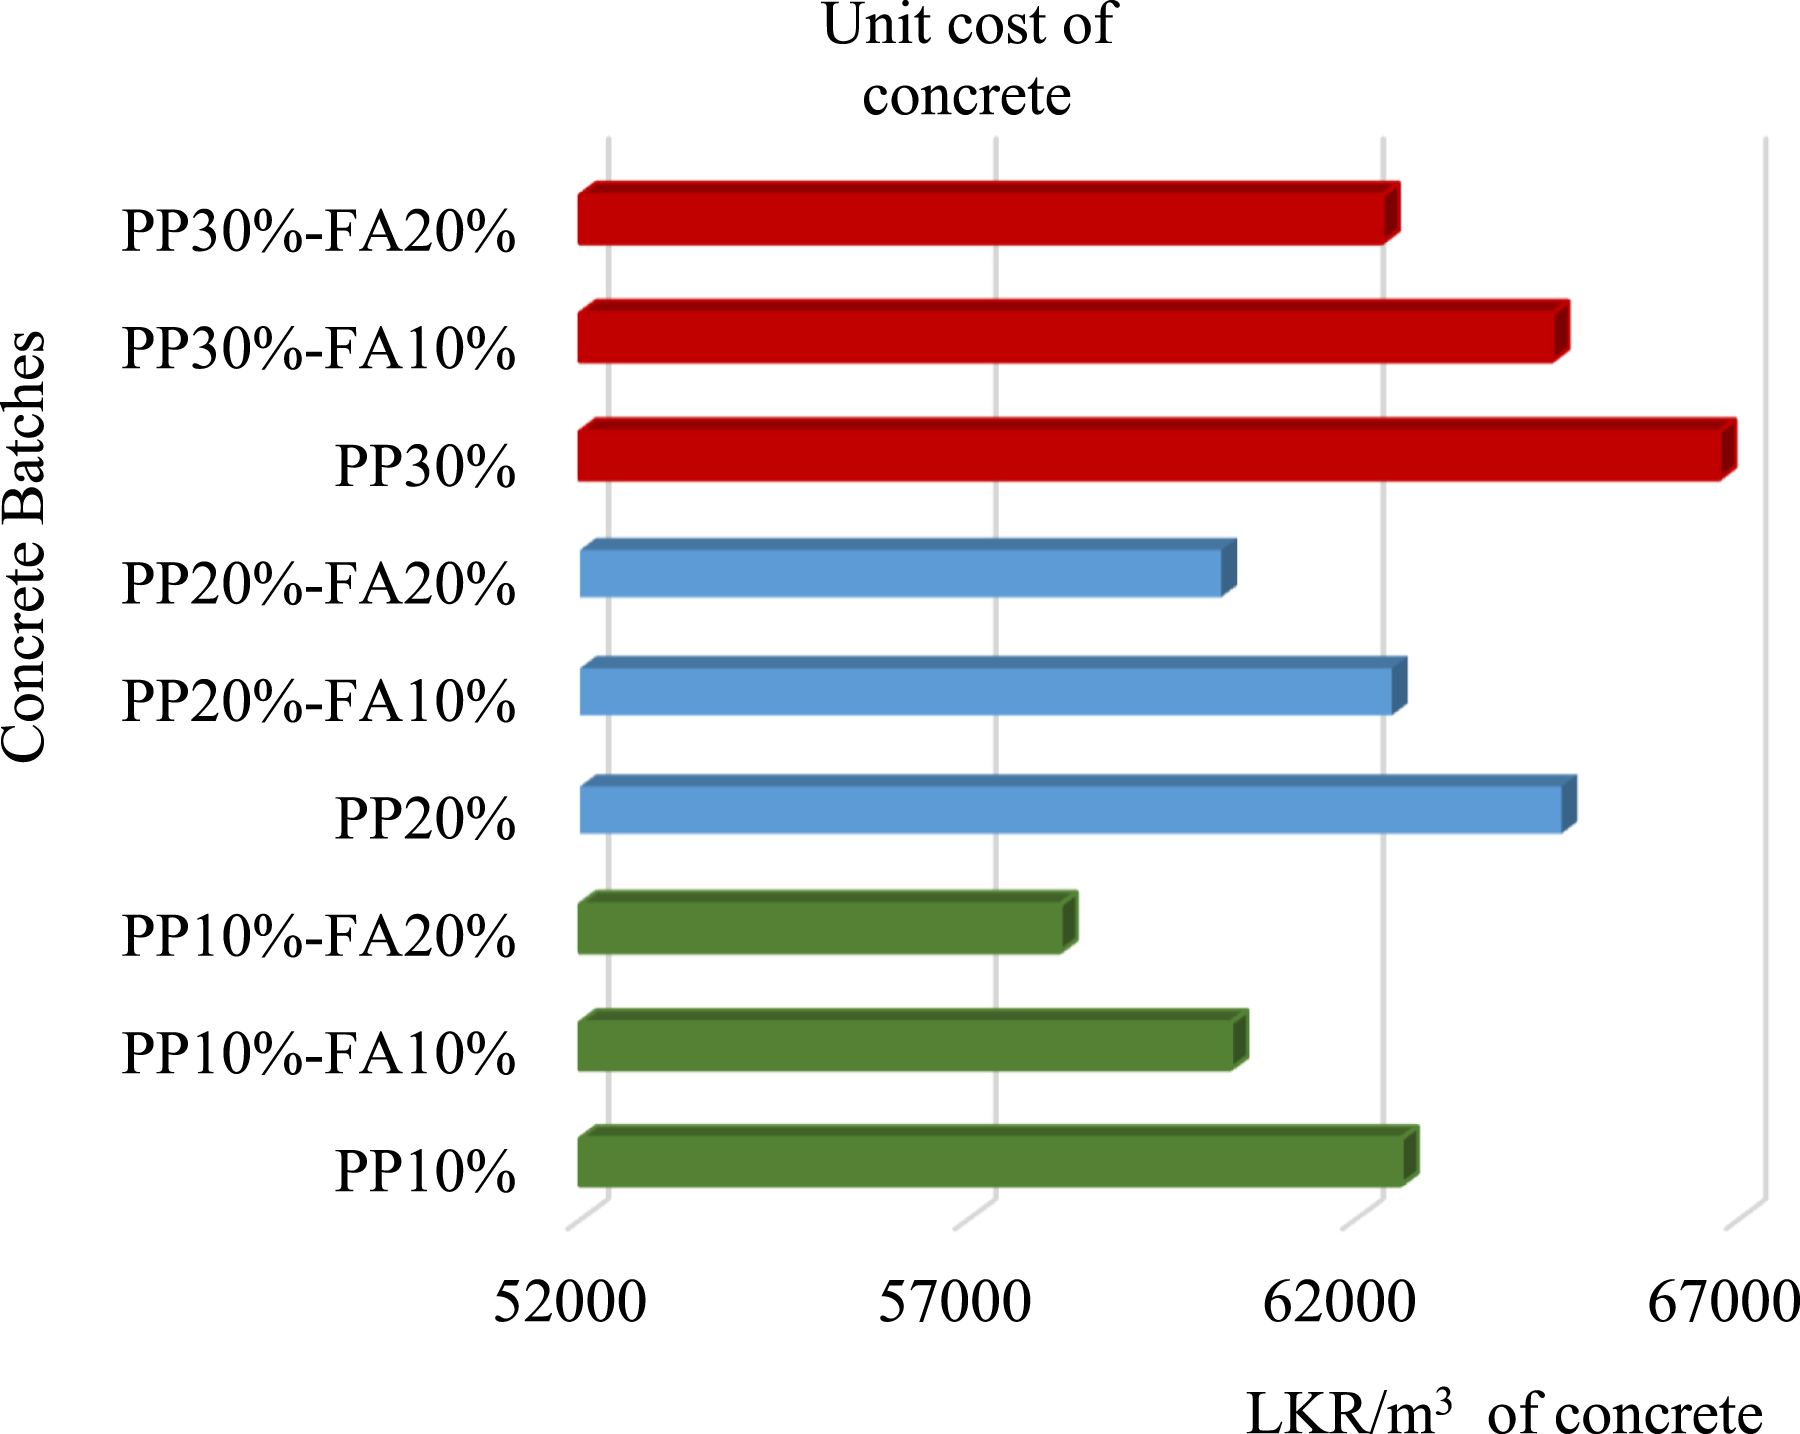
The above analysis focused on material costs but noted other factors affecting sustainable concrete’s overall cost, such as mixing time, weight reduction savings, and long-term durability concerns. When considering concrete mixing, FA blends well with other materials, while PPCA may reduce efficiency due to its low weight and irregular shape. Although increased mixing time could raise labor and energy costs, the current study found no additional time required for PPCA replacement up to 30%, maintaining 8 min of mixing time across all batches without extra cost. Concrete weight reduction is vital in construction. 69 Using PPCA reduced concrete density, leading to lower transportation costs and improved handling efficiency. 70 Further studies are recommended to fully quantify these cost savings. Regarding durability, PPCAC showed mixed results: improved chloride ion penetration but inferior water absorption, carbonation depth, and permeability. Some contradictory results were observed for shrinkage. The plastic degraded faster than NCA. Thus, weight reduction savings may be offset by maintenance costs. However, adding FA could mitigate this effect, as its durability benefits are well-documented.34,71 Current study recommended to do Long-term durability performance to develop accurate life-cycle cost analyses of PPCAC and BBSC.
Binary blended sustainable concrete and its benefits
The mechanical performance results from the binary addition of PPCA and FA, and cost analysis show that the best combination for BBSC can be taken as the batch that contains 10% PPCA and 20% FA (PP10%-FA20%). Utilizing BBSC in the construction industry would remove tons of solid waste from open dumping and landfills, thereby minimizing environmental problems. The usage of FA prevents the addition of SP by increasing the workability of concrete. Further, FA not only enhances the workability but also increases the durability properties.72,34,73
Homogeneity of PPCA in SPC
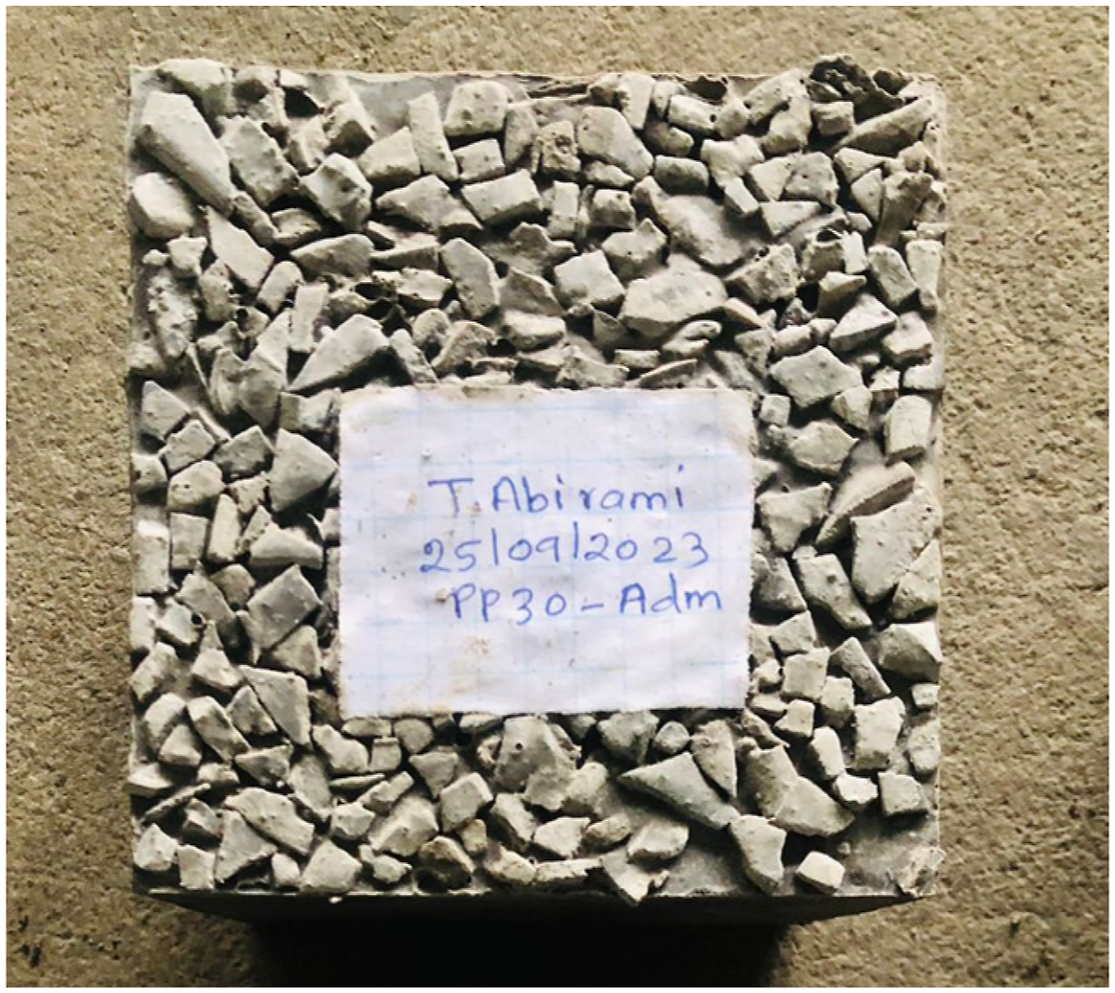
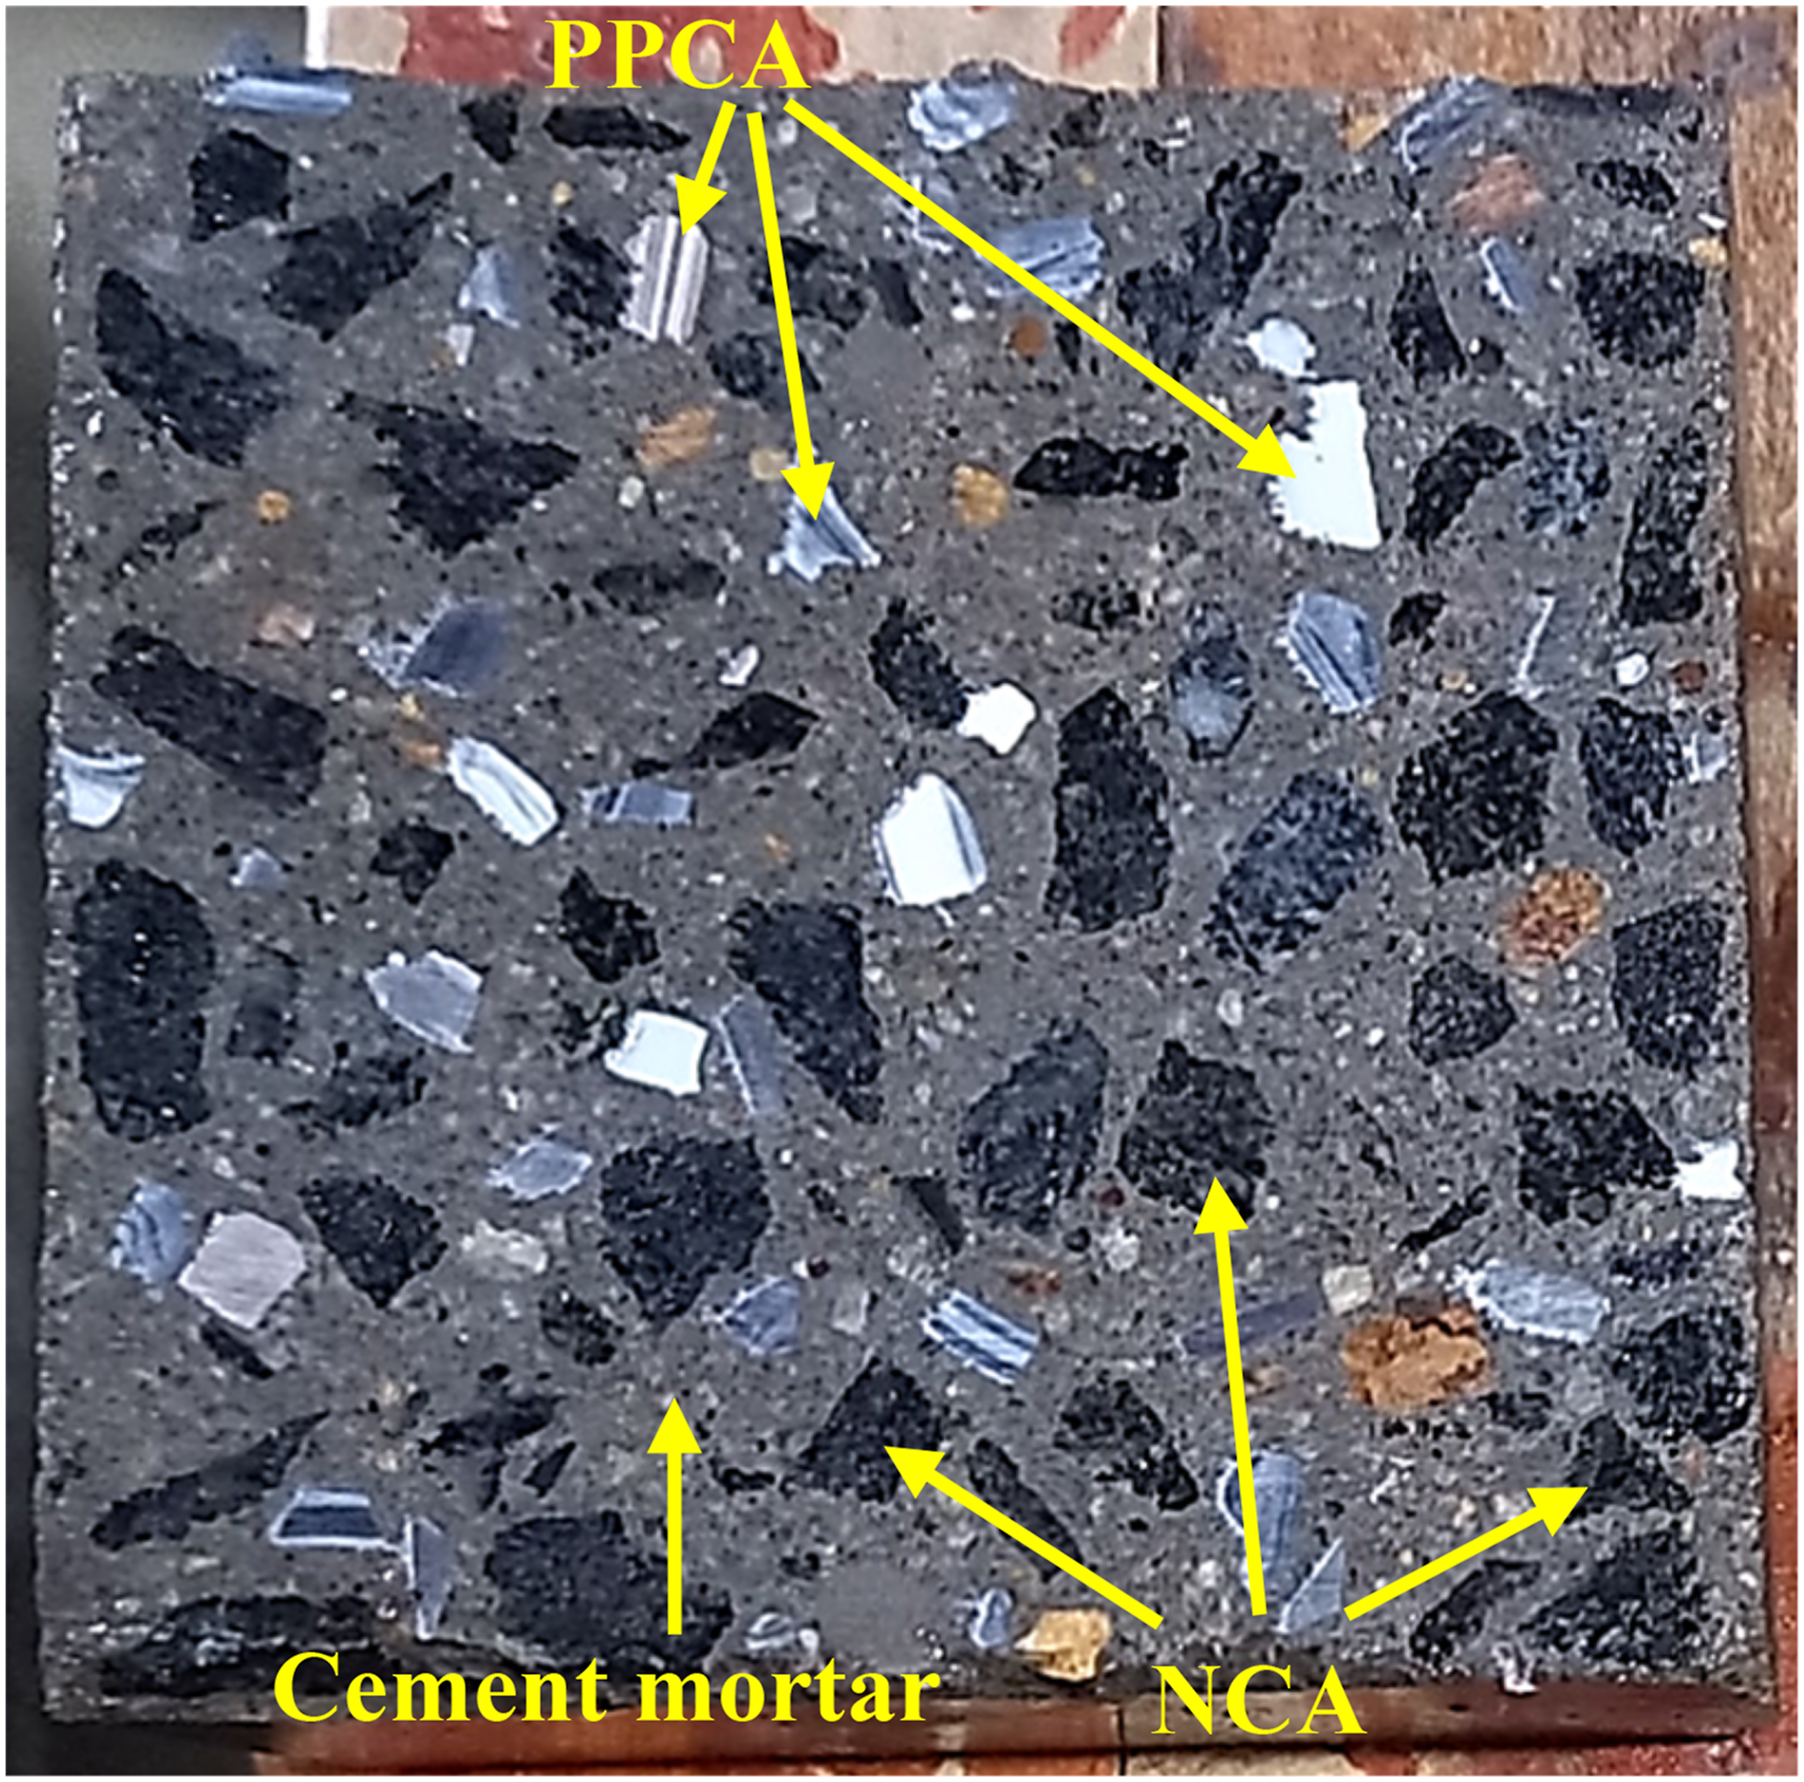
Even though there are a number of studies related to the addition of SP in PPCAC, none of the studies have considered sufficiently the homogeneity of PPCA in concrete. It is important to take into account that the specific gravity of PPCA is lower than water. As mentioned in Section of Specimen fabrication, the PPCA tended to float to the top surface of the specimen when highly workable PPCAC was produced using SP and compaction was given using a vibrating table. Hence, the current study avoided these factors in all batches to maintain the homogeneity of PPCA in concrete. Figure 28 presents a cut surface of a cube specimen where the alignments of PPCA among NCA can be seen.
74
Here, the PPCA distribution is almost similar to NCA. Furthermore, this study recommends the use of PPCAC more in precast construction than in in-situ construction, for instance, in precast lightweight lintel beams, kerbs, and wall panels. Because, a high level of quality control can be deployed during precast work, and that will enable to maintain uniform distribution of PPCA in the concrete. The use of PPCAC will make the precast elements lightweight; that will be highly desirable. Also, such use plays a role in preventing plastic waste from re-entering into the environment. Cut surface of cube specimen belonging to PP30%-SP0.4 batch.
74
Conclusions
The major conclusions drawn upon this study are as follows. 1. The workability of concrete reduced by 37 – 47% when natural coarse aggregate (NCA) was replaced with polypropylene plastic coarse aggregate (PPCA) in the range of 10 – 30%. The irregular shape and sharp edges in PPCA should have contributed mostly to the loss in workability. The loss could easily be recovered by adding of a superplasticizer. In contrast, the partial replacement of cement with fly ash (FA) increased the workability. 2. The compressive strength of the concrete reduced progressively with the incorporation of PPCA. The strength was 29.7% lower in 30% PPCA concrete than that of a conventional concrete mix. Similarly, the splitting tensile strength and the flexural strength of concrete reduced up to 31.9% and 28.1% respectively when the NCA was replaced up to 30% by PPCA. The main reason for the strength reduction could be attributed to the weak bond developed between PPCA and cement paste. The microstructural analysis indicated clearly the presence of a considerable separation between PPCA and the cement paste. 3. A major attribute resulted from the use of 30% of PPCA in concrete was 38.3% increase in the ductility of the material after the peak stress. When compared with conventional concrete, the thermal conductivity of the material also declined by 15.2%, 27%, and 39.4% as the PPCA content increased by 10%, 20%, and 30% respectively. Similarly, the material weight reduced gradually up to 7.4% when PPCA content was increased towards 30%. 4. In contrast to the single addition, the binary addition of 30% of PPCA and FA to the concrete increased the workability by at least 50% and 90% for FA replacement levels of 10% and 20% respectively, when compared with PPCA concrete. The resulting products could attain the strength and workability required by structural concrete applications. Overall, the binary addition of 10% PPCA and 20% FA was identified to be an eco-friendly and economically feasible concrete. It is of note that the optimum combination identified herein was based predominantly on short-term mechanical performance. Therefore, the investigation of long-term durability performance and behaviour under elevated temperatures before implementing the material in real-world applications is an important matter for future work. 5. In terms of homogeneity, the dosage of superplasticizer should be limited, and appropriate compaction should be given to maintain the uniform distribution of PPCA in the concrete matrix.
Footnotes
Acknowledgements
The support given by the State Ministry of Skills Development, Vocational Education, Research, and Innovation of the Government of Sri Lanka under grant number MSVRI/RES/03/07-12/2021 was highly appreciated. Experimental facilities were gained from the Materials Laboratory, Department of Civil Engineering, University of Peradeniya.
Declaration of conflicting interests
The author(s) declared no potential conflicts of interest with respect to the research, authorship, and/or publication of this article.
Funding
The author(s) disclosed receipt of the following financial support for the research, authorship, and/or publication of this article: This work was funded by the State Ministry of Skills Development, Vocational Education, Research, and Innovation of the Government of Sri Lanka under grant number MSVRI/RES/03/07-12/2021.