
Abstract
Additively manufactured composite structures can be utilized in the production of engineering materials with enhanced mechanical properties. In this work, mono-, bi-, and tri-material structures (MMS, BMS, and TMS, respectively) were fabricated using additively manufactured PLA (poly-lactic acid) lattice frames embedded with Polyurethane (PU) foam and milled glass fibers (MGFs). TMS samples were reinforced with MGFs at 1.25, 2.5, 3.75, and 5.0 vol%, indicated as TMS-1, TMS-2, TMS-3, and TMS-4, respectively. The mechanical response of these composite structures was tested by applying a low-velocity impact load. The effects of MGF content and variations in applied impact energy, and variation in microstructure on the composite samples were investigated. Results revealed an enhanced mechanical response of TMS samples compared to MMS and BMS. Additionally, with increasing applied impact energy, the TMS samples showed an improved corresponding response, with a peak absorbed energy of 96.03% of the applied 60 J energy. Furthermore, to study the applicability of the composite structures in real-life applications, helmet prototypes made of MMS, BMS, and TMS were designed and tested under the applied low-velocity load, showing an improved response of TMS helmet samples compared to the other composite structures.
Introduction
Additive manufacturing (AM; also known as three-dimensional printing) is growing as an advanced manufacturing technology and becoming part of fabricating complex engineering components.1–3 In AM, no by-product material is wasted, introducing a more sustainable manufacturing process compared to conventional ones.4–6 That is possible thanks to the layer-by-layer component building adapted in AM.7,8 Such technology contributes to saving time, resources, and effort, and it is also sufficient for producing complex geometry components.9–11 Nowadays, composite materials are used in multiple engineering applications in several industrial sectors, including airplanes,12,13 construction,14–16 automotive,17–20 and biomedical applications.21–23 The fact is that composite materials have various preferable characteristics, such as having a high strength-to-weight ratio, distinguished fatigue and corrosion resistance, and a wide range of material selection options.24–28 Composite materials are typically manufactured in multiple structures, such as laminar, 29 fiber-reinforced,30–32 and sandwich33,34 composite structures. Although these composite structures serve the purposed application efficiently, the production process is complicated for complex geometries and consumes a lot of time and effort.33,35,36 Here comes the need for more advanced manufacturing technologies to overcome the difficulties of producing composite structures conventionally.37–39
Polymer-based composite structures have been revealed to acquire more improved response to applied mechanical load when reinforced with milled glass fibers (MGFs).40,41 Besides, the variation in MGFs content has been shown to influence the mechanical behaviour of MGFs reinforced polymeric composites. 42 Adding glass fiber reinforcement to additively manufactured composite structures has been demonstrated to improve the mechanical response of those composites.43–45 Particularly, the low-velocity impact response is improved by the addition of fiber reinforcement to the composite structures.46–48 Foams are widely used in many applications due to their ability to, light weight, impact absorption, and low cost.49–51 One commonly used types of foams are Polyurethane (PU), which are used in construction, 52 agriculture, 51 thermal insulation,53,54 furniture,53,54 and medical applications. 51 It has been shown that if fiber reinforcement is added to the PU foams, such as fiber glass, the mechanical performance of PU foams will be enhanced. That includes tensile strength, elastic modulus, and fatigue resistance.55–57
Fused filament fabrication (FFF) is the most commonly used AM technology in fabricating polymer components.58,59 Lately, it has been immigrated to be used in the manufacturing of polymeric composite structures.58,59 Although FFF printed components, especially with complex geometry, are easier to produce, their mechanical performance still falls behind compared to conventionally produced composites.60–62 Furthermore, FFF printing of multi-materials still faces a lot of challenges due to limitations in component integrity, mismatching of materials cooling rates and thermal expansion coefficients.63,64 Other possible challenges are the limitations of digital modelling tools and design technologies oriented towards the FFF manufacturing process.65,66 In our previous work, we studied the enhancement of mechanical properties of tri-material composite structure composed of PLA/Epoxy/MGFs44,67,68 and PLA/PU foams/MGFs, 69 in the means of tensile, compression, and flexural loads, in addition to Shore hardness. Findings have shown that the increment of MGFs influenced the mechanical behaviour of those composite structures. Also, the tri-material composite structure has demonstrated an improved performance, compared to mono- and bi-material composite structures. In this current work, we are going to synthesise mono-, bi- and tri-material structures of PLA lattice frame, PU foam filling, and MGFs reinforcement. The performance of those fabricated samples in response to applied low-velocity impact load will be investigated. The experiments will be executed for two purposes; to study the effect of MGFs content on the mono-, bi-, and tri-material composite structures, and to understand the behavior of the tri-material composite structure when varying the applied impact energy.
Materials and Methods
Fabrication of PLA/PU/MGFs Mono-, Bi-, and Tri-material Composite Structure Samples
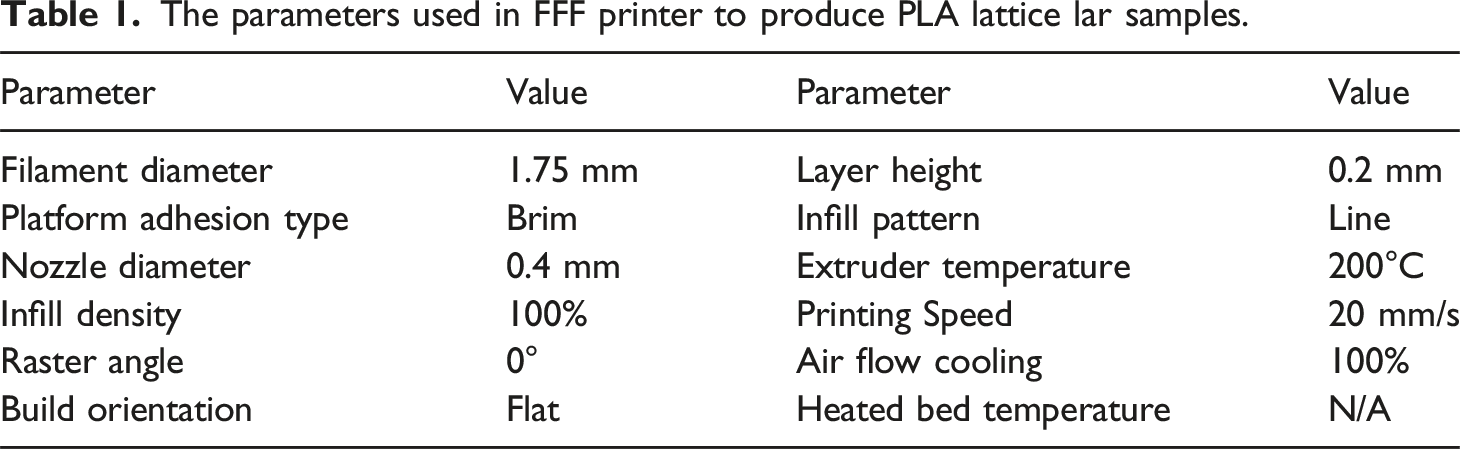
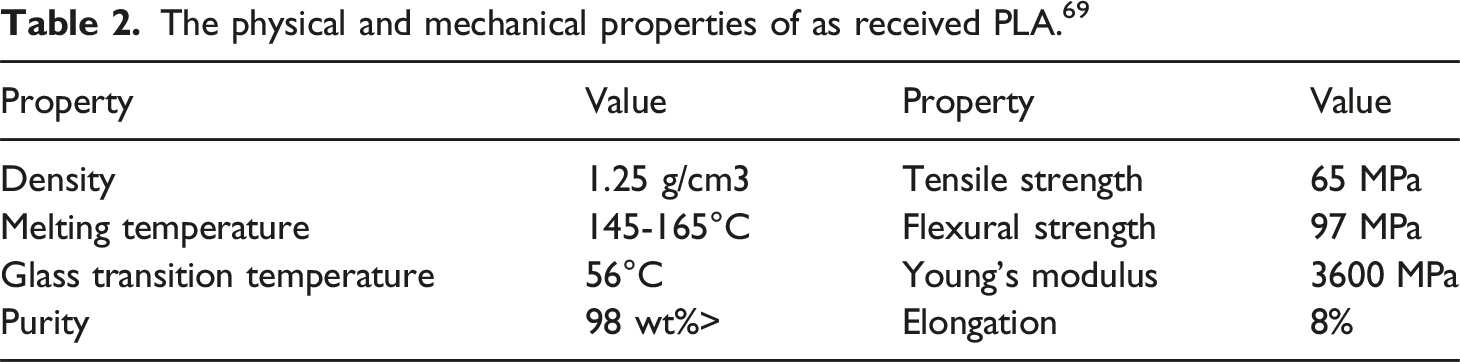
The tri-material composite structure was produced by filling the additively manufactured PLA lattice frame with a mixture of PU and MGFs. In the beginning, the PLA lattice frame was digitally modeled using Solidworks CAD software (version 2015). The samples designed to be tested for the low-velocity impact load with dimensions of 65 x 65 x 13 mm, as shown in Figure 1. After completing the CAD design, the digital model was converted into. STL file format to be later processed for FFF printing using Cura Software, where the printing parameters were adjusted. The parameters selected for the FFF printing process of PLA lattice frame are summarized in Table 1. Following that, G-Code files was generated to be feed to the printer to fabricate the PLA frame. A Creality Ender-3 Pro FFF printer was used in this process. The PLA filament used in printing the samples was supplied by ESUN industrial corporation, China. The PLA filament physical properties are shown in Table 2, as reported by the supplier. Dimensions of low-velocity samples and the building unit cell. The parameters used in FFF printer to produce PLA lattice lar samples. The physical and mechanical properties of as received PLA.
69
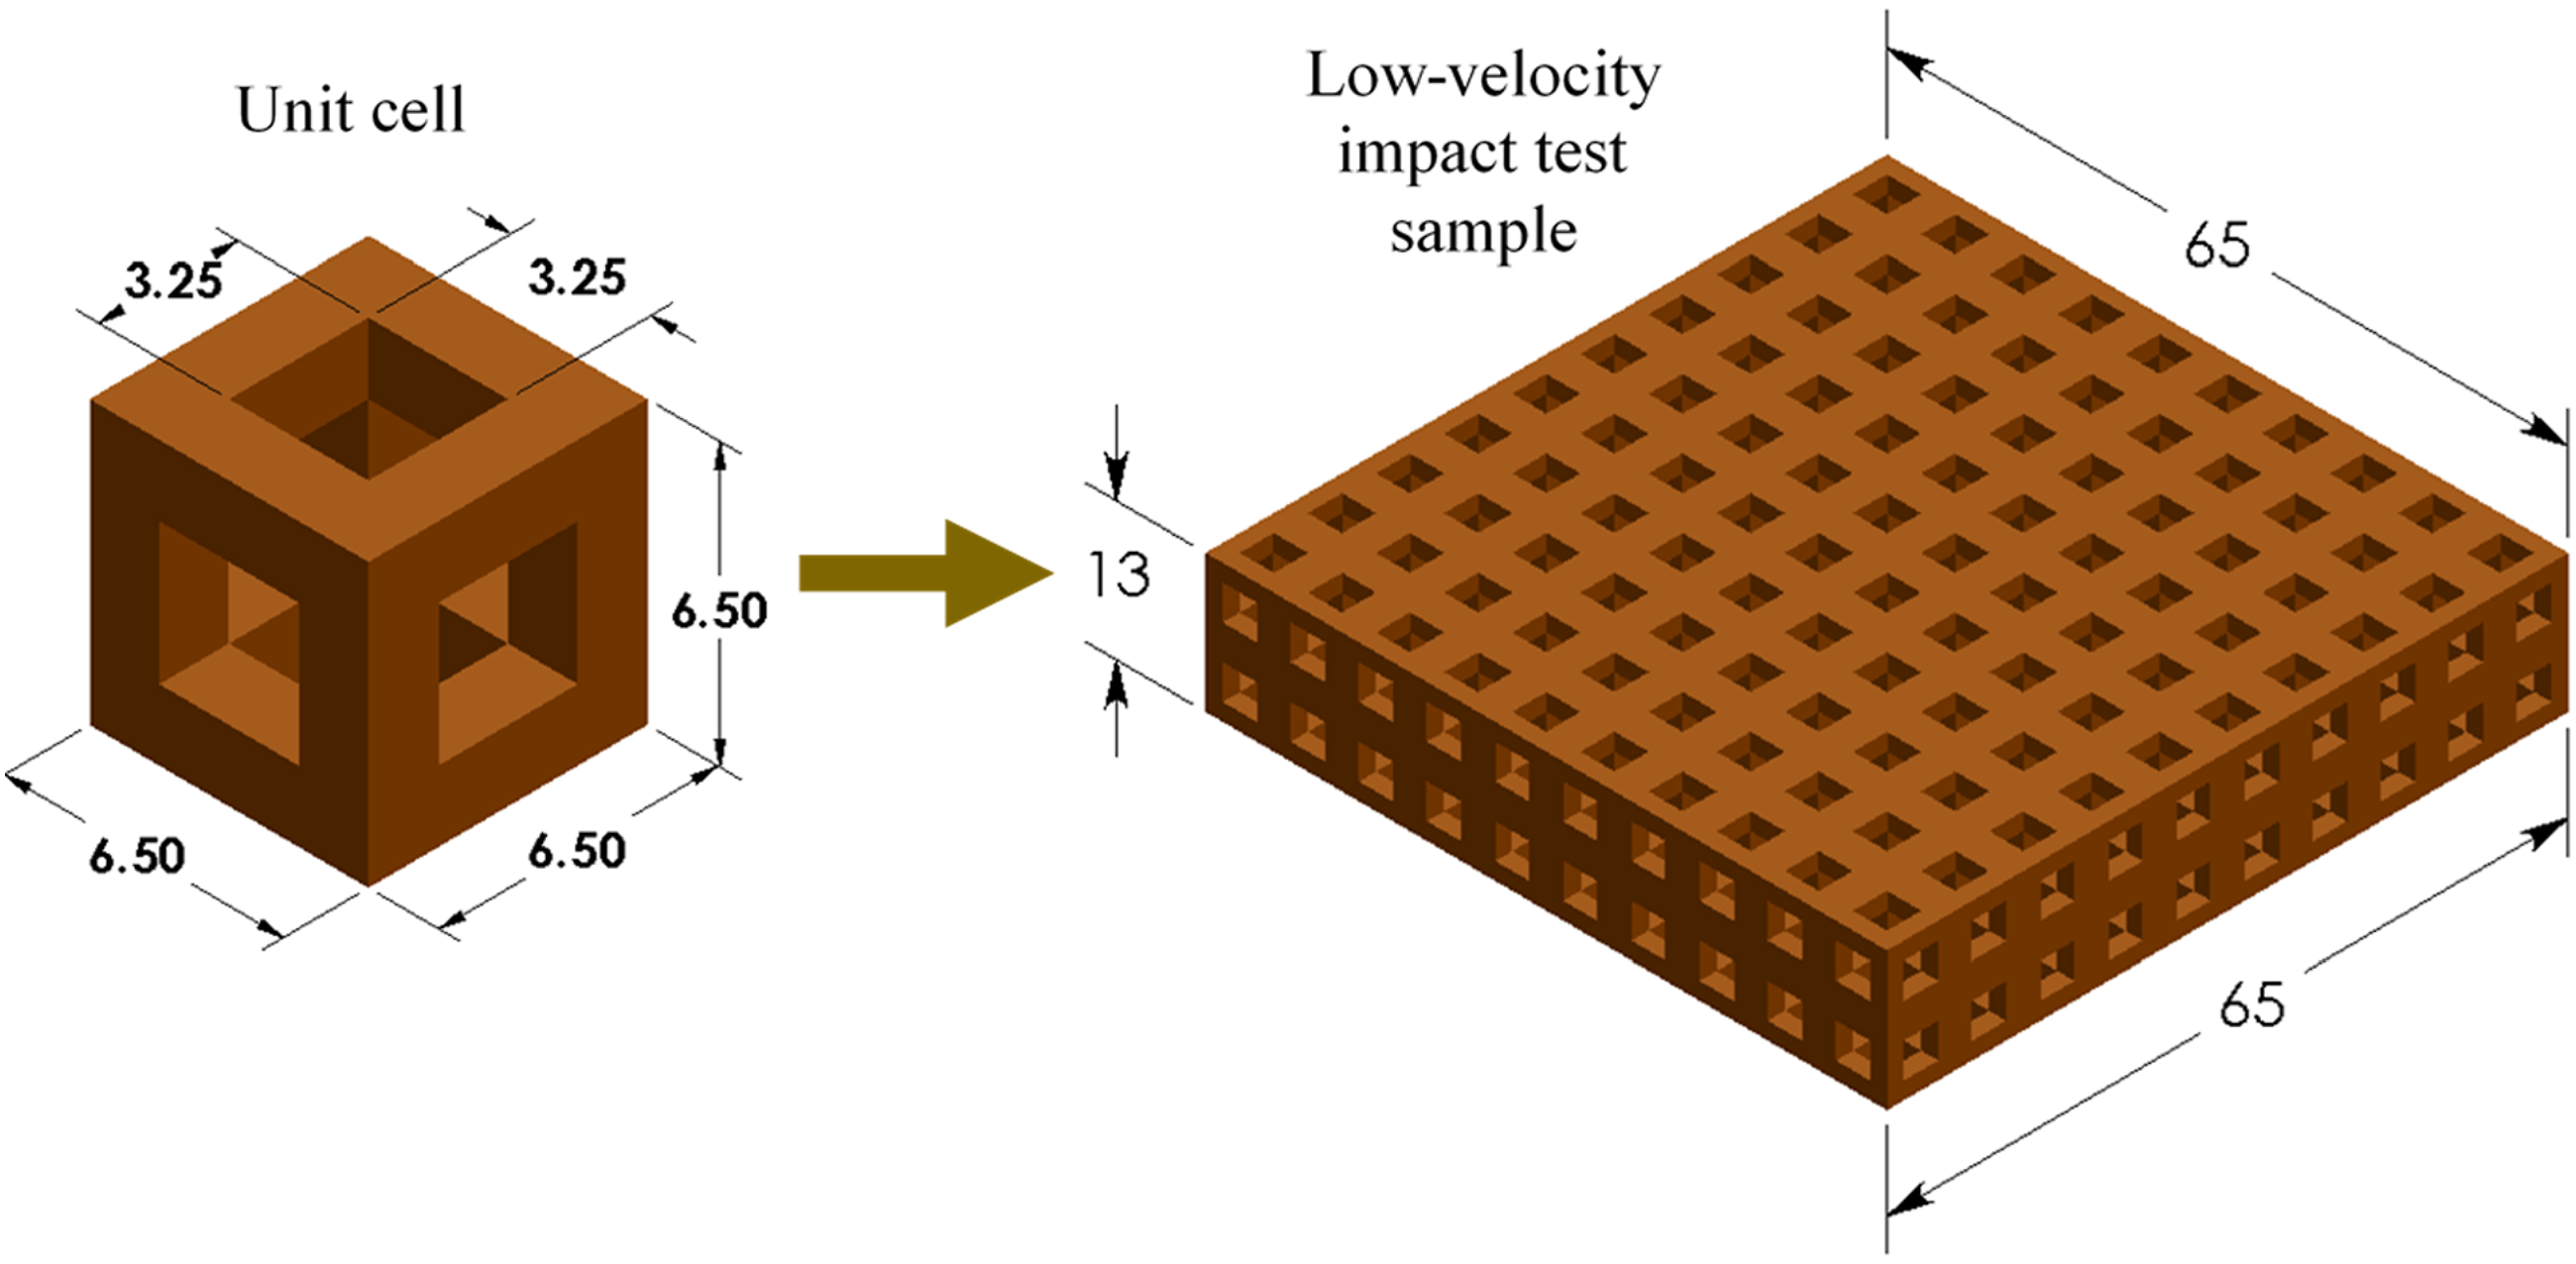
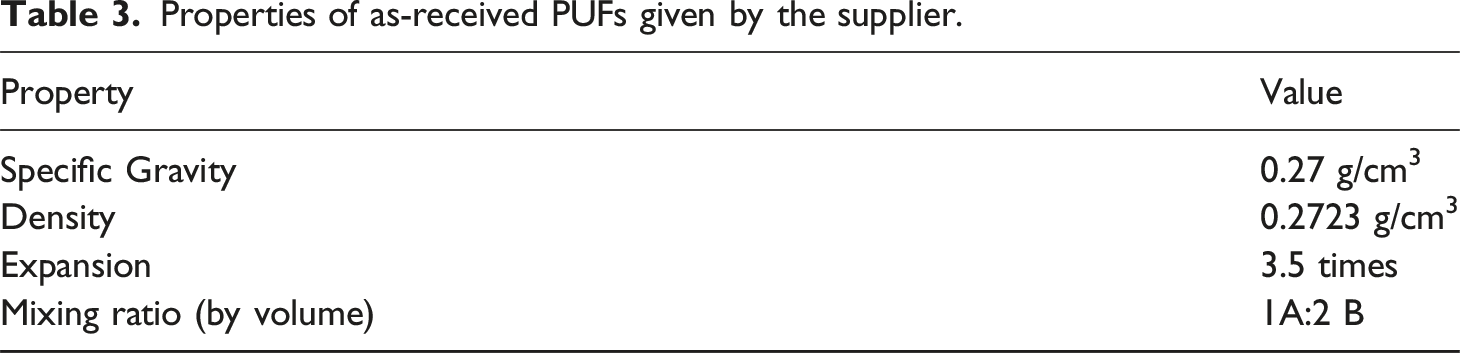
Properties of as-received PUFs given by the supplier.
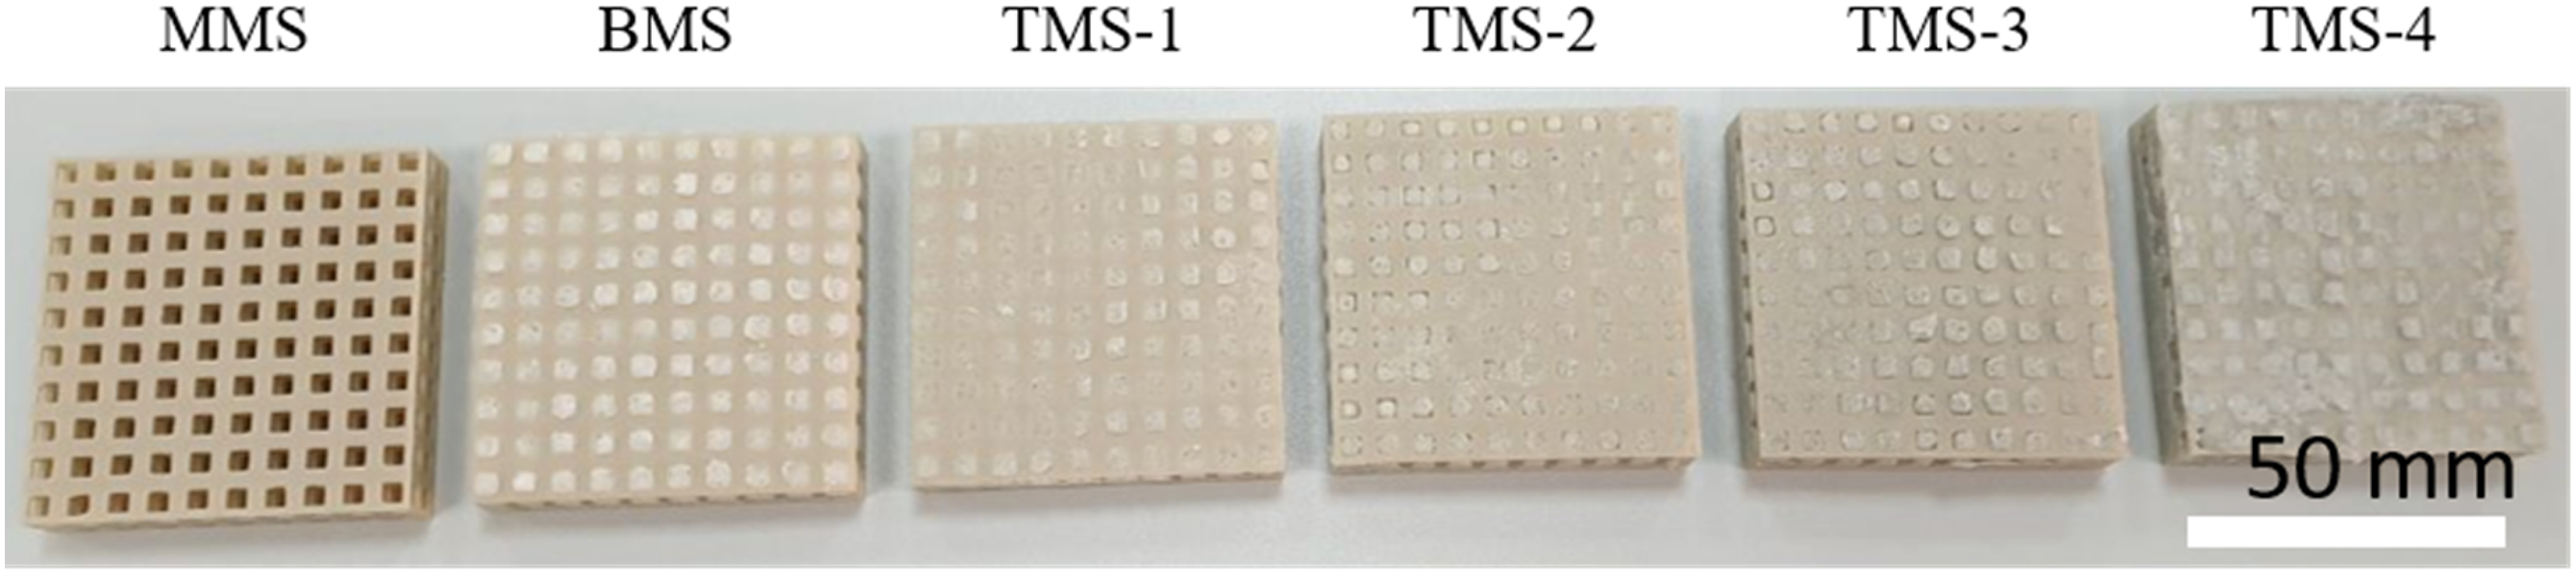
Fabricated PLA/PU foams/MGFs samples.
PU foam resin consisted of two parts (A and B). For fabricating TMS samples, MGFs content was divided into two halves, each half was mixed with one part of the PU resin and stirred for 2 h before being mixed together for 10 min and then poured into the PLA lattice frame, which were hold in silicone mold and kept to cure for 24 h.
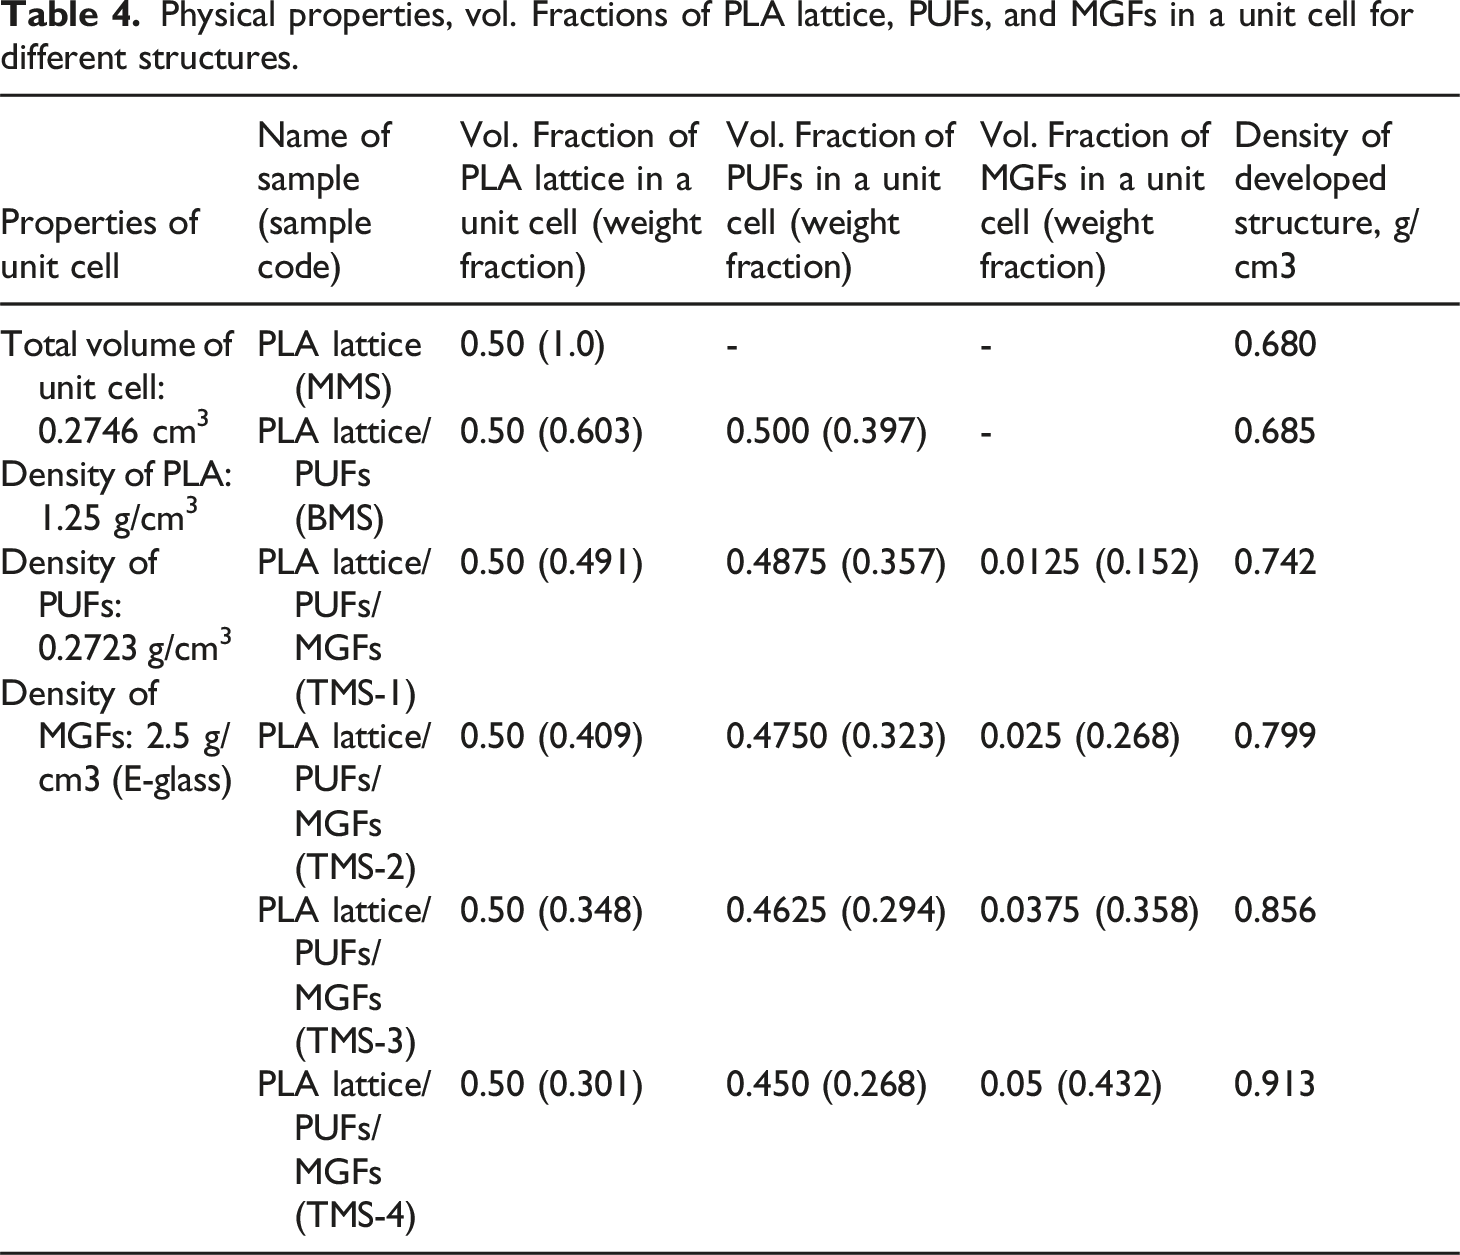
Physical properties, vol. Fractions of PLA lattice, PUFs, and MGFs in a unit cell for different structures.
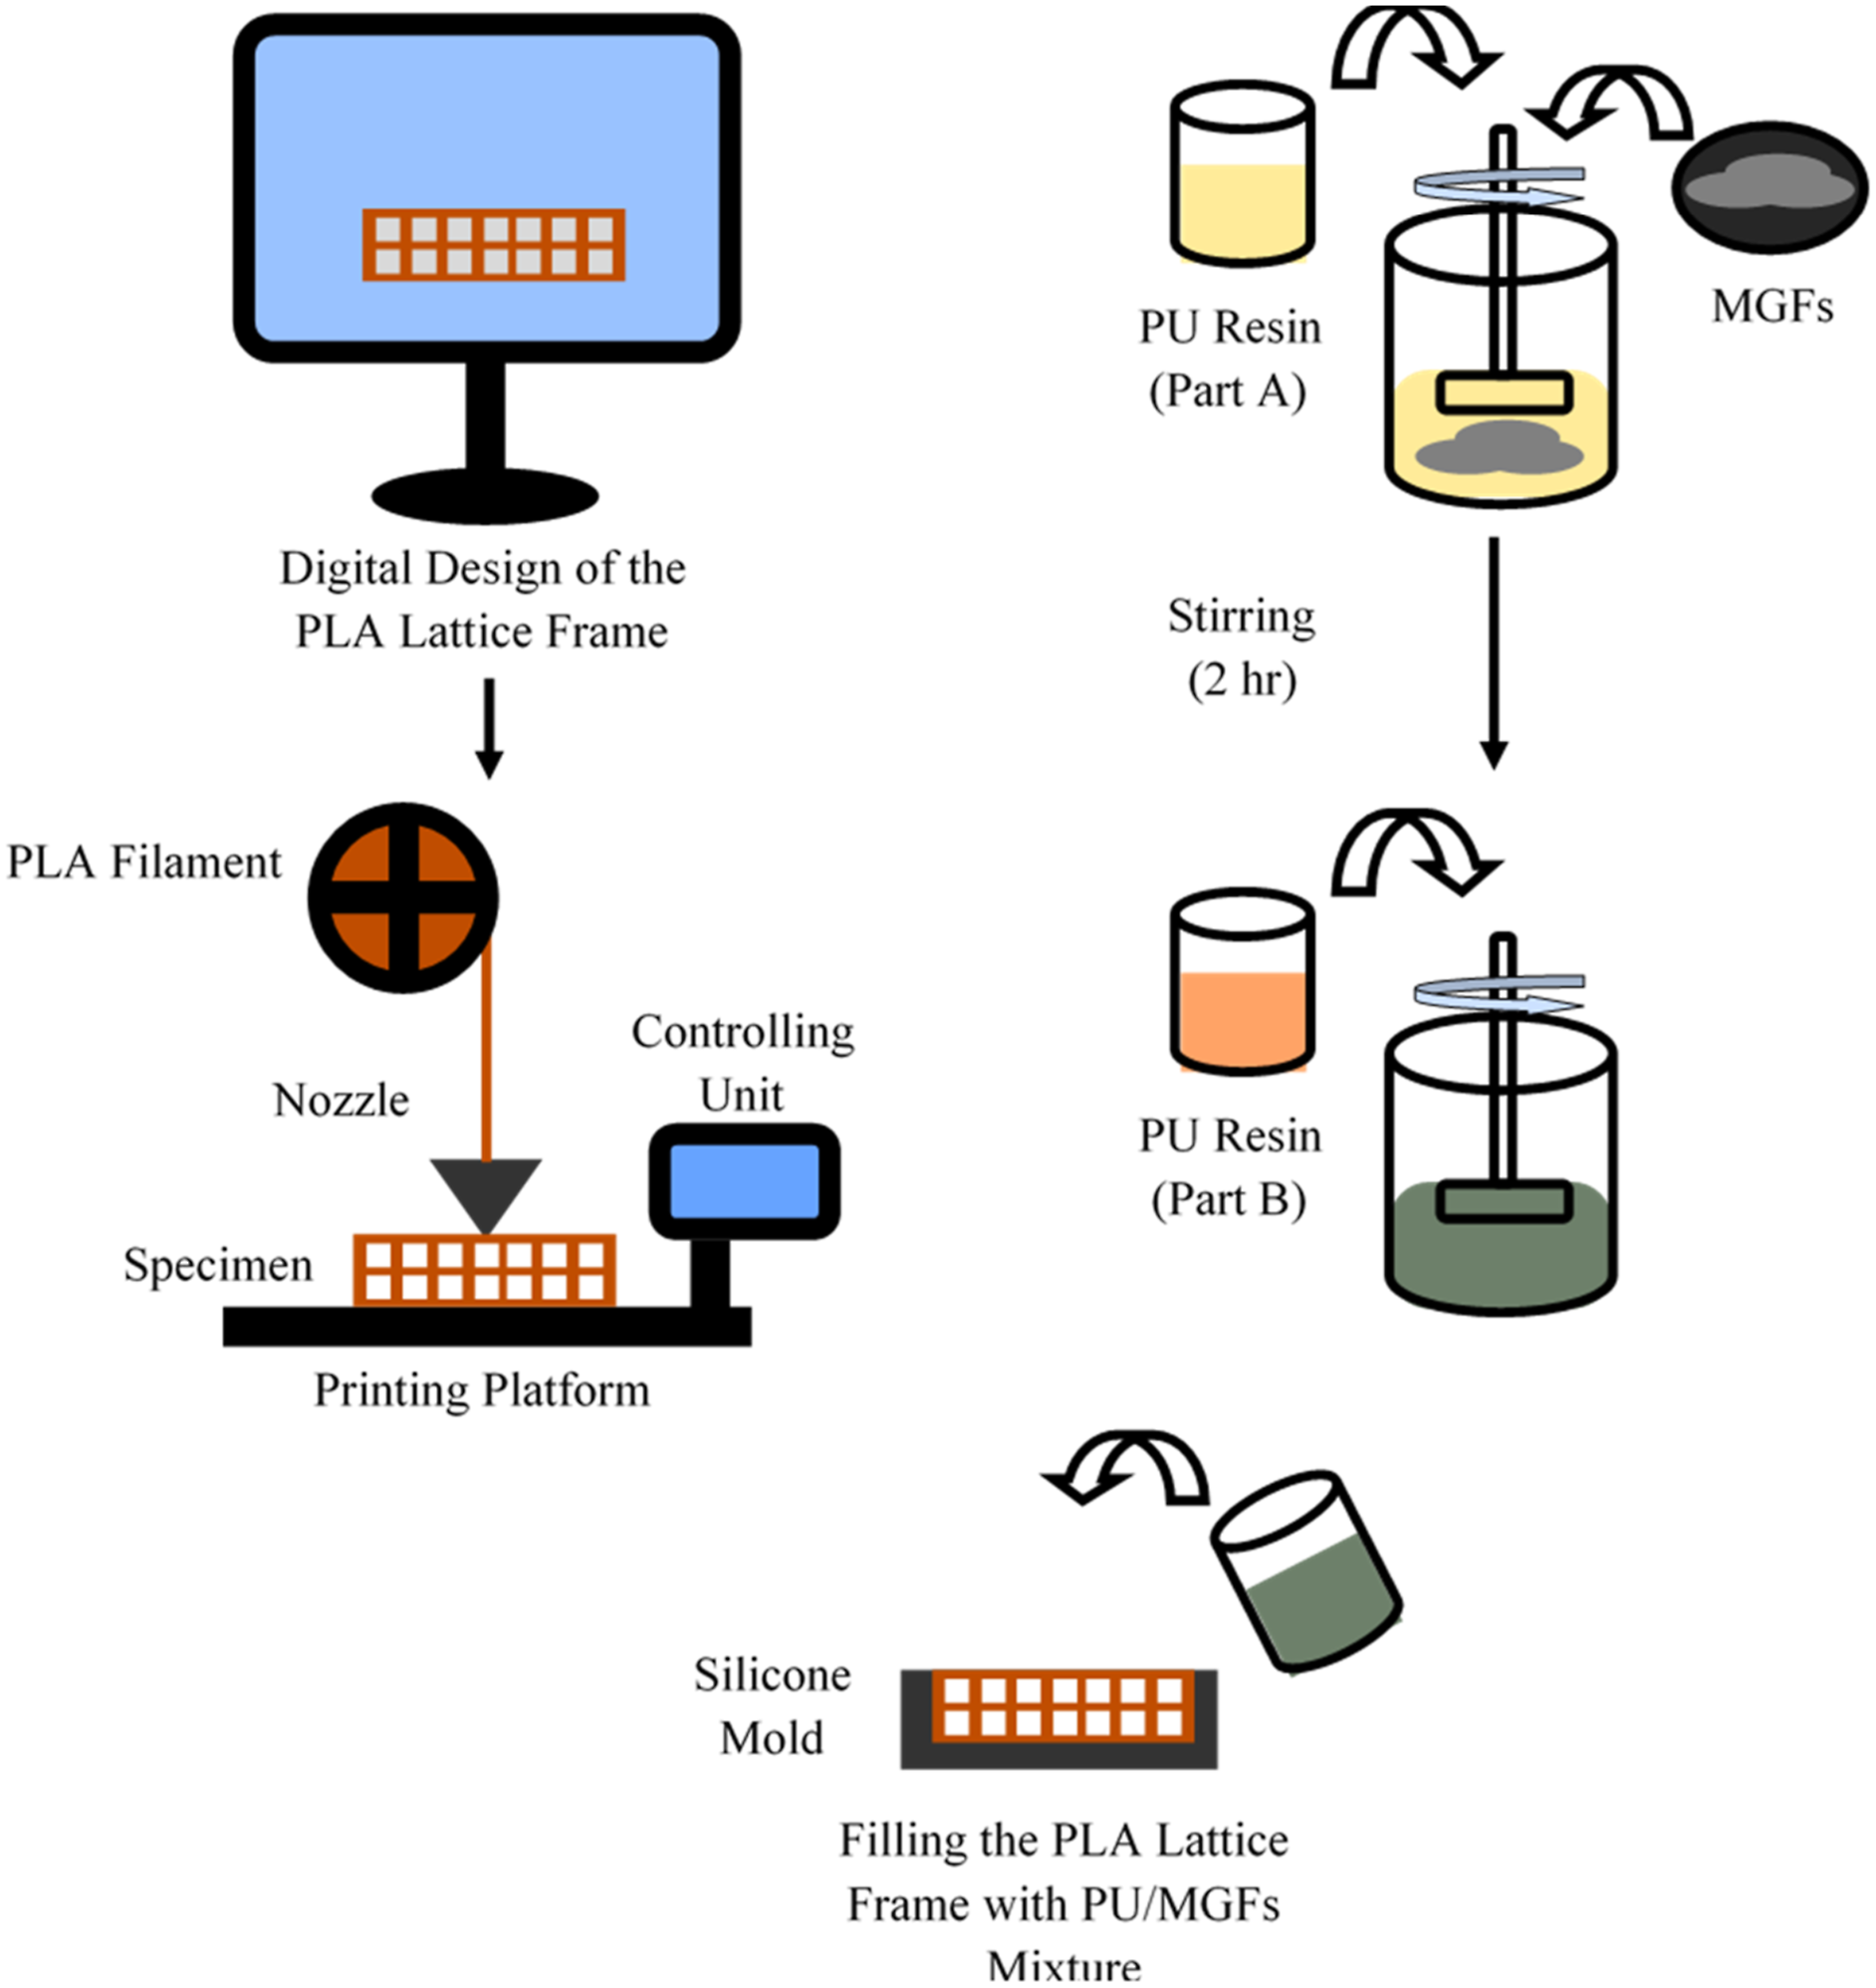
Schematic representation of the manufacturing process of the PLA/PU/MGFs composite structure samples.
Low-velocity Impact testing of Mono-, Bi-, and Tri-material Composite Structure Samples
To investigate the mechanical response of the designed composite structure, samples were tested by applying low-velocity impact load. Tests were conducted using Instron (CEAST 9350) drop-tower testing machine, shown in Figure 4. This testing machine consists of two parts; the upper part that contains the falling weight and the impactor head, and the lower part that contains the testing chamber. The impactor head includes a hemispherical impactor insert with a length of 40 mm and a diameter of 20 mm. To ensure the impactor would not bounce will be hitting the sample, the anti-rebound system was activated. Composite structure samples would be held in the testing chamber by the specimen holder and clamping ring. The support ring has an inner diameter of 40 mm and an outer diameter of 60 mm, which is a standard size built into the fixture. Each sample for the low-velocity impact test consists of 200 RVE (Representative Volume Element) cells. In this configuration: 60 RVE cells are included in the unsupported opening at the center where the impactor penetrates. 64 RVE cells are supported by the clamping system. The remaining 76 RVE cells are unsupported at the periphery of the samples during the test. This design choice ensures that the response measured during testing accurately reflects the material behavior under localized unsupported conditions, which is critical for understanding the mechanical performance of the composite structure in practical applications. Additionally, to ensure that all samples have identical RVE cells within the same inner ring diameter, samples were precisely aligned at the midpoint of the clamping apparatus. Testing chamber temperature was set to the ambient temperature. To test the influence of the MGFs reinforcement content on the performance of the fabricated samples, the low-velocity impact test was executed at energy level of 75 J, to ensure full penetration of the tested specimen. At 75 J of input energy, the impact velocity, the falling height, and the impactor head mass were 3.11 m/s, 493 mm, and 15.5 kg, respectively. This ensures that all the composite structure samples would undergo full loading and failure, endorsing adequate comparison between samples performance. On the other hand, to investigate the effect of varying the applied impact energy on the composite structure samples, specimens were tested under multiple energy levels, including 3, 9, 12, 40, 60, and 75 J. Schematic illustration of low-velocity testing machine.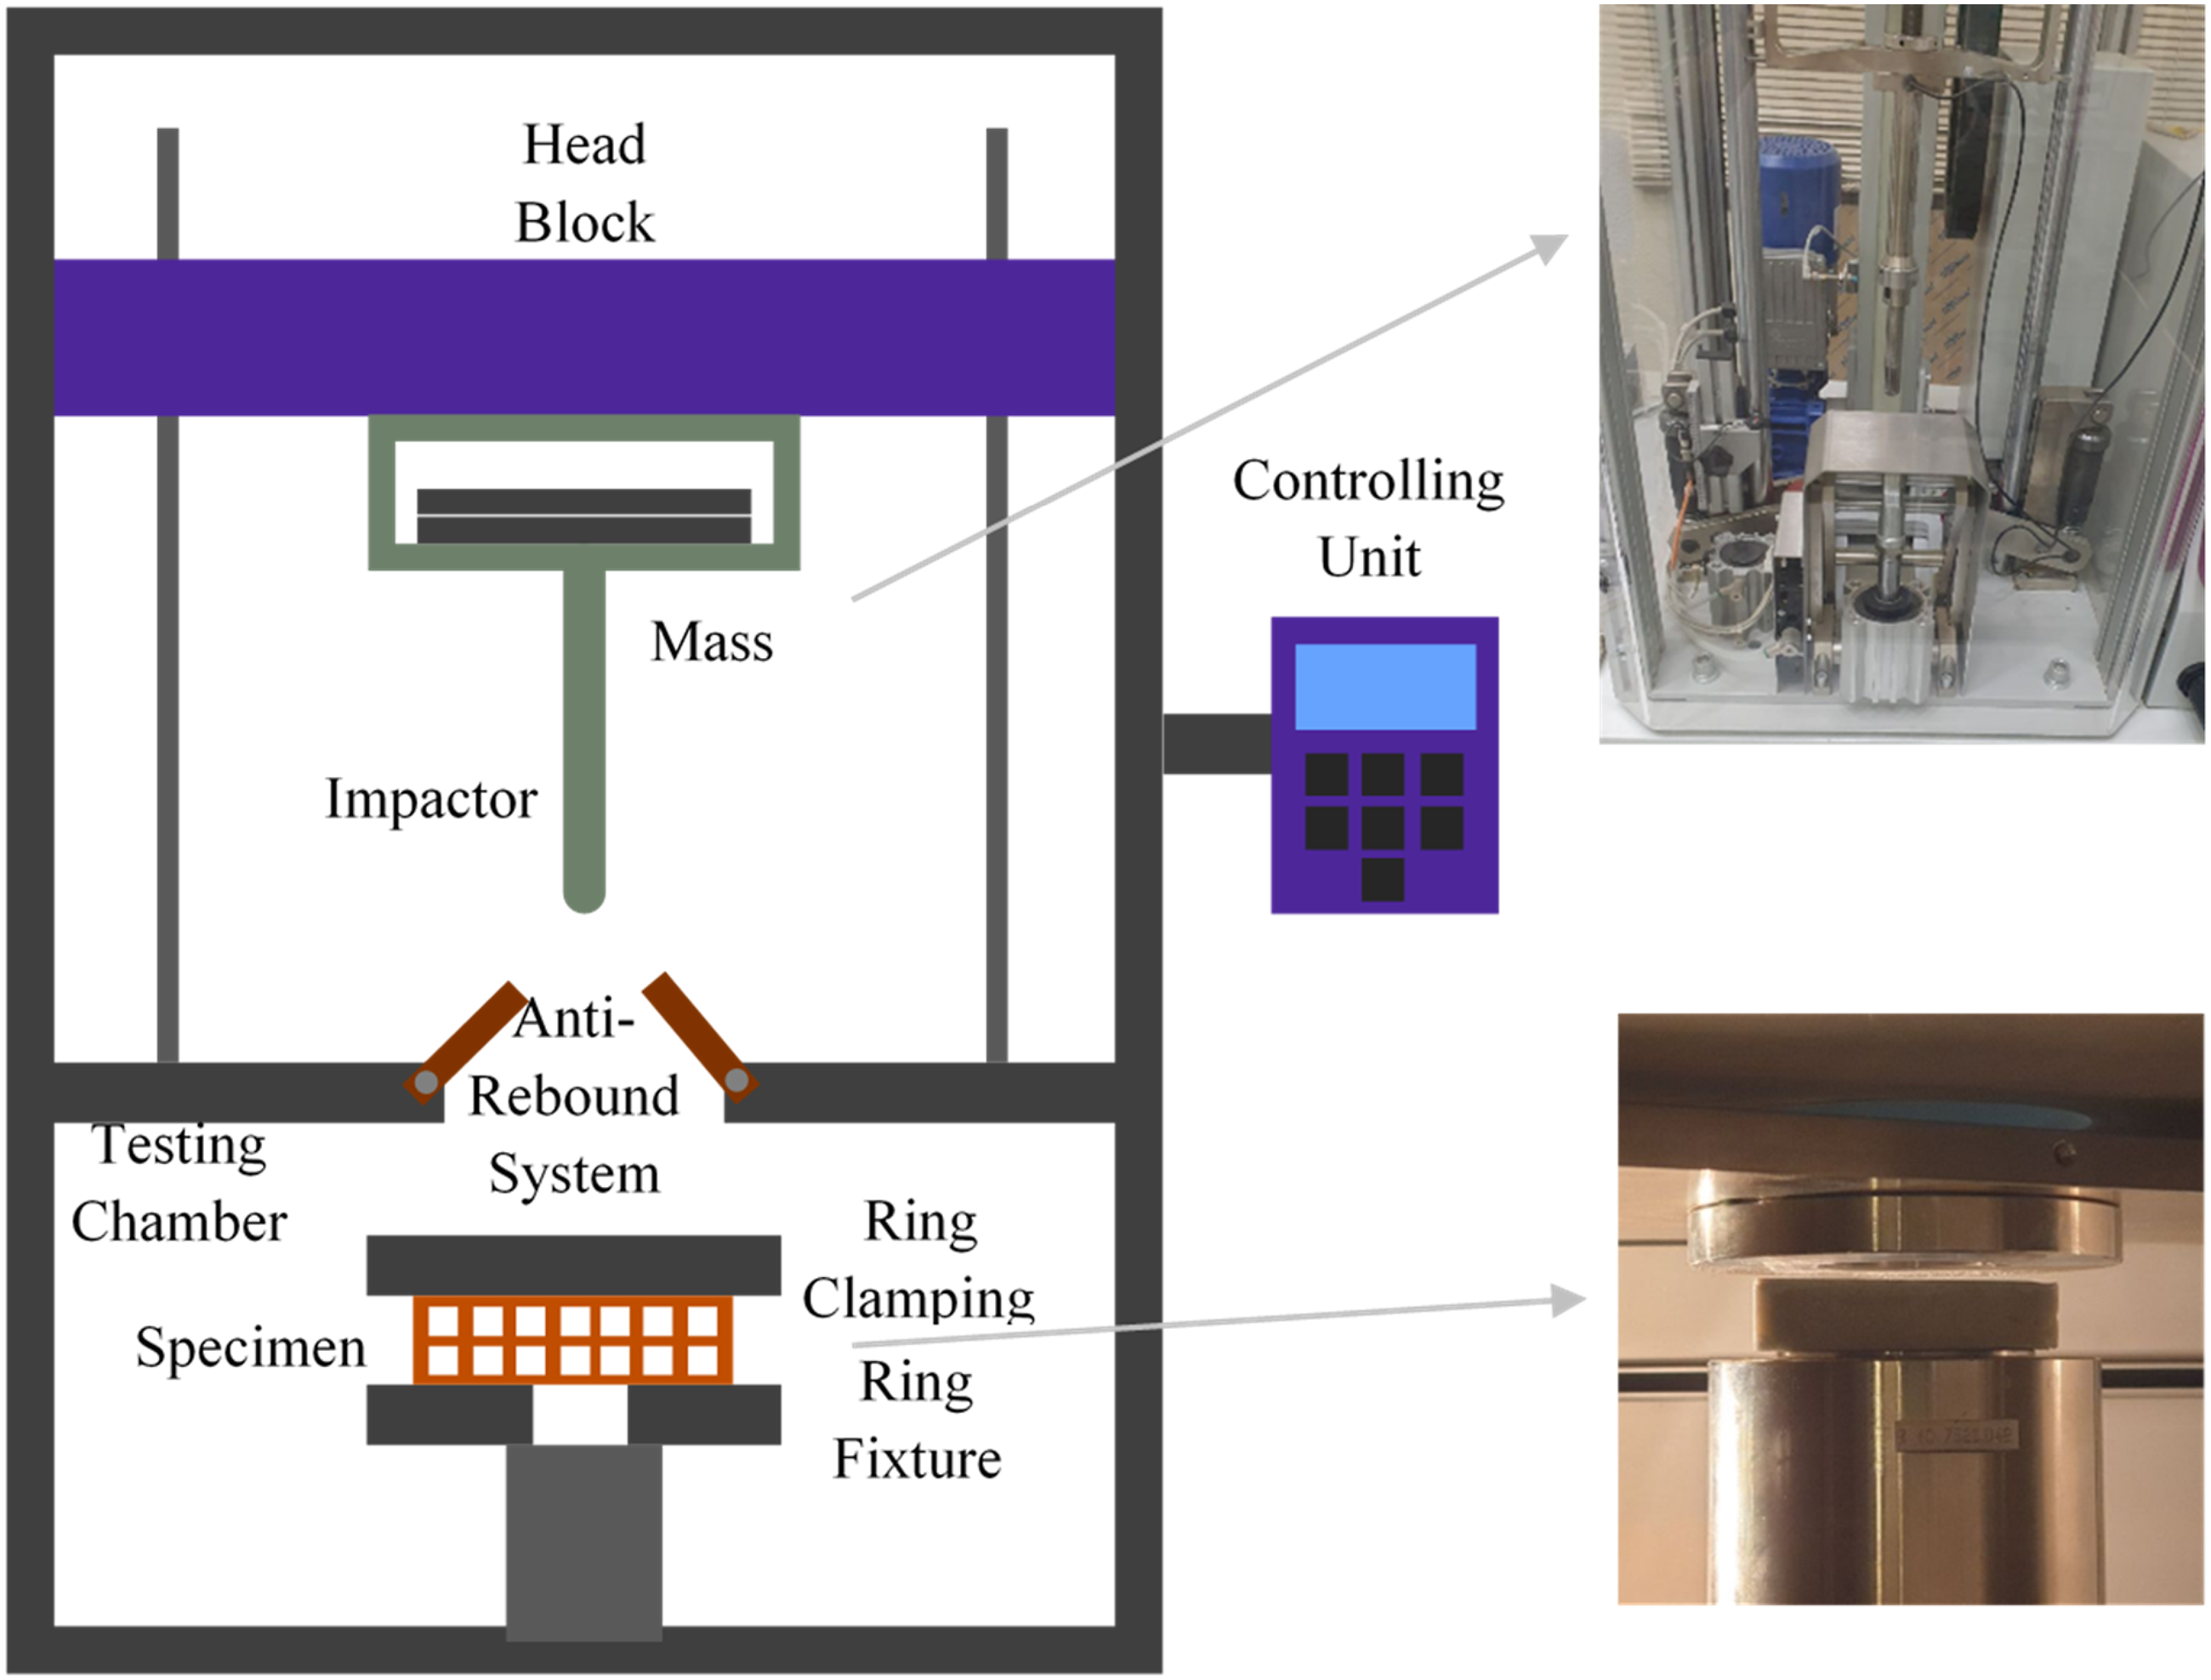
Low-velocity Impact testing of Helmet Prototypes
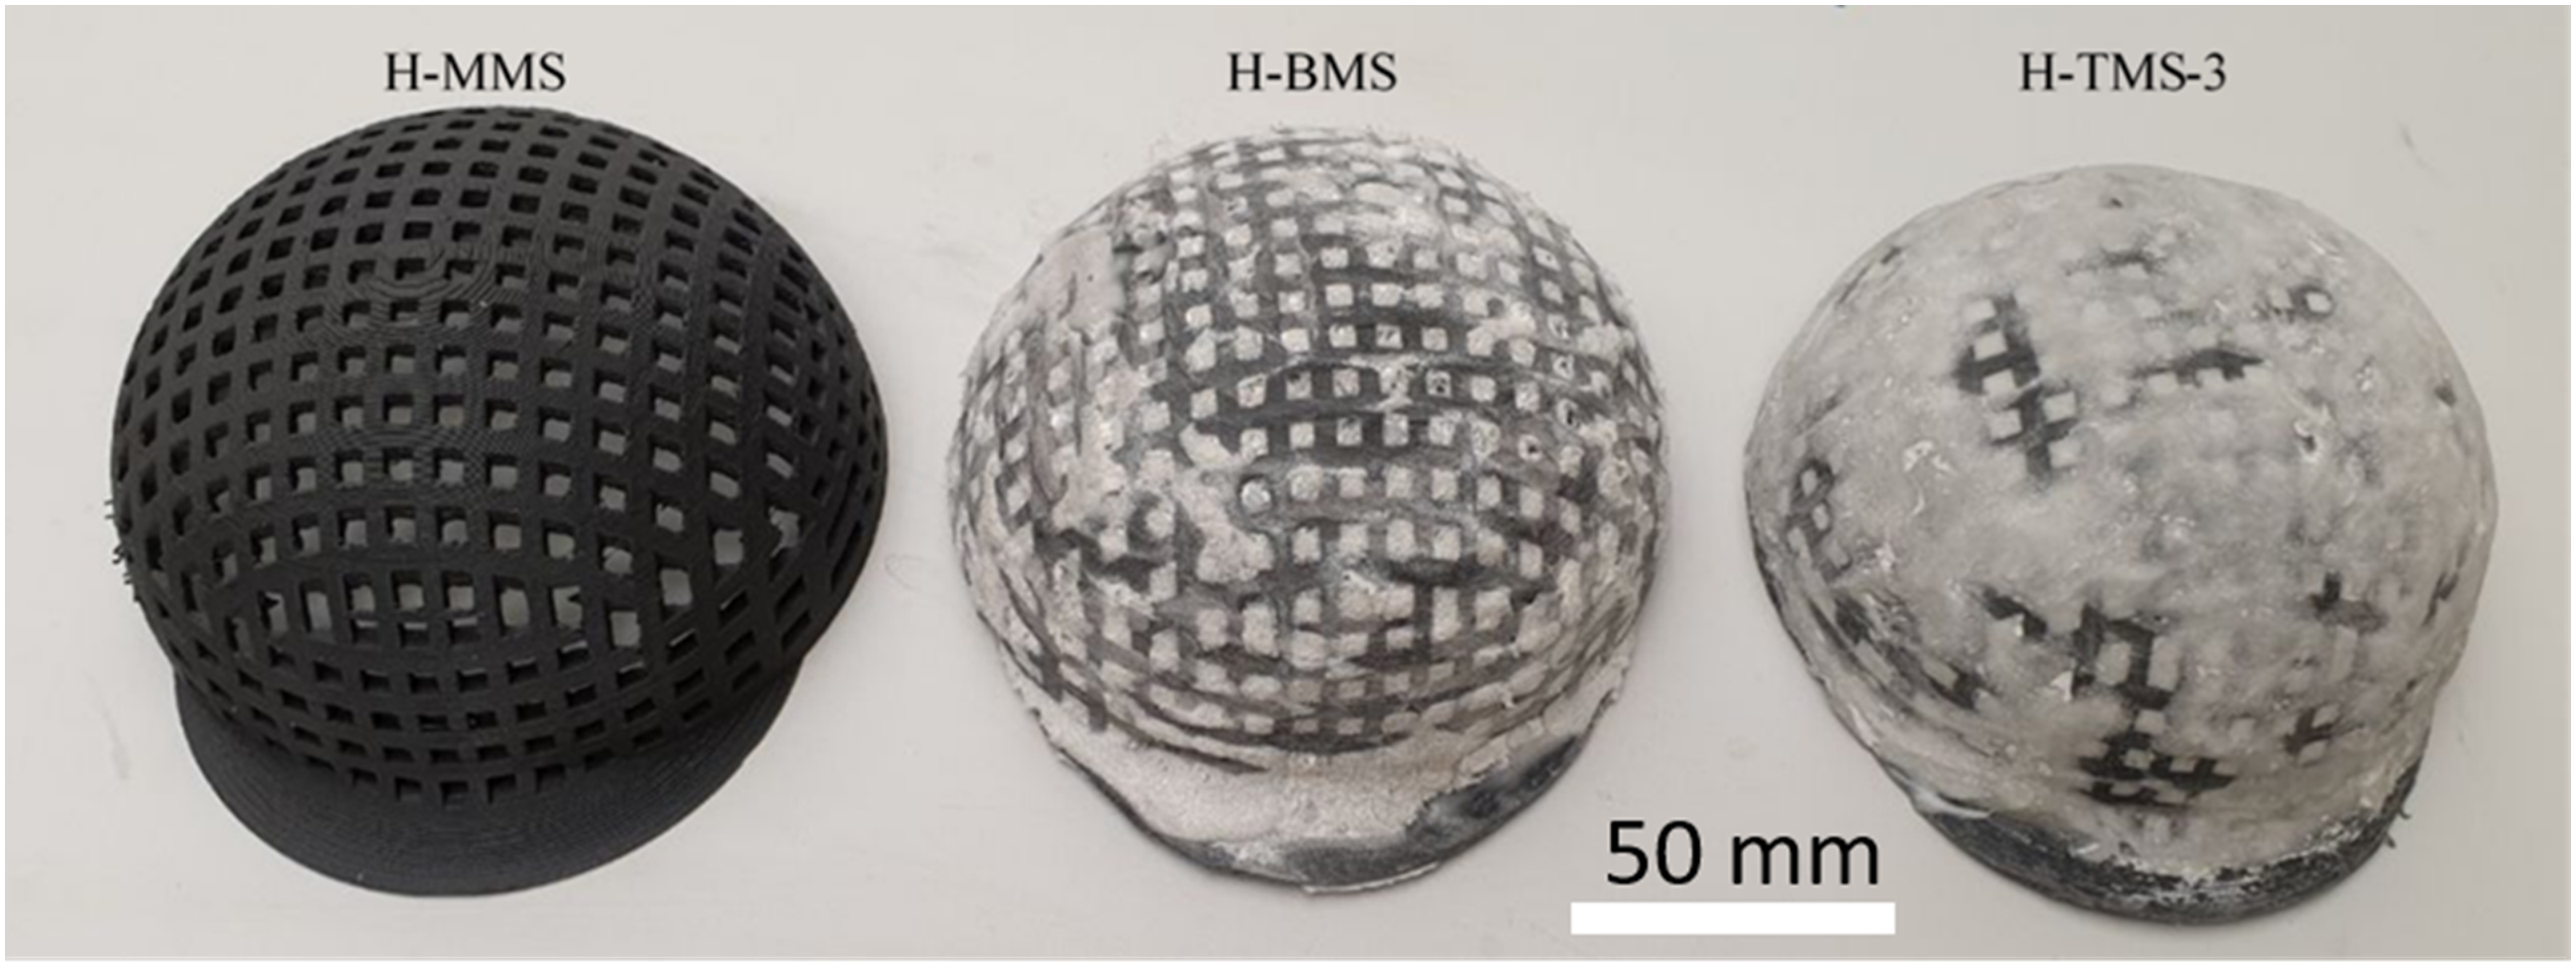
To investigate the performance of the designed TMS and compare to MMS and BMS, helmet prototypes was fabricated out of those composite structures. For TMS samples, TMS-3 was chosen due to its enhanced performance. The design and dimensions of the helmet prototypes are summarized in Figure 5. Samples were designed with a thickness of one-unit cell, which is 6.5 mm, for a more realistic representation of lightweight helmet prototype. Additionally, the final manufactured helmet prototypes are presented in Figure 6. Design details of helmet prototype. Fabricated helmet prototype samples of MMS, BMS, and TMS composite structures.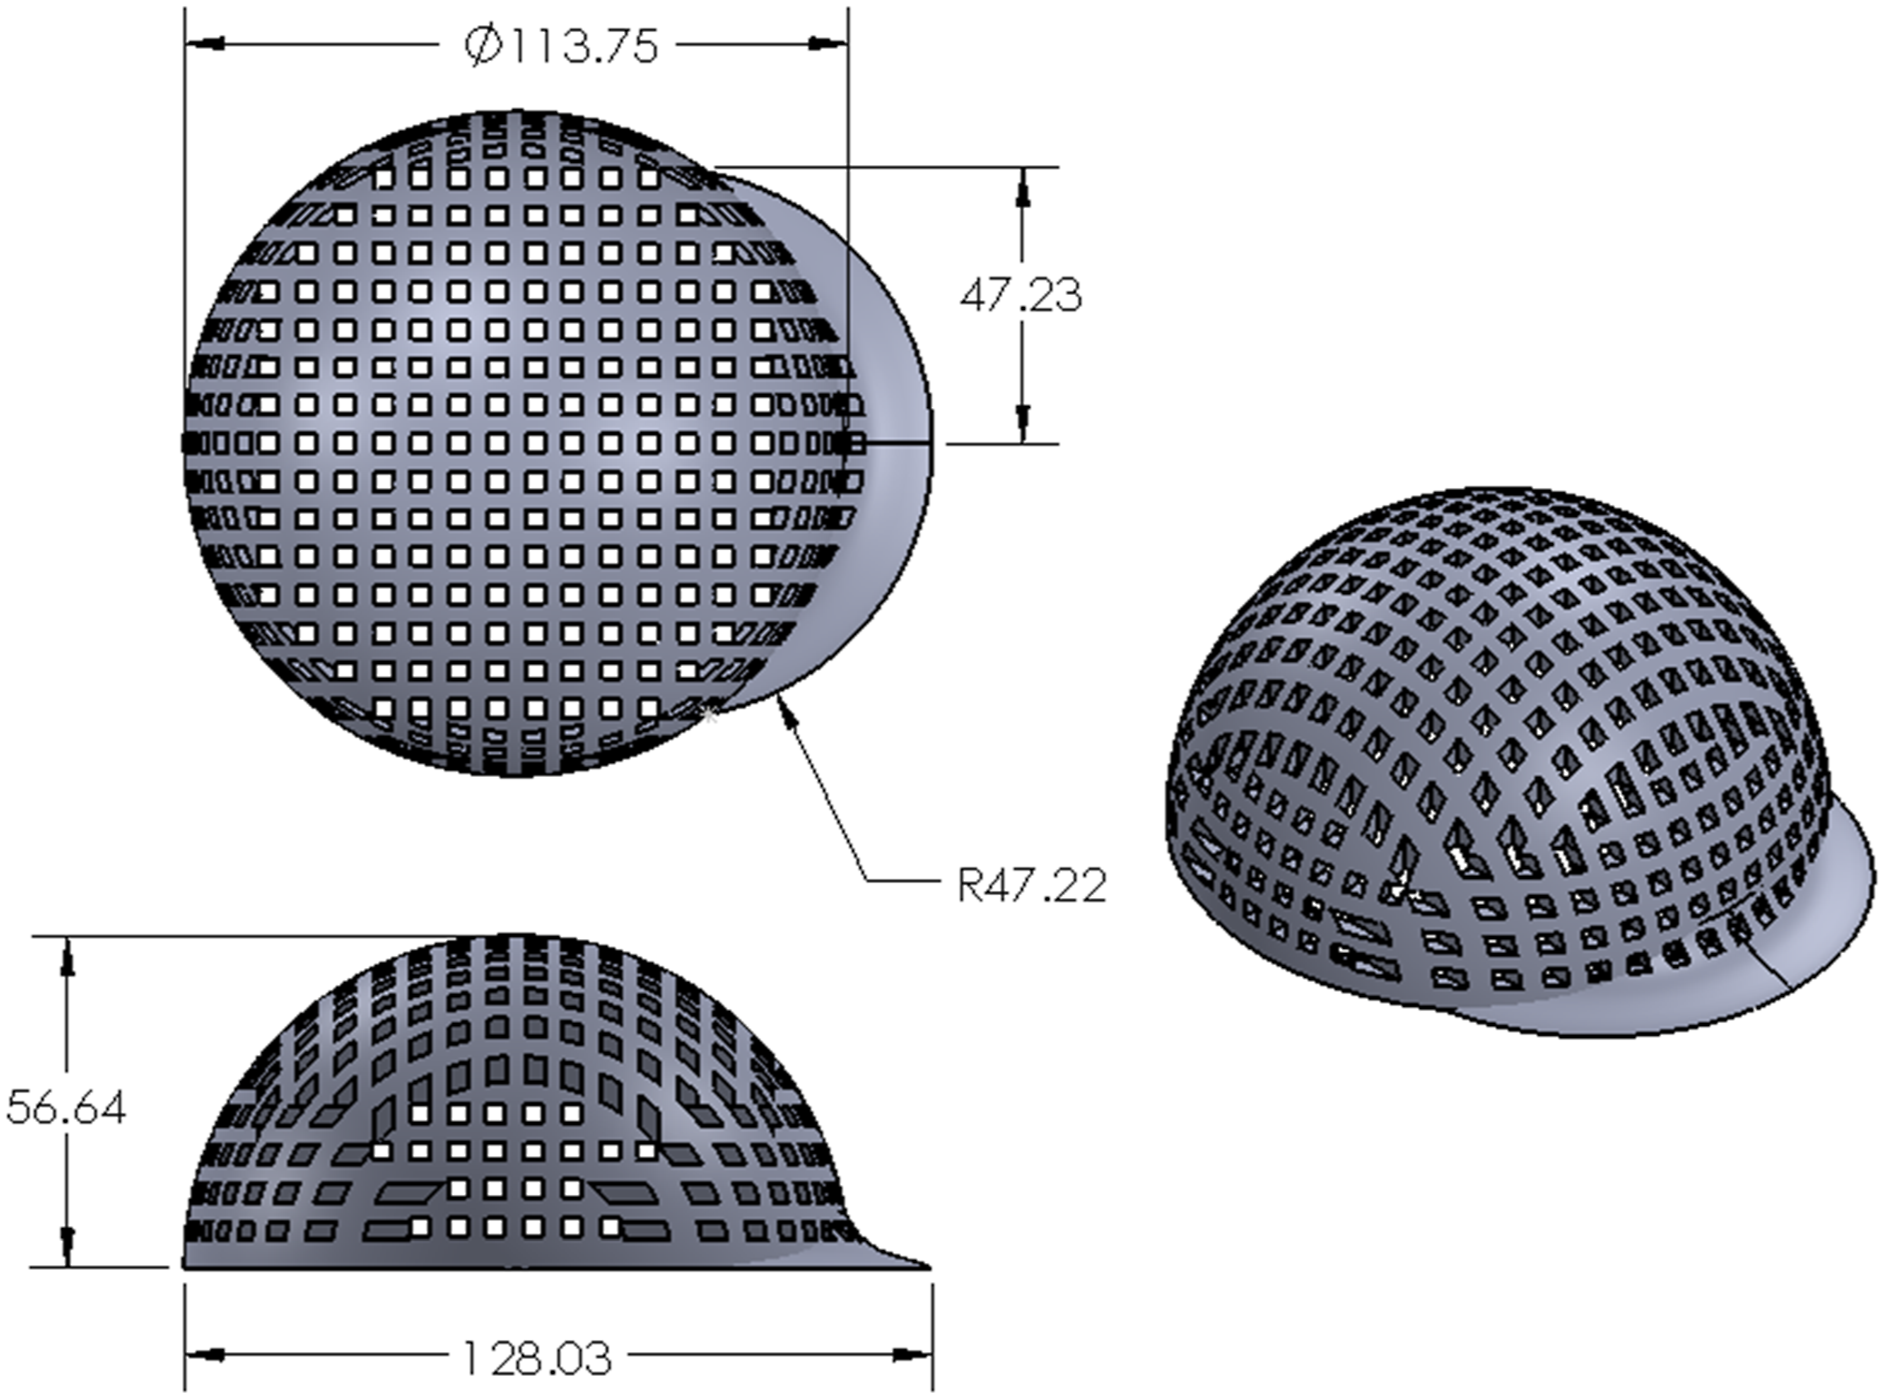
Microstructure Tri-material Composite Structure Samples
To have a more in-depth understanding of the effect of the applied low-velocity impact load on the microstructure of fractured composite samples, MMS, BMS, and TMS samples were scanned under the FEG-HRSEM electronic microscope (30 keV with a resolution of 1.3 nm at kV). To ensure a high quality capturing of the surface features, samples surface was coated with 20 nm thickness layer of gold, using the Q150 turbo-pumped sputter coating machine (supplied by Quorum Technologies, UK).
Results and Discussion
The TMS samples were fabricated and their response to the low-velocity impact load was then tested. In this section the findings resulted of the samples behavior with varied MGFs content, and for varied applied energy levels, were reported.
Low-velocity Response for TMS samples with Varied MGFs Content
By varying the MGFs content for the TMS samples, the influence of the milled fibers reinforcement on the holistic material structure was observed, and results are shown in Figure 7. The MMS samples has generated the minimum force response (average 1541.27 N), as shown in Figure 7(a), which was expected due to lack of PU foams filling and MGFs reinforcement. The peak absorbed energy by MMS samples was 8.91 J (average), as shown in Figure 7(b). This shows the limitations of MMS and emphasis the need of more robust material structure. When the BMS samples were tested under low-velocity load, they showed noticeable and improved response compared with MMS. Peak generated force due to applied impact load reached 3108.22 N, with 39.18 J absorbed energy (Figure 7(c) and (d)). This represents a 102% generated force improvement and 340% more absorbed energy, compared to MMS. According to this findings, adding PU foams filling to the lattice structure has proven to enhance the mechanical response of the composite structure. Despite the current improvement, adding fiber reinforcement is expected to add more enhancement. Low velocity behavior for TMS samples with varied MGFs content; a), c), e), g), i), k), and l) represent the Force (N) versus Time (ms) response, whereas b), d), f), h), k), and m) represent the Energy (J) versus Time (ms) response; (T1: Trial 1; T2: Trial 2; T3: Trial 3).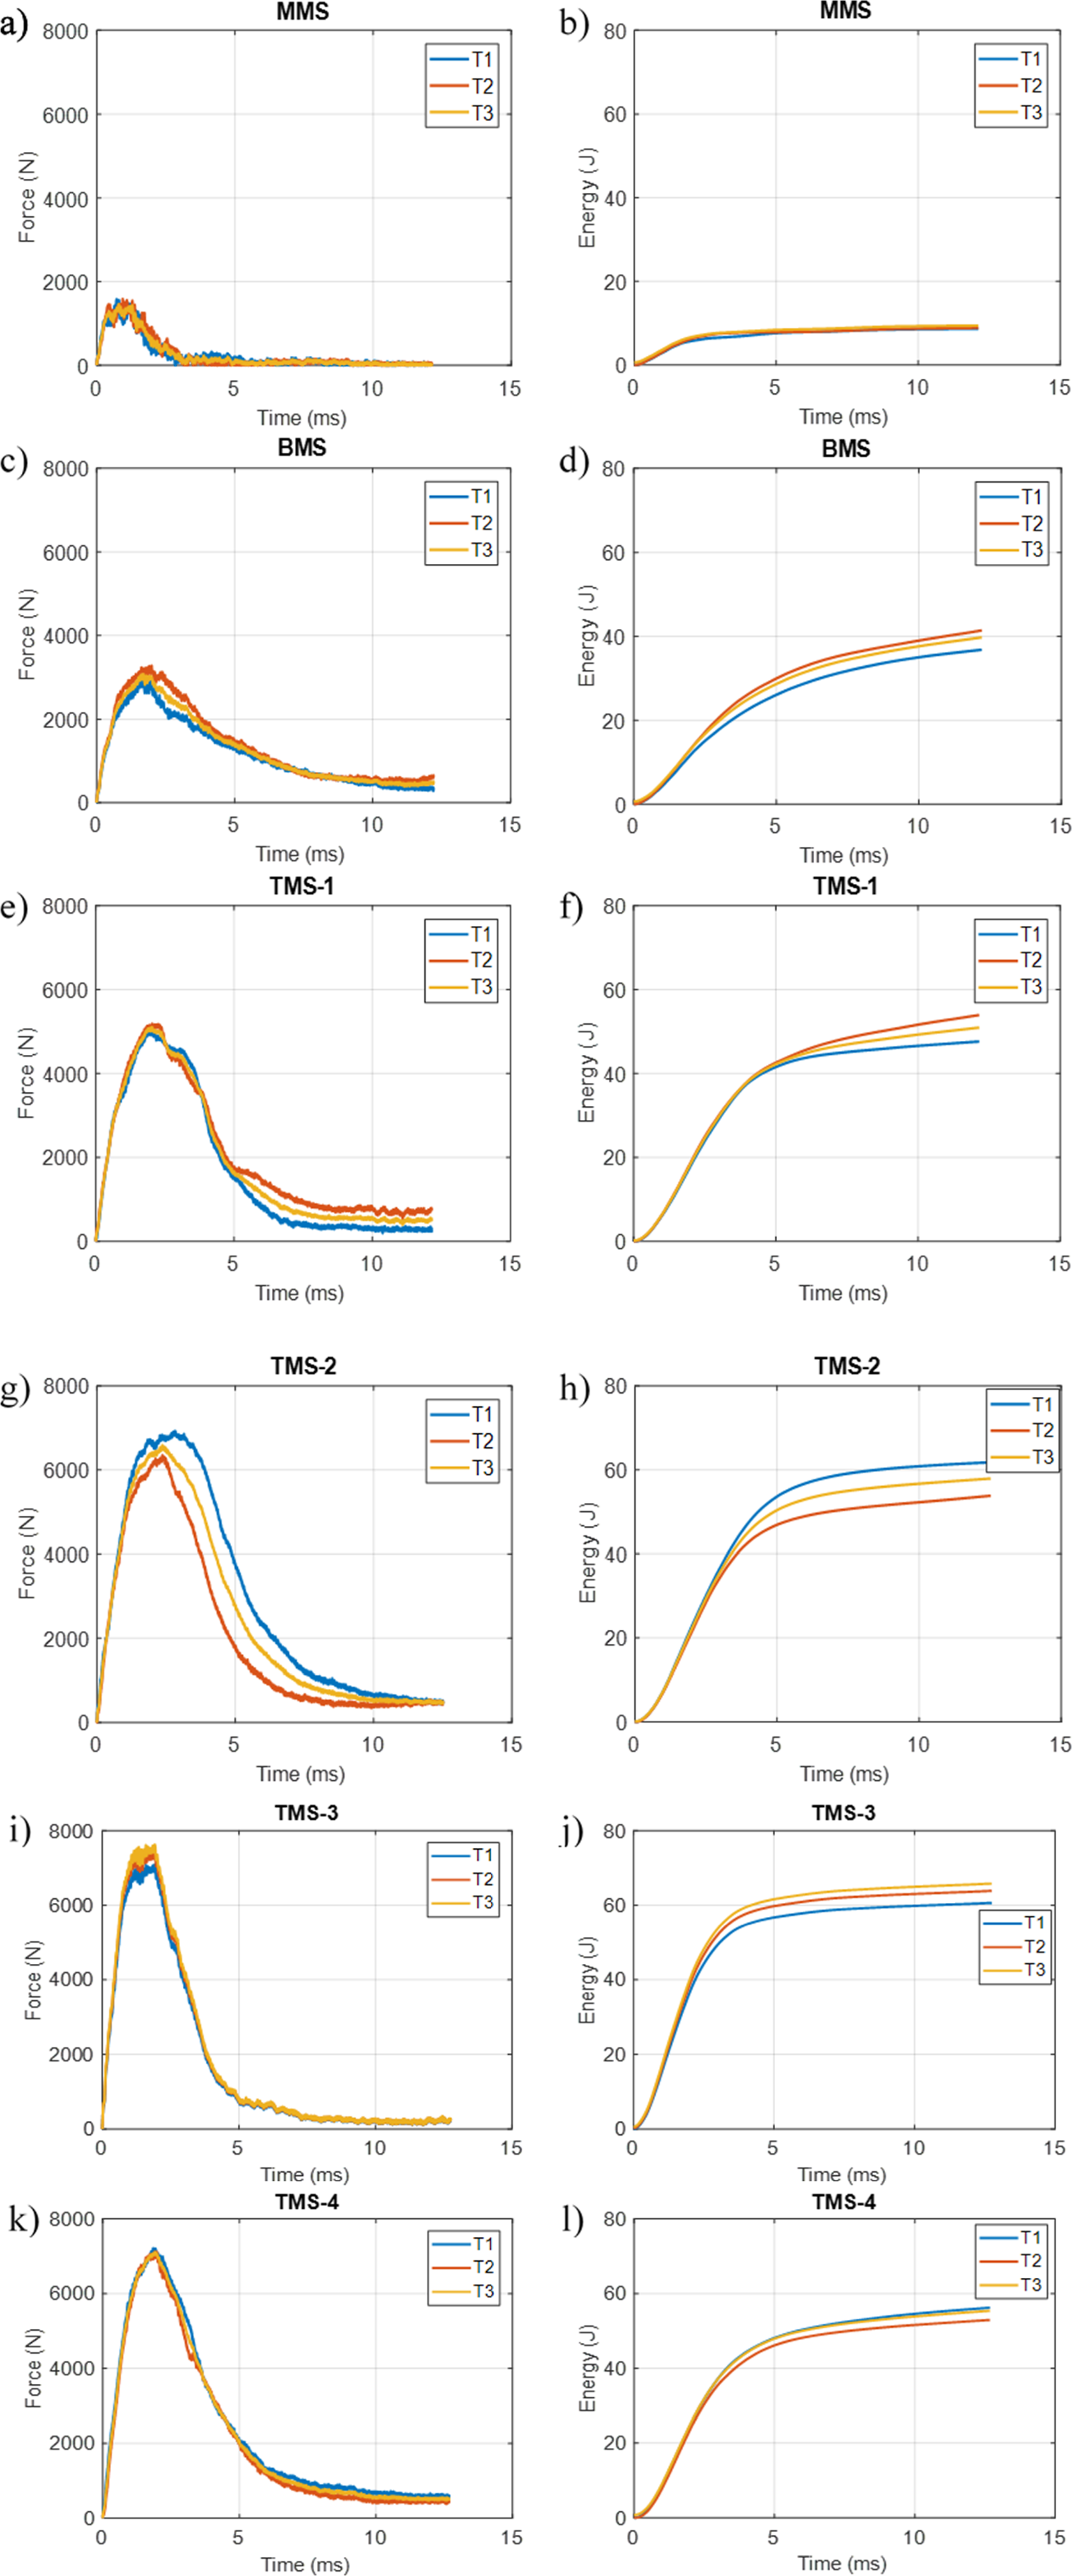
By introducing MGFs content to the composite material structure, the reinforced PU improved the behavior of the TMS-1 samples even further. This can be shown in the peak force generated (5110 N) and the corresponding absorbed energy of 50.8 J, which is 64% and 30% improvement, respectively (compared to MMS). Bothe force and absorbed energy response are shown in (Figure 7(e) and (f). Such results demonstrate the enhancement brought by introducing MGFs content in TMS samples. Going further with TMS-2 samples, which contain more MGFs content, Figure 7(g) and (h) show the mechanical response of those samples in means of force and absorbed energy. The peak generated force reached 6624.82 N (30% improvement compared to TMS-1), and the peak absorbed energy was 57.82 (14% improvement compared to TMS-1). As expected, the increment in MGFs content has demonstrated to enhance the mechanical response even further.
The TMS-3 samples have shown the most enhanced mechanical behavior among all other samples. With peak force of 7390.83 N and peak absorbed energy of 63.48, this represents 12% and 10% improvement, respectively, compared to TMS-2. The mechanical behavior of TMS-3 samples is shown in Figure 7(i) and (j). Going beyond that, TMS-4 samples showed drop in their response compared with TMS-3, as shown in Figure 7(k) and l. The peak force reached 7152.88 N and the peak absorbed energy reached 63.48 J. This drop could be explain by the saturation in MGFs content and agglomeration occurred due to it, as reported in our previous work. 69 The mechanical response of the composite structures showed noticeable enhancement by introducing the PU filling to the PLA lattice structure in the BMS samples. Even further improvement was demonstrated by adding the MGFs reinforcement in the TMS samples. As the MGFs content increased, the mechanical behavior was correspondingly enhanced. Reaching saturation increased the possibility of agglomeration, as in TMS-4 samples, leading to a slight drop in the mechanical response.
Figure 8 summarize the response of MMS, BMS, and TMS samples when undergoing low-velocity impact test and the effect of the MGFs content on the behavior of composite structure samples. The velocity residual for MMS, BMS, and TMS1-4 samples changes as 0.13, 0.9, 1.34, 1.7, 2.45, and 1.74 m/s, respectively. This indicates the resistance of the samples to the progression of the impactor through the composite structures. It is shown that as the MGFs content increase the samples is more likely to resist the movement of the impactor. In a similar way, the variance in displacement demonstrate the same pattern. The fractured composite structure samples, post low-velocity impact test, are shown in Figure 9. A summary of low-impact response characterization of MMS, BMS, and TMS samples demonstrated by peak generated force (N), peak absorbed energy (J), velocity residual (m/s), and impactor displacement (mm) at peak energy. Fractured MMS, BMS, and TMS samples post low-velocity test.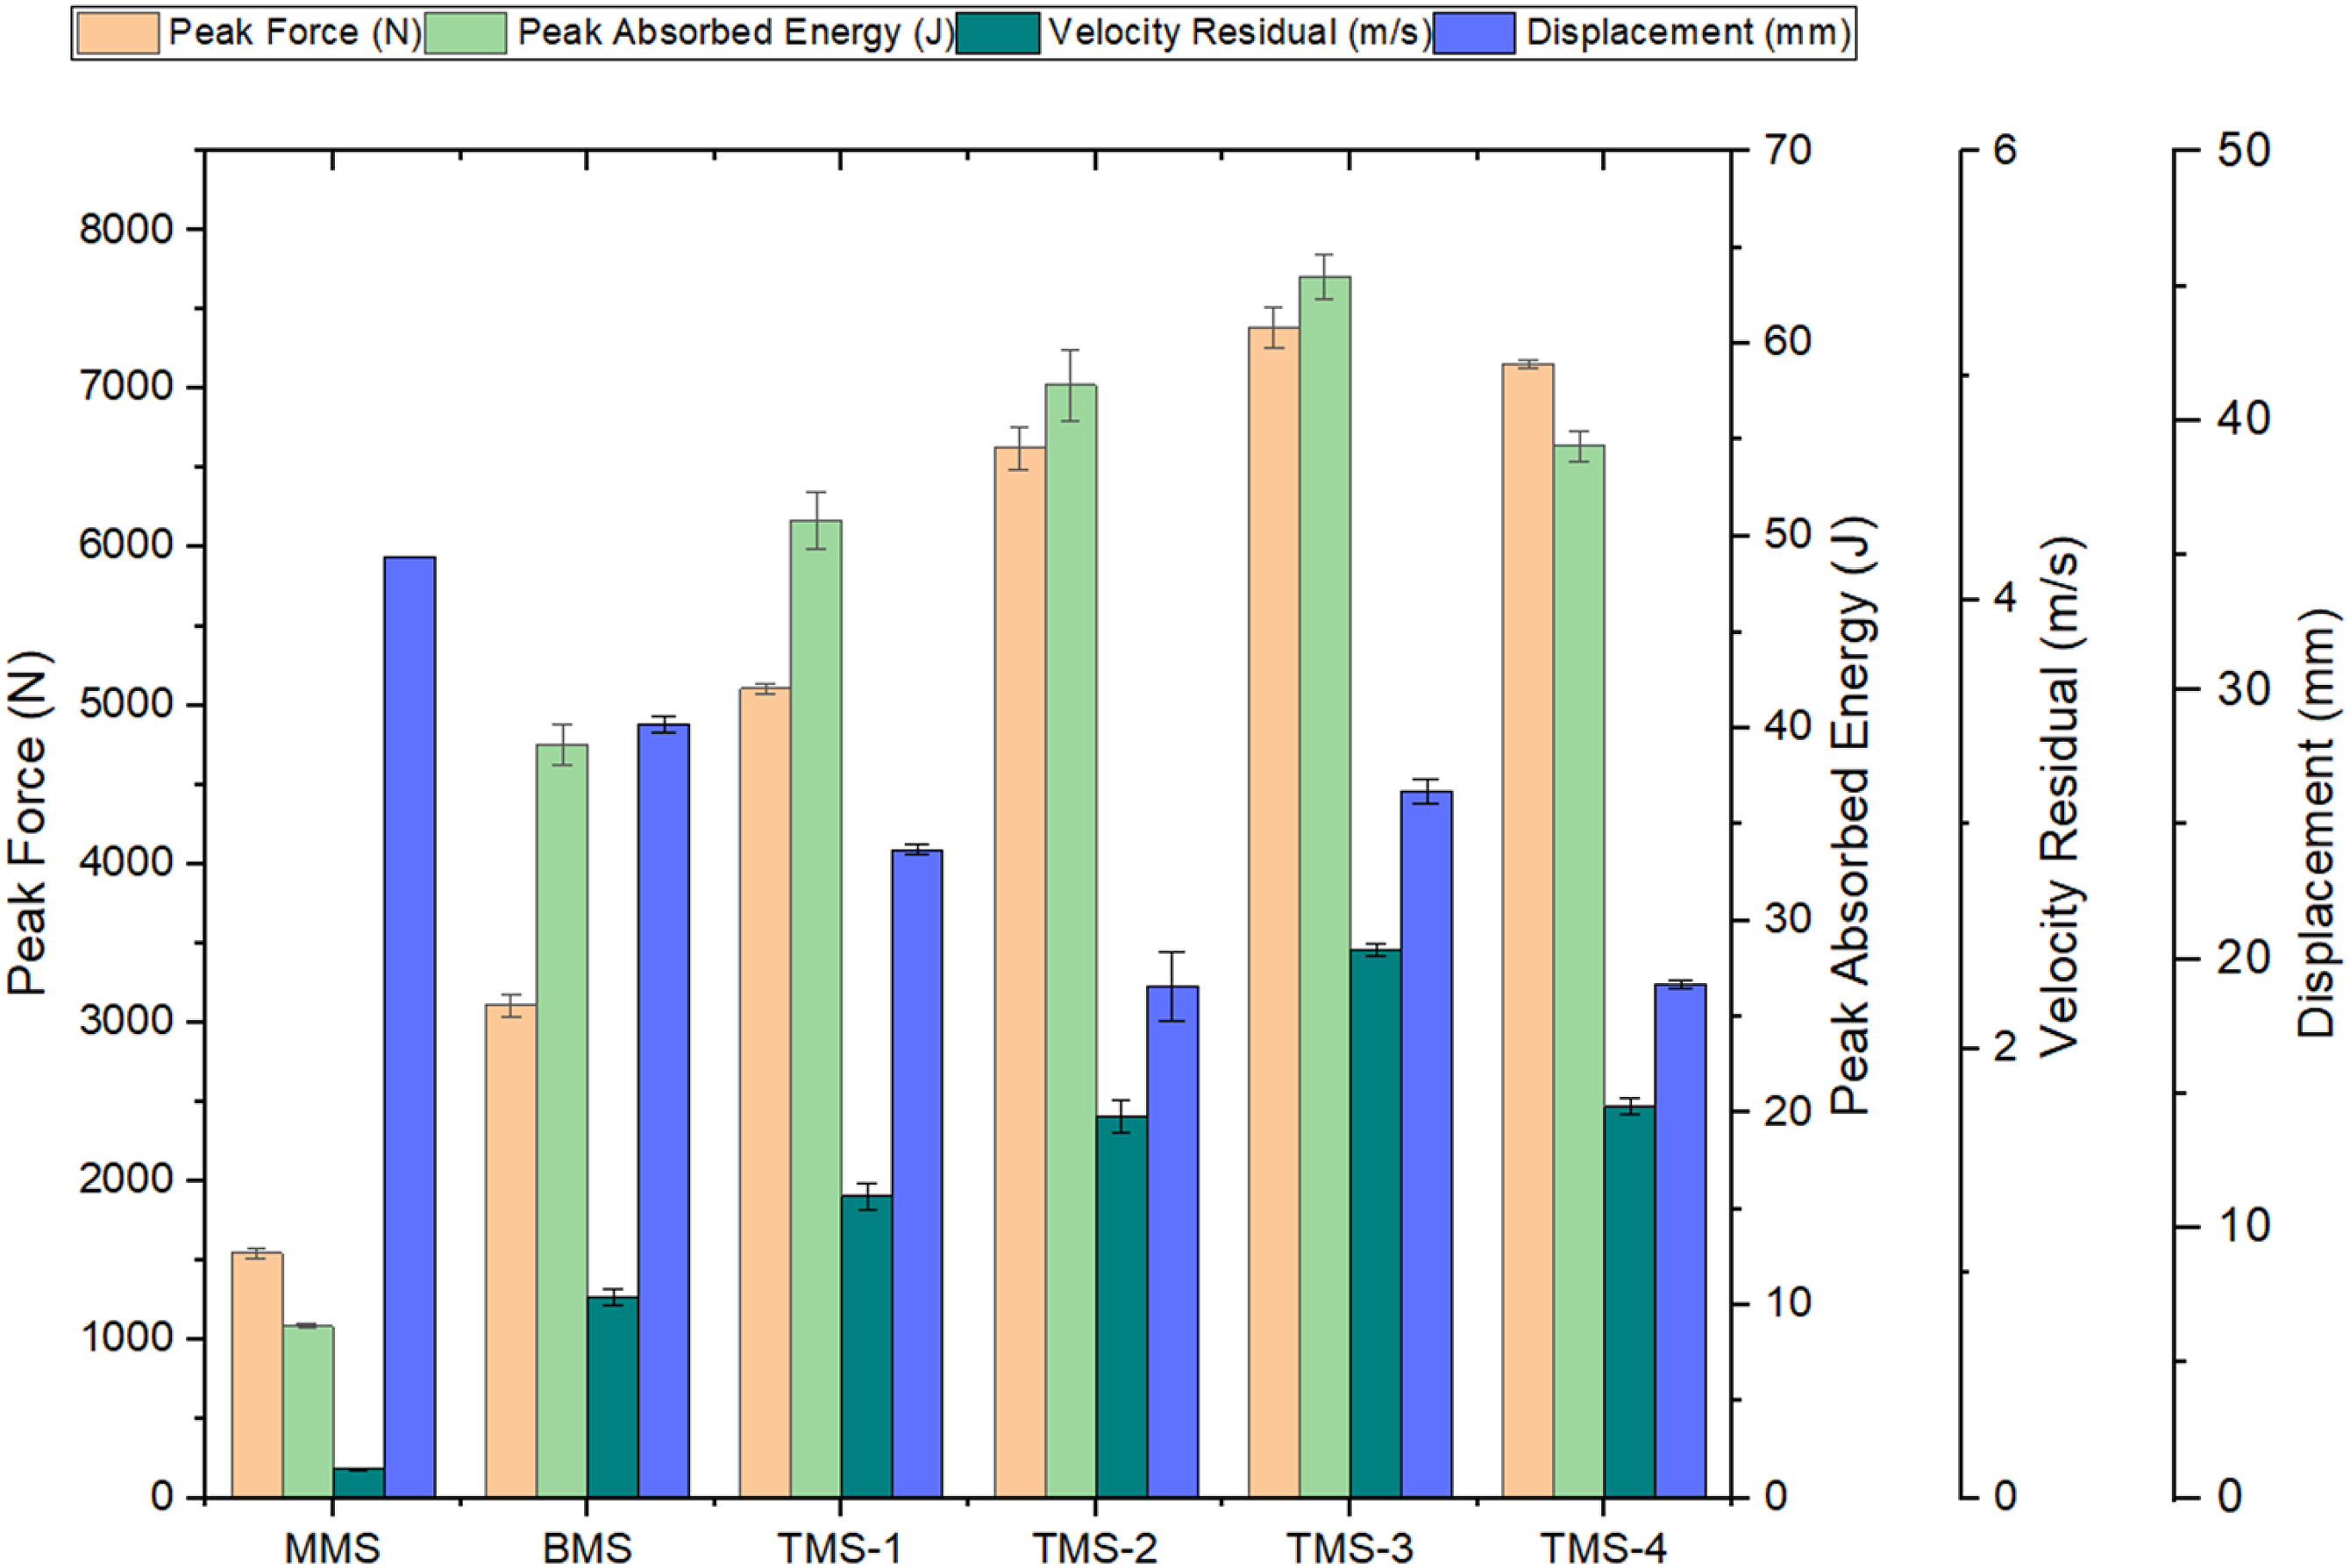
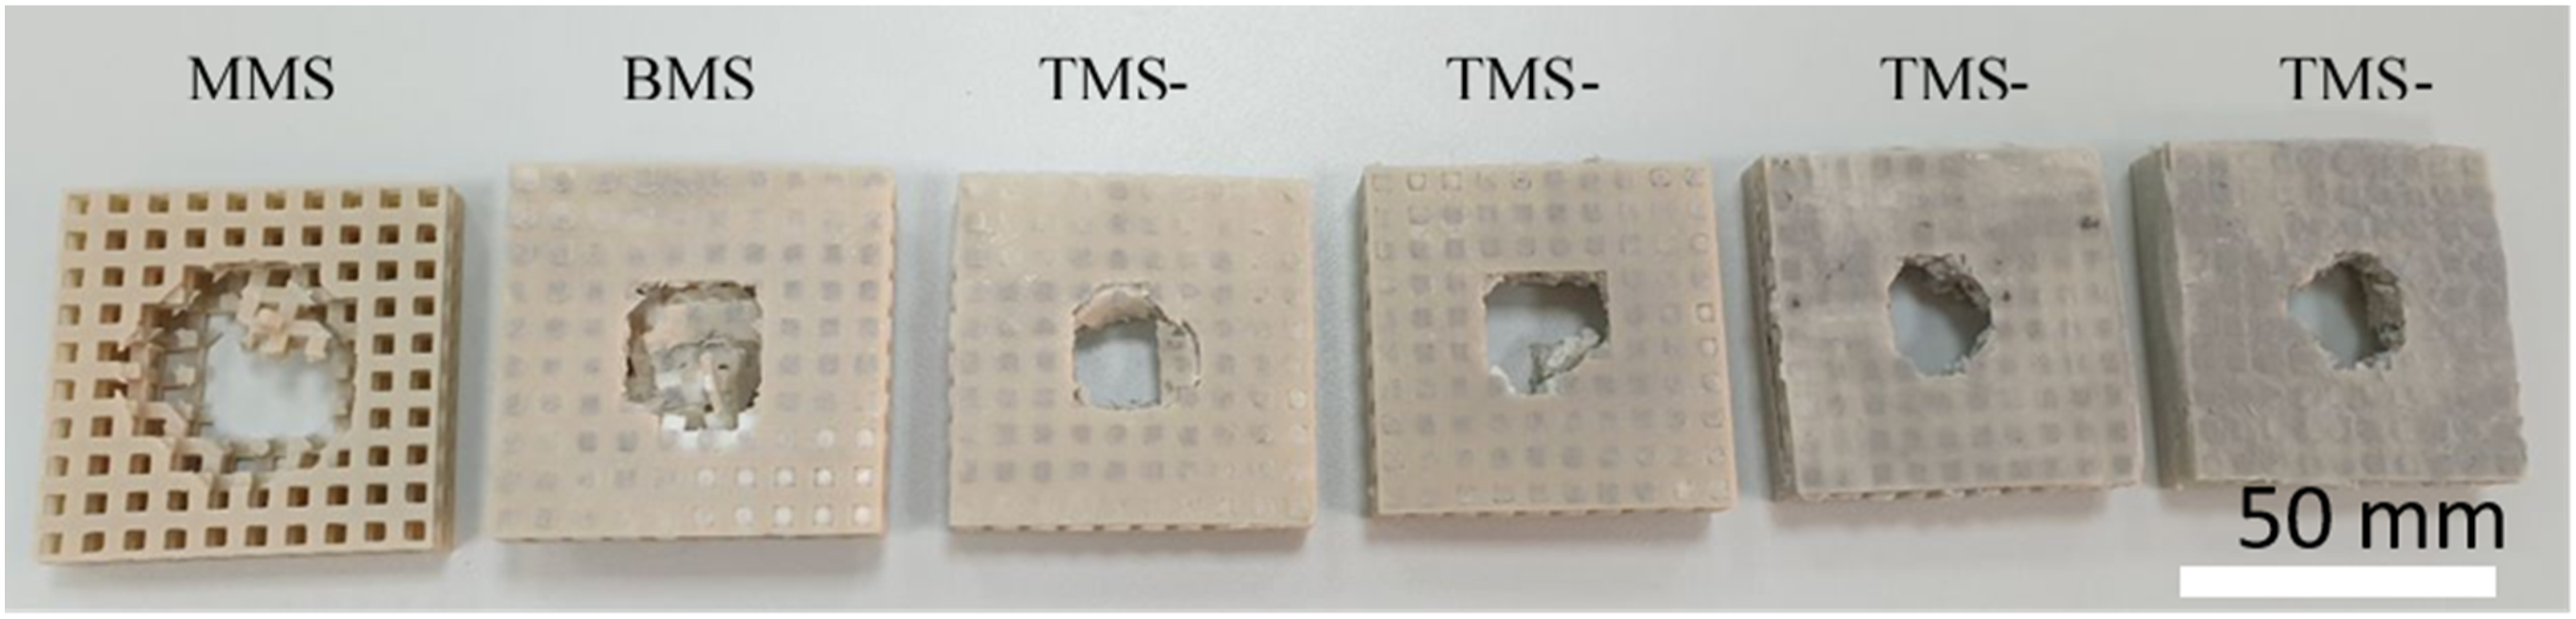
Figure 10 illustrates the change in velocity through time following the application of low-velocity impact load on composite structure samples. The TMS-3 samples exhibit the highest velocity residual at 2.51 m/s, followed by TMS-4, TMS-2, and TMS-1 with velocity residuals of 1.66, 1.54, and 1.46 m/s, respectively. Besides, as the MGF content increased, the rate of velocity degradation of the impactor accelerated, with TMS-3 samples having the furthest declination rate. However, TMS-4 demonstrated lower absorption of the applied impact energy, compared to TMS-3, which may be attributed to the saturation in MGF content leading to agglomeration within the samples.
68
The velocity residual serves as an effective indicator of the capability of specimens to absorb applied impact energy and resist the progression of the impactor through the composite structure. Impactor velocity variation over time in response for the applied low-velocity load for the comosite structure samples.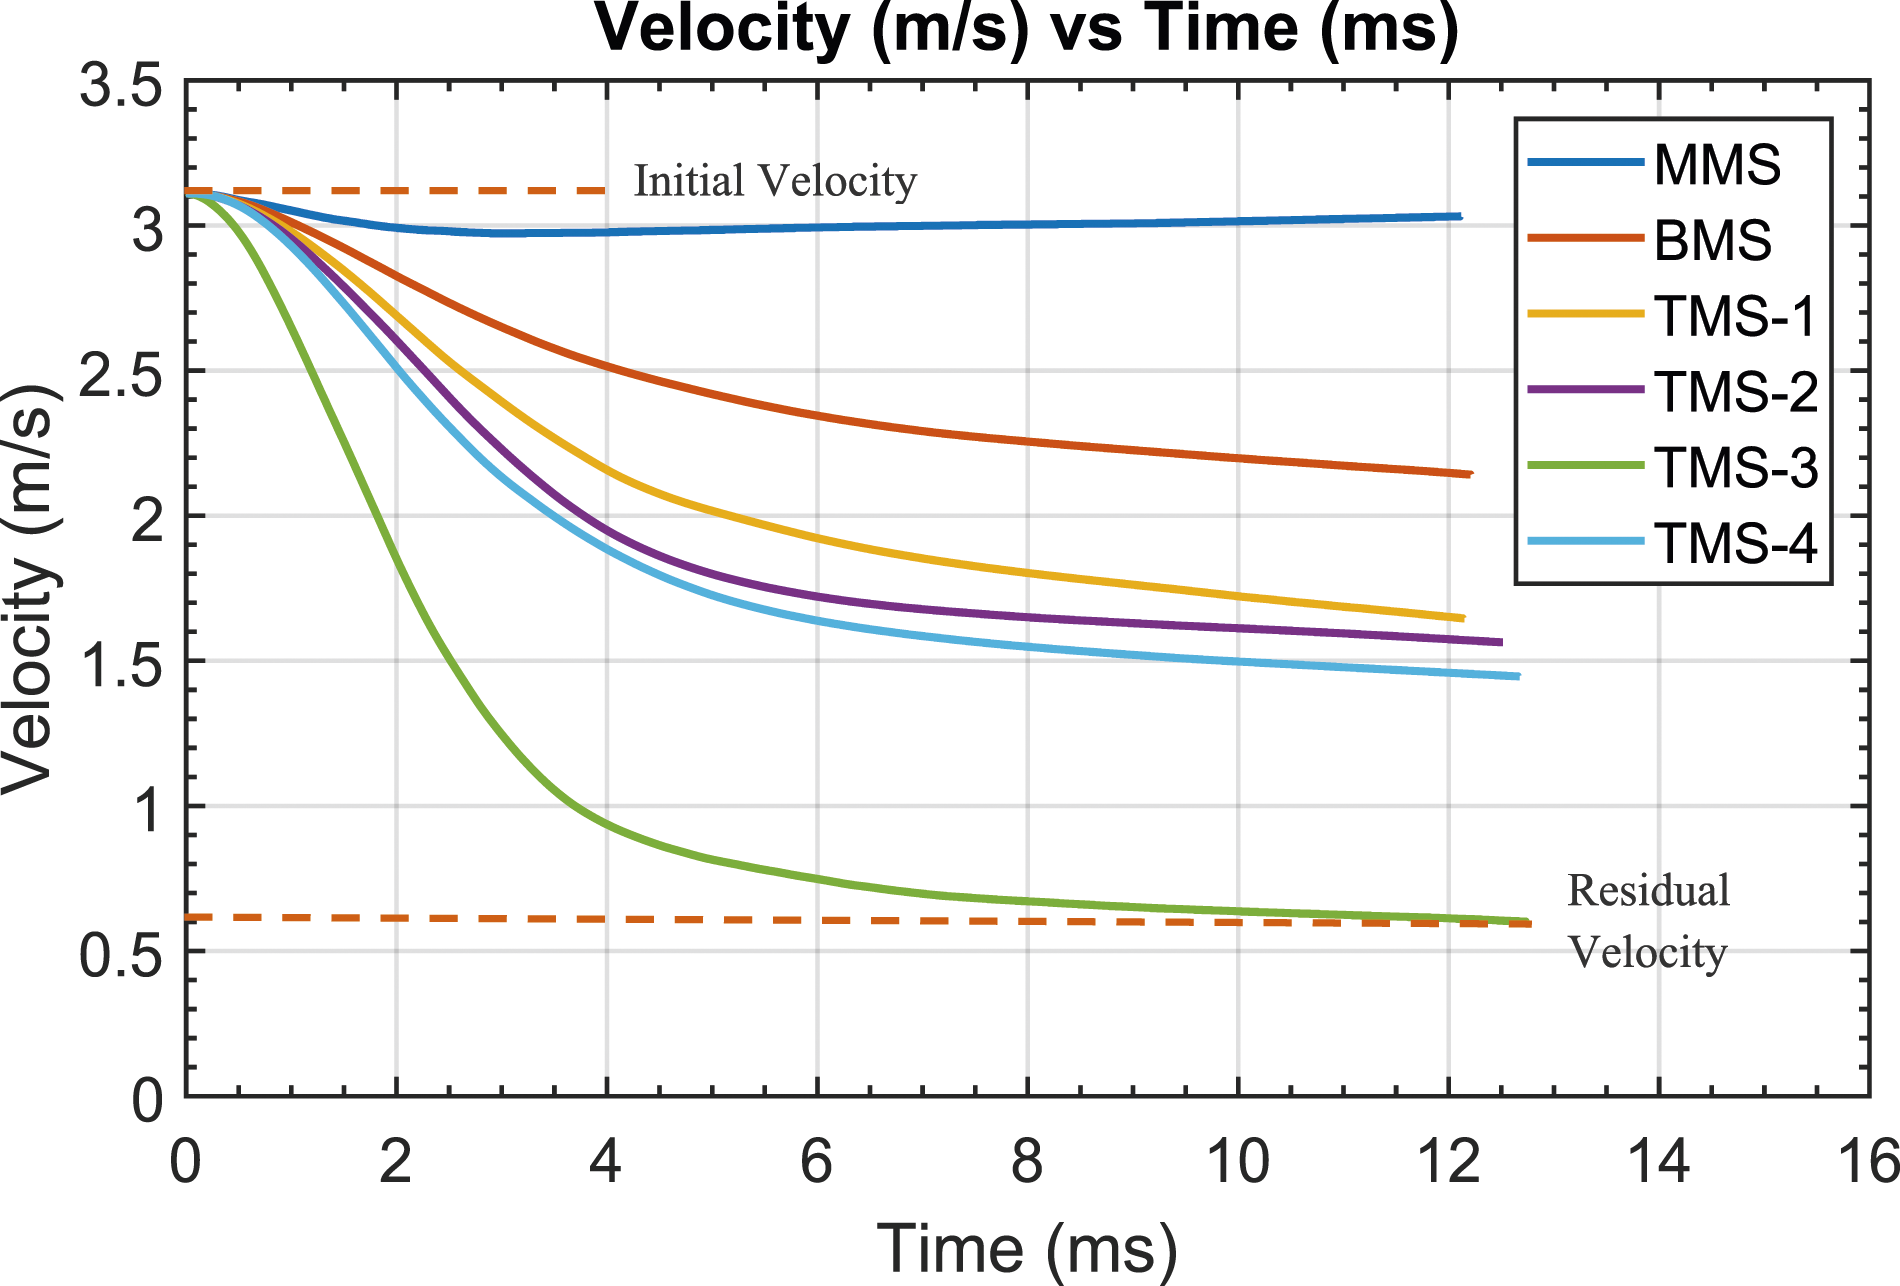
Low-velocity Response for TMS samples with Varied Applied Energy Levels
To investigate how the TMS samples respond to the low-velocity load of varied energy, the test was conducted under 3, 9, 12, 40, 60, and 75 J applied energy levels. TMS-3 samples was selected for this tests due to the improved behavior demonstrated previously.
The force generated with time under low-velocity load for multiple applied energy levels is represented in Figure 11, whereas the absorbed energy is summarized in Figure 12. Furthermore, Figure 13 summarize the response of TMS samples when undergoing low-velocity impact test for varied applied energy levels. For 3 J applied energy, the TMS sample generated only 1734.67 N with a corresponding absorbed energy of 2.21 J. This was combined with 0.909 m/s velocity residual and 1.36 mm impactor displacement. For 9 J applied energy, the force and peak absorbed energy increased to 3209.13 N and 4.27 J respectively. The corresponding velocity residual and displacement were 1.73 m/s and 1.57 mm. By increasing the applied energy to 12 J, the corresponding generated force increased to 4226.81 N absorbing 10.66 J of the applied energy. The velocity residual was 2.21 m/s with impactor displacement of 2.69 mm. Force versus time response of TMS samples under varied applied energy levels. Absorbed energy versus time of TMS samples under varied applied energy levels. A summary of low-impact response characterization of TMS samples for 3, 9, 12, 40, 60, and 75 J applied energy, demonstrated by peak generated force (N), peak absorbed energy (J), velocity residual (m/s), and impactor displacement (mm) at peak energy.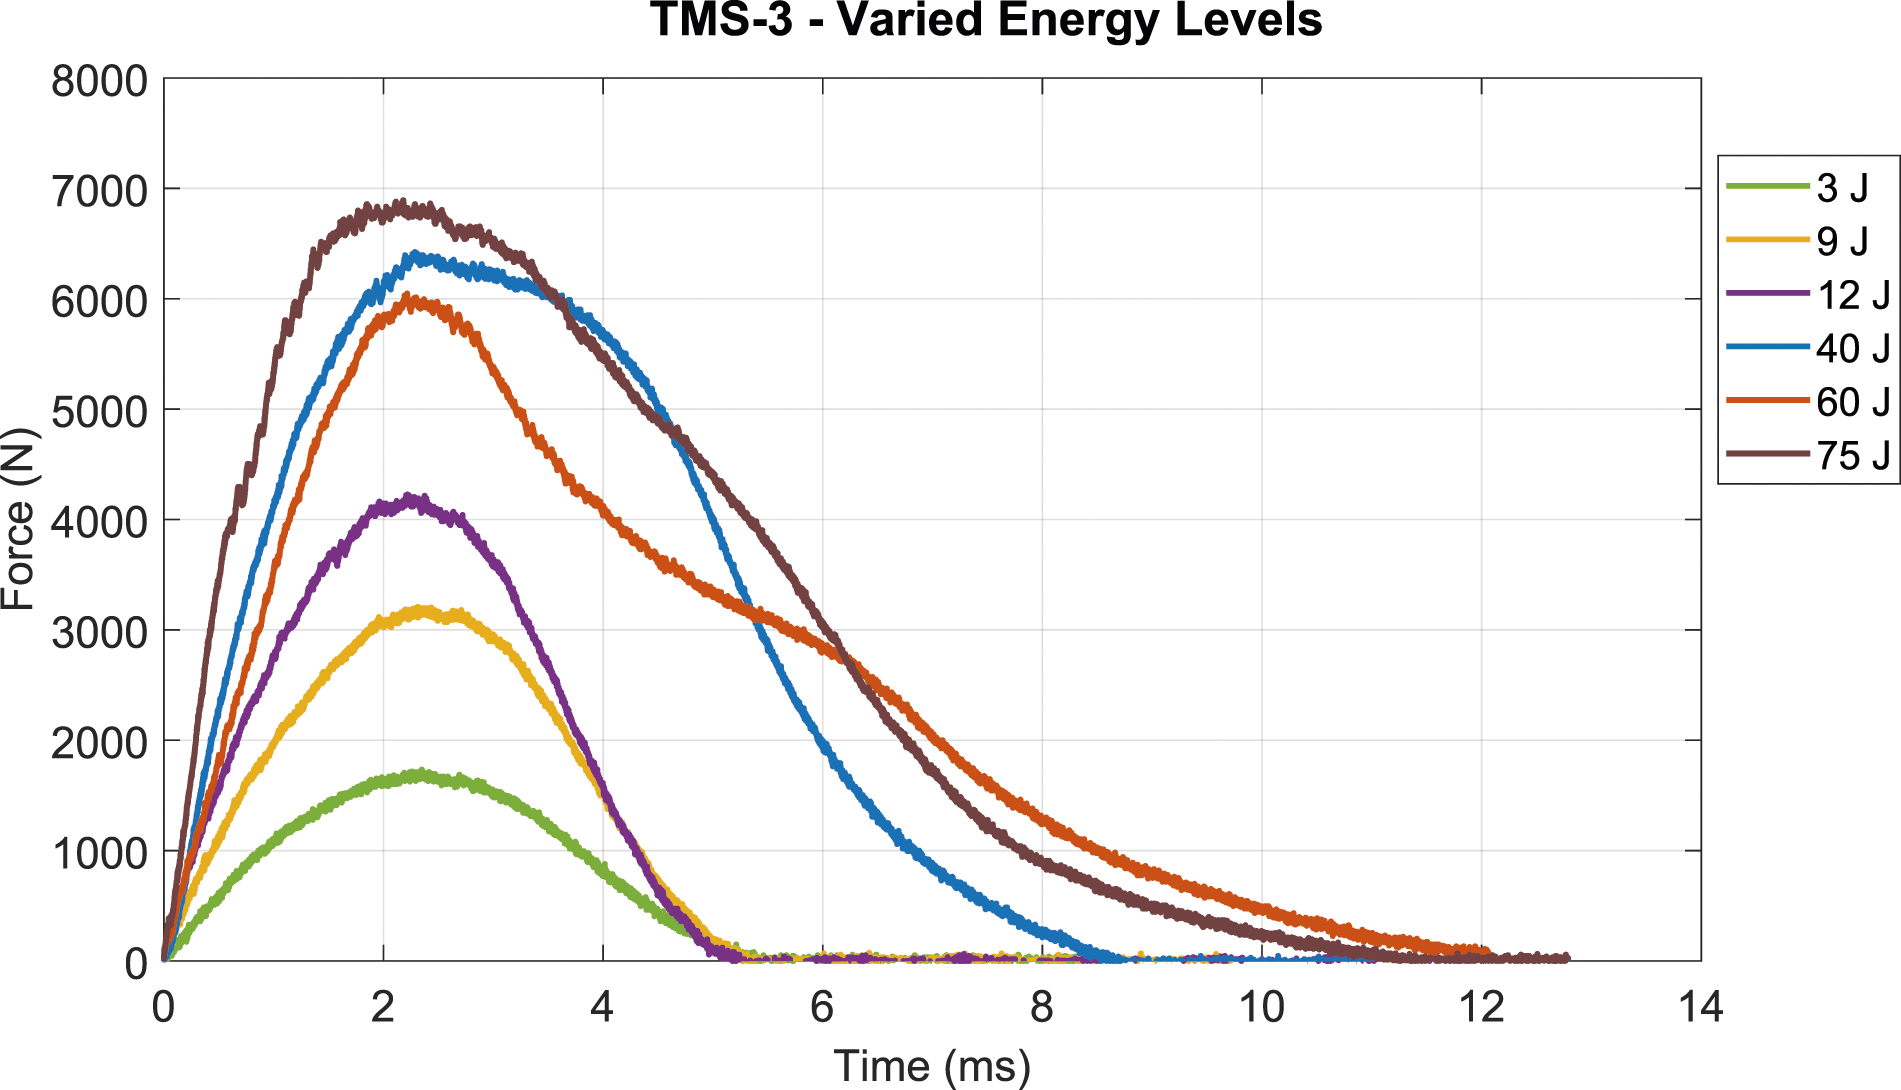
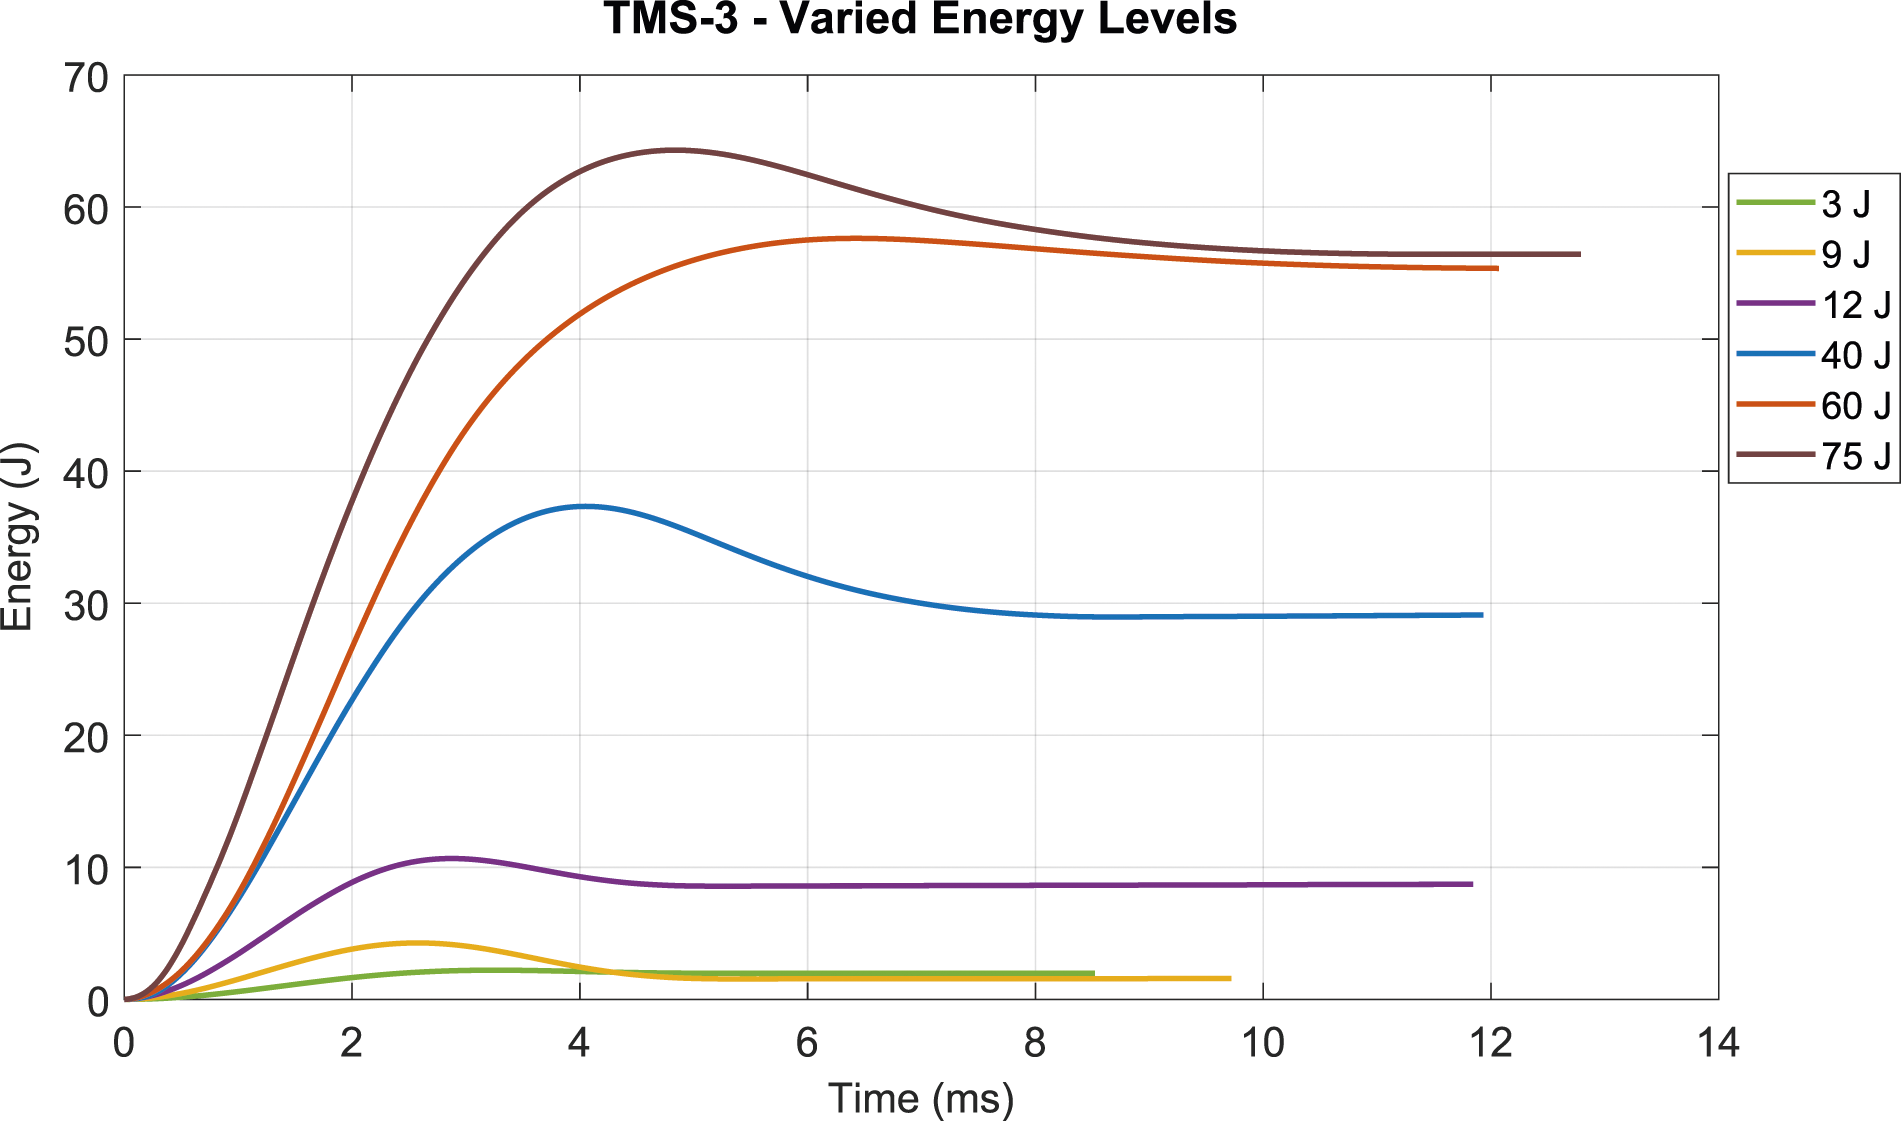
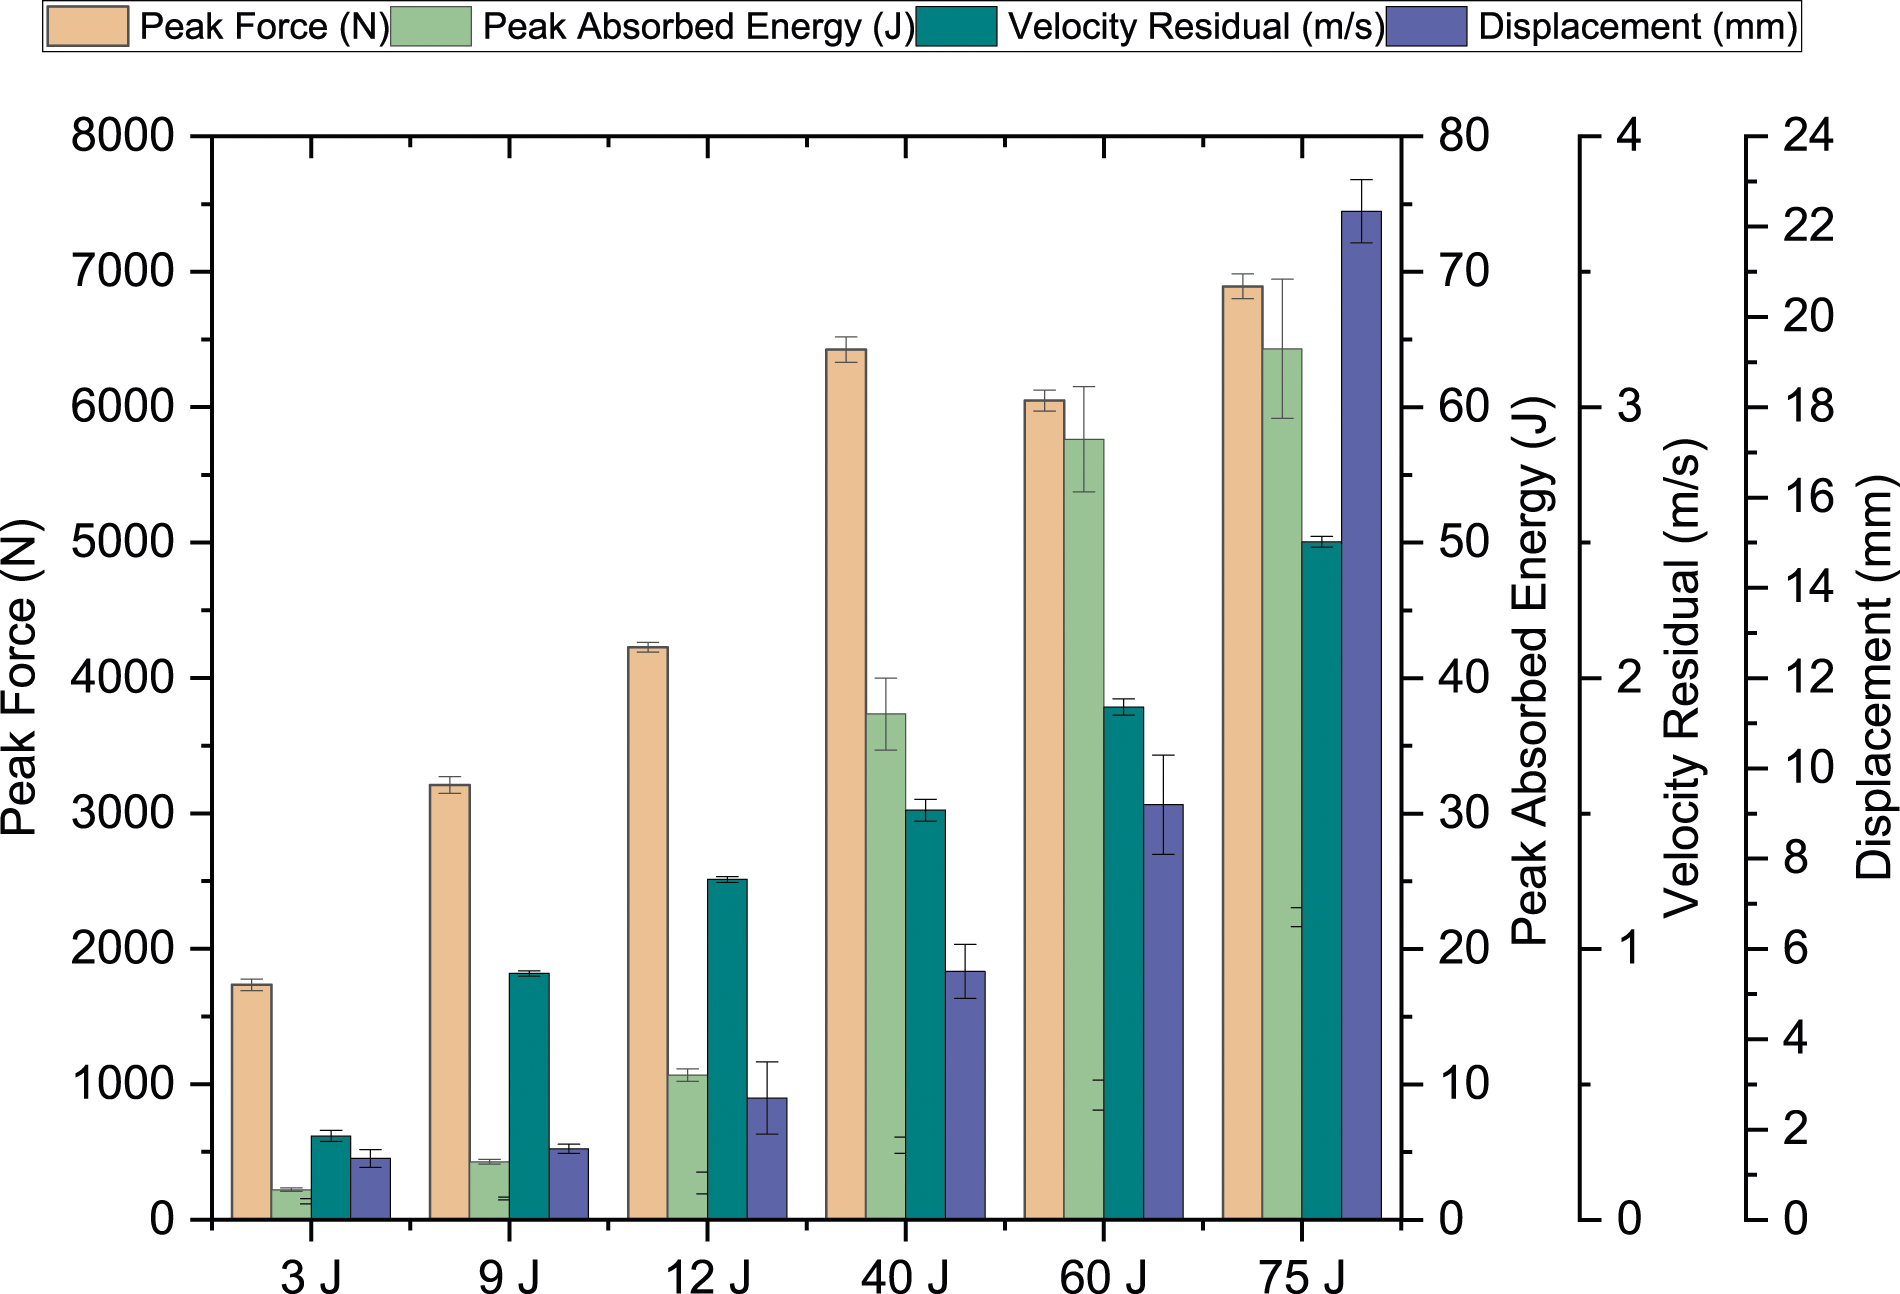
For the 40 J applied energy level, the generated force reached 6424.04 N, absorbing 37.33 J of the applied energy; with a corresponding velocity residual and displacement of 3.39 m/s and 5.49 mm, respectively. Moreover, when 60 J energy was applied, the maximum peak force reached 6048.21 N. Although this is less than the force generated for the 40 J energy level, the absorbed energy is much higher, reaching 57.62 J. Also, the generated force curve lasted for a longer period the test time, compared to the one of the 40 J level. Finally, at 75 J applied energy, the peak force response reached it maximum at 6892.41 N, with a corresponding absorbed energy of 64.31 J. This was combined by 4.08 m/s velocity residual and 7.87 mm displacement.
Low-velocity Response for TMS helmet samples
To investigate the behavior of developed composite structures for a real life application, a set of helmet porotypes samples were fabricated of MMS, BMS, and TMS composite structures. The TMS-3 MGFs reinforced structure was selected due to its demonstrated enhanced response to the low-velocity load. Samples then were tested under 75 J applied impact energy.
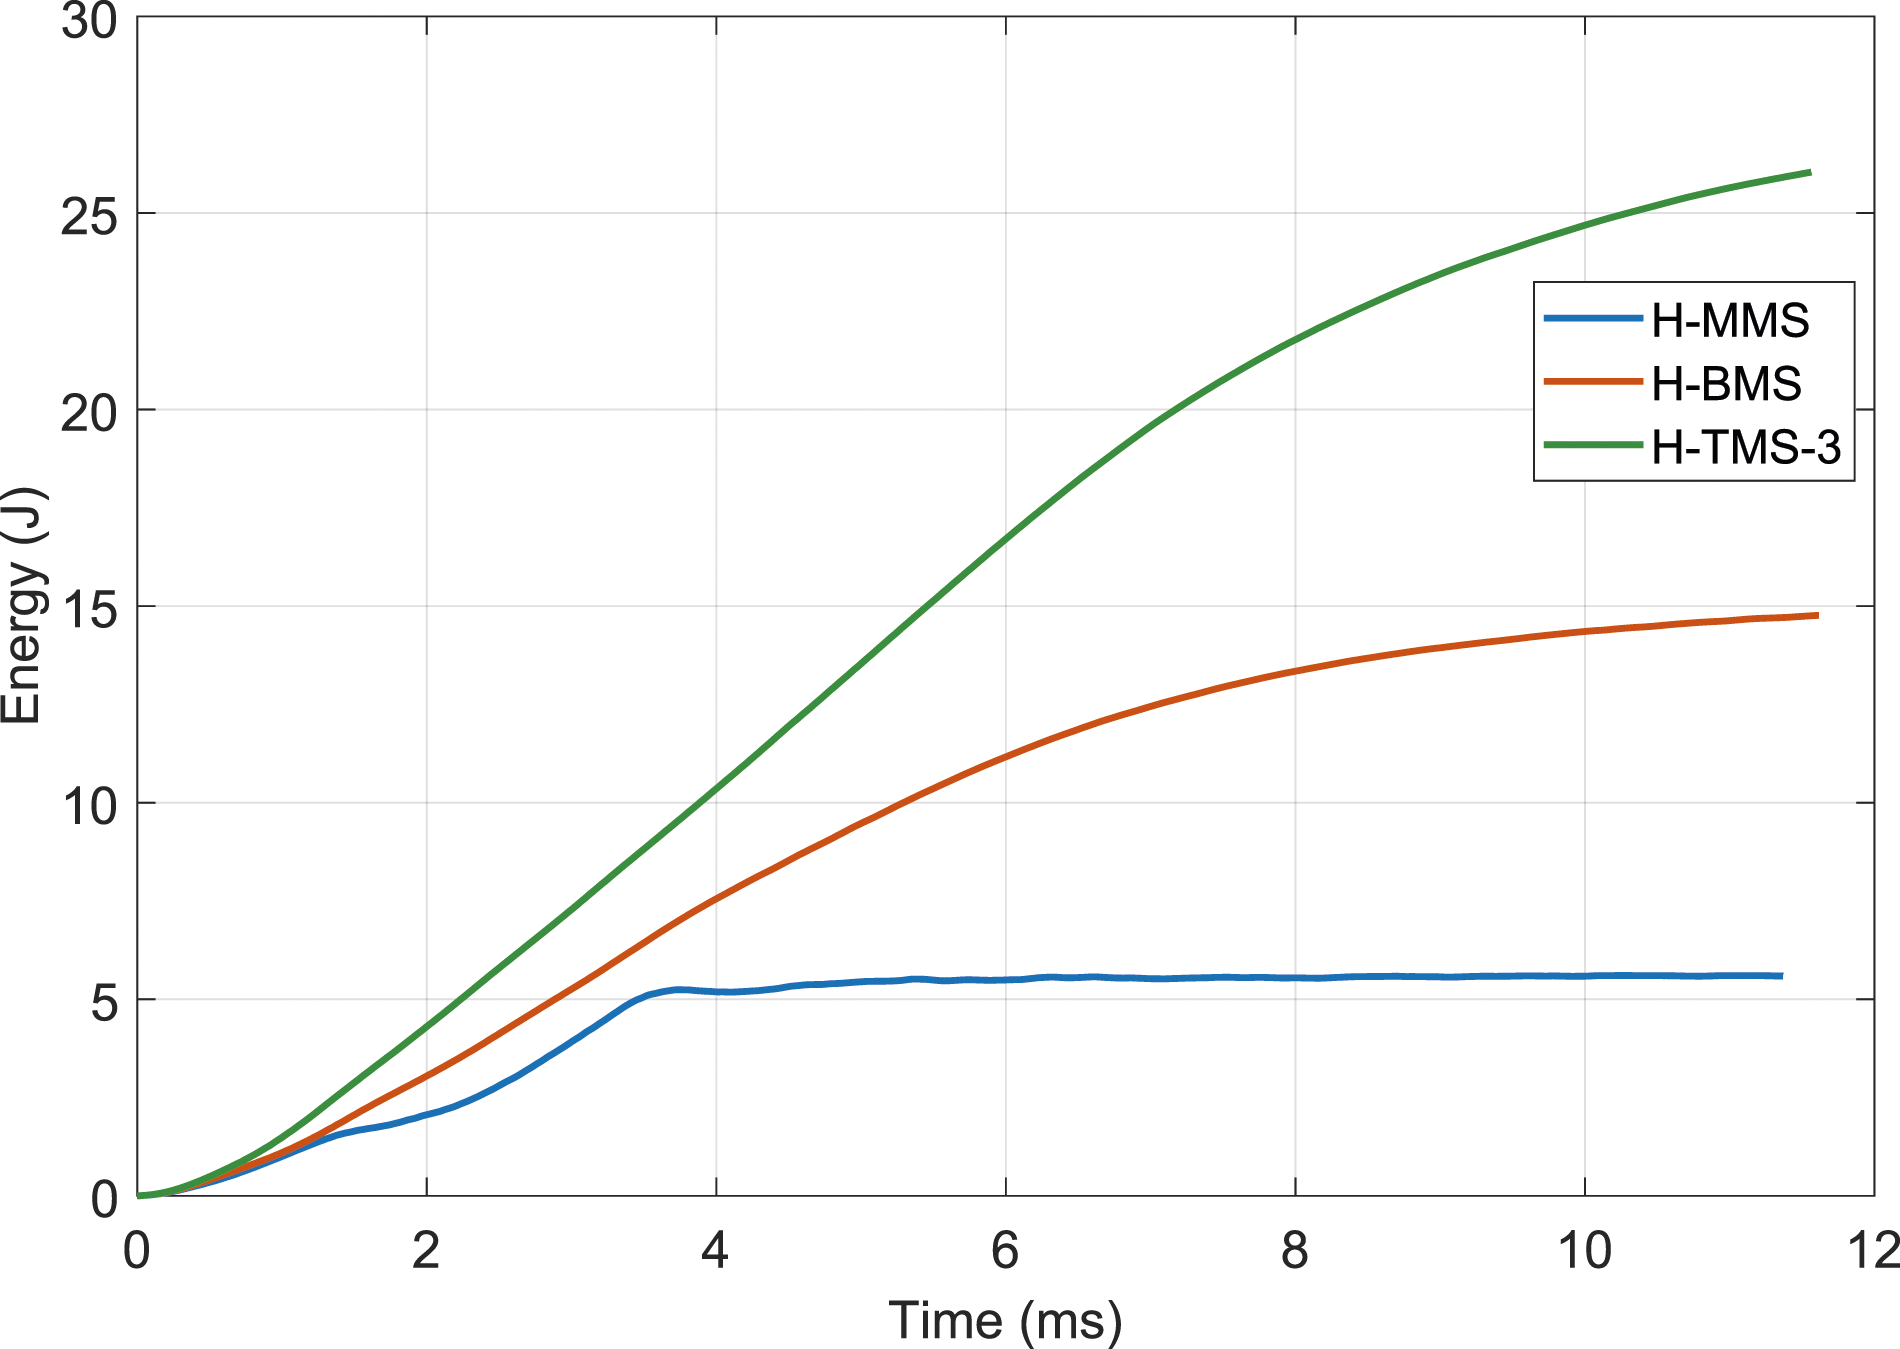
The force generated in response to the applied low-impact energy load at 75 J for MMS, BMS and TMS helmet prototype samples is shown in Figure 14. The peak force generated of MMS samples reached 948.28 N, with a corresponding absorbed energy of 5.61 J, as shown in Figure 15. The samples generated force gradually increased to reach the peak and then immediately drop to the zero-level. On the other hand, the BMS samples hold the generated force for a longer period of test time, indicating higher resistance to the applied load. BMS samples’ absorbed energy was 14.77 J, which is a 163.28% enhancement. The TMS samples generated a force of 1266.31 N, a 33.54% improvement compared to MMS. The peak absorbed energy reached 41.93 J, a 364.17% improvement compared to MMS, and a 76.30% improvement compared to BMS. Force versus time response of the helmet prototypes fabricated of MMS, BMS, and TMS, for 75 J applied impact energy. Energy versus time response of the helmet prototypes fabricated of MMS, BMS, and TMS, undergoing 75 J applied impact energy.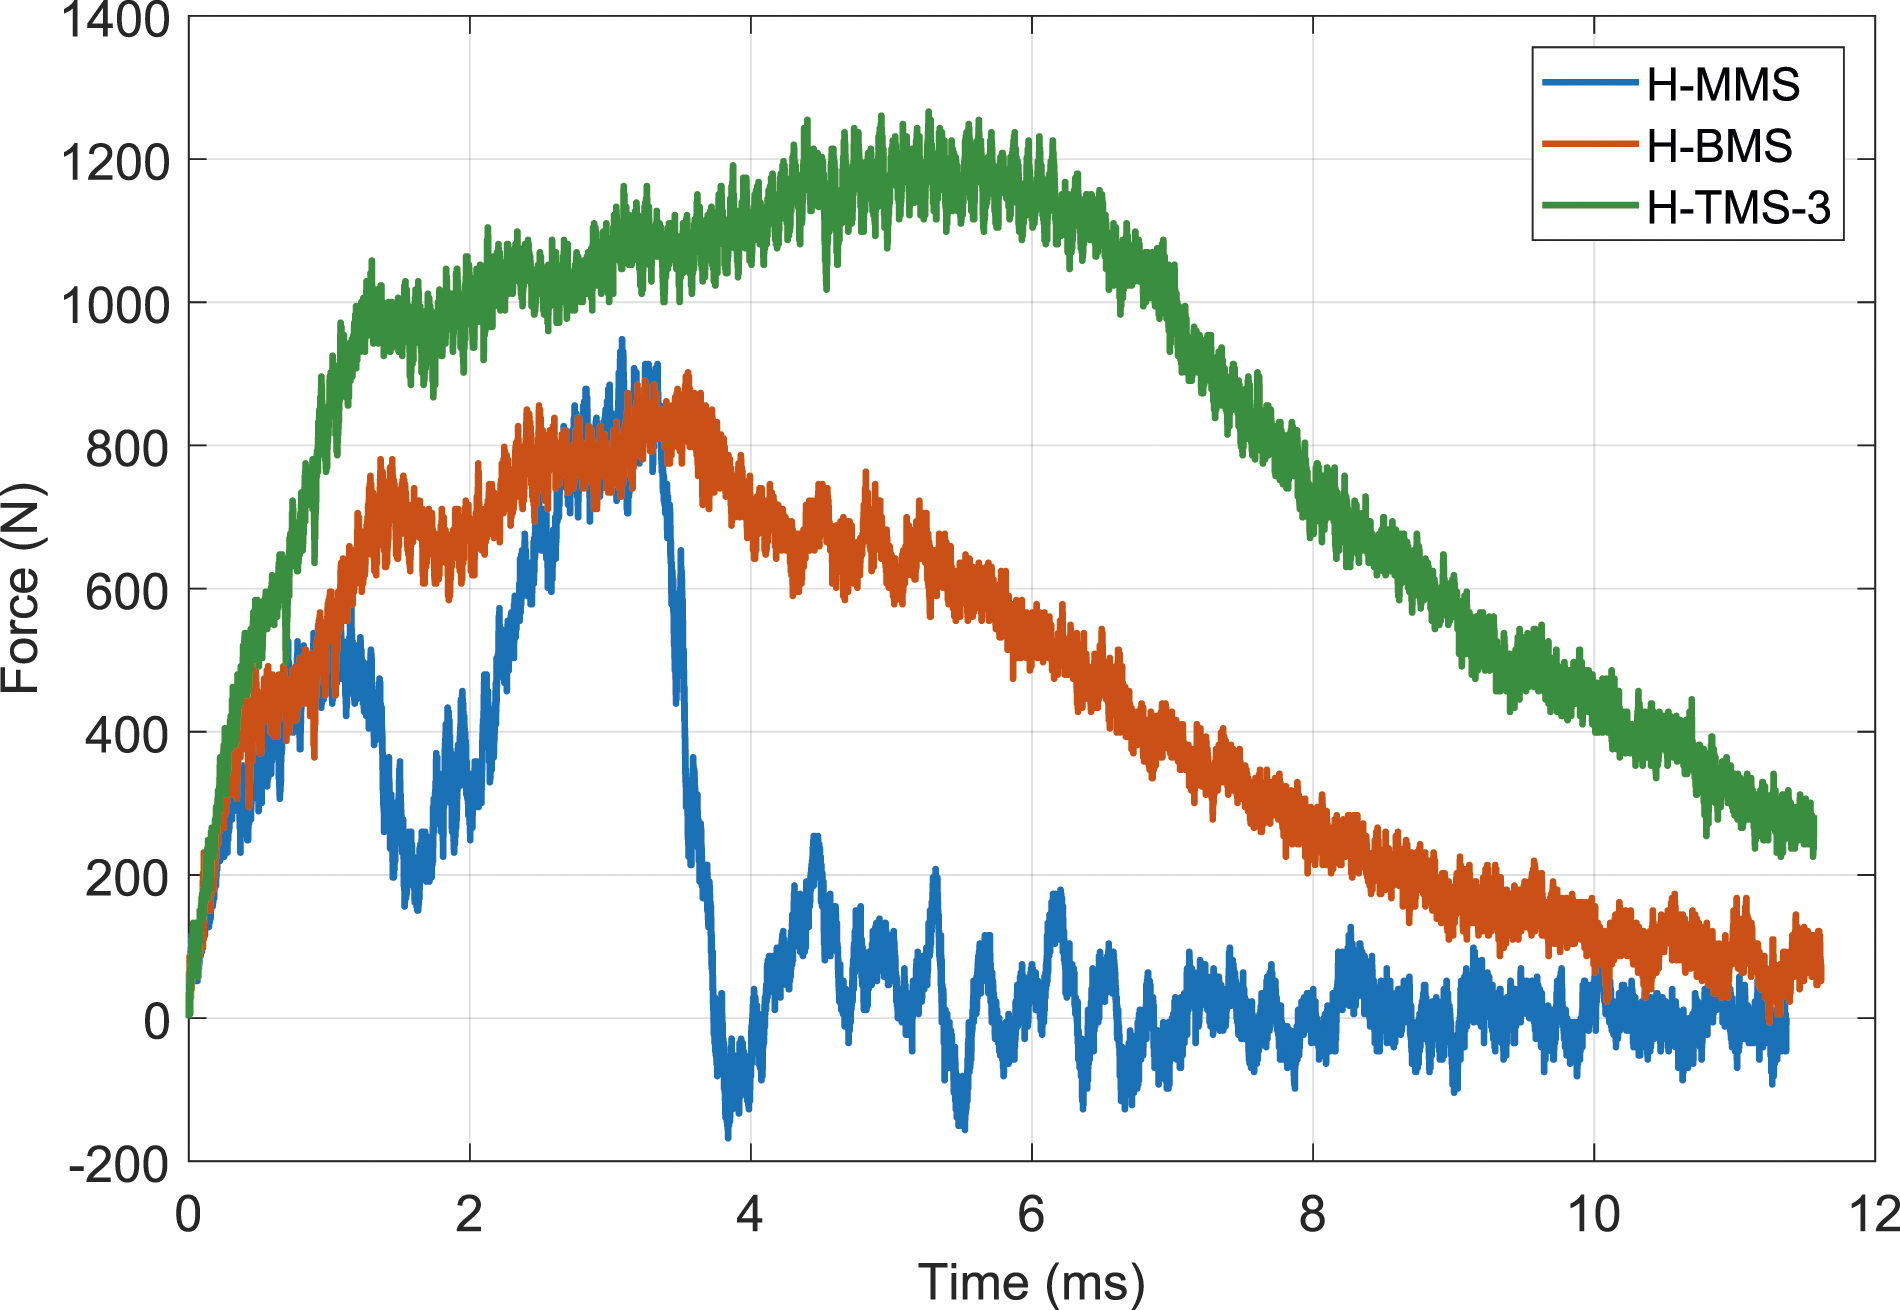
The velocity residuals of MMS, BMS and TMS helmet prototype samples were 0.078, 0.225, and 0.501 m/s, as represented in Figure 16. Correspondingly, the impactor displacement reached 33.68, 32.97, and 31.29 mm, indicating a full penetration of the samples. These results demonstrate the improvement of the adding MGFs reinforcement to the PU filling in the TMS samples, resulting in greater generated force, absorbed energy, and velocity residual. These are indicators of a higher level of resistance to the impactor movement through the samples. Such improved behavior can be of a great use in designing composite structures for real life applications. The fractured helmet prototypes samples due to undergoing the low-velocity impact test are shown in Figure 17. It is to be noted here that the discrepancy in residual velocity between the flat plates and helmet geometries at 75J impact energy underscores the complexity of real-world applications and the importance of geometry in impact resistance. Flat plates were used during the initial tests to systematically investigate the fundamental mechanical response of the composite structures under controlled and reproducible conditions. This approach allows to isolate and understand the material behavior without the additional variables introduced by complex geometries. These flat plate tests provide valuable baseline data on the material properties, such as energy absorption capacity, deformation mechanisms, and failure modes. In addition, the flat plates cannot fully replicate the performance of helmet geometries. Helmets have curved surfaces and more intricate structures that can significantly influence the impact response. The lower residual velocity observed in the helmet tests at 75J impact energy is likely due to the additional factors such as curvature and structural integrity, which enhance the energy dissipation and distribution. A summary of low-impact response characterization of MMS, BMS, and TMS helmet prototype samples demonstrated by peak generated force (N), peak absorbed energy (J), velocity residual (m/s), and displacement (mm) at peak energy. Fractured composite structure samples after the low-velocity impact test.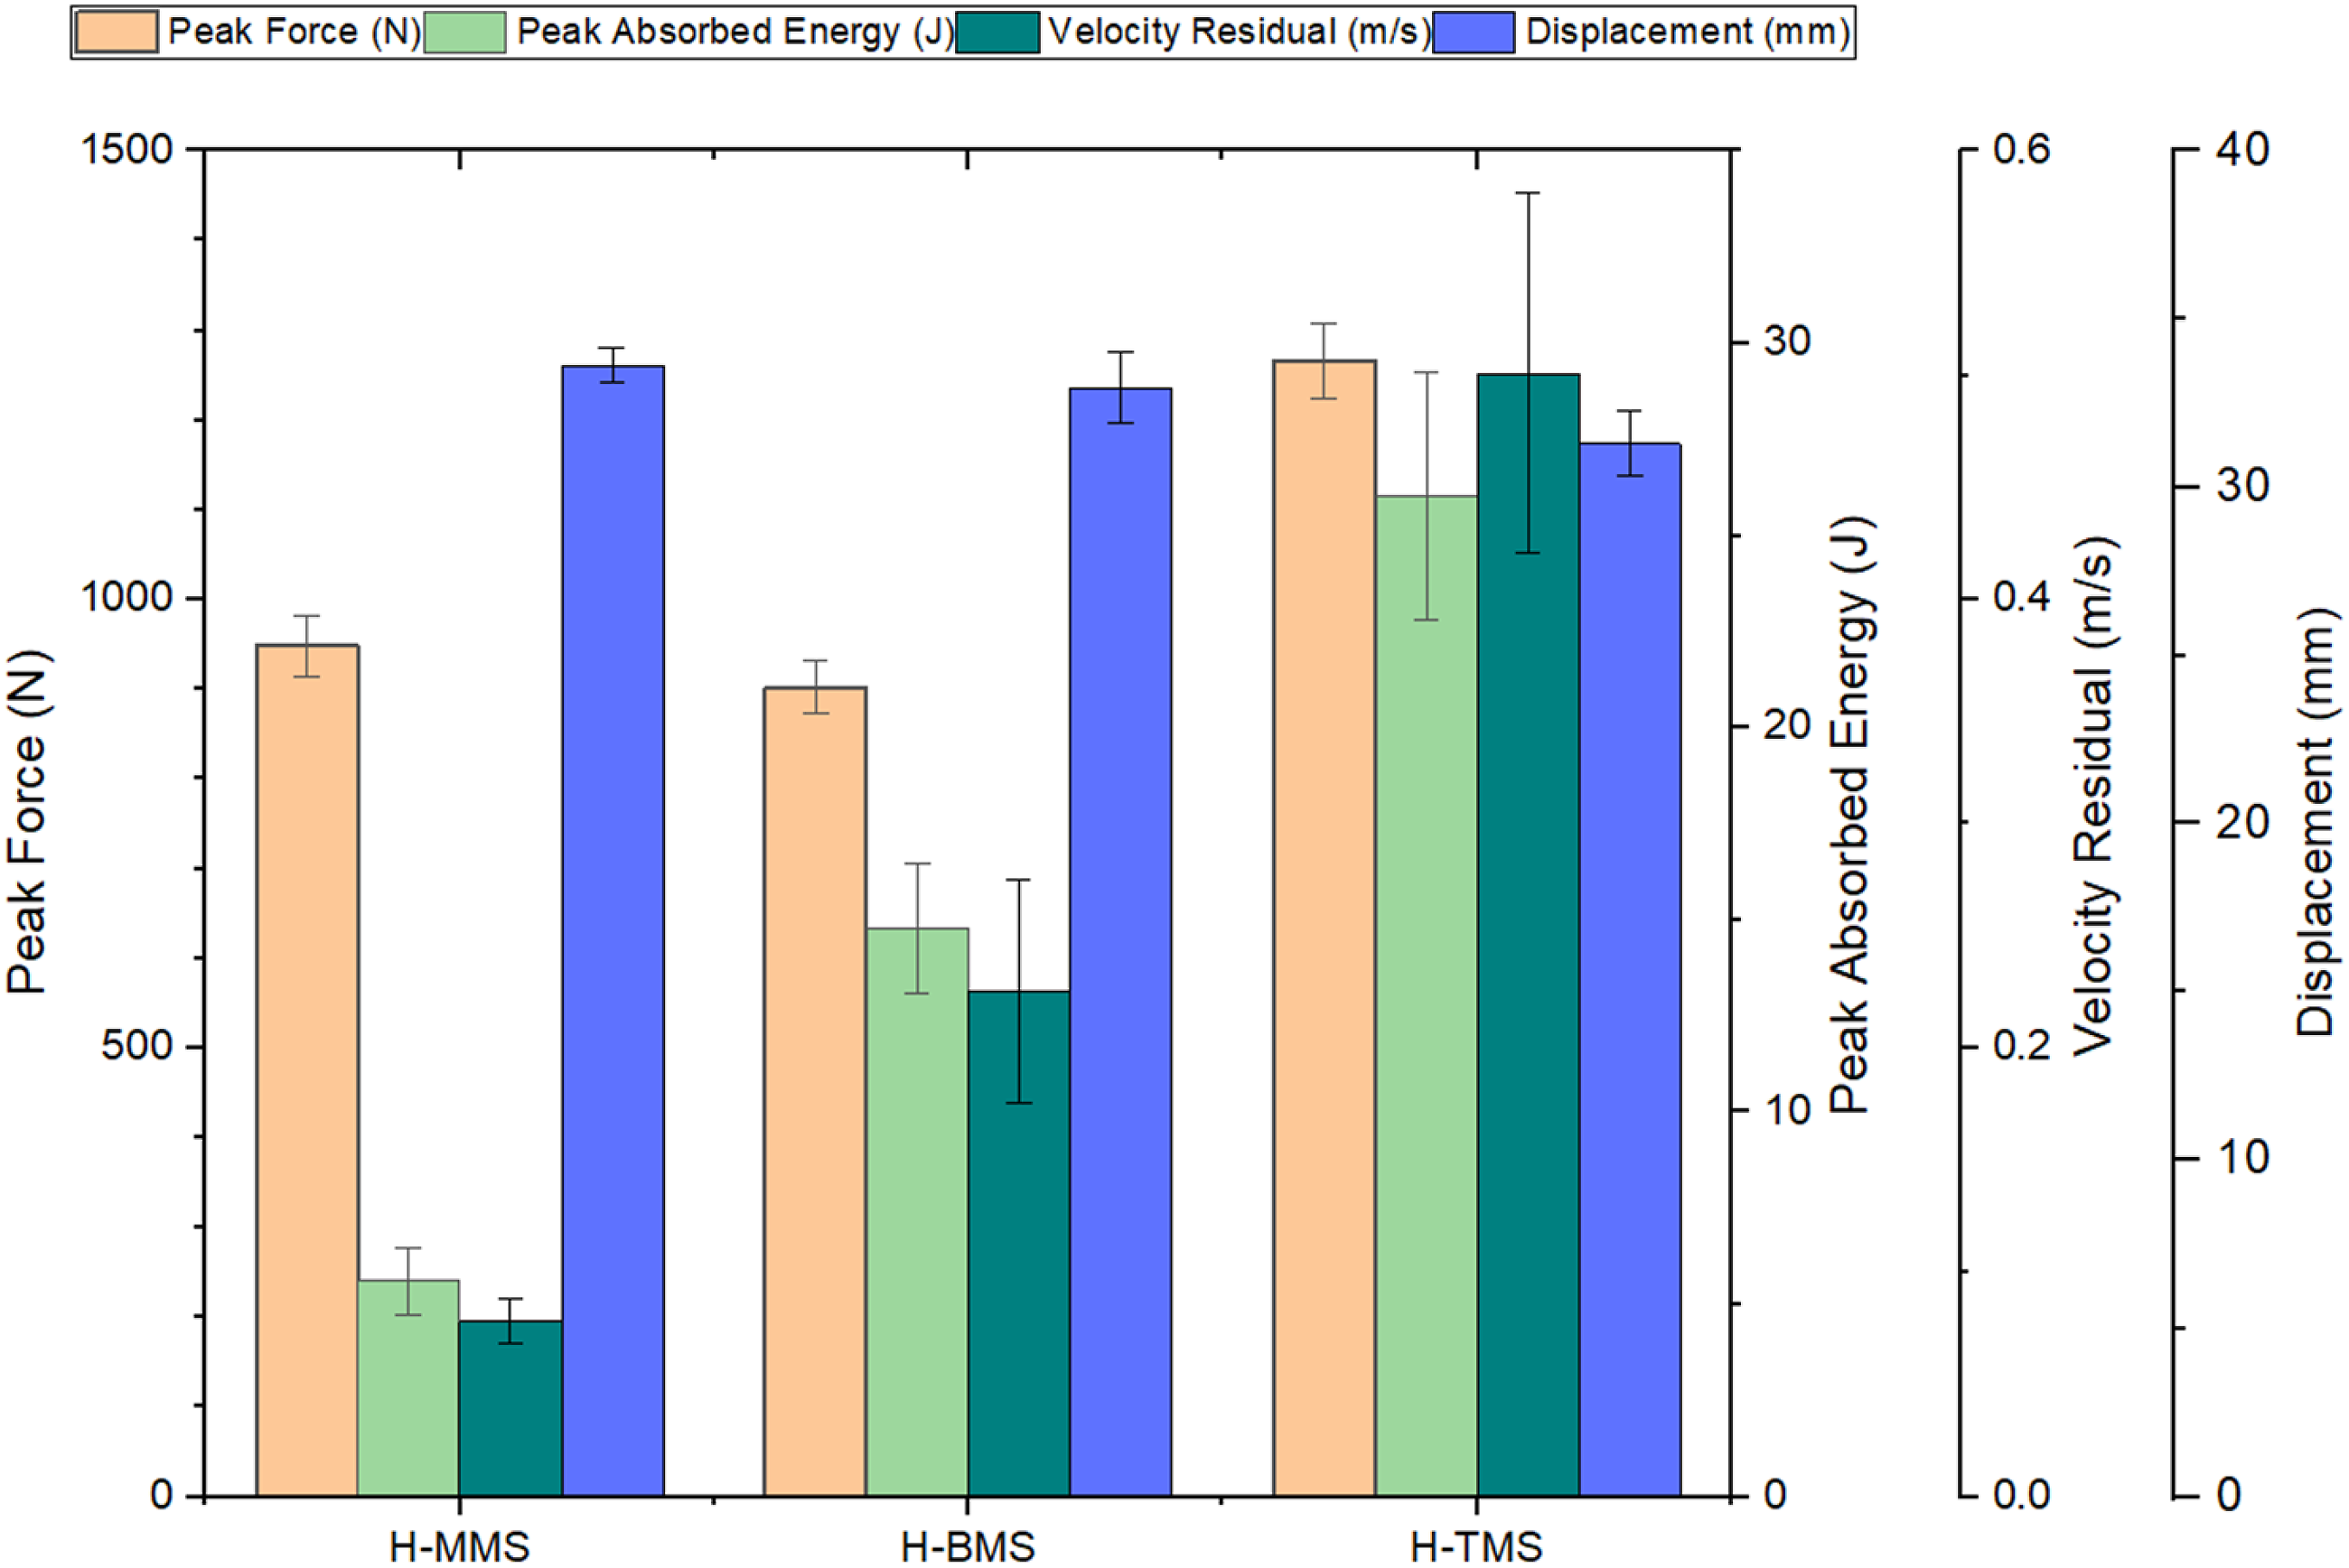
Microstructural Features Mono-, Bi, and Tri-material Composite Structure Samples
Post to conduction the low-velocity impact test, the influence of the applied load on the microstructure of MMS, BMS, and TMS samples was investigated. The demonstrated enhanced mechanical response of the TMS samples was reflected on their fractured surface, which was examined by the HRSEM. Figure 18 (a1-f2) shows the examined fractured surfaces of the low-velocity impact tested samples of MMS, BMS, and TMS. Figure 18 a1,2 shows the good adhesion between the layers of the additively manufactured PLA lattice frame. In the BMS samples, the strong bonding between the PLA and PU foams within the interface area is shown in Figure 18 b1,2. The microstructural features of TMS samples are presented in Figure 18 c1-f2. It has been shown the even distribution of MGFs content through the TMS samples’ surface. Besides, as the MGFs content increased within TMS1-4 samples, that was reflected on the density of micro-fibers shown in Figure 18 (c1-f2). The PLA and PU foams underwent brittle fracture progression due to the applied load, while MGFs suffered one of the following fracture mechanics: fiber de-bonding, fiber pullout, or fiber rupture, as presented in Figure 18 (c1-f2). The fracture modes occurred in TMS samples due to the addition of MGFs content helped in enhancing the mechanical response of the tested samples. However, if the PU foams surface was saturated with MGFs, the increasing de-bonding and pullout of fibers led to a slight drop in TMS-4 samples’ response (Figure 18 f1,2). Microscopic surface images of the fractured PLA/PU foams/MGFs samples: a1,2) MMS; b1,2) BMS; c1,2)TMS-1; d1,2) TMS-2; e1,2) TMS-3; f1,2) TMS-4.
Conclusion
The enhancement of mechanical behaviour of composite structure consisting of PLA, PU foams, and MGFs reinforcement was investigated by conducting low-velocity impact tests on the fabricated samples. The effect of MGF reinforcement content on the performance of the MMS, BMS, and TMS samples was studied, in addition to the influence of the variation of applied impact energy. The results can be summarized in the following conclusions: • TMS samples showed enhanced mechanical behaviour compared to MMS and BMS, indicating the effect of added MGFs reinforcement. • Increasing the MGF content led to an improvement in the TMS mechanical performance in response to the applied low-velocity impact load. Nonetheless, by reaching the 3.75 vol% MGFs (TMS-3), the mechanical performance started declining slightly due to the agglomerating of MGFs after reaching saturation. • Varying the applied impact energy showed the capacity of TMS samples to effectively absorb the applied energy before suffering a partial or full fracture. • The applicability of the enhanced TMS composite was tested on a helmet prototype and compared to MMS and BMS. Results showed improved performance compared to the other composite structures.
Footnotes
Author contributions
Declaration of conflicting interests
The author(s) declared no potential conflicts of interest with respect to the research, authorship, and/or publication of this article.
Funding
The author(s) received no financial support for the research, authorship, and/or publication of this article.
Data availability statement
The experimental datasets obtained from this research work and then the analyzed results during the current study are available from the corresponding author on reasonable request.