
Abstract
In this study, we present the optical, electrical, dielectric, and mechanical properties of nanocomposite films containing different inorganic filler content. Starch is used as the biopolymer while the carbonate intercalated Mg-Al layered double hydroxide (LDH) is used as the inorganic filler. X-ray diffraction (XRD), Fourier transform infrared spectroscopy (FT-IR), scanning electron microscopy (SEM), and energy dispersive X-ray analysis (EDS) are used to characterize and evaluate the dispersion of LDH in the biopolymer matrix. Increasing the filler content was found to improve the optical properties by increasing the light absorption coefficients, reducing the optical gap energy and increasing the refractive index. Improved dielectric properties were demonstrated by the significant decrease in the dielectric energy dissipation with increasing filler content. In addition, mechanical properties were enhanced by increasing the Young’s modulus when the filler content reached 5 wt %.
Keywords
Introduction
In recent years, the use of clays/polymer composite films has increased considerably due to their properties resulting from the mixing of both the effect of the organic matrix (bio-polymer) and that of the inorganic one (clay) making them applicable in several fields such as the environment,1,2 electrochemistry, 3 protective clothing, optical devices and aerospace. 4
Organic polymers are non-degradable, which poses a real threat for the environment. Researchers and industrialists are therefore seeking to replace them with biodegradable, 5 biocompatible and environmentally friendly polymers, known as biopolymers. Depending on their vegetable or animal origin, there are several types of biopolymers, such as cellulose, starch, chitosan, agar-agar, chitin, alginate6,7 etc.
Starch is a polysaccharide compound composed of glucose units (C6H12O6). 8 Recently, it has been considered as a promising material in various sectors, especially in the paper industry and in the production of biofuels. 9 Starch can be obtained from different plant sources such as potato, corn, wheat, waxy corn, rice, pea and cassava. 10 The availability of sources, low cost and simple preparation process have made starch a popular, non-toxic, biodegradable biopolymer,11,12 used in pharmacy, 13 cosmetic 14 and textile. 15
Nanocomposites can be defined as materials composed of an inorganic matrix (charge) and an organic one (biopolymer). Their properties are given by the synergistic effect resulting from the nature of the interfacial interactions between the two matrices. The development of film-based nanocomposites is of great interest to industry, especially for the production of renewable and biodegradable plastics, such as those using starch as a biopolymer.16–18
Clays are among the various nanoparticles used to reinforce polymer matrices. 19 They are becoming increasingly popular with industrialists due to their high impermeability, low cost, and environmentally-friendliness. In addition, clays have a lamellar structure that enhances their potential by improving barrier properties to gases such as CO2 and O2, as well as fire resistance. Clays also possess desirable mechanical, 20 optical, and dielectric properties. 21
Recently, clay/polymer-based nanocomposites have attracted many researchers and industrialists due to their flexibility and easy dispersion in the biopolymers which can improve the nanocomposite properties. We can cite reports in the literature dealing with the mechanical properties of clay-doped polymer composites. Chen and Evans investigated the mechanical properties of clay/Starch composites, 17 Ghanaatian et al. I,vestigated the mechanical properties and drug release rate of PVA/poly (ethylene glycol)/clay (montmorillonite) nanocomposites. 22 Other nanocomposites are obtained by dispersing Zn-Al based anionic clay in poly (butylene succinate) and have demonstrated interesting rheological properties. 23
Anionic clays also called layered double hydroxides (LDH) can be described by the general formula:
These clays (LDH) are of great interest due to their low preparation cost and the possibility of modifying of their physicochemical properties by inserting different inorganic and organic anions in the interlayer space, 23 making them useful in several fields such as catalysis, 24 environment25–27 corrosion, electrochemistry, 27 medicine, 28 etc.
Moreover, the aim of this work is to investigate the electrical, dielectric, optical, and mechanical properties of LDH/starch nanocomposite films synthesized with different LDH content. Therefore, we have to identify the optimal amount of LDH particles required to produce high performance starch films for optoelectronics. The choice of this type of nanocomposite films is based on the fact that are non-toxic, flexible, biodegradable and environmentally friendly. Indeed, in this work, carbonate intercalated Mg-Al LDH phases are the anionic clays used which are synthesized by the co-precipitation method. Subsequently, the solution casting method was used to prepare films of LDH/starch nanocomposites films. X-ray diffraction (XRD), Fourier transform infrared spectroscopy (FTIR), Scanning electron microscopy (SEM), and Energy dispersive X-ray analysis (EDS) are used to confirm the preparation of nanocomposites films and the dispersion of LDH in the polymer matrix. In addition, UV-visible (UV-Vis) spectroscopy has been used to analyze the optical properties, with particular emphasis on the energetic band gap. Impedance spectroscopy is used to evaluate the electrical and dielectric properties of the nanocomposite films. In addition, tensile testing is used to determine the Young’s modulus to assess the mechanical properties.
Materials and methods
Materials
All reagents were supplied by Sigma Aldrich: Potato Starch (C6H10O5)n, glycerol (p ≥ 99.5%), MgCl2, 6 H2O (p ≥ 99%); AlCl3, 6 H2O (p ≥ 98%); NaOH pastilles (p ≥ 98%) and Na2CO3, 10 H2O (p ≥ 99%).
Synthesis
Synthesis of LDH (inorganic matrix)
Carbonate intercalated Mg–Al LDH was synthesized by the coprecipitation method at a constant pH as it’s described elsewhere.
29
Metallic salts of (MgCl2. 6H2O) and (AlCl3. 6H2O) (R = Mg/Al = 3) were dissolved in the distilled water. Under stirring, the pH of the reaction mixture was kept constant at 10.0 by adding a solution of NaOH (0.8 M) and Na2CO3 (0.2 M). Once the addition of salts was completed, the reaction mixture was aged at room temperature for 24 h. The resulting sludge (LDH) was filtered and washed with distilled water and then dried at 50°C for 48 h. Figure 1(a) shows the process of preparing the inorganic matrix. Synthesis of layered double hydroxide (LDH) (a) and LDH/starch nanocomposite films (b).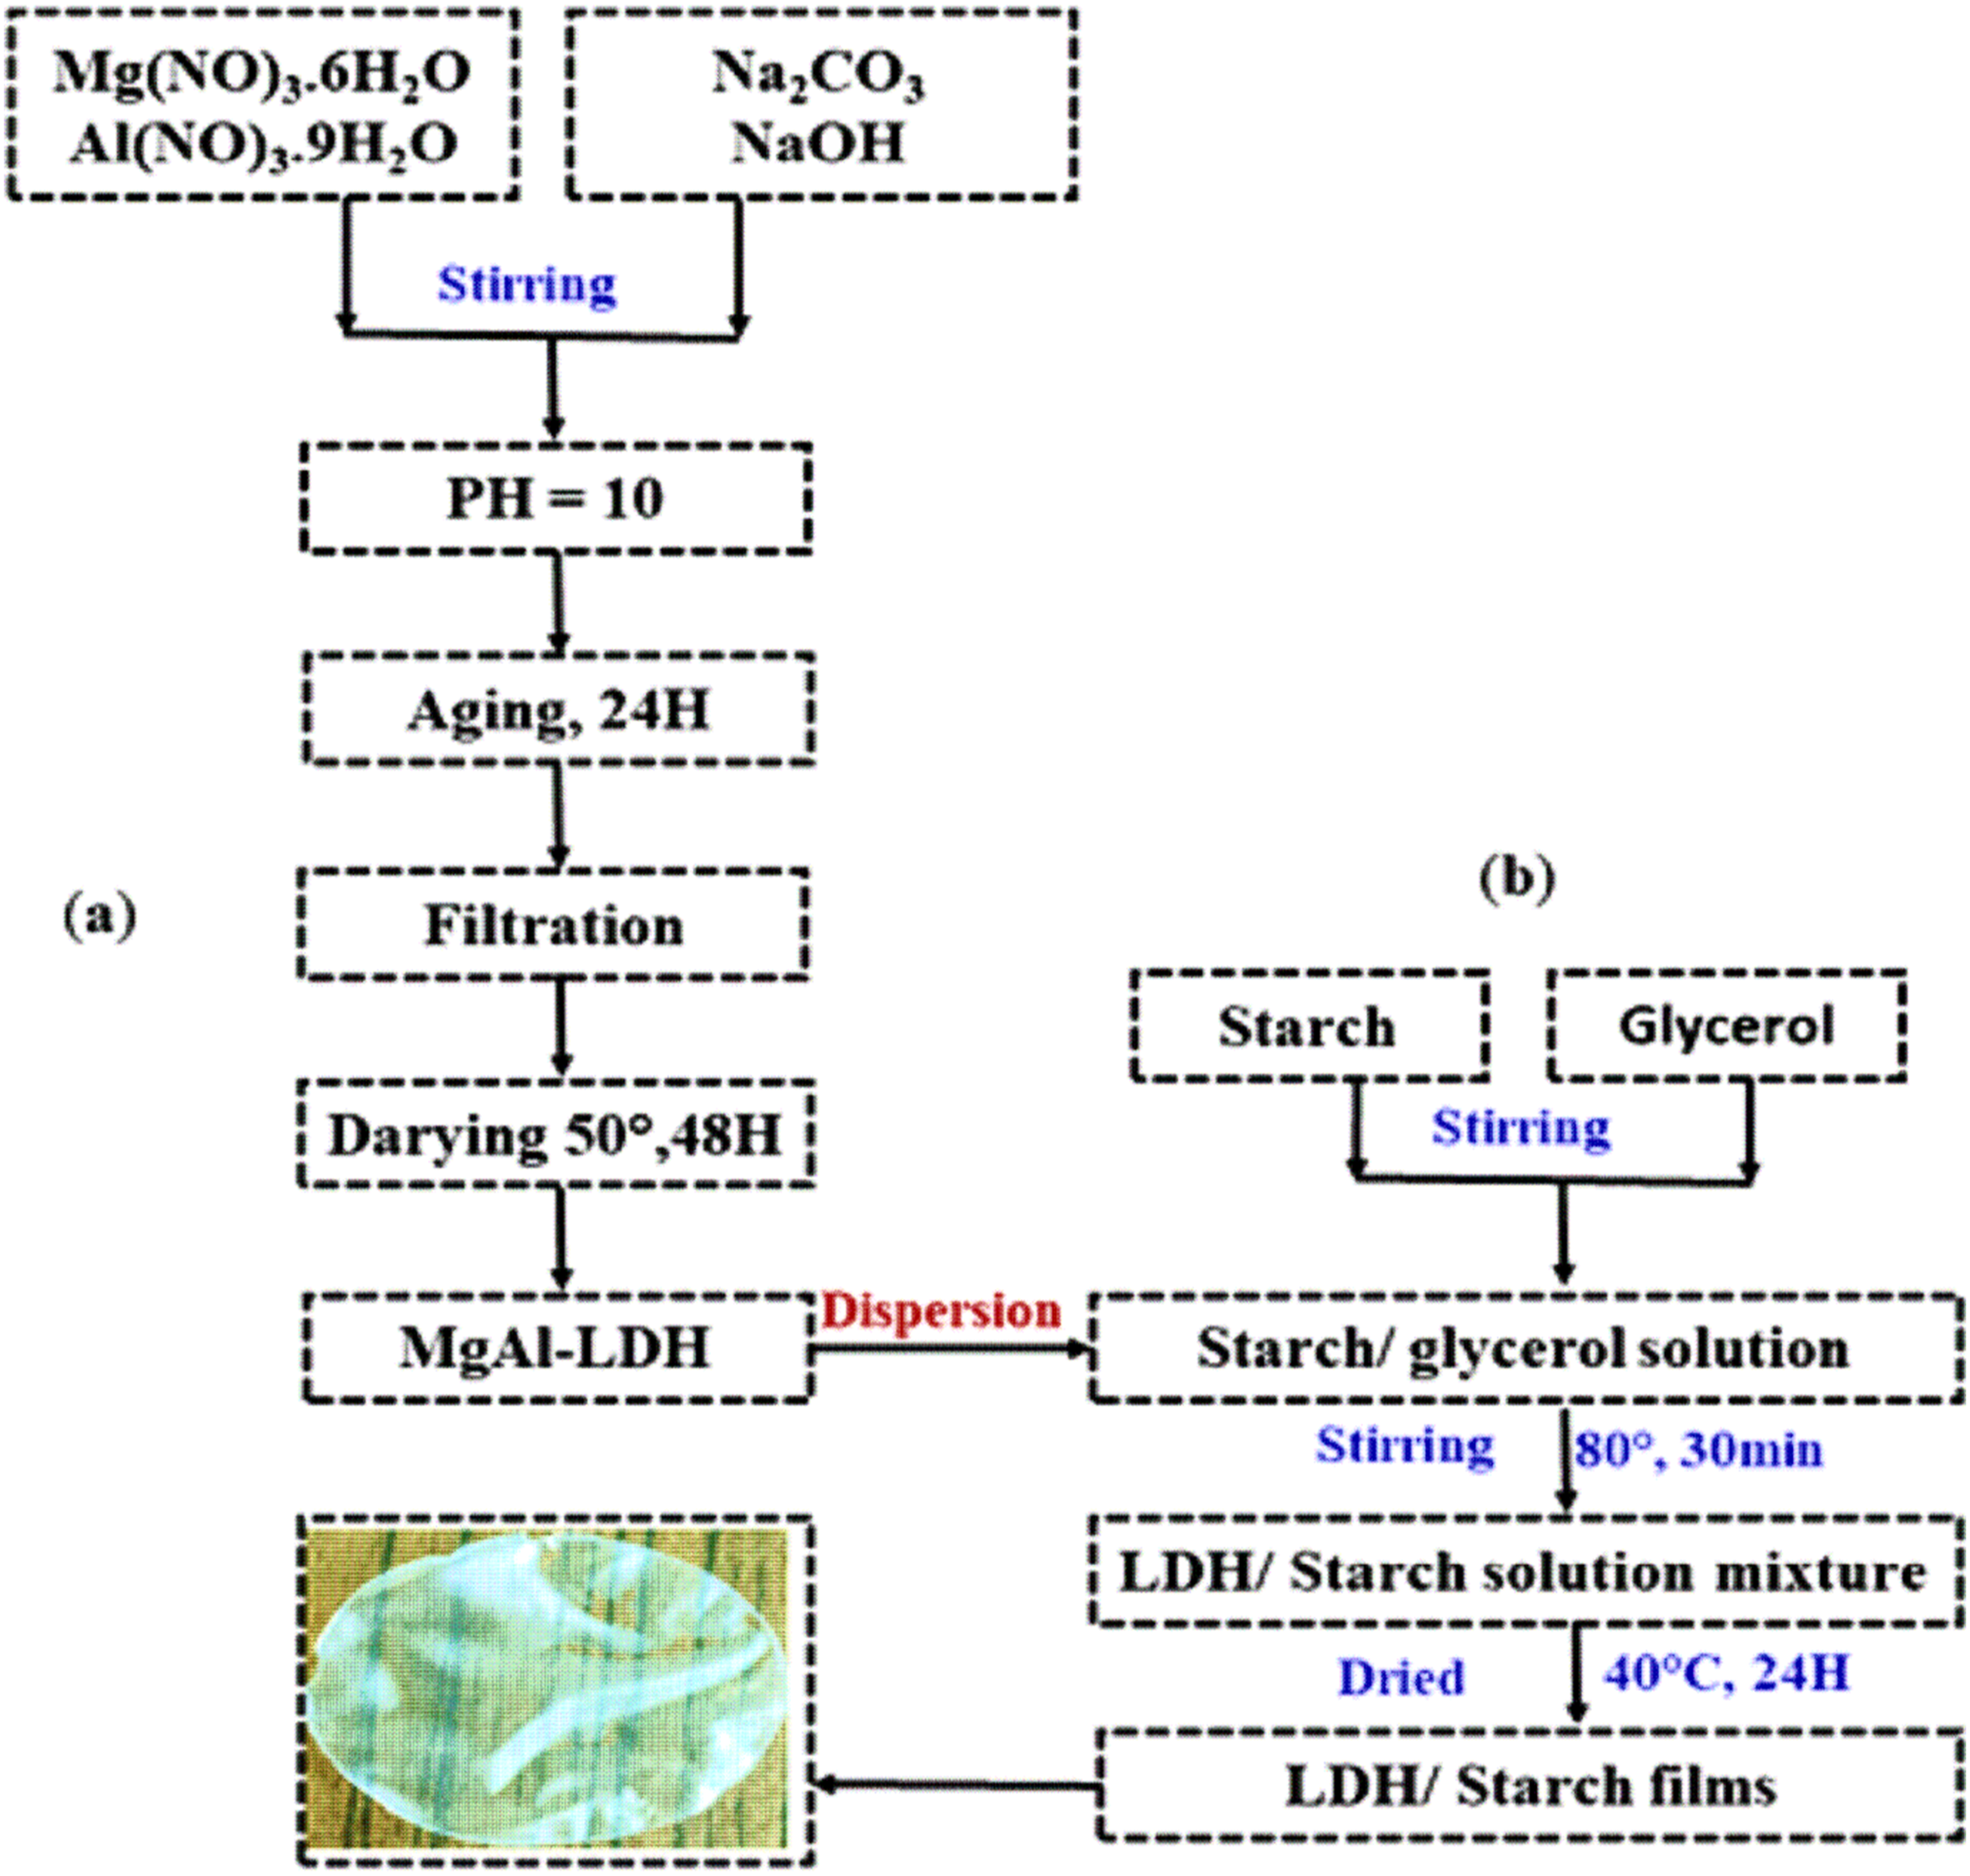
Synthesis of nanocomposite films
LDH/starch based nanocomposite films were prepared by the solution casting method using glycerol as a plasticizing agent according to previous work. 30 In fact, different concentrations of charge (LDH) were mixed with LDH/starch = 1 wt %, 3 wt %, 5 wt % and 7 wt %. After adding the glycerol, the resulting suspension was heated in water at 80°C and stirred for 30 min. The mixture was then poured into Petri dishes, dried at 40°C for 24 h and finally cooled to room temperature. Figure 1(b) shows the process of preparing the nanocomposite films.
Characterization
XRD analysis was performed using a D8 BRUKER-AXS diffractometer and Cu-Kα radiation (2θ range of 5°–70°). FT-IR spectra were obtained with a Nicolet iS10 Thermo Fisher instrument, collecting 16 scans with a resolution of 4 cm−1 in the range of 500–4000 cm−1. The morphology of all the nanocomposite films was studied using a Hirox SH-5500P scanning electron microscope (SEM). The elemental mapping was performed using an X-ray energy dispersive spectrometer (EDXS) integrated with the SEM (Bruker, XFlash 6 detector). Optical measurements were carried out in the 200-1000 nm range using a Shimadzu UV-160A spectrophotometer. Mechanical tests were then carried out using an MTS Criterion machine. Electrical measurements were made at 25°C, 68% relative humidity, and 0.8 V amplitude using a Solartron Analytical Modulab MTS instrument in the frequency range [1-106] Hz. The powder sample was compressed and placed between two parallel copper electrodes, which were adjusted to provide the sample’s thickness using a micrometer. The powder sample was compressed and placed between two parallel copper electrodes, which were adjusted to the thickness of the sample using a micrometer. Zview2.2 and Origin 9 softwares were used for data analysis.
Results and discussions
Characterization
X–ray diffraction
To confirm the presence of the inorganic matrix (LDH) and biopolymer (starch), all LDH/starch films were characterized by XRD and are reported in Figure 2. The diffractogram of starch (Figure 2(a)) is presented as a quasi-amorphous form,
31
with the appearance of some characteristic peaks such as the one at 19.6°, corresponding to the formation of amylose-lipid complex present in the starch.
32
An additional peak at 16.7° was also observed and is attributed to the retrogradation of amylose.
33
Furthermore, the X-ray diffractogram of the LDH matrix (Figure 2(b)) shows the appearance of the characteristic peaks (003) and (110).34,35 The angular positions of (003) and (110) give the values of the parameters c and a, respectively, according to the formulas: X-ray diffractograms of starch (biopolymer) (a) LDH (charge) (b) and synthesized nanocomposite films (c).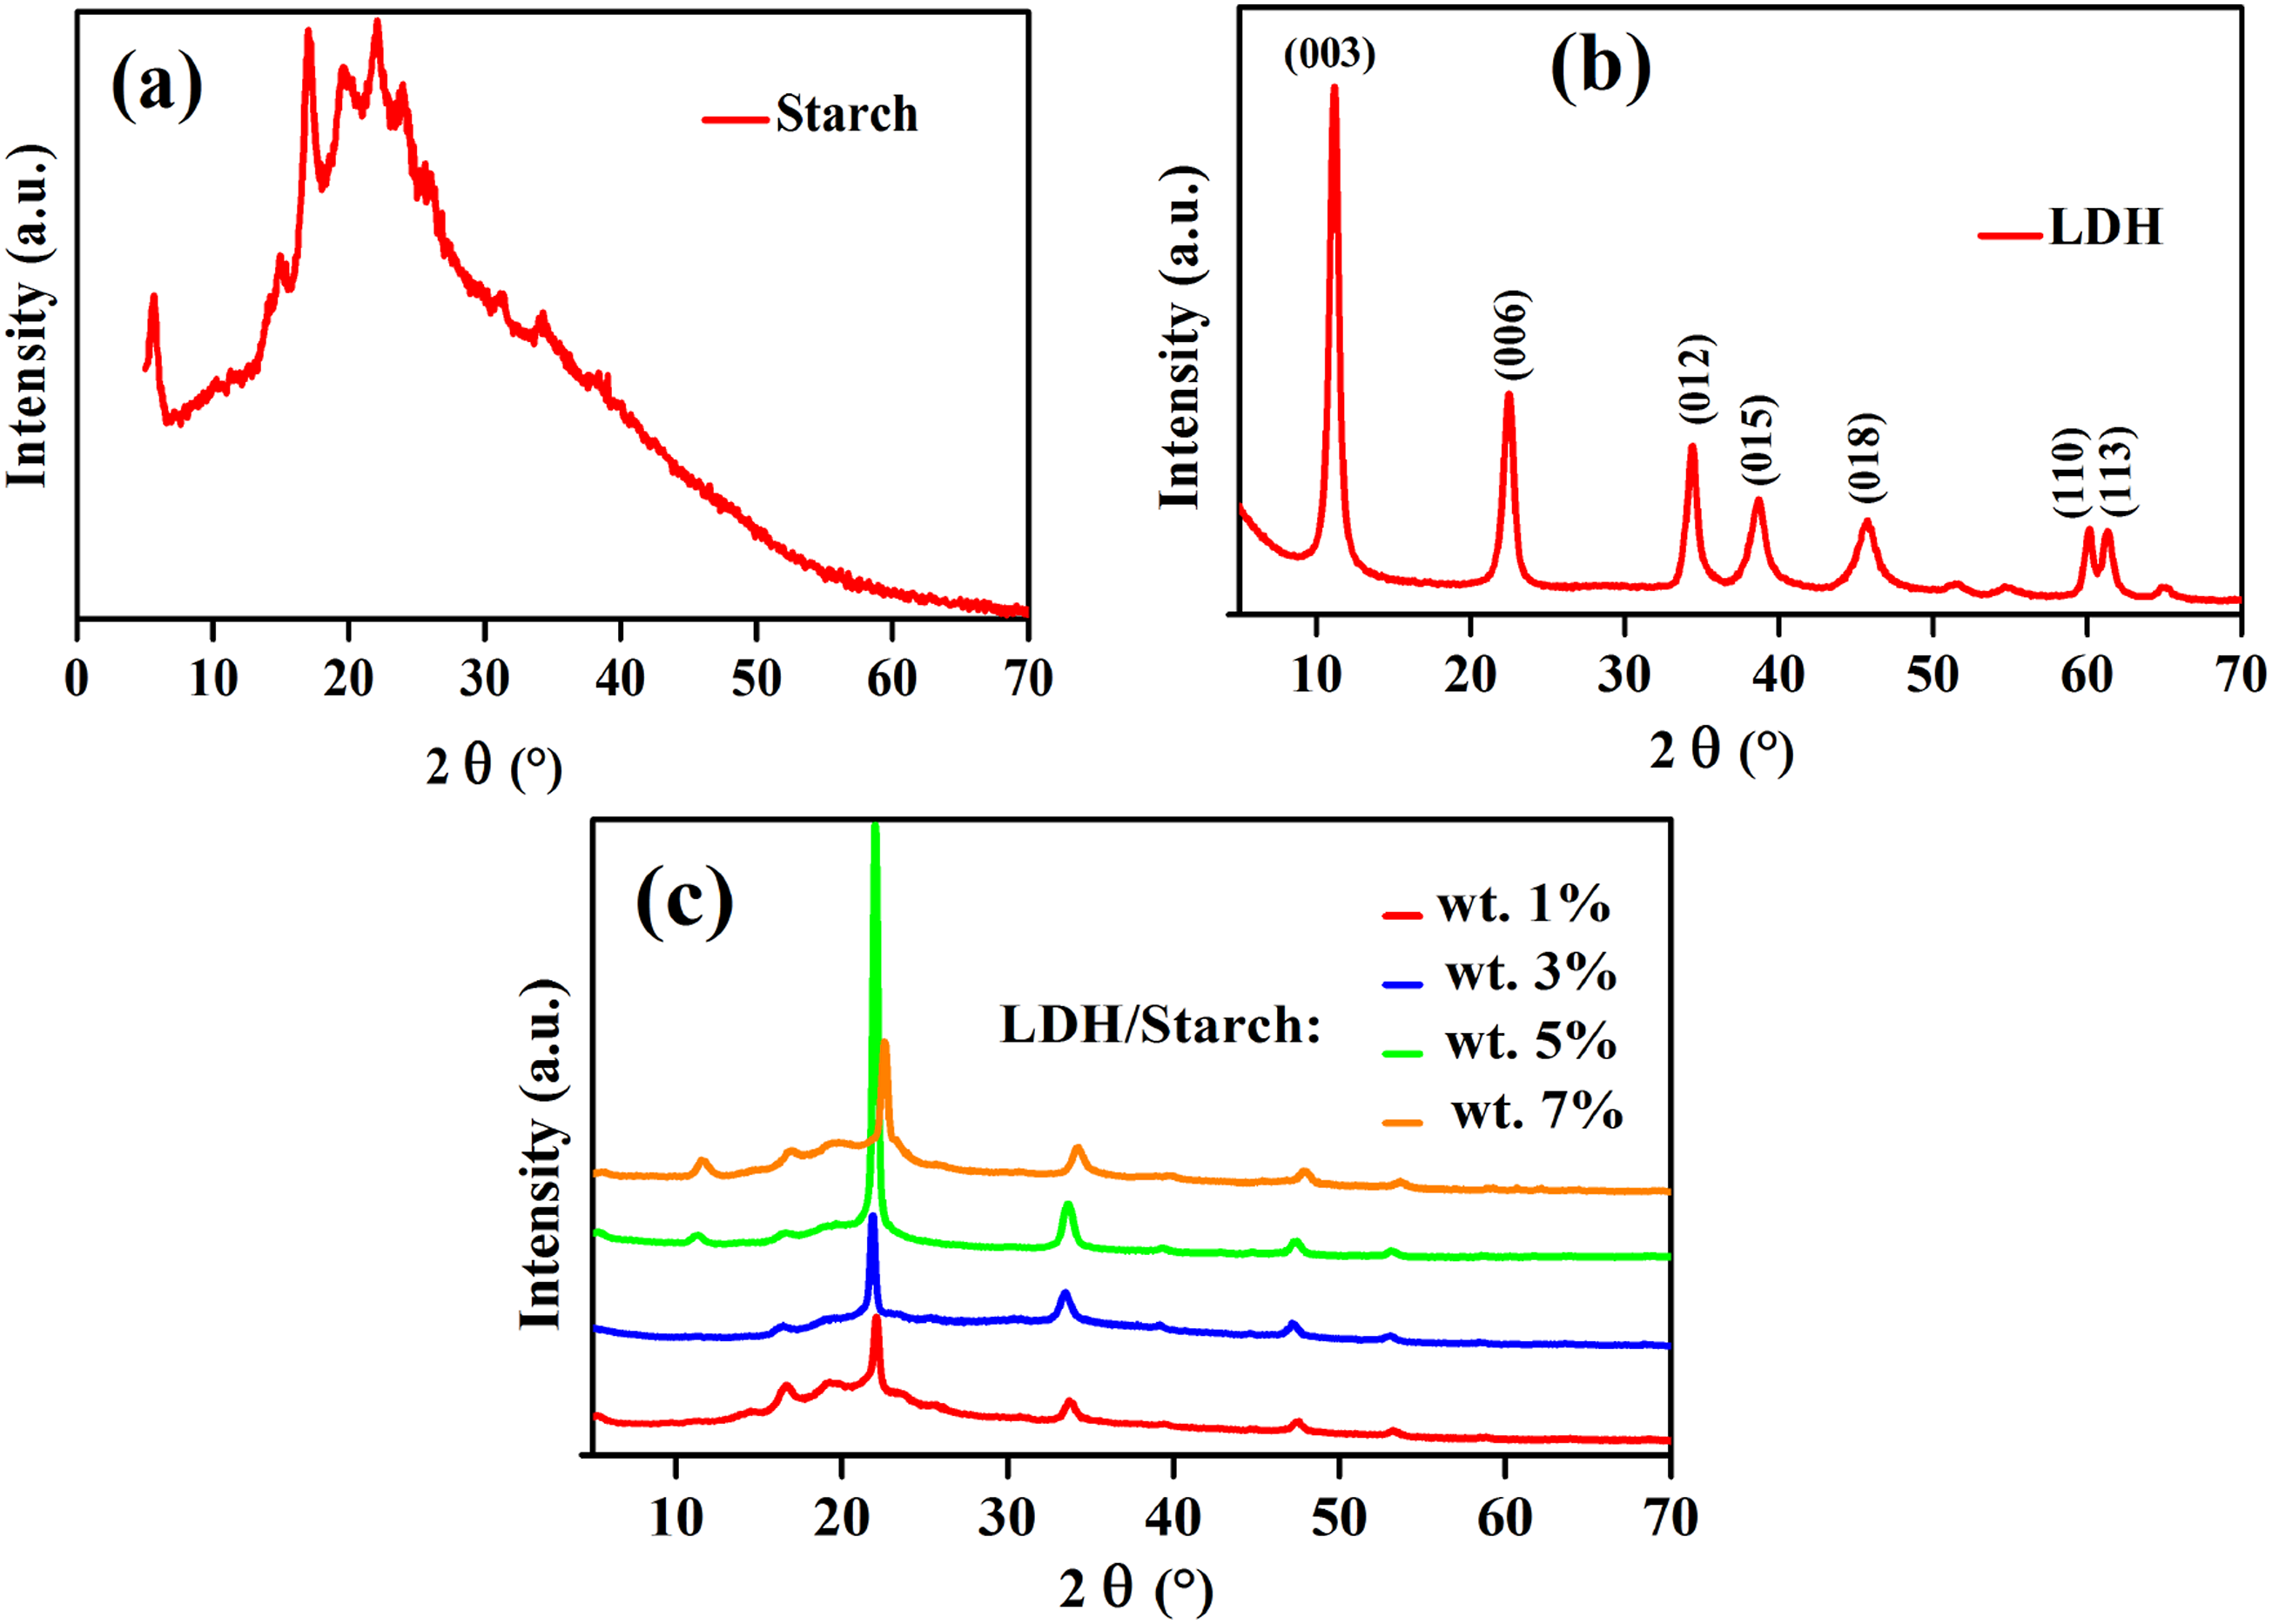


The X-ray diffractograms of nanocomposite films (Figure 2(c)) clearly show a shift of the peaks towards the low Bragg angles from 0 to 5 wt% LDH content, and a disappearance of (003) and (110) peaks of LDH, indicating a well dispersion of LDH in the starch. However, the intensity of the peak assigned at 23.1° increases up to 5 wt % of LDH content beyond which it decreases to 7 wt % indicating again a dispersion of LDH in the biopolymer.
Fourier transform infrared spectroscopy (FT–IR)
The FT–IR spectrum of LDH (Figure 3(a)) shows the different expected bands that are commonly observed in LDH materials. The wide band at 3482.2 cm−1 corresponds to the stretching mode of the OH group ν(OH). Around 1639.09 cm−1 appears the angular deformation band of the water molecule δ(H2O).
36
The intense band characteristic of the carbonate ion ν3(CO32–) appears at 1380.3 cm−1.
36
Between 400 and 800 cm−1 there are M–OH and M–O bands with M corresponds to the metal cation present in the brucite layer.
37
FT–IR of LDH matrix (a) and nanocomposite films (b).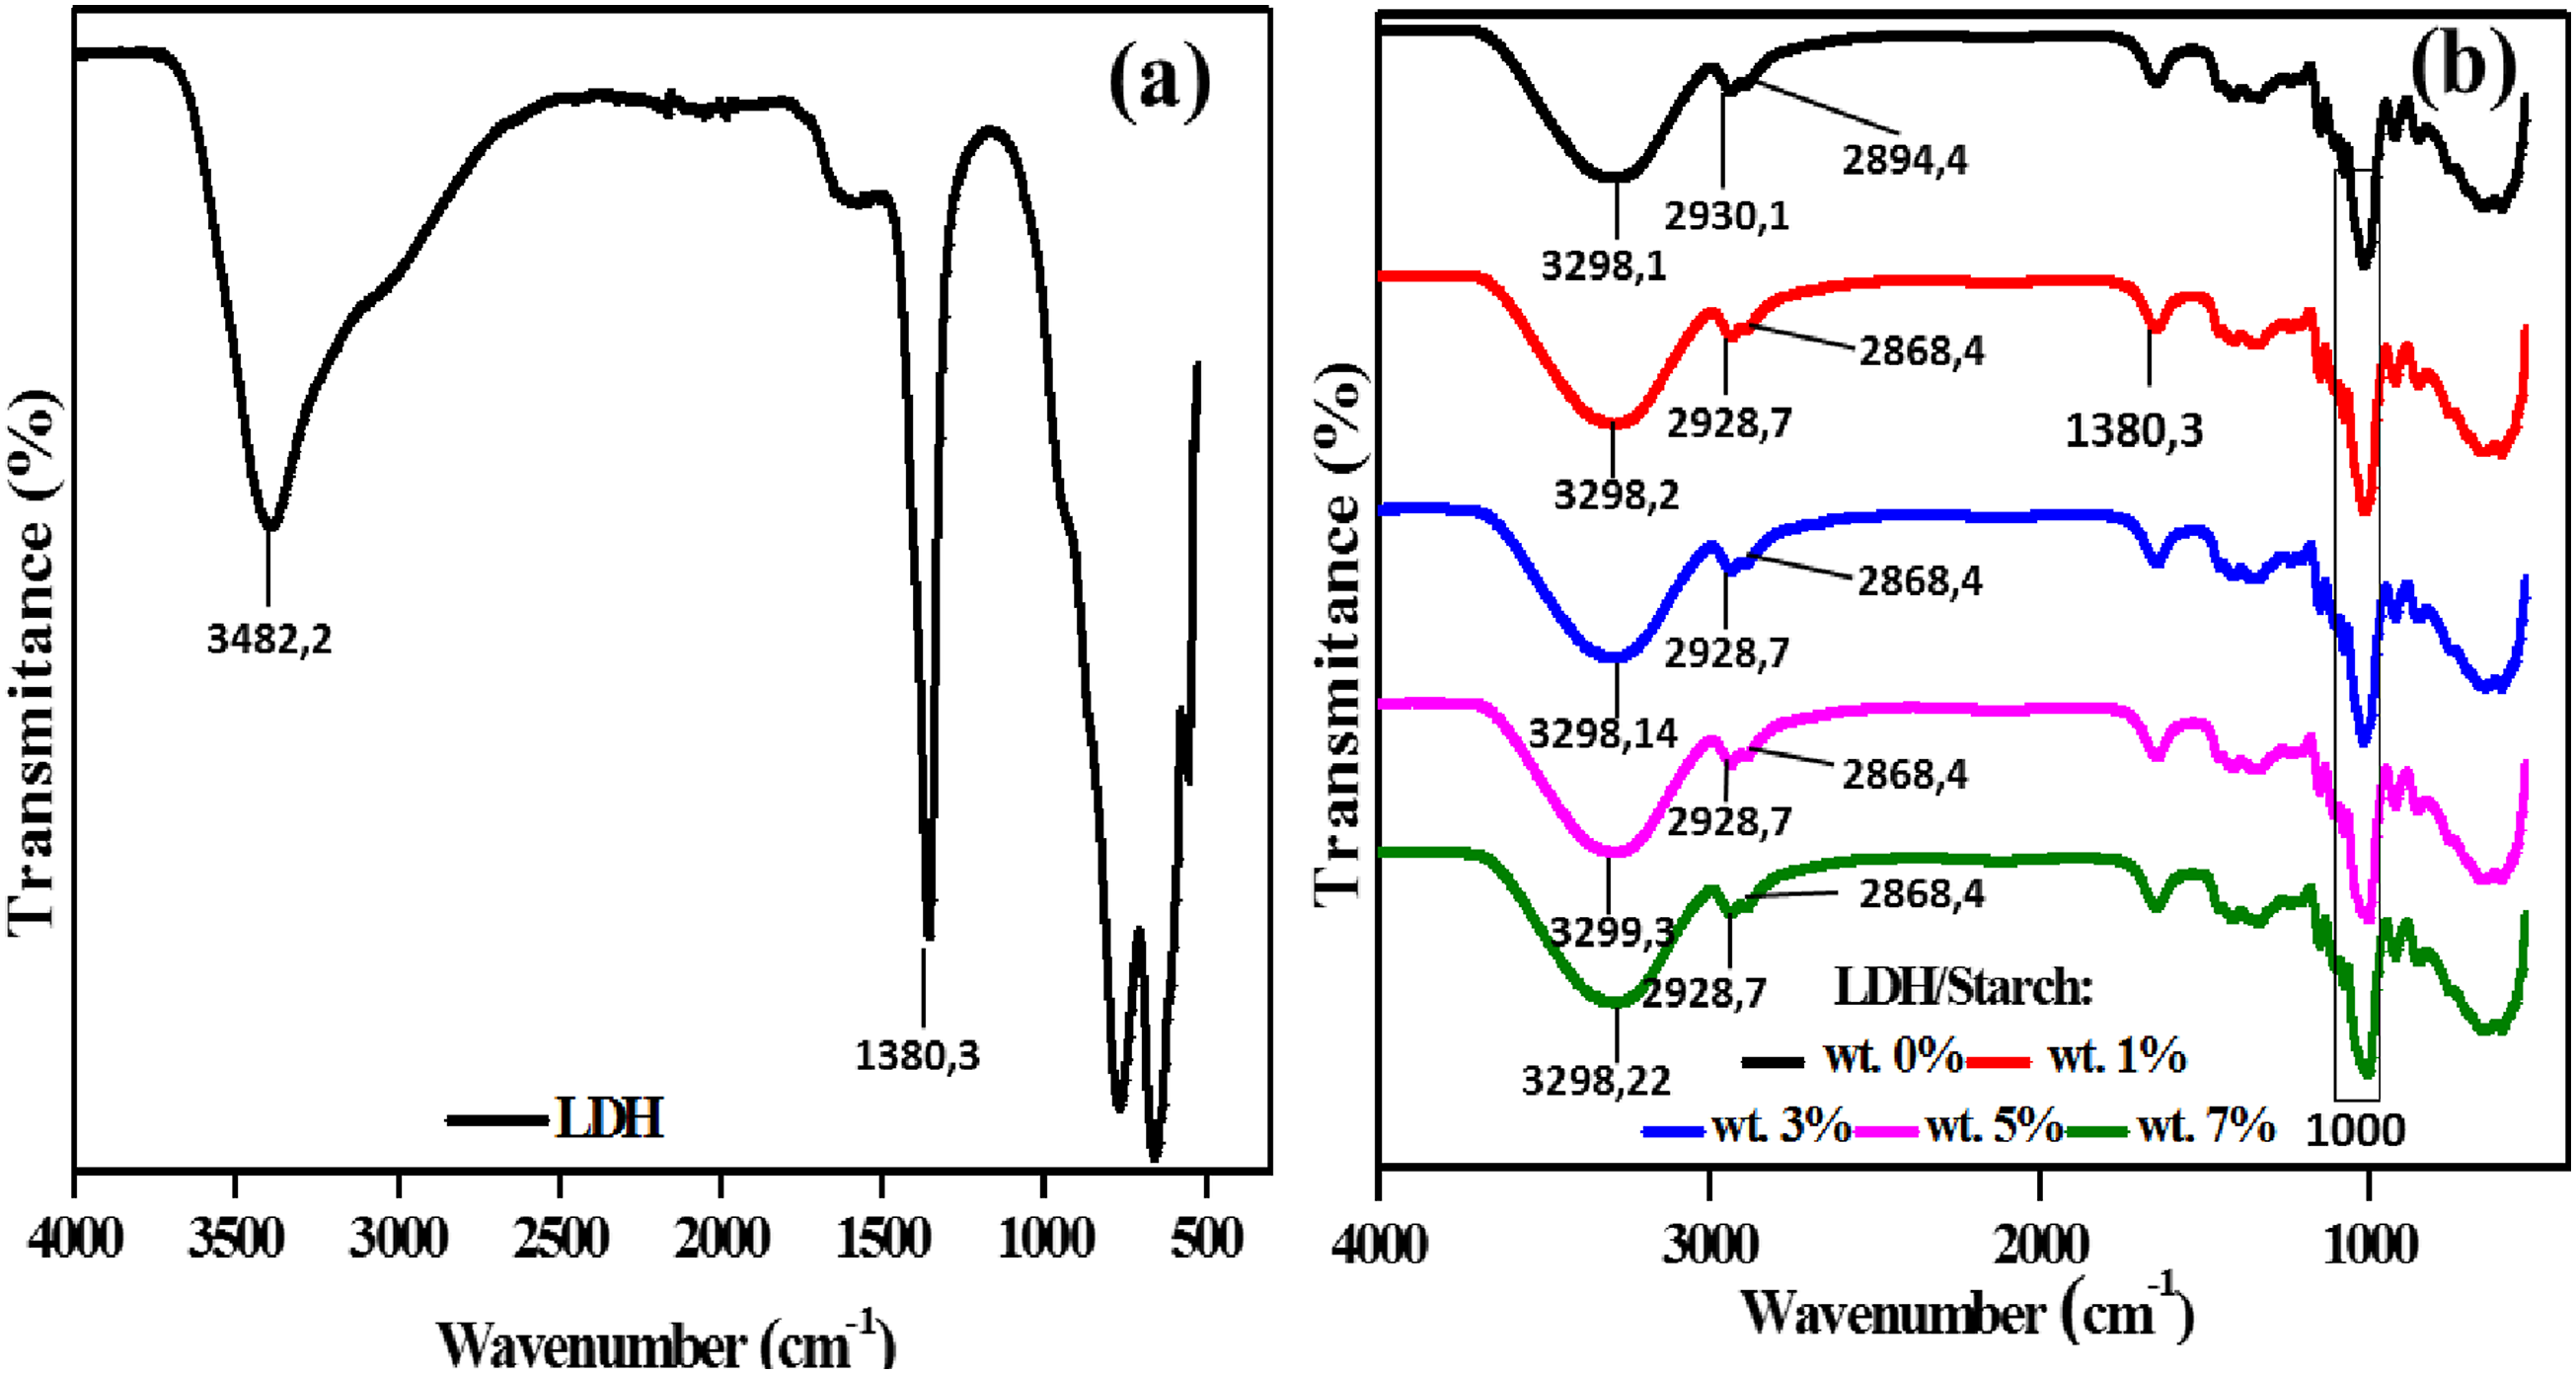
The FTIR spectra of the nanocomposite films (Figure 3(b)) confirm the XRD results by the appearance of the two characteristic bands related to the biopolymer and LDH. The broad band at around 3298 cm−1 corresponds to ν(OH) and that at about 2928 cm−1 is attributed to C–H (stretching mode). Other characteristic bands arising from starch include those related to C–H stretching (2928 and 2894 cm−1), C–O–C (1080 and 1000 cm−1) and O-H bending (1639 cm−1). The characteristic band of the carbonate ion ν3(CO32–) appears at 1380.3 cm−1. 38 At about 1630 cm−1 appears the angular deformation band of the water molecule δ(H2O) which originates from LDH as reported above. The bands observed at around 1000 and 1149 cm−1 correspond to the stretching vibrations C–O–C and C–O–H, respectively.39,40 The bands below about 800 cm−1 are attributed to M–O and M–O–M bonds of LDH as reported above. These results show the good dispersion of LDH in the biopolymer matrix.
Scanning electron microscopy and elemental analysis
LDH dispersion and the interaction between the polymer matrix and LDH are recognized as essential parameters that influence various properties of polymer nanocomposites. Scanning Electron Microscopy (SEM) is critical for observing the fine LDH dispersion within the starch matrix. Figure 4 shows SEM images comparing pure starch with LDH/starch nanocomposites containing 5 wt % LDH. These images show the superior crystallinity of LDH, with a densely packed and textured surface pits that interlock to form a distinct texture. The observation shows that LDH particles are uniformly dispersed within the starch matrix, in contrast to pure starch with a uniform surface morphology (Figure 4(a)). In contrast, the surface of the LDH/starch nanocomposites shows a rough fracture structure (Figure 4(b)), suggesting a more effective interfacial interaction. This observation is due to the formation of hydrogen bonds between the LDH and the starch chains. These bonds are important in achieving optimal LDH dispersion and in creating a strong interfacial interaction with the starch.41,42 (a)-(b) SEM images, (c)-(d) EDX spectra and (e)-(f) mapping images of elemental distribution of starch and LDH/starch nanocomposite films.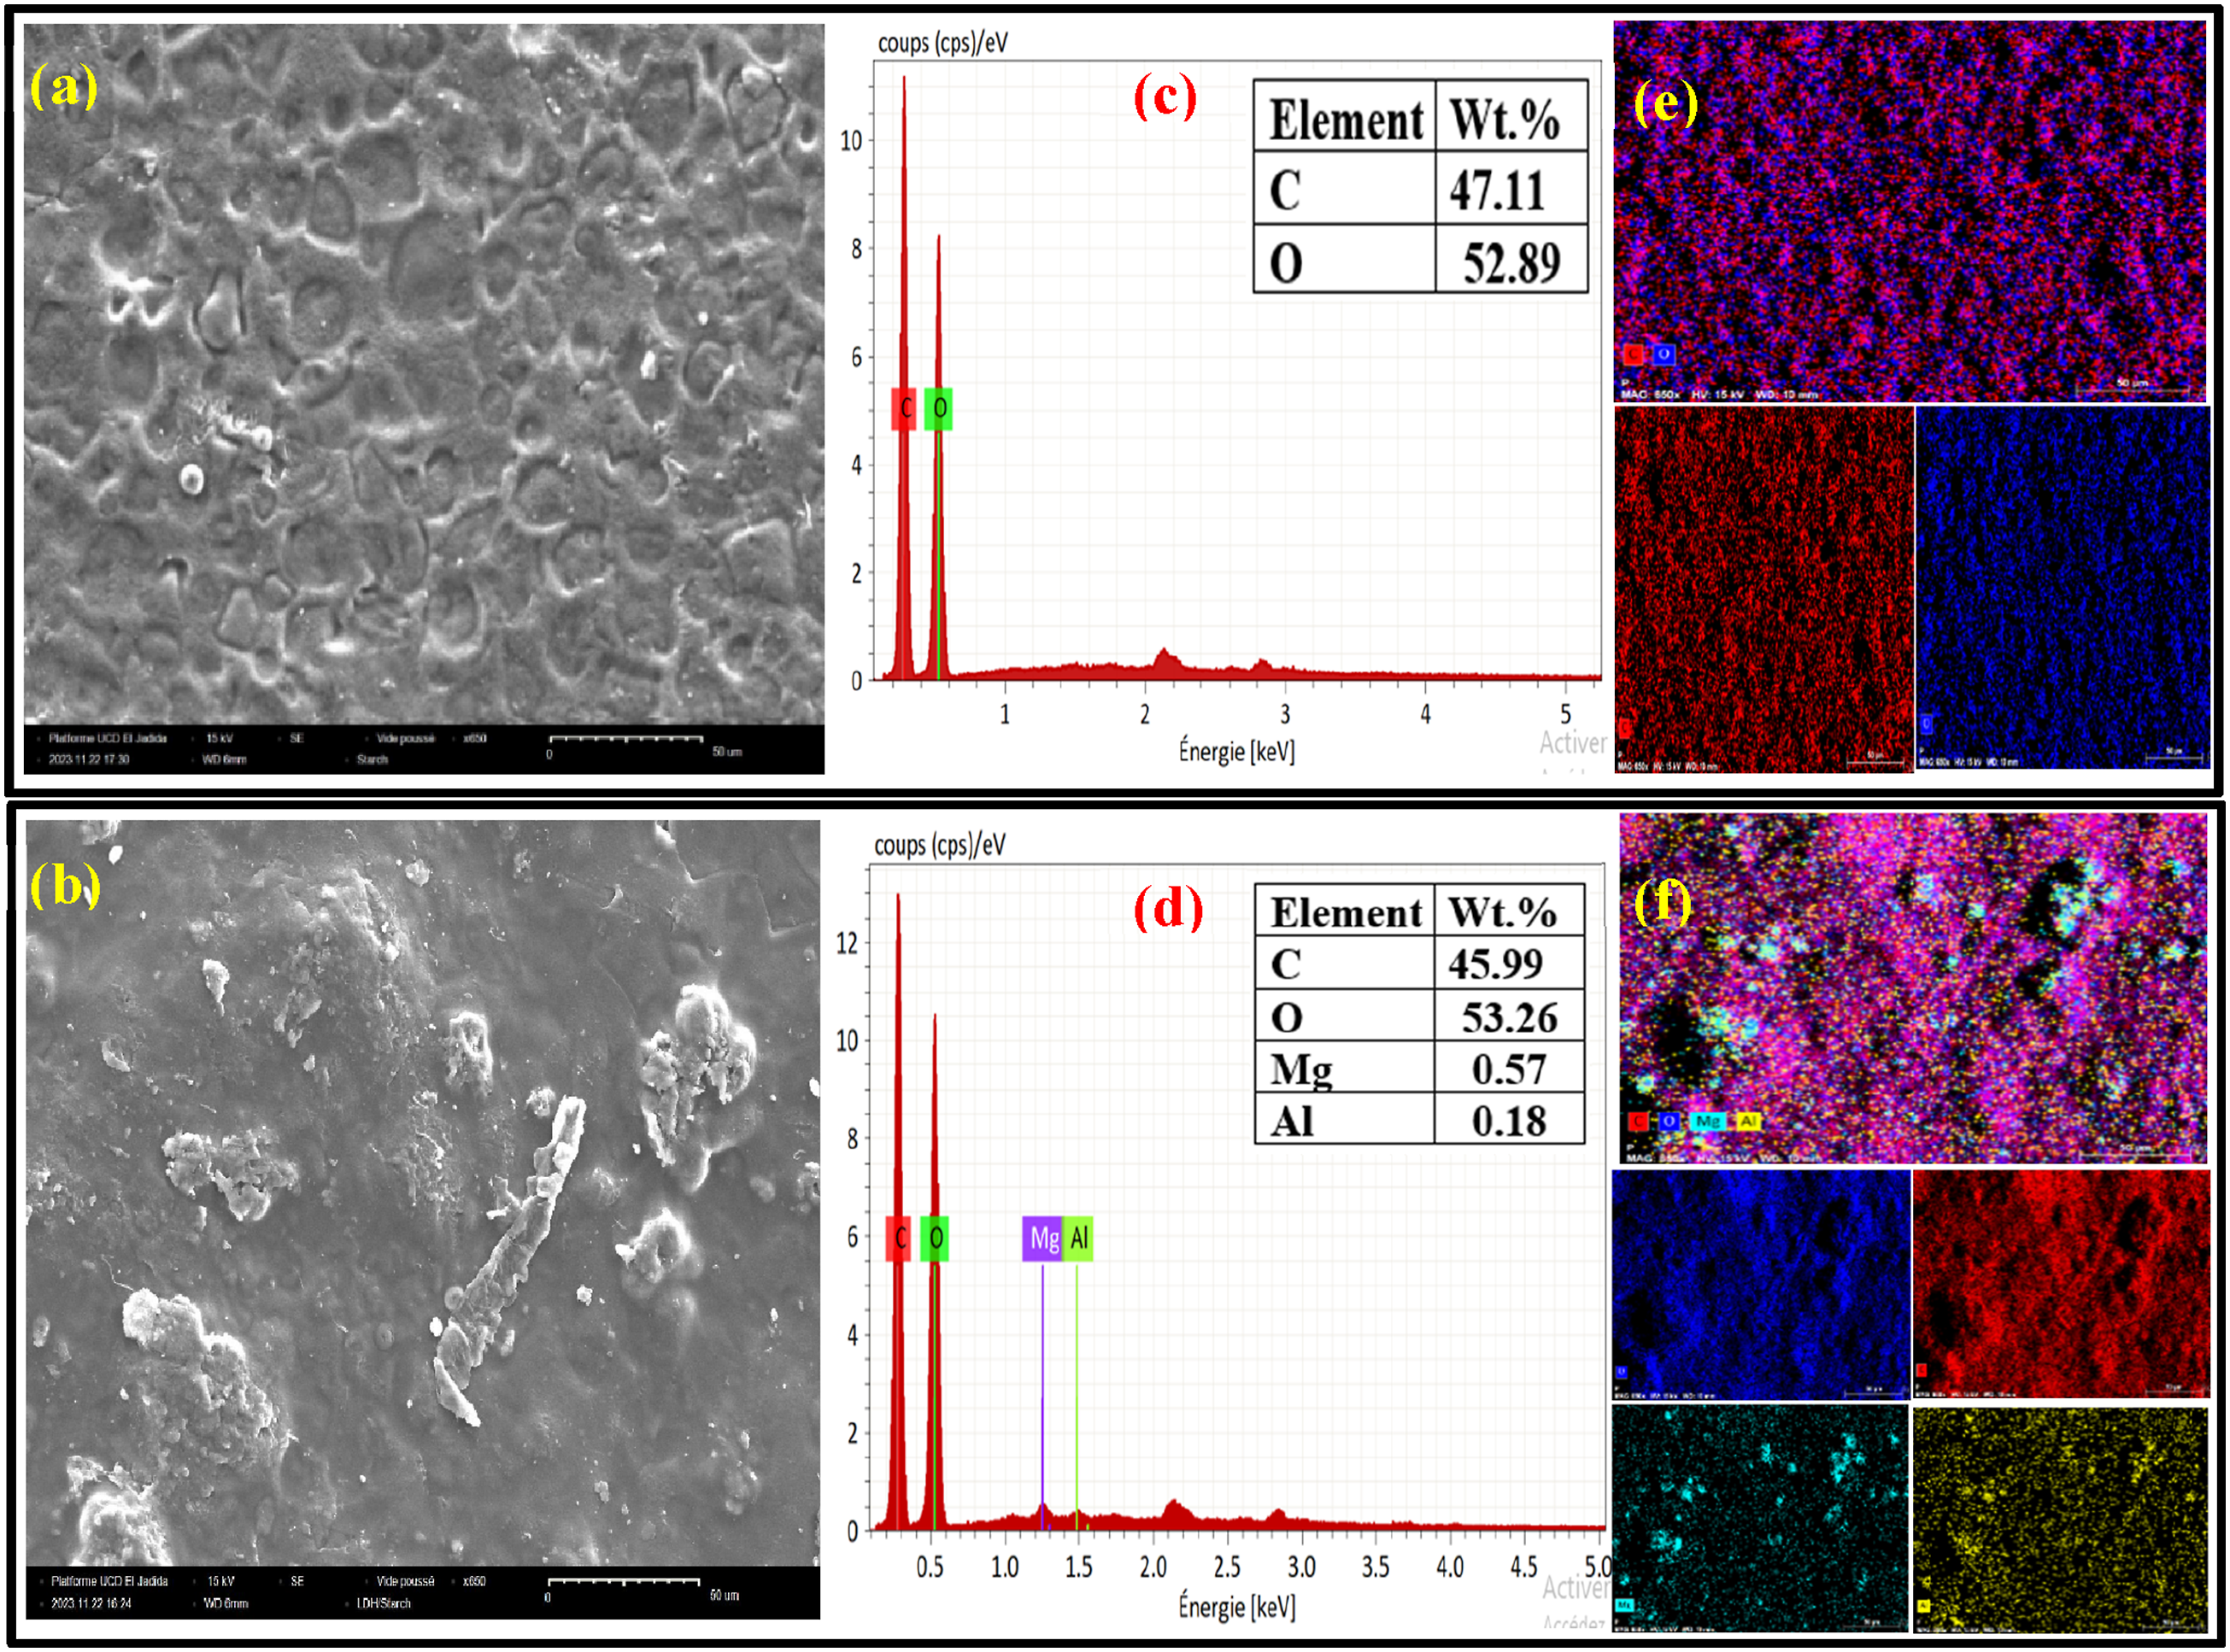
Figure 4(c) and (d) displays the compositional properties of films obtained from EDX measurements. The EDX spectrum of starch films (Figure 4(c)) confirms the presence of C and O with atomic percentages of 47.11 % and 52.89 %, respectively. Additionally, the existence of Mg and Al, with a low percentage compared to C and O, verifies the dispersion of LDH in LDH/starch films (Figure 4(d)). Moreover, the EDX mapping of starch films (Figure 4(d)), and of starch with 5 wt % LDH. Figure 4(e) and (f) depicts the elemental mapping of the starch and LDH/starch films, illustrating the even distribution of elements in the starch and LDH/starch film (5 wt %).
Optical properties
Transmittance behavior
The films were analyzed with a UV-vis spectrophotometer to evaluate radiation transmittance, taking into account their respective constituents. Figure 5 shows the spectra of the different films. It was observed that the LDH containing films had exceptional UV light (200–400 nm) barrier properties compared to the reference film (Starch). The reference film was highly transparent in the visible spectrum (400-700 nm), indicating a high percentage of transmission.
43
The incorporation of LDH into the films caused a notable decrease in transmittance within the range of 400 nm to 800 nm, attributed to light scattering.
44
Moreover, transmittance serves as a measure to evaluate the distribution of fillers in the matrix or their cohesion at the interface. Overall, LDH/starch nanocomposites exhibit a robust interface between fillers and the surrounding matrix, resulting in exceptional adhesion, superior mechanical properties, and significant optical transparency. The introduction of LDH particles into the starch matrix caused a remarkable decrease in the transmission spectra compared to the pure starch matrix, which is consistent with the decrease in transparency of the starch–kaolinite composite film as the clay (kaolinite) content increases from 0 to 15 wt %.
45
Transmittance spectra of nanocomposite films.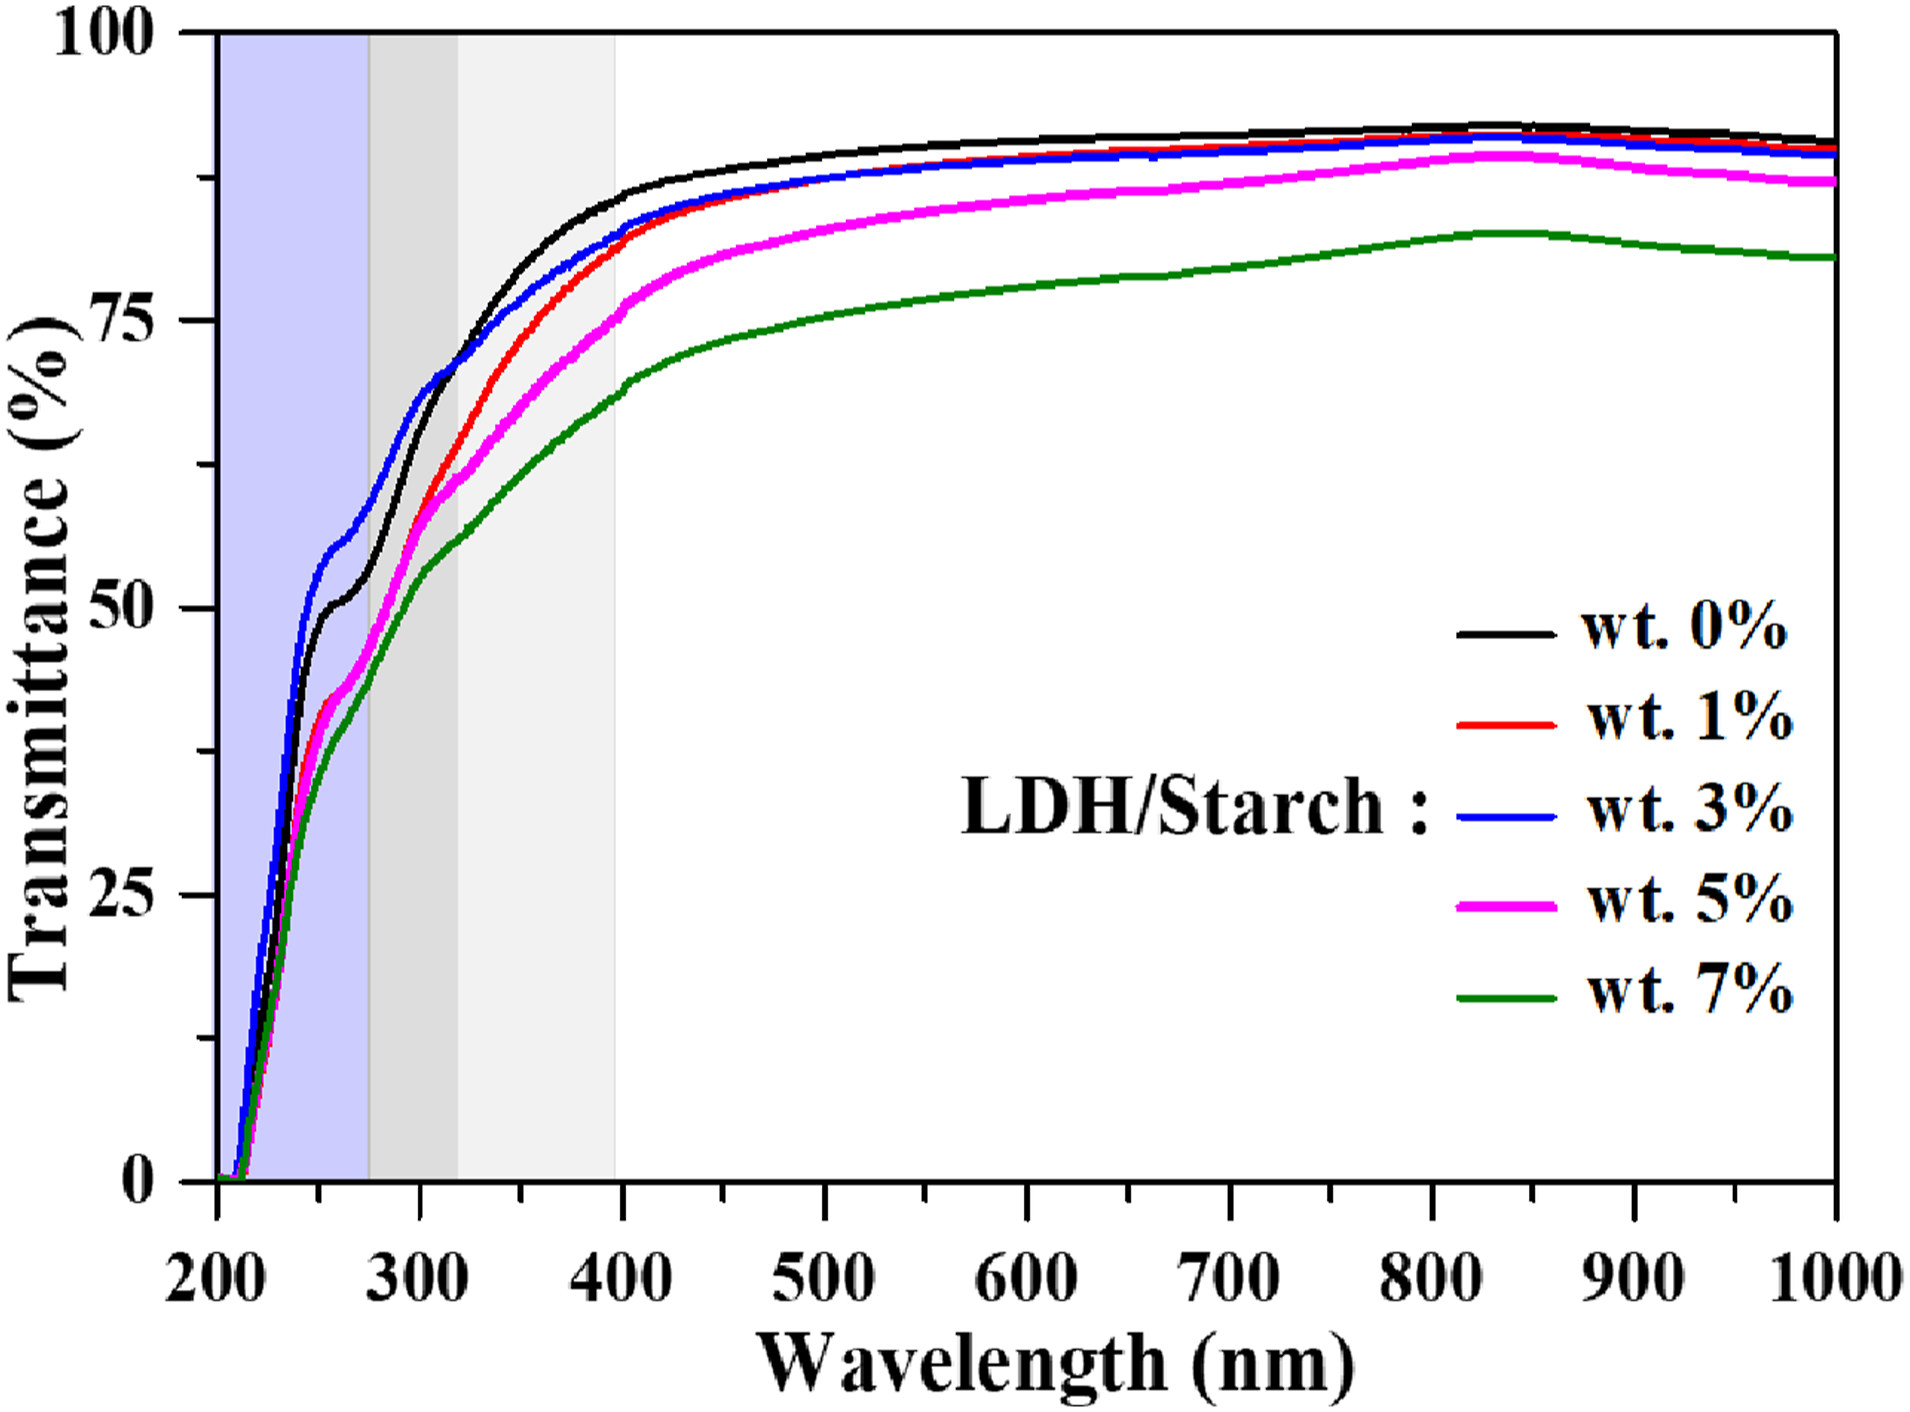
Reflectance behavior
The reflectance measurements for the nanocomposite films are shown in Figure 6. In the UV–Vis region, particularly, in the 227–750 nm range, the reflectance percentage decreases in the order 5 wt % > 7 wt % > 0 wt % > 3 wt % > 1 wt % (Figure 6(a)). However, in the NIR region (Figure 6(b)), the reflection percentage increases with decreasing filler content. Reflectance spectra of nanocomposite films in the UV-Vis range (a) and NIR range (b).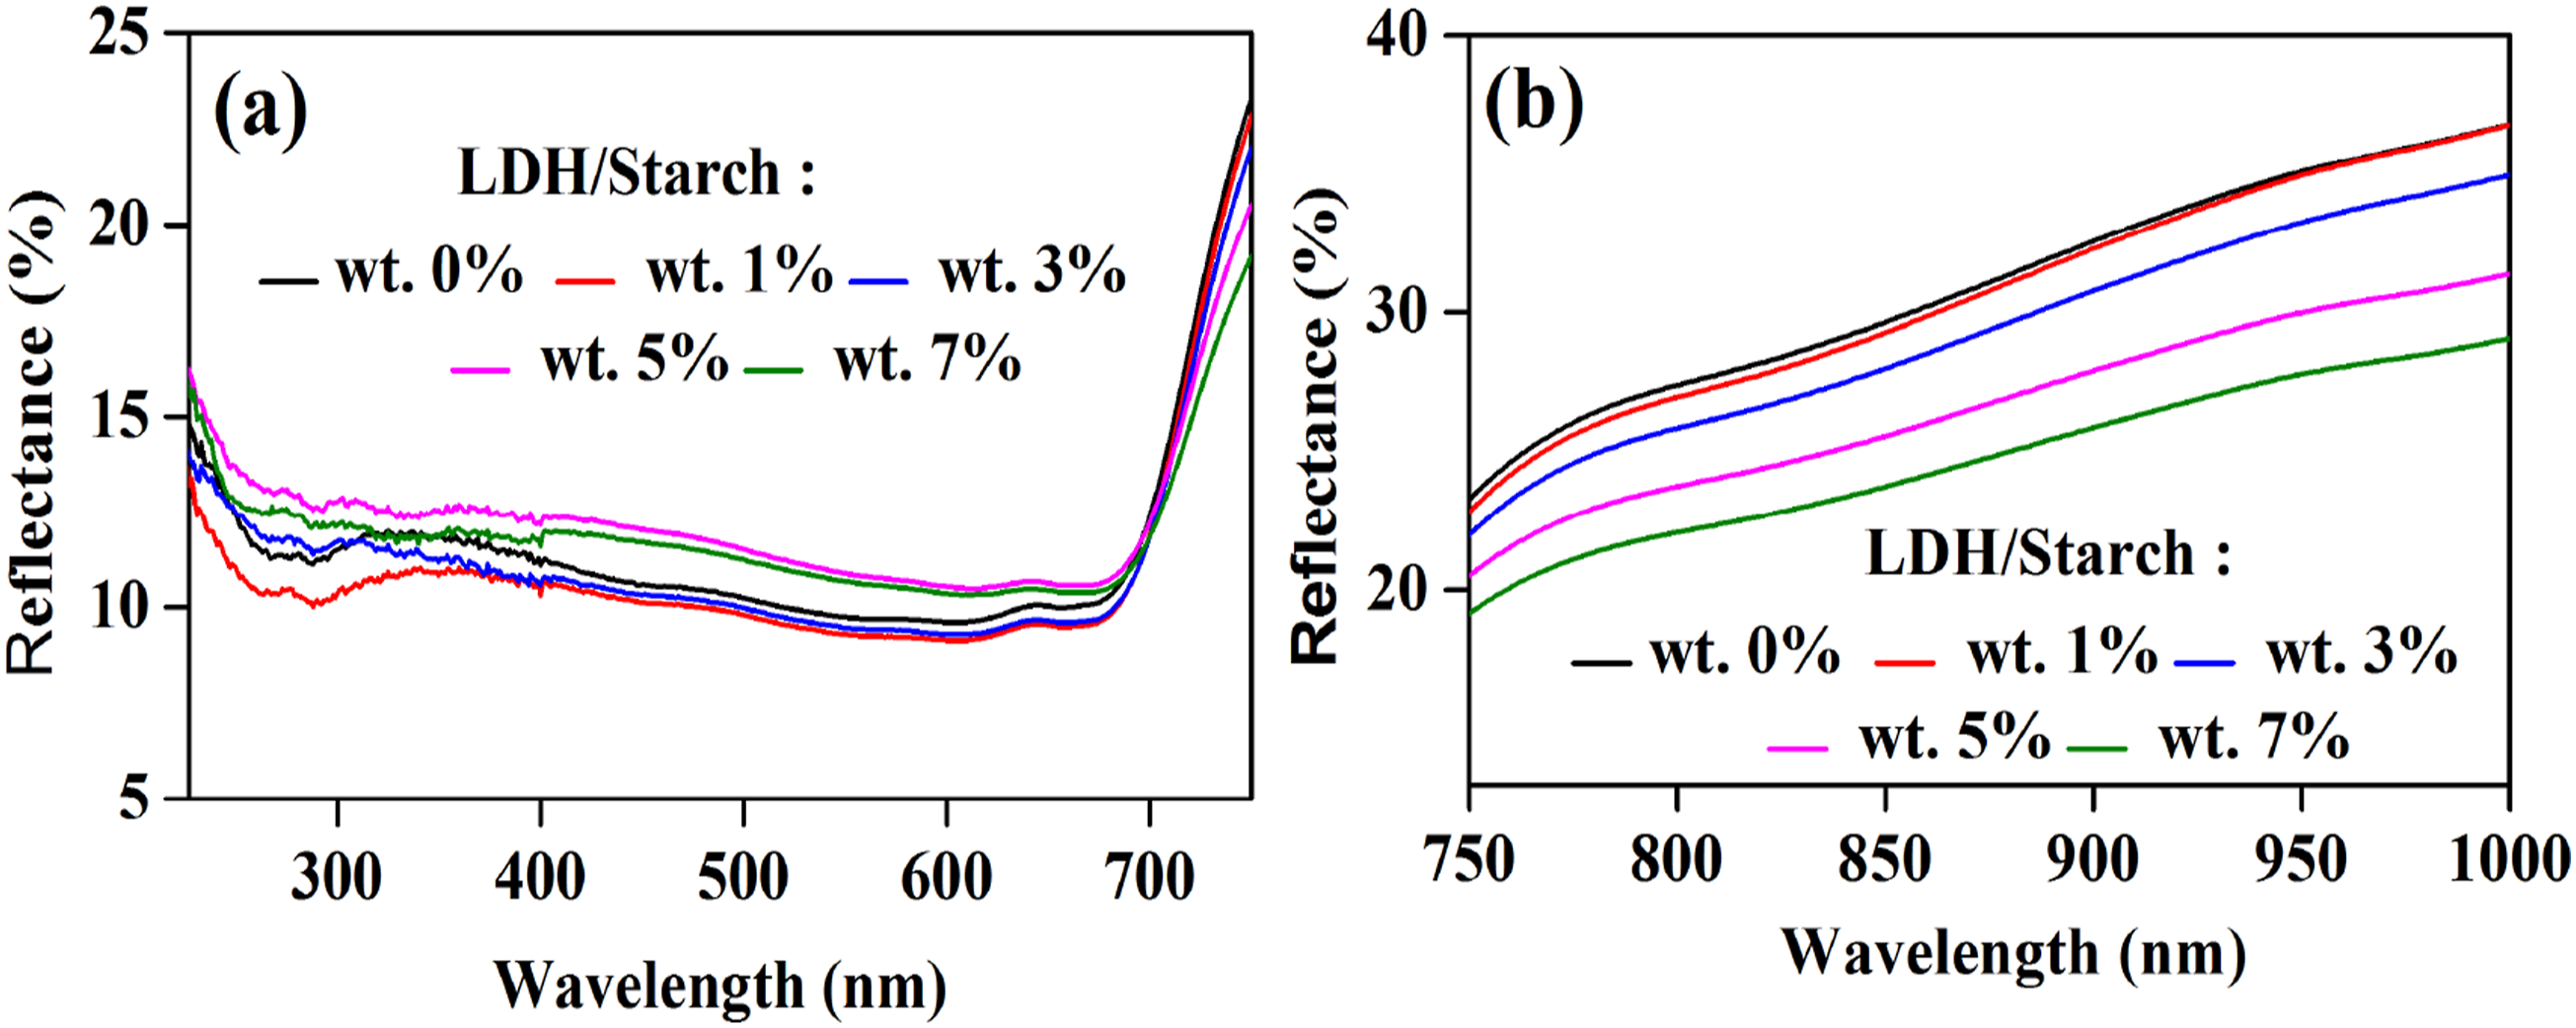
Absorbance behavior
The absorption coefficient (
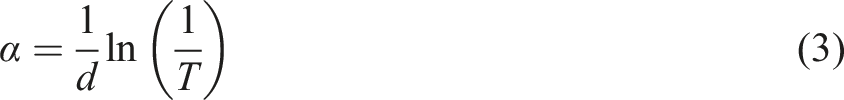
Figure 7 shows the evolution of the absorption coefficient for the nanocomposite films. An absorption band appears at 227 nm which probably corresponding to the electronic transition π→π∗, due to the presence of the >C = O group of the starch molecule. The intensity of this band increases with the increasing of charge content. This can be attributed to the formation of charge transfer complexes,
47
which implies the formation of certain bonds between LDH and starch.
48
Furthermore, the absorption coefficient in the UV-Vis region (Figure 7(a)) and in the NIR region increases with increasing LDH content Absorption spectra of nanocomposite films in the UV-Vis (a) and NIR (b) regions.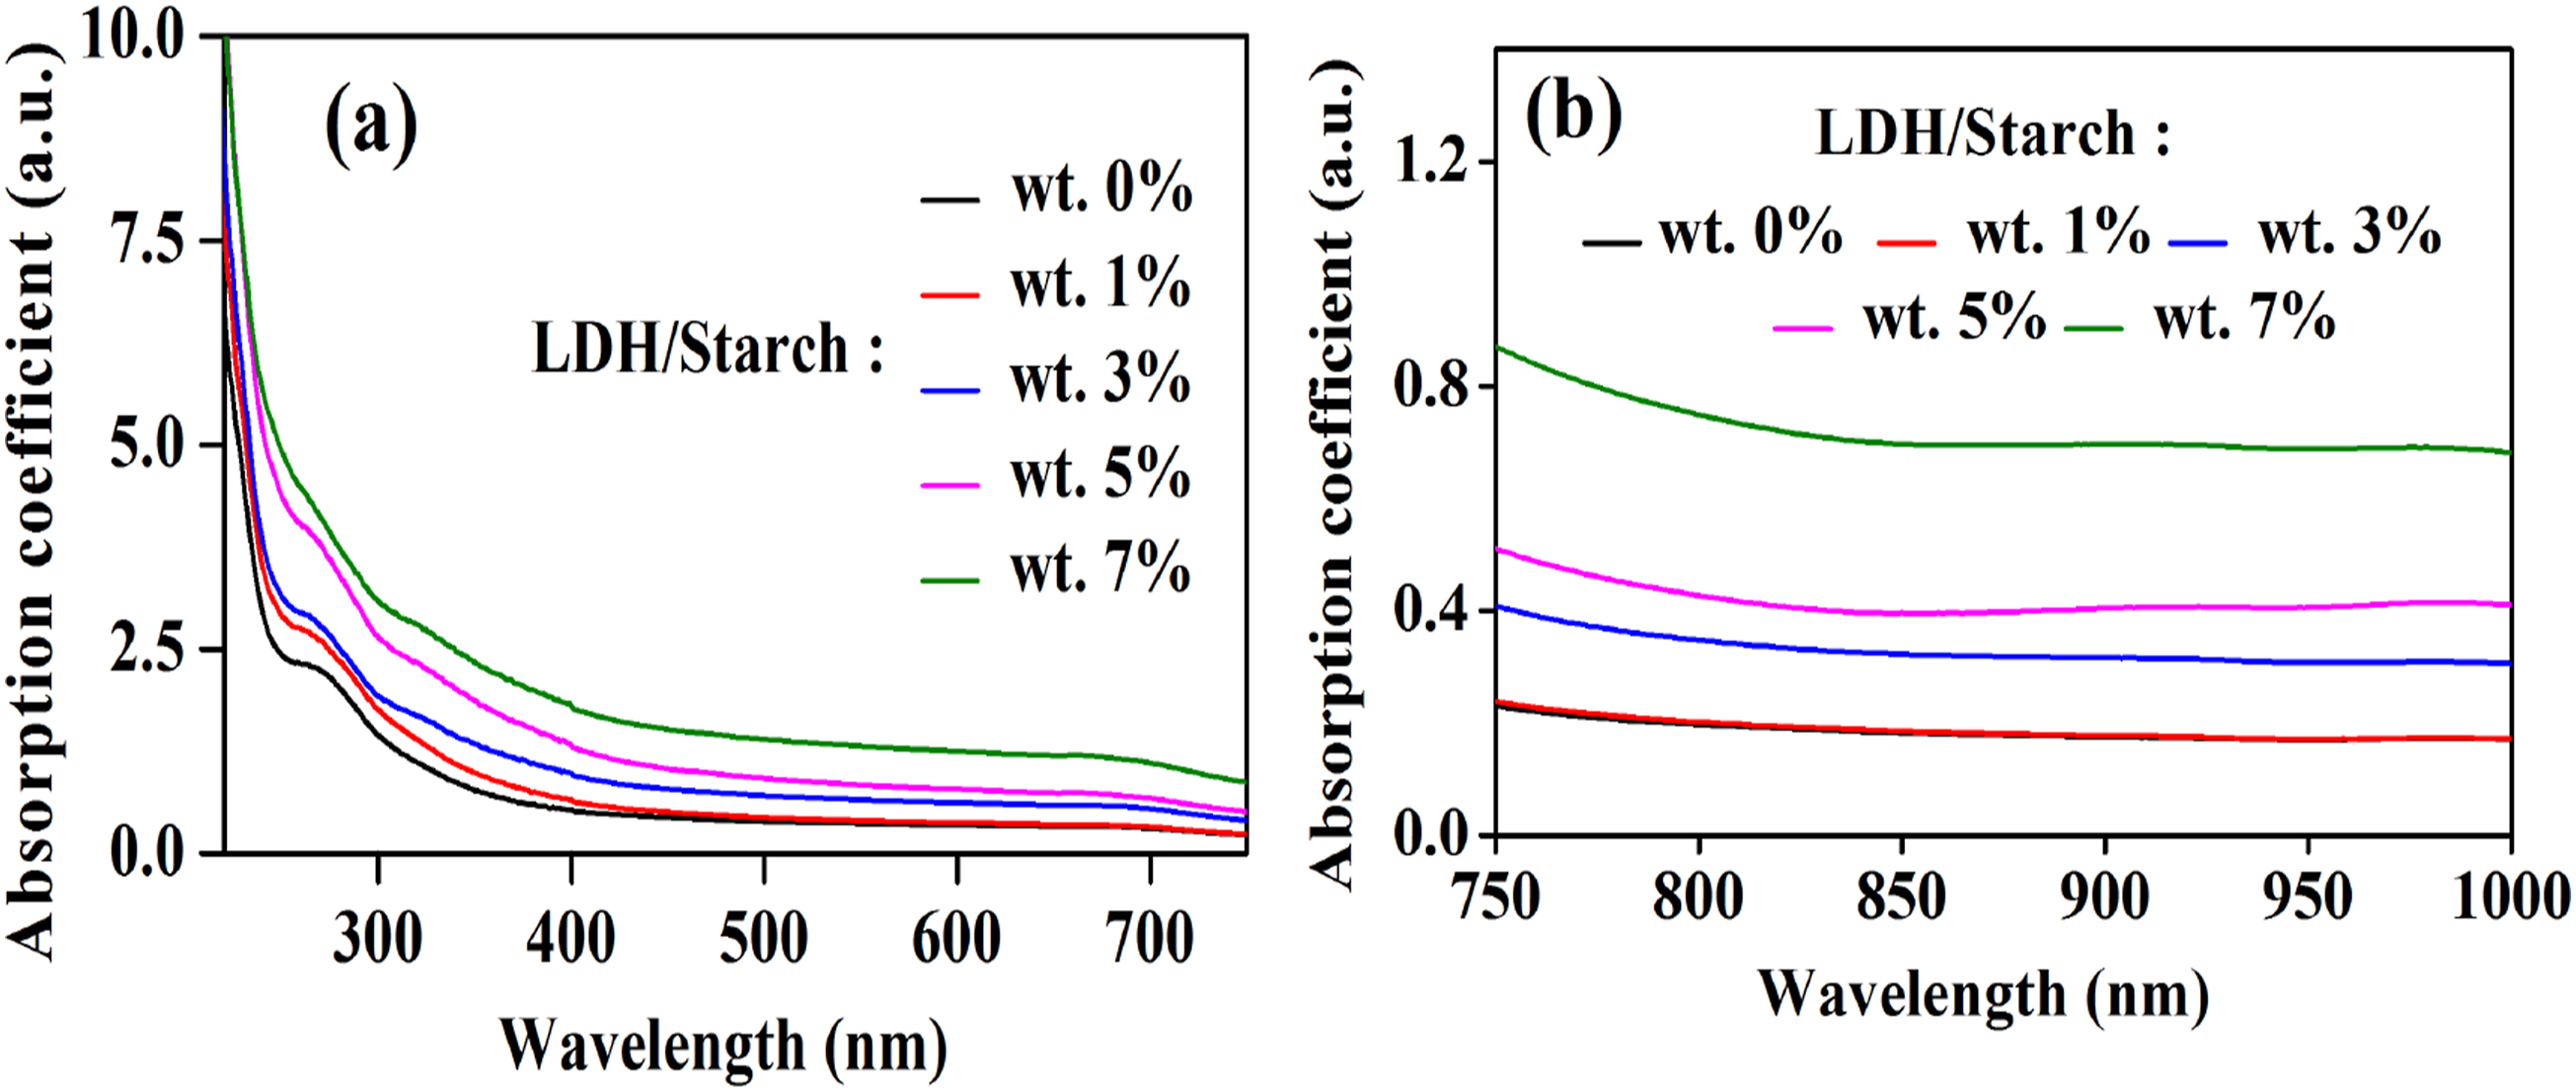
Extinction coefficient
The extinction coefficient (k) is a measure of the force with which a substance absorbs light at a given wavelength, and is therefore an intrinsic optical property of the material that depends on its composition and structure. This parameter can be calculated using the following equation
50
:
Figure 8 shows the evolution of k as a function of λ for the nanocomposite films. The extinction coefficient increases as the charge content increases, indicating the effect of the LDH content on the enhancement of the light absorption.
51
Extinction coefficient of nanocomposite films with different LDH content.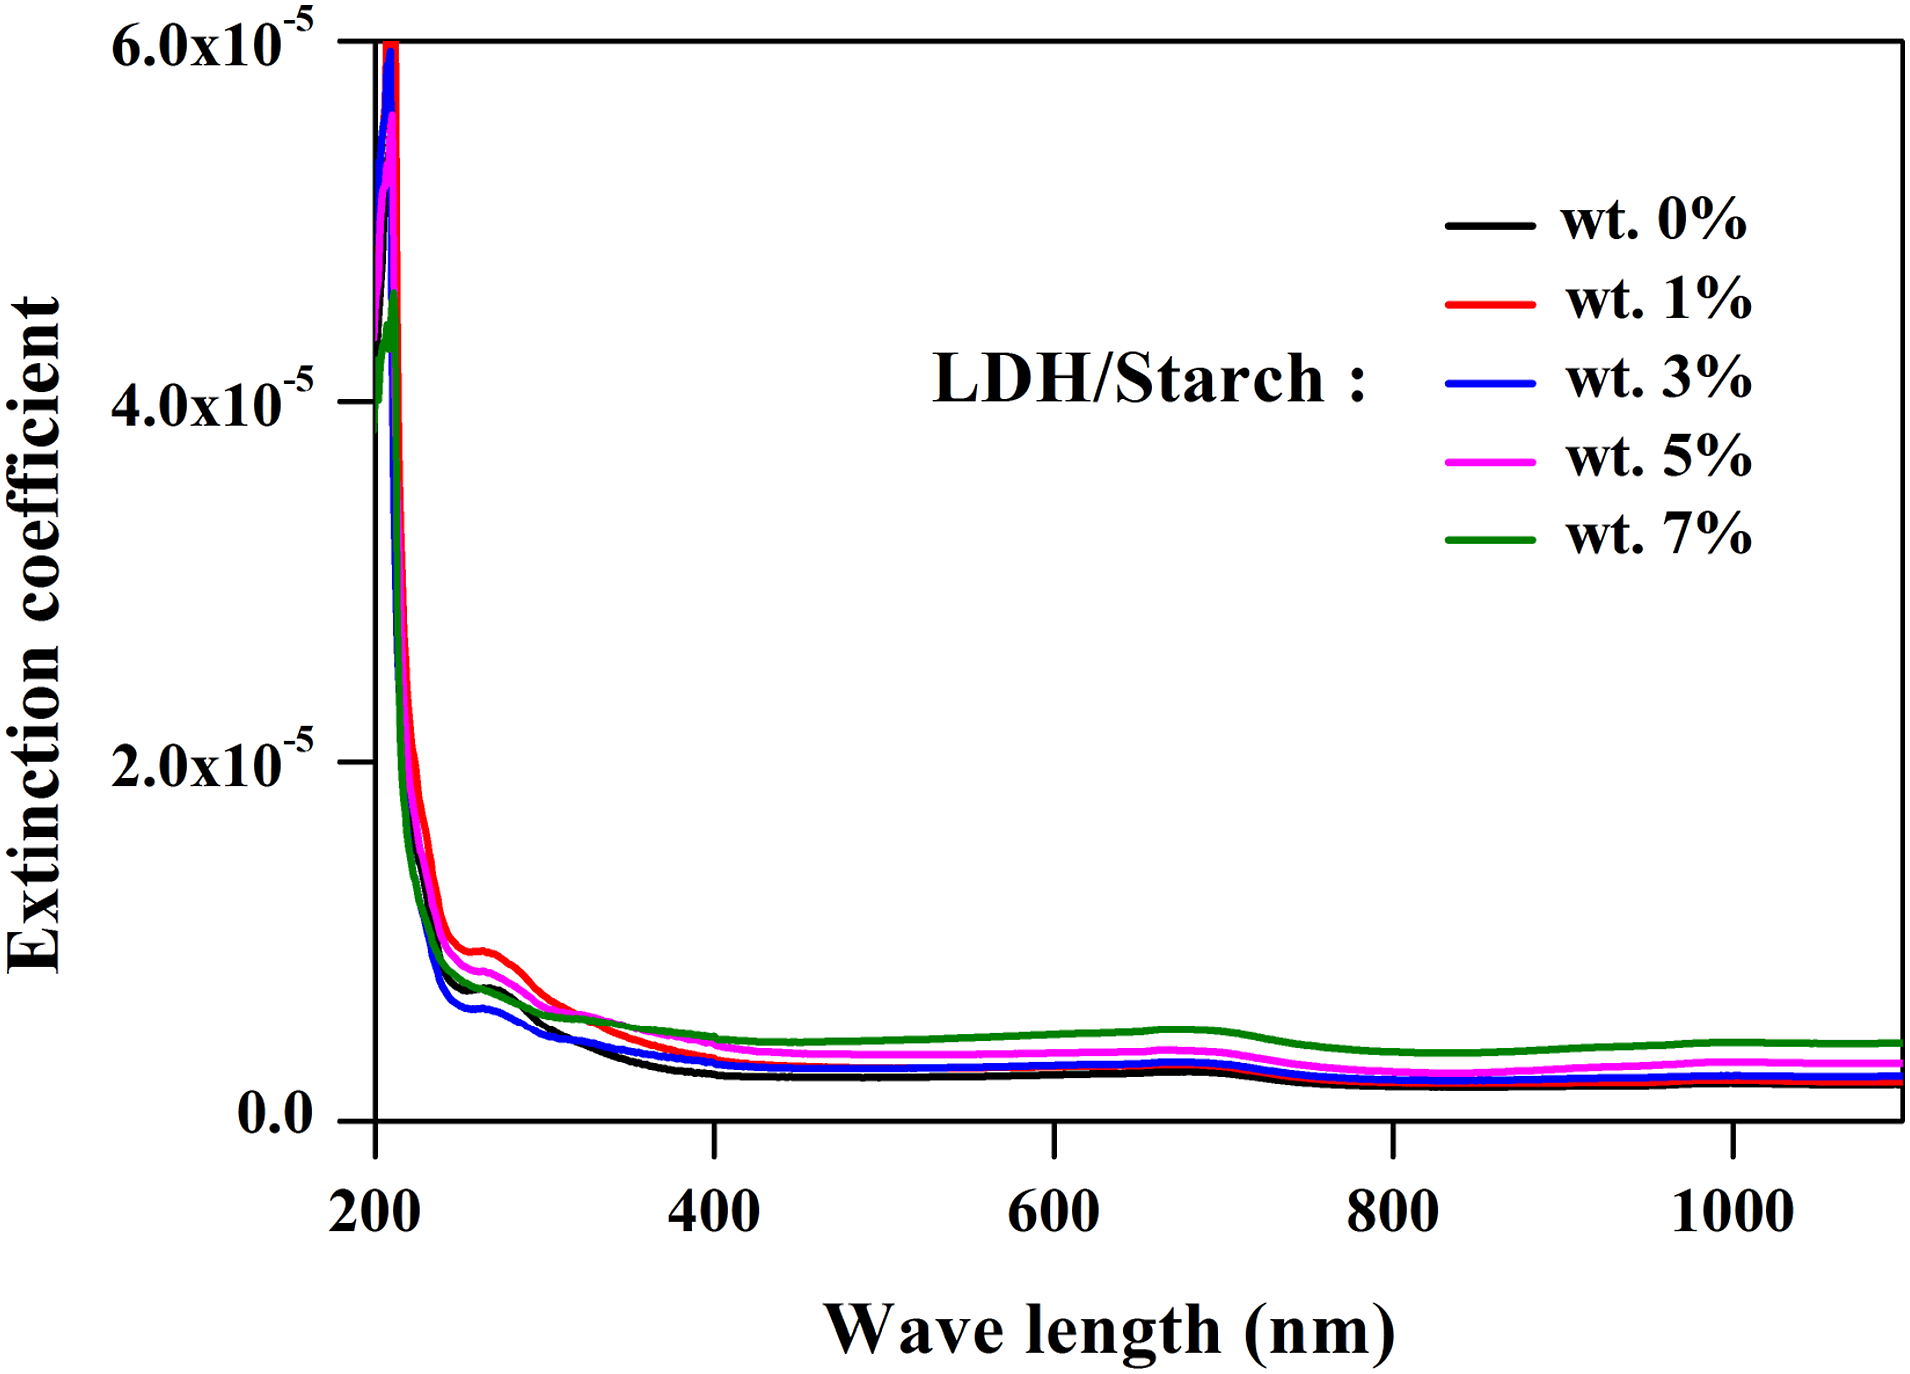
Electronic behavior
The gap energy can be determined from the following equation
52
:

Eg is the gap energy that can be obtained from the intersection of the extrapolated linear part of the curve with the hν axis, 53 A is a constant and n is equal to 2 and 1/2 for the direct and indirect transitions, respectively.
Figure 9(a) shows the evolution of (αhν)2 as a function of hν. A decrease in the gap energy values from 4.88 to 4.66 eV is observed as the LDH content increases from 0 to 7 wt %, confirming the uniform dispersion of LDH in the biopolymer matrix Evolution of (αhν)2 as a function of (hν) (a) Eg as a function of LDH content (b) for the nanocomposite films.
Refractive index, optical conductivity and optical dielectric constant
Refractive index, optical conductivity and optical dielectric constant for the nanocomposite films with different LDH content.
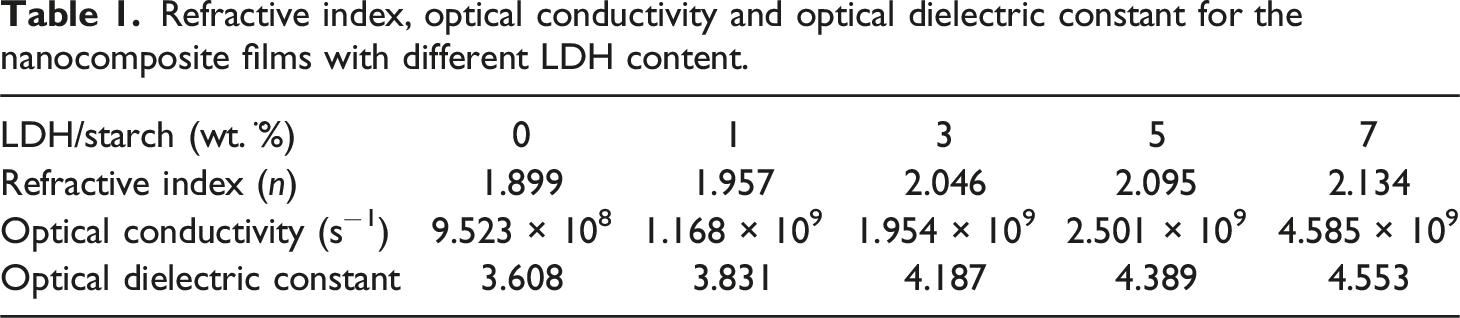
It can be seen from Figure 10(a) that the refractive index increases with increasing LDH content, indicating the effect of the clay in improving the optical properties of nanocomposite films. LDH content dependence of refractive index (a) optical conductivity (b) and optical dielectric constant (c) for the nanocomposite films.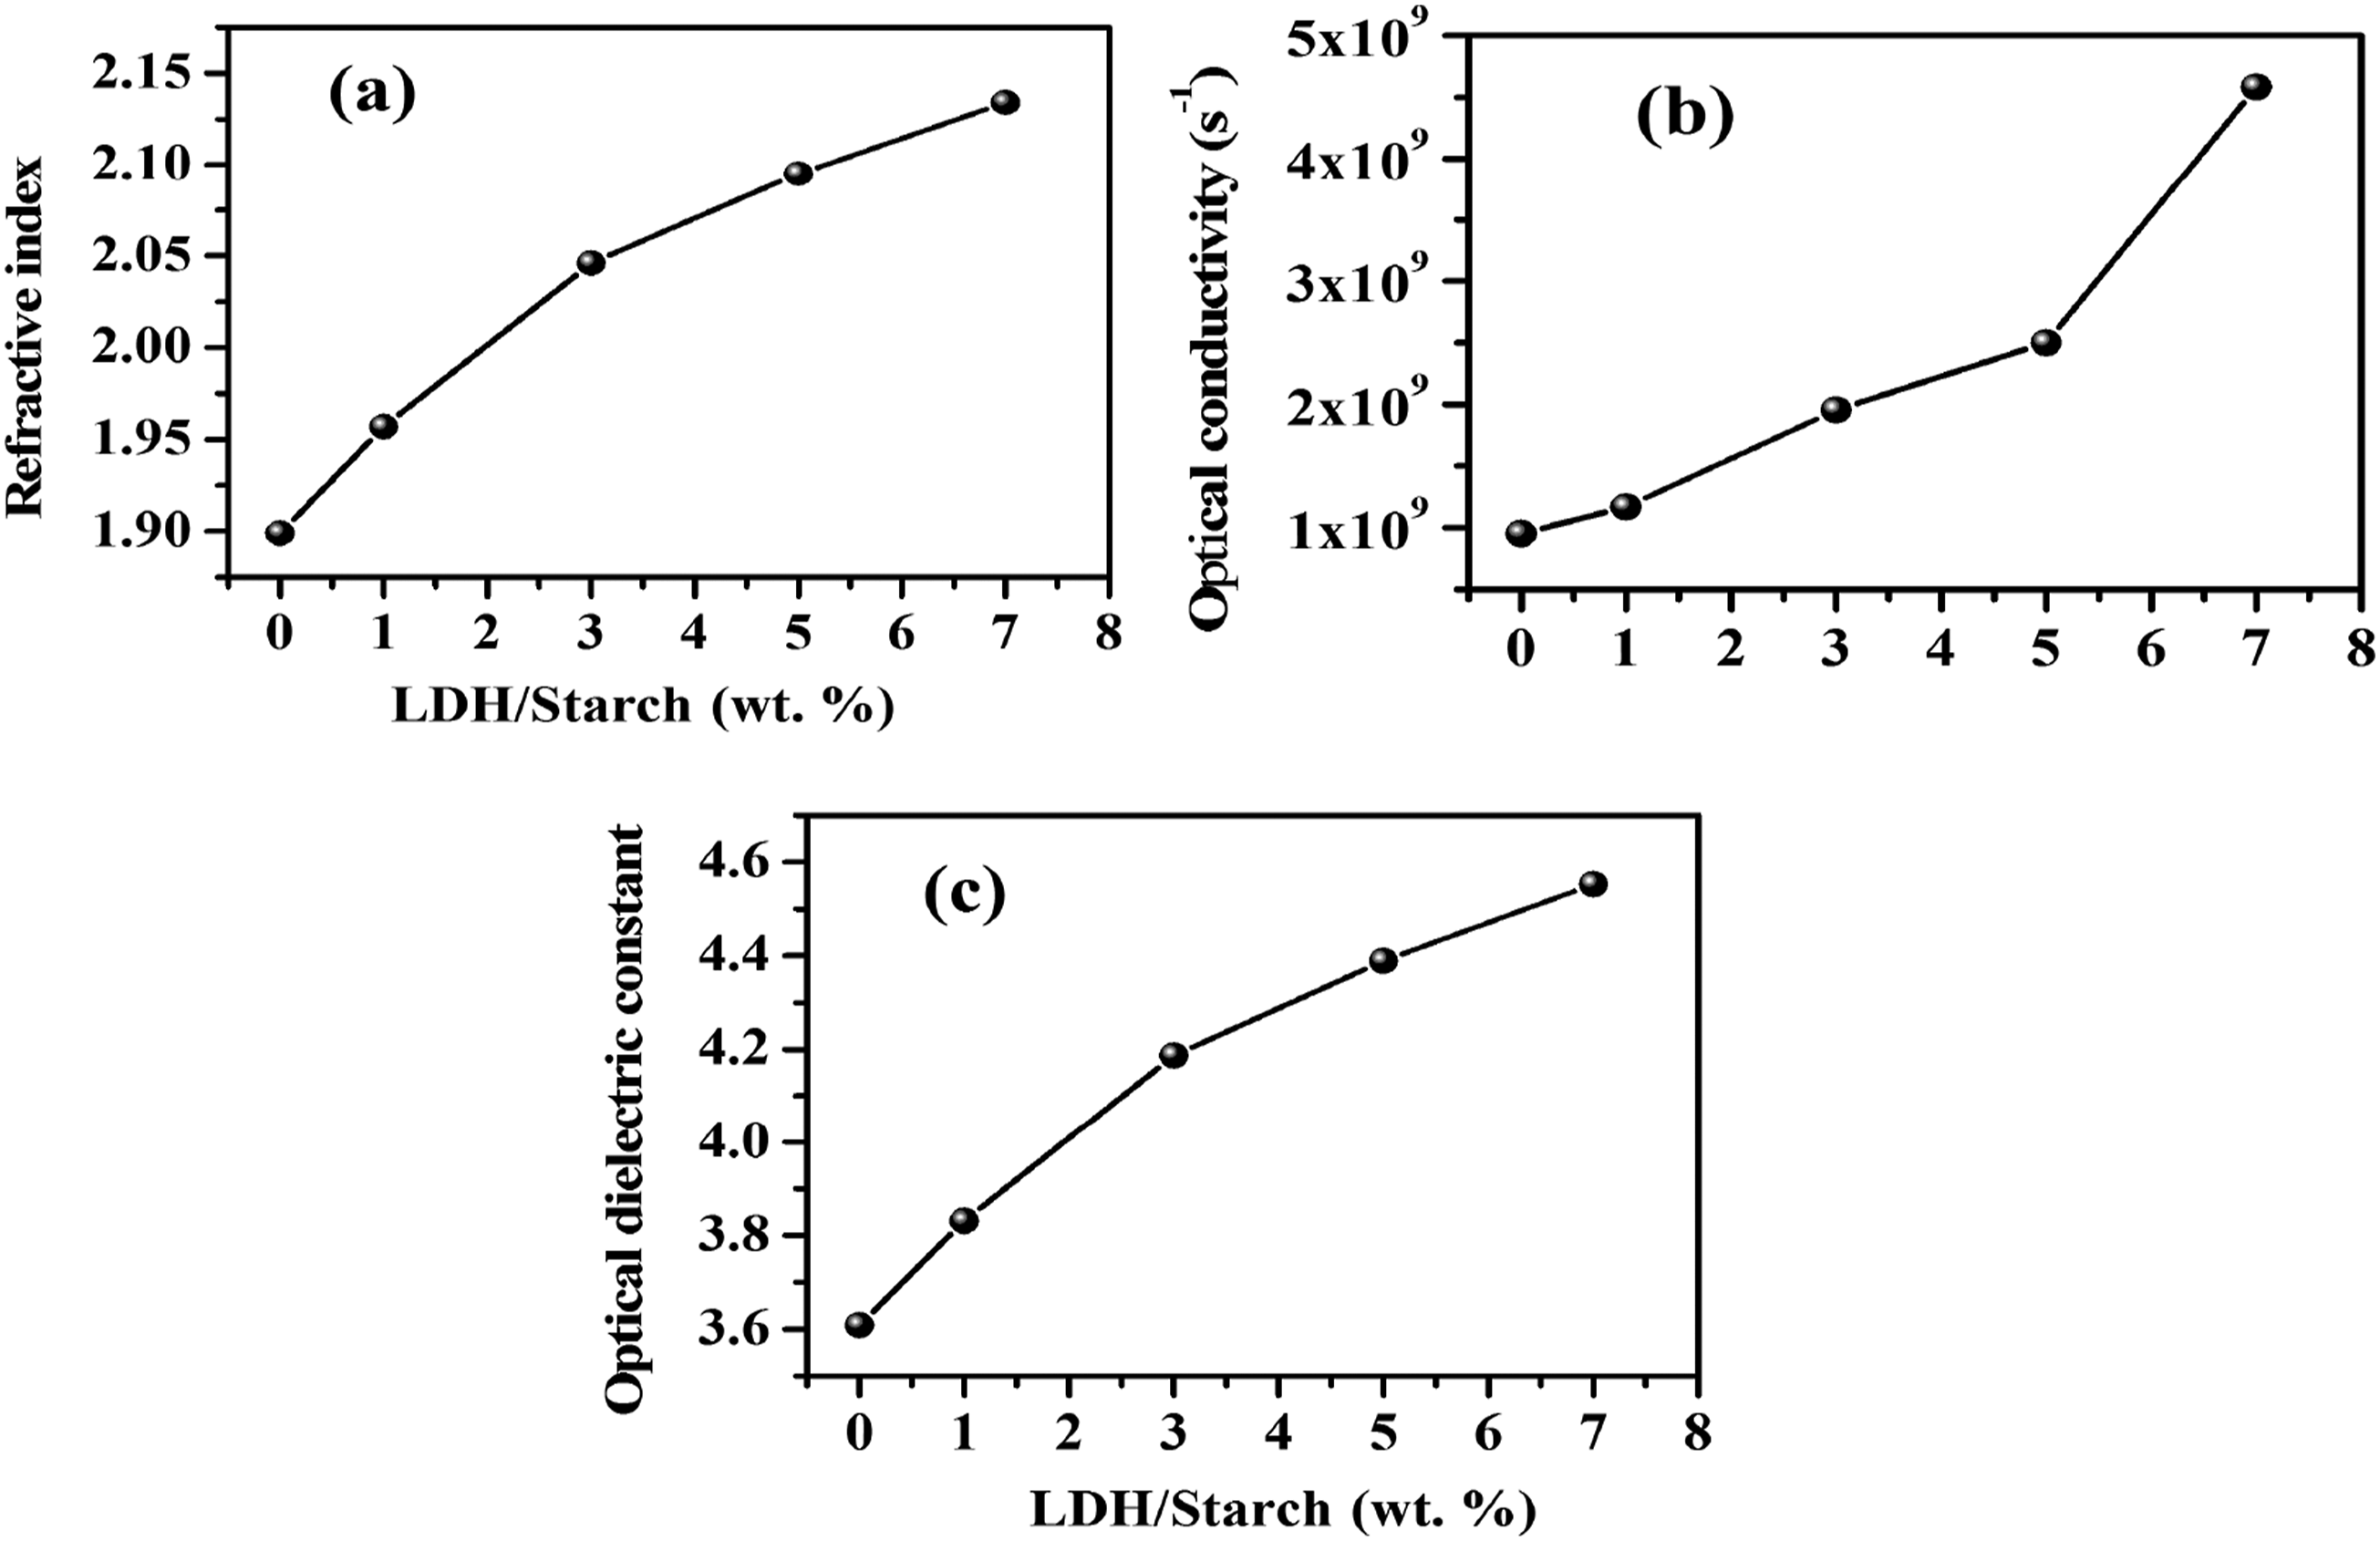
Optical conductivity is important for materials used in optoelectronic devices because it describes how the material responds to electromagnetic waves. It is directly related to the absorption coefficient through a specific relationship.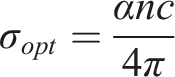
Figure 10(b) shows the variation in optical conductivity as a function of photon energy for LDH/starch nanocomposite films. The optical conductivity of the nanocomposite films increases with increasing LDH content, and this evolution is essentially correlated with the absorbance behavior. The high optical conductivity found for these materials, makes them good candidates for optoelectronic applications.
Furthermore, the dielectric constant can be determined using the following equation
56
: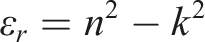
Figure 10(c) shows that the value of
Mechanical properties
Mechanical resistance is one of the mechanical performances characterizing the materials. This parameter can be seen from the evolution of the maximum stress as a function of the percentage of filler. From Figure 11(a), an increase in the mechanical resistance of the biofilms was observed at the LDH contents from 0 to 5 wt % followed by a decrease up to 7 wt % respectively, indicating that the best resistance to mechanical fracture is obtained when the LDH content equal to 5 wt %. The tensile properties are demonstrated by the Young’s modulus. According to Figure 11(b), the Young’s modulus of the LDH/starch nanocomposite films increases from 0.004 to 0.015 GPa as the LDH content increases from 0 to 5 wt %, respectively. In addition, the increase in both the tensile strength and Young’s modulus can be explained by several factors such as strong interfacial interactions (LDH–biopolymer), which limit the segmental mobility of the biopolymer chain and result in a lower strain rate and an efficient load transfer.
57
These results are consistent with those reported for starch/bentonite clay nanocomposites.
58
The authors reported an increase in the mechanical properties (stress and Young’s modulus) of the composite as the clay content increased from 0 to 10 wt %. LDH content dependence of the stress max (a) and Young’s modulus as a function of LDH content (b) in nanocomposite films.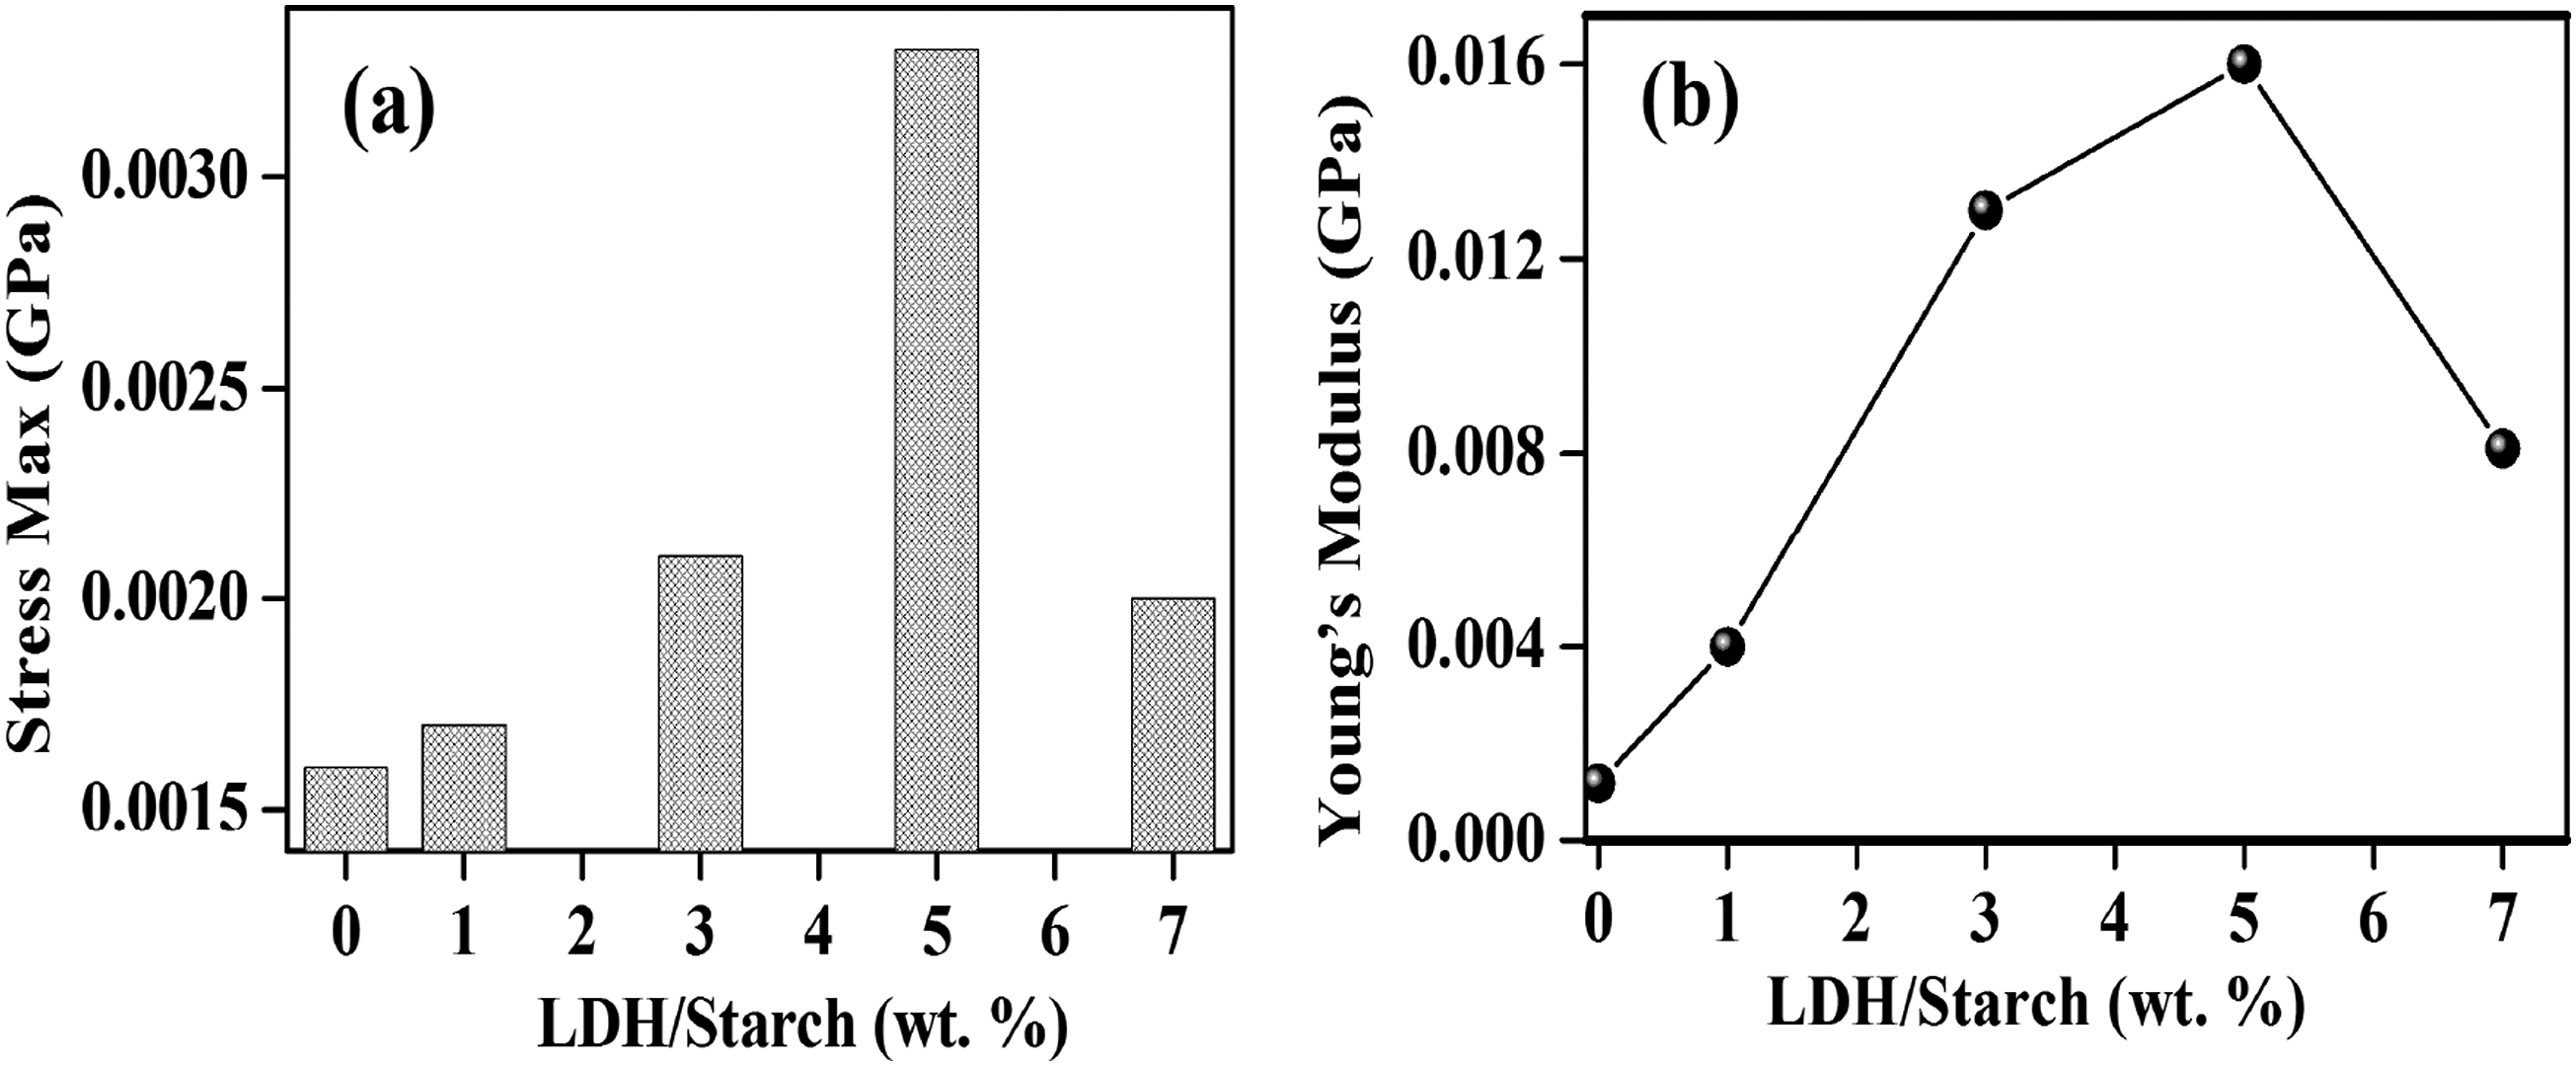
Electrical properties
Electrical modeling
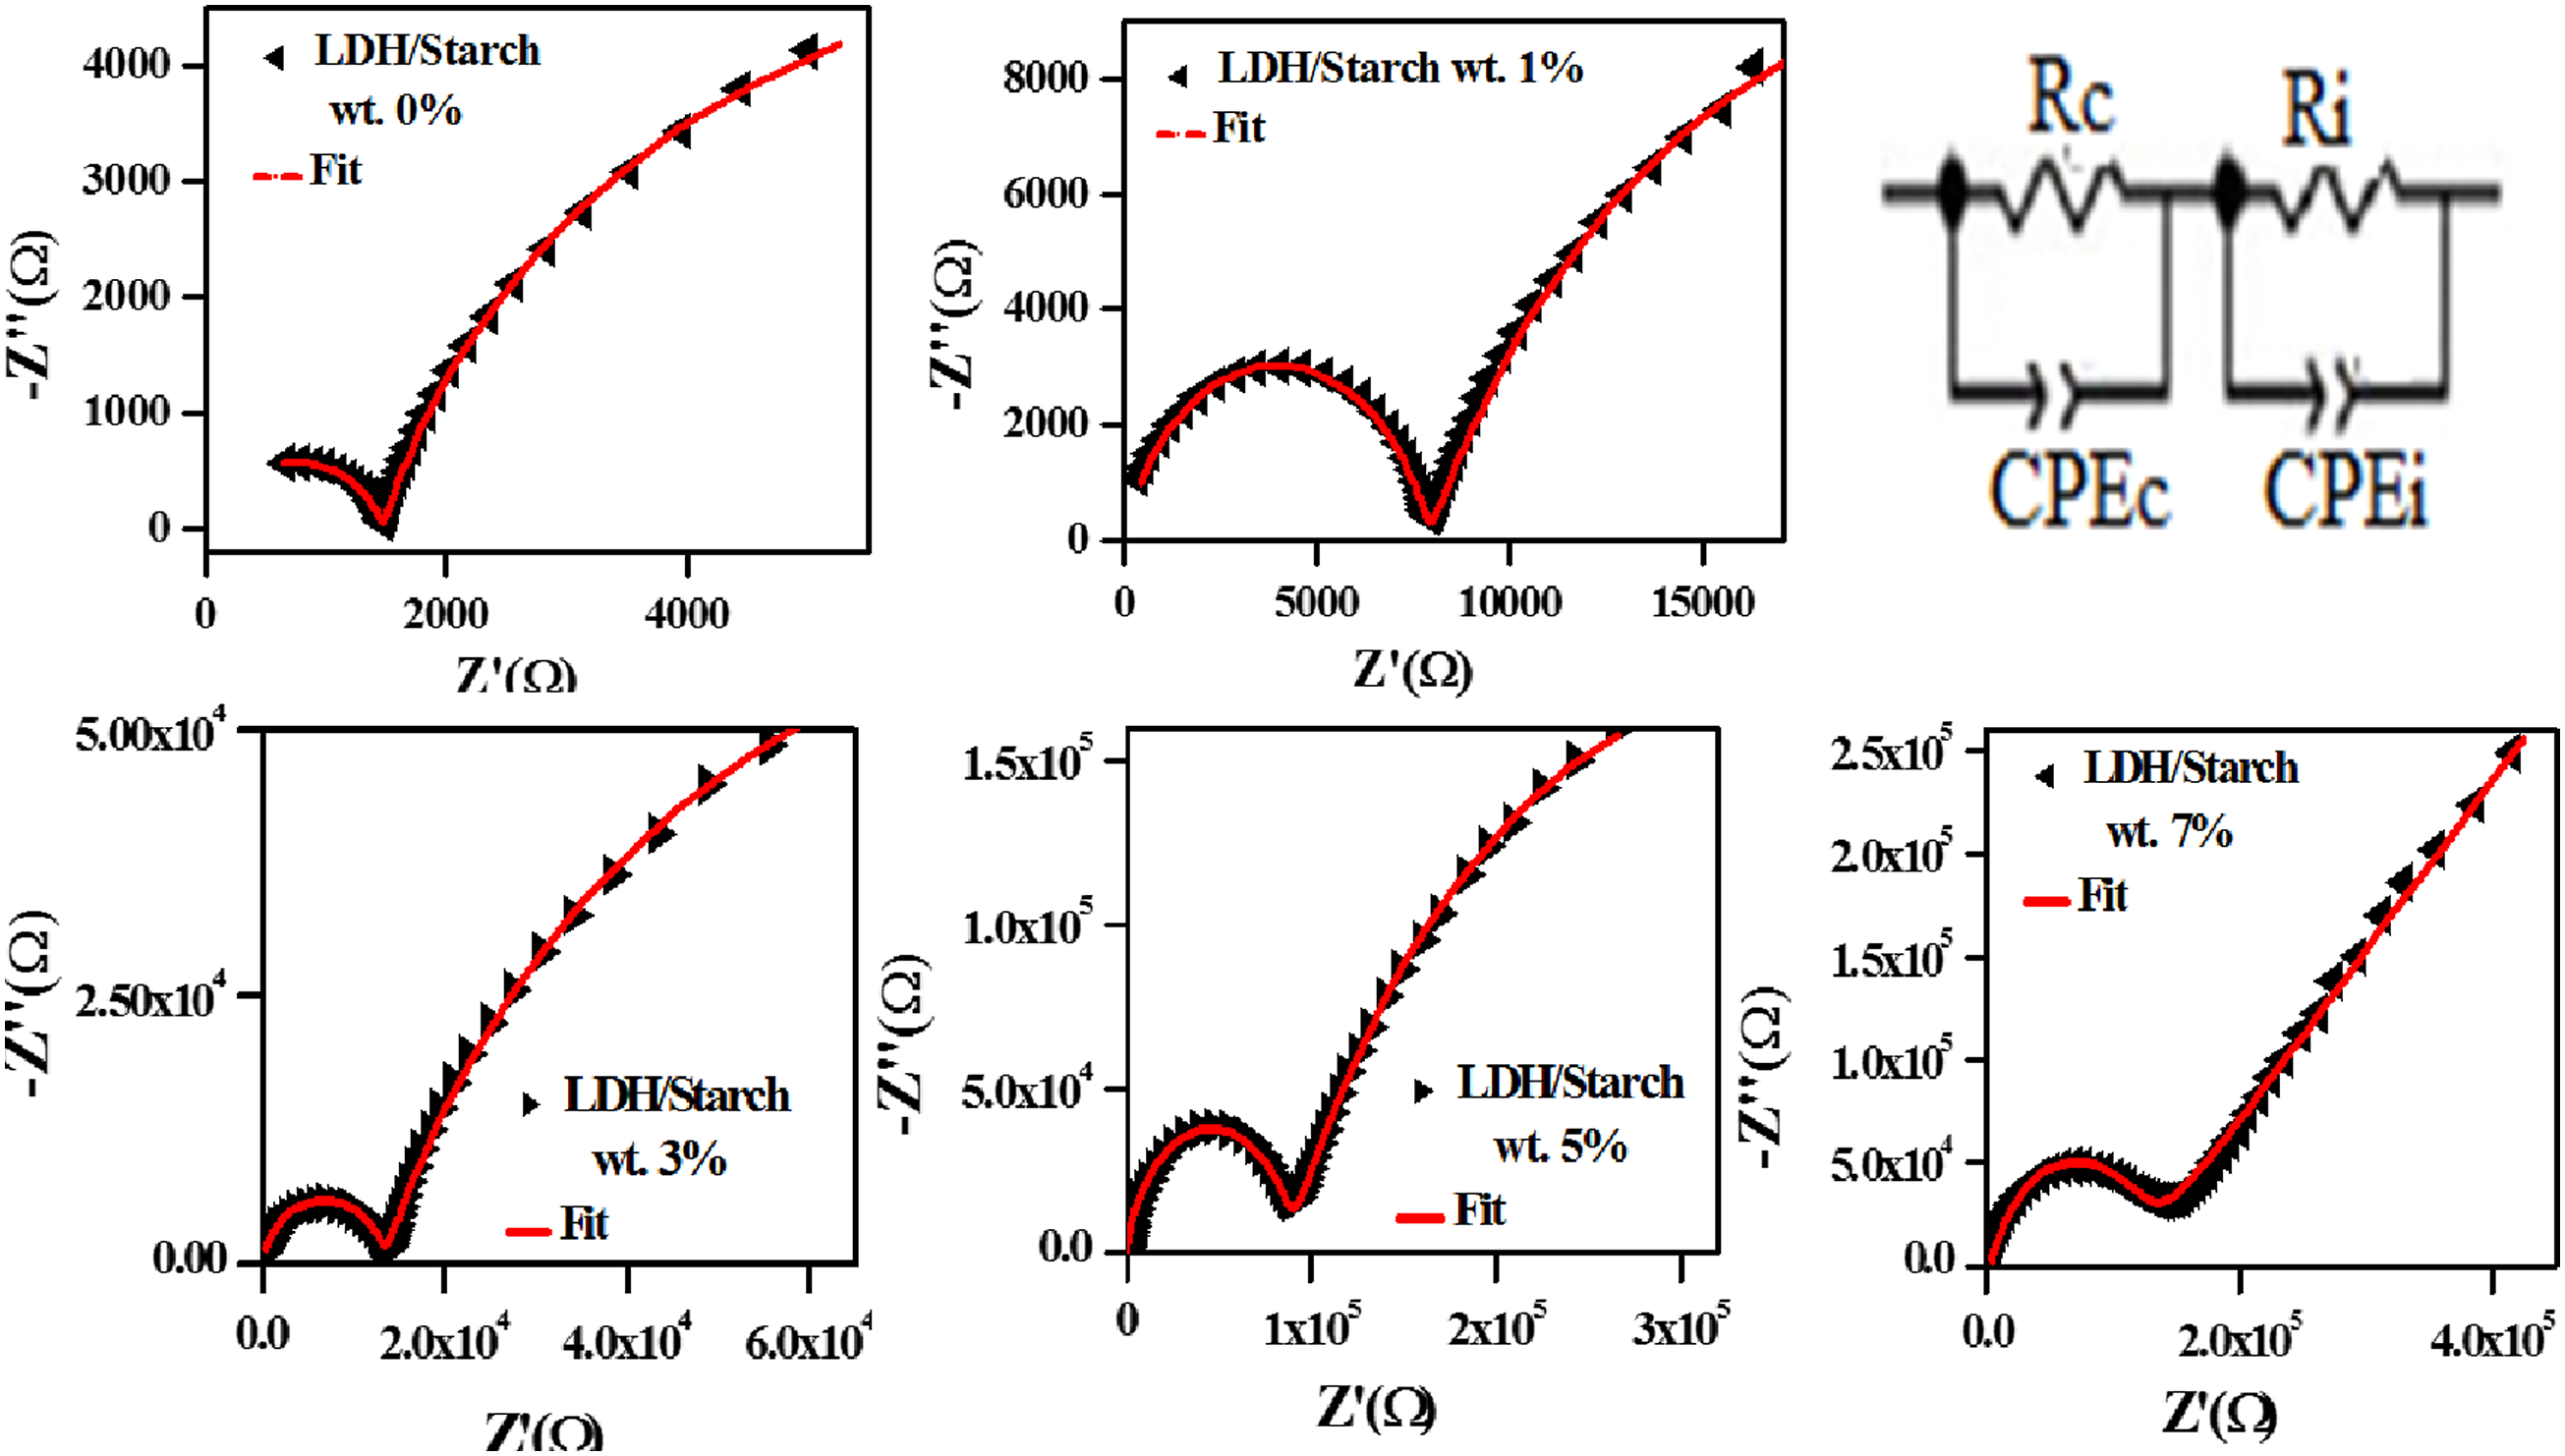
The Nyquist plots of the nanocomposite films are represented as depressed semicircular arcs suggesting non-Debye dispersive relaxation types Nyquist plots of nanocomposite films and the corresponding equivalent electrical circuit (inset).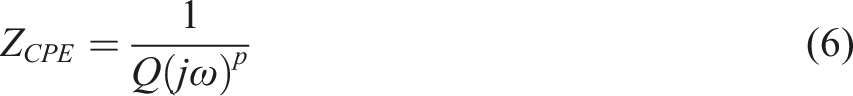
p is called the dispersion coefficient (0
The relaxation time (τ) and relaxation frequency (fr) can be calculated as follows:
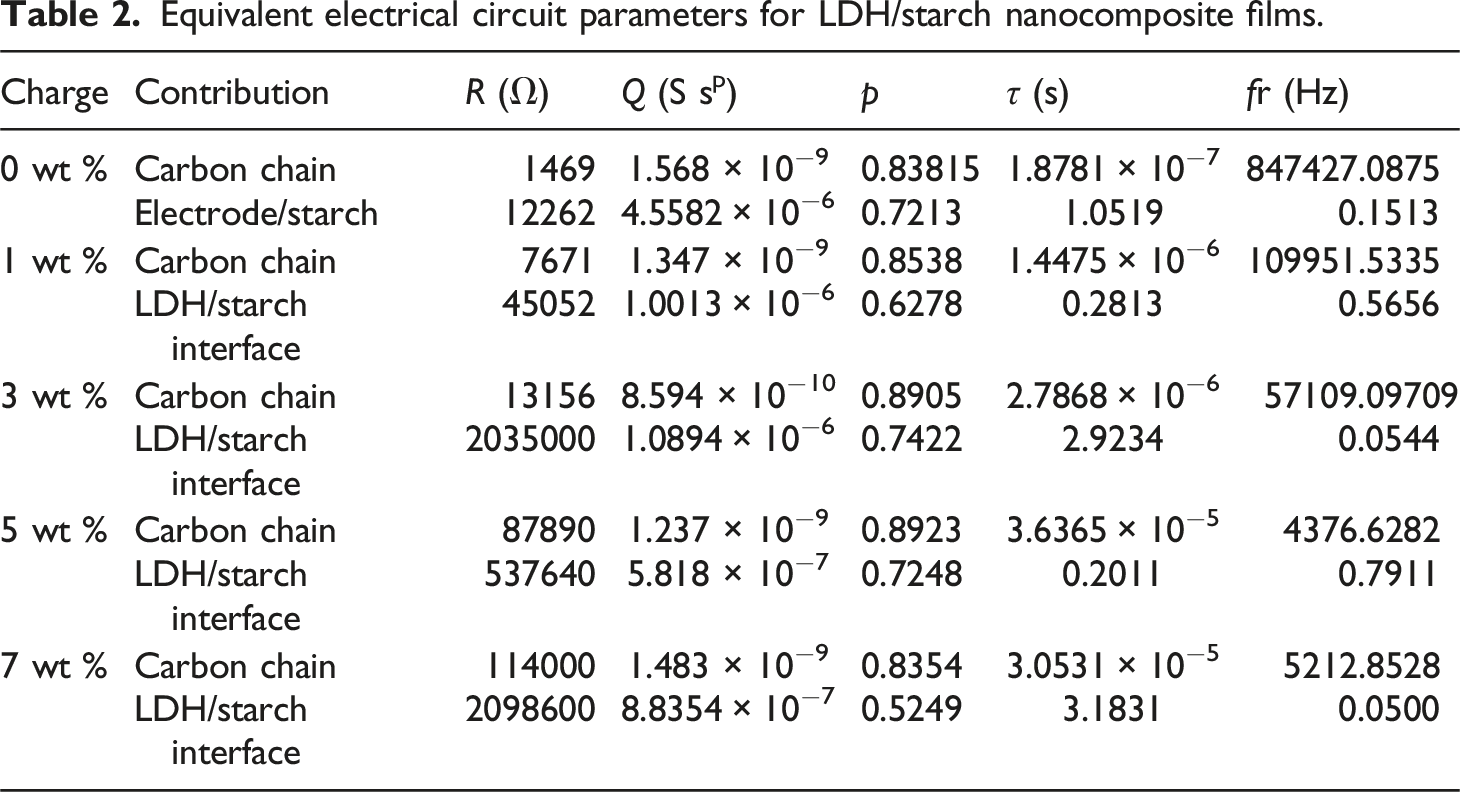
Equivalent electrical circuit parameters for LDH/starch nanocomposite films.
Relaxation frequency
The complex impedance allows us to explain the behavior of the polarization, since it is related to the complex permittivity by the following equation: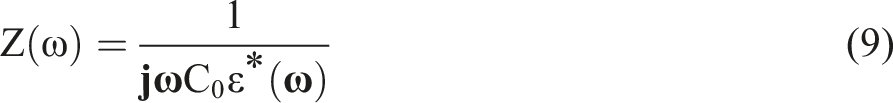
It is well known that the main advantage of the complex impedance formalism is that it brings out the intrinsic relaxation.
60
Thus, we can obtain out different relaxation frequencies via the maximums of the frequency dependence of the imaginary part (Z″) of the complex impedance (Z*) (Figure 13). In fact, two relaxation processes of the biofilms should be observed, but only the one related to the contribution of carbon chains is well represented. This is probably due to the fact that the relaxation frequency values of the other contribution (LDH/starch interface) are less than 1 Hz. The existence of such relaxation peaks at different frequency ranges is related to the existence of two electroactive regions at low and high frequencies. This indicates that the charge carriers responsible for the conduction behavior move over a long and short distances for the LDH/starch interface and carbon chain regions, respectively. It can also be seen that the relaxation frequency shifts towards the lower frequencies as the LDH content increases. The value of the relaxation frequency found graphically is in good agreement with that calculated using equation (8), indicating that the electrical equivalent circuit corresponds well to the electrical response of the samples. Imaginary part of complex impedance (-Z″) as a function of frequency.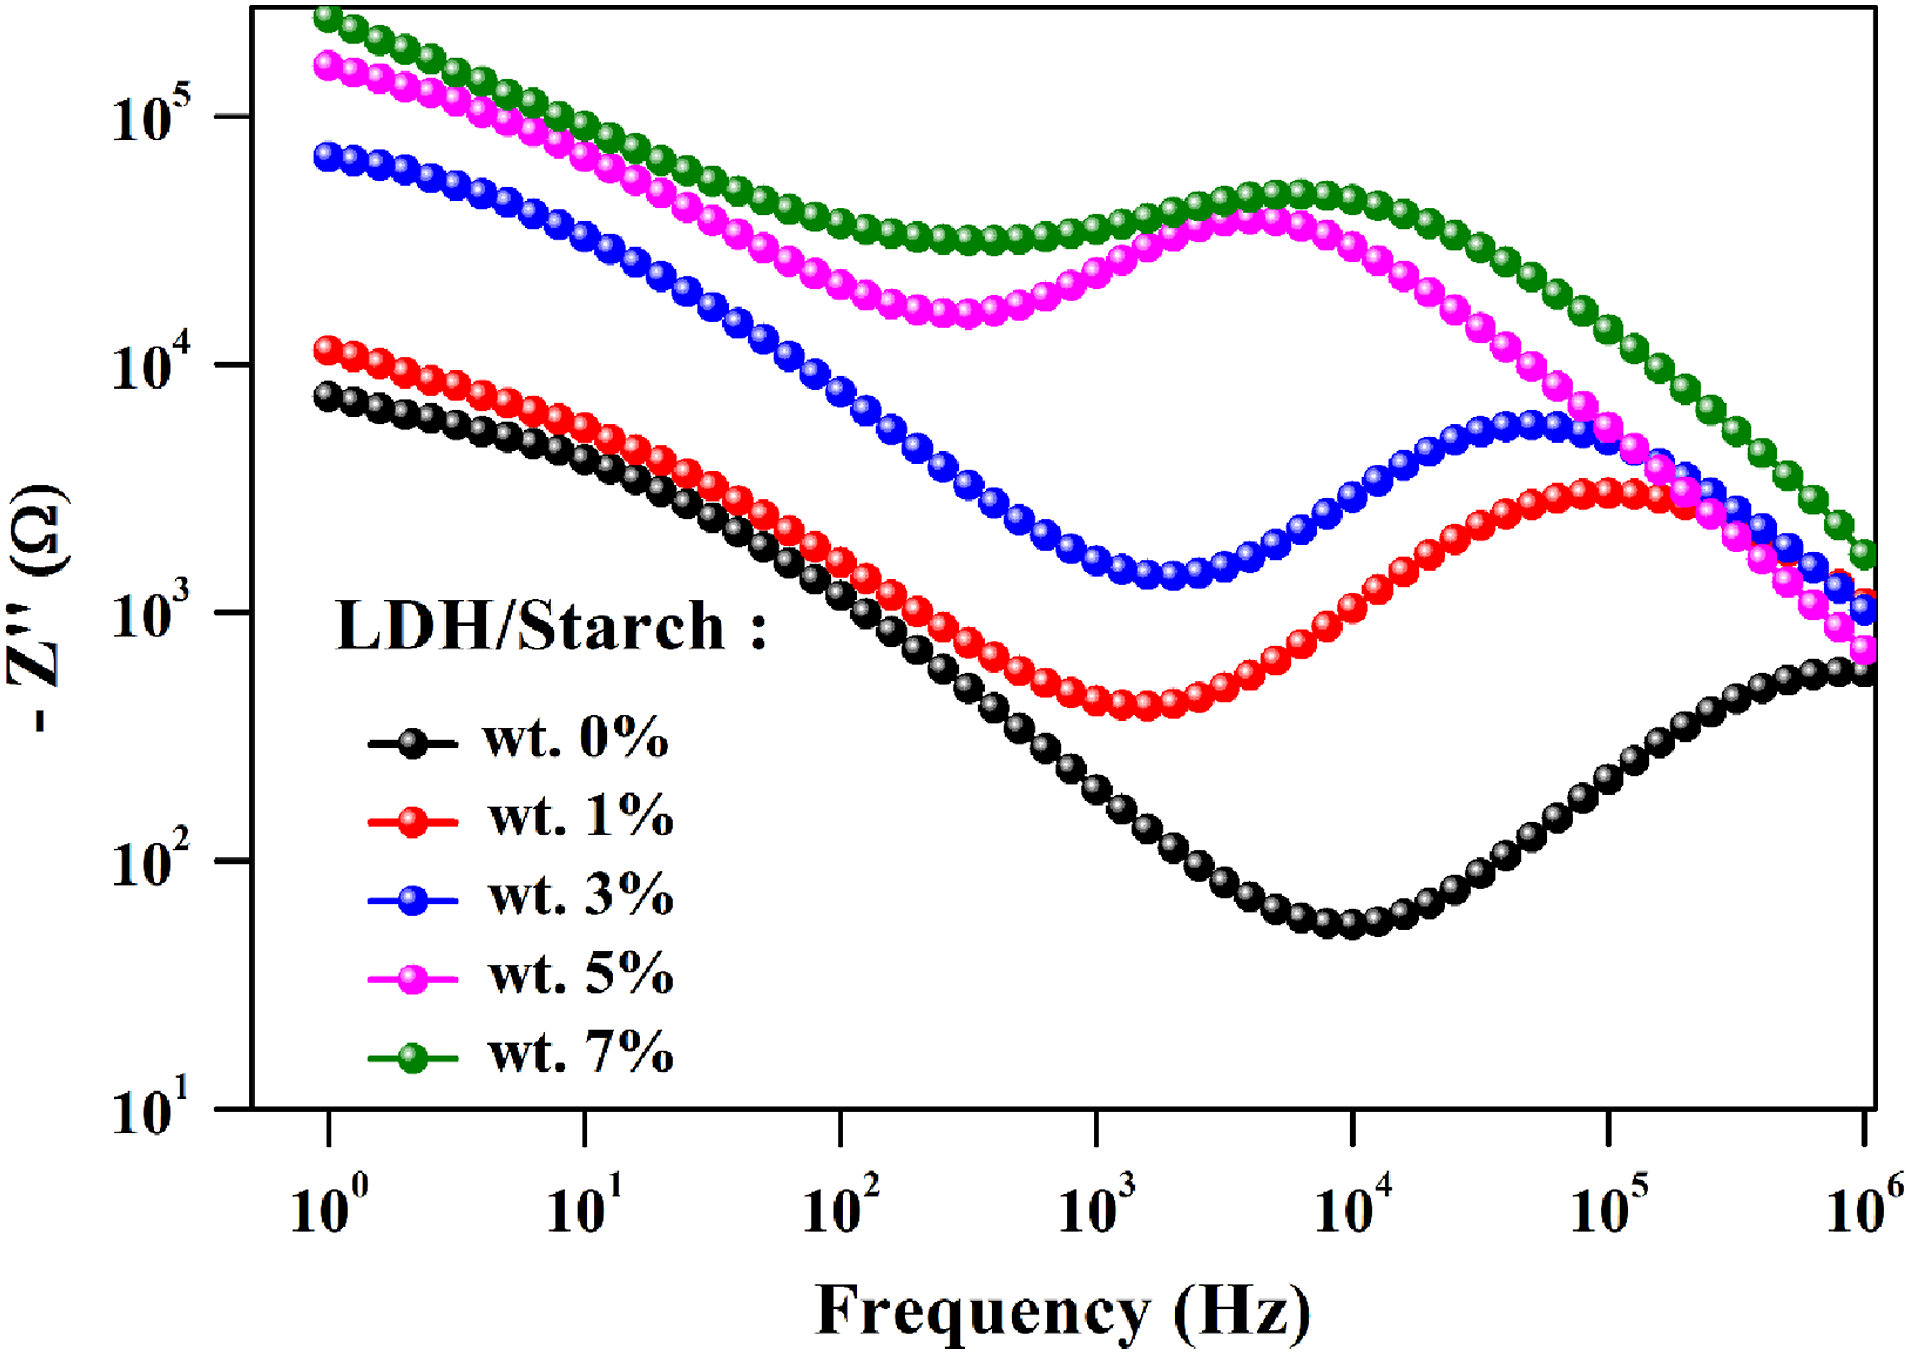
Frequency dependence of electrical conductivity
The complex conductivity is defined by the following expression:
The real part
The evolution of σac as a function of frequency for the synthesized nanocomposite films is shown in Figure 14(a). For each sample, σac increases with increasing frequency, which supports the hypothesis of the dominance of the hopping process in the conduction mechanism,61,62 and decreases with increasing LDH content, probably due to the poor conductive nature of the inorganic matrix. (a): Frequency dependence of electrical conductivity for nanocomposite films with different LDH content (b): dc electrical conductivity as a function of LDH content.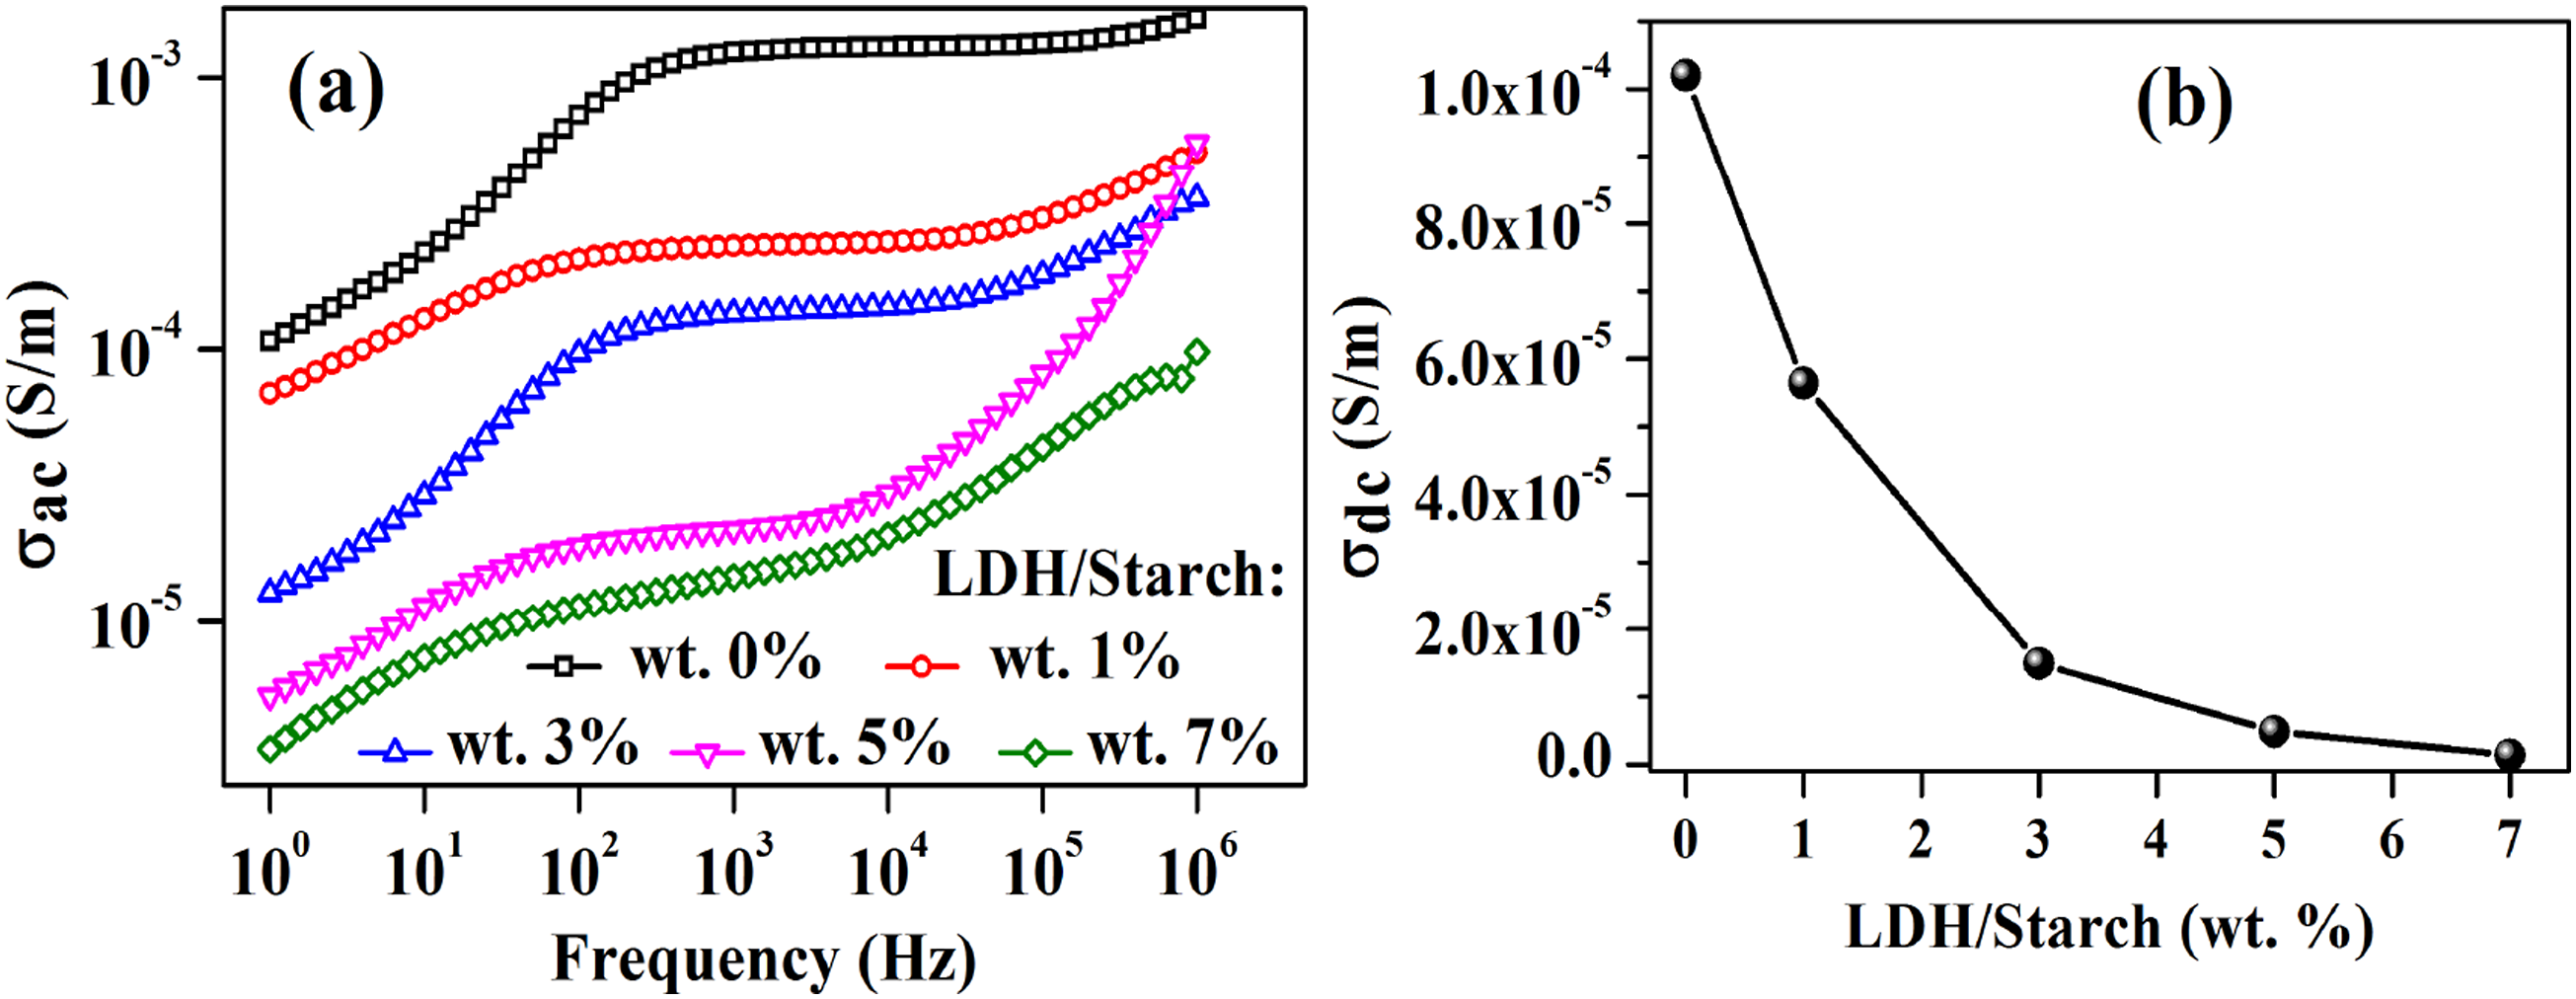
Furthermore, the conductivity at zero frequency called the residual conductivity or dc conductivity (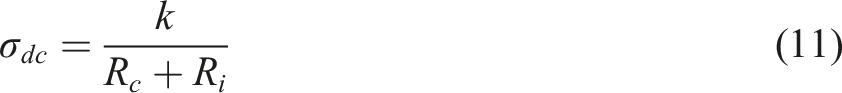
From Figure 14(b), it can be seen that
Dielectric properties
Today, material dielectric properties are of great interest to researchers as they are indispensable for industry applications such as energy storage devices.
Frequency dependence of dielectric constant
The study of the dielectric properties of materials is of great interest to researchers as they are essential for industrial applications such as the energy storage devices and semiconductors. The dielectric constant is defined as the ability of a material to polarize and store charge when an external electric field is applied. This parameter results from the orientation of the dipoles along the direction of the electric field.
64
It is defined as the real part of the complex relative permittivity which is expressed as follows:
The evolution of the dielectric constant as a function of frequency for the nanocomposite films is shown in Figure 15(a). The high dielectric constant values observed at low frequencies can be explained by the accumulation of charges at the electrode-sample interface.
65
It can be noted that the dielectric constant decreases from 0 to 5 wt % and then increases to 7 wt % LDH content, which is in agreement with the previous works.66,67 Moreover, compared to a preview work on polystyrene/montmorillonite nanocomposites,
68
the authors reported a similar effect of clay content in reducing the dielectric constant of nanocomposites from 0 to 5 wt %. Another study showed a decrease in the dielectric constant of poly (methyl methacrylate)/montmorillonite nanocomposites with increasing clay content from 0 to 5 wt %.
69
(a): Frequency dependence of dielectric constant for nanocomposite films with different LDH content and (b): Dielectric constant value at 1 MHz as a function of LDH content.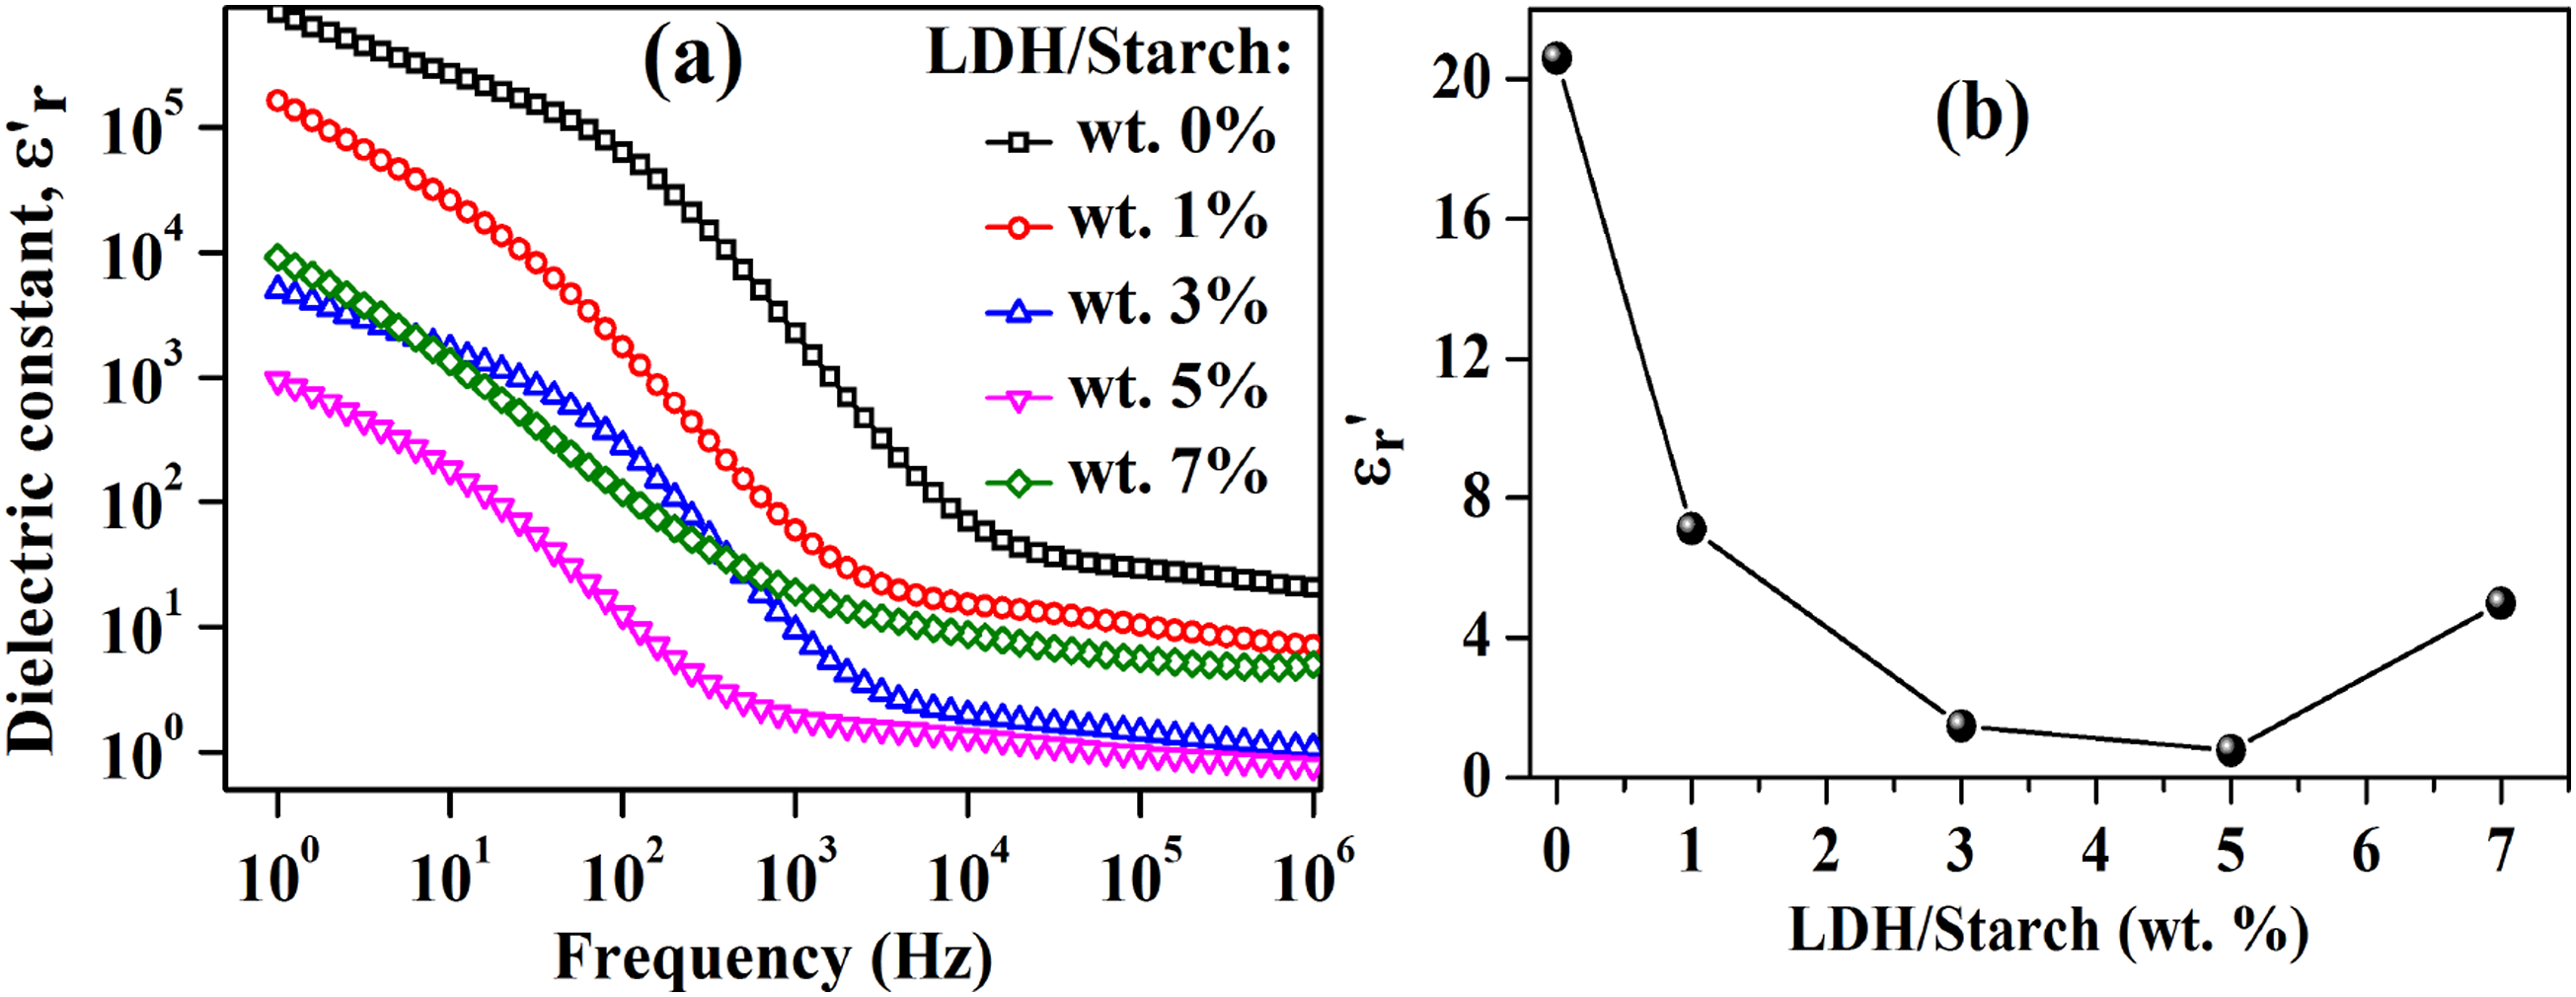
Moreover, the value of the dielectric constant at 1 MHz for each LDH content was reported in Figure 15(b) which showed a decrease of
Frequency dependence of dielectric loss tangent
The dielectric loss tangent (Tang δ) must be studied because it measures the dissipation of electrical energy in the form of heat, an essential parameter for evaluating the material before its industrial application.
70
The more the dielectric loss tangent is increased, the more the material heats up and the more its lifetime is reduced. Tang δ can be determined by the following relationship: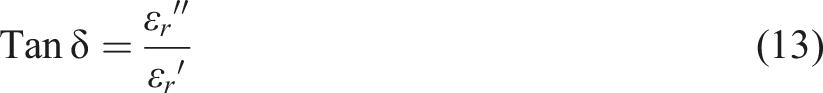
Figure 16(a) shows the evolution of the dielectric loss tangent as a function of frequency for the synthesized nanocomposite films. Indeed, as the LDH content increases from 0 to 7 wt%, the maximum of the dielectric loss tangent ( (a): Frequency dependence of dielectric loss tangent for nanocomposite films with different LDH content and (b): Dielectric loss tangent value at 1 MHz as a function of LDH content.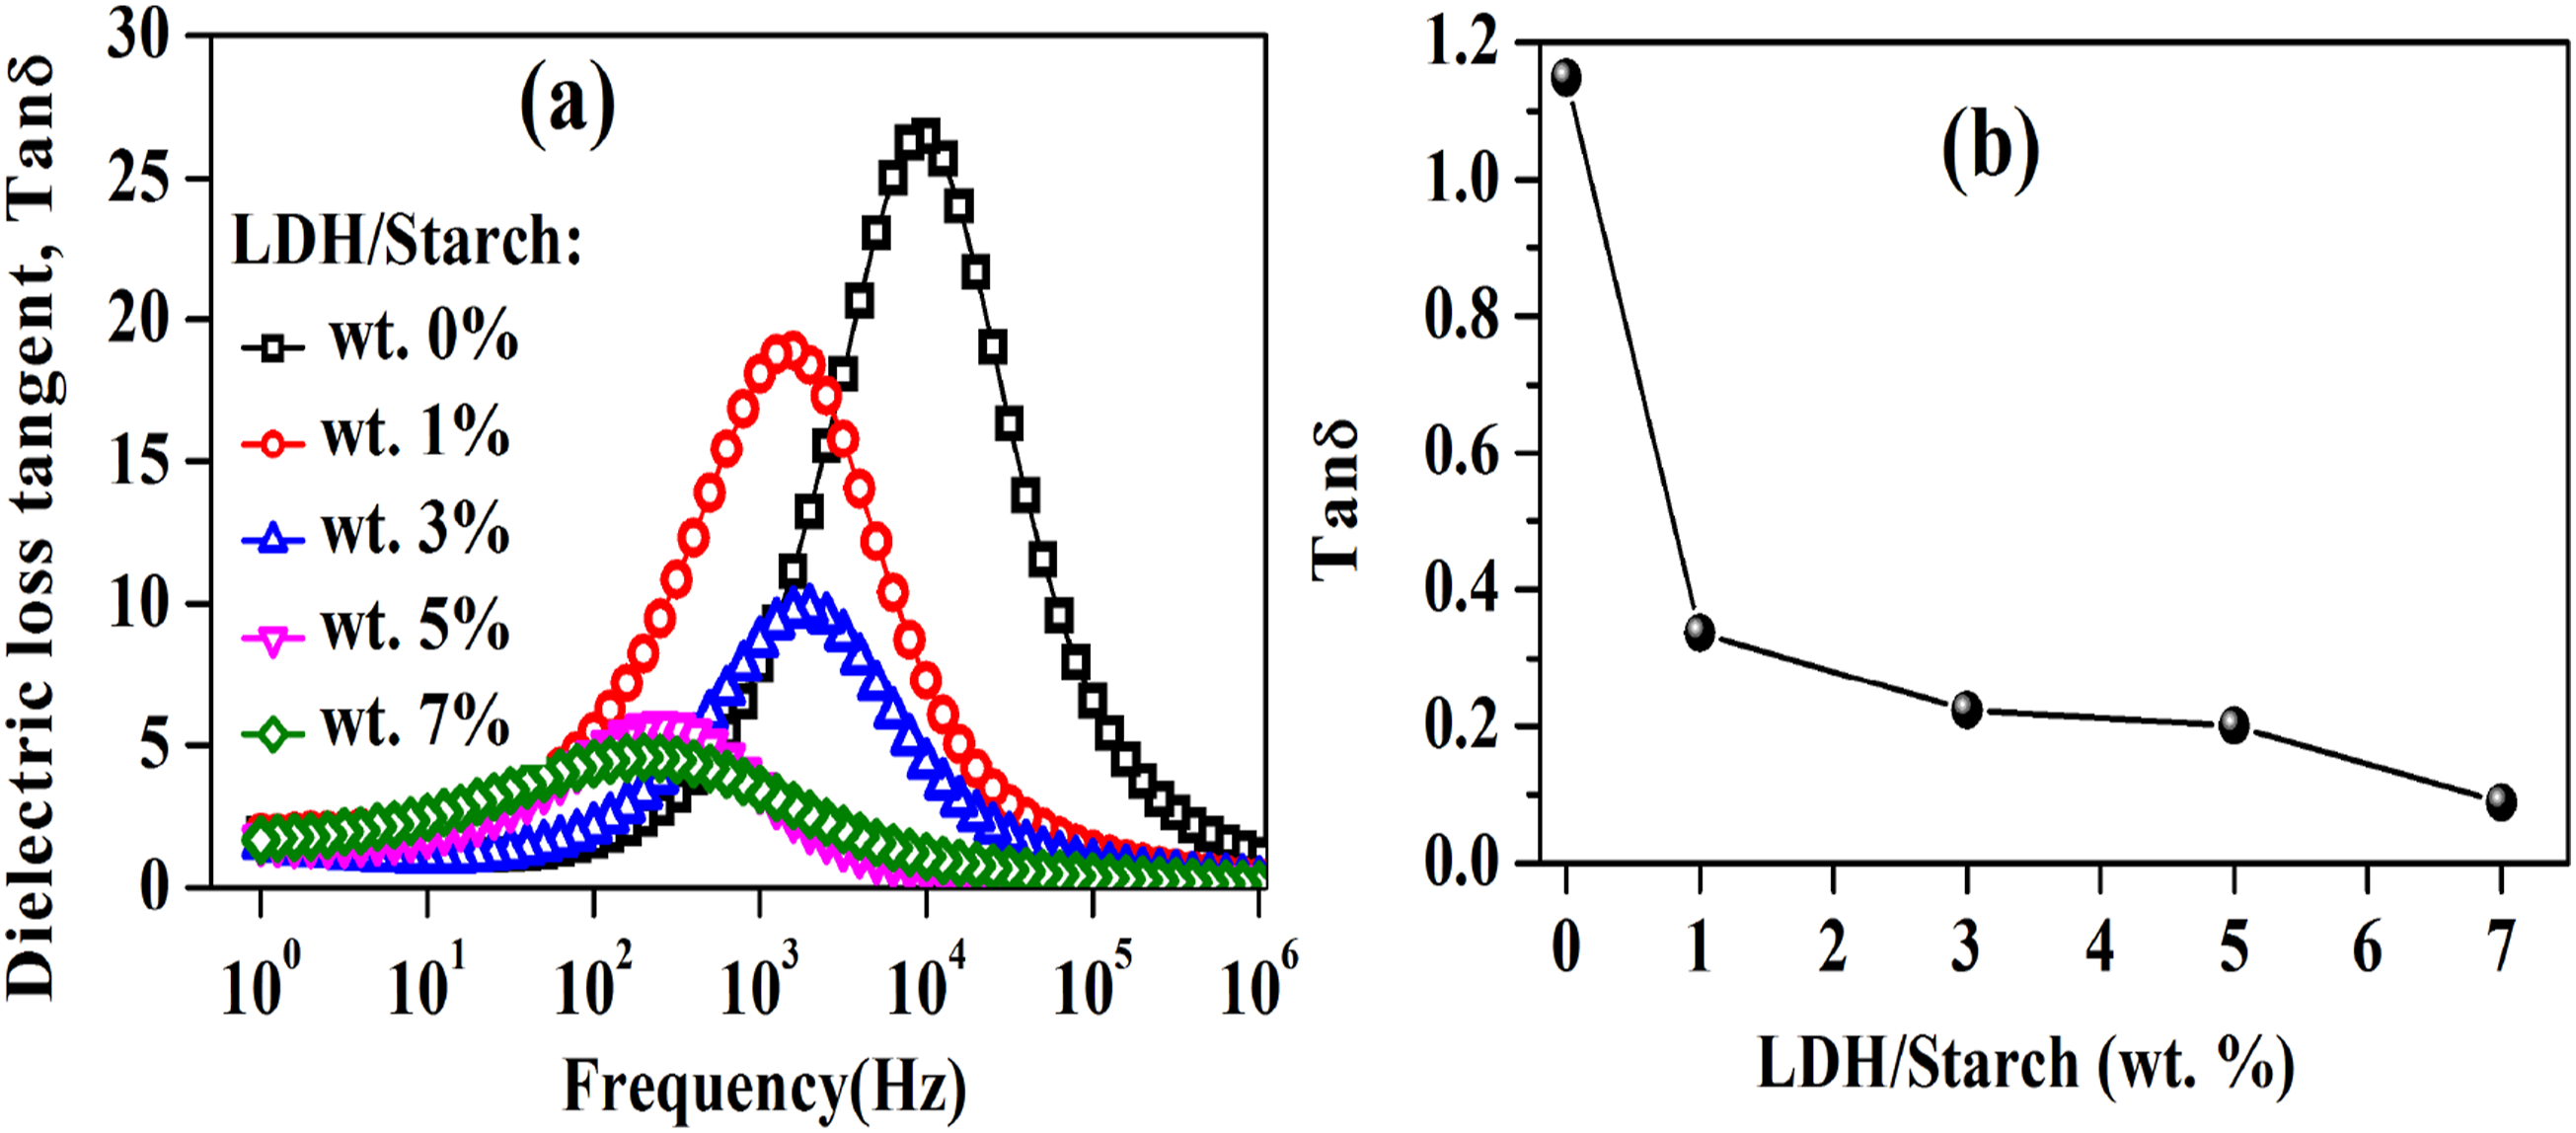
Moreover, in order to study the effect of the LDH content on the dielectric loss tangent, the evolution of Tan δ at 1 MHz has beed reported in Figure 16(b) which shows a decrease of this dielectric parameter with increasing LDH content. This indicates the benefit of LDH doping in improving the dielectric properties by reducing the energy dissipation.
Conclusion
This study reports the electrical, dielectric, optical, and mechanical properties of layered double hydroxide (LDH)/starch nanocomposite films. The LDH used was synthesized by co-precipitation at a constant pH by using magnesium and aluminum as divalent and trivalent metal cations, respectively and carbonate as an intercalated ion. The nanocomposite films were prepared by the aqueous solution casting method and LDH/starch of 0, 1, 3, 5 and 7 (wt. %). The dispersion of LDH in the nanocomposites was confirmed by X-ray diffraction, Fourier transform infrared spectroscopy, scanning electron microscopy and energy dispersive X-ray analysis. The electrical response of each nanocomposite was modelled by an equivalent electrical circuit consisting of two parallel combinations of resistance and pseudo-capacitance corresponding to the electrical response of the polymer carbon chains and the electrode-sample interface, respectively. The frequency dependence of electrical conductivity, dielectric constant and dielectric loss tangent was investigated using complex impedance spectroscopy. It was shown that an increase in LDH content leads to a decrease in the electrical conductivity and dielectric loss tangent with increasing LDH content which is of interest for dielectric applications, while the dielectric constant was decreased from 0 to 5 wt % before increasing to 7 wt %. In addition, with increasing LDH content, the nanocomposite films showed an increase in the absorption coefficients, a decrease of the optical gap energy and transmittance, and an increase in refractive index, optical conductivity and dielectric constant. It should be noted that both the Young’s modulus and stress plot showed an increase for the LDH content from 0 to 5 wt % before increasing to 7 wt %. According to these results, an improvement of the optical, dielectric and mechanical properties was shown through the LDH doping in the starch based nanocomposite films, which promote a versatile potential for the production of optoelectronic films as they are flexible, biodegradable, and environmentally friendly. In this case, the optimum amount of LDH particles required to produce high performance starch based films was found to be around 5 wt % LDH as it showed an improvement in optical, dielectric and mechanical properties.
Footnotes
Declaration of conflicting interests
The author(s) declared no potential conflicts of interest with respect to the research, authorship, and/or publication of this article.
Funding
The author(s) received no financial support for the research, authorship, and/or publication of this article.
Correction (October 2024):
Equation 5 has been updated in the article since its original publication.