
Abstract
Silica-based hybrid blends at different molecular or nanometer scale have gained a lot of interests from the technological point of view. In particular, several inorganic-organic hybrids find application in the biomedical field. In this context, inorganic SiO2 and hybrids made up of SiO2 and polyethylene glycol (PEG) have been synthesised via the sol-gel route and characterised from the morphological (throught the Atomic Force Microscopy - AFM) and spectroscopic point of view to shed light on their features as possible hybrid biomaterials. AFM investigation allowed for an effective quantitative evaluation of surface roughness of bioactive sol-gel-based materials. The results revealed an increase in material porosity as a function of the PEG amount in the systems, thus highlighting the pivotal role of the PEG amount as compatibilizing on the morphological features of silica-based blends. The co-presence of both the inorganic and organic phases was confirmed by the Fourier-transform infrared spectroscopy (FT-IR). Moreover, the influence of PEG was also investigated by analysing the deconvoluted FT-IR spectra in the range of 1600-750 cm−1.
Keywords
Introduction
The information derived from surface roughness evaluation by atomic force microscopy (AFM) is the quantitative and qualitative characterization of the surface topography and morphology of various materials and samples. Atomic force microscopy can measure the surface roughness parameters, such as the average roughness Ra (the average of absolute values of surface height variations), the root mean square RMS roughness (square root of the mean of squares of distances from the mean surface level), the peak-to-valley height, and the fractal dimension, which can provide insights into the surface quality, functionality, and performance of the materials and samples. 1 Atomic force microscopy can also image the surface features, such as the grains, pores, cracks, defects, and nanostructures, which can reveal the surface structure, composition, and properties of the materials and samples. 1
Some examples of the applications of AFM for surface roughness evaluation concern the possibility of measuring the surface roughness of (a) silicon wafers for semiconductor fabrication and quality control, 2 (b) polymer composites for aeronautical applications also optimizing their electrical, thermal, and mechanical properties, 3 and (c) biological samples for biomedical applications also understanding their cellular functions and interactions.
Sol-gel is a technique that involves the formation of a gel from a solution of metal or metalloid precursors, followed by drying and heat treatment to obtain a solid material. Sol-gel based materials have various advantages, such as low processing temperature, high purity, good homogeneity, and tunable properties.4–8 However, sol-gel based materials also tend to have high porosity, which can affect their surface roughness. 9 Porosity indicates the volume of empty spaces present in a material, while roughness indicates the degree of irregularity of the surface of a material. The porosity and roughness are two parameters that characterize the surface of a material and that can influence its interactions with biological tissue. The porosity of sol-gel based materials depends on several factors, such as the precursor type and concentration, the solvent type and amount, the pH and temperature of the solution, the drying method and rate, and the heat treatment conditions.7,10–12 The effect of porosity on surface roughness can be either positive or negative depending on the application and purpose of the sol-gel based materials. For some applications, such as catalysis, sensors, and drug delivery, high porosity and high surface roughness are desirable because they can increase the surface area and reactivity of the materials.13,14 For other applications, such as coatings, optics, and electronics, low porosity and low surface roughness are preferable because they can improve the smoothness and uniformity of the materials.15,16 Therefore, the roughness evaluated with atomic force microscopy (AFM) enhances with enhanced porosity of sol-gel based materials because the porosity creates irregularities and variations on the surface topography and morphology of the materials. The effect of porosity on surface roughness can be controlled by adjusting the sol-gel parameters and conditions to obtain the desired properties for different applications. The correlation between the roughness evaluated by atomic force microscopy (AFM) and porosity of sol-gel based materials is a topic that has been investigated by several researchers using different methods and techniques. The roughness of a silica and PEG-based material, assessed by atomic force microscopy (AFM), can influence the porosity of the material in different ways, depending on the synthesis and processing conditions.
Some studies have reported that there is a positive correlation between the roughness evaluated by AFM and porosity of sol-gel based materials. For example, a study 17 found that the surface roughness increased with increasing porosity of SiO2/PEG hybrid materials synthesized by sol-gel method. The study also found that the surface roughness increased with increasing PEG molecular weight. The authors suggested that the higher PEG molecular weight could increase the viscosity and gelation time of the sol, leading to more porous and rougher materials. Other studies have reported that there is a negative correlation between the roughness evaluated by AFM and porosity of sol-gel based materials. For example, a study 1 found that the surface roughness decreased with increasing porosity of SiO2/PEG hybrid films prepared by sol-gel method. The study also found that the surface roughness decreased with increasing PEG content and annealing temperature. The authors suggested that the increased PEG content and annealing temperature could improve the dispersion and compatibility of SiO2 and PEG, resulting in smoother and more homogeneous films. Since the porosity and roughness are two important parameters that can influence the biocompatibility and bioactivity of sol-gel materials, the objective of this work consisted in the morphological study, via AFM, of SiO2/PEG hybrid nanocomposites loaded at different weight percentages of PEG synthesized by sol–gel technique, whose bioactivity and biocompatibility have been demonstrated. 18 This study is aimed at obtaining information on the surface roughness also evaluating, at the same time, the distribution of the organic phase PEG within the inorganic phase SiO2 through AFM section analysis. AFM is a technique that allows to measure roughness with nanometric resolution, as well as observe the morphological and mechanical characteristics of the material.19–23 The correlation between porosity and surface roughness can be either positive or negative, depending on the type, composition, and structure of the bioactive sol-gel materials. 24
The biocompatibility of a bioactive sol-gel hybrid material based on SiO2 and polyethylene glycol (PEG) can be related to the increase in porosity and also surface roughness measured by atomic force microscopy (AFM) in different ways, depending on the type of application and the desired effect.
In general, one can say that an increase in porosity and roughness can have positive or negative effects on the biocompatibility of a bioactive sol-gel hybrid material based on SiO2 and PEG, depending on the context.
For example, an increase in porosity and roughness: • can favor the formation of a layer of apatite on the surface of the material, which is an indicator of bioactivity and biomineralization. This can improve the adhesion and proliferation of bone cells and facilitate the integration of the material with bone.
25
This effect is particularly useful for orthopedic and dental applications, where strong osteointegration between the material and bone tissue is required
7
• can enhance the surface area of the material and its ability to bind biological molecules, such as proteins, enzymes, antibodies or drugs. This can improve the functional properties of the material and its applicability as a biosensor, biocatalyst or controlled release system.
26
This effect is particularly useful for diagnostic, therapeutic and biotechnological applications, where high sensitivity, selectivity and efficacy of the material are required.
27
• can also cause a higher chemical reactivity of the material and a higher exposure of silanol groups. This can increase the risk of hydrolytic degradation of the material and the release of silicon ions into the biological medium. This can cause toxic or inflammatory effects on the cells and tissues surrounding.
28
In this work, the AFM results revealed an increase in material porosity as a function of the PEG amount in the nanocomposite systems. The AFM study allowed us to evaluate how, to relate the biocompatibility of a bioactive sol-gel hybrid materials based on SiO2 and PEG to the increase in porosity and also surface roughness measured by AFM, one must consider the type of application, the desired effect and the trade-off between the advantages and disadvantages that result from these parameters. This study paves the way for understanding that the enhancement of porosity and roughness surfaces of sol-gel SiO2/PEG materials can have various implications for different applications.
Some of the effects of porosity on the properties of SiO2/PEG sol-gel hybrid systems are refractive index, thermal conductivity, mechanical properties, biocompatibility. The refractive index of a material is a measure of how much it bends light. Porous materials have lower refractive indices than dense materials, because they contain more air, which has a refractive index close to 1. Therefore, by increasing the porosity of SiO2/PEG sol-gel hybrid systems, the refractive index can be reduced, which can improve their anti-reflective and optical properties. For example, one study 29 showed that the refractive index of SiO2/PEG sol-gel coatings can be adjusted in a continuous range between 1.14 and 1.20, using the timing when the PEG was added. The thermal conductivity of a material is a measure of how well it conducts heat. Porous materials have lower thermal conductivities than dense materials, because they contain more air, which is a poor conductor of heat. Therefore, by increasing the porosity of SiO2/PEG sol-gel hybrid systems, the thermal conductivity can be reduced, which can make them suitable for thermal insulation applications. For example, one study 30 showed that porous SiO2 cryogels prepared by sol-gel chemistry and freeze-drying have hierarchical structures with high porosity and low thermal conductivity. The mechanical properties of a material are a measure of how well it resists deformation or fracture under applied forces. Porous materials have lower mechanical properties than dense materials, because they have less material to support the load. Therefore, by increasing the porosity of SiO2/PEG sol-gel hybrid systems, the mechanical properties can be reduced, which can affect their durability and stability. However, some studies have shown that the addition of PEG can improve the mechanical properties of porous SiO2 sol-gel coatings by enhancing their flexibility and toughness. 27 The biocompatibility of a material is a measure of how well it interacts with biological systems, such as cells, tissues, organs, or blood vessels. Porous materials have higher biocompatibility than dense materials, because they can allow more fluid and nutrient exchange, as well as cell adhesion and proliferation. Therefore, by increasing the porosity of SiO2/PEG sol-gel hybrid systems, the biocompatibility can be improved, which can make them suitable for biomedical applications, such as drug delivery, tissue engineering, and wound healing.
Summing up, AFM analysis demonstrated that the bioactive and biocompatible organic–inorganic hybrid nanocomposites, consisting of polyethylene glycol (PEG) embedded in SiO2 matrix are rough nanostructured hybrids in which the organic and inorganic phase are bonded together at nanometer to sub-micrometer scales. The co-presence of both the inorganic and organic phases was confirmed by the Fourier-transform infrared spectroscopy (FT-IR).
Materials and methods
Materials
Tetraethyl orthosilicate (TEOS Si(OC2H5)4, Sigma-Aldrich, Darmstadt, Germany) pure ethanol (EtOH 99,8%, Sigma-Aldrich), polyethylene glycol (PEG400, Mw = 400 Da, Sigma-Aldrich), nitric acid (HNO3 65%, Sigma-Aldrich) and MilliQ water were used for the sol-gel synthesis. All the reagents for the sample analyses were of analytical grade.
Methods
The sol-gel synthesis
The SiO2 matrix has been synthesized via the sol-gel route with different amounts of PEG (from 0 to 50 wt.%). All the reagents, as well as the ratio used, have been reported in Figure 1. Reagents, molecular ratio, sol-gel steps and labels of the synthesised materials.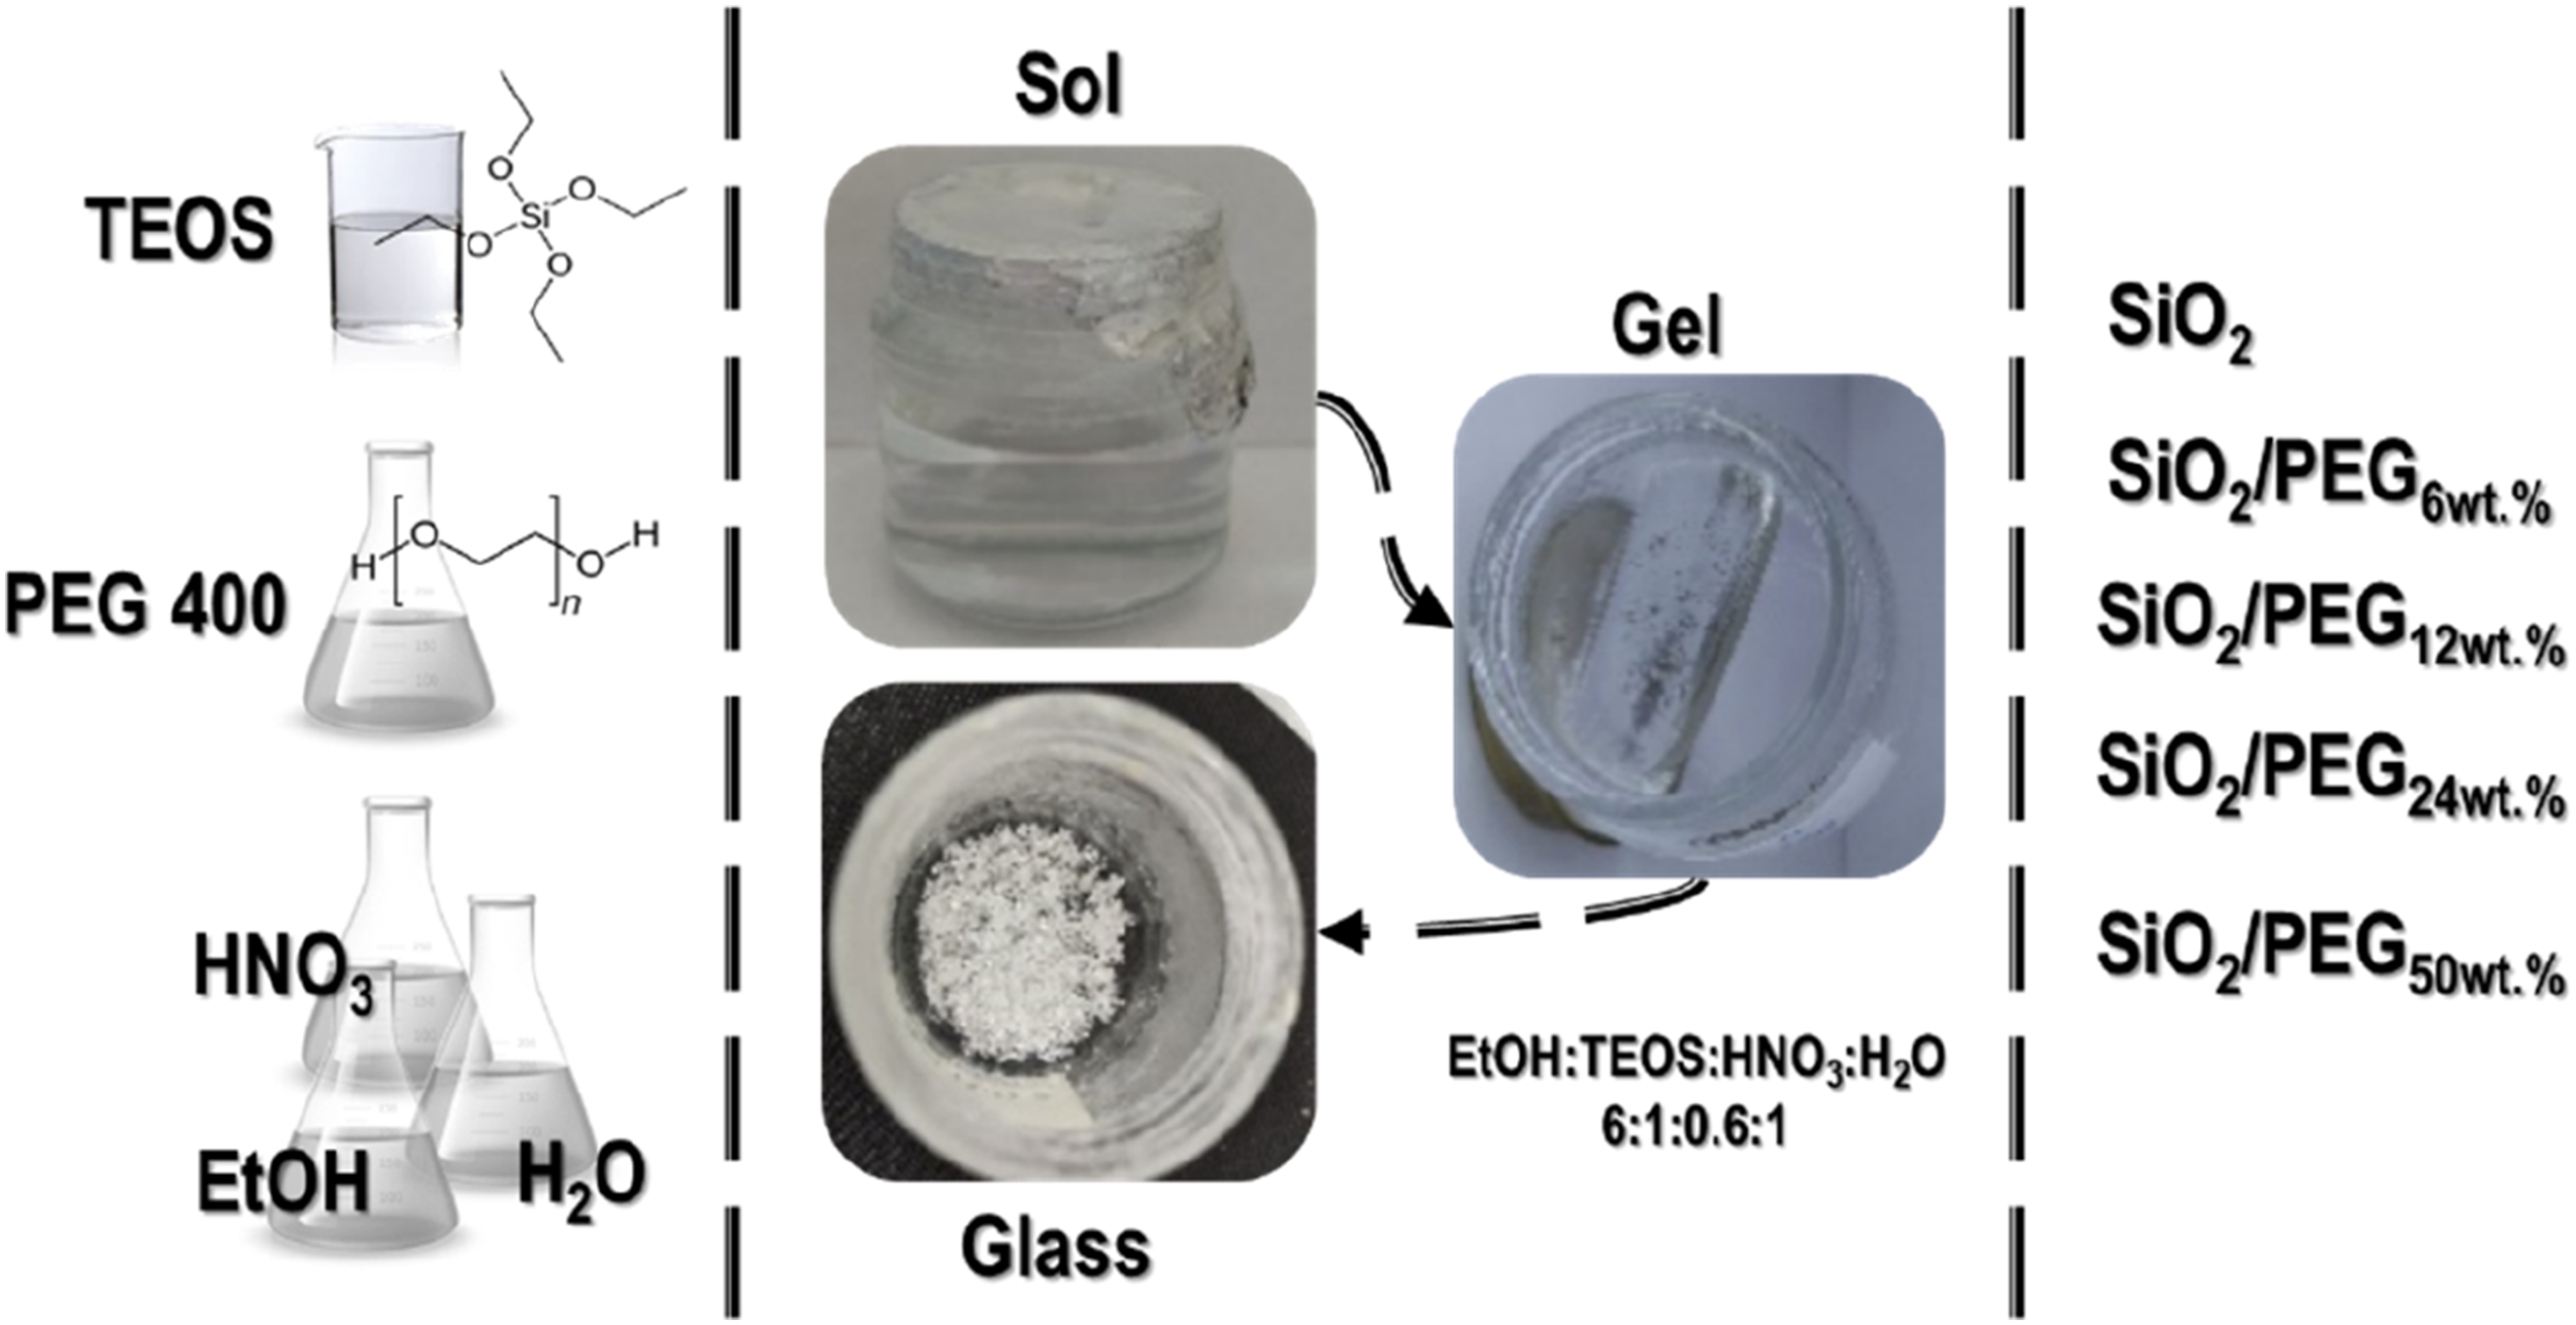
As regards the SiO2 synthesis, TEOS was added to EtOH and MilliQ water under continuous magnetic stirring. To increase the hydrolysis rate,11,31 nitric acid has been added to the solution. This latter was stirred for 20 min and carefully closed. After gelation occurrence, the system was opened, and the obtained wet gel was dried at 40°C for 24 min to get the glassy SiO2. All the other systems have been synthesized with the same procedure by preparing the TEOS, EtOH and MilliQ water-based solutions mixed with different amounts of PEG (6, 12, 24 and 50 wt.% with respect to the silica content) before the addition of nitric acid.
Atomic force microscopy
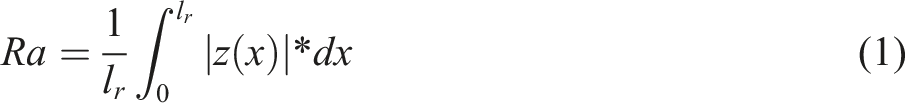
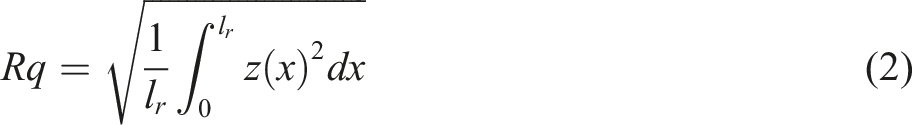
Atomic force microscopy (AFM) analysis was performed by means of a BrukerNanoScopeV multimodeAFM (Digital Instruments, Santa Barbara, CA, USA) apparatus to quantify the surface roughness parameters and analyze the nanoscale surface morphology of sol-gel based materials. The resulting map represents the surface topography of the analysed samples. Topographic height images were acquired at room temperature and processed using a Bruker software Nanoscope Analysis 1.80 (BuildR1.126200). The AFM measurements were performed in tapping mode. In this mode, a sharp tip attached to a cantilever is oscillated at its resonant frequency so that the tip intermittently touches the sample surface. Topography is constructed by detecting changes in amplitude or phase caused by tip-surface interaction during scanning. The deflection is detected by a laser beam reflected from the cantilever into a photodiode. The height of the tip is then adjusted to maintain a constant force or deflection, and the height data is recorded as a function of the tip position. The maximum lateral resolution is linked to the radius of curvature of the tip, typically a few nm, while the vertical one is of the order of a few Å. In this work, the tip is characterized by a radius of 5−10 nm, a nominal spring constant of 20−100 N/m, and resonance frequencies of 200−400 kHz. Thanks to the intermittent and non-continuous contact, this way of working reduces damage to the tip or the surface of the sample and is particularly suitable for the study of soft materials such as organic or biological ones. For each analyzed sample, several AFM images were acquired at different locations to evaluate the trend of the roughness parameters and verify if these are reproducible on different scanned areas of the samples. The scanning rate was 0.500 Hz per scan line, with 512 pixels per line. In order to evaluate the surface roughness, different roughness parameters are generally estimated and applied. In this work, to derive the quantitative roughness, two of the most relevant height parameters, namely, the roughness average (Ra) and the root mean square roughness (Rq), have been considered. More precisely, Ra represents the arithmetic mean of the absolute values of the height of the surface profile, and Rq is analogous to the roughness average (Ra), with the only difference that Rq is more sensitive to peaks and valleys than Ra, due to the squaring of the amplitude in its calculation. These amplitude parameters, which characterize the surface based on the vertical deviations of the roughness map from the mean surface, are extensively used in the literature.32,33 For all the samples, the Ra and Rq parameters were evaluated, according to equations (1) and (2):
Fourier-transform infrared spectroscopy
The interactions between the inorganic and organic components were examined using the FT-IR technique. The absorbance spectra were obtained with the aid of a Prestige 21 (Shimadzu, Milan, Italy) instrument. The spectra were captured with a resolution of 2 cm−1 (64 scans) in the 400–4000 cm−1 range. FT-IR analysis was performed on KBr discs containing 198 mg of salt and 2 mg of sample powder. The software packages IR Solution and Origin were used to process the recorded spectra. The Multiple Peak Fit tool in Origin 8 software was used to deconvolute the primary peak in the 1600–750 cm−1 range.
Results
Morphological characterization: Surface roughness study
The knowledge of the surface texture and microstructure represents a crucial aspect of understanding the nature of the material surface. In this context, it is essential to verify the effectiveness of the adhesion at the interface between the polymer matrix and the filler particles. In this regard, the use of organic compatibilizing agents such as polyethylene glycol (PEG) for immiscible polymer blends, 34 together with the incorporation of nanoparticles such as montmorillonite (MMT) 35 which can generate high-performance materials integrating the merits of both polymer blends and nanocomposites have proven to be a winning strategy to enhance interface connection. In fact, the key role played by a compatibilizer is to improve the interfacial adhesion and stability of two or more incompatible polymers by reducing the interfacial tension and increasing the interfacial area.
In this work, Atomic Force Microscopy (AFM) was used to evaluate the surface roughness of the silica-polyethylene glycol (SiO2/PEG) hybrid systems, synthesised via the sol-gel route, and their nanoscale surface morphology as a function of the different PEG amounts. The versatility of sol–gel SiO2-based materials has led to the formation of polymer hybrids with high performance.36,37 The SiO2/PEG inorganic-organic biomaterials were found to be bioactive and biocompatible through a characterization of their structure and biological properties demonstrating the potential use of the obtained hybrids in dental or orthopedic applications. 18 PEG which constitutes the organic (polymer) phase is a versatile, biocompatible polymer 38 which was capable of imparting bioactivity and biocompatibility to the final hybrid systems when it was added to inorganic silica sol–gel matrix. 39
In particular, the AFM technique made it possible to measure the roughness of the samples, also evaluating the effect on it of the different quantities of PEG. In this work, a detailed AFM analysis was employed to investigate the peculiar morphology of SiO2 and SiO2/PEG materials obtained by sol-gel method in order to demonstrate the relationship between the surface roughness of the analysed samples and their porosity. Greater porosity due to the addition of the PEG polymer translates into greater adhesion leading to sol-gel hybrid materials characterized by high bioactivity. One possible reason why the adhesion and therefore bioactivity increase as the porosity of the SiO2/PEG material increases due to the addition of PEG is that the porous structure of the material can enhance the interaction with biological fluids, such as simulated body fluid (SBF) or blood plasma. The porous structure can provide more surface area and sites for the adsorption and deposition of biomolecules, such as proteins, calcium, and phosphate ions, which can form a bioactive layer on the surface of the material. This bioactive layer can promote the attachment and proliferation of cells, such as osteoblasts or fibroblasts, which can improve the biocompatibility and bioactivity of the material.18,27 Another possible reason is that the addition of PEG can improve the hydrophilicity and flexibility of the SiO2/PEG material, which can also affect its adhesion and bioactivity. PEG is a polymer that has many applications in biomedicine, such as drug delivery, tissue engineering, and wound healing. PEG can increase the water uptake and swelling of the SiO2/PEG material, which can make it more compatible with biological fluids and tissues. PEG can also increase the elasticity and toughness of the SiO2/PEG material, which can make it more resistant to cracking and deformation under mechanical stress. 40 These are some of the possible reasons why the adhesion and therefore bioactivity increase as the porosity of the SiO2/PEG material increases due to the addition of PEG. However, there may be other factors that also influence these properties, such as the surface roughness, crystallinity, chemical composition, and morphology of the material. Therefore, more research is needed to optimize these parameters for different applications.
It is worth noting that the salient features of the observations that have been the driving force of our research work consist in wanting to give added value to the understanding of the properties of the bioactive and biocompatible SiO2/PEG nanocomposites, suitably synthesized for applications in the biomedical field on the basis of the interactions explored at the molecular level. In this regard, AFM analysis demonstrated that the silica-based blends are rough nanostructured hybrids in which the organic and inorganic phases are bonded together at nanometer to sub-micrometer scales. Summing up, in this work, through AFM morphological analysis, we aim to provide the reader with new insights and information that can demonstrate at the nanoscale level the interpenetration of the two phases (organic-inorganic), while supporting the relevant bioactivity and biocompatibility properties already demonstrated for the hybrid samples 18 here analyzed obtained using the sol-gel technique that involves the formation of a gel from a solution of metal or metalloid precursors, such as tetraethyl orthosilicate (TEOS) for SiO2. The gel can then be dried and heat-treated to obtain porous materials with different shapes and sizes. 41
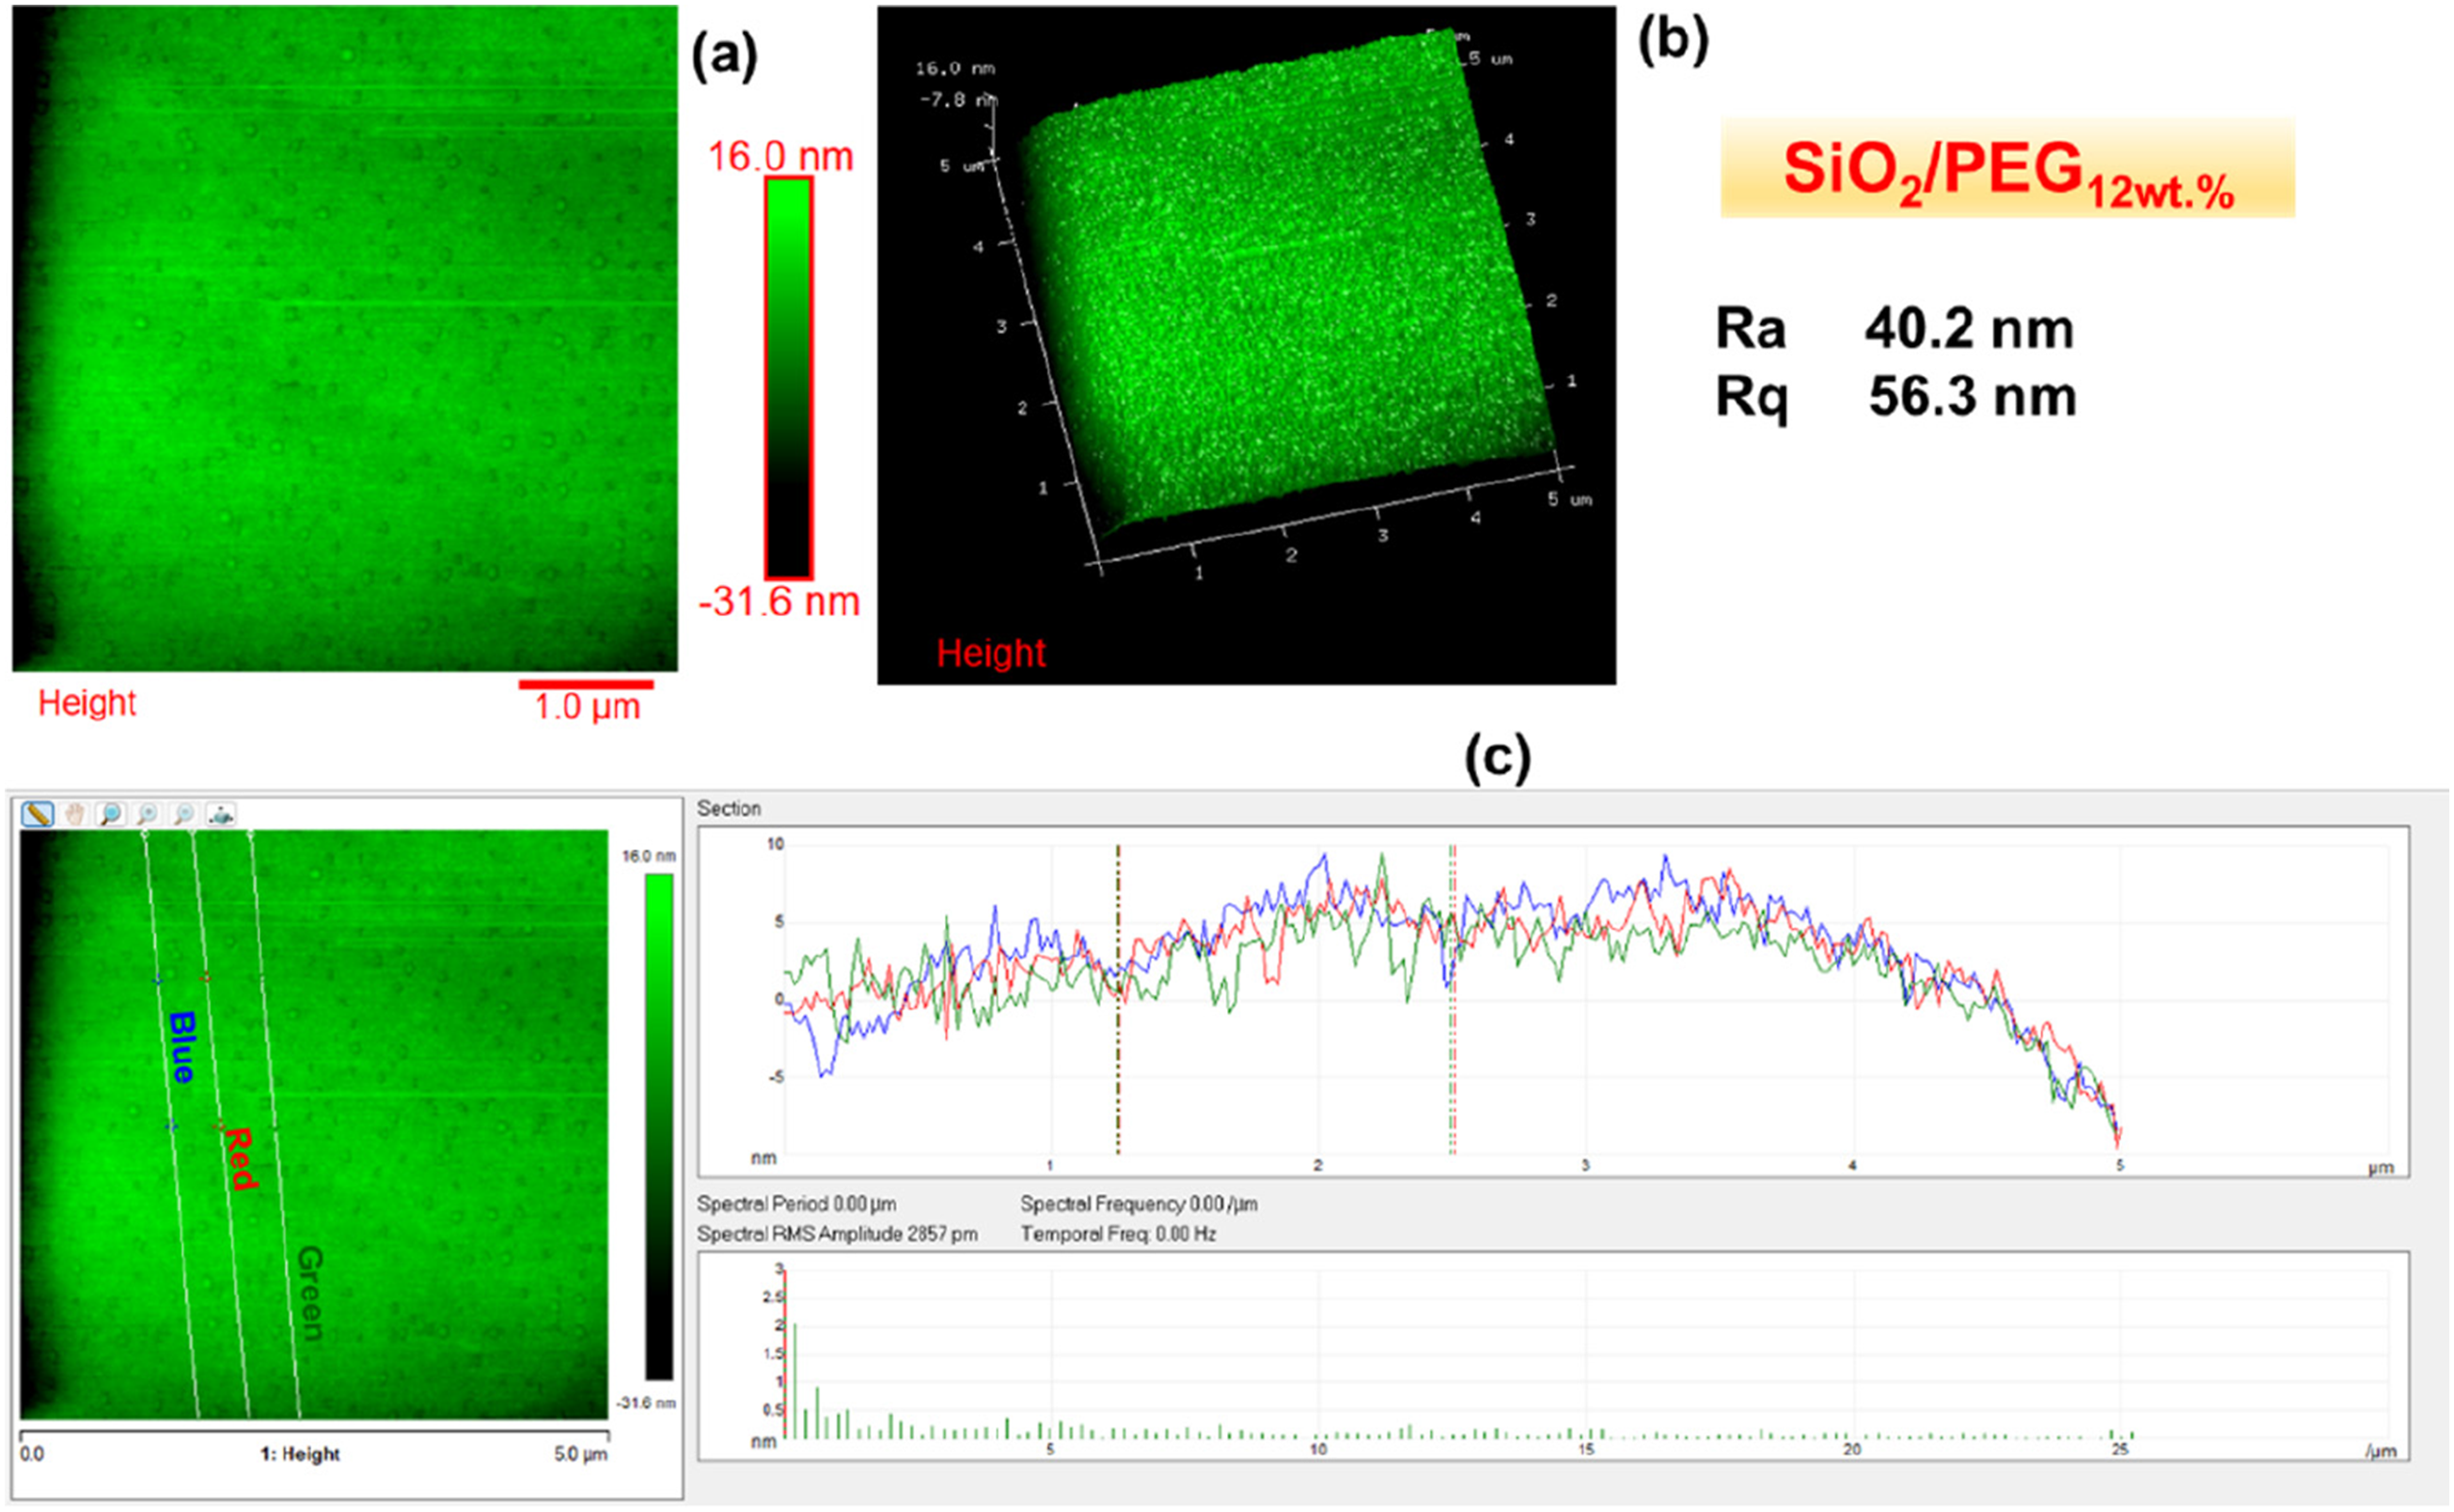
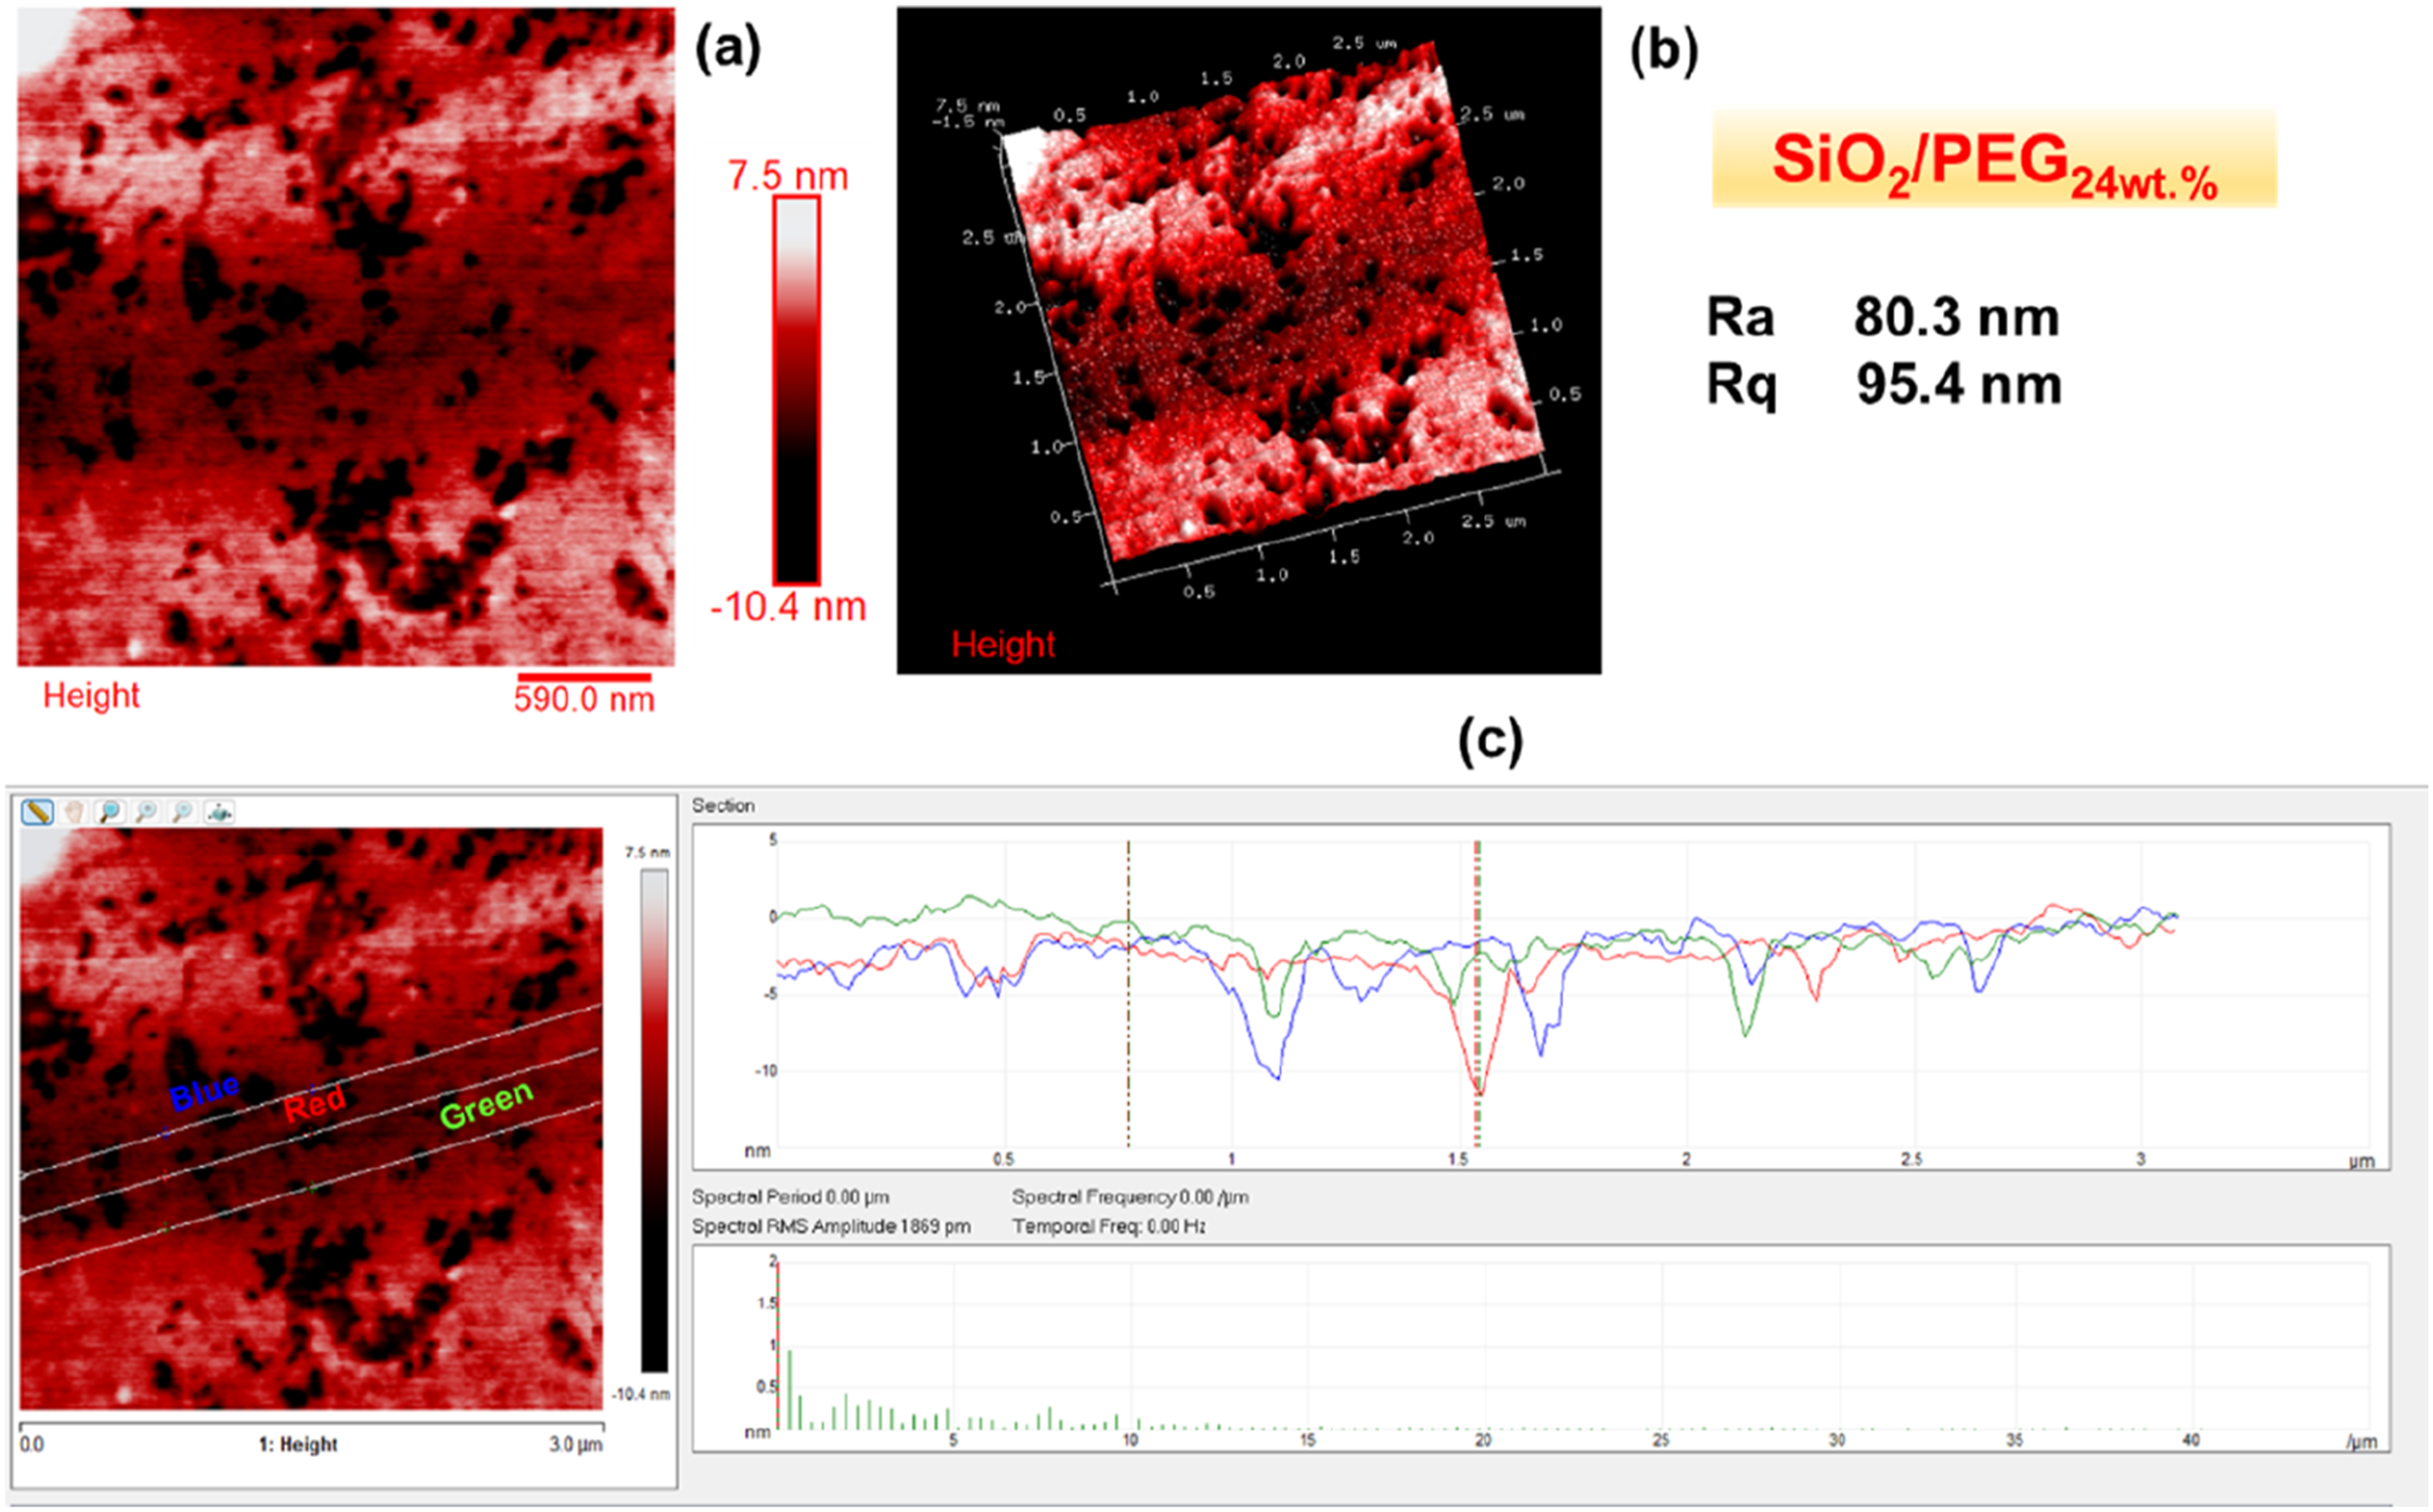
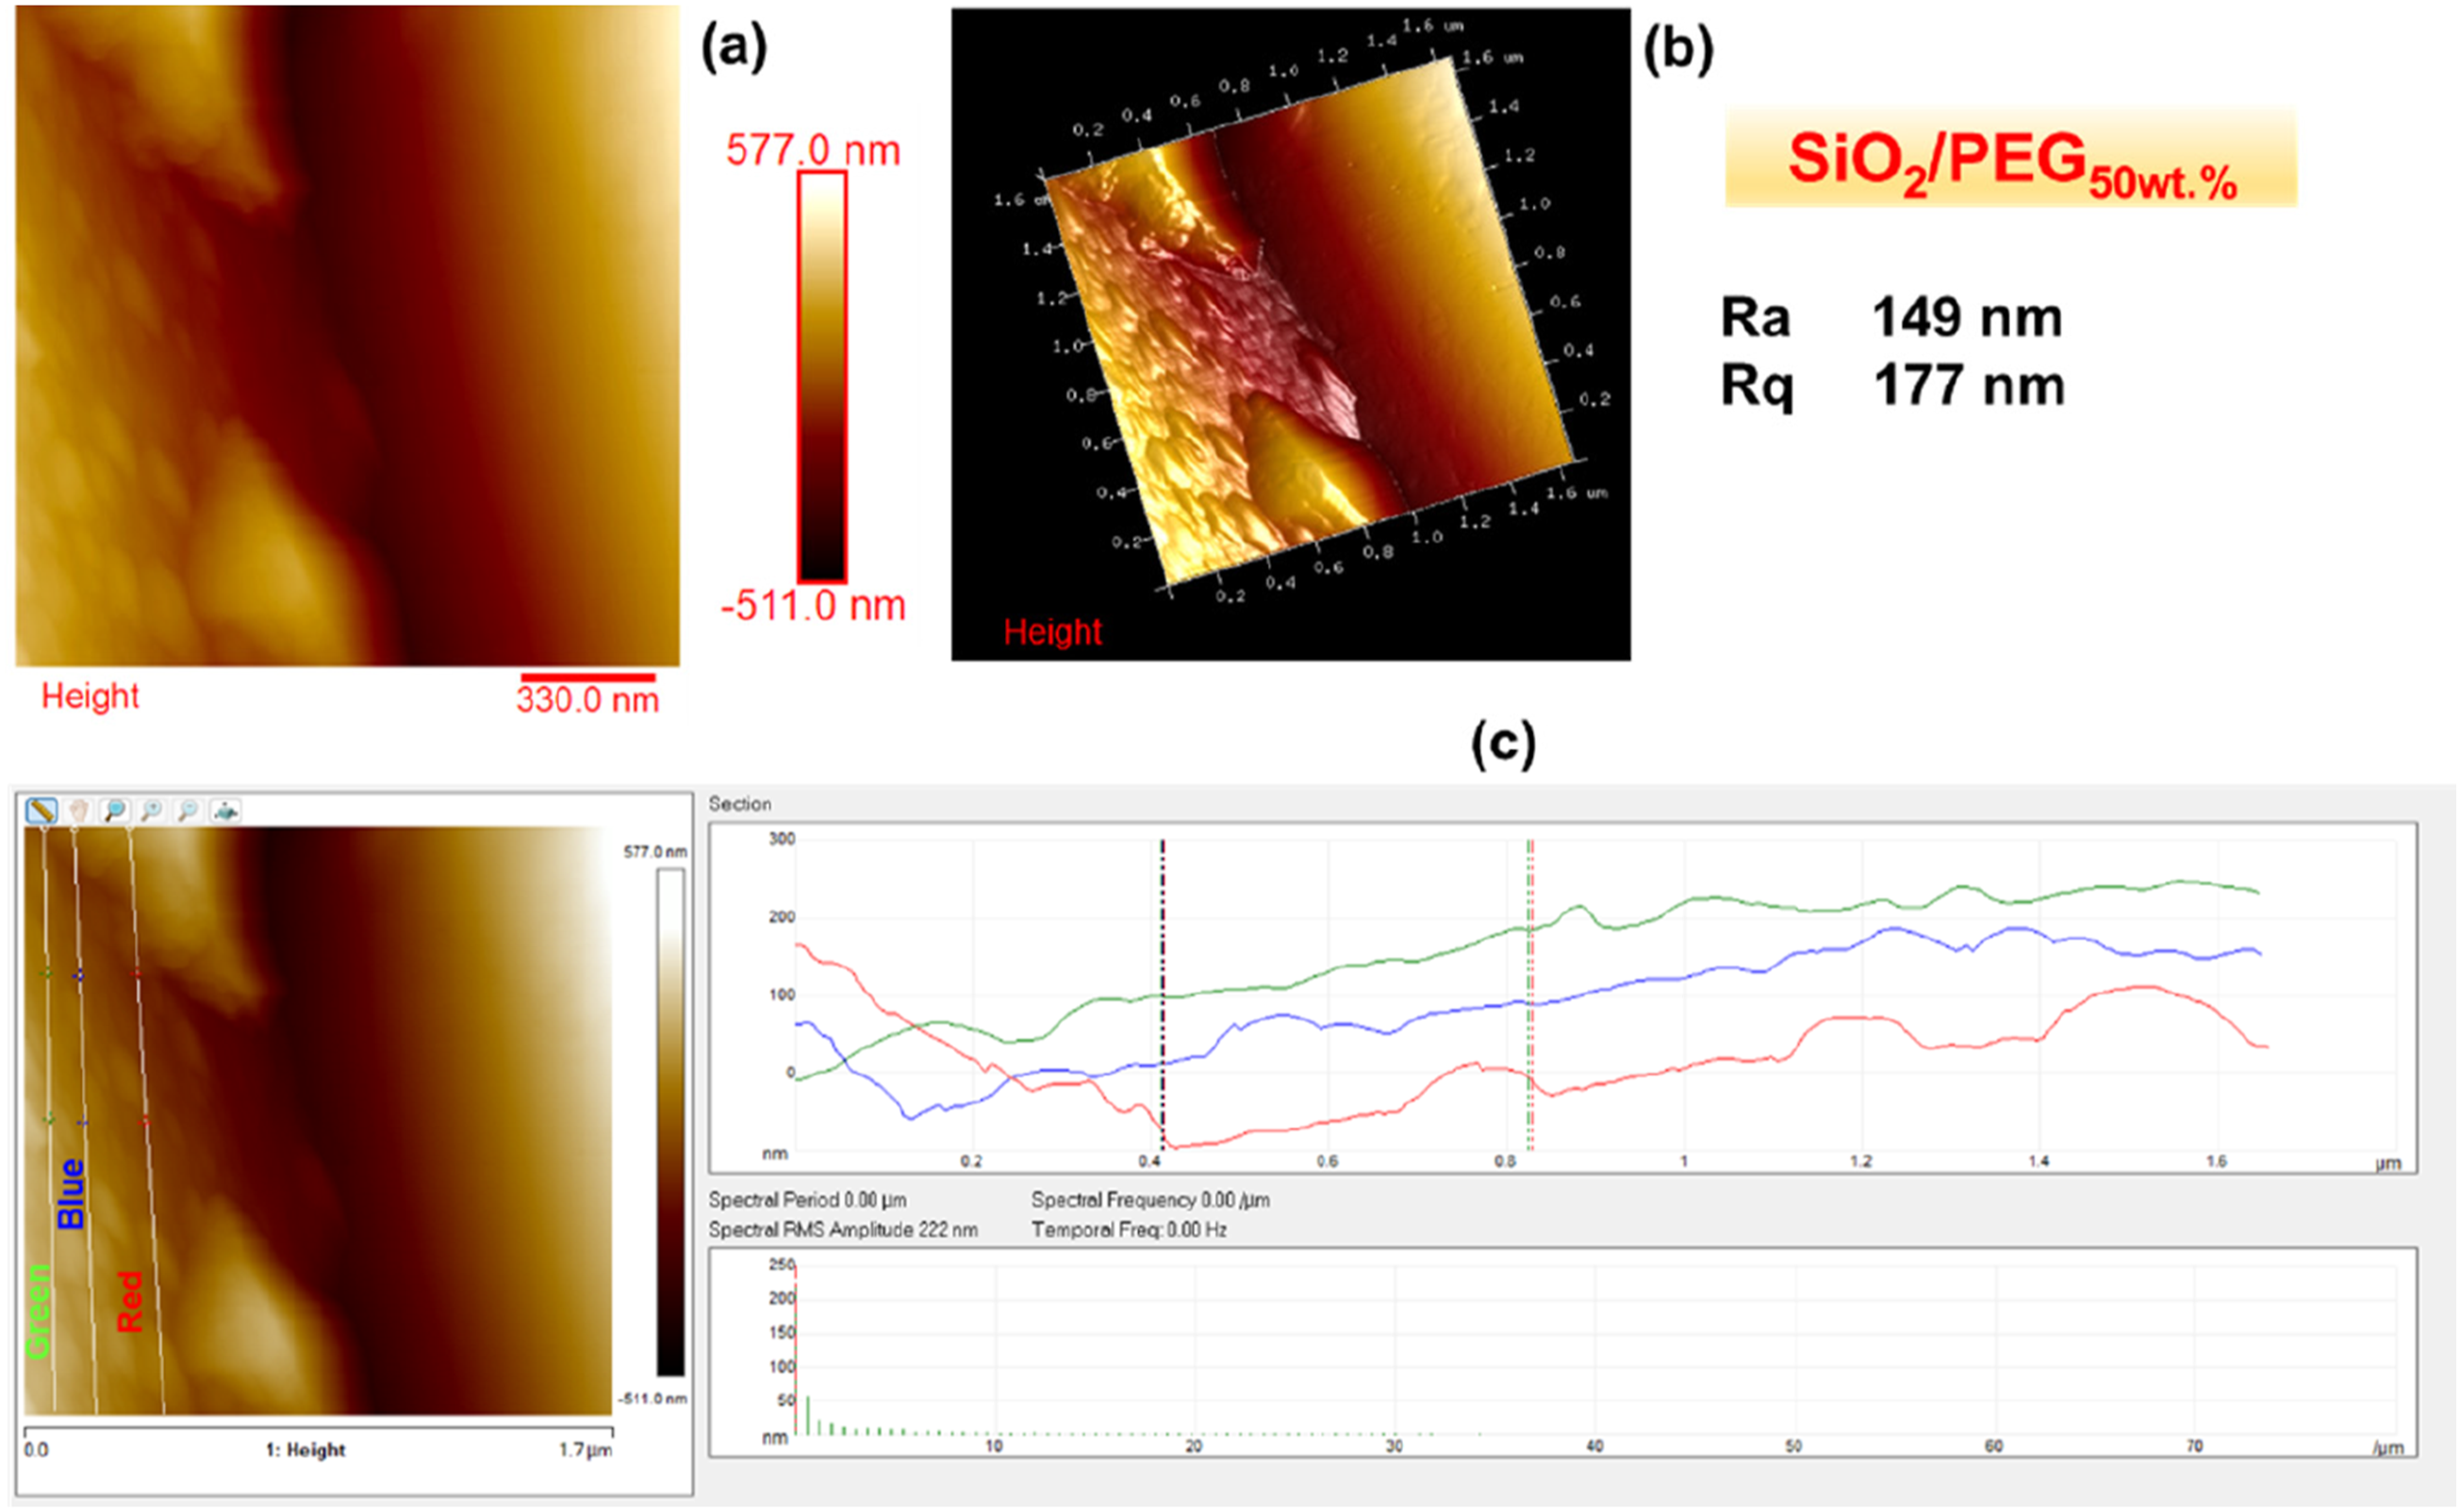
Figures 2–6 show the morphology of SiO2, SiO2/PEG6wt.%, SiO2/PEG12wt.%, SiO2/PEG24wt.% and SiO2/PEG50wt.% samples, respectively. In particular, for each sample, both the two-dimensional (2D) and three-dimensional (3D) surface profiles of the AFM-height image are shown. The height image is displayed as a pseudocolor plot, where different colors represent different heights, going from the darker color which indicates the deeper areas of the sample to the lighter color associated with the areas of the sample located more superficially, as can be seen from the scale bar located to the right of the height image which reveals the surface features. Besides, we also evaluated by AFM section analysis the distribution of the inorganic and organic components both in the SiO2 matrix alone and in the SiO2 matrix loaded with different weight percentages of PEG, as can be seen from image (c) present in all Figures 2–6. Morphology of SiO2: (a) AFM-2D Height image; (b) AFM-3D Height image; (c) AFM section analysis. Morphology of SiO2/PEG6wt.%: (a) AFM-2D Height image; (b) AFM-3D Height image; (c) AFM section analysis. Morphology of SiO2/PEG12wt.%: (a) AFM-2D Height image; (b) AFM-3D Height image; (c) AFM section analysis. Morphology of SiO2/PEG24wt.%: (a) AFM-2D Height image; (b) AFM-3D Height image; (c) AFM section analysis. Morphology of SiO2/PEG50wt.%: (a) AFM-2D Height image; (b) AFM-3D Height image; (c) AFM section analysis.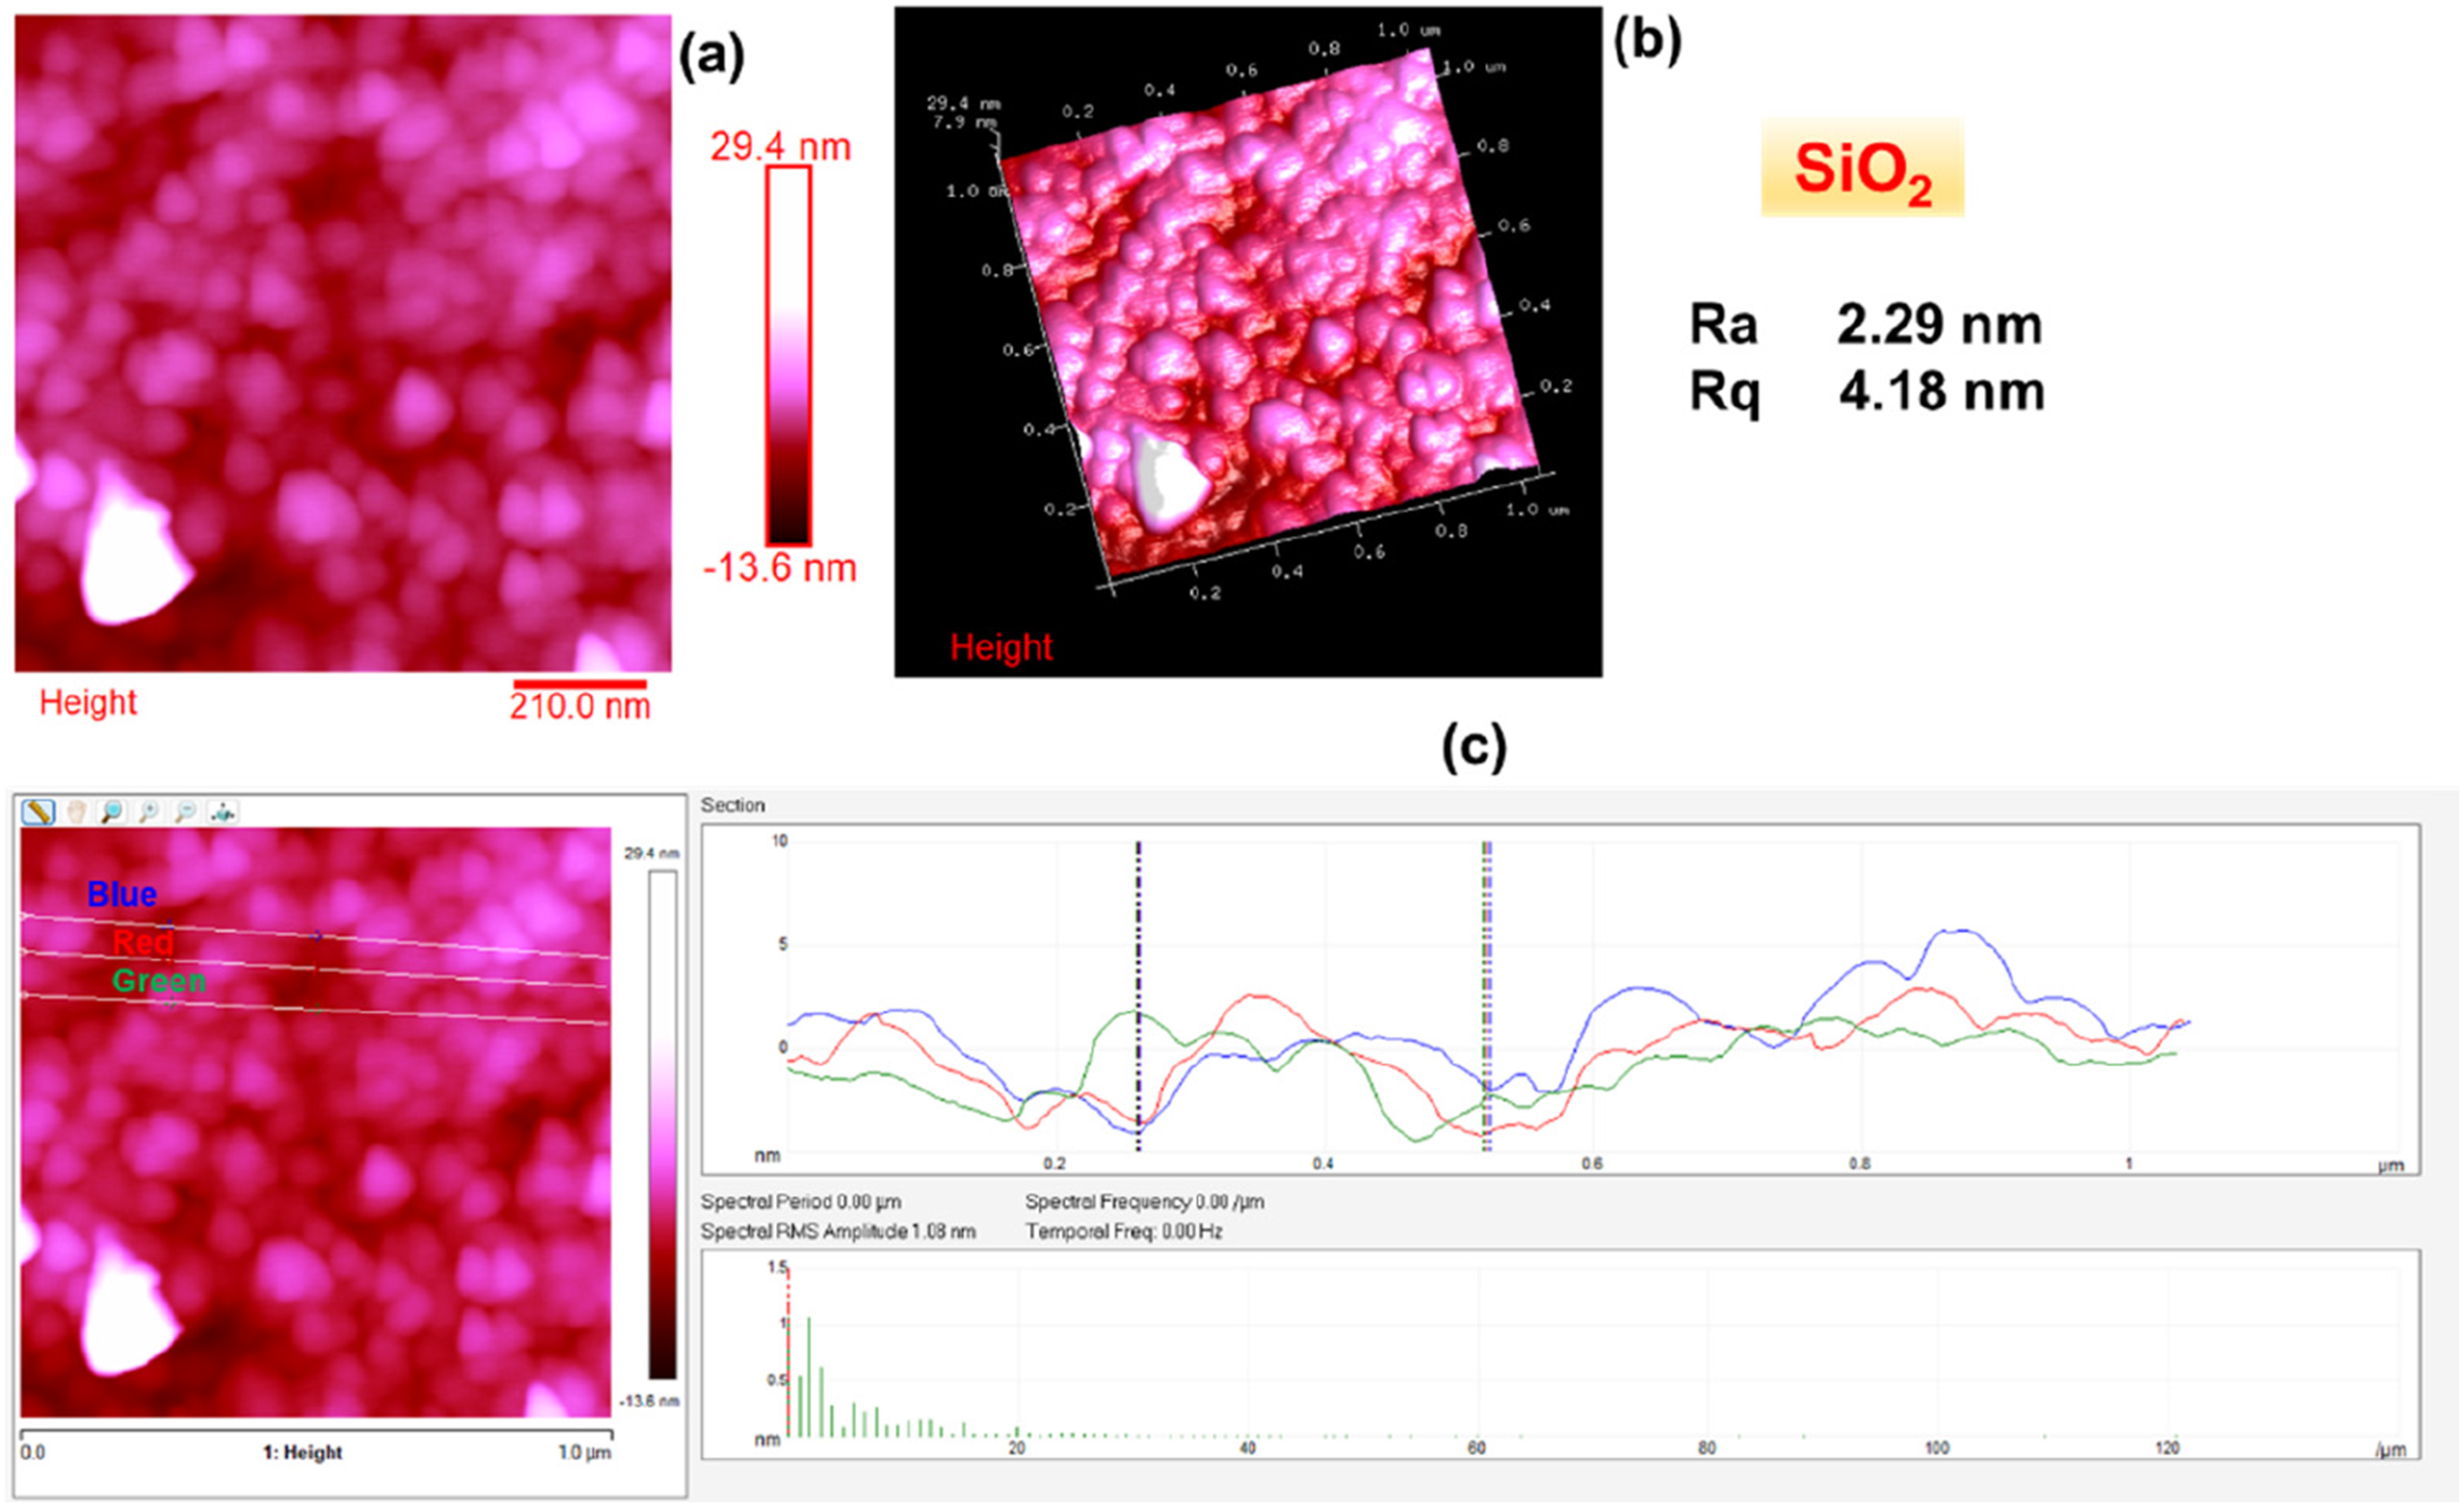
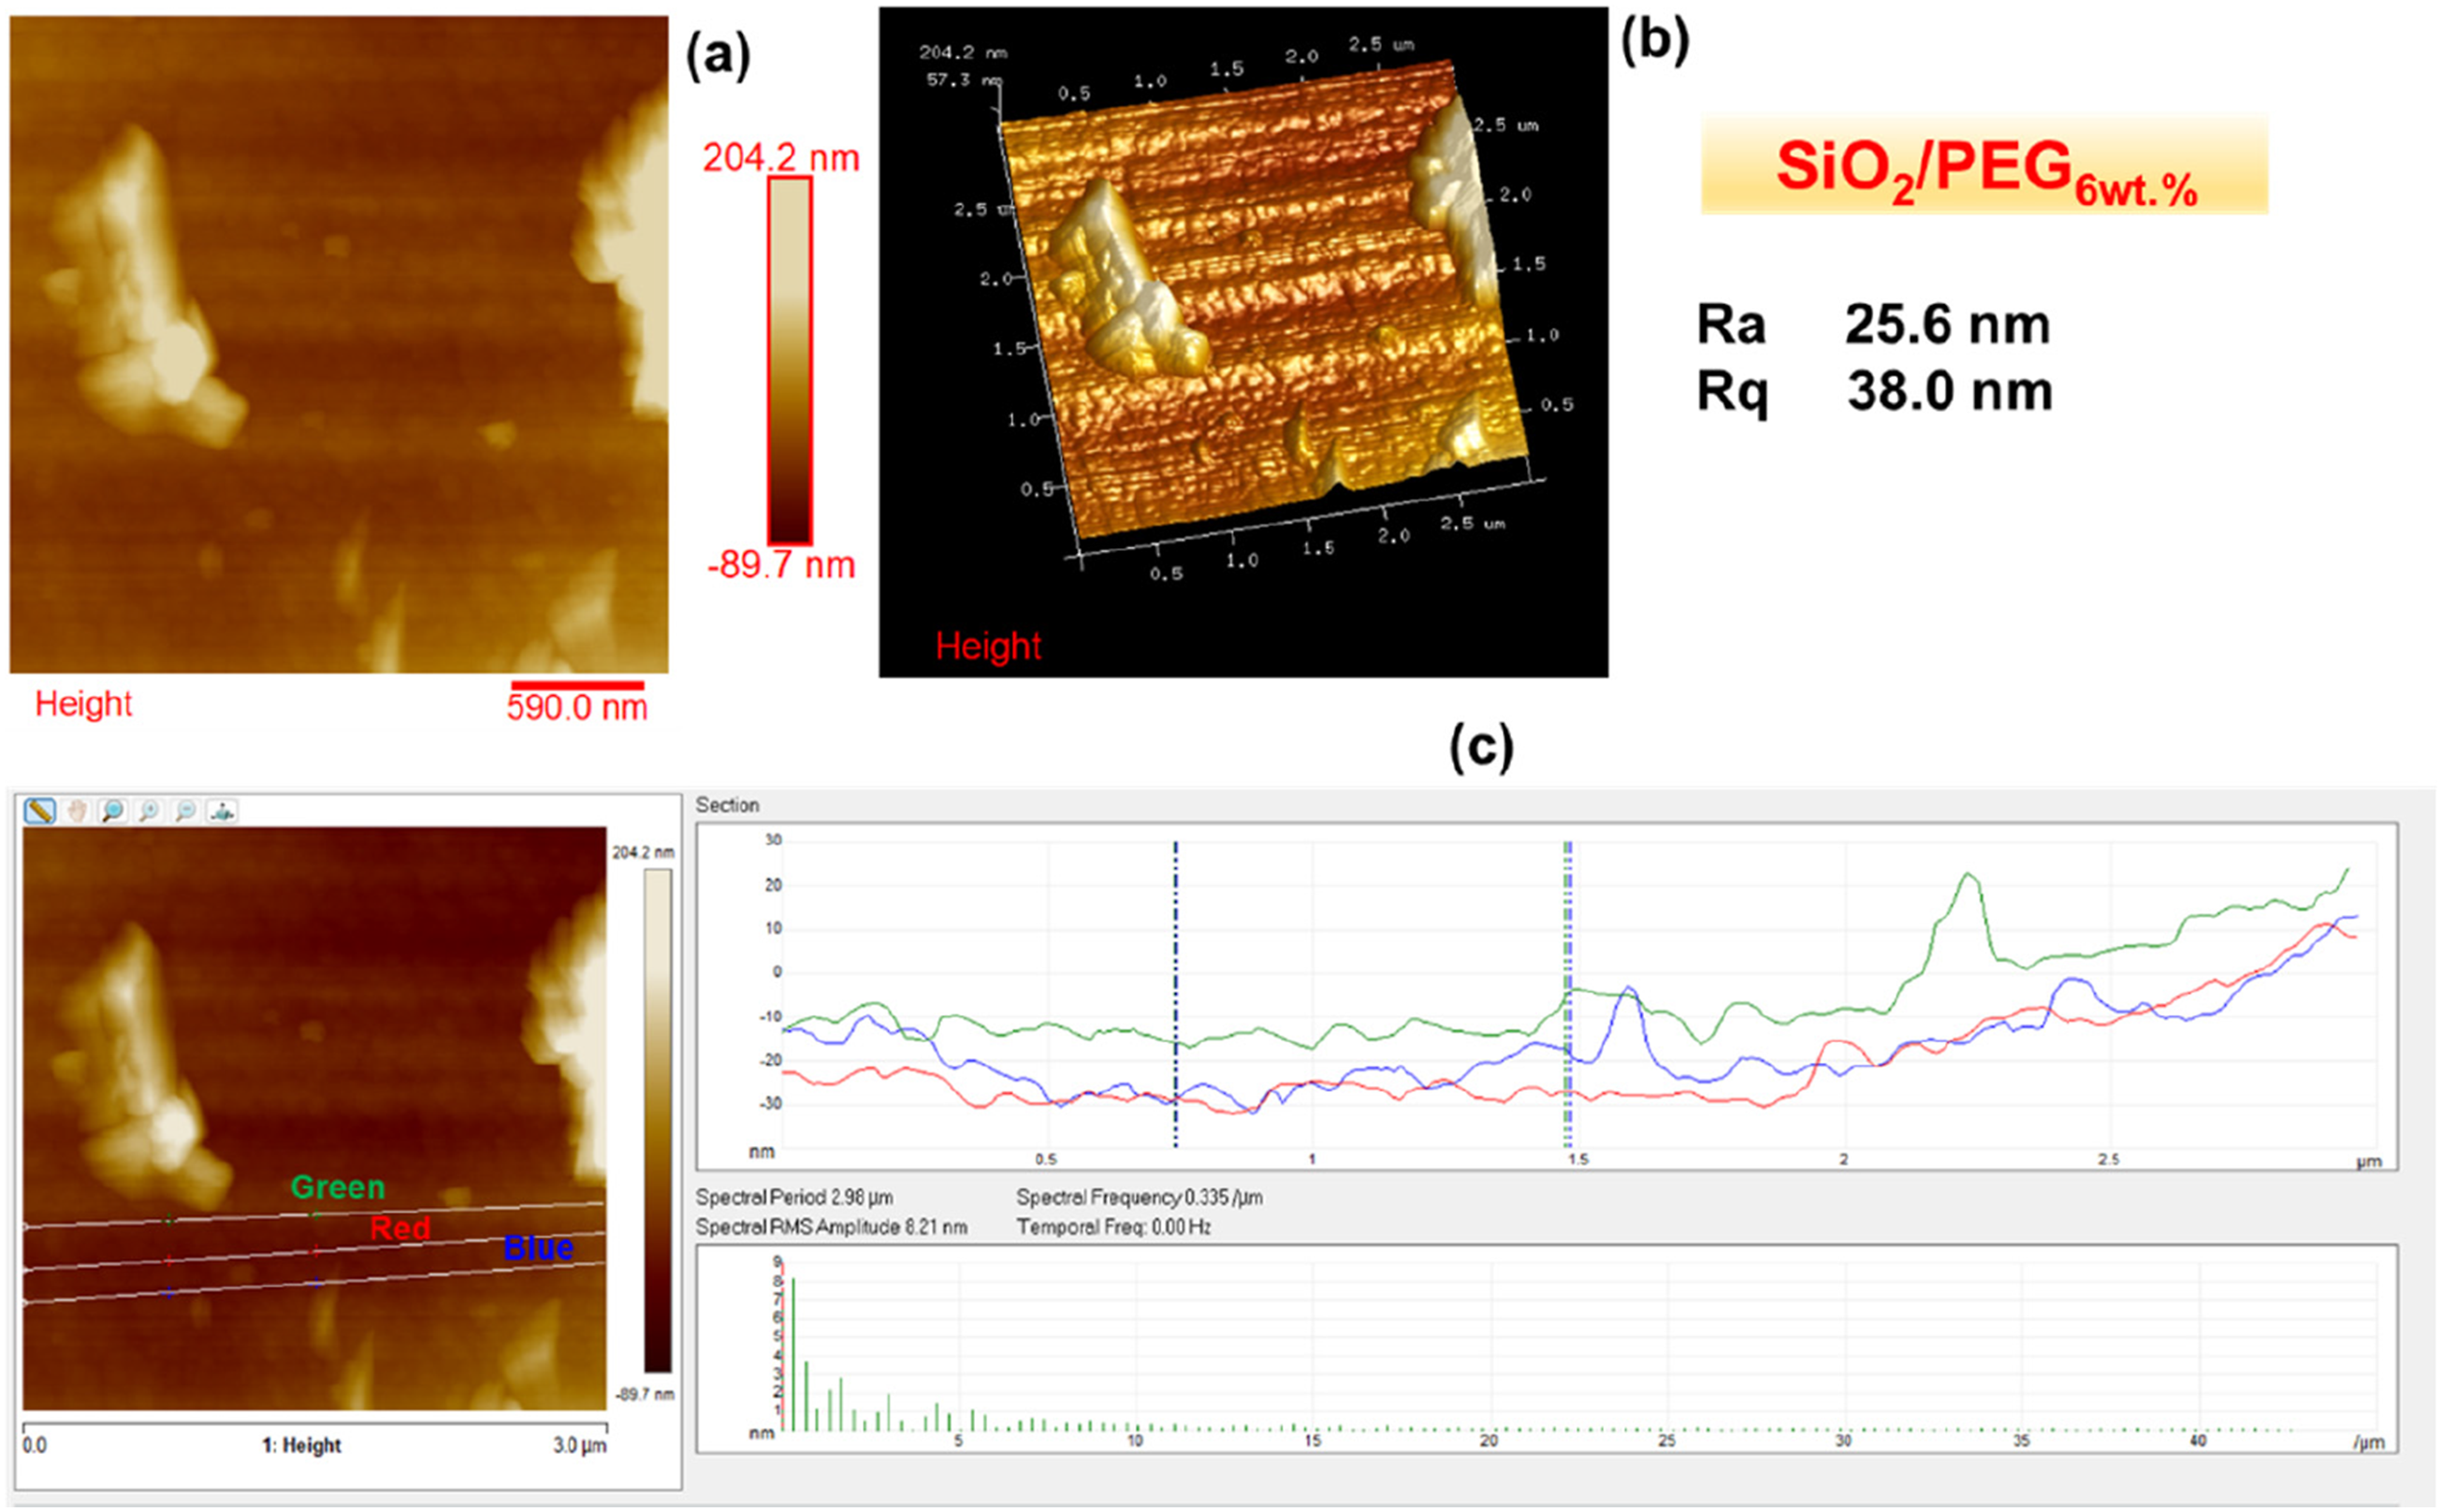
Roughness parameters Ra and Rq for the SiO2 matrix alone and SiO2/PEG hybrids (SiO2/PEG6wt.%, SiO2/PEG12wt.%, SiO2/PEG24wt.%, SiO2/PEG50wt.%).
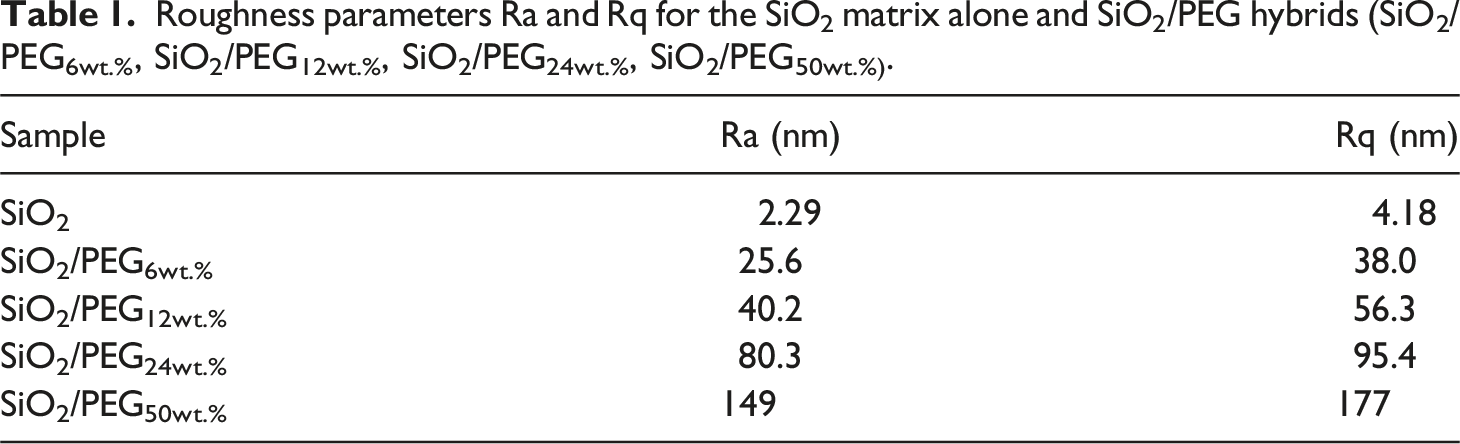
The roughness parameters reported in Table 1 offer the reader a clear correlation, thus highlighting the role of PEG in the surface morphology.
These parameters are also evident in Figures 2–6, which show, in succession, the representative AFM 2D and 3D topographic pictures corresponding to SiO2, SiO2/PEG6wt.%, SiO2/PEG12wt.%, SiO2/PEG24wt.%, and SiO2/PEG50wt.% samples, respectively. The AFM images show that the nanoscale roughness of the sample SiO2 is relatively low, as attested by the evaluated roughness parameters Ra = 2.29 nm and Rq = 4.18 nm. On the contrary, for all SiO2/PEG hybrids characterized by different amounts of PEG (6, 12, 24 and 50 wt.% with respect to the silica content), we can detect roughness values greater than those shown by the SiO2 matrix alone, which appear to increase as the weight percentage of PEG increases gradually. The AFM height images of the SiO2 sample (Figure 2) clearly shows on the entire scanned surface the presence of the globular morphology, tipycal of SiO2 amorphous matrix obtained by using a sol-gel method. These results confirm the success of the sol-gel route adopted to synthesize the inorganic matrix SiO2. By carefully observing the AFM height images of the hybrid samples SiO2/PEG, we can notice a change in the surface morphology. More precisely, the AFM height images show that the presence of the polymer PEG affects the bioactivity of the obtained materials as the scanned surfaces of the hybrid samples appear to be covered by a reduced number of rounded globular shapes and they also present smaller dimensions and a different distribution which may be attributable to their interaction with the polymer PEG. The observation of the SiO2/PEG system morphology confirms that the interpenetration of the two phases (organic and inorganic) occurs on nanometric scale. FTIR analysis demonstrated the incorporation of the polymer (PEG) into the network via hydrogen bonds between the ethereal oxygen atoms or alcohol groups of the organic component and the hydroxyl groups of the inorganic matrix. The spectroscopic results seem to confirm the morphological results since from the AFM images (Figures 3–6) the SiO2/PEG samples show a topography typical of an organic/inorganic nanocomposite hybrid material with the two phases effectively interpenetrated. The bioactivity and biocompatibility of the hybrids was affected by the PEG’s presence. The possibility of appreciating morphological differences for the different hybrid samples SiO2/PEG as the quantity of PEG increases explains the increase in porosity due to the PEG incorporation, thus confirming that the synthesized materials are nanostructured hybrids. One possible reason why the nanoscale roughness of the SiO2/PEG material increases as the weight percentage of PEG in the inorganic matrix increases is that the PEG molecules form aggregates or clusters on the surface of the SiO2 matrix, creating an uneven and irregular morphology. This can be seen from the AFM images of the SiO2/PEG composites (Figures 3–6) with different PEG contents. AFM images show that the surface of the SiO2 matrix becomes more rough and porous as the PEG content increases from 6 to 50 wt.%. In fact, we can observe that the surface morphology changed from smooth and homogeneous (Figure 2) to rough and heterogeneous as the PEG content increased (Figures 3–6). The PEG molecules may also interact with the SiO2 network through hydrogen bonding or other intermolecular forces, causing some distortion or deformation of the SiO2 structure, as reported in the literature. 42 Another possible reason is that the PEG molecules have different thermal expansion coefficients than the SiO2 matrix, and thus they may cause some thermal stress or strain on the surface of the SiO2/PEG material during the heat-treatment process. This may result in some cracks or fissures on the surface, increasing the roughness. 43 In Figures 2(c)–6(c), we can observe for the SiO2 matrix and for SiO2/PEG hybrid systems the evaluation of the distribution of the inorganic phase represented by SiO2 and of the organic phase represented by PEG along the three white lines via AFM section analysis. Each white line drawn in the AFM images along the section of the sample surface is associated with the distribution profile of the two phases which can be viewed on the right of the AFM image in the three different colors green, blue and red. The profiles indicate for all the samples a rather regular distribution of the interpenetrated phases although it is possible to note the degree of irregularity of the material surface as the weight percentage of PEG increases.
In this work, in order to obtain more detailed information on the topographic profile of the different samples analyzed, the AFM amplitude error and phase images (Figure 7) which allow the detection of fine morphological characteristics not easily identifiable in the height images are also shown for all the samples. It is worth noting that the amplitude error image shows the difference between the setpoint amplitude and the actual amplitude of the cantilever oscillation. The setpoint amplitude is the amplitude that is maintained by the feedback loop during the scanning, and the actual amplitude is the amplitude that is measured by the detector. The amplitude error image can reflect the topography and morphology of the sample surface, as well as the tip-sample forces and interactions. The amplitude error image can also reveal the surface defects and features, such as steps, edges, or particles. A phase image is a type of image that shows the difference between the phase of the cantilever oscillation and a reference phase, usually set at the free oscillation phase. The phase image can reflect the energy dissipation and viscoelastic properties of the sample surface, as well as the tip-sample adhesion and friction. The phase image can also reveal the surface heterogeneity and composition, as different materials or phases may have different phase shifts, thus providing complementary information to the height image, which shows the vertical displacement of the cantilever. By combining these images, one can obtain a more complete and accurate characterization of the sample surface. From Figure 7, we can see how the amplitude error and phase images contribute significantly to having a complete mapping of the surface of the analyzed samples. In fact, morphological details intrinsically connected with the composition of SiO2/PEG systems are highlighted. It is worth noting that the different topographic profiles are associated with the presence of PEG which interacts with the SiO2 matrix creating interconnections due to the establishment of intermolecular interactions which translate into a compact structure. The different morphological response is attributable to the different quantities of PEG present in the SiO2 matrix. From Figure 7, we observe the passage from the surface of the SiO2 sample covered with smooth globular shapes to the surfaces of the hybrid systems SiO2/PEG in which the presence of the organic phase and the inorganic phase is discriminated from the phase images which appear to be intimately linked to form a more textured wrinkled and porous as the added amount of PEG increases. Morphology of SiO2 and SiO2/PEG hybrid systems: AFM-2D Amplitude Error images (on the left) and AFM-2D Phase images (on the right).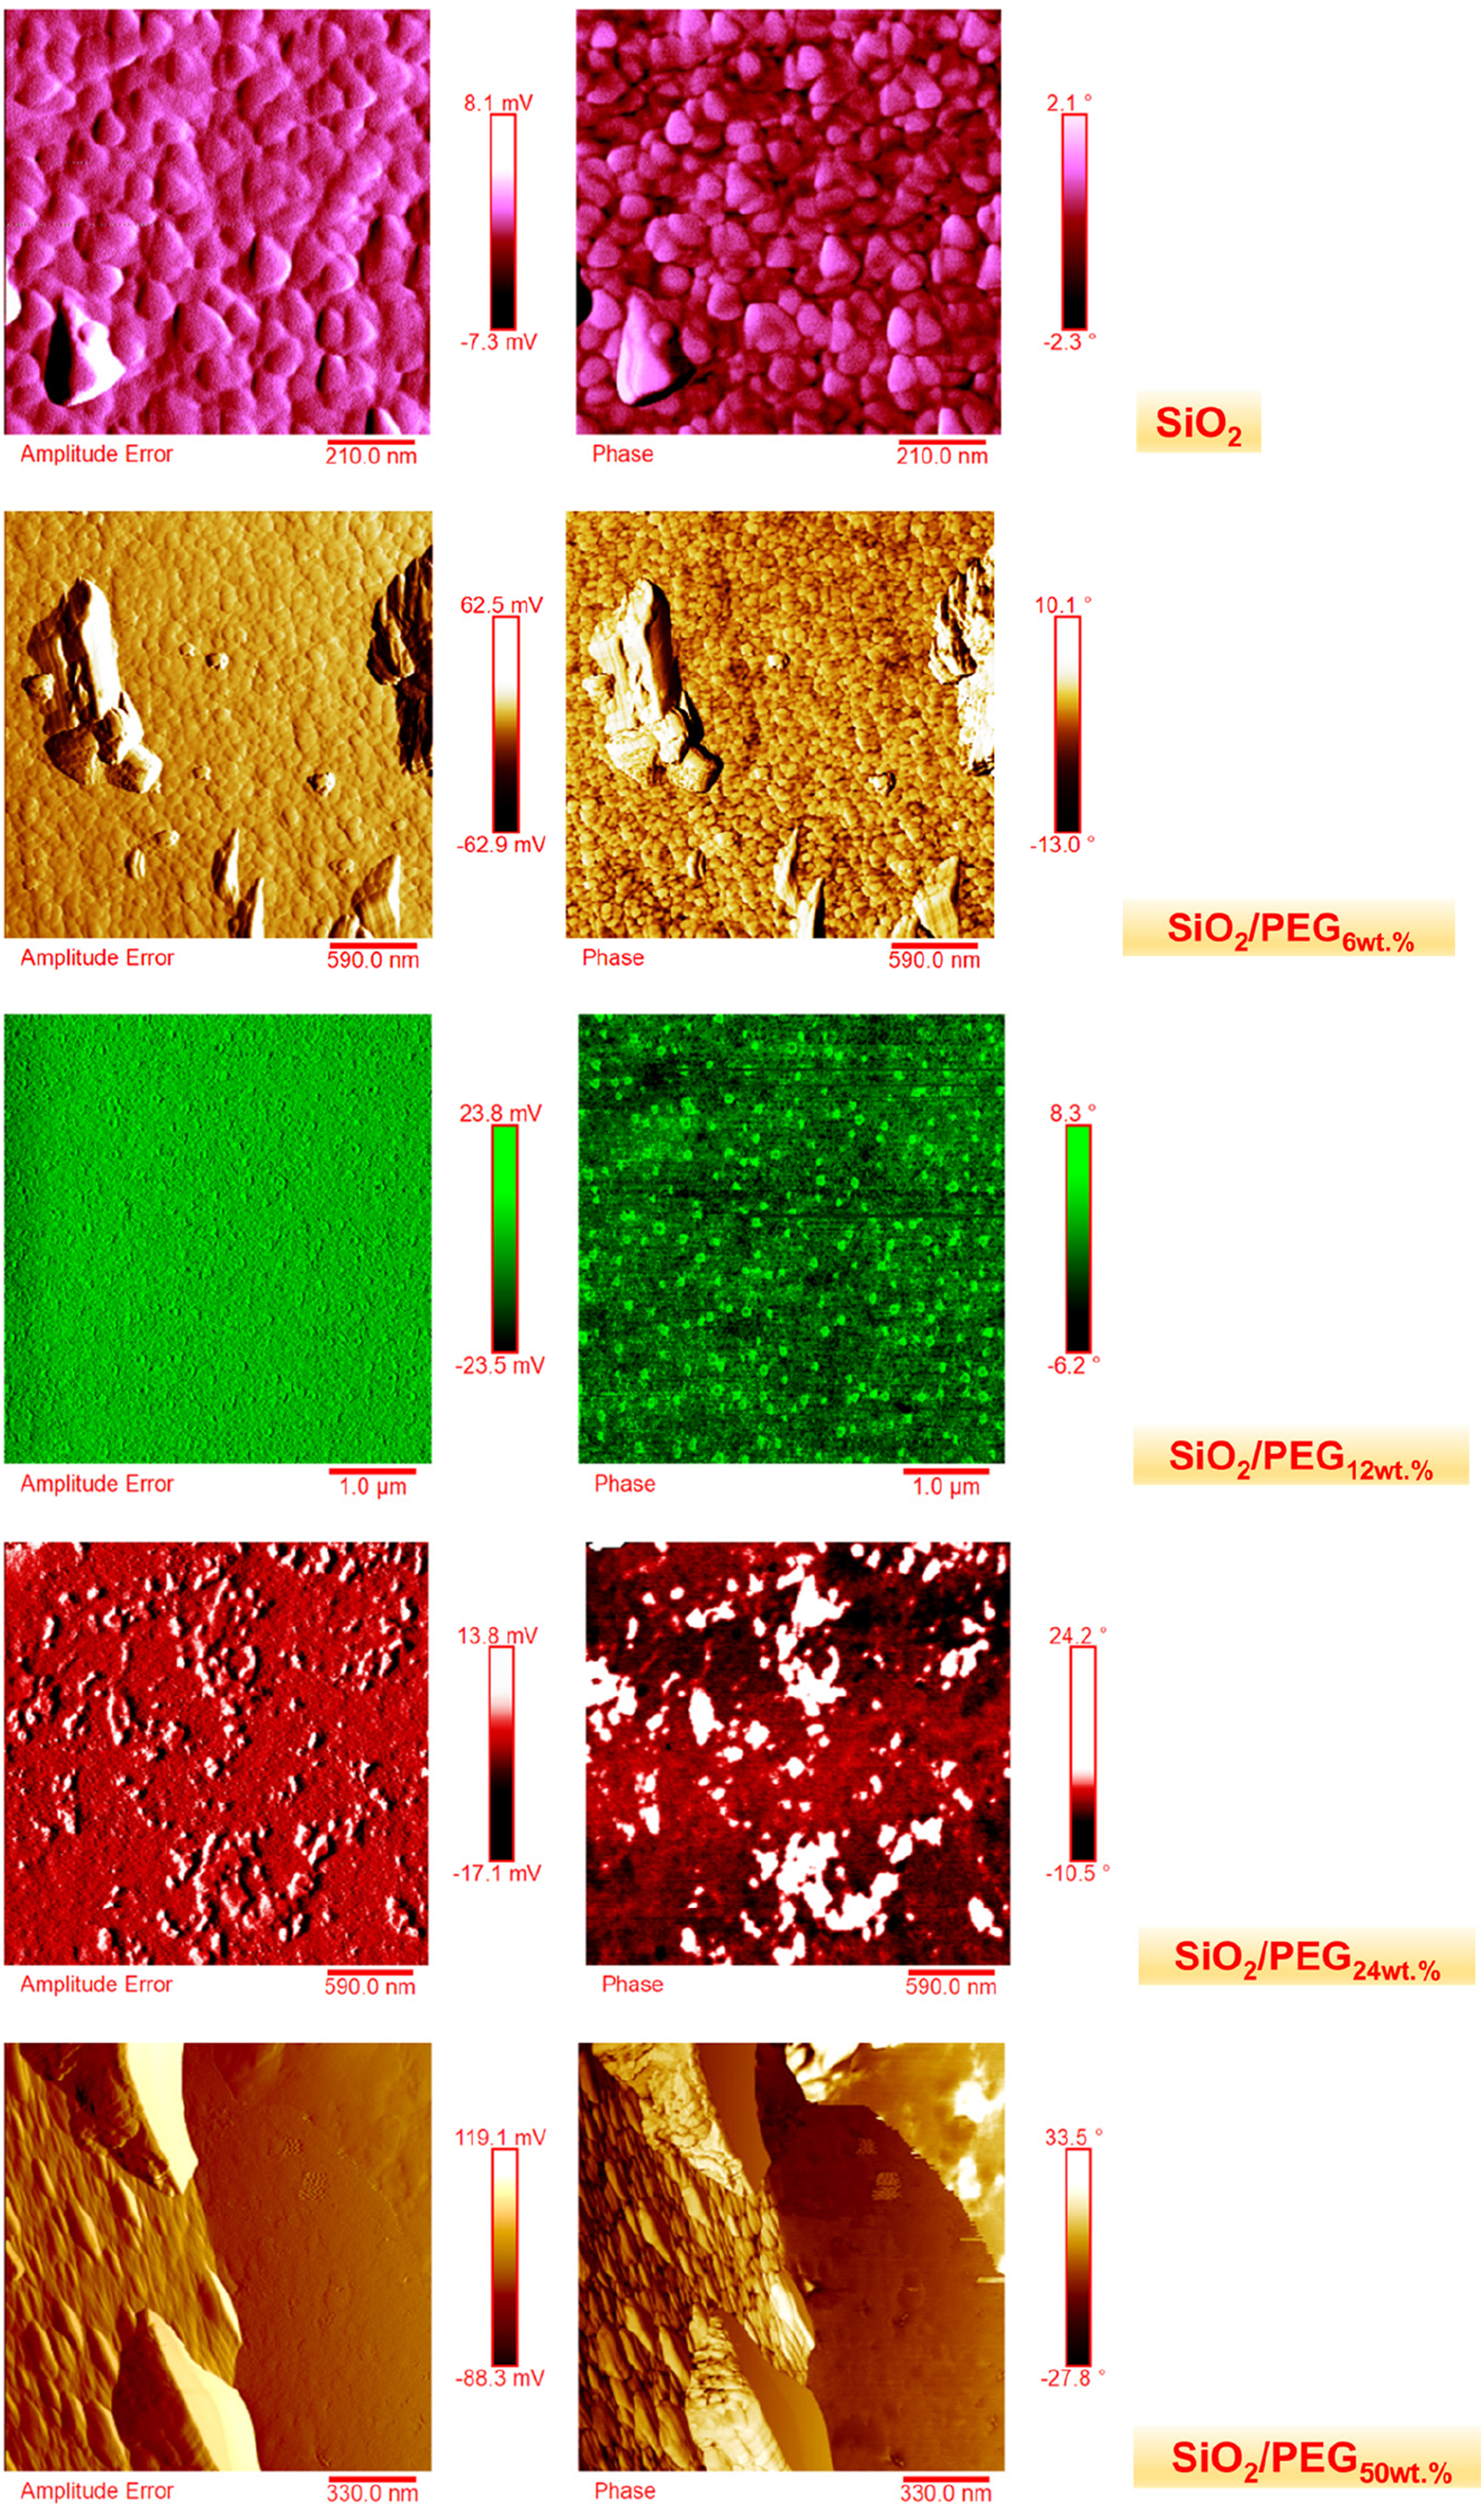
FT-IR analysis and deconvolution
The interaction among the inorganic and organic phases has been investigated through the FT-IR analysis. The spectra of PEG, SiO2 and the SiO2/PEG hybrid materials are reported in Figure 8. The image sheds light on the influence of the PEG amount in the hybrids. Indeed, it can be noted that an increase in PEG amount resulted in a broadening of the -OH vibrations detected in the range of 3700–3300 cm−1, as well as an increase in the CH2 and CH3 stretching vibrations41,42 in the region of 3000-2850 cm−1. Moreover, all the hybrids show the main signals of the SiO2 spectrum, including the Si-O-Si absorption band located at 1080 cm−1 (with its typical shoulder at 1200 cm−1)
18
and the Si-O bend at 460 cm−1.
44
FT-IR spectra of PEG, SiO2 and SiO2/PEG hybrid materials.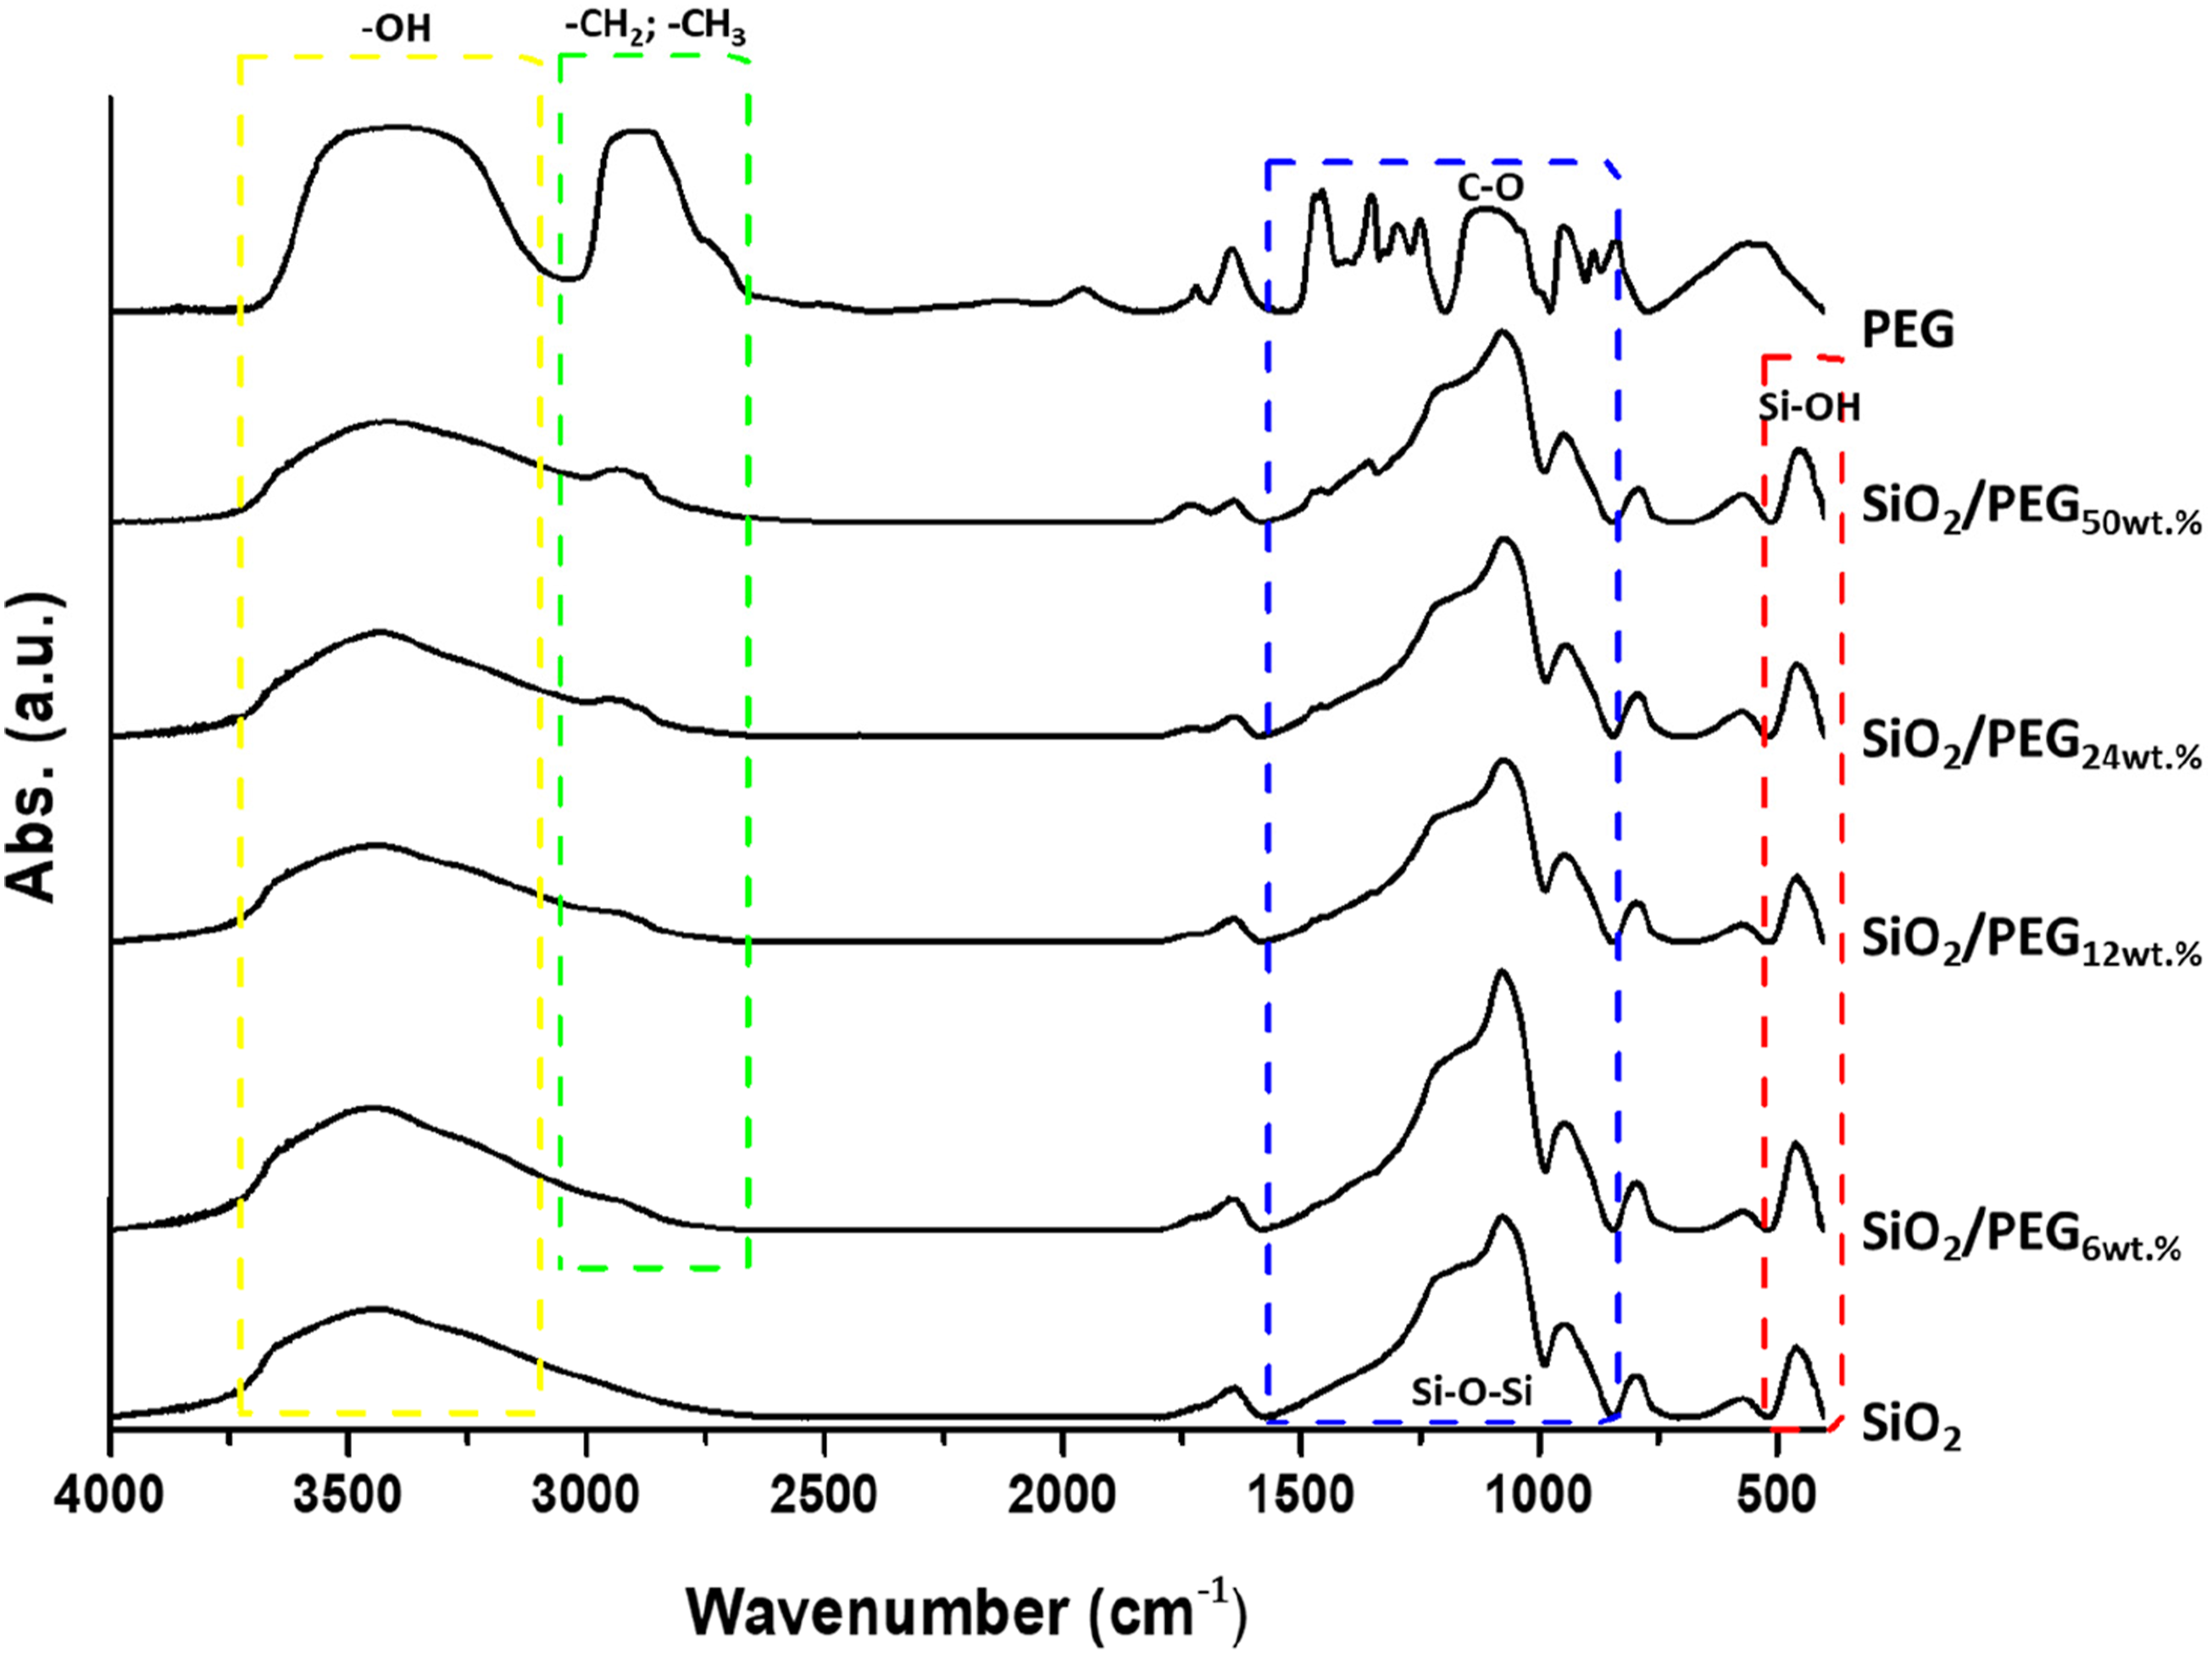
To deepen the comprehension of the PEG influence in the hybrid formations, the main absorption bands in the range of 1600-750 cm−1 have been deconvoluted and reported in Figure 9. In SiO2 deconvoluted spectrum the absorption band at 1058 cm−1 is related to the dominating transverse optical mode of the Si-O-Si asymmetric stretching. This band is coupled with the shoulder at high frequency (detected at 1179 cm−1), assigned to the skeletal Si-O-Si stretching vibration in longitudinal optical mode. Additionally, the bands at 956 and 916 cm−1 are due to the Si-O and Si-OH vibrations of the surface silanol groups.
45
As regards the band at 1378 cm−1, it could be related to the presence of some residual EtOH entrapped in the SiO2 matrix. The increase in PEG amount in the SiO2 matrix led to the shift of the main Si-O-Si absorption band, as well as, to the shift of their shoulders at higher frequencies. The absorption bands of the Si-O and Si-OH bending vibrations seem not to be affected by the presence of PEG. New absorption bands are detected after the addition of 6 wt.% of PEG and are centered at 1470 and 1020 cm−1. The former is assigned to the C-H vibration mode, while the latter could be related to the C-O vibration. Indeed, this peak is generally located at 1080–1060 cm−1, so the shift at the lower wavenumber could be the consequence of the chemical environment which affects its position. Moreover, the C-O-H stretching of PEG (generally located at 1060 cm−1)
46
is superimposed on the main Si-O-Si absorption band. Furthermore, an increase in PEG amount led also to a shift at a higher wavenumber (from 1020 cm−1 in SiO2/PEG6wt.% system to 1034 cm−1 SiO2/PEG50wt.%), indicating an increase in the H-bonds interaction between the inorganic and organic phases). Additionally, the systems with higher PEG amounts (12, 24wt.%, respectively) revealed another peak centered at 1135–1138 cm−1 due to the C-O stretch. At 50 wt.% of PEG, this peak is merged with the Si-O-Si asymmetric stretching suggesting an equivalence with the C-O vibration. Finally, the latter system possesses a further peak centered at 1302 cm−1 which can be assigned to the O-H bend of residual EtOH entrapped in the system. Deconvoluted FT-IR spectra of SiO2 and SiO2/PEG hybrid materials in the range of 1600–750 cm−1.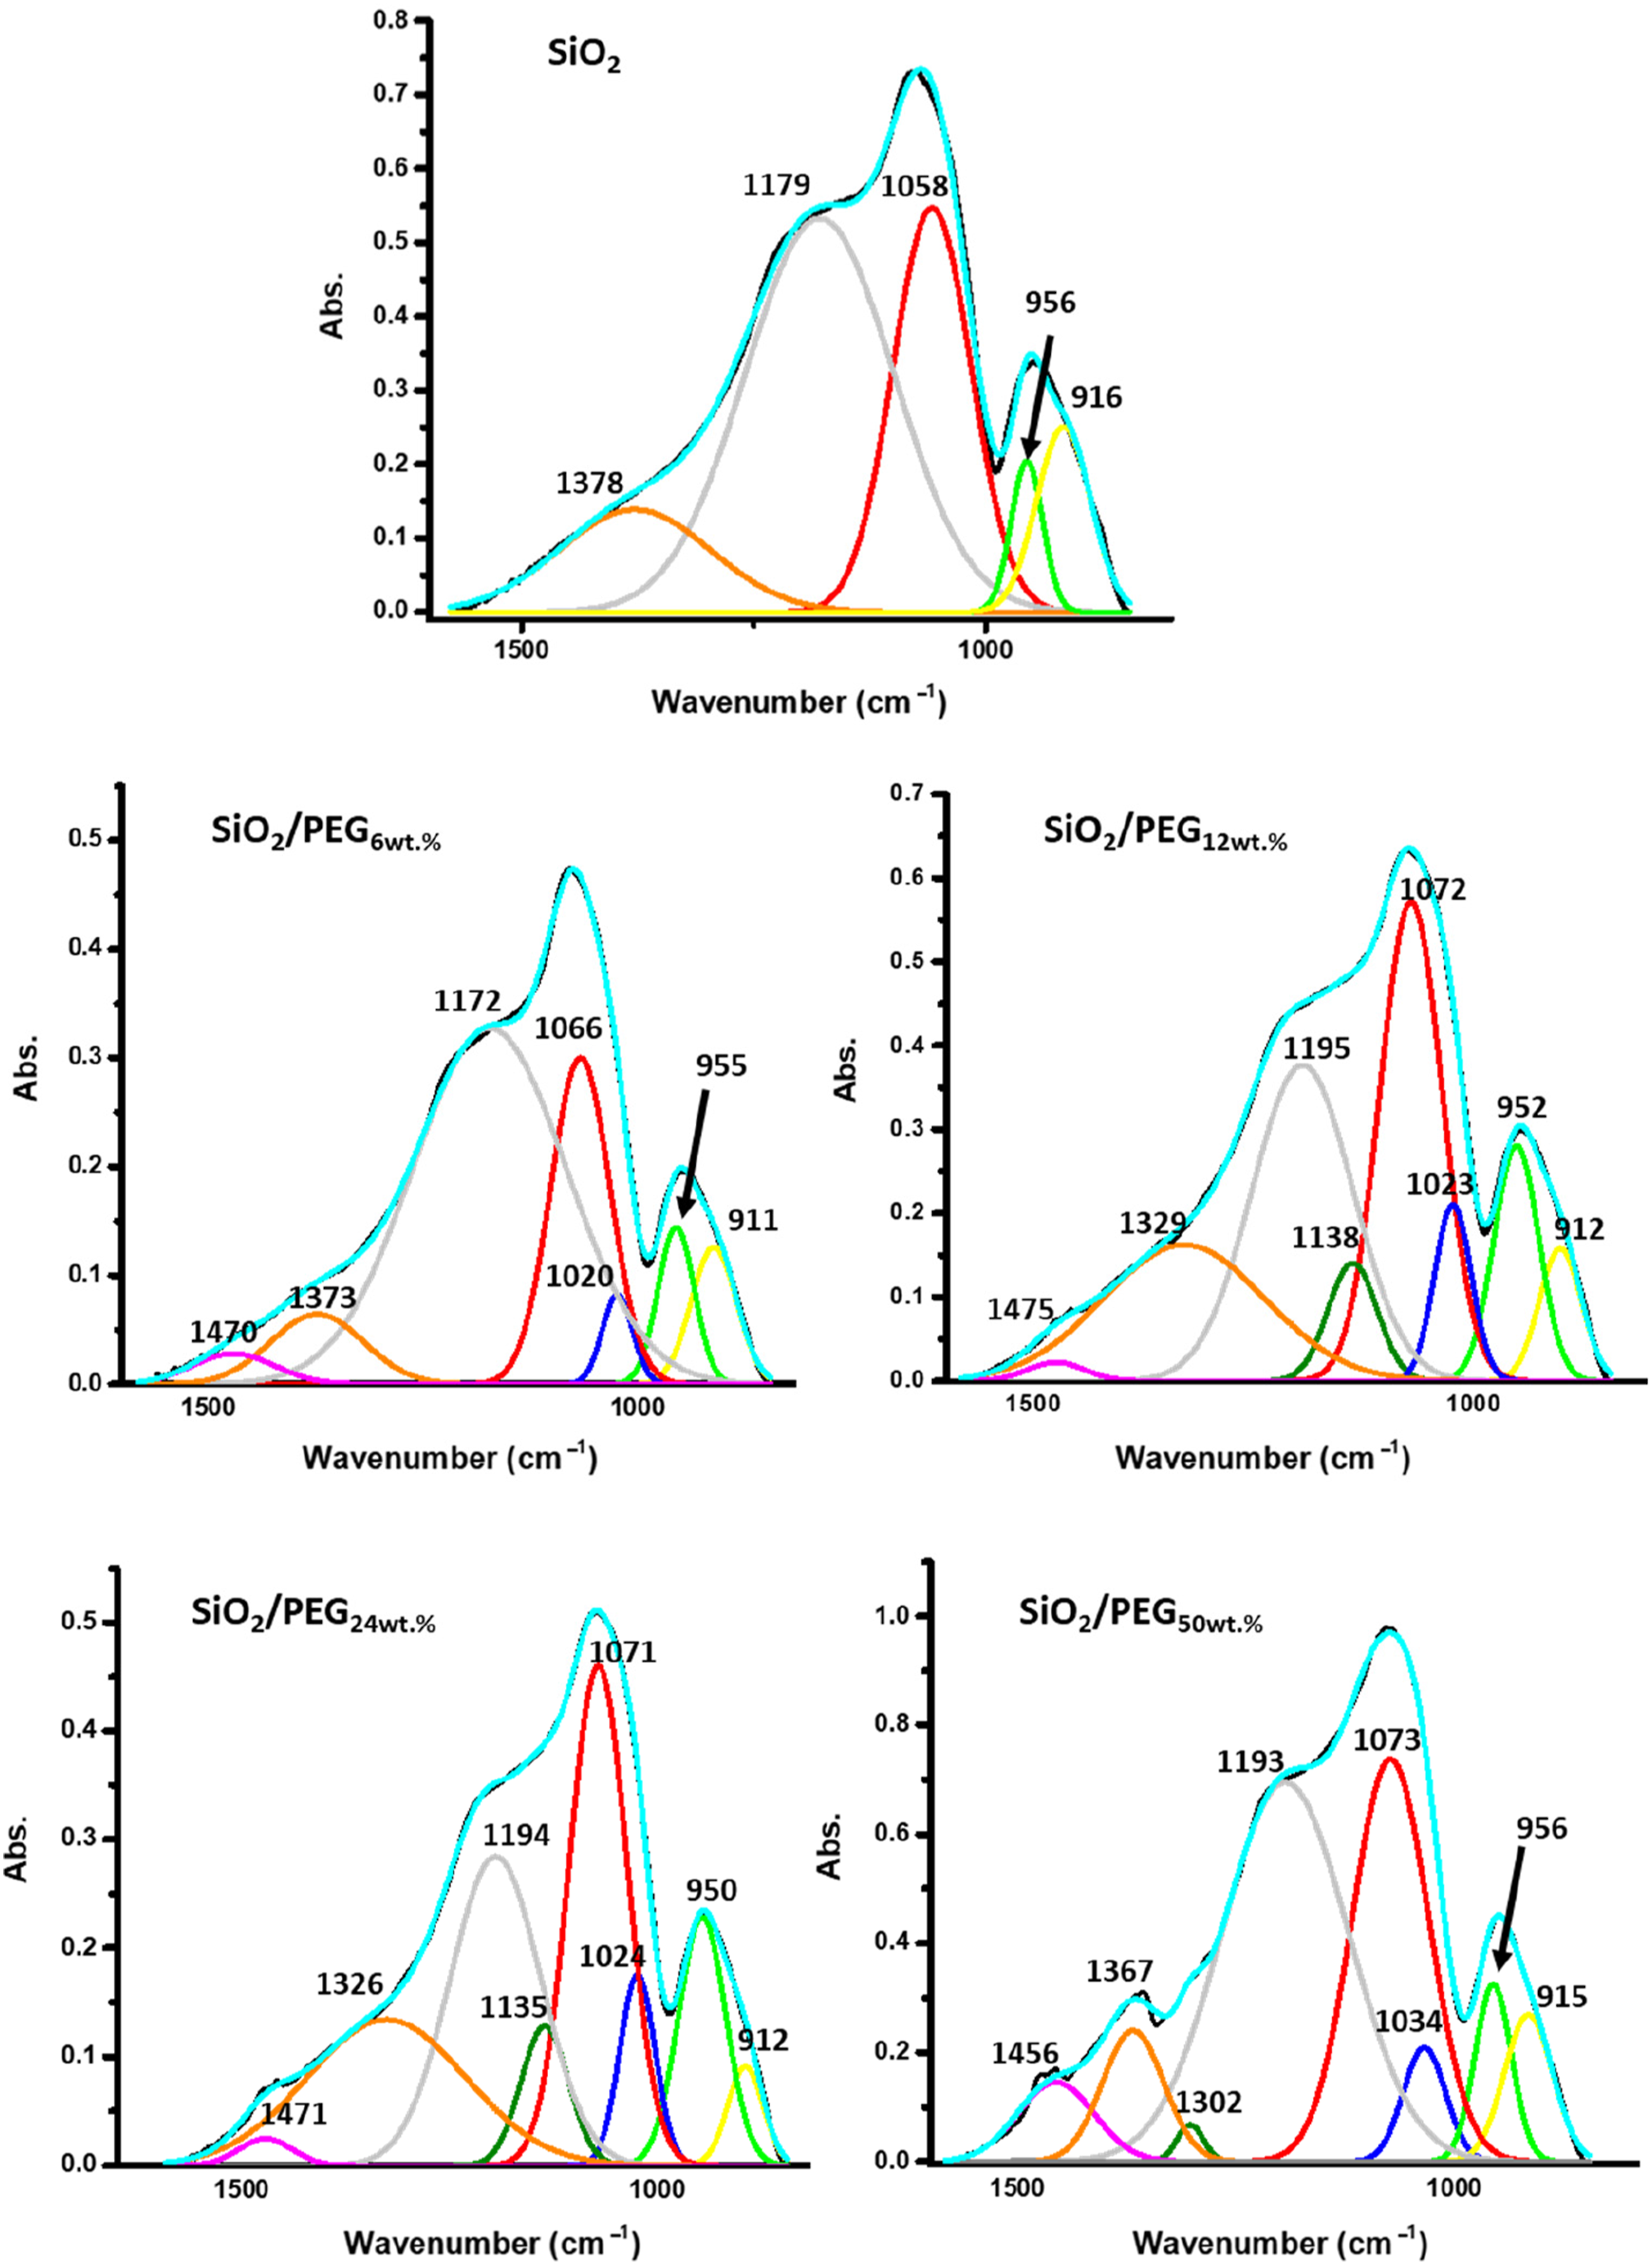
Conclusions
In this work, Atomic Force Microscopy (AFM) was used to evaluate the surface roughness of the SiO2/PEG hybrid systems, synthesised via the sol-gel route, and their nanoscale surface morphology as a function of the different PEG amounts (6, 12, 24, 50 wt.% with respect to the silica content). The results revealed an increase in material porosity as a function of the PEG amount in the systems. The surface roughness of the SiO2/PEG nanocomposites enhances with enhanced porosity which creates irregularities and variations on the surface topography and morphology of the materials. The nanoscale roughness of the matrix SiO2 is relatively low, as attested by the roughness parameters Ra = 2.29 nm and Rq = 4.18 nm. On the contrary, for all SiO2/PEG hybrids, we can detect roughness values greater than those shown by the SiO2 matrix alone which appear to gradually increase as the weigh percentage of PEG increases. More precisely, the sample SiO2/PEG6wt.% exhibits the roughness values Ra = 25.6 nm and Rq = 38.0 nm, the sample SiO2/PEG12wt.% exhibits the roughness values Ra = 40.2 nm and Rq = 56.3 nm, for the sample SiO2/PEG24wt.% we can see the roughness values Ra = 80.3 nm and Rq = 95.4 nm, and, for the sample SiO2/PEG50wt.% containing the maximum amount of PEG, the highest roughness values equal to Ra = 149 nm and Rq = 177 nm were recorded. The AFM study paves the way for understanding that the enhancement of porosity and roughness surfaces of sol-gel SiO2/PEG materials can have various implications for different applications. In particular, AFM analysis demonstrated that the bioactive and biocompatible SiO2/PEG nanocomposites, appropriately synthesized for applications in the biomedical field, are rough nanostructured hybrids in which the organic and inorganic phases are bonded together at nanometer to sub-micrometer scales. The co-presence of both the inorganic and organic phases was confirmed by the Fourier-transform infrared spectroscopy (FT-IR).
Footnotes
Declaration of conflicting interests
The author(s) declared no potential conflicts of interest with respect to the research, authorship, and/or publication of this article.
Funding
The author(s) received no financial support for the research, authorship, and/or publication of this article.