
Abstract
Mechanical properties of short fiber reinforced composites manufactured with fused deposition modeling is affected by variables such as printing properties and internal structure of the composite. In this study, the relation between the tensile properties of 3D-printed short fiber reinforced composites, printing orientation and internal structure is inspected. Samples of different printing orientations are manufactured. These samples are inspected under X-ray micro computed tomography (micro-CT) and their fiber orientation distributions and fiber properties are determined. Then, these internal structure properties are applied to analytical material models to estimate the tensile properties of composites. Estimated material properties are compared with tensile test results. It turns out that analytical models that consider internal structure properties provide more accurate estimations than other analytical models that does not take these into account.
Introduction
3D printing of complex-shaped parts from composite materials is becoming widespread in the last decade, especially in the defense, automotive, and aerospace industries. Among various production methods, the most common type of this printing process is the fused deposition modeling (FDM) method. This method is preferred over other forms of 3D printing, such as stereolithography (SLA) or selective laser sintering (SLS), due to its ease of use, low cost, and reduced waste properties. 1 Despite these advantages, most FDM printed polymers are not preferred for end-user applications or load-bearing members of a structure due to polymers used in printing being insufficient in terms of required strength for most applications.2–4 In the last couple of years, many studies have been performed to increase the mechanical capability of these polymers. 3 Adding nano-materials, micro-particles, and short and continuous fibers are among the solutions for this purpose.5,6 Inspection of bronze-reinforced PLA 7 or hybrid metal-composite materials 8 in structural applications, graphite-reinforced EVA in electrical applications, 9 copper and iron-reinforced ABS in thermal applications, 10 and carbon fiber-reinforced ABS under load-bearing applications 11 are some of these studies in which such additives are used to improve the mechanical properties of these materials.
Short fibers are the most widely used reinforcements for FDM-printed ABS, PLA, or nylon.2,12,13 Isobe et al. 14 concluded that using short fiber reinforcements instead of continuous fibers can maintain the ease of printing due to its structure. Ivey et al. 15 found that reinforcing PLA with short-carbon fibers led to an increase in the strength of the produced samples, compared to non-reinforced PLA. Yasa and Ersoy 16 inspected the mechanical properties of 3D-printed short carbon fiber-reinforced composites and found that fiber-reinforced composites have increased tensile strength and elastic modulus compared to the polymer itself. Al Abadi et al. 17 developed an analytical model to predict the elastic properties and a numerical model to predict the failure and damage behavior of FDM printed carbon, Kevlar, and glass fiber-reinforced nylon material.
Apart from reinforcements, printing orientation is also essential for determining the strength of 3D-printed materials. Hanon et al. 18 inspected the effect of printing and raster orientations on the tensile strength of FDM-printed PLA specimens. The study has shown that the raster orientation does not significantly affect the tensile properties. However, on-edge printing orientation provided the best performance regarding Young’s modulus and tensile strength. Chacón et al. 19 found that the upright-oriented, FDM-printed PLA samples provided the lowest tensile properties compared to the flat and on-edge-oriented samples. Cantrell et al. 20 found that raster and printing orientations did not significantly affect the tensile behavior of ABS and PC specimens. However, they inspected a change of up to 20% in shear properties. Tanabi 21 examined the effect of printing orientation on the mechanical properties of FDM-printed, short carbon fiber-reinforced PET materials. It was observed that printing orientation caused a significant anisotropy in the shear properties of the samples.
In addition to these aspects, a key characteristic should also be considered while working on the mechanical performance of 3D-printed short fiber-reinforced polymers, which is the internal structure of these materials. Parts manufactured with FDM have different internal structures than those manufactured with conventional methods. Deposed layers involve voids, which can affect the mechanical properties of the 3D-printed composite, such as causing an anisotropic structure. 22 Also, the orientation of fibers may differ due to the printing parameters, which can also affect the mechanical behavior of the material. However, most of the classical analytical models employed for composite materials, such as rule of mixtures, do not consider the effect of essential parameters such as embedded fiber orientation, length, and void content on the mechanical behavior of 3D-printed composites. 23 Such internal properties of a 3D-printed composite can be examined and analyzed via micro-CT scanning. 24 Micro-CT scanning provides a stack of images belonging to the subjected samples’ cross-sections. This process allows for creating a 3D voxel model of the sample and quantifying the properties mentioned earlier.
In order to inspect the internal structure of composite materials, a software called VoxTex is developed by KU Leuven Composite Materials Group. This software analyzes image stacks obtained from a micro-CT scan and creates a 3D model of the inspected material. With this 3D model, components of a composite material can be examined separately. Properties like fiber volume ratio, void content, anisotropy, and stiffness matrix can be obtained from this analysis.25,26 In our previous study, the effect of microvascular channels on the stiffness of a composite and changes in fiber angles were studied by analyzing the component properties and the anisotropy of the material by VoxTex. 27
In this study, the tensile behavior of the 3D-printed composites under different raster and printing orientations was analyzed. In order to achieve that, samples of different orientations were fabricated behavior. The analytical approaches were used to estimate the tensile properties of the 3D-printed composite specimens, considering the embedded reinforcement fibers’ orientation. This aim was realized by first fabricating appropriate samples for inspection under a micro-CT device. After the inspection, the internal structure of the specimen was revealed as 3D images. These images were then processed via VoxTex software to differentiate fibers and matrix and determine the fiber orientation. The obtained orientation functions were employed in the analytical models to determine the elastic modulus and tensile strength of the FDM printed composites. Failure conditions were defined with theoretical formulations and analytical models were verified with experimental test results.
In the following sections, specimen preparation procedures, characterization of the internal morphology of these specimens, determining the composite properties and tensile testing procedures are explained. After that, micro-CT scanning procedures and their results are given. Using the images obtained from the scan, fiber orientation analysis and the estimation of the tensile behavior through analytical methods are performed, and the results are presented. Finally, conclusions obtained from the study are presented.
Material and specimen preparation
The specimens used for the mechanical characterizations are FDM-printed using ABS and XSTRAND GF30-PA6 filaments, with a diameter of 1.75 mm, with regard to ASTM D638-type V standard. XSTRAND GF30-PA6 is a Polyamide six reinforced with short glass fibers (30 wt.%). A Zortrax M200 3D printer with a 0.4 mm diameter hardened steel nozzle is used for printing the specimens. A printing speed of 40 mm/s, bed temperature of 80°C, and nozzle temperature of 255°C are used for the XSTRAND GF30-PA6 specimens. For the ABS specimens, these parameters are modified as 35 mm/s of printing speed, 80°C of bed temperature, and 275°C of nozzle temperature, respectively. Infill is set to 100%, and layer height is 0.19 mm for all specimens.
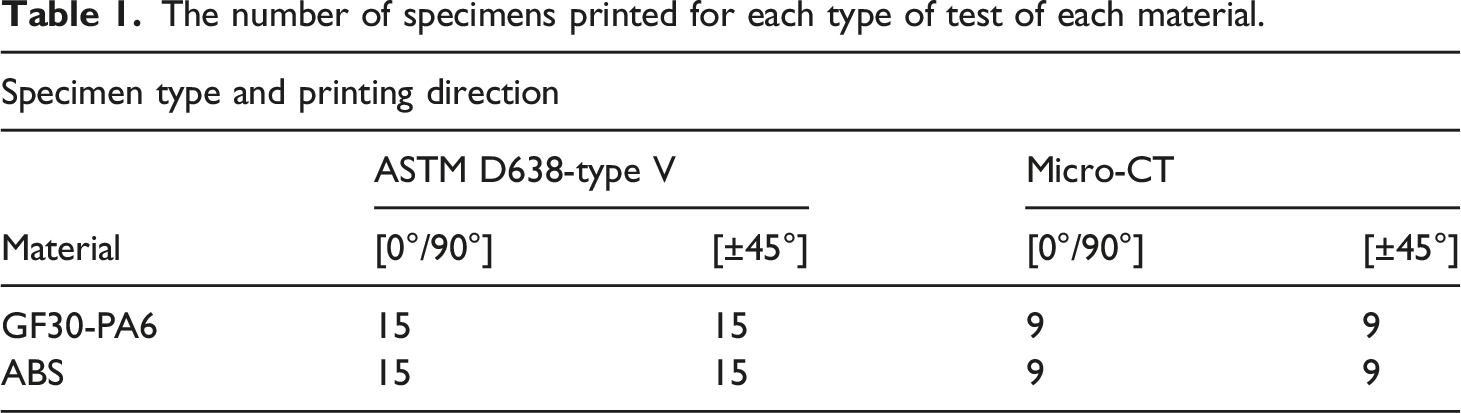
The effect of printing direction on the embedded fiber orientation and tensile properties of the 3D printed samples were investigated by printing the samples in flat, on-edge, and up-right directions at [0°/90°] and [±45°] raster orientations as shown in Figure 1(a). For the micro-CT scans, specimens of the same XSTRAND GF30-PA6 material with 10 mm × 5 mm × 8 mm dimensions are fabricated with the same printing parameters (Figure 1(b)). Altogether 156 specimens are fabricated for mechanical characterization tests and micro-CT scans (Table 1). (a) Naming of the printed specimens, which are manufactured according to the ASTM D638 standard (red-colored specimens have [0°/90°] orientation, while the black-colored specimens have [±45°] orientation). (b) Micro-CT specimens. The number of specimens printed for each type of test of each material.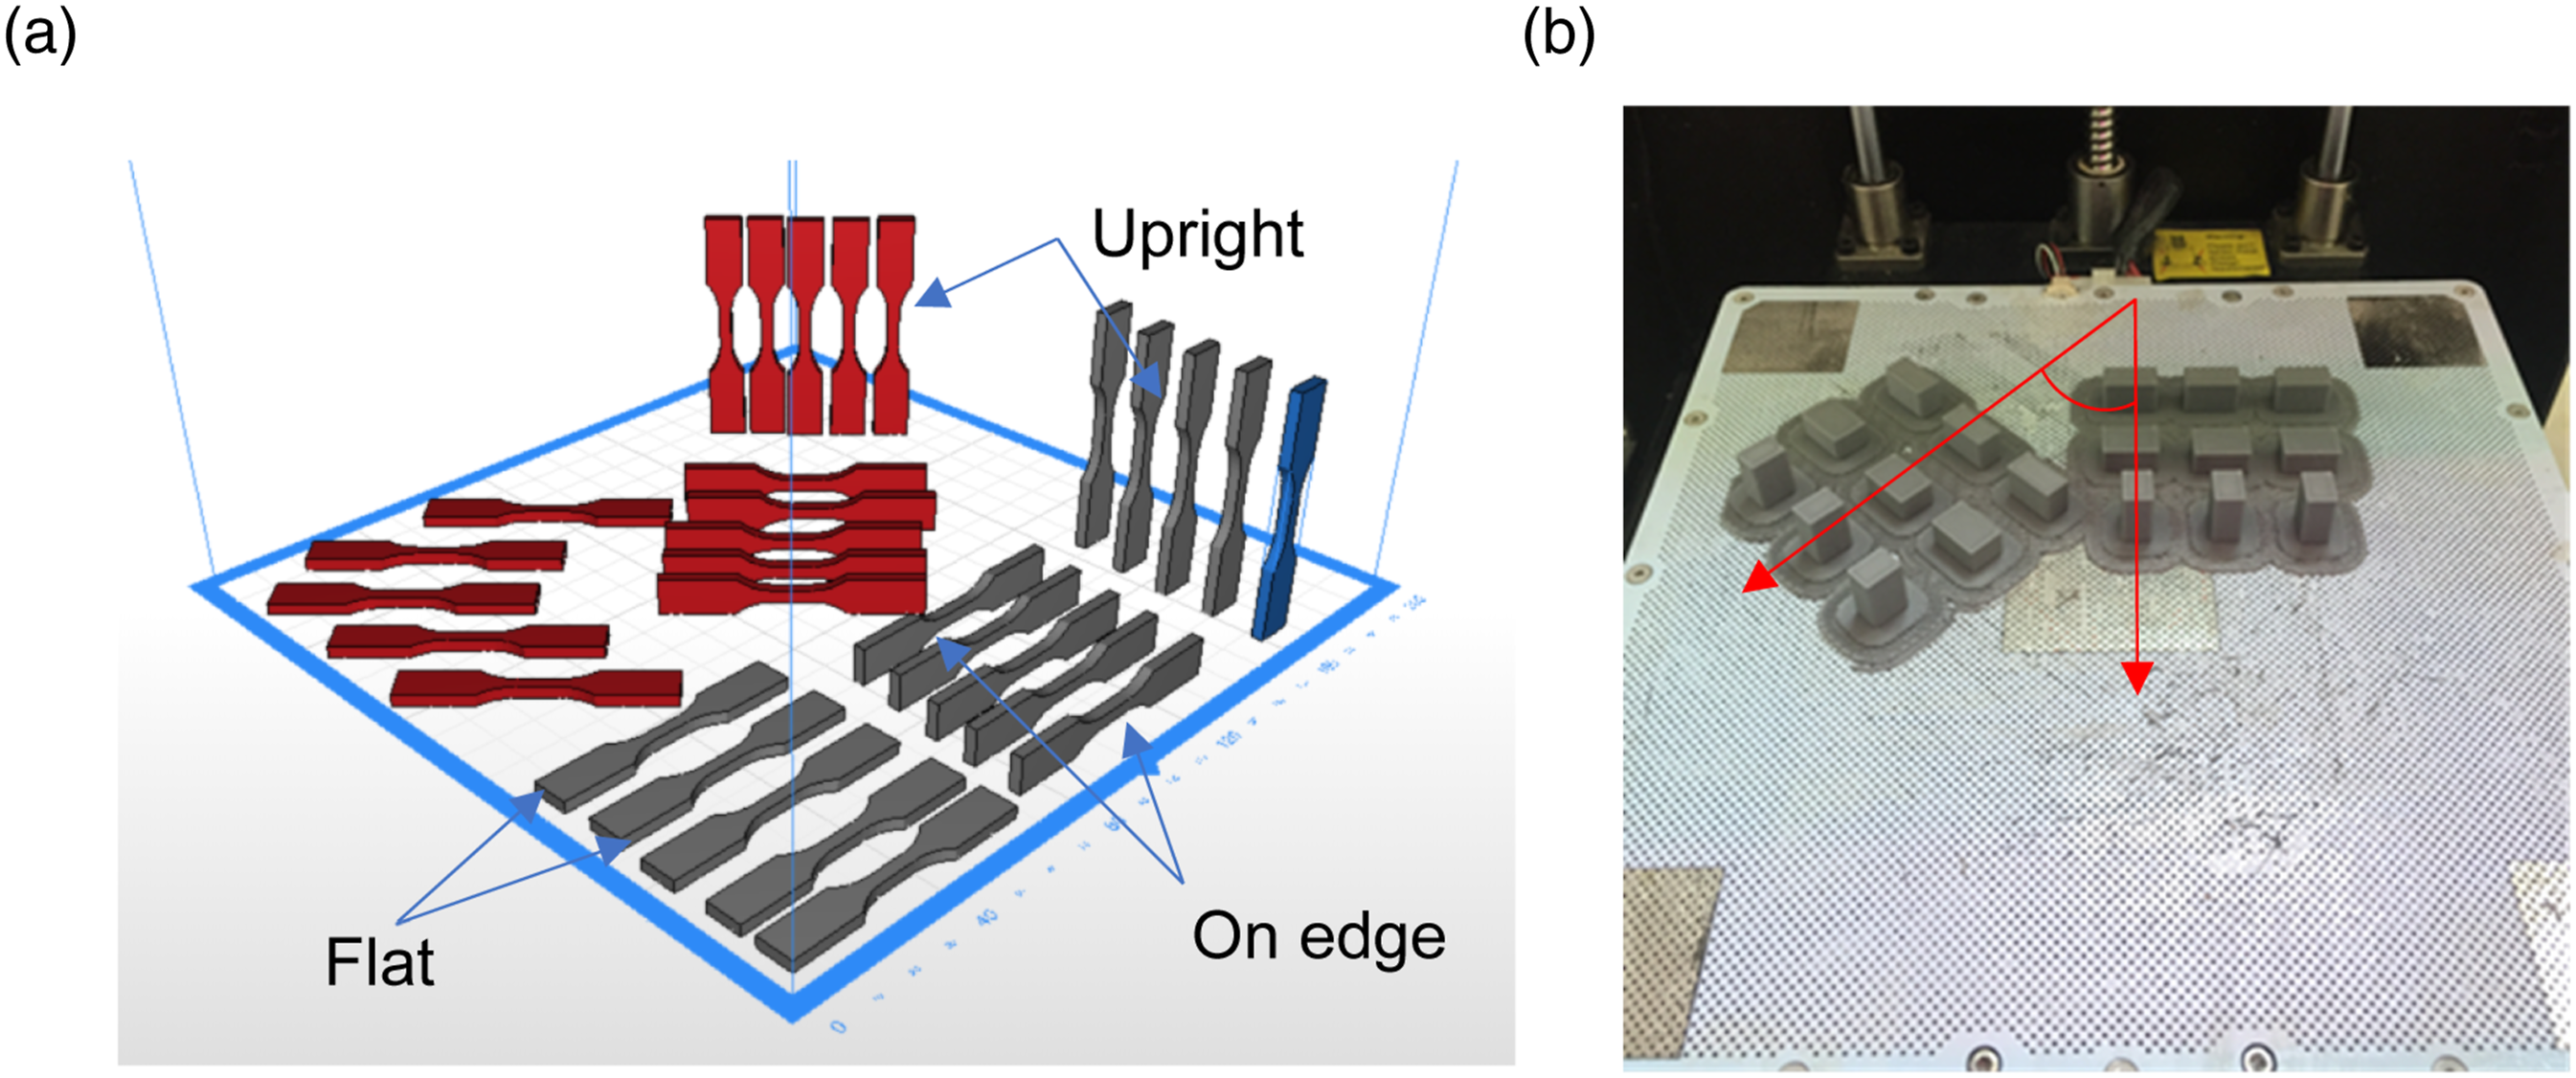
Characterization of the internal morphology of the composite
In order to determine the weight (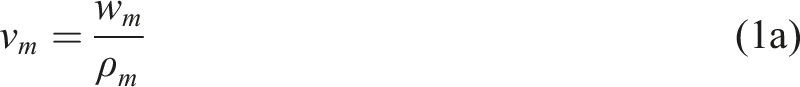
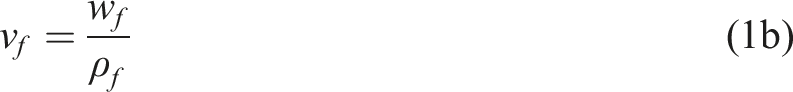
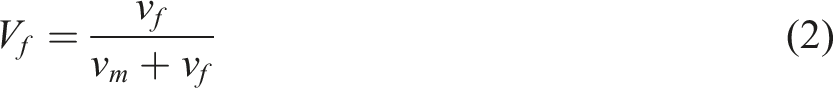
As a result of the analysis, the weight ratio of the glass fibers turned out to be 27% (Figure 2). The densities of the component materials are determined as TGA results of the GF30-PA6 filament as the percent decrease of the normalized weight against temperature.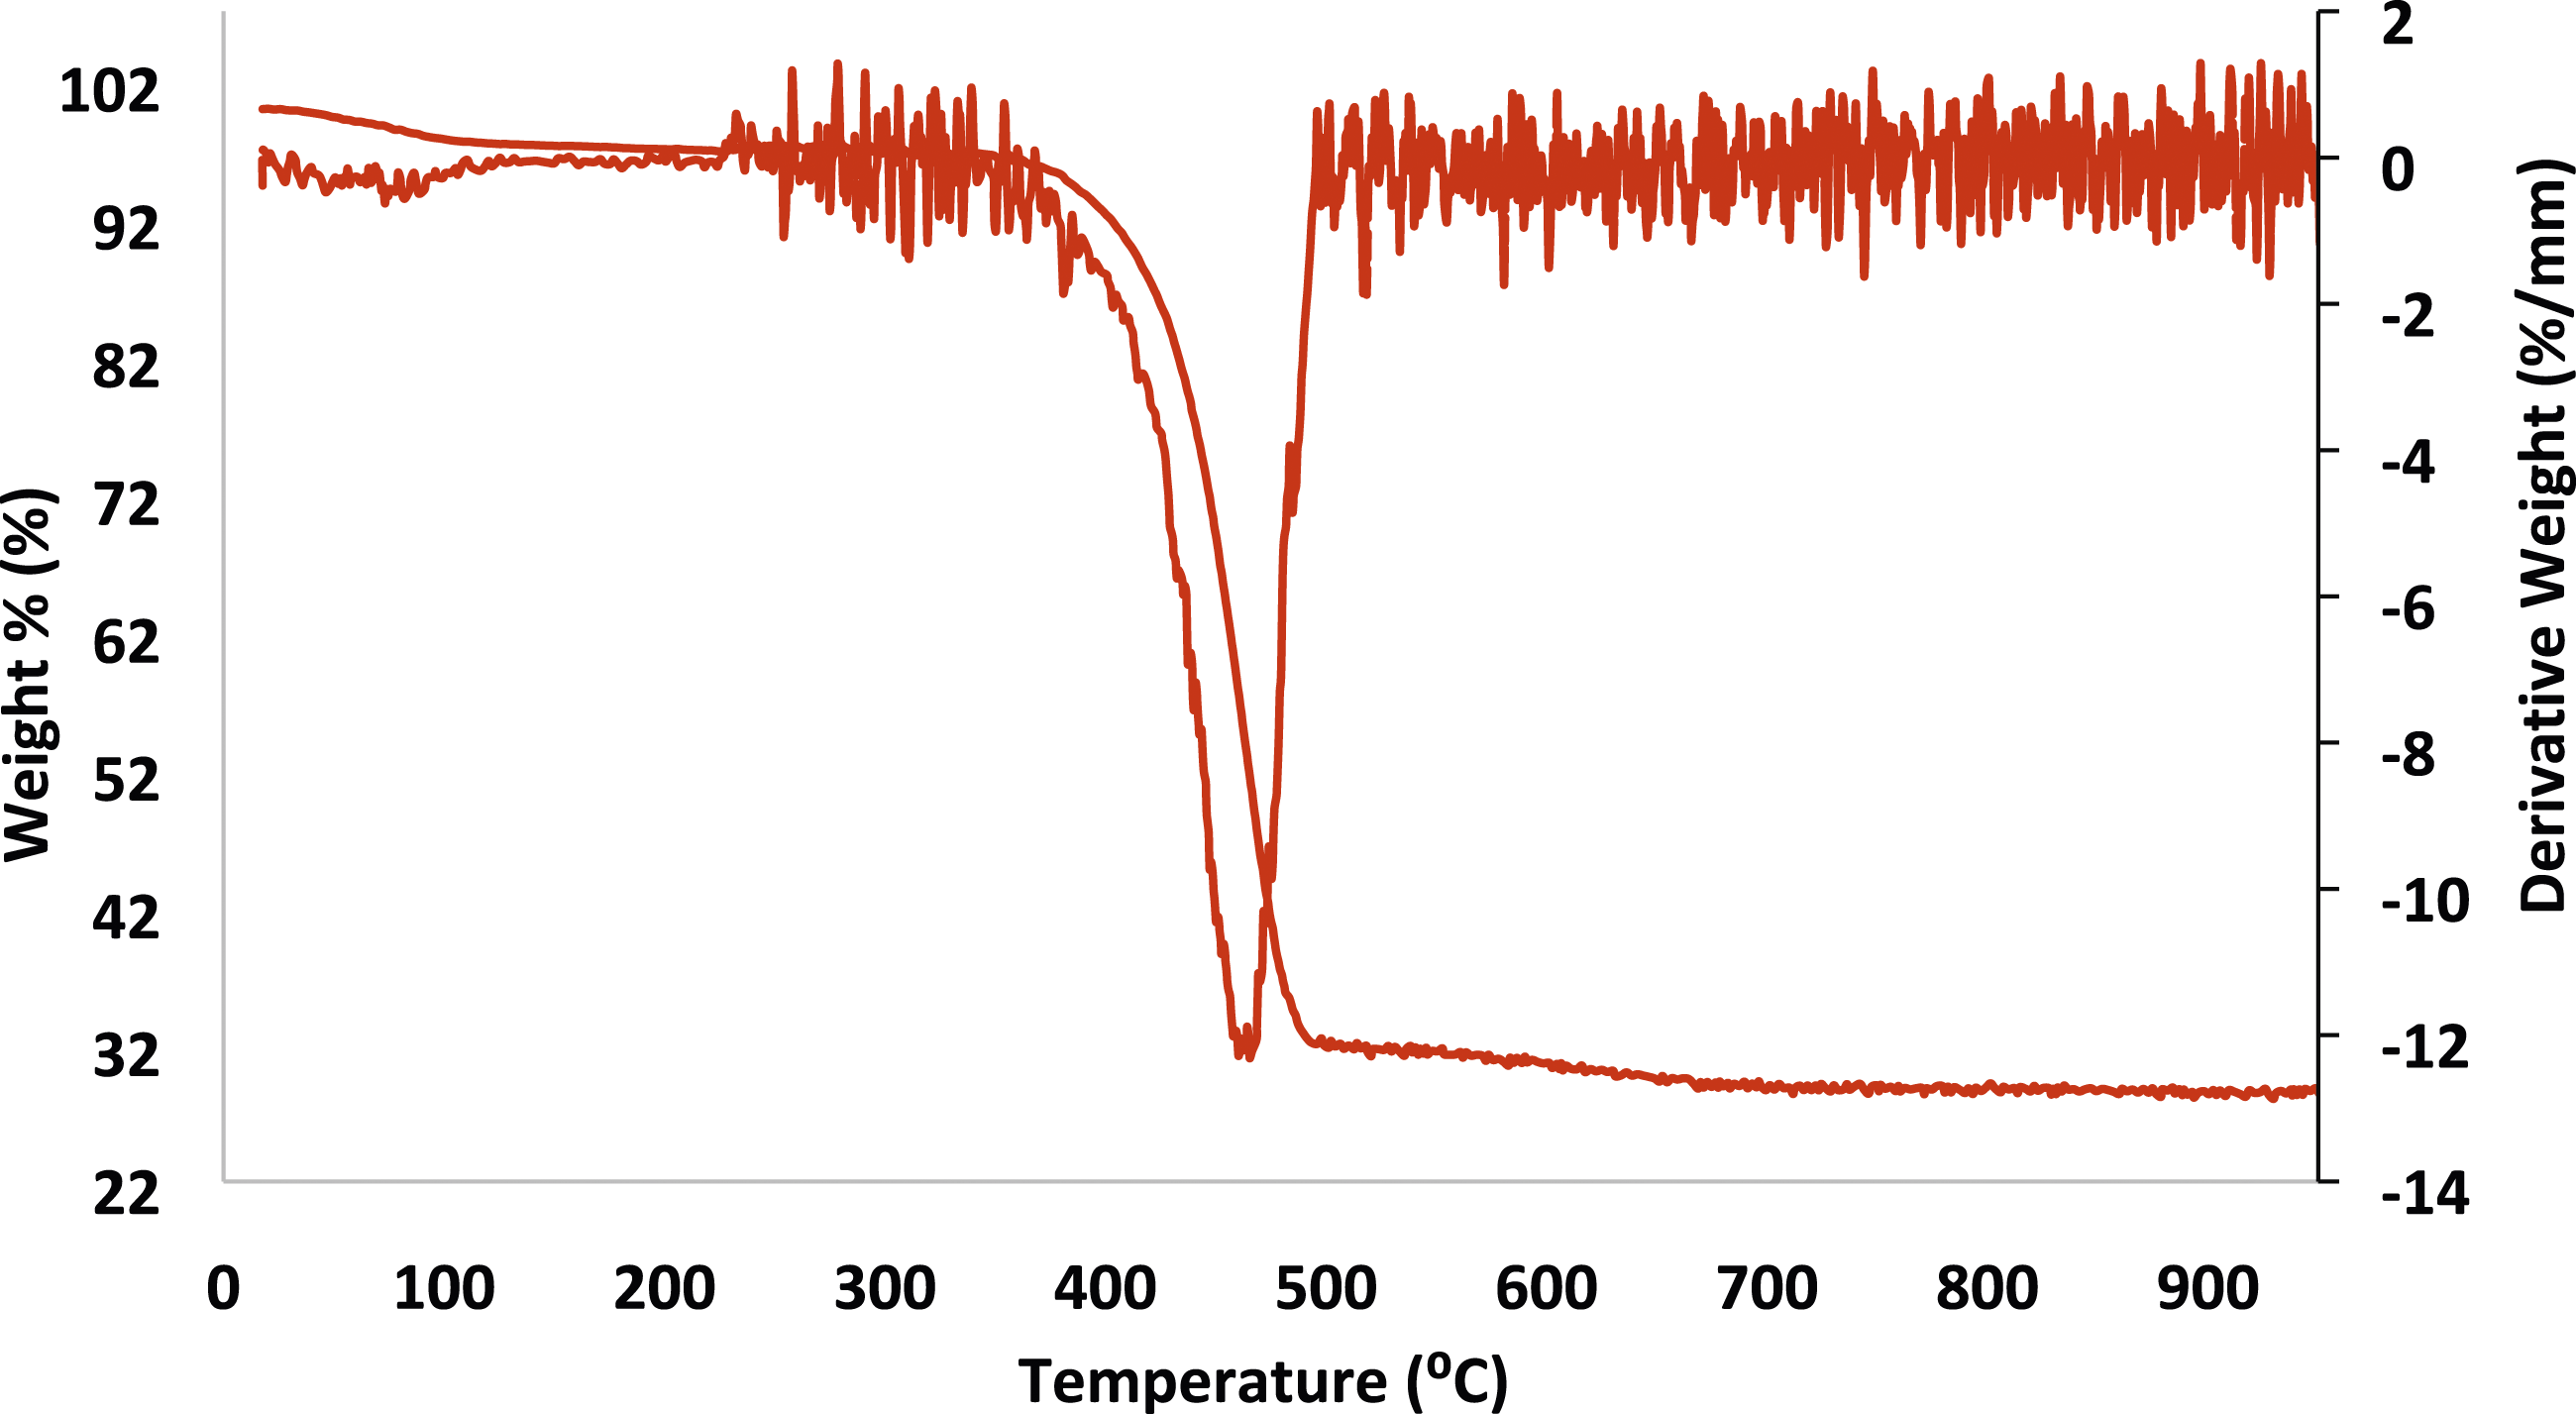
Scanning electron microscopy (SEM) was used to determine the embedded glass fiber length and diameter. The imaging was performed on representative samples using Tescan GAIA three equipped with a field emission electron gun in Hacettepe University Research and Application Center of Advanced Technologies (HUNITEK). Secondary electron (SE) imagery has been acquired under 7 kV accelerating voltage, 50 Pa beam current with 7 mm of working distance. Figure 3 shows the microstructure of the fabricated samples with PA6-G30 filament. The average diameter and length of the glass fibers were measured as 11.27 μm and 300 μm, respectively. SEM images of (a) [0°/90°]; (b) [±45°] on edge specimens.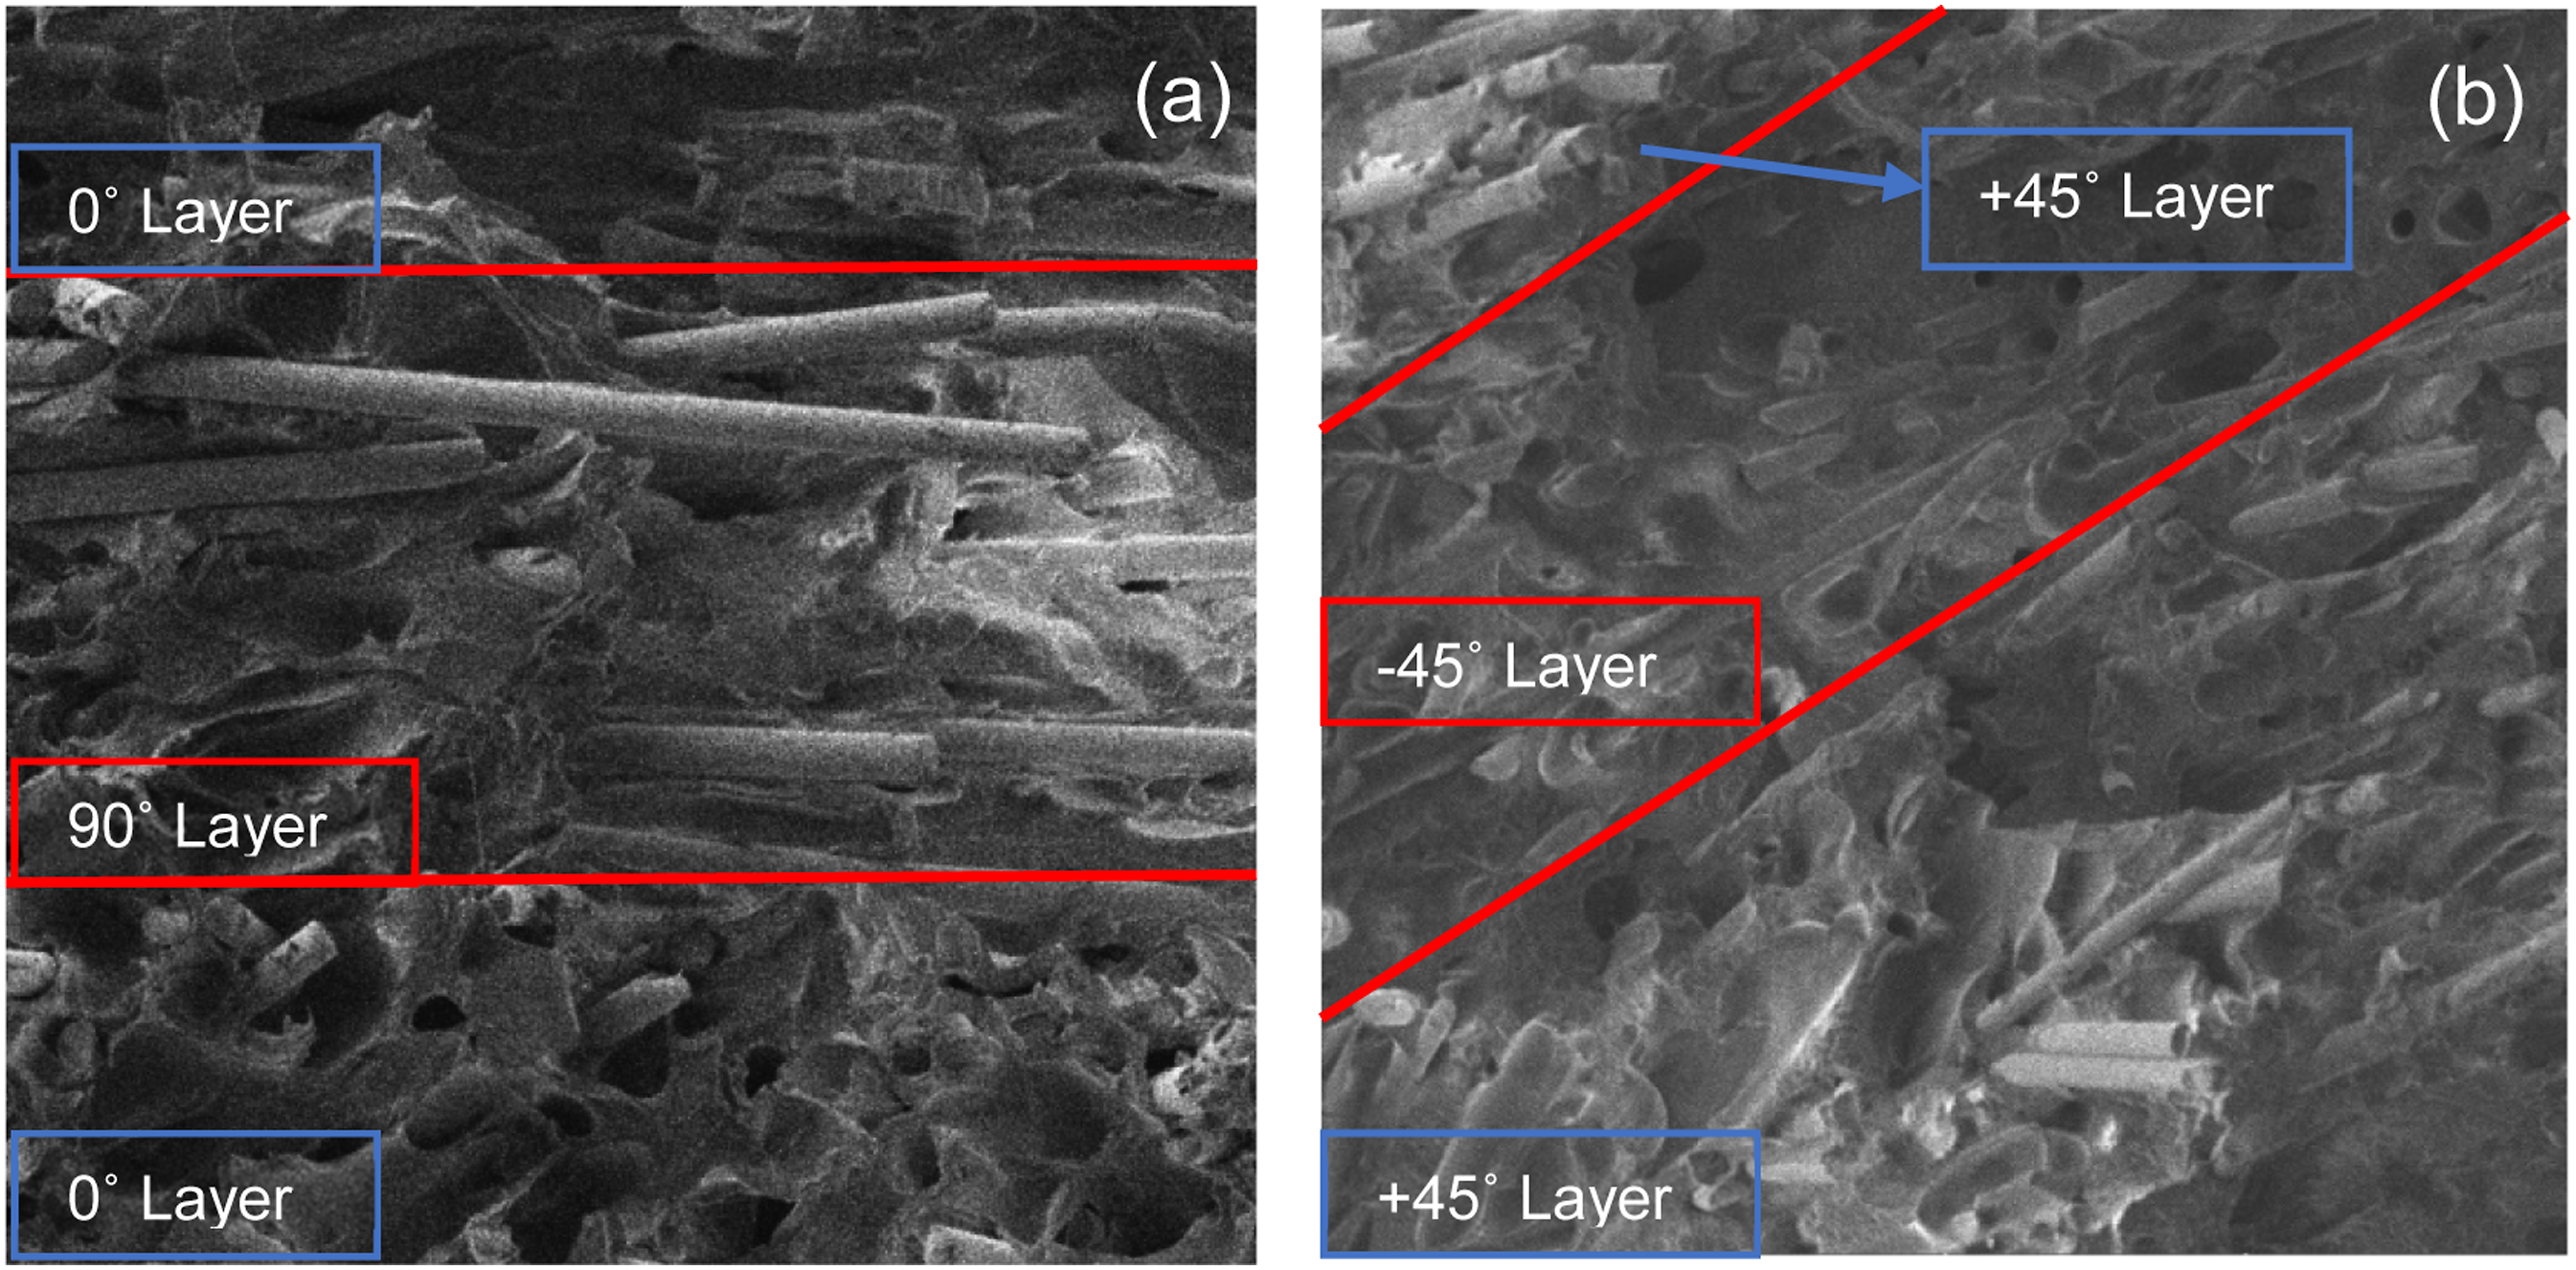
Tensile tests
Types and printing directions of the tensile test specimens.
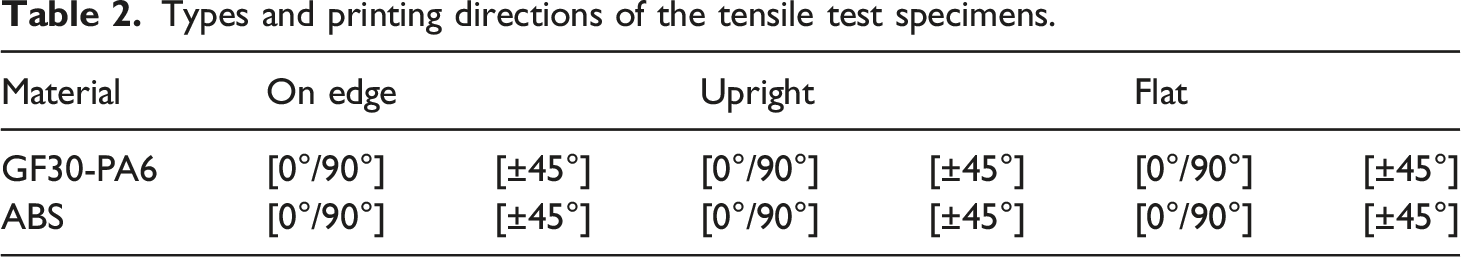
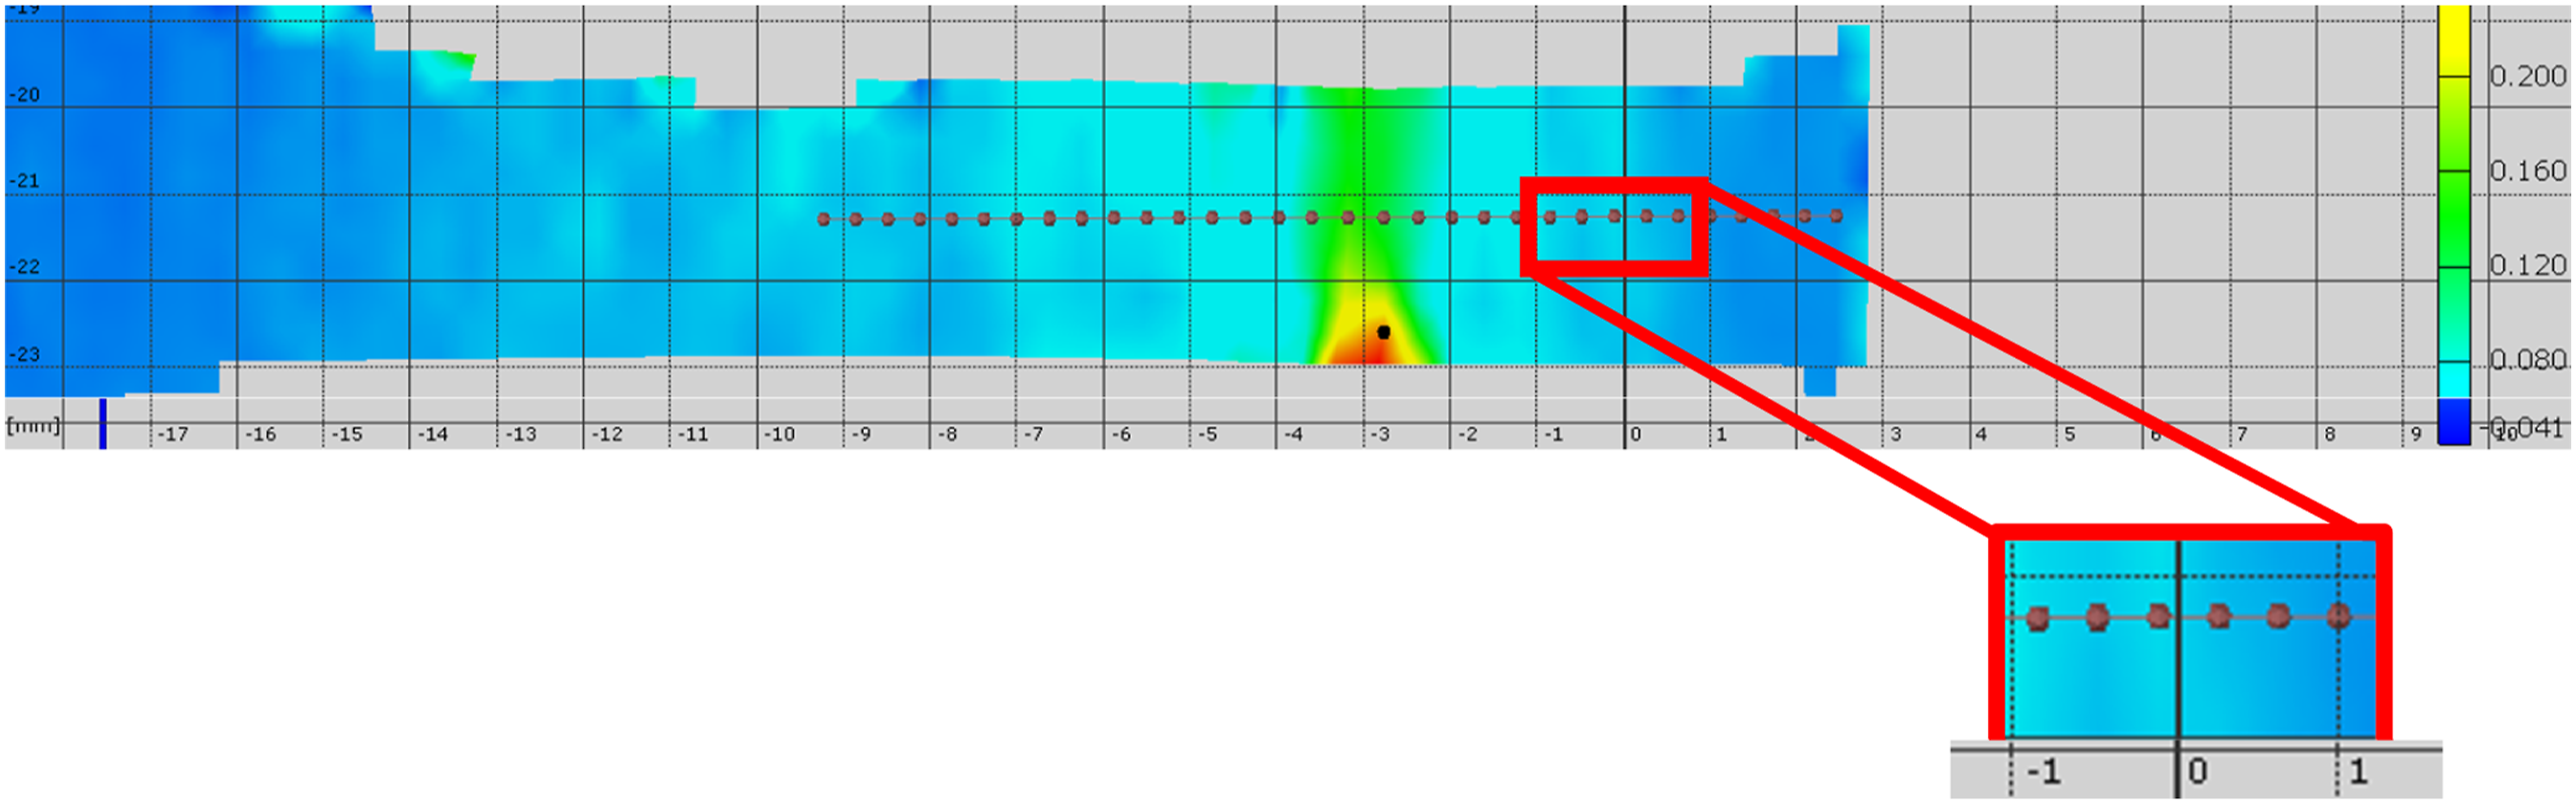
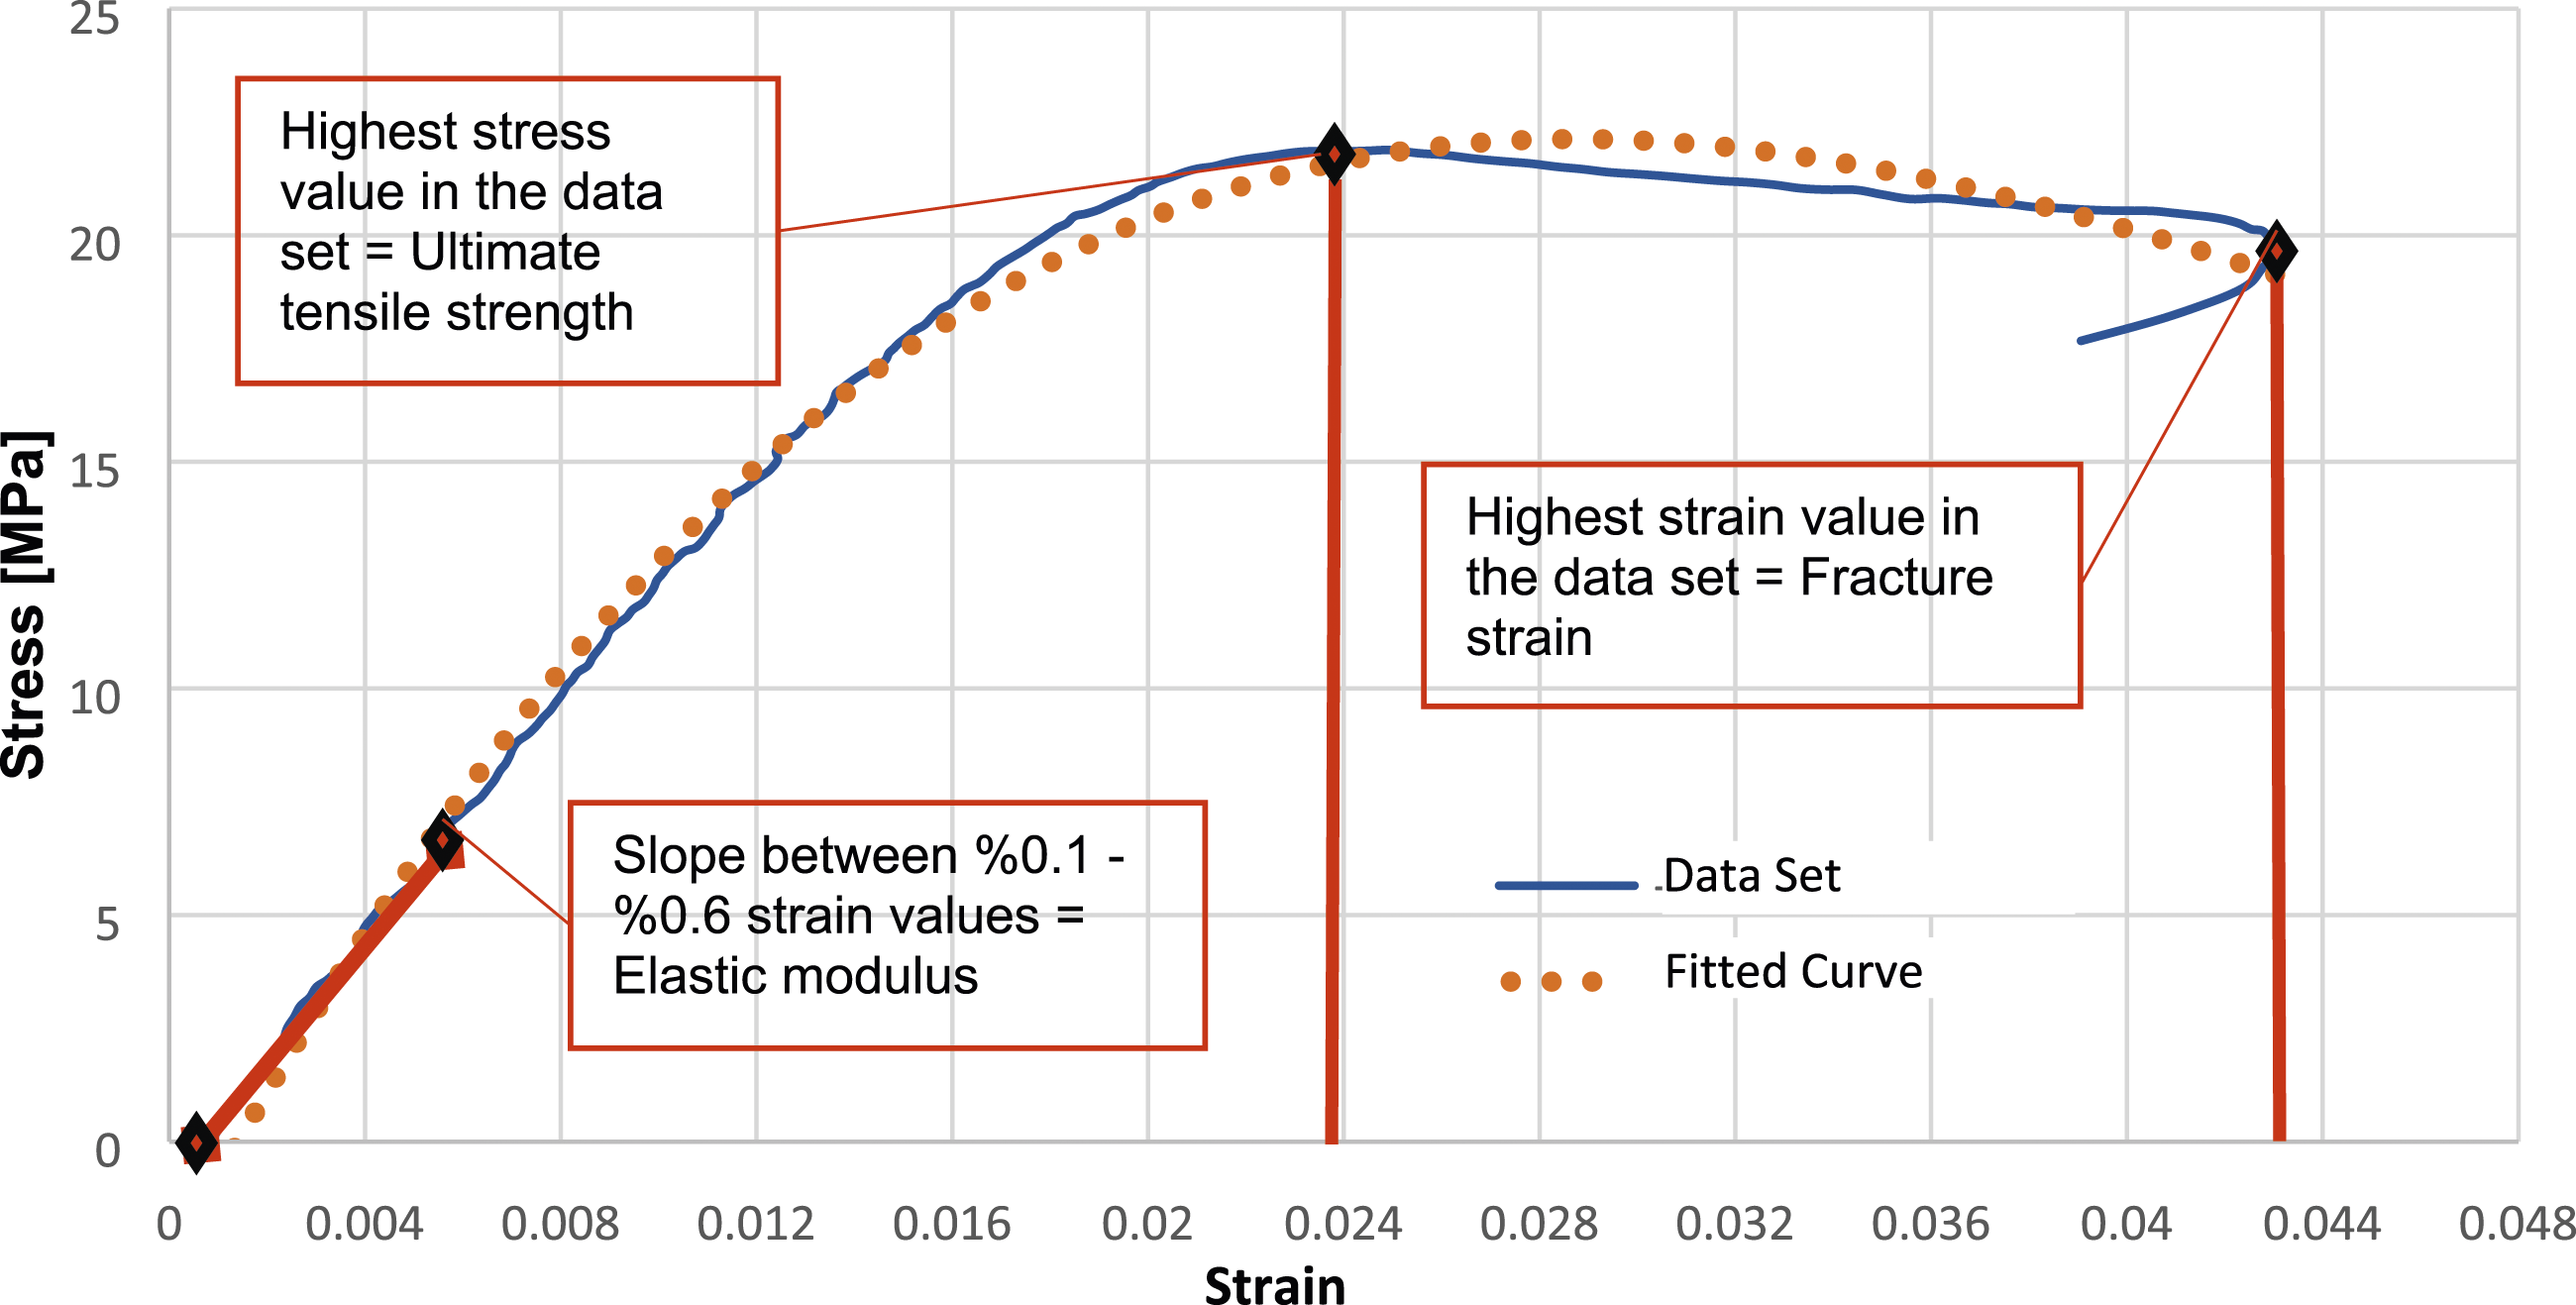
Figure 4 presents the strain distribution on the specimens and the virtual measurement points. In order to increase the effectiveness and save time, only the displacements from a certain number of measurement points are processed. The measurement points are chosen to be within a 1 mm distance from each side of the fracture point. (Figure 5). Six points are determined to be within the decided area. Elastic modulus, ultimate tensile, and fracture stress-strain values are determined, as shown in Figure 6. DIC image examples of specimens. DIC image of [±45°] upright PA6 specimen and the distance scale in mm. Determination of tensile properties from the stress-strain curve (blue curve indicates the data set; orange dots indicate the polynomial curve fitted to the data set).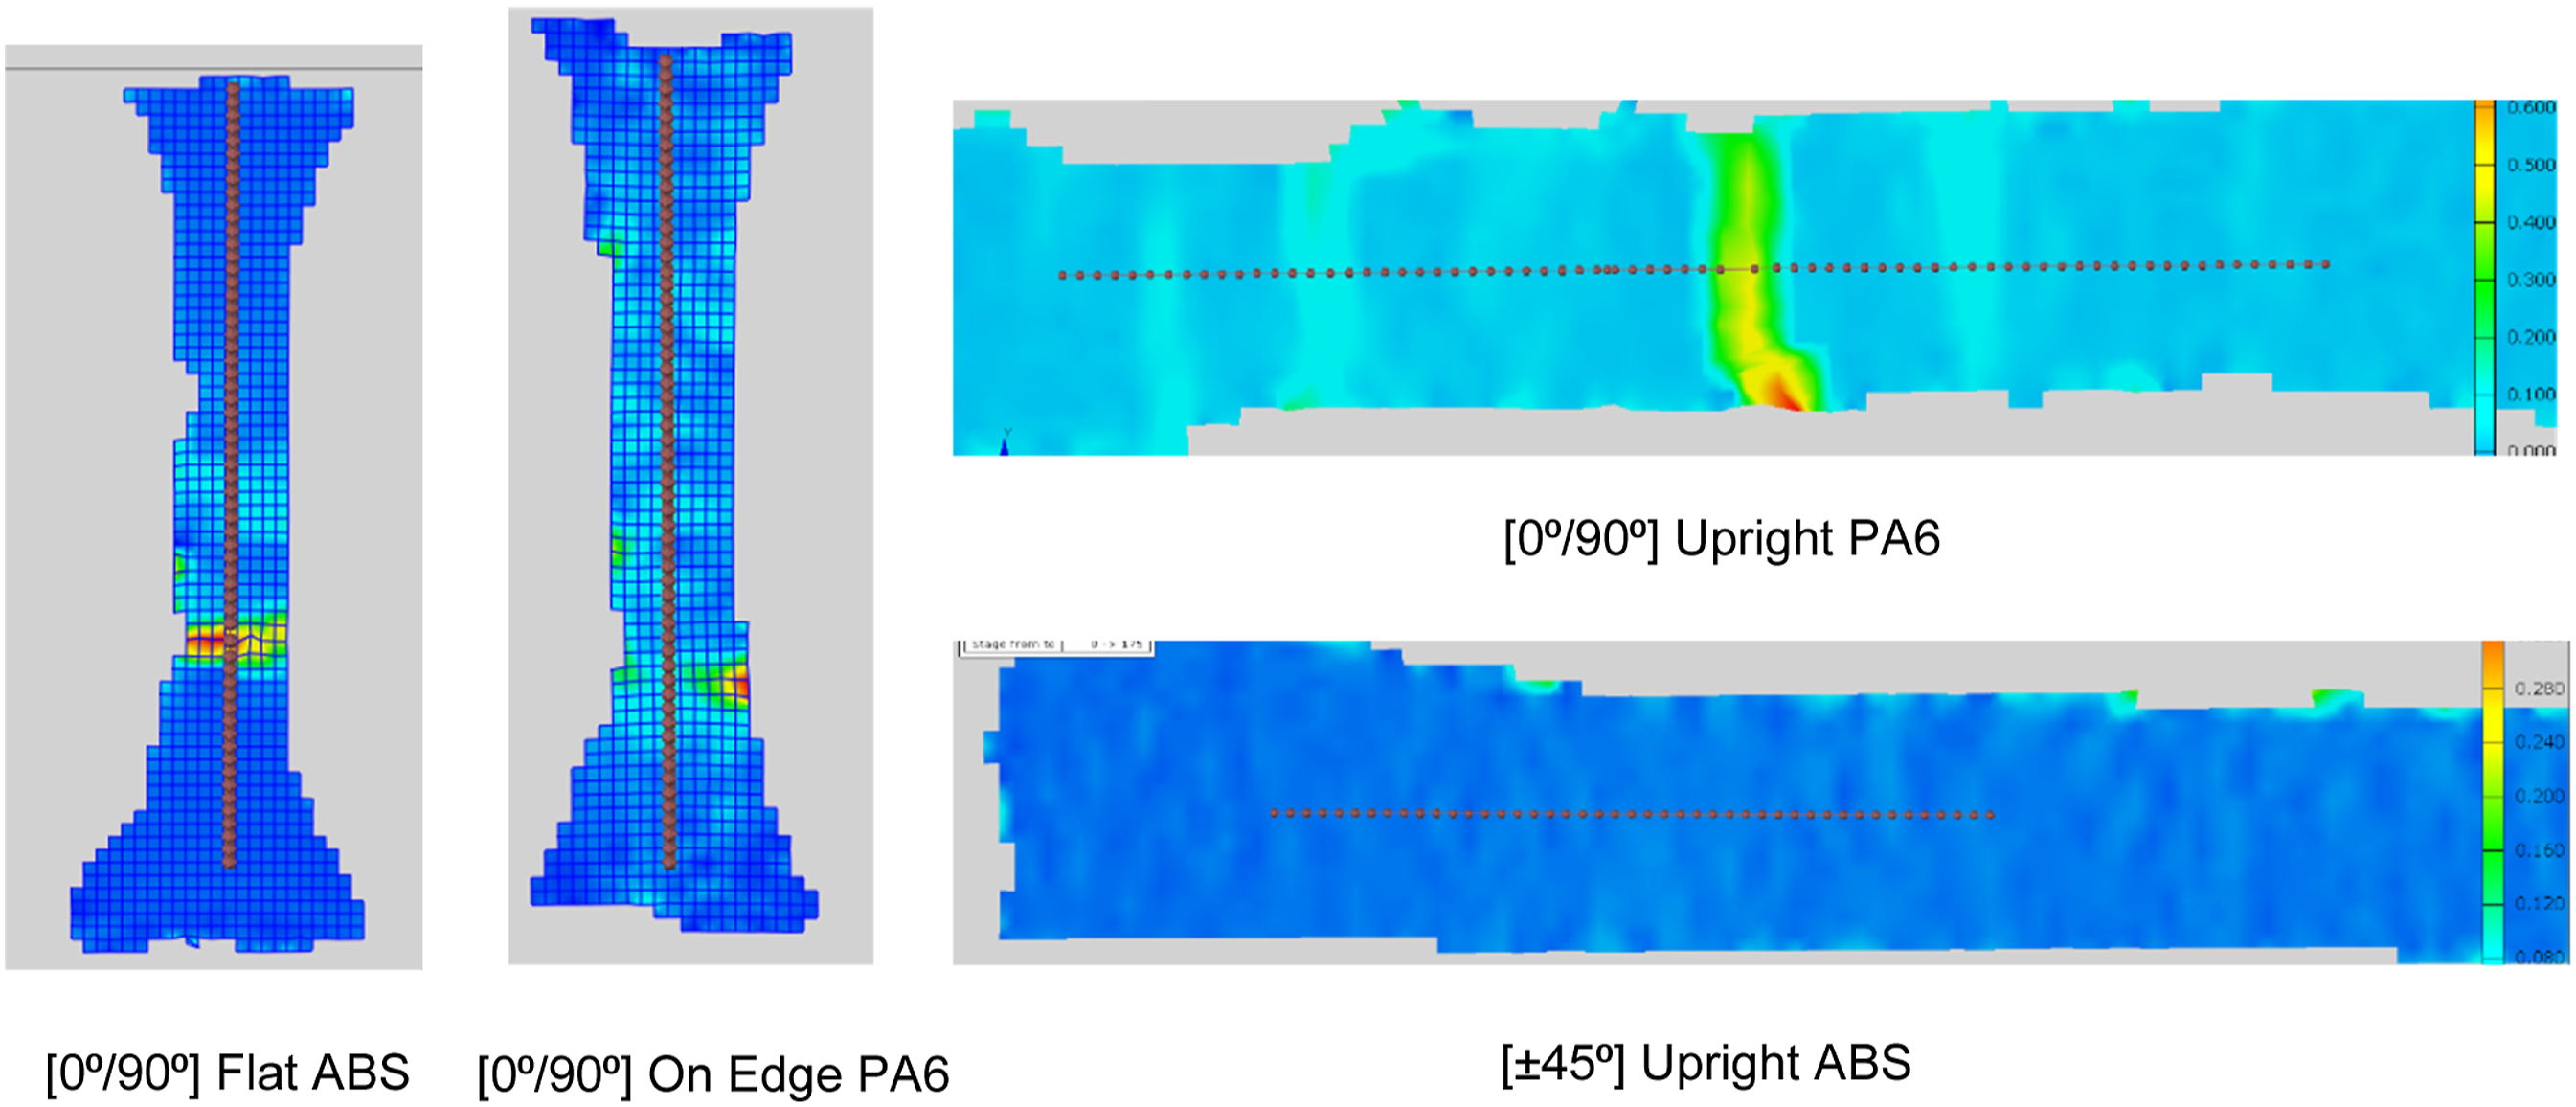
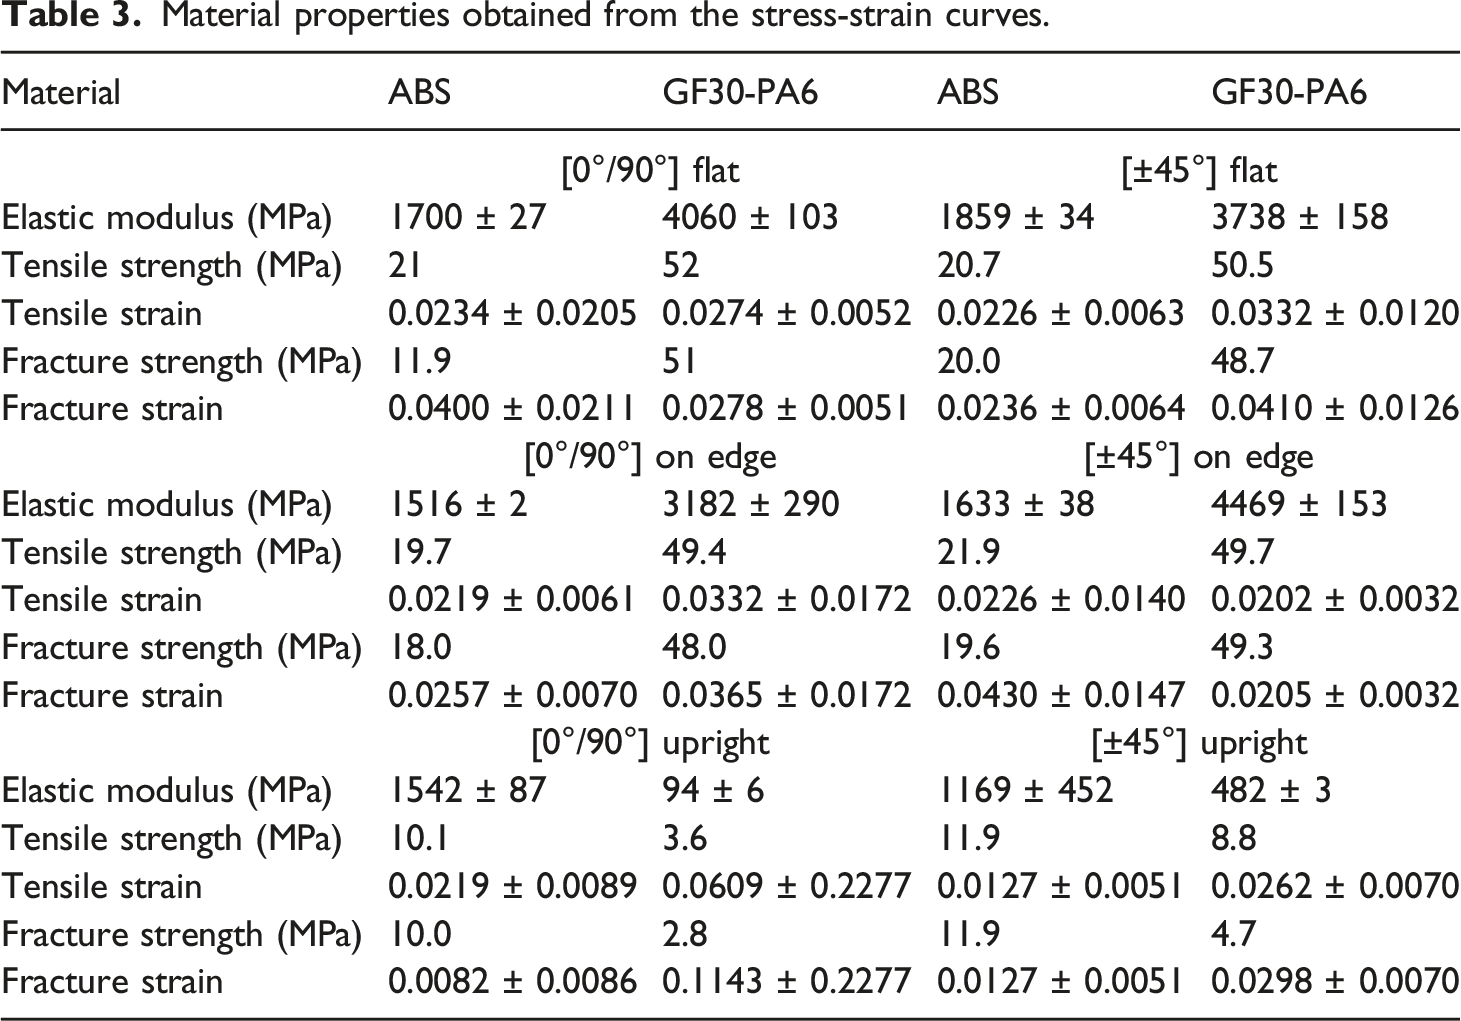
Material properties obtained from the stress-strain curves.
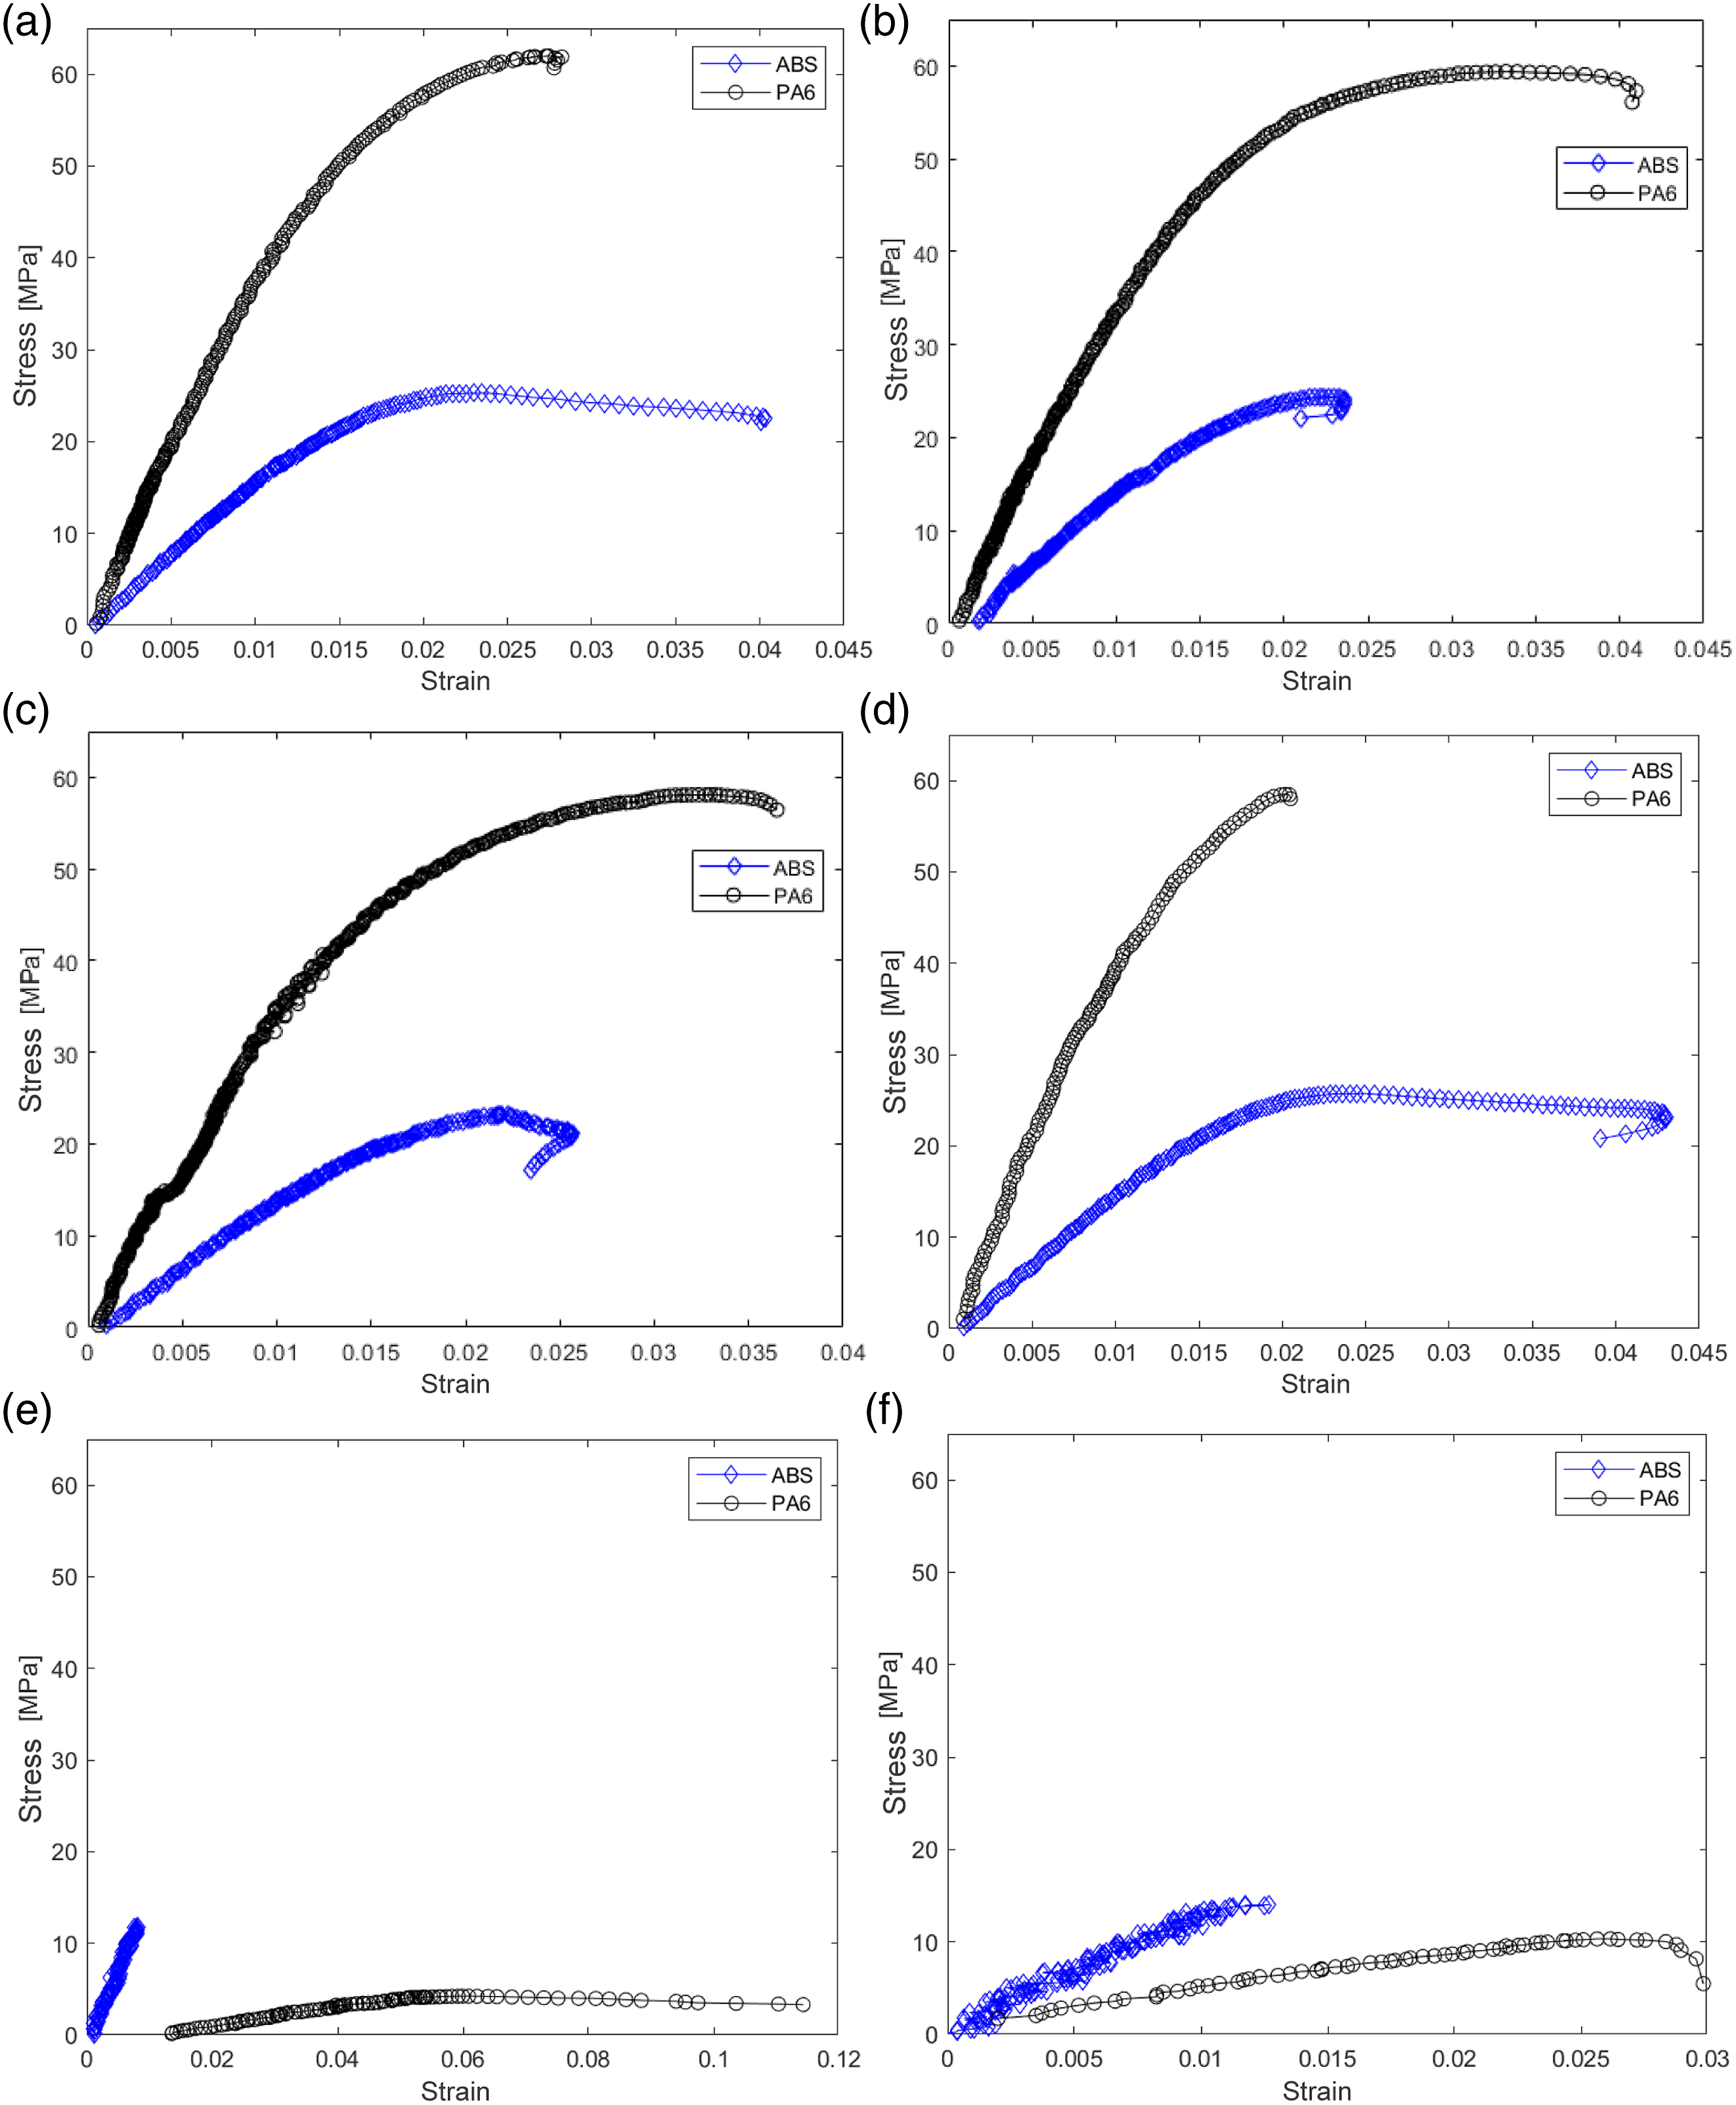
Stress-strain curves per printing configuration. (a) [0°/90°] flat; (b) [±45°] flat; (c) [0°/90°] on edge; (d) [±45°] on edge; (e) [0°/90°] upright; (f) [±45°] upright.
The SEM images of the fractured surfaces in Figure 8 show that the dominant failure mode at GF30-PA6 samples is fiber pull-out in different specimens, even though their printing directions and fiber orientations are different. The red circles on the images indicate that the fibers are pulled out of the matrix as a whole, meaning that fiber pull-out has occurred in the sample. Fracture surface images of (a) [0°/90°] upright; (b) [0°/90°] flat; (c) [±45°] on edge; (d) [±45°] flat specimens. Red circles indicate the fiber pull-out regions.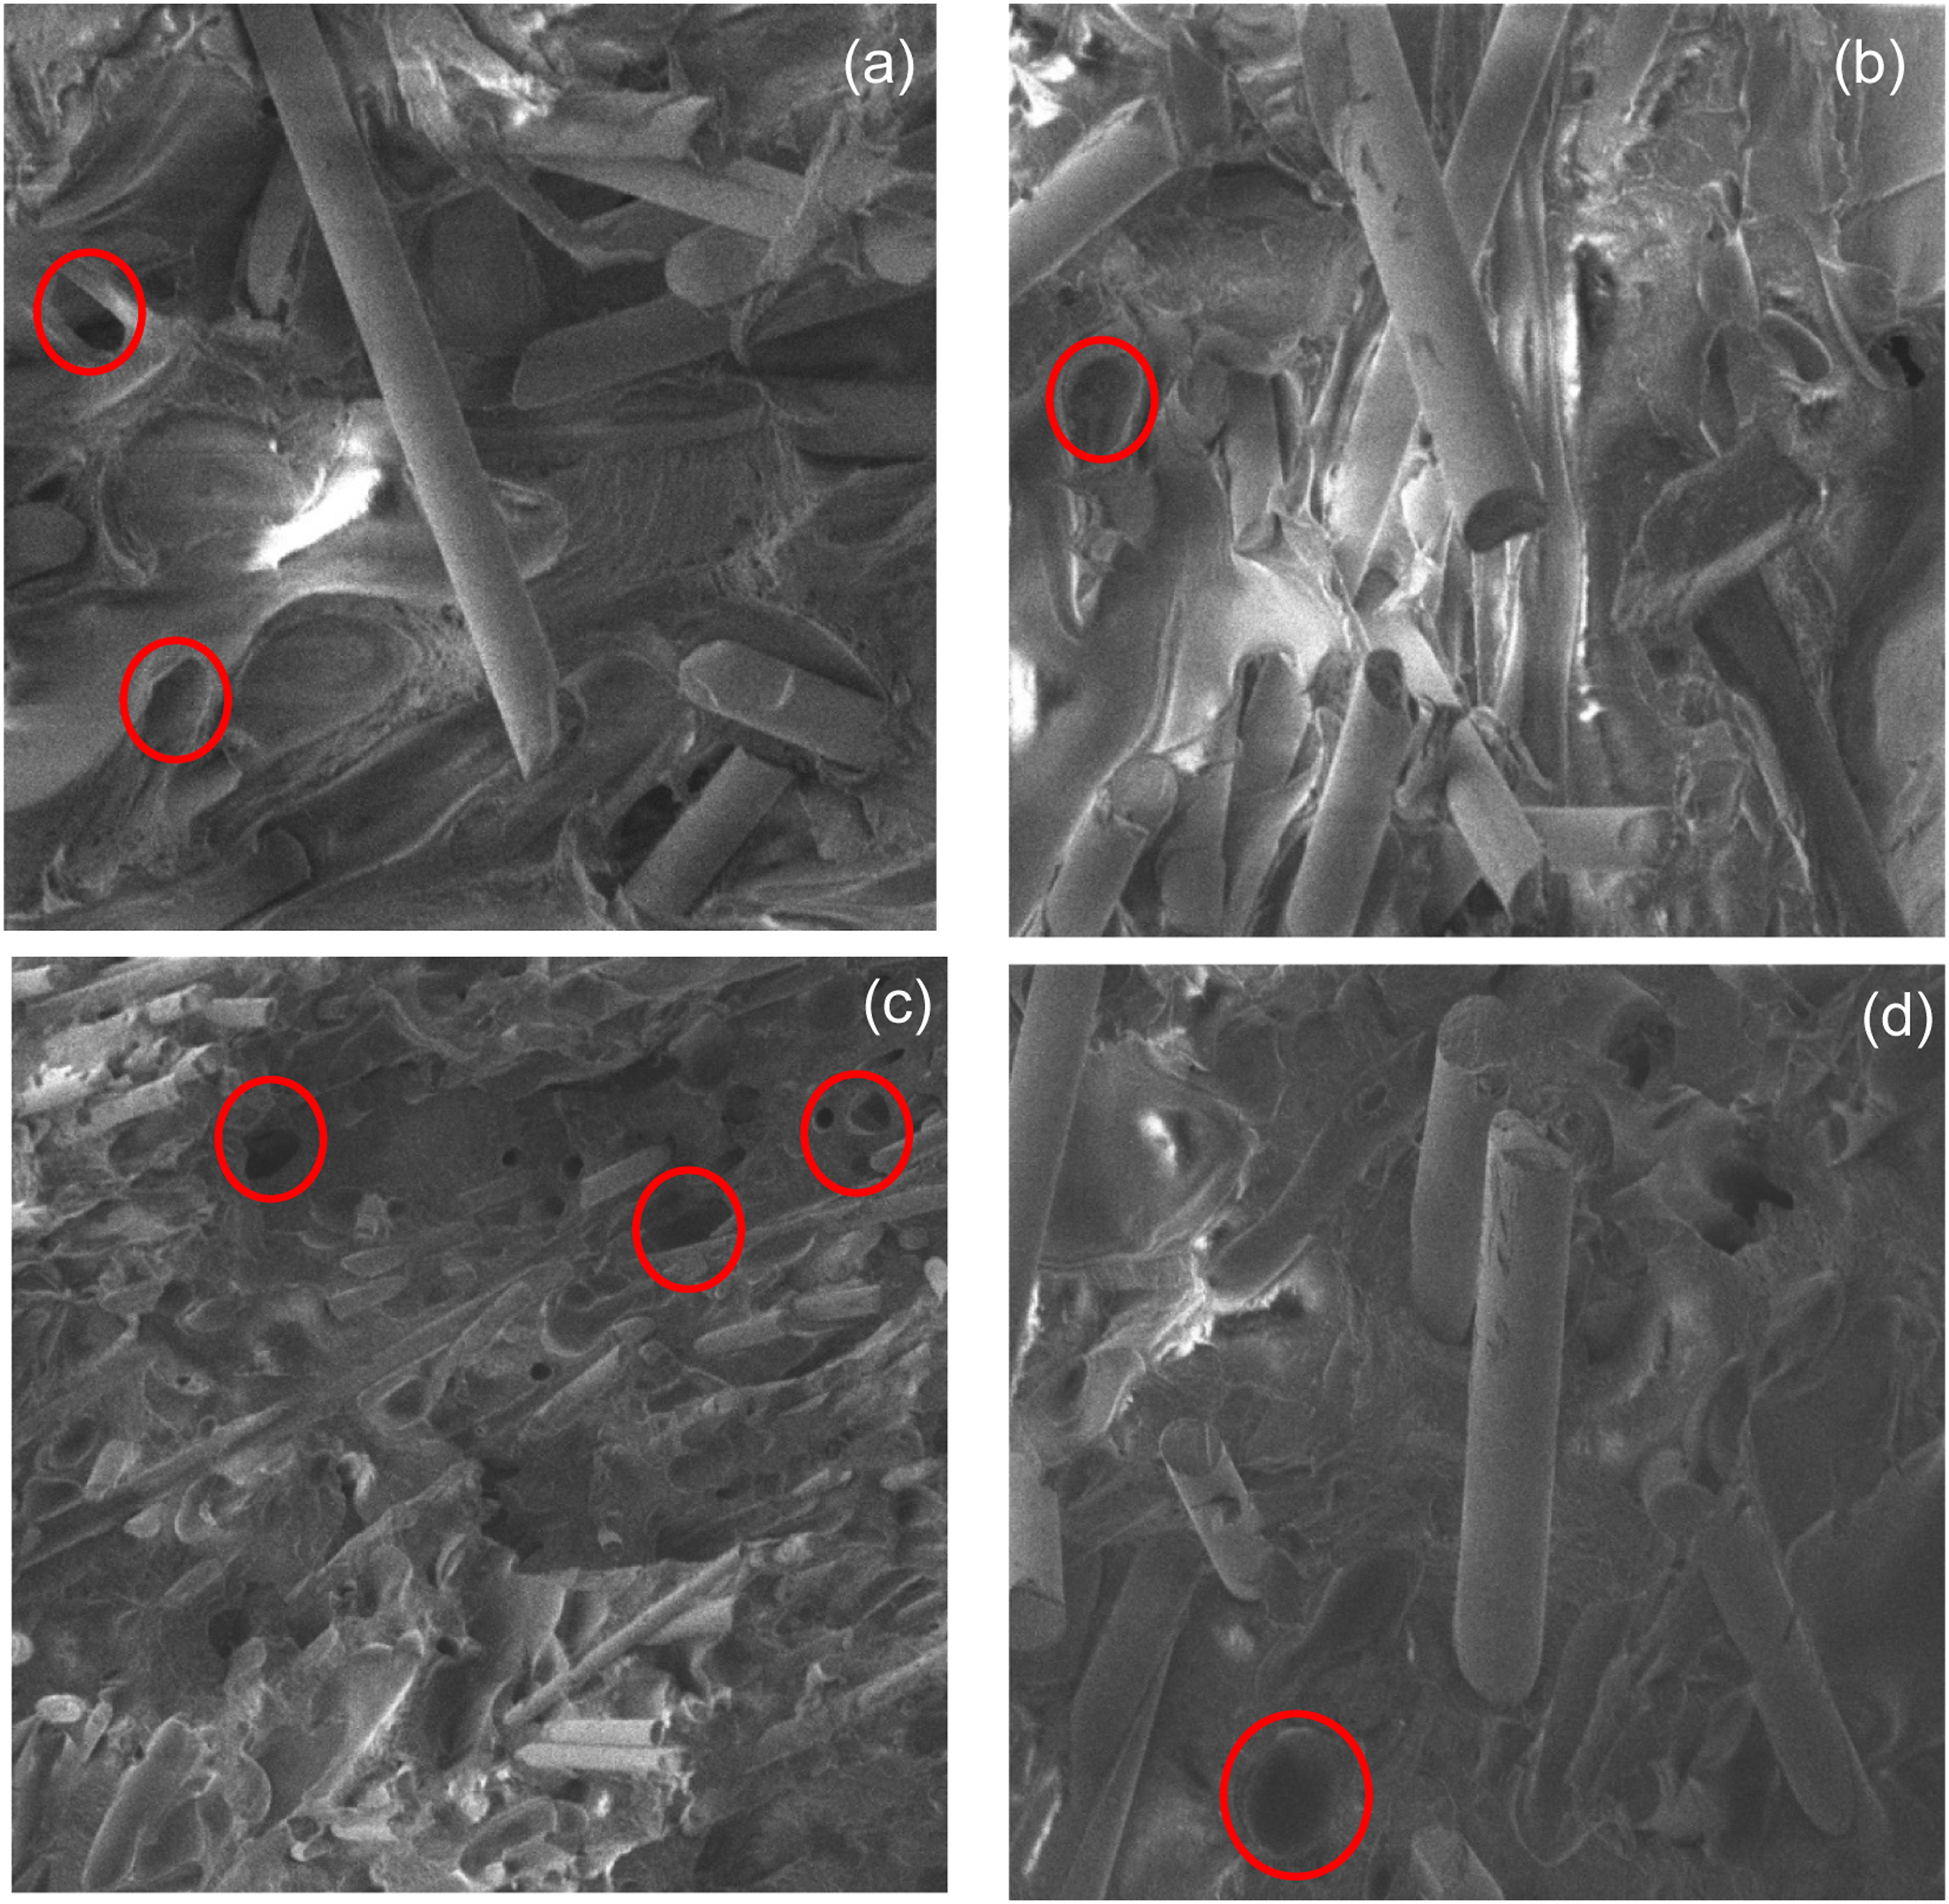
Micro-CT scanning procedure
Representative samples (Figure 10) have been chosen for computerized microtomography (µCT) analyses in order to reveal the three-dimensional distribution of components. The samples have been scanned using Bruker 1272 scanner installed in Hacettepe University Research and Application Center of Advanced Technologies (HUNITEK). Samples have been scanned under 75 kV source voltage and 100 µA source current with 0.18° rotation step generating 2450 × 2450 pixel raw images having 4 µm/pixel resolution. This resolution is selected such that it is about 1/3 of the average fiber diameter, which is determined through experience from prior studies. Raw images were reconstructed into a virtual stack of virtual slices with the same resolution using InstaRecon algorithm. Image processing was then employed on reconstructed image stacks using VoxTex software platform.
Fiber orientation analysis
Images of the internal structure are obtained using micro-CT scans. The fiber orientation distribution is extracted from these images to estimate the mechanical behavior with analytical methods. For the micro-CT scans, smaller samples are manufactured in [0/90°] and [±45°] orientations (Figure 9). (a), (b) Micro-CT scan samples (scale = 10 mm).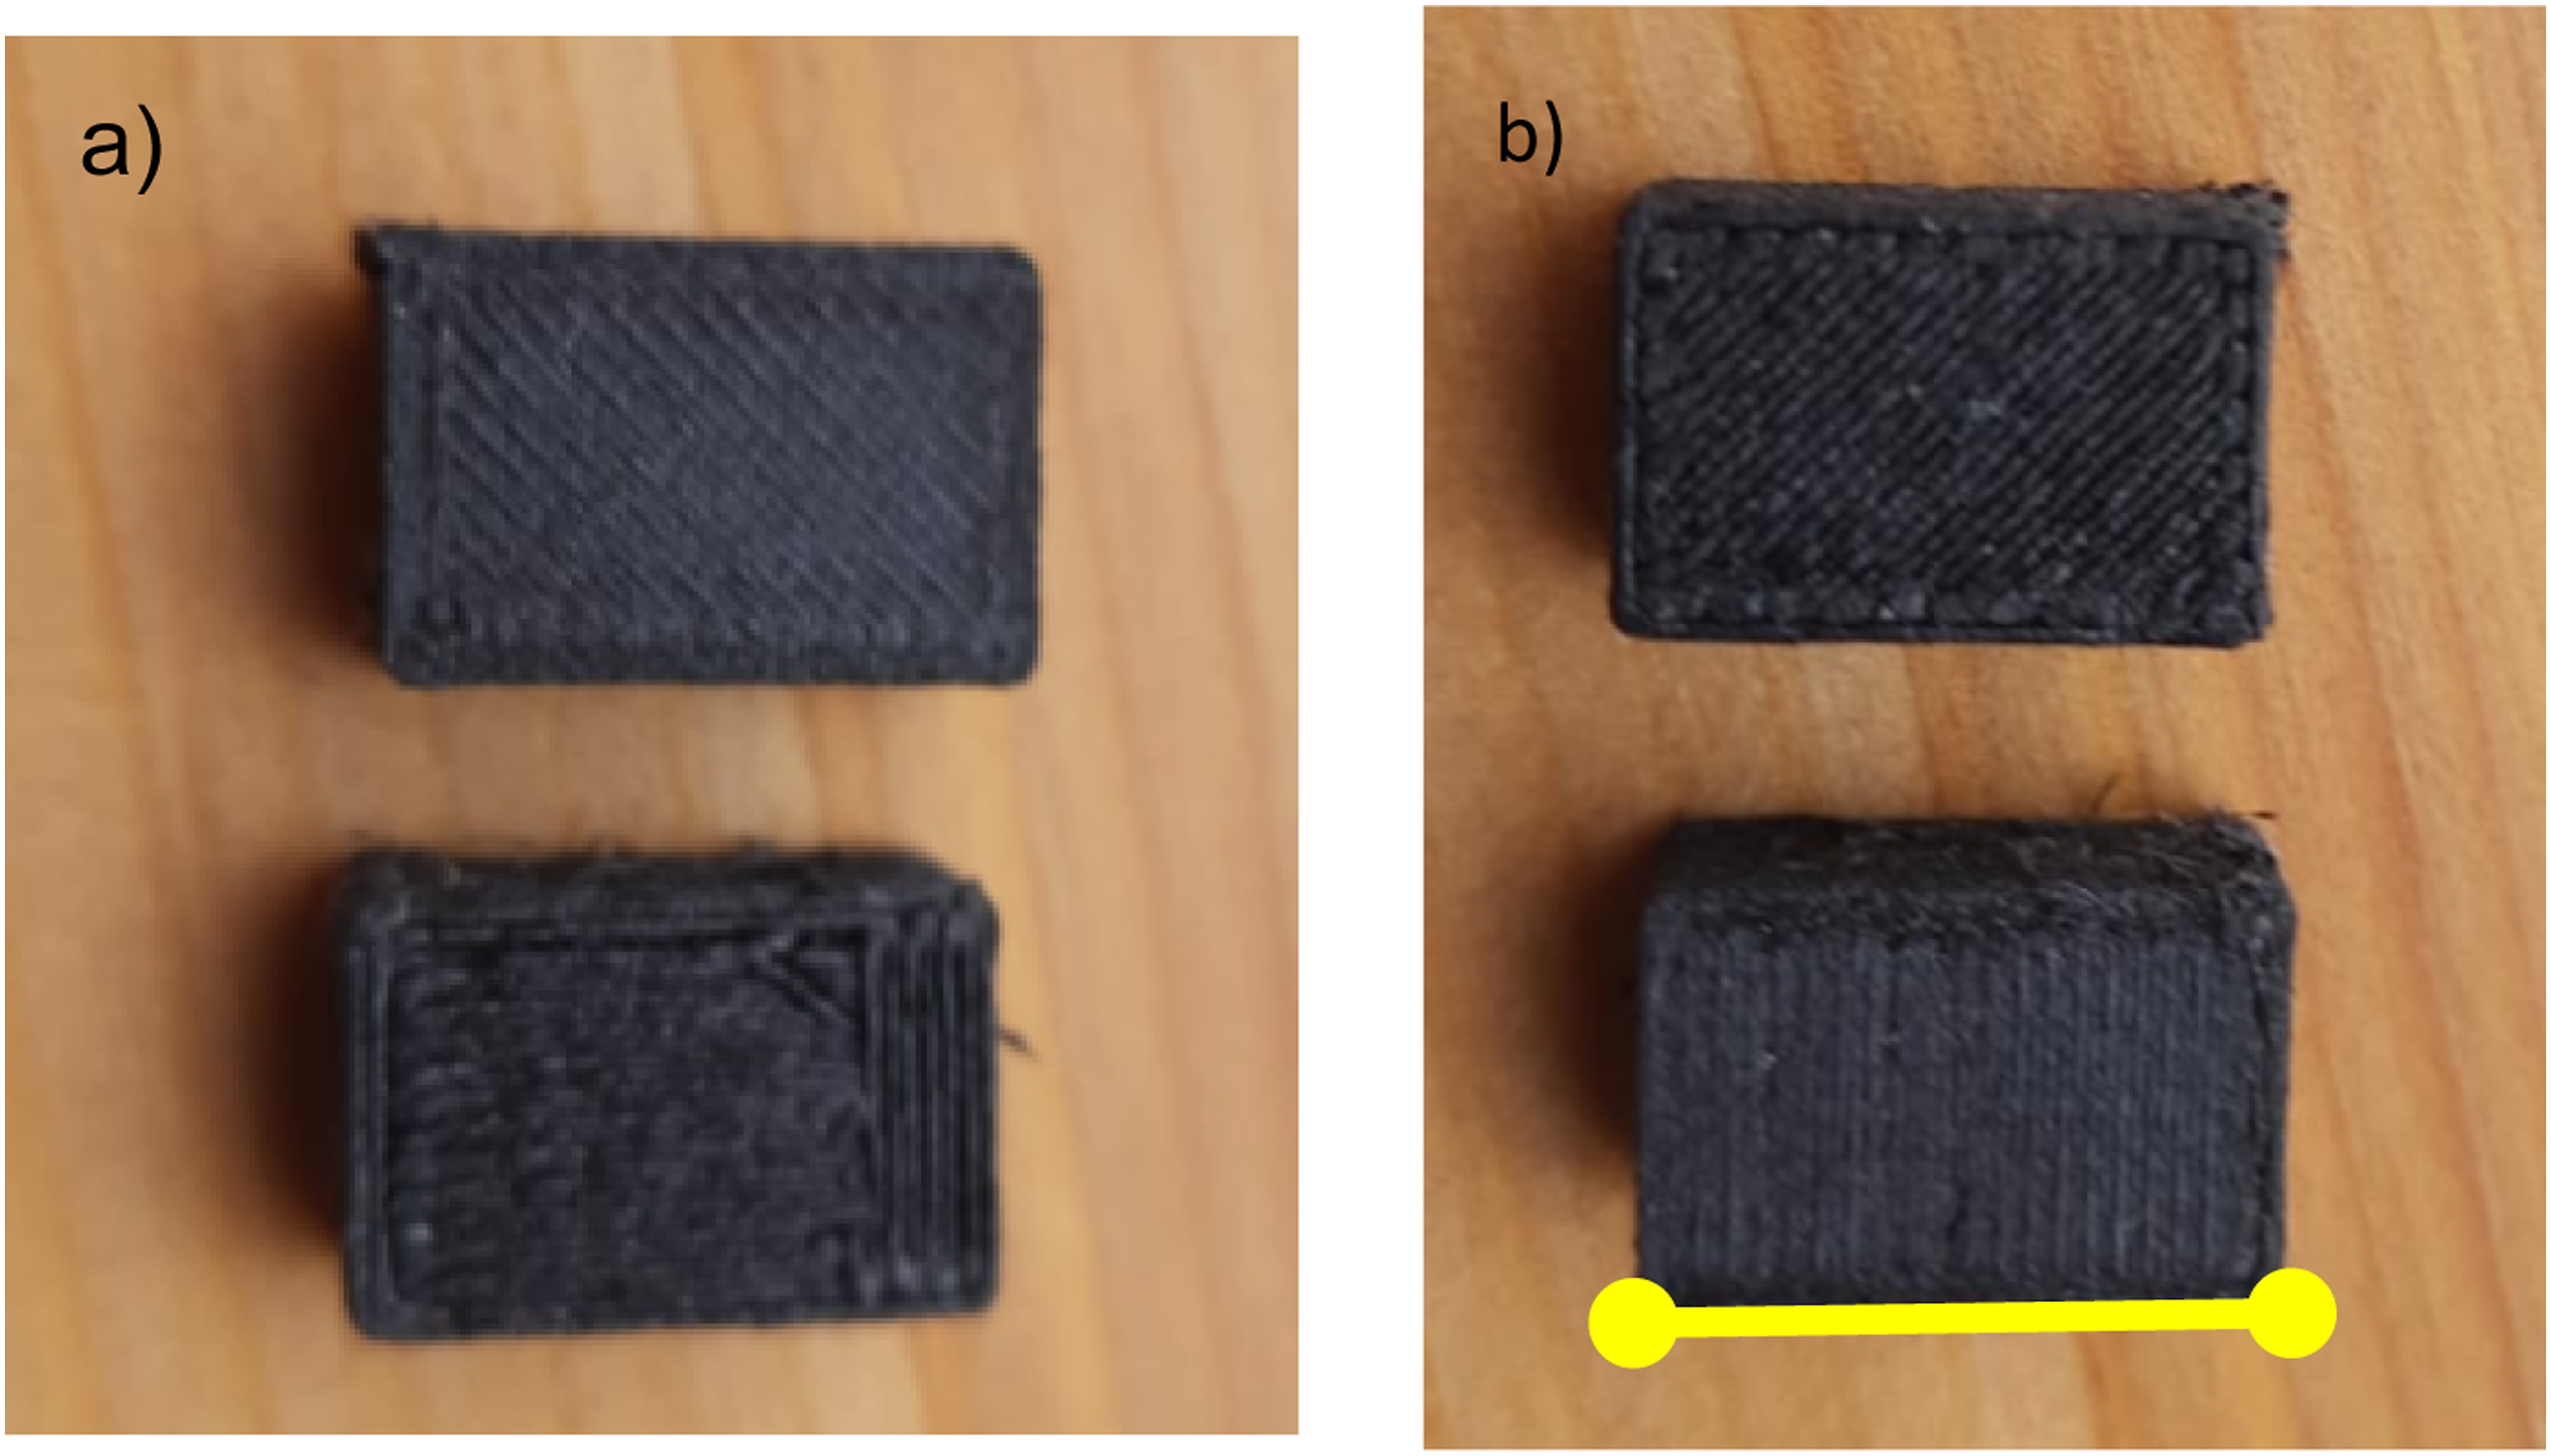
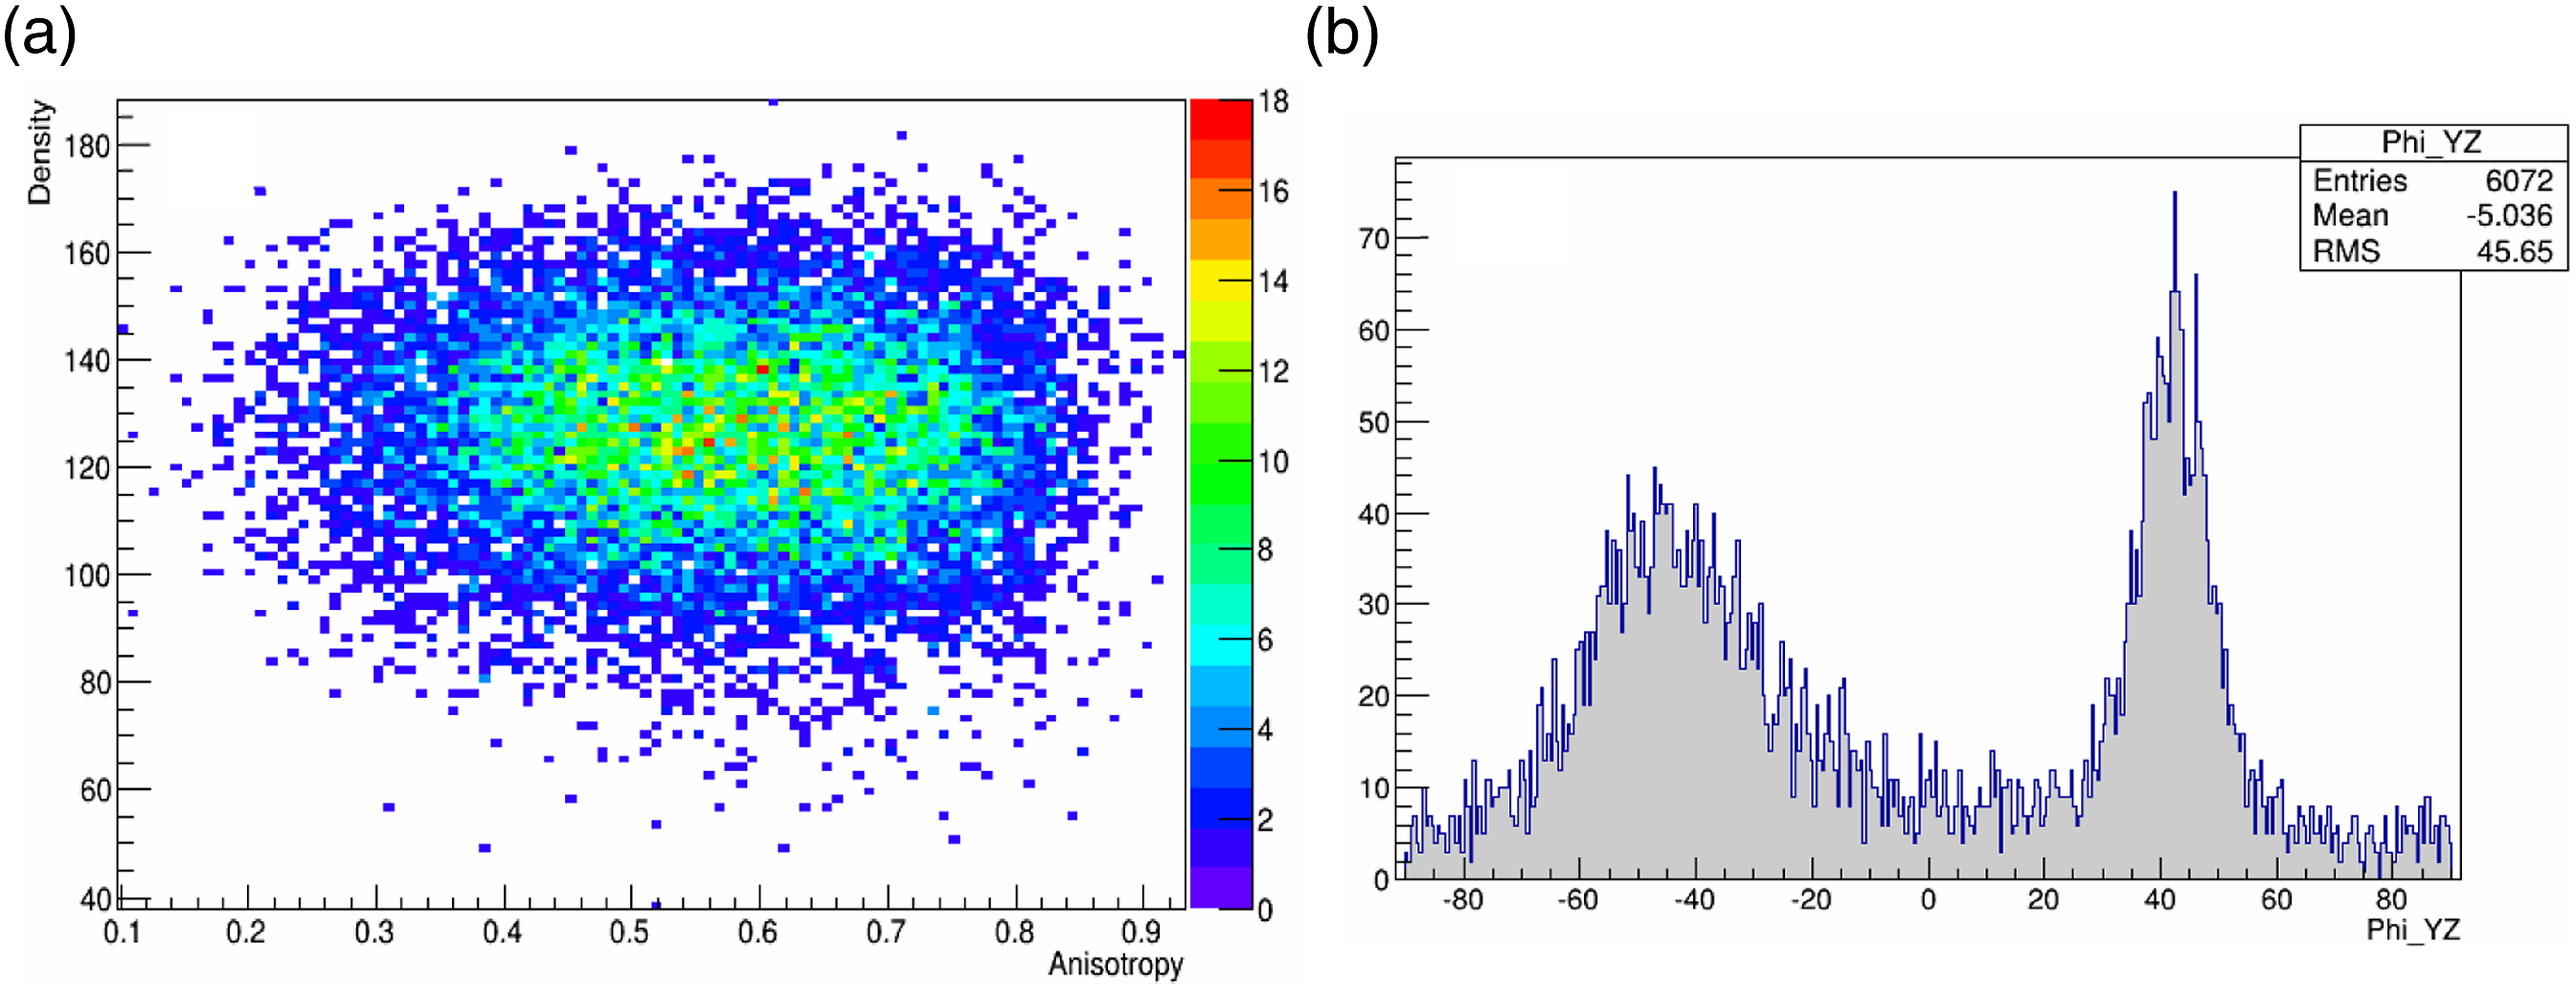
Scanned images from the high-resolution scan of the samples are imported to the VoxTEX software and processed to get anisotropy and orientation distribution data. The anisotropy and density values are used to determine the fibers, where high anisotropy and high-density values indicate the presence of fibers in the scanned region. The orientation of the fibers is defined in the spherical coordinate system, where the phi angle defines the in-plane angle, which is also the angle in the plane of stacks. Obtained anisotropy–density histogram, in-plane ( (a) Anisotropy - density; (b) in-plane orientation distribution; (c) out-of-plane orientation distribution of the [0°/90°] sample. (a) Anisotropy - density; (b) in-plane orientation distribution of the [±45°] sample.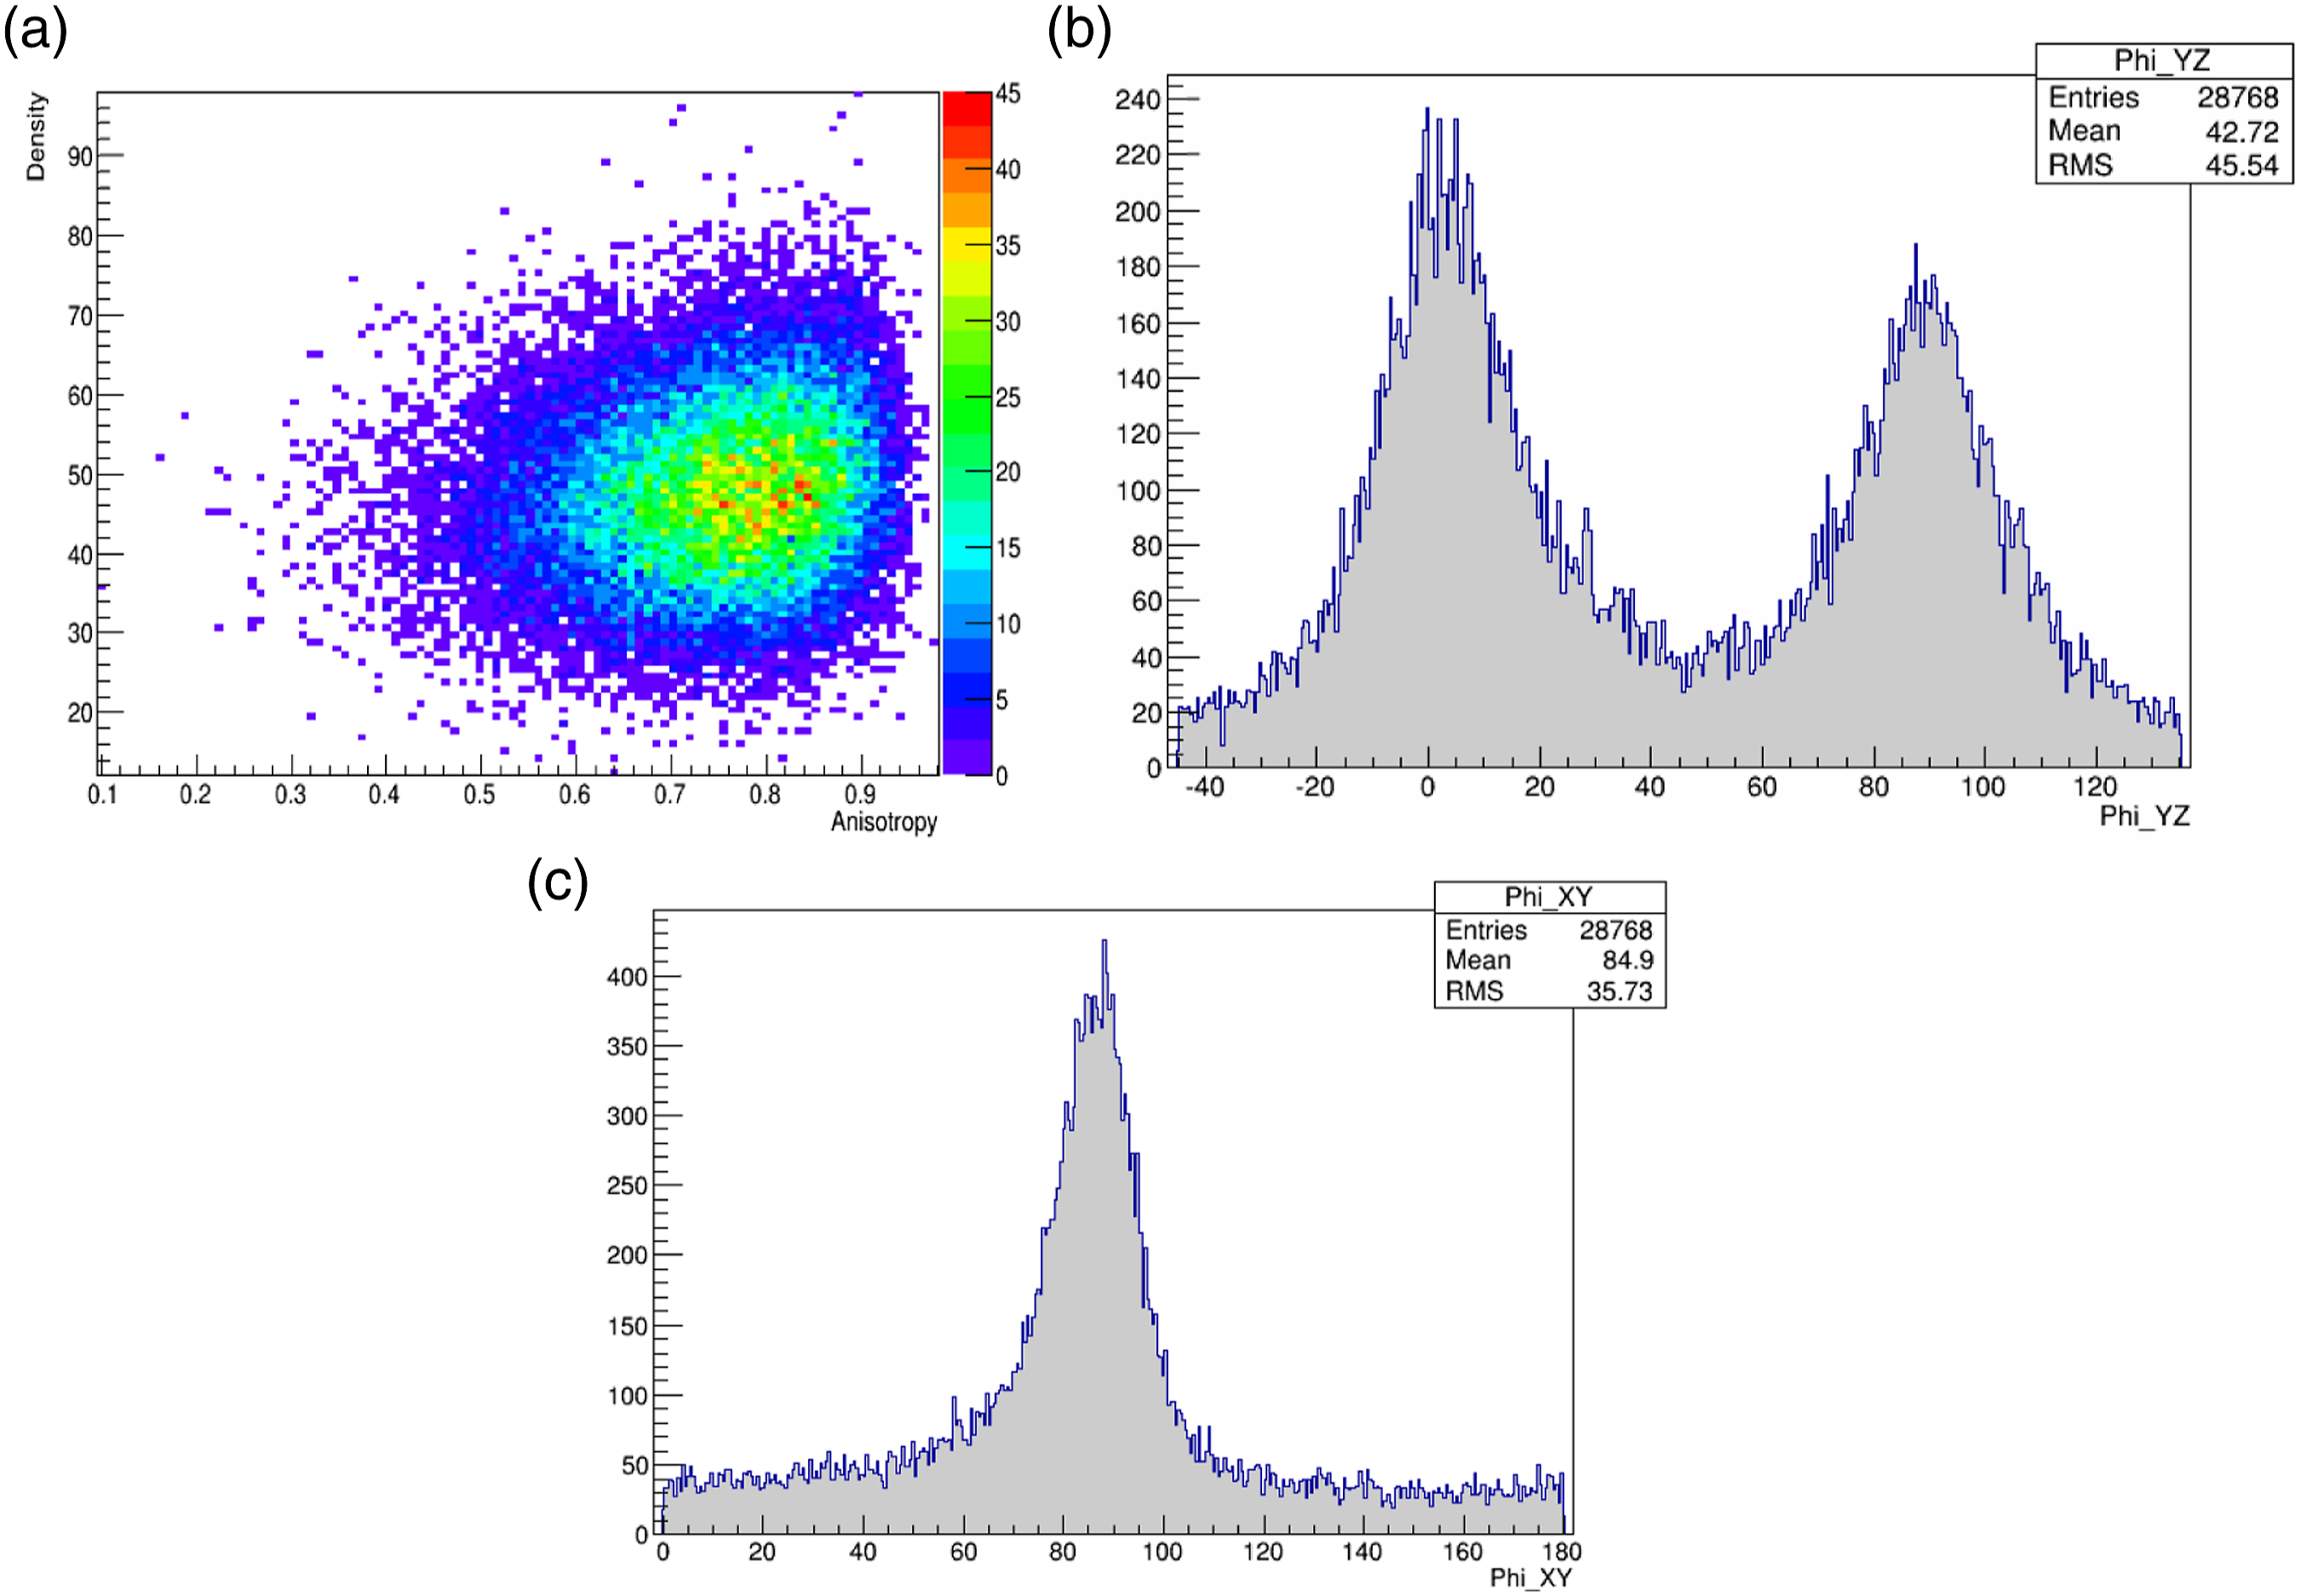
Estimation of tensile behavior
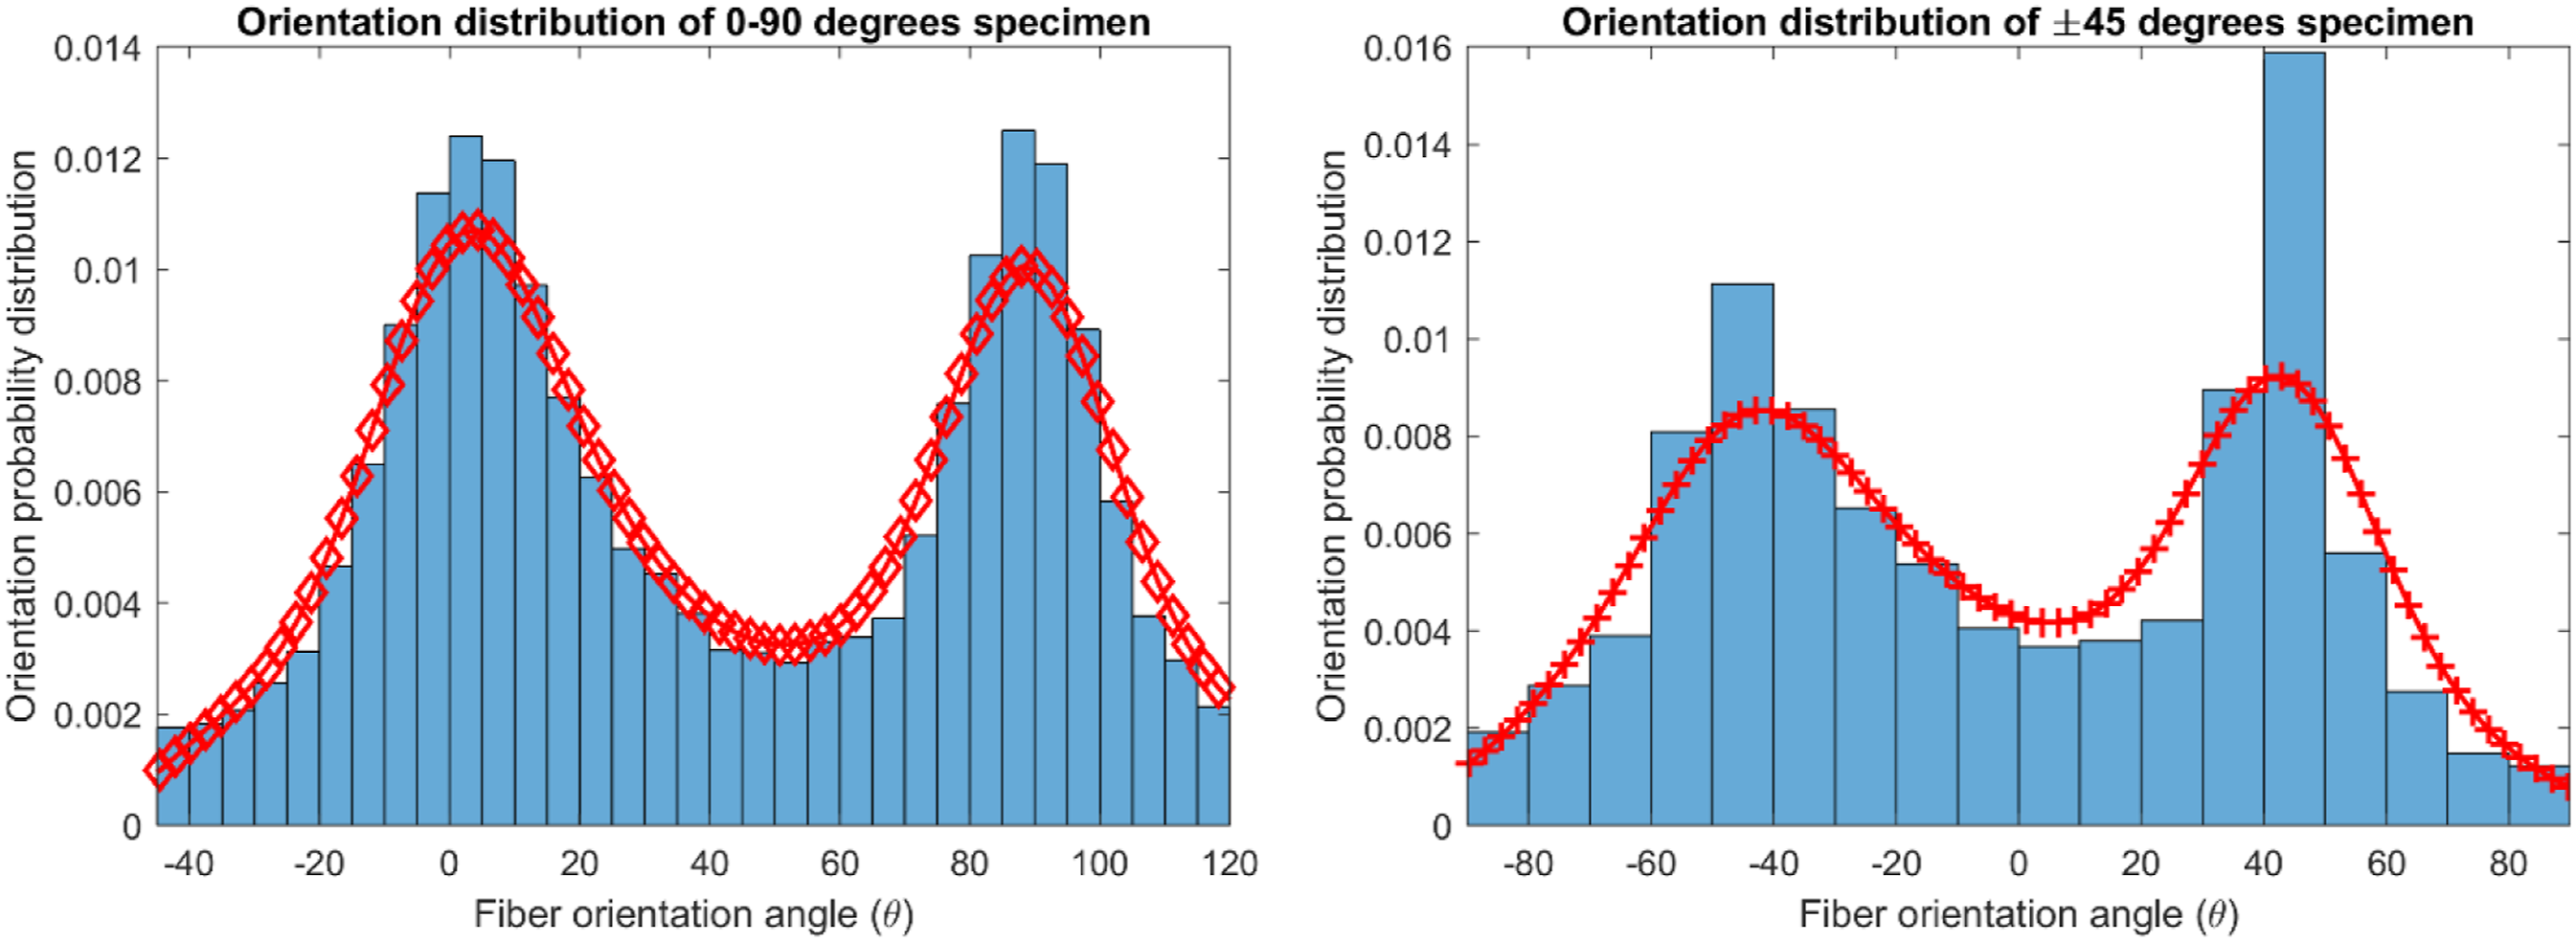
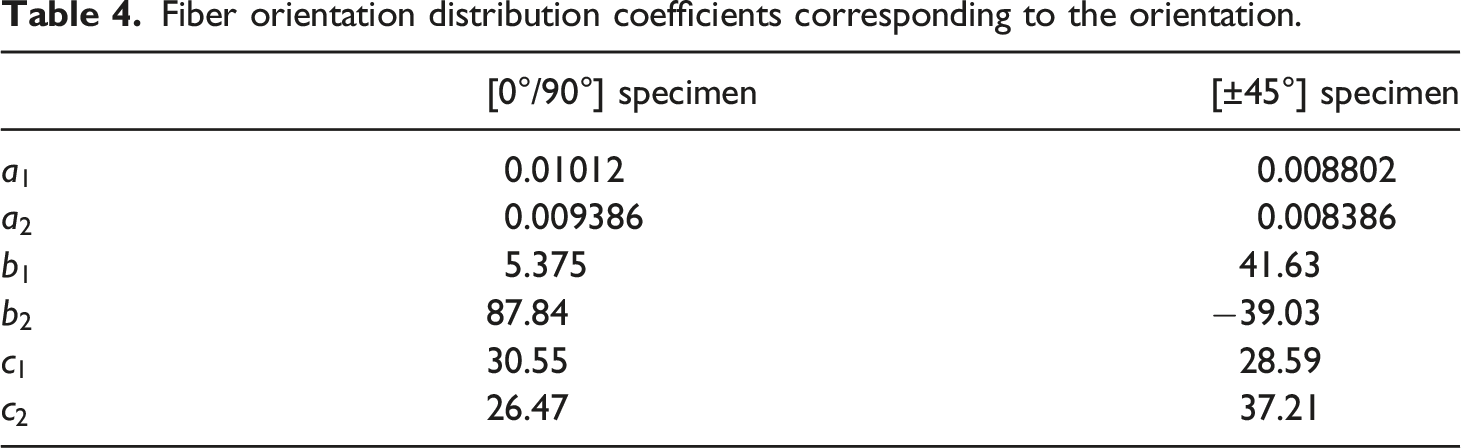
Once the micro-CT imaging and the orientation analysis are done, the data obtained from these processes are used with analytical models to estimate the tensile behavior of the specimens. The fiber orientation distributions obtained through micro-CT imaging analysis in VoxTex, are extracted into MATLAB for a further process. They are determined for [0°/90°] and [±45°] oriented flat specimens and given in Figure 12, which are represented in gauss distribution functions (equation (3)). Their corresponding coefficients are shown in Table 4. In addition to the obtained data, fiber length distribution data is needed to employ the analytical models correctly. As these data were unavailable, the fiber length distribution present in a previous study
32
was assumed to be similar to the one in the current study. Fiber orientation probability distributions. Fiber orientation distribution coefficients corresponding to the orientation.
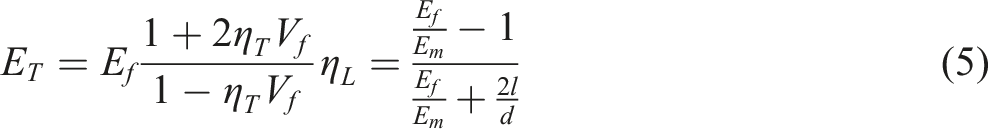
In this study, various analytical models for elastic modulus and tensile strength estimation are employed. Halpin-Tsai, laminate analogy and modified linear rule of mixtures are used to estimate the elastic modulus of the FDM printed composites. Halpin – Tsai model
33
estimates longitudinal and transverse stiffnesses by only using the properties of the constituent materials (equations (4) and (5)). This model does not take fiber orientation or fiber length distributions. However, average fiber length and diameter are used as variables obtained through the SEM imaging process.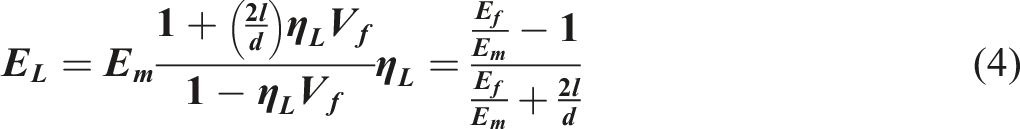
The second model is the laminate analogy model, which models a composite with a random fiber distribution as a laminate composite such that each lamina has different orientations.
34
The equation of this model is given in equation (6):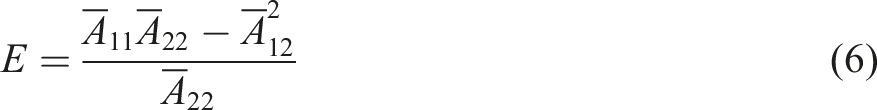
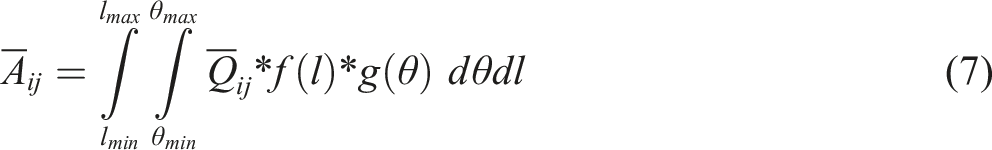
The third model is called the modified linear rule of mixtures, a modified version of the classical rule of mixtures.
35
The model includes the effects of the fiber orientation and the fiber length distributions (equation (8)).

For estimating the tensile strength, the aforementioned rule of mixtures and Tsai-Hill models have been modified differently to be used in tensile strength estimations. The first model for this case, the modified rule of mixtures model, includes the effects of fiber orientation and length distributions to achieve a more accurate representation of the mechanical behavior (equation (11)).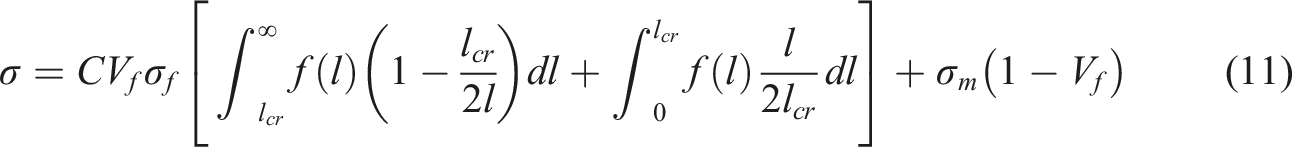
The second model used for the estimation of the tensile strength is the modified Tsai–Hill model.
37
This model is a modified version of the Tsai-Hill model to account for the fiber orientation distribution. The equation used in this model is given in equation (13).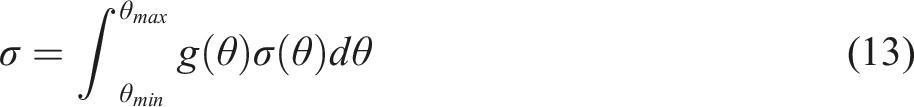

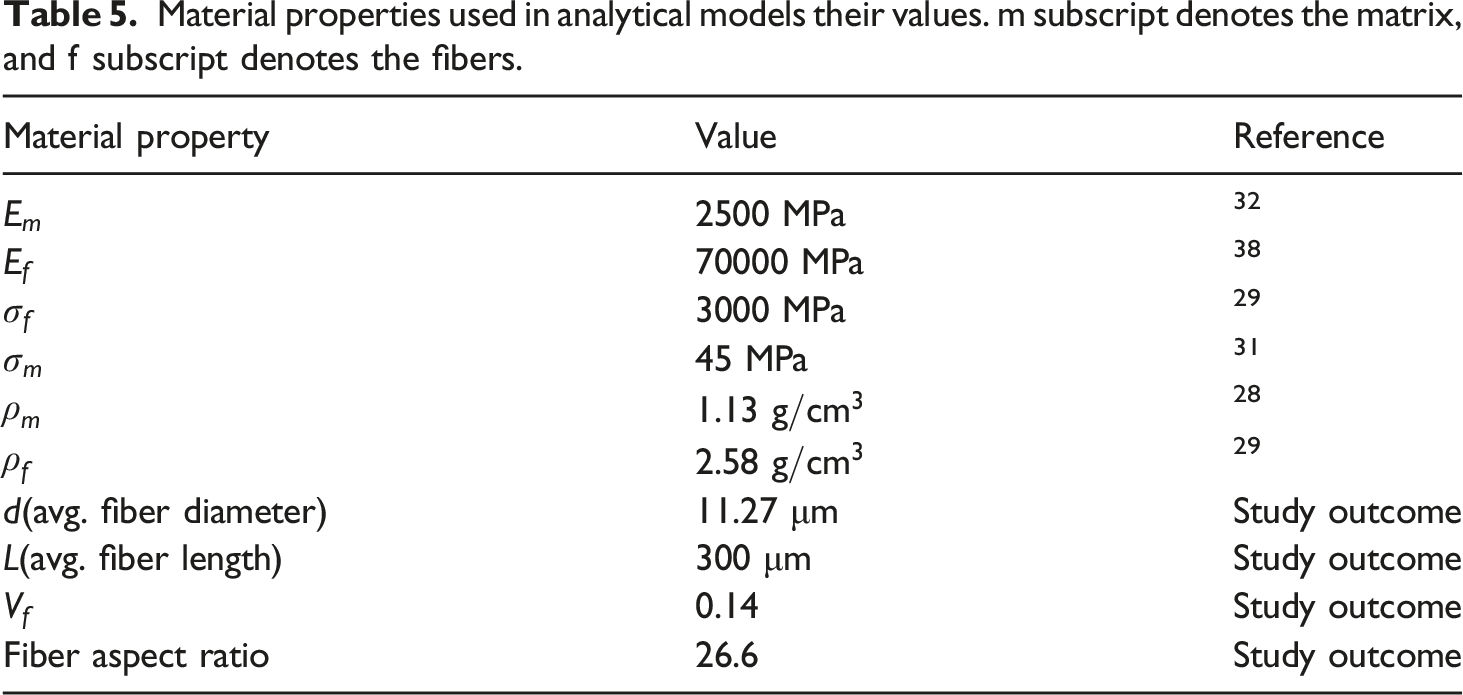
Material properties used in analytical models their values.
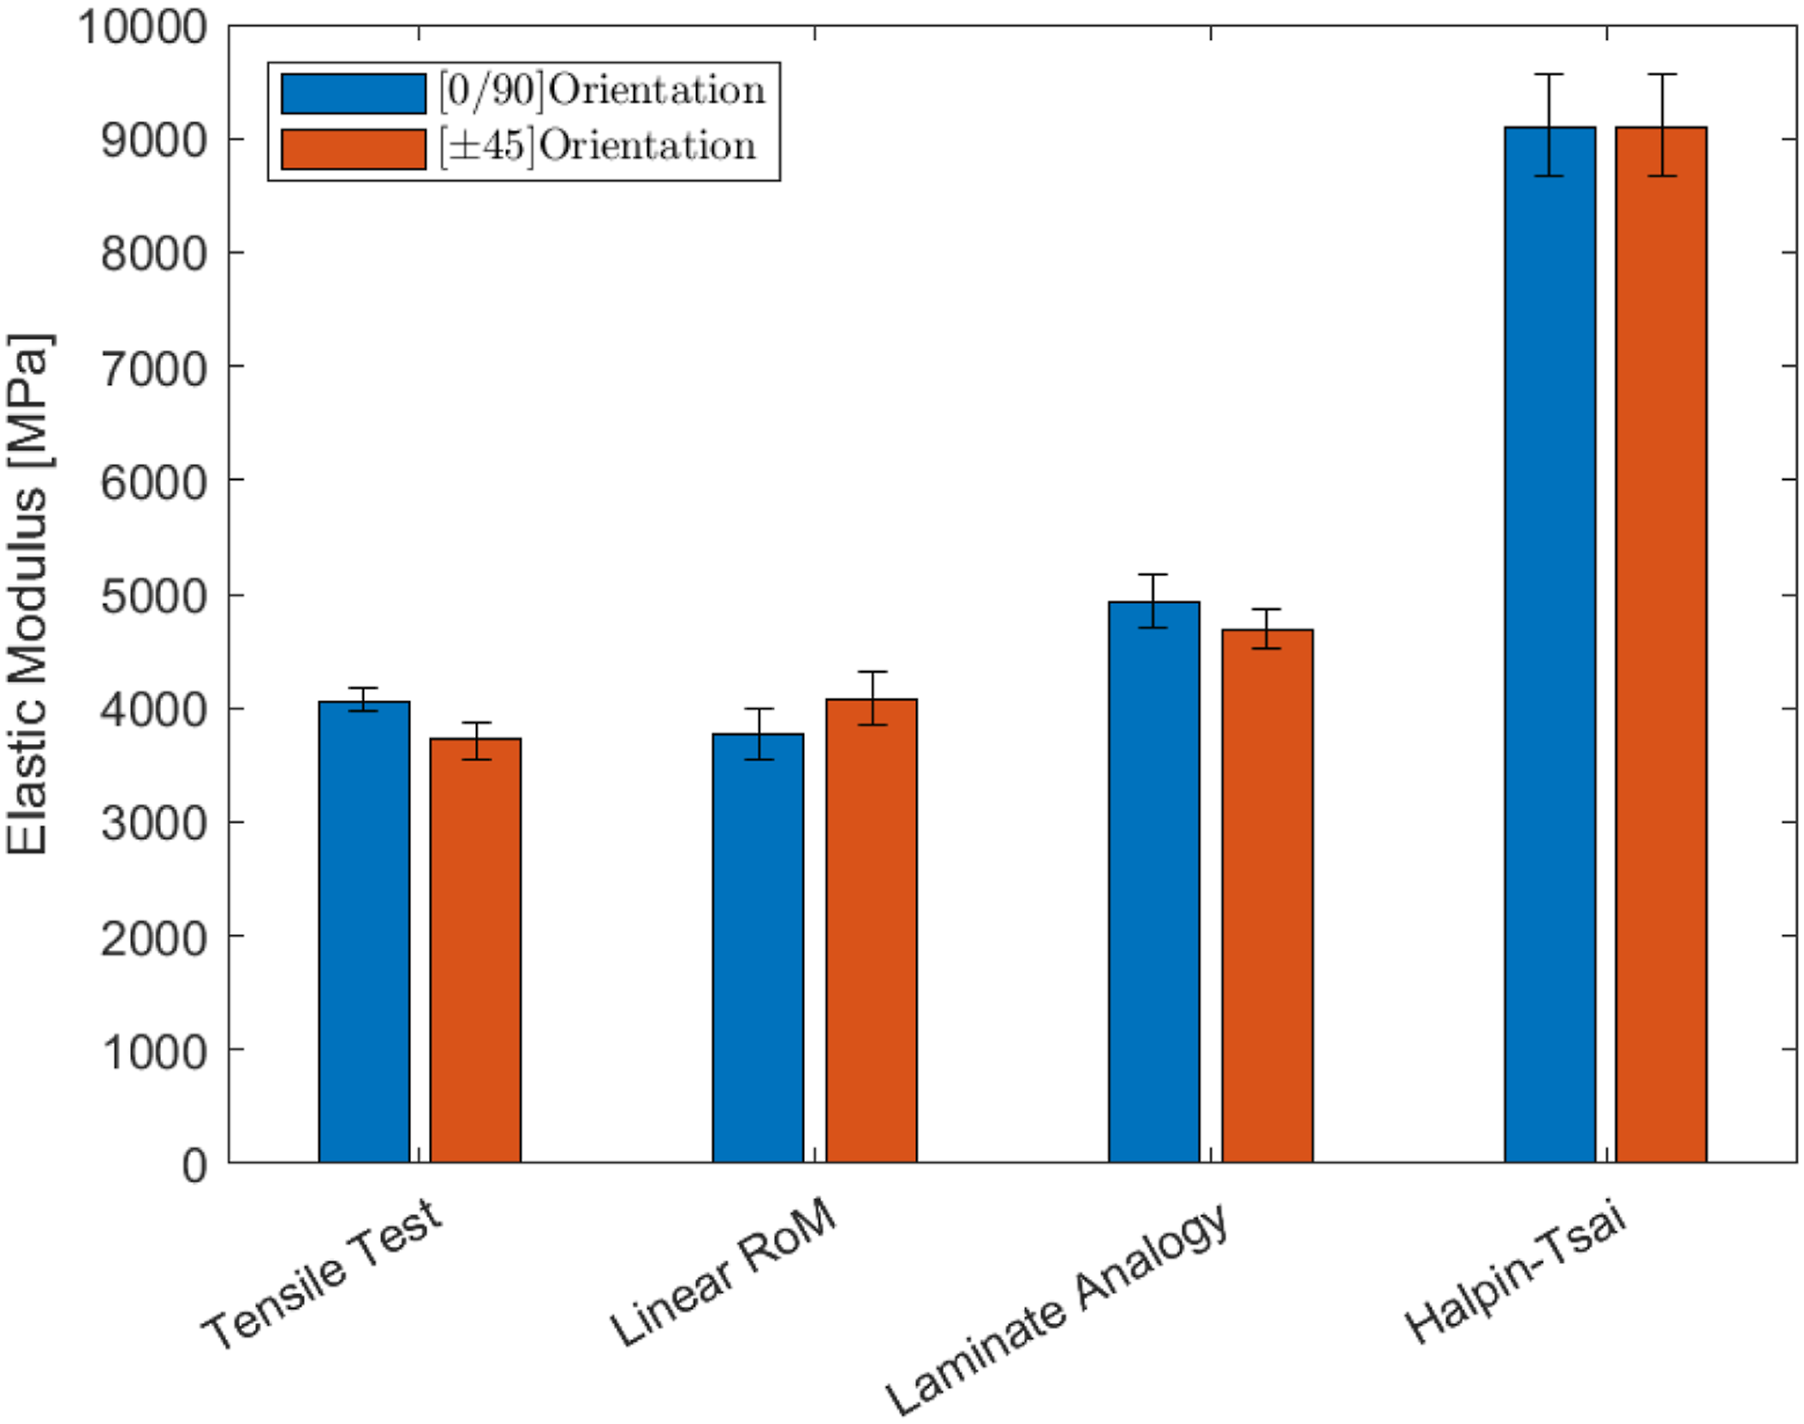
Comparison of elastic modulus between experimental results and analytical estimations.
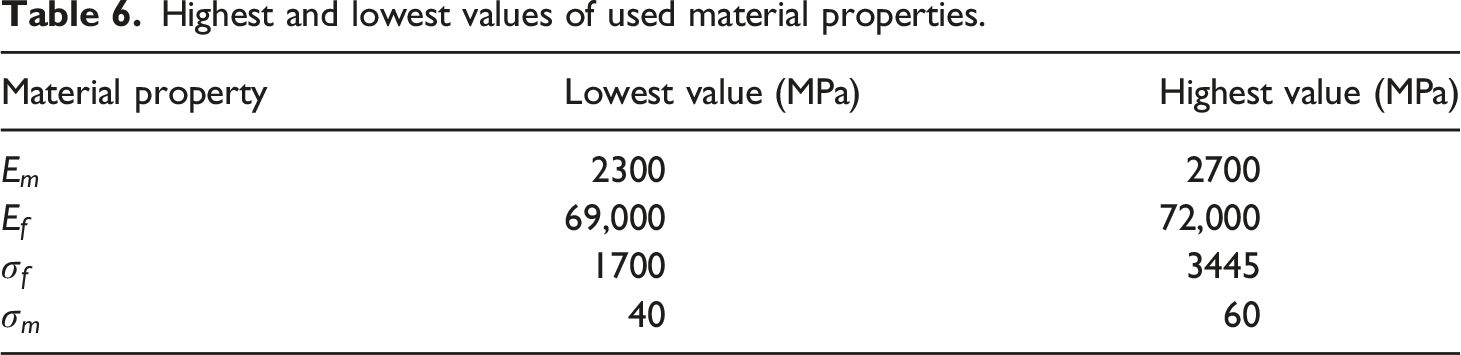
Estimations of the failure behavior produced with analytical models are compared in Figure 14. It can be seen that both analytical models provide close results when compared to the experimental results. The modified rule of mixtures model estimates the tensile strength almost the same as experimental results. The success of these models is related to the inclusion of the effects of the fiber orientations and fiber lengths inside the composite. In order to investigate the impact of material properties on the outcomes shown in Figures 13 and 14, specific material properties are applied in different values on a range (Table 6). The range of results is indicated with the black bars on the figures. It turned out that matrix elastic modulus and tensile strength significantly affect the obtained results. In contrast, the change in fiber elastic modulus affected the elastic modulus estimations just a little, and the change in fiber tensile strength did not affect the tensile strength estimations. Comparison of tensile strength between experimental results and analytical estimations. Highest and lowest values of used material properties.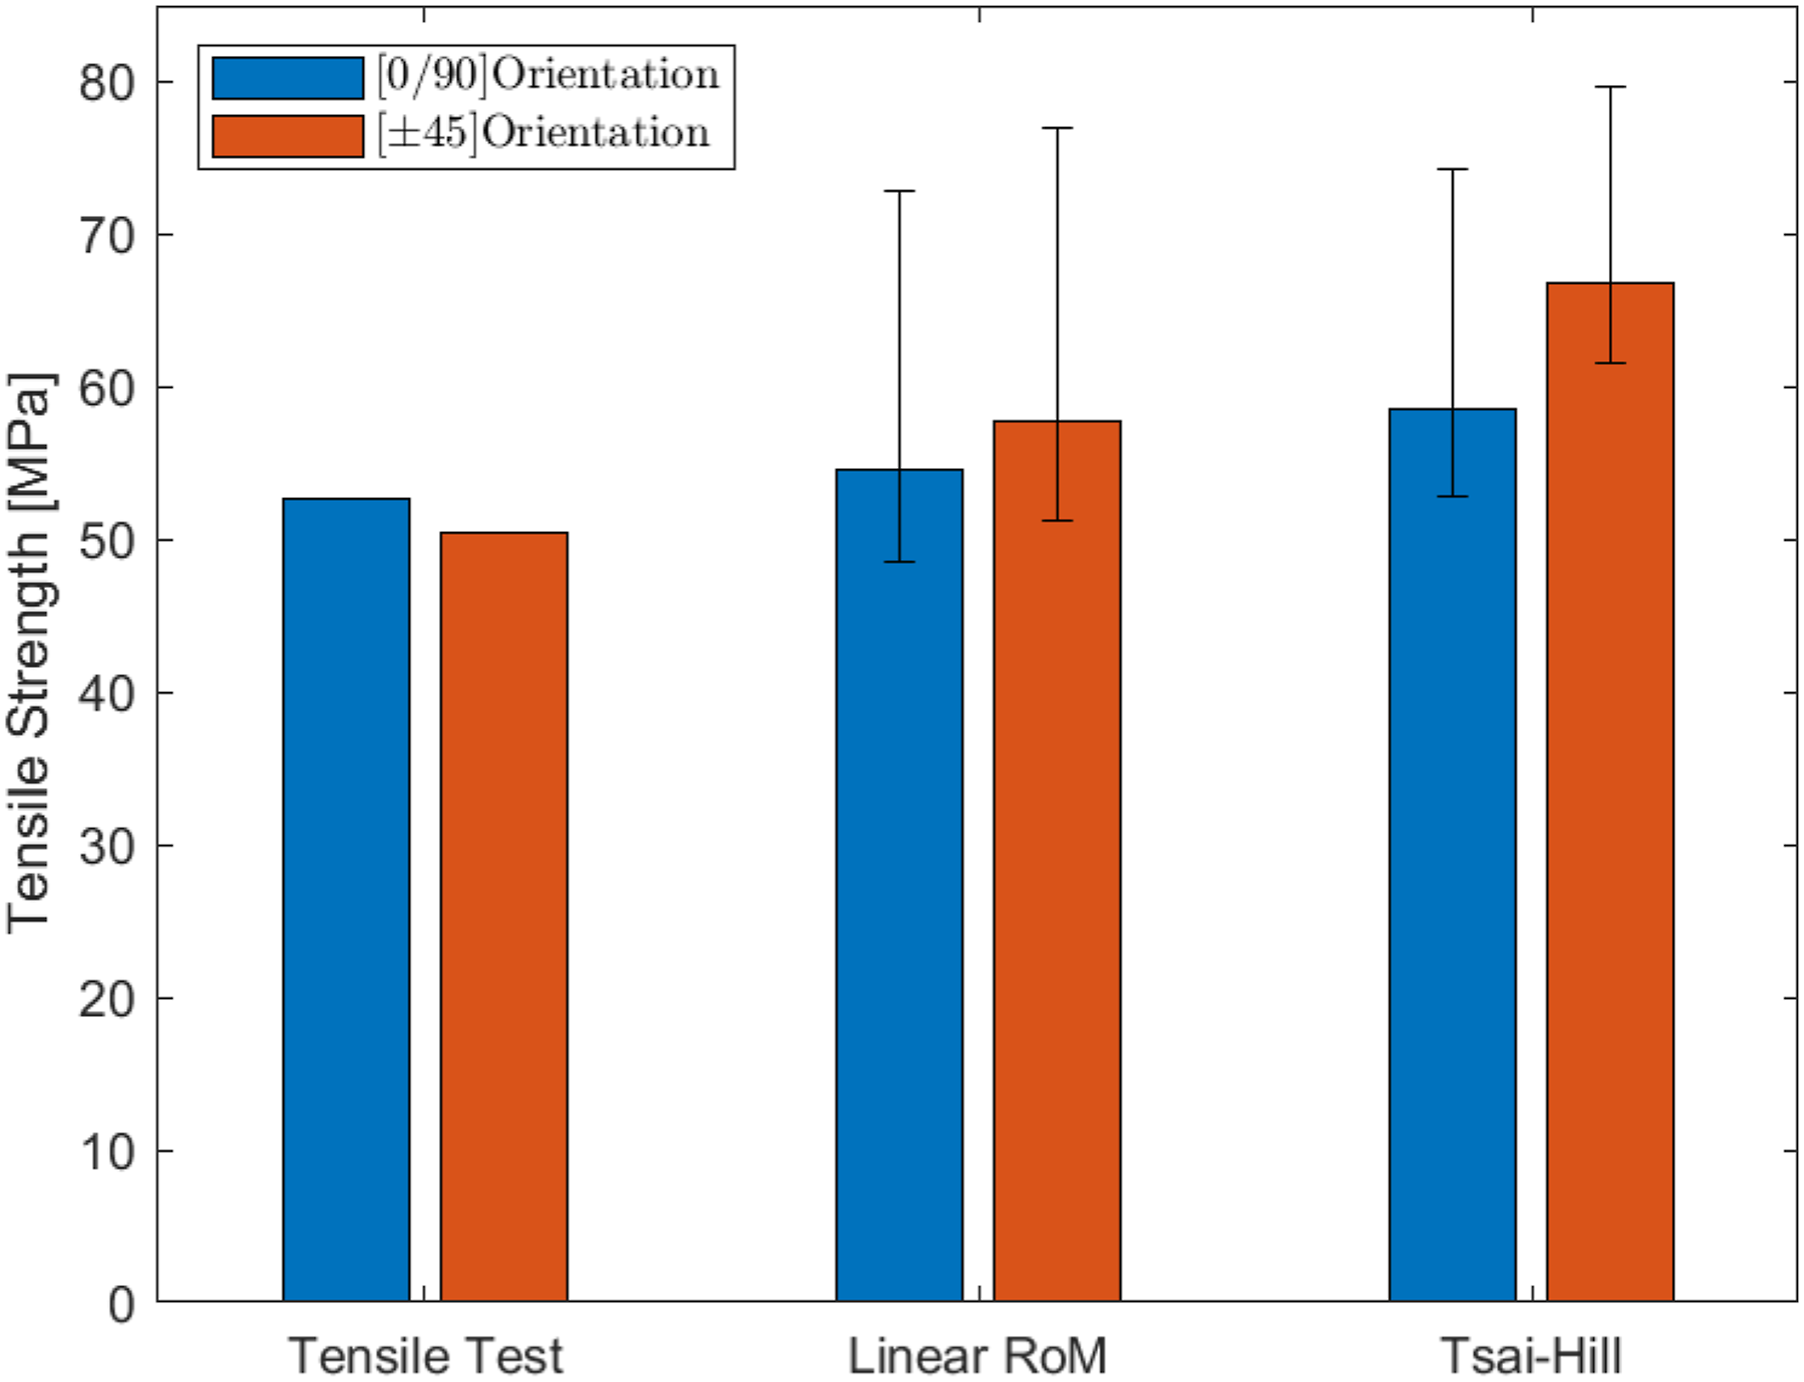
Conclusion
In this study, the internal structure of 3D-printed composite materials is inspected through micro-CT scanning to determine the effect of fiber orientation on tensile behavior. In addition to that, the impact of printing properties on tensile behavior is also examined. After characterizing the materials through experimental methods, analytical models are employed to estimate these tensile properties, and their results are compared with the experimental results. The results indicate that the effect of the fiber orientation should be considered while using these models since the fiber orientation significantly affects the mechanical behavior of 3D-printed composites. The outputs of this study can be summarized as follows: • Regardless of the material type, parts printed with flat and on-edge orientations have much more strength than the upright-oriented ones. Its main reason is that the layer adhesion in 3D-printed parts is weak, and layer separation occurs much earlier than other failure modes in upright-oriented samples. • There is no significant difference in mechanical performance between flat and on-edge-oriented parts. Both printing orientations are suitable for the best mechanical performance. • Regardless of printing direction and fiber orientation, the dominant failure mode of 3D-printed parts occurred as fiber pull-out. • Further microstructural defects, such as voids, caused by 3D-printing process could not be evaluated under imaging procedures due to the low contrast of the material. Hence, their possible effects on failure are neglected for the scope of this study. • Analytical models, such as Halpin-Tsai, which do not consider the fiber orientation and length distributions, may not reflect the correct mechanical performance for the 3D-printed composites. A more accurate prediction of the tensile properties of a 3D-printed composite is possible when fiber orientation and length distributions are considered. • Used analytical models do not consider non-linear material behavior of materials, thus only linear elastic properties are considered in the scope of this study. Future studies may include different analytical models for this case. • Among the analytical models used in this study, the modified linear rule of mixtures turned out to be the most successful one in terms of elastic modulus and tensile strength estimations.
Footnotes
Acknowledgements
The authors would like to thank the Research Fund of Hacettepe University for supporting this study. This study is a part of first author’s Ph.D. Thesis.
Declaration of conflicting interests
The author(s) declared no potential conflicts of interest with respect to the research, authorship, and/or publication of this article.
Funding
The author(s) disclosed receipt of the following financial support for the research, authorship, and/or publication of this article: This work was supported by Hacettepe University Coordination Unit of Scientific Research Projects [grant number FHD-2020-18699].