
Abstract
To explore the potential wear performance of commonly utilized hydraulic system polymer components, we investigated the effects of different working conditions on the frictional and wear behaviors of three polymer sealing materials in this study. Polytetrafluoroethylene (PTFE), nylon (PA), and polypropylene (PP) composites were prepared using copper (Cu) and glass fiber (GF) as fillers. The tribological and wear properties (wear rate, surface appearance, wear patterns) of the sealing composites were evaluated. The results showed consistent trends toward increasing average coefficient of friction as load and speed increased for PTFE. The incorporation of filler improved the wear resistance of the composites. The addition of Cu particles showed lower coefficient under higher load and sliding speed. PA with continuous glass fiber (CGF) sealing composites showed lower coefficient, less wear volume, and relatively smoother wear zone surfaces than PTFE-based composites or PP with short glass fiber (SGF). We propose that PA-CGF outperforms other materials in regards to fatigue and friction and wear even under extremely high silding speed,as well as sealing properties.
Keywords
Introduction
Advancements in machinery manufacturing have created strict requirements for sealing rings, which are used in hydraulic actuators, vehicle transmission, and hydrogen gas compressors, among other applications.1–3 Sealing rings play a vital role in the reliability, durability, and efficiency of devices. When designed effectively, they mitigate friction and prevent leakage. 3 The friction and wear properties are important indicators of their working performance and service life. 4 If the rings exhibit excessive wear or unexpected friction, they will contribute to excess energy expenditure, increase the likelihood of failure, truncate the lifetime of the sealing system, and drive up the costs of maintaining hydraulic devices. 5
The effective design and optimization of sealing rings depends on accurate evaluations of tribological processes and wear performance of sealing materials. Researchers have proposed analytical and numerical simulation methods to assess and evaluate the tribological characteristics of sealing materials, 6 but experimental investigations may better explain the frictional and wear behavior of sealing rings, especially in terms of the underlying frictional phenomena of novel sealing composites.
Polymers are increasingly used as seal materials in hydraulic devices because of their high performance. 7 Polytetrafluoroethylene (PTFE) is a widely used material in various machine systems owing to its remarkable high-temperature resistance, unique chemical properties, and excellent frictional characteristics. However, it has poor wear resistance.8,9 Various fillers have been added to PTFE in efforts to improve its frictional and wear behavior. Commonly used fillers include carbon fiber (CF), glass fiber (GF), and copper (Cu).
Previous researchers have estimated the friction and wear of PTFE composites with various filler materials.4,5,9–11 Riddar et al., 3 for example, built a special test setup and added 25% graphite to a guiding ring of PTFE to observe material transfer from the guiding ring to an aluminum surface. Liang et al. 10 explored the tribological properties of a PTFE matrix with the addition of fluorinated graphene (FG) with various fluorine/carbon (F/C) ratios and graphene (G); the wear resistance for four fabricated FG/PTFE composites was superior to that of the G/PTFE composite. Ghosh et al. 11 investigated the effect of Cu nanoparticles (NPs) on the wear performance of thick polydopamine (PDA)+PTFE coatings. Cu NPs were found to improve the mechanical properties, tribological performance, adherence, and cross-linking between constituents of the nanocomposite coatings of the composite.
Wear can also be reduced by coating the surface with a hard film,the coating surface is deposited onto the polymer component 12 or its counterface.13,14 Moreover, Choudhury et al. 14 illustrated that coating thickness is related to film transfer and contact pressure, then developed suggestions for prolonging wear life accordingly.
Pure PTFE, without other reinforced material, is so soft that it very readily changes shape and does not easily resist wear. 15 However, most PTFE composites serve to reduce wear while increasing friction. The complex geometries of PTFE products cannot be manufactured until the part has been sintered properly, which creates difficulties in forming and secondary processing when adding fillers thus adding costs to the manufacturing process.
Many researchers have tested other polymers as potential replacements. Yu et al. 16 found that PFA/CF composites have optimal wear resistance and sealing properties. Mazza et al. 17 investigated the tribological behavior of epolytetrafluoroethylene-based composite material filled with Valflon F115, which showed lower coefficient of friction than unfilled PTFE. Ran et al. 2 compared the wear behavior and sealing performance PI, PEEK, and PTFE polymer materials to find that PEEK is best suited for sealing rings.
Nylon (PA) and polypropylene (PP) have good mechanical performance and wear resistance, and are easily formed by injection molding. Stadlmann et al. 18 prepared wood-polymers (PA, PP) by overmolding and concluded that PA6 has optimal tensile shear strength.
Short glass fiber (SGF) and continuous GF (CGF) are also commonly used as additives to enhance stiffness and hardness.19–25 Giarmas et al. 19 investigated the mechanical behavior of three-dimensional (3D) printed PA honeycomb structures to find that fiber-reinforced PA exhibited the highest flexural strength, modulus and stiffness. Divya et al. 20 found that adding short glass and carbon fiber fillers to PP by injection molding enhances hardness and abrasion resistance. Autay et al.21,22 found that increasing the GF weight fraction increases the elastic modulus, flexural modulus, ultimate strength, and flexural strength of PA66 composites but decreases their ductility and focus the effects of hygrothermal aging on their flexural, friction, and wear behaviors.
Dong et al. 23 optimized the process parameters for CGF-reinforced PA6 composites to determine the optimal flexural strength and flexural modulus. Luke and Lingesh et al.24,25 studied the effects of fiber content, orientation, and hybridization on the mechanical behavior of CGF-reinforced PA. They found that fiber addition to PA increased tensile strength depending on the fiber orientation between the axis and tensile stress direction. Lingesh et al. 25 observed significant enhancement in the strength of composites due to the effects of hybrid fibers.
PA and PP each have a larger coefficient of friction than PTFE, but it is still lower than that of many bulk polymers. Various reinforced composites have been incorporated into PA and PP matrices to improve wear behavior.26–29 Li et al. 26 employed the carbon fiber as reinforcement, examined the tribological performance of carbon fiber reinforced polyamide 6 (CF/PA6) under dry sliding condition and obtained the optimum wear loss when the content of carbon fiber is 20 vol%. Some polymer were also used as fillers. Adding thermoplastic polyurethane(TPU)to PA6 improved the toughness of PA6 and reduced coefficient of friction,but the PA6-TPU exhibited the worse wear resistance than pure PA6. 27 Wei.et al. 28 investigated the tribological properties of short carbon fiber/PA-6/PTFE hybrid composites. The hybrid effects on the coefficient of friction and wear rate were identified and the PA/PTFE with a carbon fiber content of 30% showed best wear resistance and friction behavior among all hybrid composites investigated. Keresztes et al. 29 addressed the tribological behaviors of the cast polyamide 6 (PA6G) matrix and its composite with added polyethylene (PE) solid lubricant (PA6GSL). Increased wear resistance and reduction in heat generation was found in the PA6GSL composite.
Vyas et al. 30 investigated the influence of hexagonal boron nitride (h-BN) microparticles on the mechanical and tribological properties of PP/PA6 to find a small decrease in tensile strength and elongation but improvement in elastic modulus compared to pure PP. The addition of h-BN fillers effectively improved wear resistance and reduced the frictional coefficient by generating a smooth, thin lubricating film over the steel disk. Gebretsadik et al. 31 compared friction and wear behavior of a PA66 composite with 25% glass fiber added in different aqueous solutions under mixed/boundary lubrication. The resultant formation of a lubricating tribo-film reduced friction and wear in seawater solution.
Many previous studies have centered on the mechanical properties of innovative composites, but few have revealed the detailed tribological mechanisms of composites. Surface friction and wear are affected by sealing parameters including interface condition, load, relative velocity, and time-in-contact. 32 Researchers have explored tribological and wear mechanisms using experimental and numerical wear simulation methods.33–38 Johansson et al., 33 for example, divided the sliding process into two stages (running-in and steady-state) and found that a smooth interface allowed for low wear rates in both. Amine et.al 34 examined wear rate and coefficient of friction of PTFE-based composites filled with 30% bronze microparticles as a function of load, sliding speed and lubrication. The result showed the good friction behavior of PTFE-based composites for low values of loads and frequencies. Besides, the wear and friction behavior of the PTFE-based composites are improved under lubricated conditions. Kim.et al. 39 studied the tribological behavior of glass fiber reinforced-PA66 under high contact pressure, sliding and grease lubricated conditions and found that the fiber orientation of the composite,the surface roughness of the counterpart steel and the contact pressure have an effect on the friction and wear properties. However, they did not examine the effects of load or sliding speed on the frictional and wear behaviors of PTFE, PA, or PP composites. Further, the wear mechanisms of these composites are not yet clear and how the various main sealing parameters affect the friction and wear response of these materials are not known.
In this paper, we elucidate the tribological function and wear mechanisms of filler materials used in composites for hydraulic device applications. Special focus is placed on the effects of the working parameters of interface condition, load, relative velocity, and time-in-contact. Three composites were prepared and sliding tests were conducted to evaluate their friction and wear response. We also analyzed the composite surfaces for tribological and wear mechanisms by scanning electron microscopy (SEM) and 3D profile measurement.
Experimental details
Material and specimen preparation
Test materials and specimen.
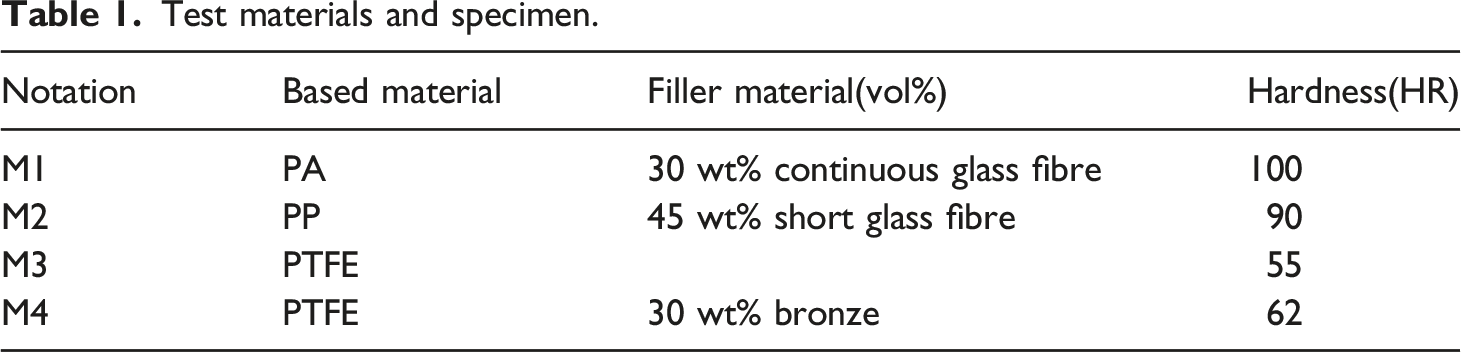
Commercially available, pure PTFE and PTFE-based composites with Cu additives were kindly supplied by Kaicheng Sealing Polymer Materials Co., Ltd, China. PA-CGF composites were prepared via rolling forming process, in which multi-layer glass fiber and PA were pressed and formed with a heated pressure roller as shown in Figure 1. The formed samples were tested with flaw detection equipment to ensure the reliability and performance of the samples. Preparation of PA-CGF material and samples.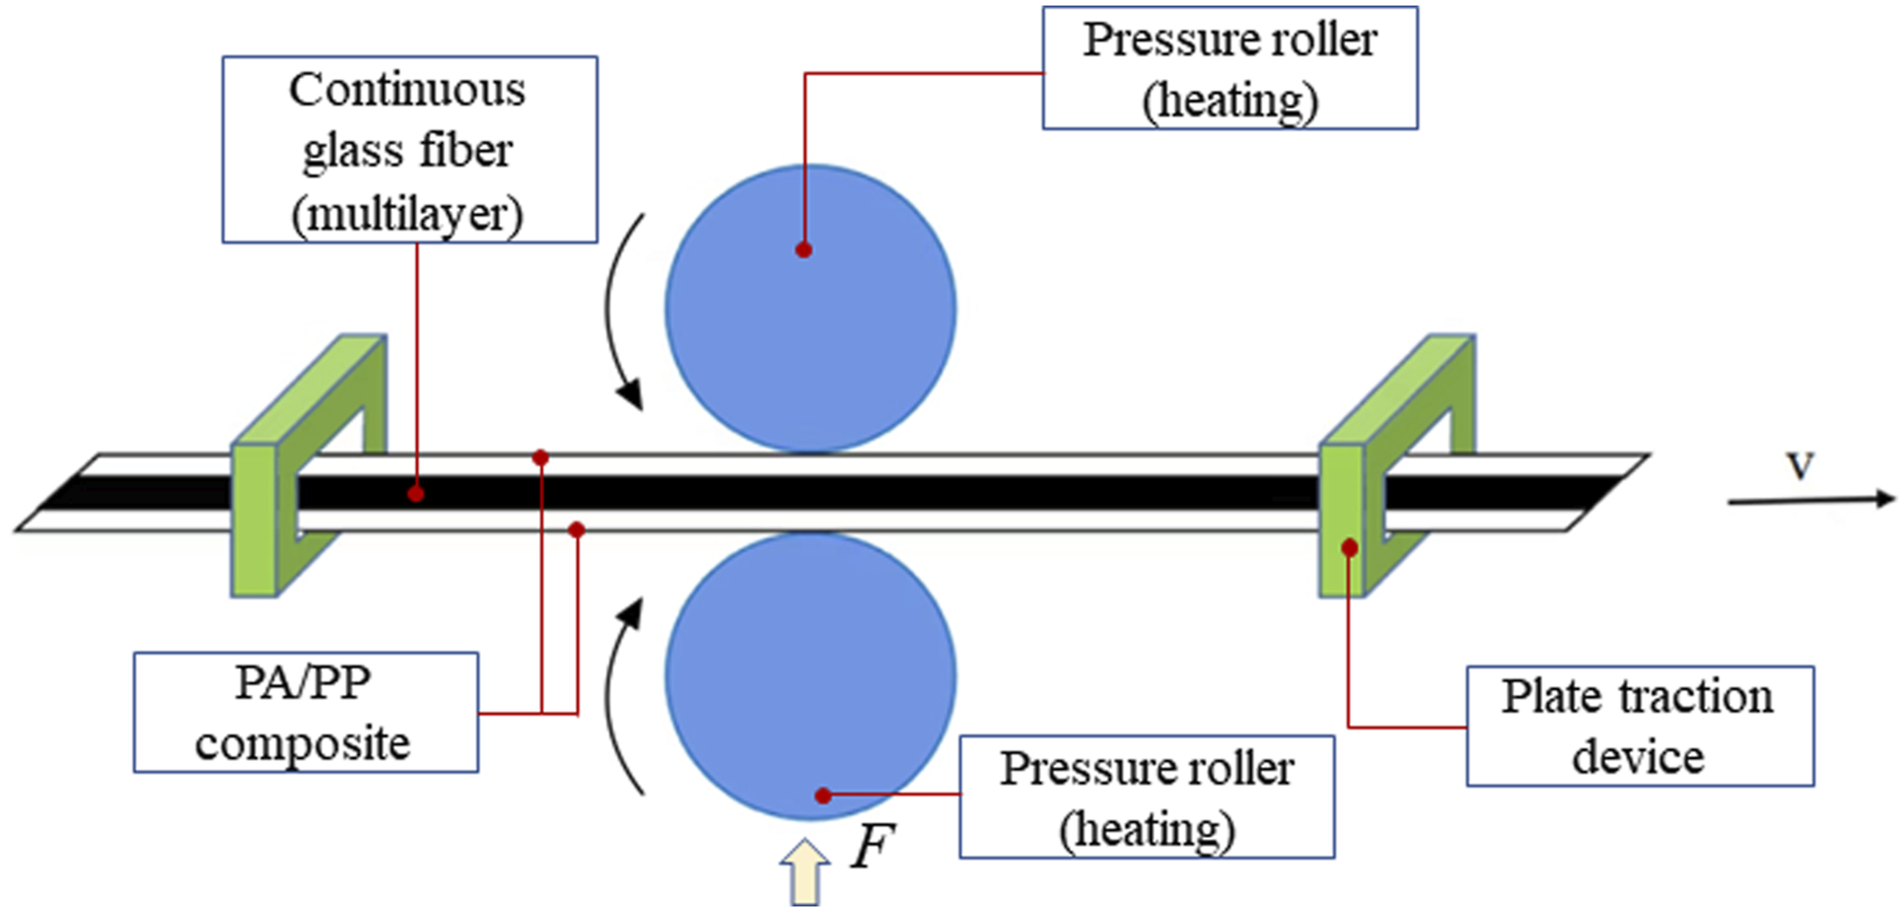
We used an injection molding process to prepare the PP-SGF composites. Short GF and PP particles were mixed thoroughly before injection in the screw cavity. The prepared PP-SGF plates were tested with a flaw detection device to ensure internal material formability of the specimen. The tribological behaviors of PA-CGF and PP-SGF composites were evaluated and compared with those of PTFE and PTFE-Cu counterparts.
Experimental device and methods
The tensile modulus(E) were measured on a universal electronic testing machine(MTS Exceed TM40,China). We used a material surface performance comprehensive tester (pin-on-disc tribometer, CFT-I type) (Figure 2) to evaluate tribological behavior at room temperature. The tester is composed of multiple functional modules that can measure rotation, reciprocation, block-on-ring mode, and other factors. The friction tester integrates force and speed tracking control functions to test the friction performance of materials under different speeds and pressures under normal load. Test rig.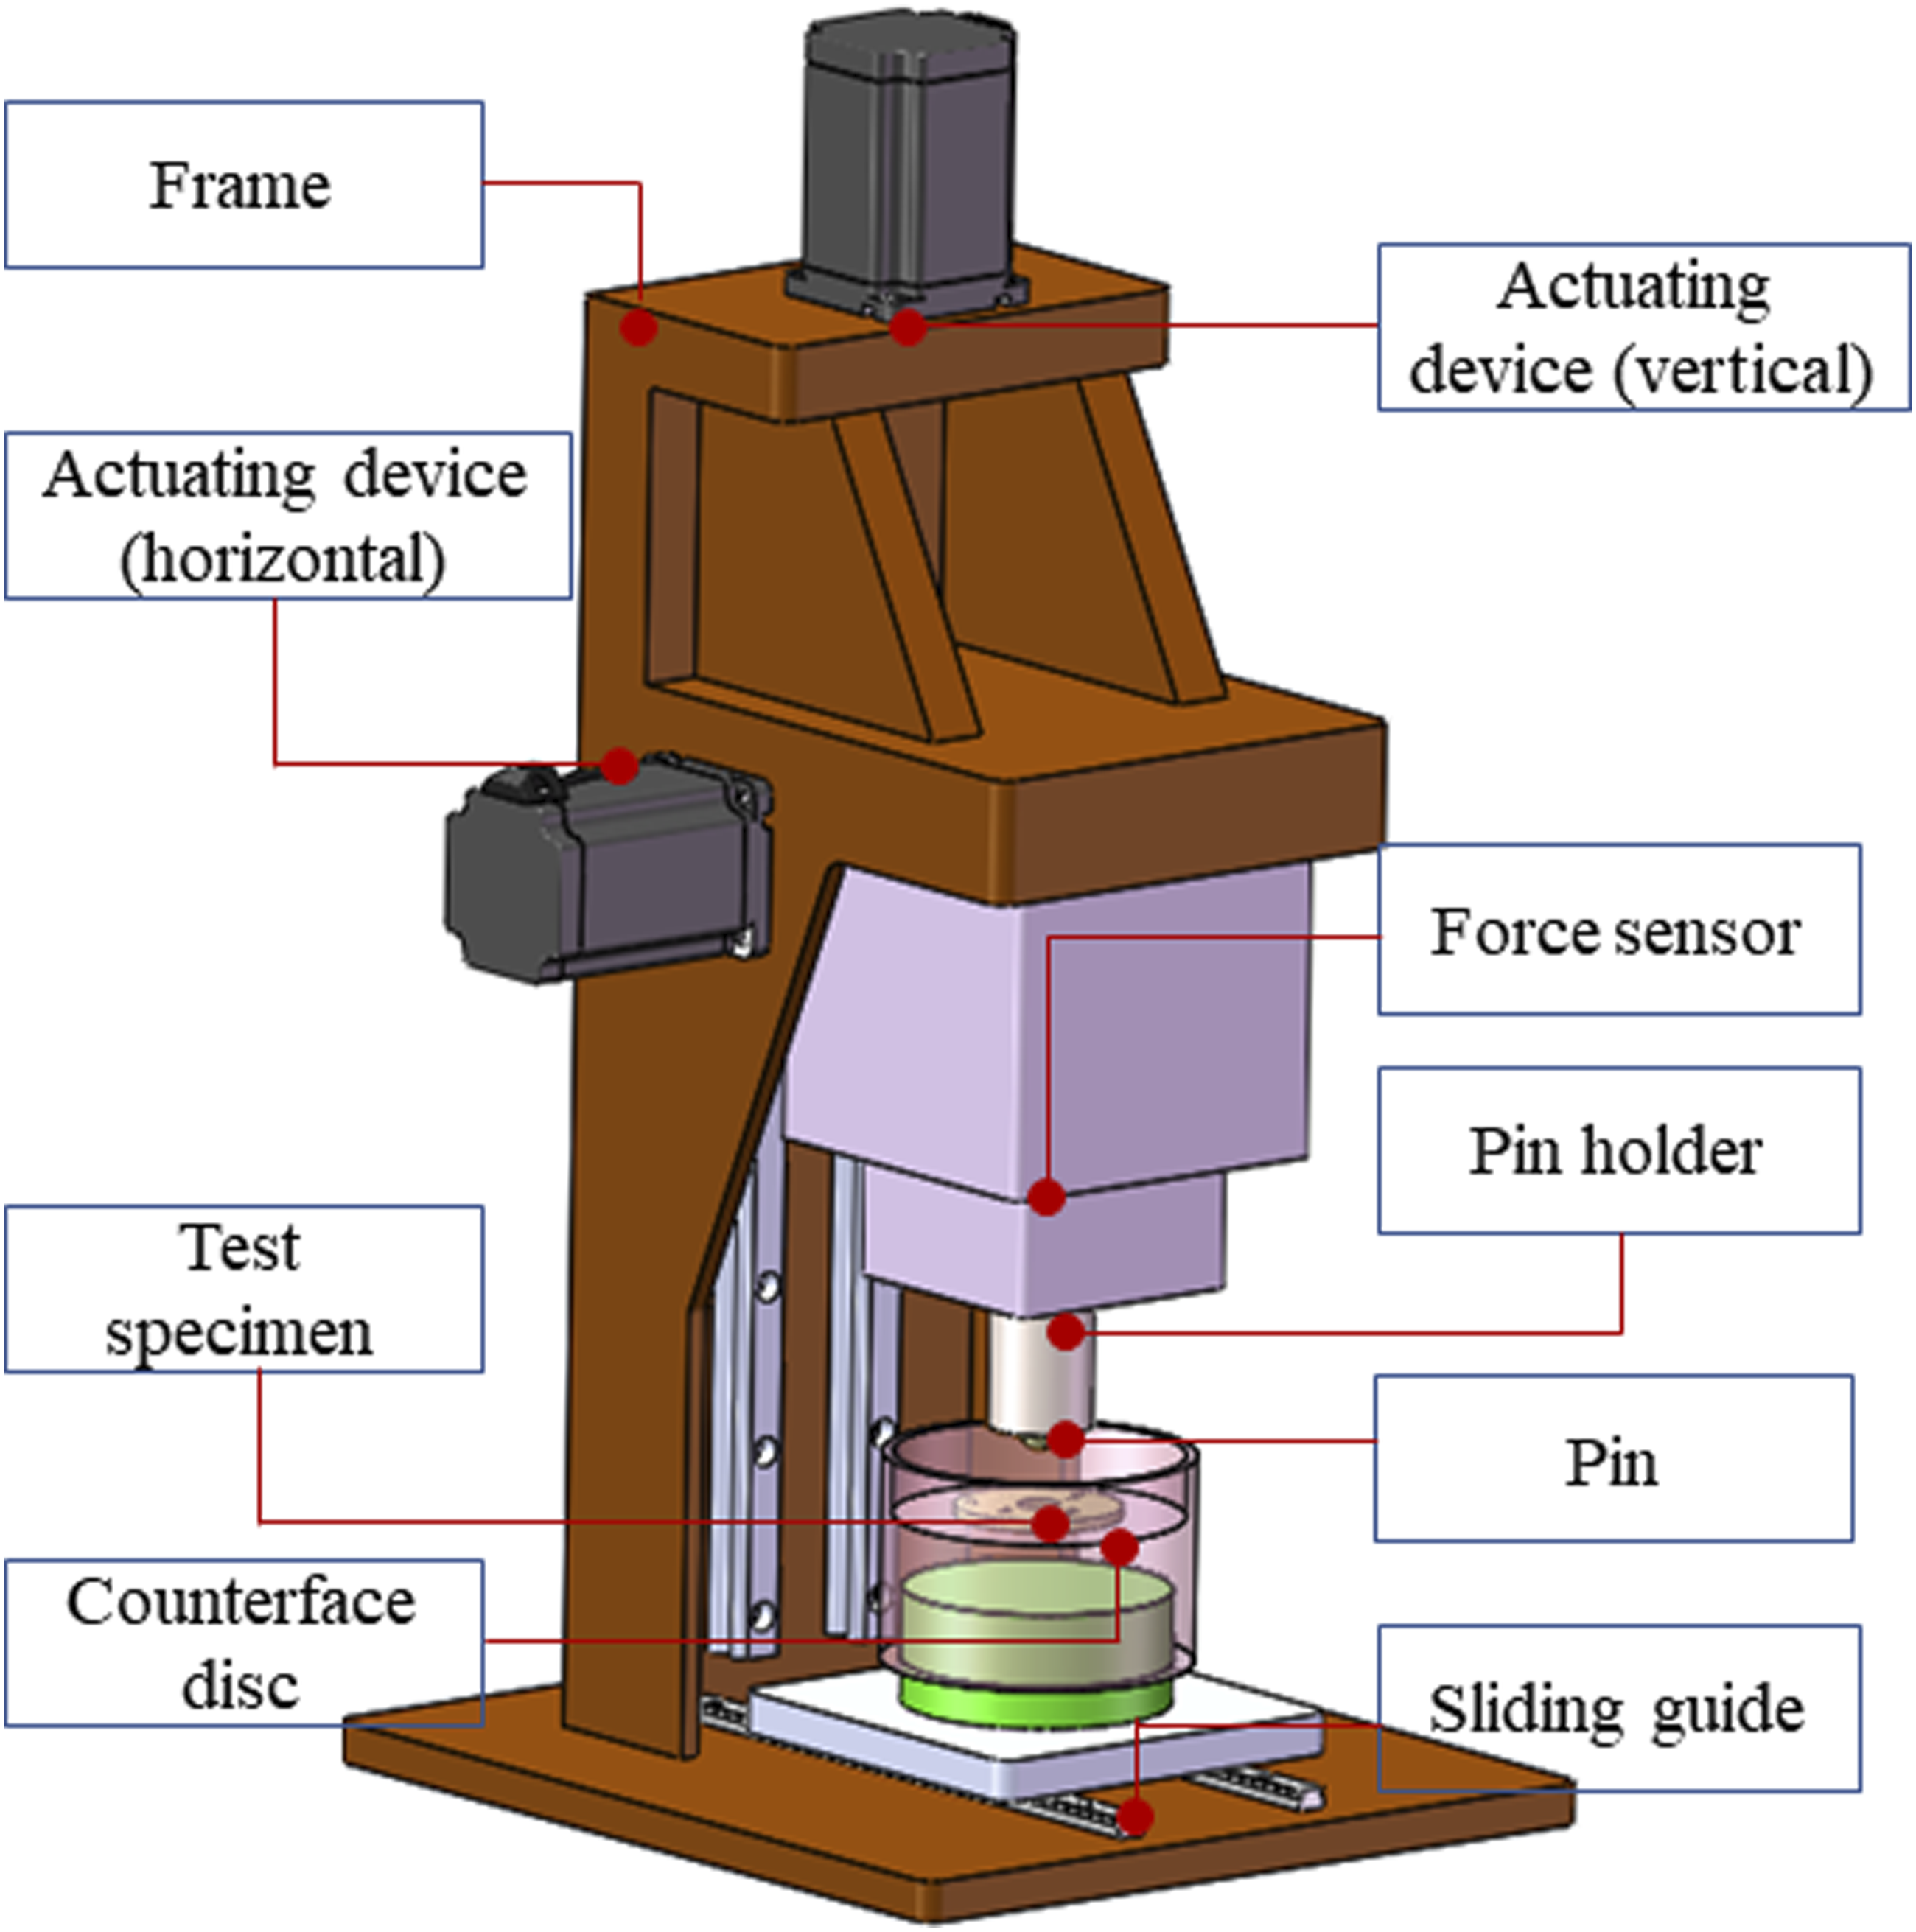
Reciprocating sliding tests were conducted on the sample composites to mimic the actual operating conditions of hydraulic seals in the rod and piston seal rings of hydraulic actuators. The seal rings in these devices are in contact with the piston/rod and reciprocate along the extending and retracting stroke. The reciprocating motion in the test rig was transformed from the rotation motion of the motor through a mechanical transmission mechanism.
Test conditions for the sliding tests.
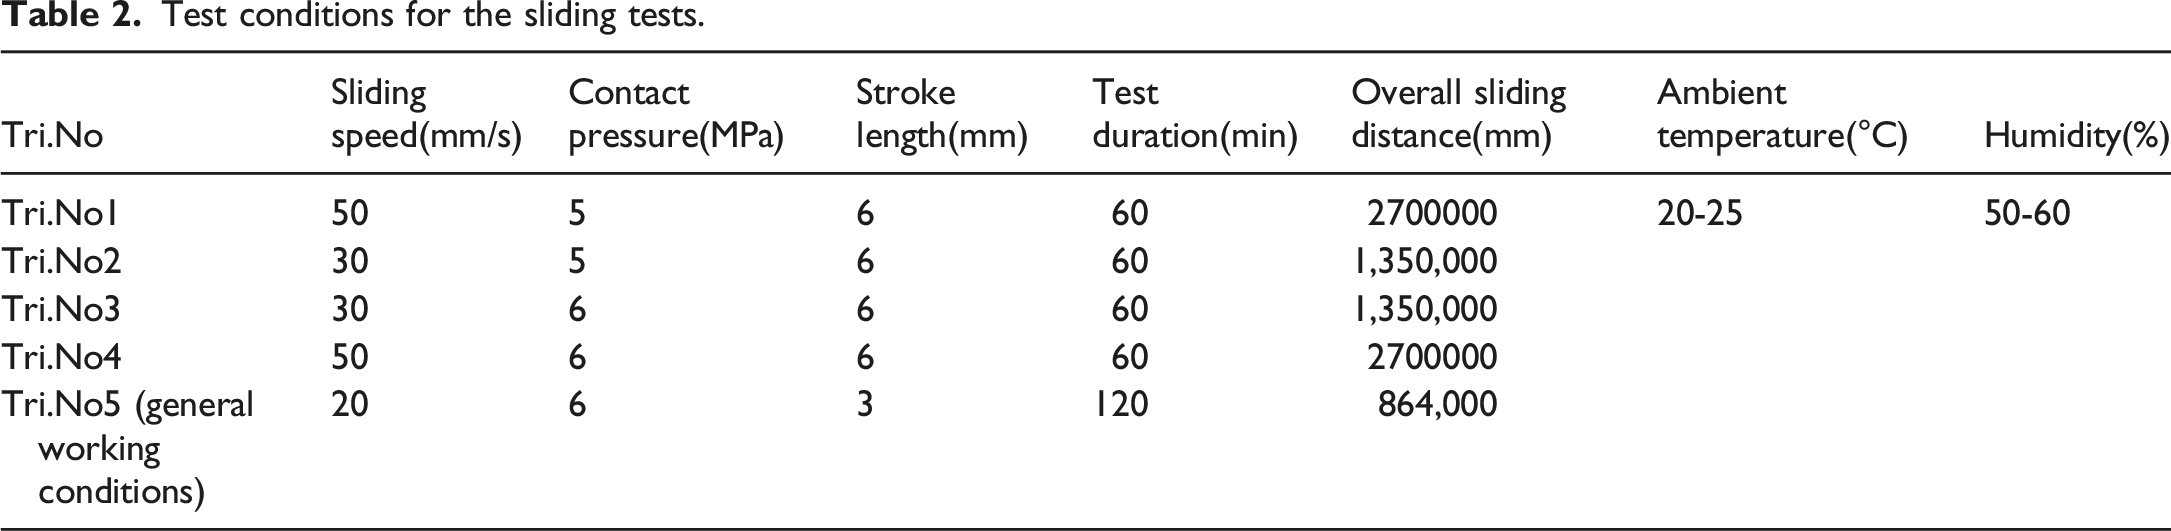
The pin-on-disc test module we used consists of a stainless-steel pin with a spherical contact surface (curvature radius: 3 mm). The pin was placed vertically on the stainless steel counterface disc, i.e., the sample to be tested (specimen diameter: 12 mm; thickness: 3 mm). Each tribological behavior of the tested specimen was repeated at least three times and the results were averaged to ensure the repeatability of the experimental data.
We conducted a surface wear test using a super depth-of-field 3D microscope (VHX5000, KEENS, 54 million pixel maximum). Each specimen was ultrasonically cleaned before the test to ensure that its state after wear could be accurately captured.
The surface wear morphology and wear roughness of each sample were tested on a 3D optical profiler (WYKO NT9100, Veeco Metrology Inc). The longitudinal scanning range of the experimental device is 0.1 nm to 1 mm, the optical transverse resolution 400 to 600 nm, and the measurement multiple is 5x to 100x. Before the test, each specimen was ultrasonically cleaned.
X-ray powder diffraction(XRD) was conducted by a Japan Rigaku’s Smartlab SE X-ray diffractometer with Cu Kα1 radiation(
The morphologies and chemical composition of the PTFE,PA and PP composites and the worn surface morphologies of the samples were obtained using an scanning electron microscope (SEM-EDS,MIRA4 LMH One Max 50,TESCAN, beam voltage: 20 kV). Before surface morphology testing, the surface of each tested sample was fixed on conductive tape and sprayed with gold to insulate the composite material under investigation.
Results and discussion
SEM, XRD and EDS analyses of different composites
Figure 2 represents the pure PTFE(a,a’), distribution of bronze particle in the PTFE matrix(b,b’), distribution of glass fiber in the PA(c,c’) and PP(d,d’) matrix obtained by scanning electron microscope.
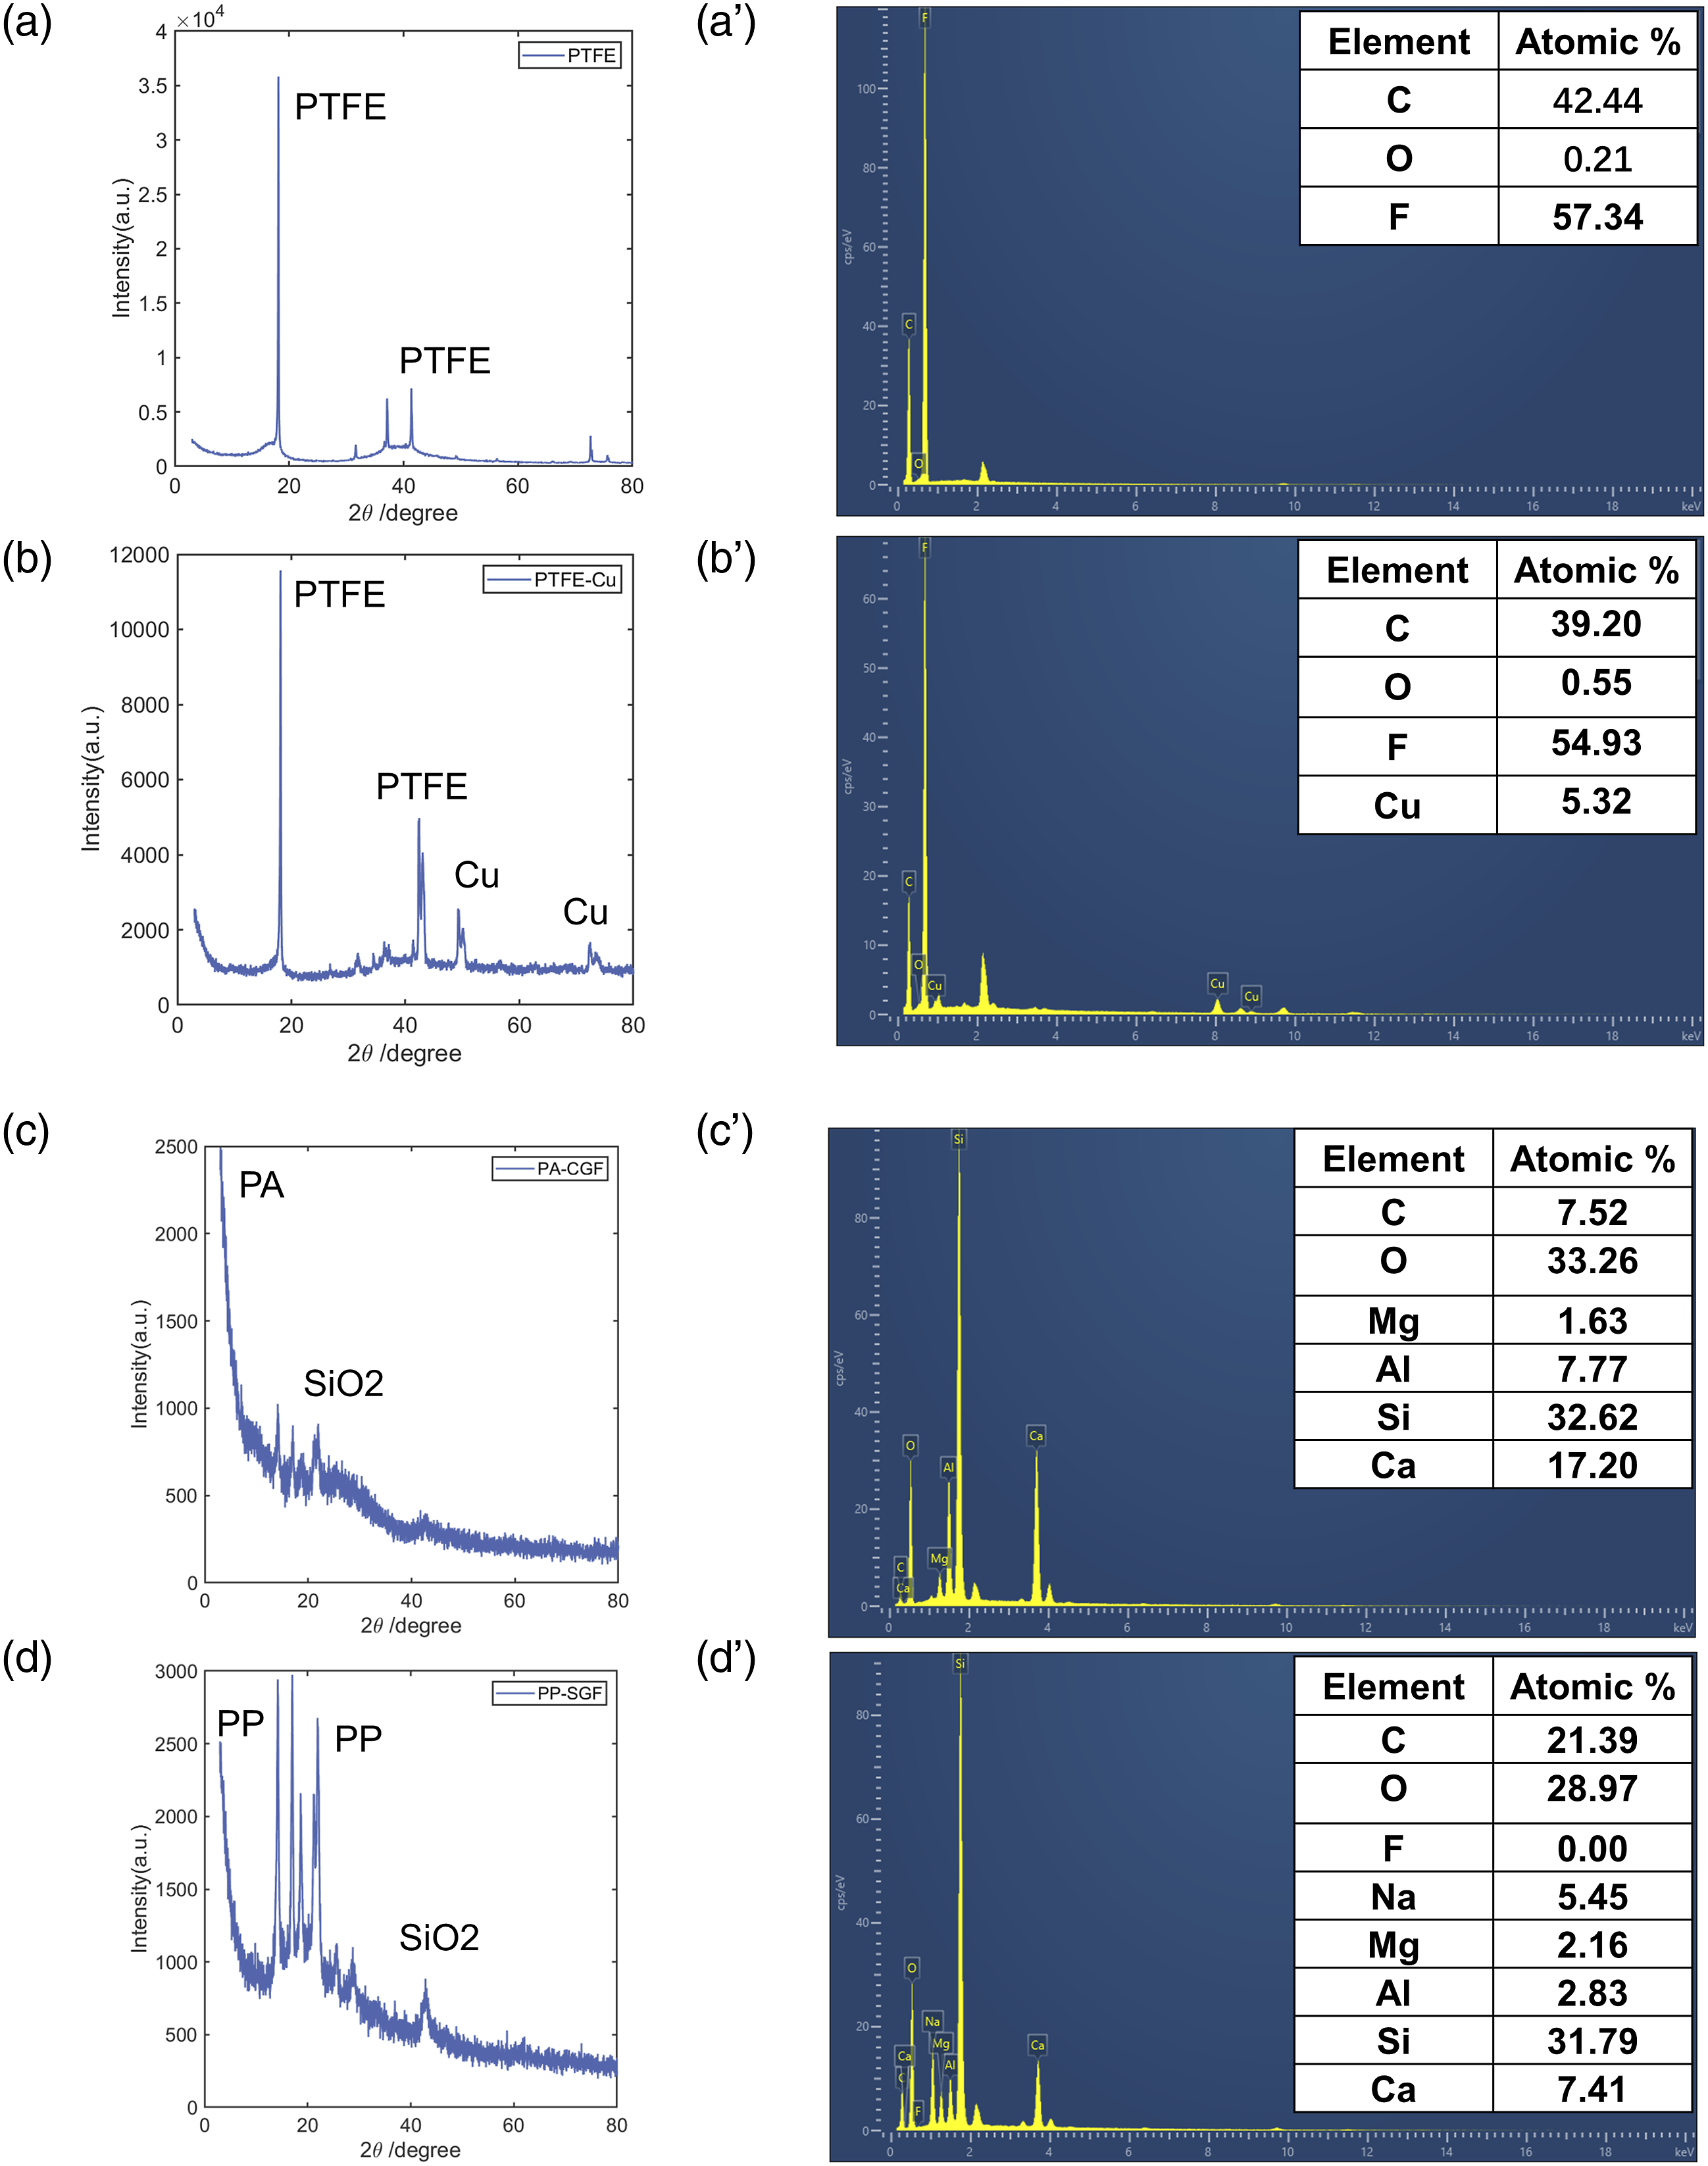
Figure 3 shows the XRD curves and chemical composition of the PTFE,PA and PP composites. By comparing with the standard card,the filled PTFE,PA and PP are mainly composed of polymer matrix and a small quantity of Cu particles and SiO2 particles. Furthermore, there is a small amount of Cu (5.32%) ifor the PTFE-Cu composites, which indicates that the PTFE matrix were successfully filled with Cu particles (Figure 3(b’)). It can be seen from Figure 3(c’) and (d’) that there is a large amount of O and Si,which demonstrated that the PA and PP matrix were successfully filled with glass fiber. (Figure 4) SEM images of the prepared materials: (a) PTFE, (b) PTFE with Cu particle, (c) PA with CGF, (d) PP with SGF. XRD and EDS analysis of the prepared materials: (a) PTFE, (b) PTFE with Cu particle, (c) PA with CGF, (d) PP with SGF.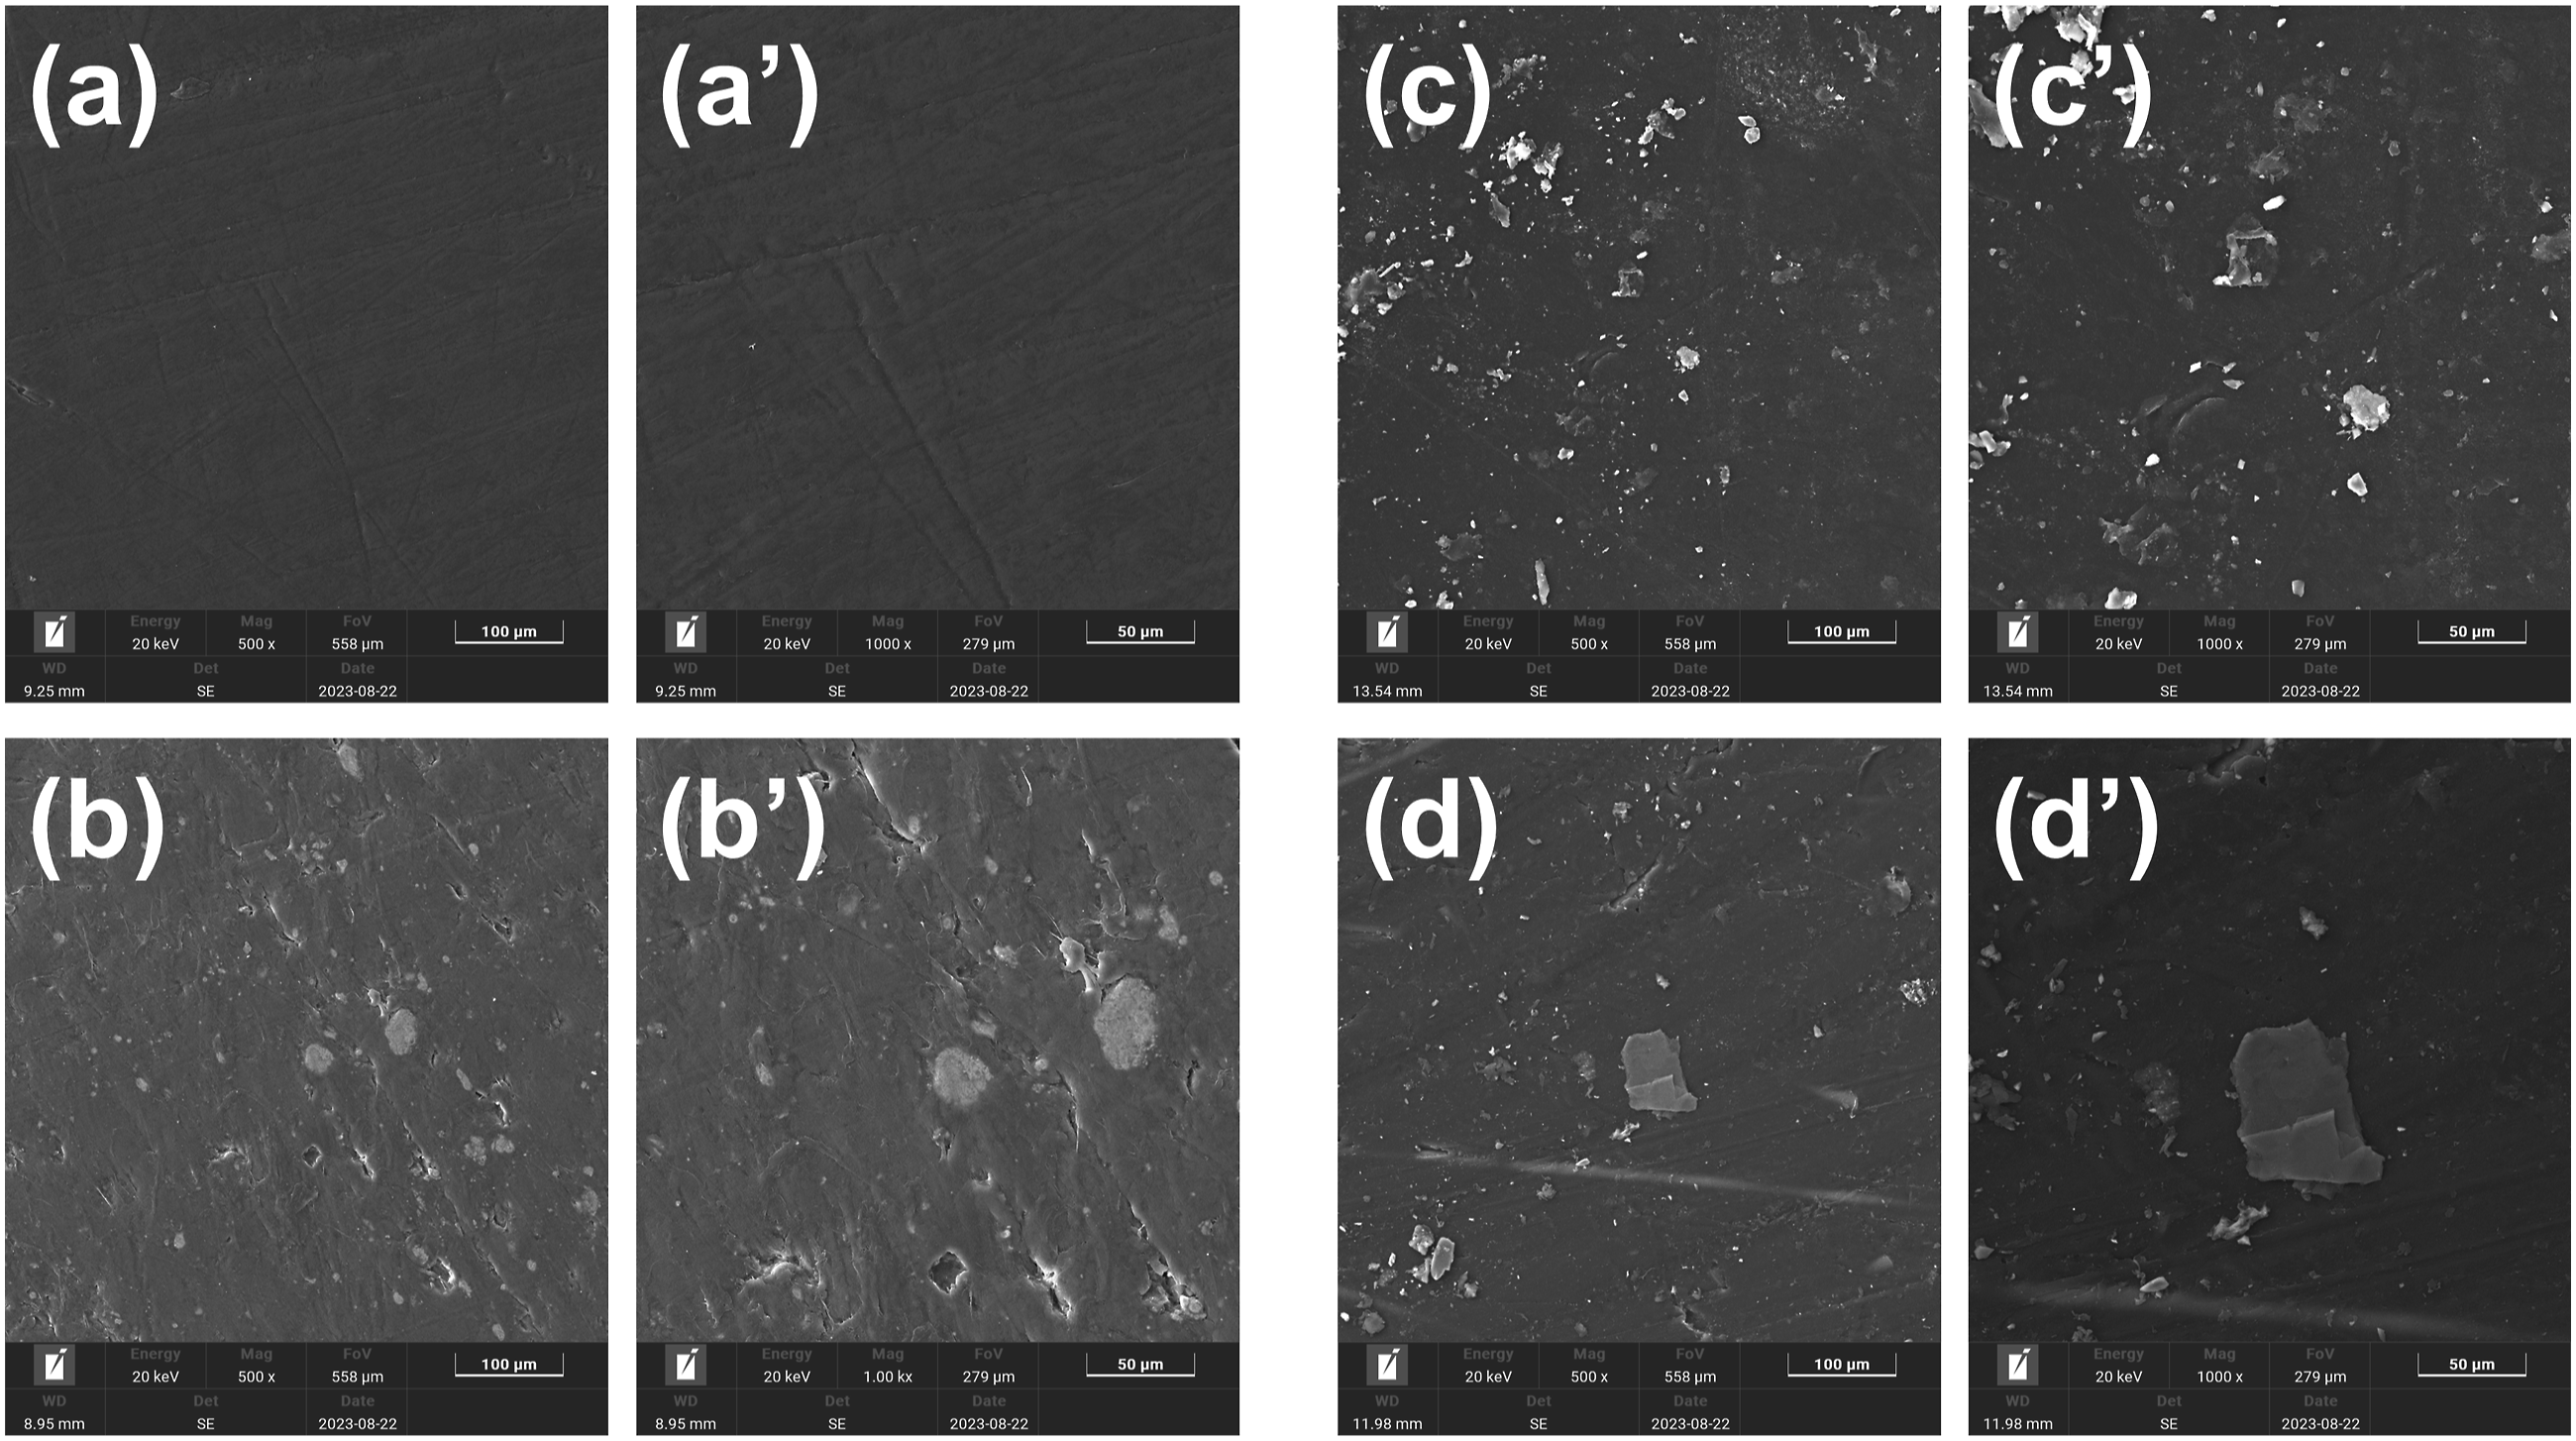
Mechanical properties of different composites
Figure 5 shows the tensile properties of different composites. It can be seen that the Young’s modulus of PA-CGF is the highest among these four materials, follows by PP-SGF. The Young’s mudulus of PTFE-Cu is slightly higher than the pure PTFE. Tensile properties of PTFE,PA and PP composites: (a) Variation in force with respect to time, (b) Young’s modulus.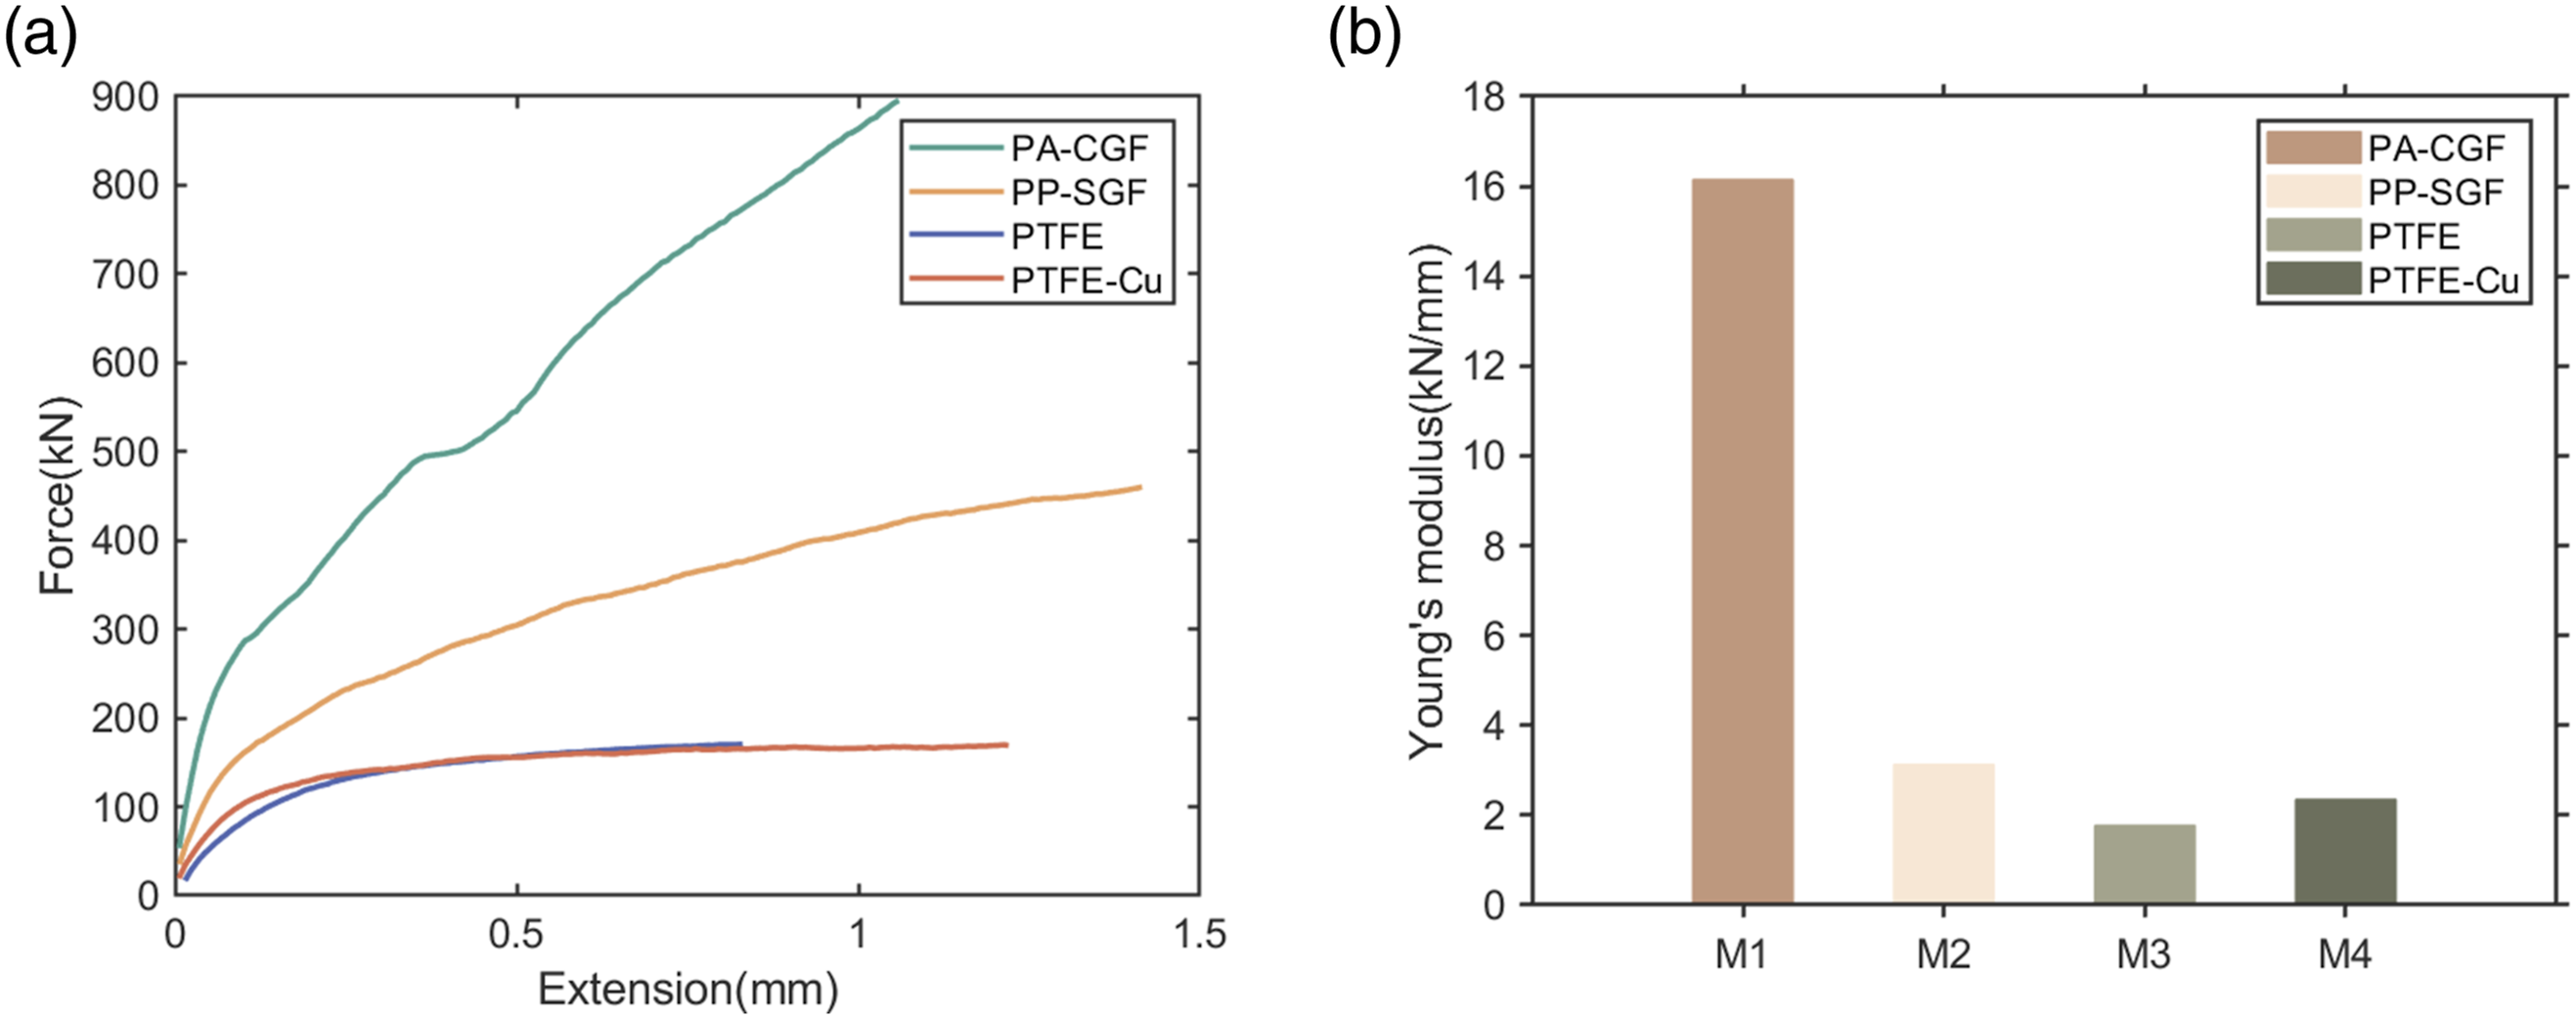
Coefficient of friction of different composites
Figure 6(a) and Figure 6(b) shows the various coefficient of friction of the sealing ring with time for the two composites under different working conditions. The data points in the figures are the averages for three test data points. At the same contact pressure (6 MPa or 5 MPa). There is a clear difference in the coefficient of friction depending on the sliding speed (Figure 6(a) and (b)). A lower coefficient of friction can be seen at 30 mm/s and friction behavior fluctuates considerably at lower sliding speeds, which is similar to early findings by Ibrahim.
35
High sliding speed contributes to unstable contiditions. This means the formation and destruction of transfer film cannot reach a balanced state under elevated temperature, which contributes to plastic deformation. Thus, increased damage on the surface increases the coefficient of friction when sliding speed is high. Variations in coefficient of friction under different speeds and contact pressure for (a)PTFE and (b) PTFE-Cu; (c) Average coefficient of friction of PTFE and PTFE-Cu with different typical wear process parameters.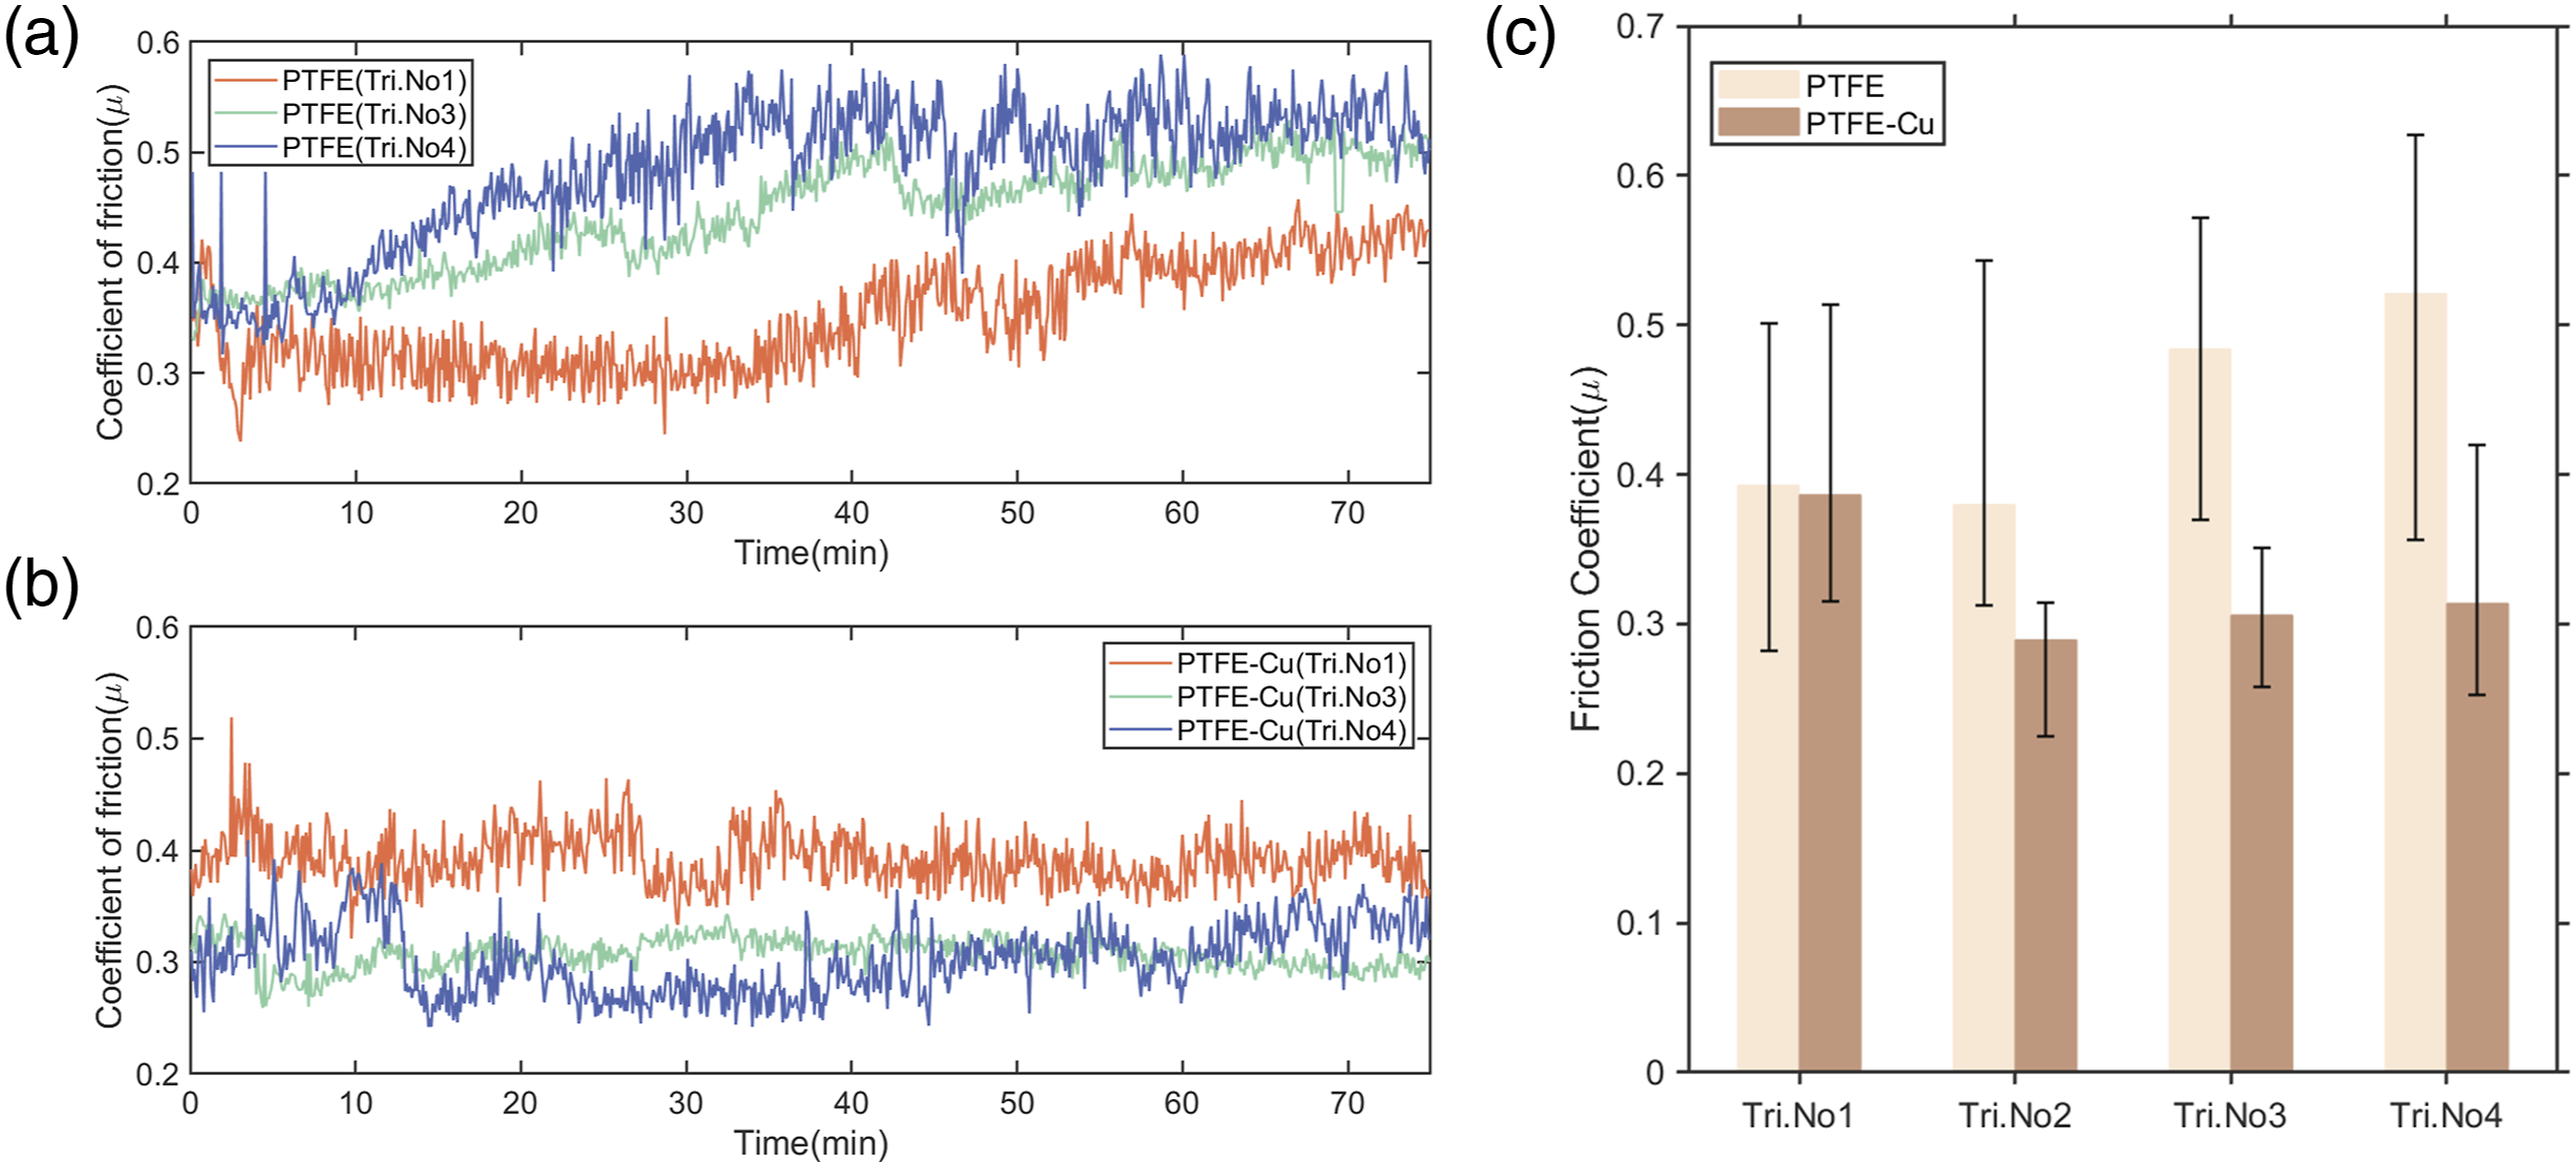
When the contact pressure increases to 6 MPa, the friction behavior becomes unstable and coefficient of friction increase for PTFE (Figure 6(a)). Some researchers have made similar observations 40 while others reached opposite results. 15 It is possible that an increasing applied load makes the contact interface closer, promoting transfer film formation, which result in more reduction in coefficient of friction. Furthermore,the increase of load will contribute to increase the temperature of polymer counterface more drastically. Therefore,the adhesion effect will increase the coefficient of friction. It is also possible that more material substrates detaches from the PTFE matrix as the load increases. Without effective reinforcement, PTFE easily peels away during friction testing; the detached materials lead to serious friction. These three factors restrict each other, which increase the coefficient of friction as the applied load increases.
When adding Cu additive to the pure PTFE, it can be seen that the coefficient of friction consistently increase with the increase in the sliding speed value but decreases with the increase in the applied load value in Figure 6(b). This opposite phenomenon is attributed to the increasing thermal conductivity of polymer composites. As a result of the higher thermal conductivity than pure PTFE, frictional heat being generated during sliding was removed in time. Therefore, this prevent the accumulation of heat and increase of contact temperature 26 and thus reducing the coefficient of friction of PTFE composites. In addition, while the increase of load will promote stable and thicker transfer film more remarkably, thus the reduction of friction is observed.
Figure 6(c) shows where the incorporation of Cu decreases the coefficient of friction of the PTFE composites. The coefficient of friction shown in the figures are average values in the visibly stable portion of each curve. Adding Cu particles to PTFE composites resulted in a lower coefficient of friction under all our test conditions due to the rolling effect 41 of Cu particles. In addition,the presence of Cu particles increase the adhesion between the transfer film and the dual surface. The transfer film is relatively stable and compact.
Figure 7 shows the variations in PTFE, PA, and PP composites over time. Within 40 min (short-term) (Figure 7(a)), the coefficient of friction of PTFE and PTFE-Cu gradually increase and reach a steady state while that of PA-CGF increases sharply and then decreases over time. The test value of PA-CGF is higher than those of PTFE composites initially, then slightly lower than those of PTFE composites. However, long-term (Figure 7(b)), the coefficient of friction of PTFE-Cu is first lower than PTFE and surpasses it around 40 min before the values reach similar levels in the steady-stage. The addition of Cu particles appears to steady the transfer film. Under friction shear and normal pressure, the surface of the PTFE matrix composites underwent serious elastoplastic deformation. Thus, delamination
11
of the Cu additive occurred and caused Cu particles in wear debris to accumulate on the surface, which caused the transition we observed in the wear tests. Coefficient of friction variations for PTFE,PA,PP composites with respect to time: (a) short duration, (b) average coefficient of friction in steady-state, and (c) long duration under high sliding speed(20 mm/s) and contact pressure(6 MPa).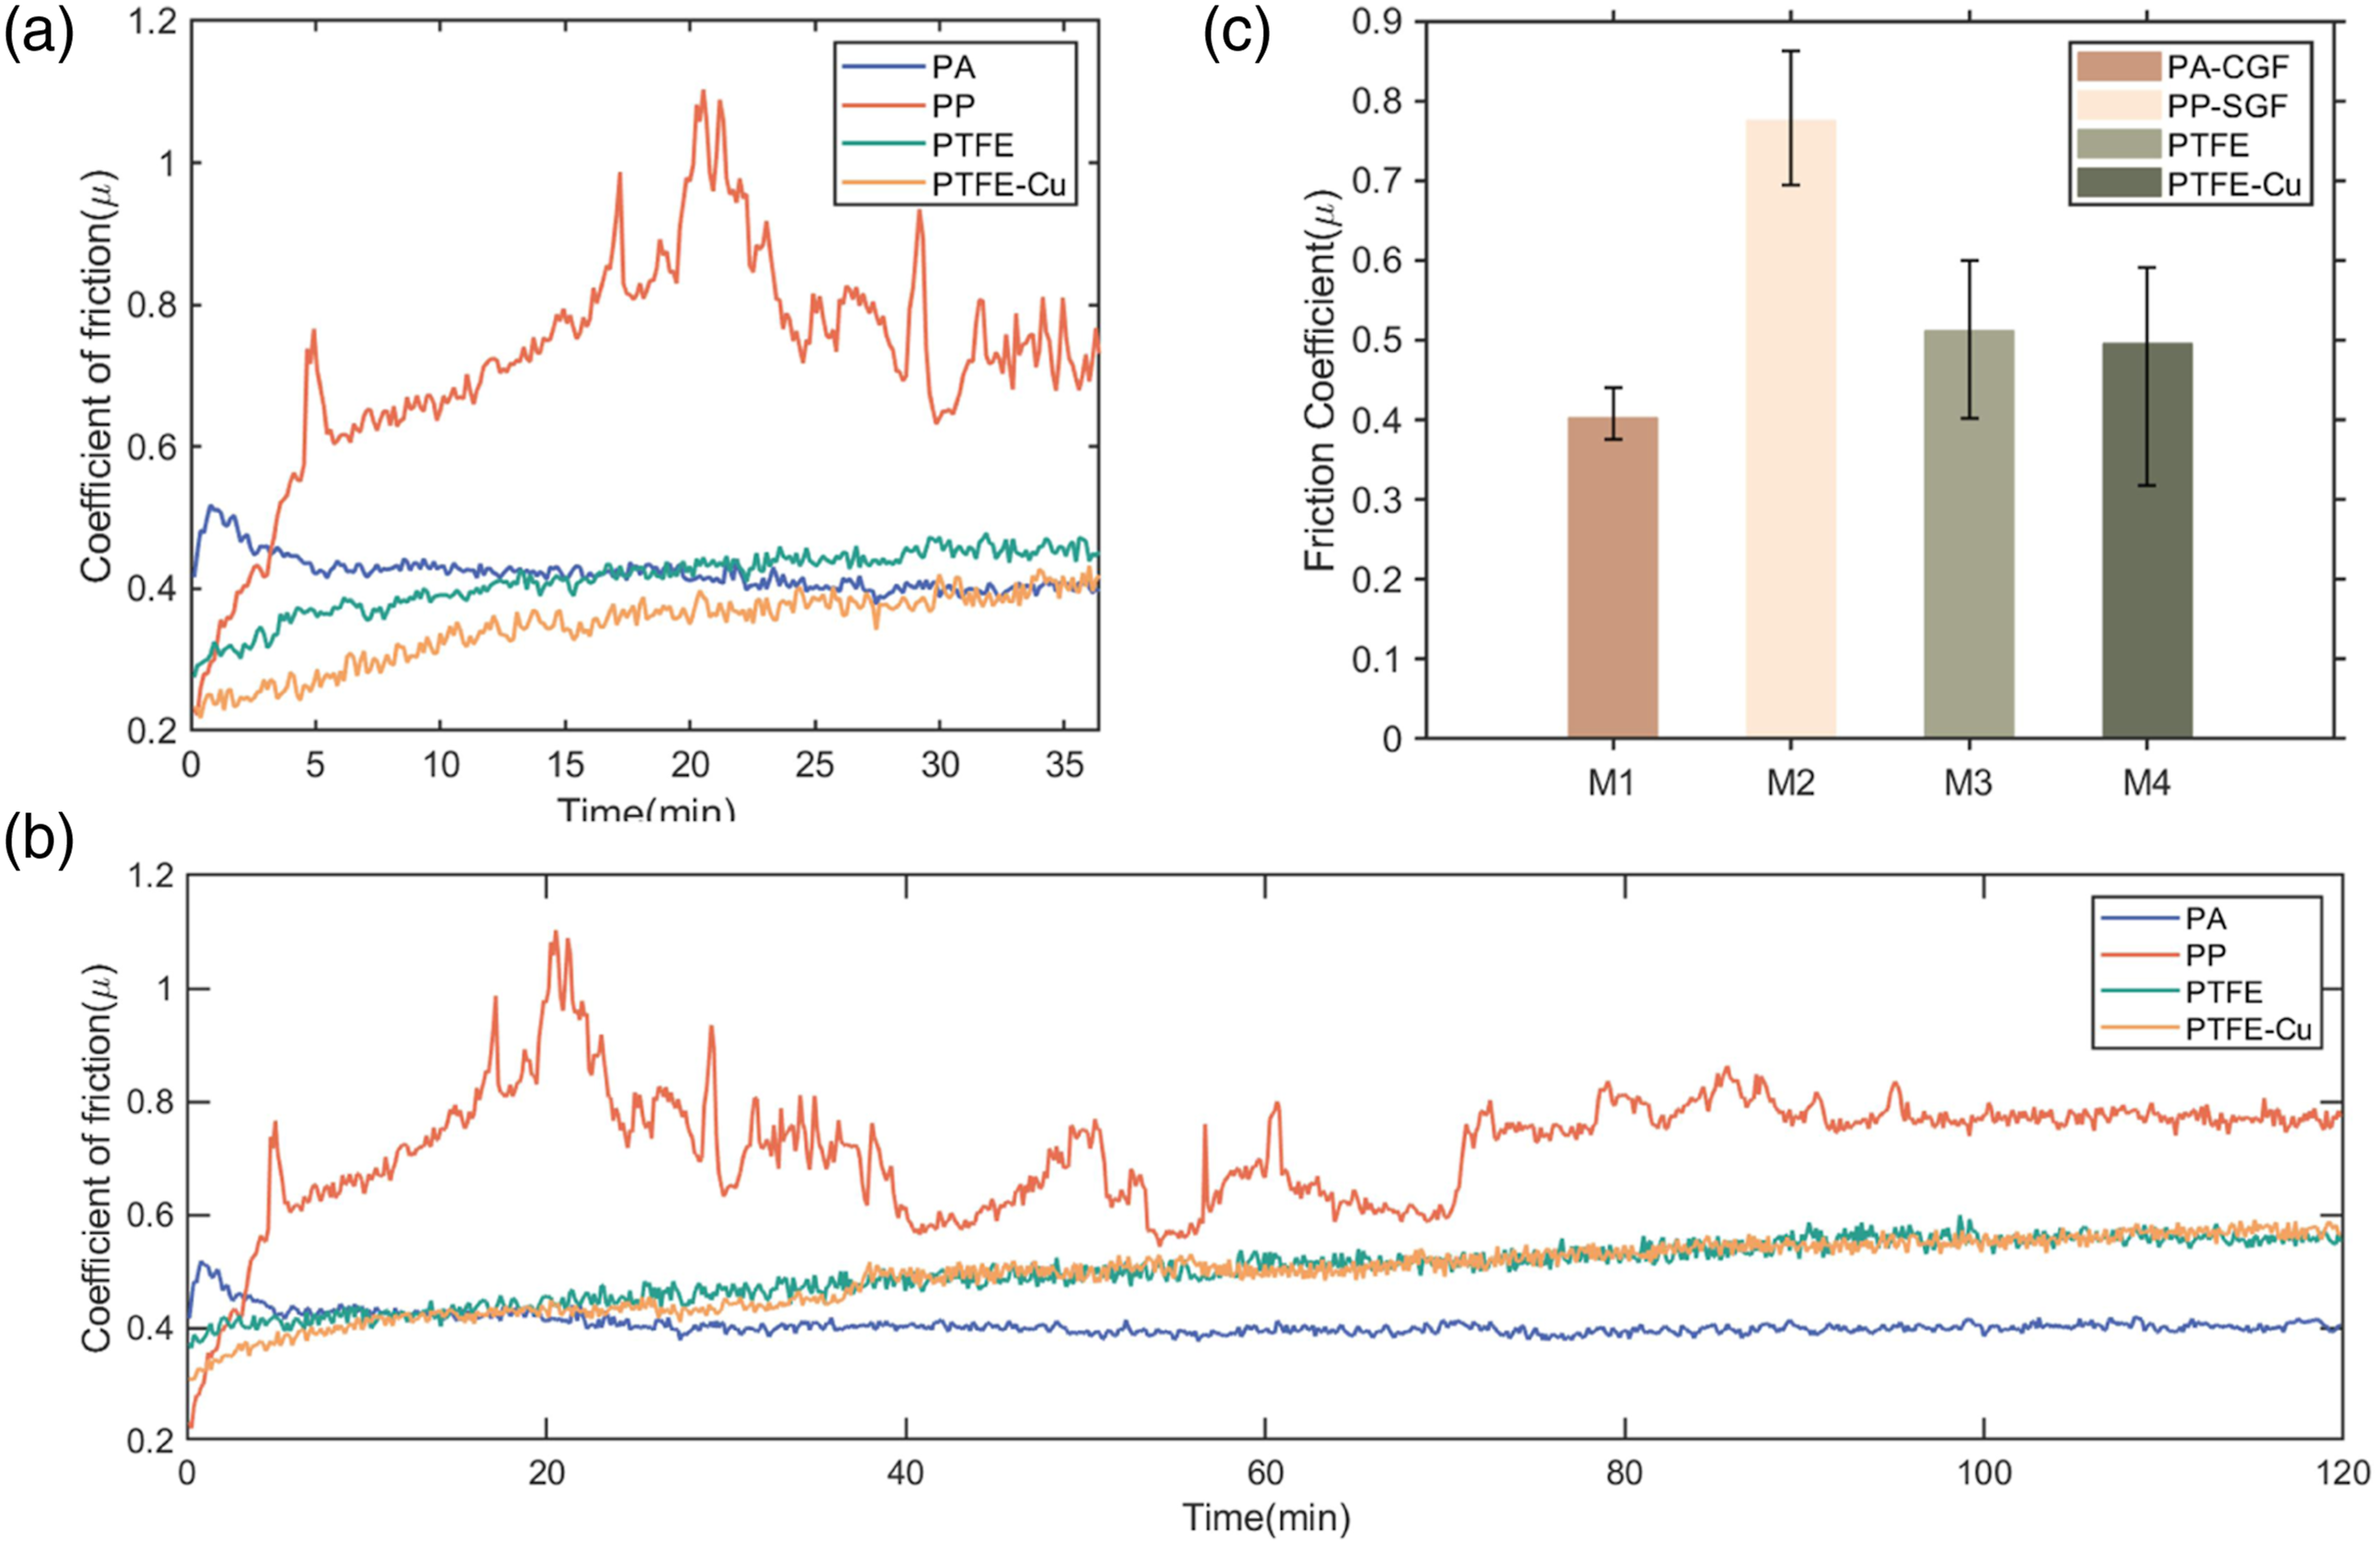
We noticed marked differences between PP-SGF and other composites in all stages of the experiment. PP-SGF also showed strong fluctuations in friction behavior throughout. After the initial run-in period, the coefficient of friction of the PP composites were higher than those of PTFE or PA composites due to the significantly higher coefficient of friction of unfilled PP compared to unfilled PTFE or PA. GF material was torn from the polymer matrix, protruding out of the polymer surface. Those fibers are often fragmented and broken off along the fiber surface, becoming large-scale debris, which accelerates the abrasive action. 37 This phenomena can also be observed in worn surface(Figure 11(a) and (b)). Therefore, the coefficient of friction was unstable during the wear test.
The average steady-state coefficient of friction over the visibly stable portion of each curve are shown in Figure 7 coefficient of friction variations for PTFE,PA,PP composites with respect to time: (a) short duration, (b) average coefficient of friction in steady-state, and (c) long durationThe coefficient of friction of PA composites are somewhat lower than those of PTFE or PP composites. We attribute this to the highest elastic modulus and hardness of the polymer, which improved the plastic deformation resistance and reduced the real contact area. The incorporation of glass fiber also strengthened the fixation of tribo-film, allowing it to strongly adhere to the surface.
Figure 8 shows that the average steady-state friction coefficient at a contact pressure of 6 MPa and sliding speed of 50 mm/s for PTFE,PA and PP composites. It can be seen that the friction behavior are different from those in general working conditions(6 MPa, 20 mm/s). The coefficient of friction of the PA-CGF and PP-SGF decreases with increase in sliding speed. This can be explained by the change in temperature on the surface of the PA and PP composites. With increase in the sliding speed,the friction heat may accumulate more quickly in the friction interface, causing more PA,PP and glass fiber to be softened and easily spread. This contributes to much more thin and stable transfer film, which act as a solid lubricant. This thin and stable transfer film would be easily destruted and spread during frition. Futhermore, unstable friction process can be observed because of the unbalanced state of formation and destruction of transfer film. Average coefficient of friction in steady-state for PTFE,PA,PP composites under higher sliding speed(50 mm/s) and contact pressure(6 MPa).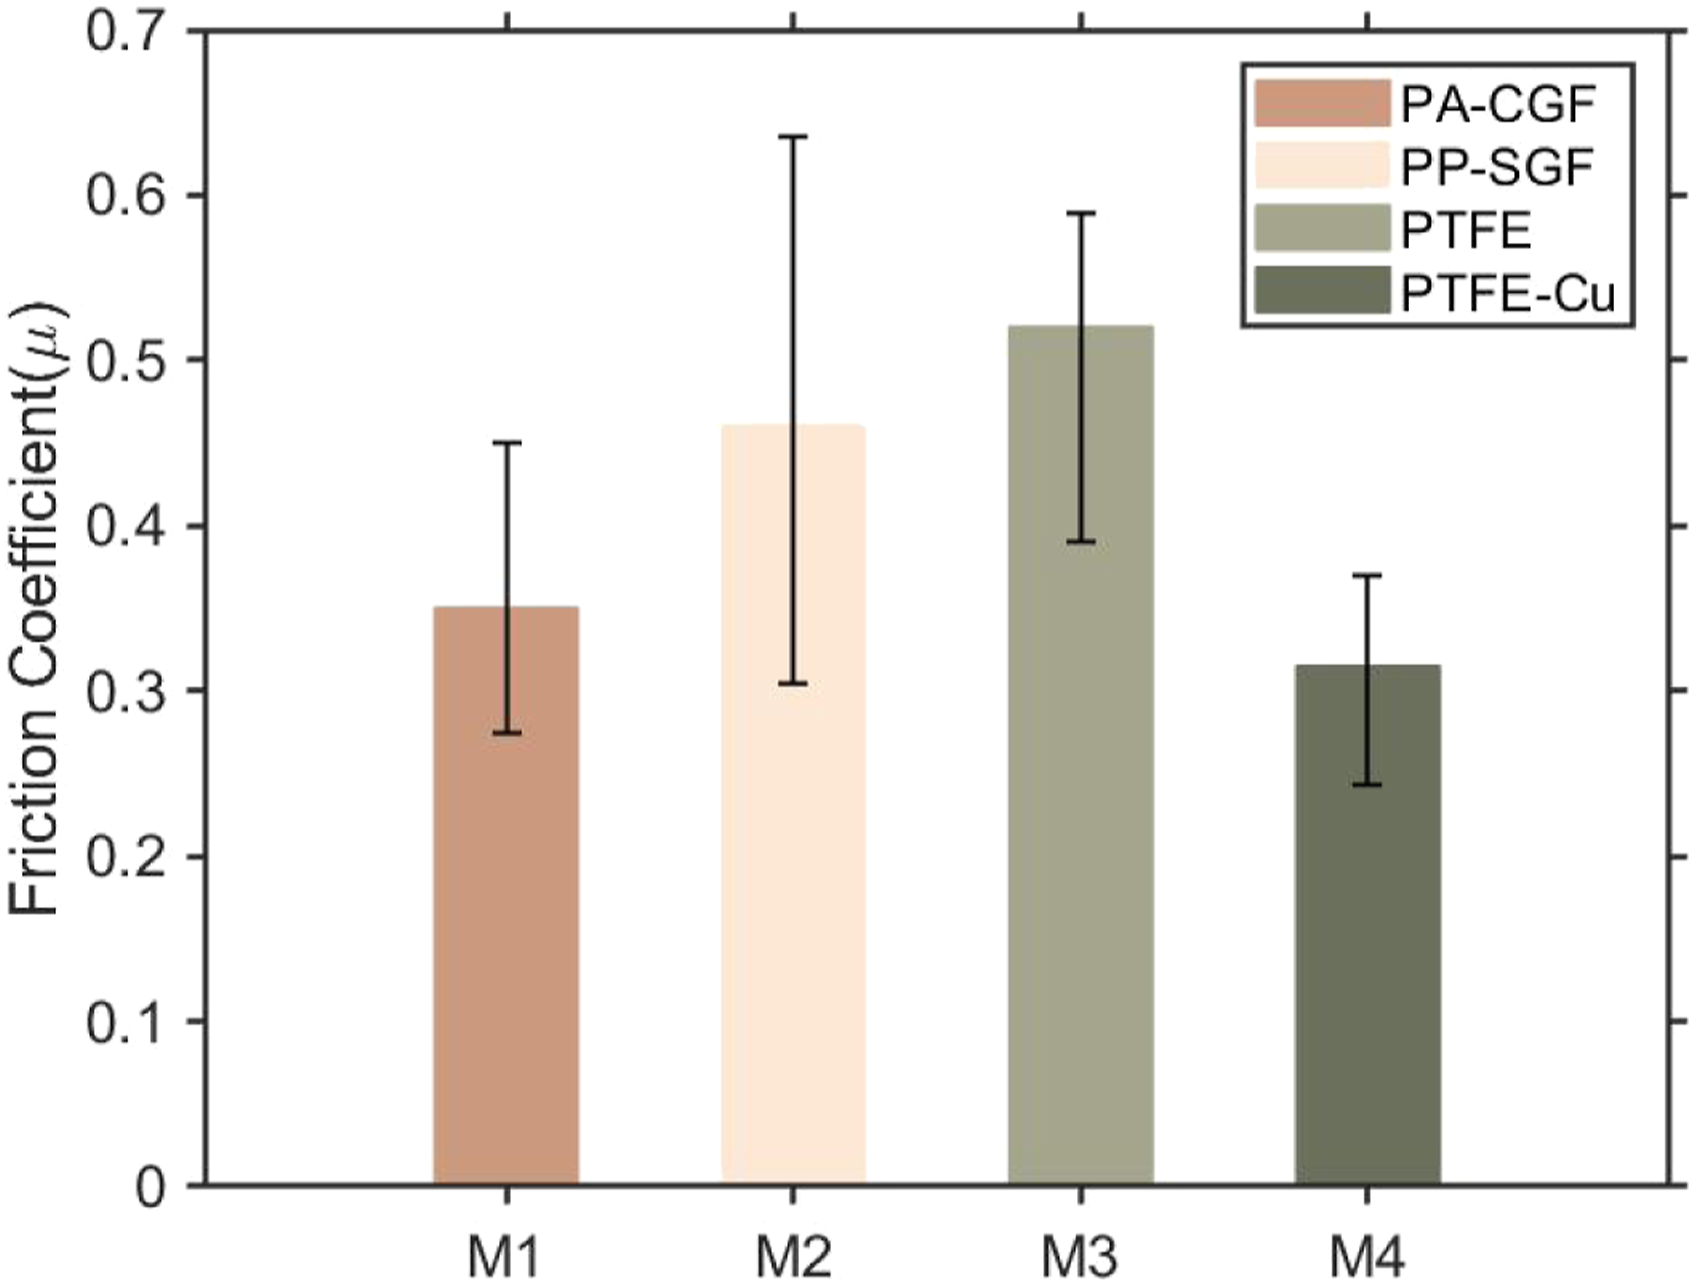
Wear rates for different composites
The representative wear performance under all working conditions was determined for each sample.
Figures 9 and 10 show the worn surface morphologies of PTFE composites under all working conditions. On the worn surface of pure PTFE, larger-scale and more abundant wear debris collected compared to other samples. This contrasts with the worn surfaces of the PTFE composites which are smoother than those of pure PTFE, owing to the reinforcement of Cu particles. Previous researchers made similar observations.11,40,42 Wear surface of PTFE at (a) Tri. No1:5 MPa, 50 mm/s, (b) Tri. No2:5 MPa, 30 mm/s, (c) Tri. No3:6 MPa, 30 mm/s, (d) Tri. No3:6 MPa, 50 mm/s, after ball-on-disc tests. Wear surface of PTFE-based composites (Cu) at (a) Tri. No1:5 MPa, 50 mm/s, (b) Tri. No2:5 MPa, 30 mm/s, (c) Tri. No3:6 MPa, 30 mm/s, (d) Tri. No3:6 MPa, 50 mm/s, after ball-on-disc tests.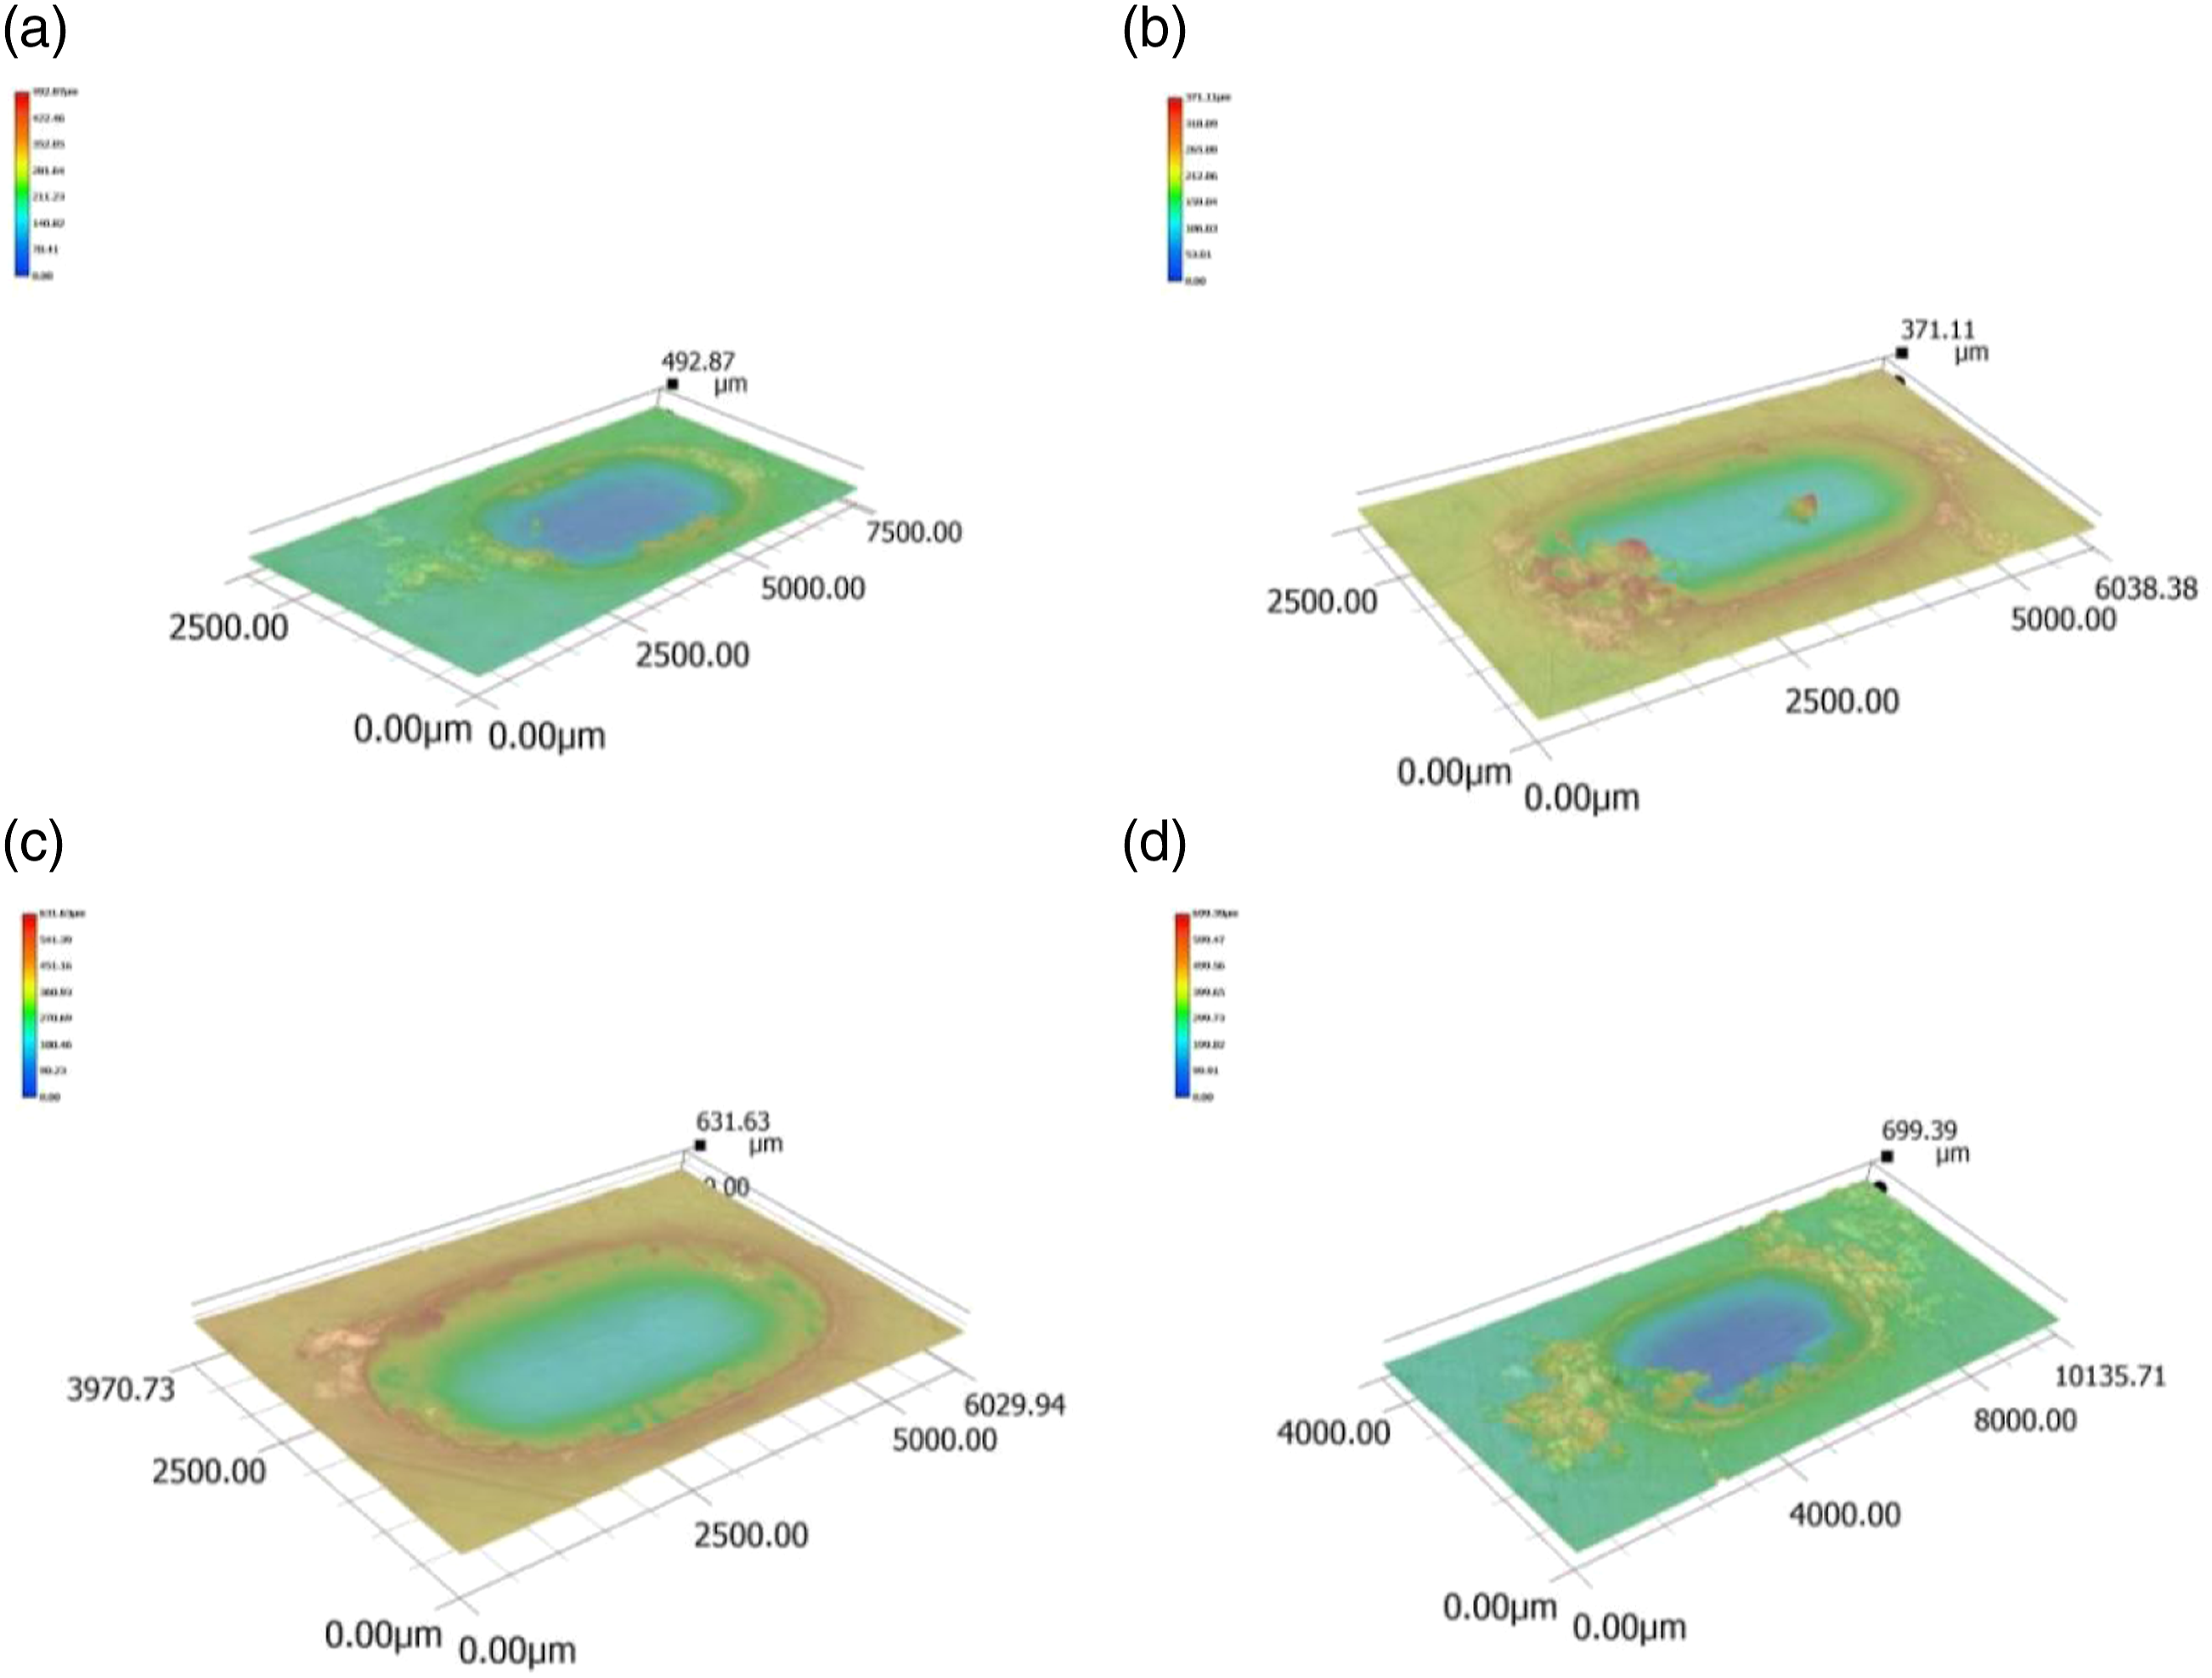
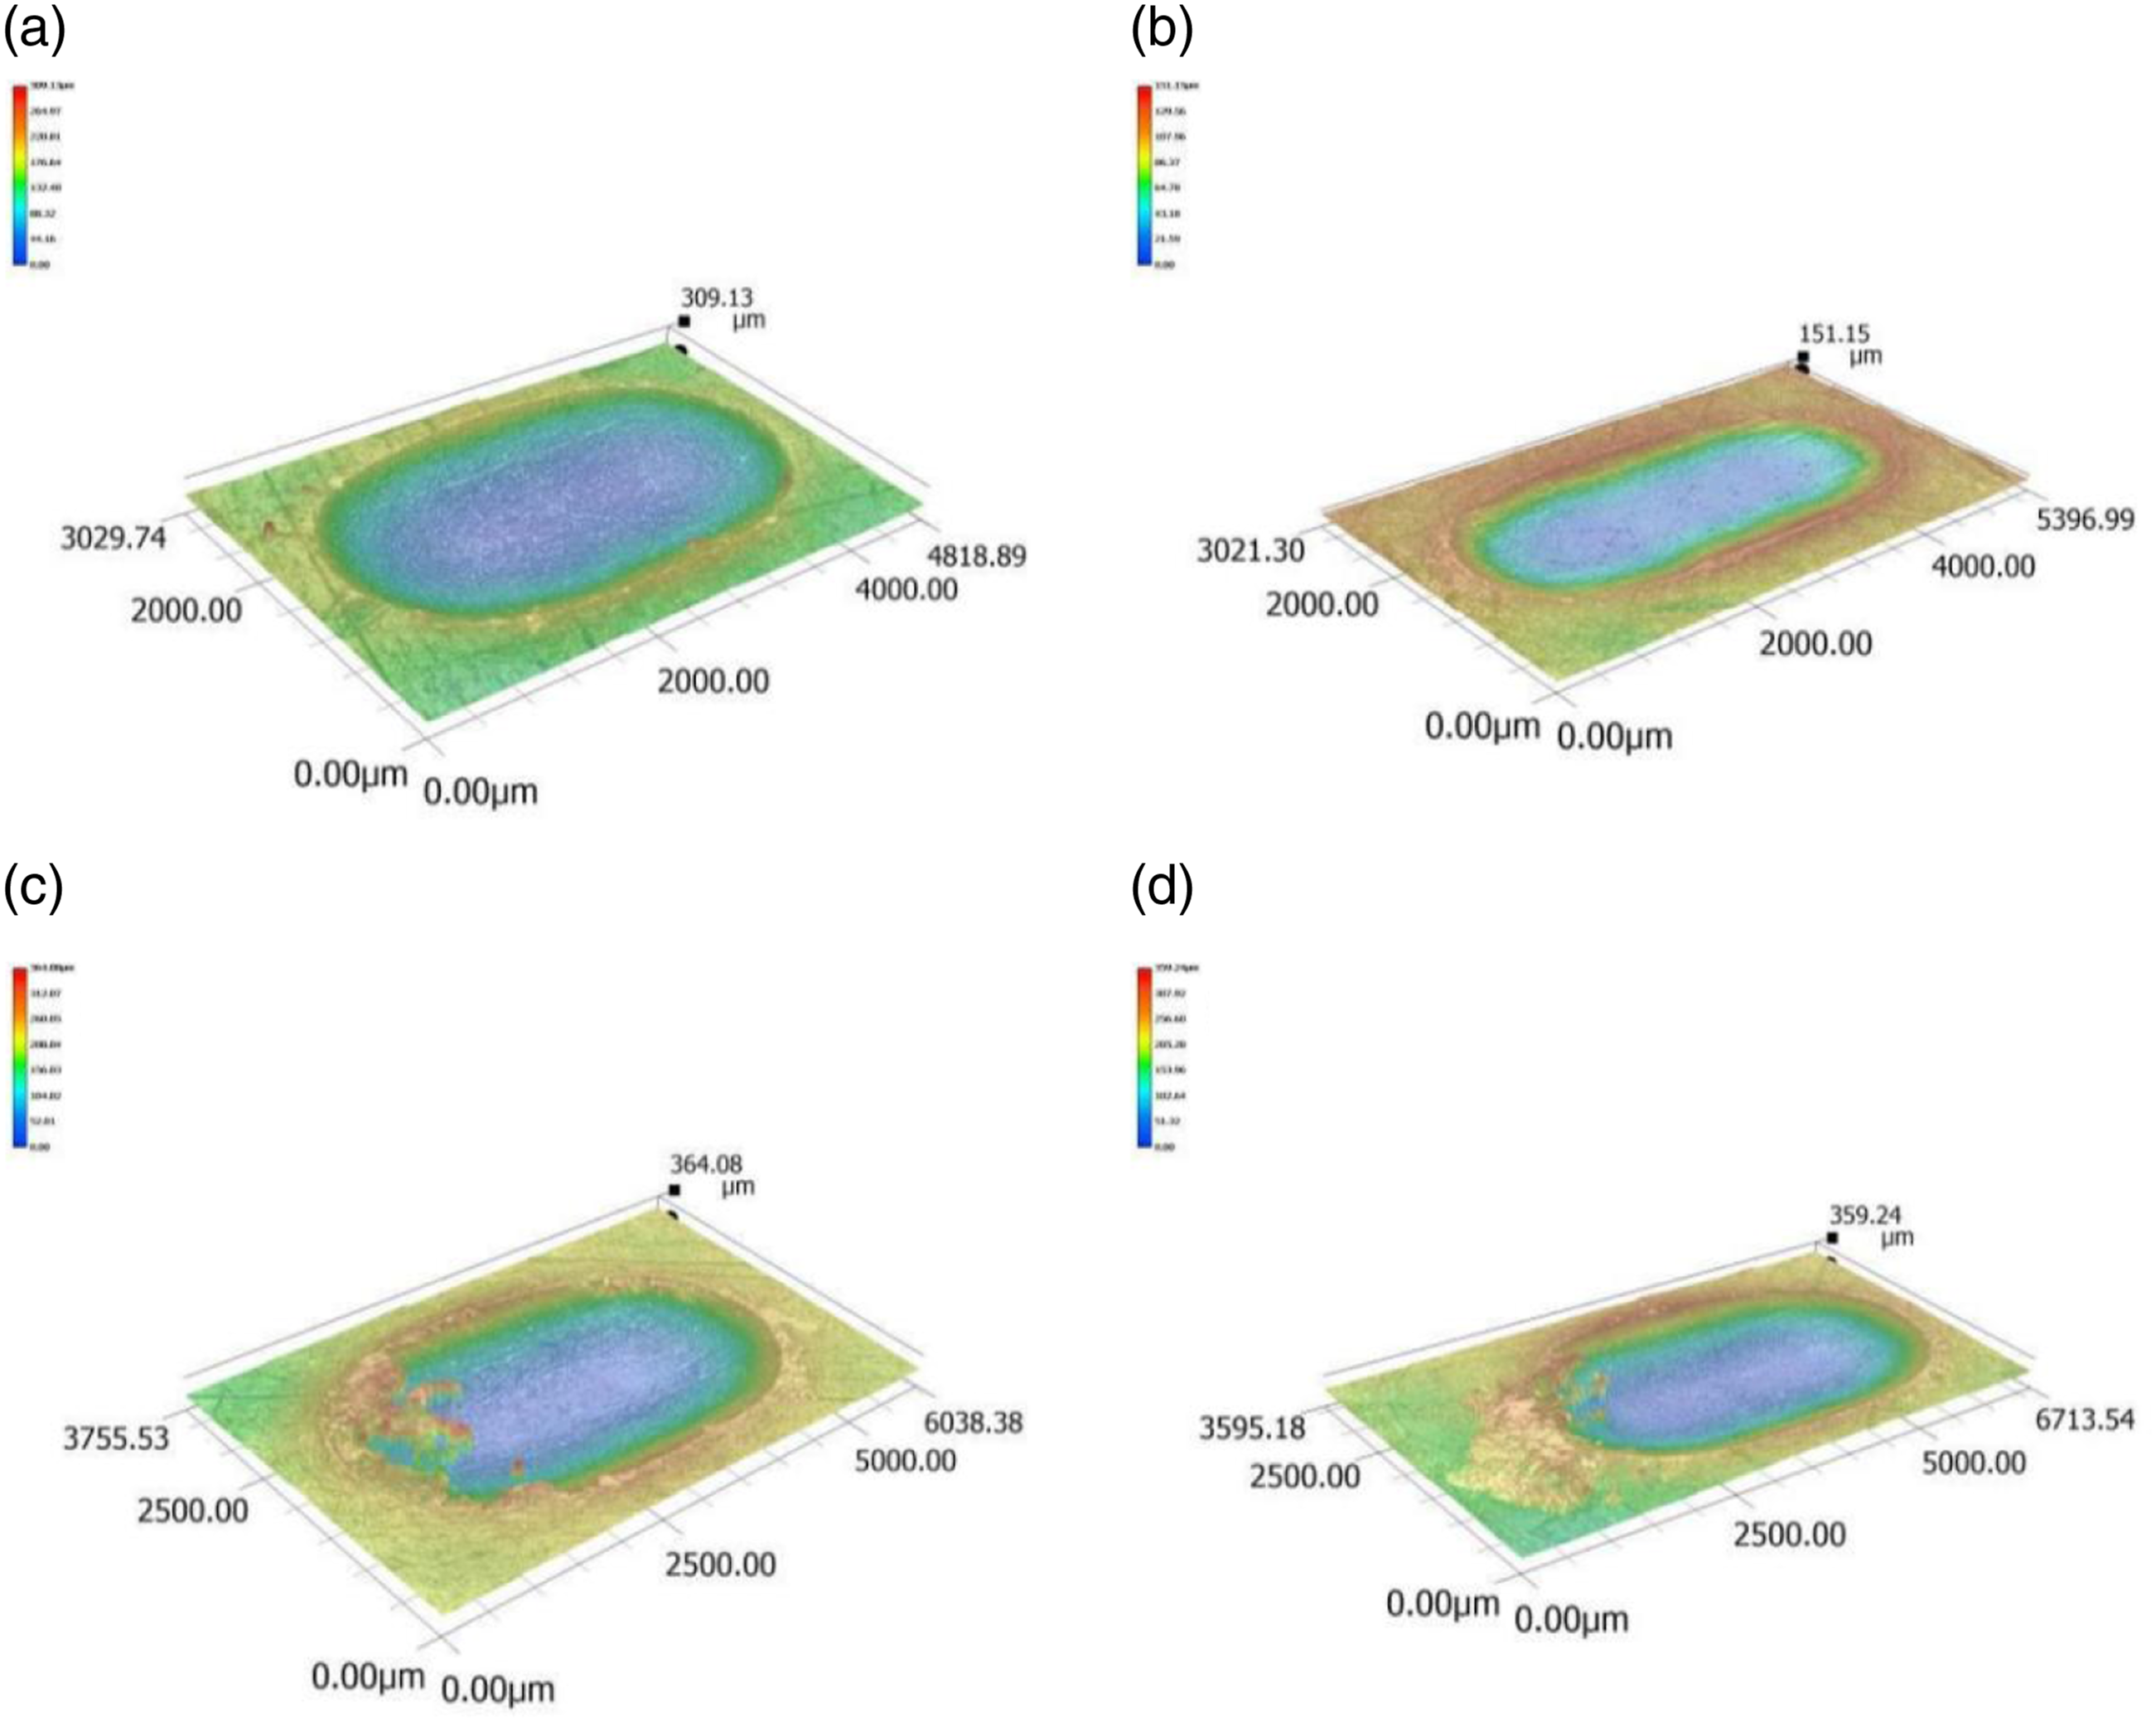
Figure 11 shows the wear rates of PTFE, PA, and PP composites. Compared with PTFE, PTFE-Cu shows much better wear resistance. Wear resistance was enhanced after adding Cu additive to PTFE for four main reasons. First, Cu additive improves the load carrying capacity of the composites.
11
Act as a hard phase,Cu additive priors to carry the load in the wear process and this lead to the reduction of compressive stress on the PTFE matrix. The enhanced adhesion between the PTFE-Cu and worn surface may increase its anti-wear performance.
43
Second, adding Cu additive to PTFE increases the thermal conductivity of polymer composites. As a result of the higher thermal conductivity than pure PTFE, frictional heat being generated during sliding was removed in time. Therefore, this prevent the increase of contact temperature
26
and thus reducing the wear of PTFE-matrix. Third, changes in the wear debris formation mechanism and smaller-size debris prevent damage to the PTFE ribbon structure.
40
Adding Cu particles to pure PTFE also caused a significant increase in hardness,and thus fracture and bending are reduced, which also prevent the polymer from being peeled off. These four factors restrict each other, altogether decreasing the wear rate of the PTFE composite. Wear rates of PTFE, PA, and PP composites for different sliding speeds and normal loads: (a) Tri.No5(30 mm/s, 6 MPa) (b) Tri.No4(50 mm/s, 6 MPa).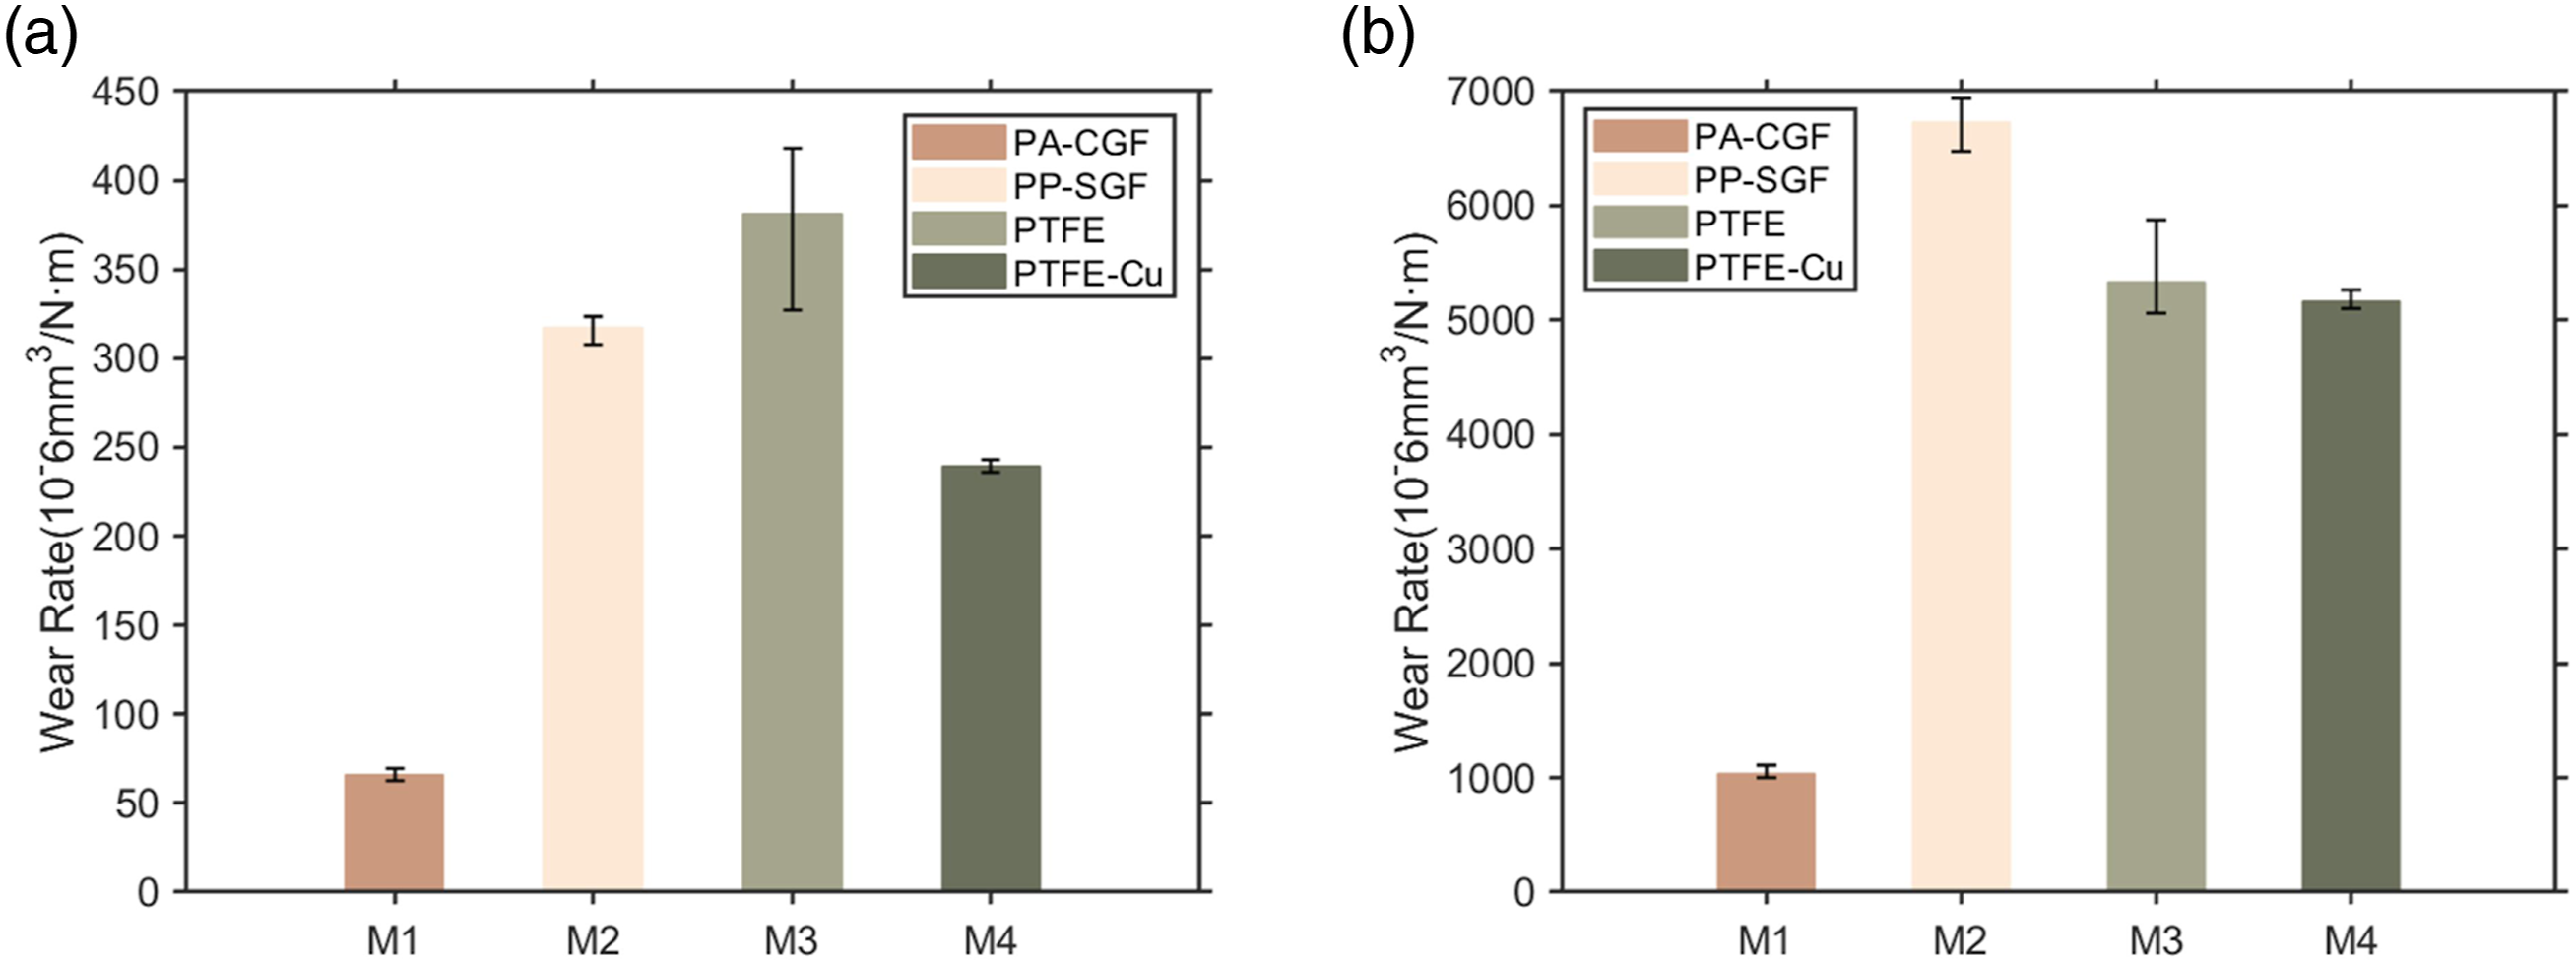
Previous researchers have also observed poor wear resistance in PTFE, PP, and PA.21,22 Our results are similar, but we did make some new observations. Our test results clearly indicate that PA-CGF provides the lowest levels of friction. Moreover, PTFE-Cu has a lower wear rate than PP-SGF. PA-CGF shows an almost six-fold lower wear rate than PTFE composites and five-fold lower wear rate than PP composites due to the effective incorporation of CGF.
We took wear volume measurements with a Keyence VHX-5000 on worn flat samples of different composites. Figure 12 shows the wear zone morphologies of PTFE, PA, and PP-based composites. We observed a significantly large-scale and abundant material transfer from the PP composite in particular (Figure 11(b)). By contrast, the worn surfaces of PA and PTFE composites are smoother. The optimal wear resistance of PA-CGF is most likely a result of the incorporation of CGF, which enhanced the hardness and plastic deformation resistance of the material while reducing the real contact area. GF has shown strong wear resistance and high load-carrying capacity in previous research.
41
GF filled into polymer also protects the PA matrix from damage, so the wear debris of our PA composite sample was of small scale. The R
a
values of PA composites (Figure 12(a)) are smallest among the four composites, which also enhanced the friction and wear behavior of the material. Furthermore, while the increase of sliding speed leads to dramatically higher wear rate for PTFE,PTFE-Cu and PP-SGF,the PA composites also can exhibit best wear resistance in the working conditions of extremely higher sliding speed,as Figure 11(b) can be seen. Wear surfaces of (a) PA-CGF, (b) PP-SGF, (c) PTFE, and (d) PTFE-Cu composites after ball-on-disc tests.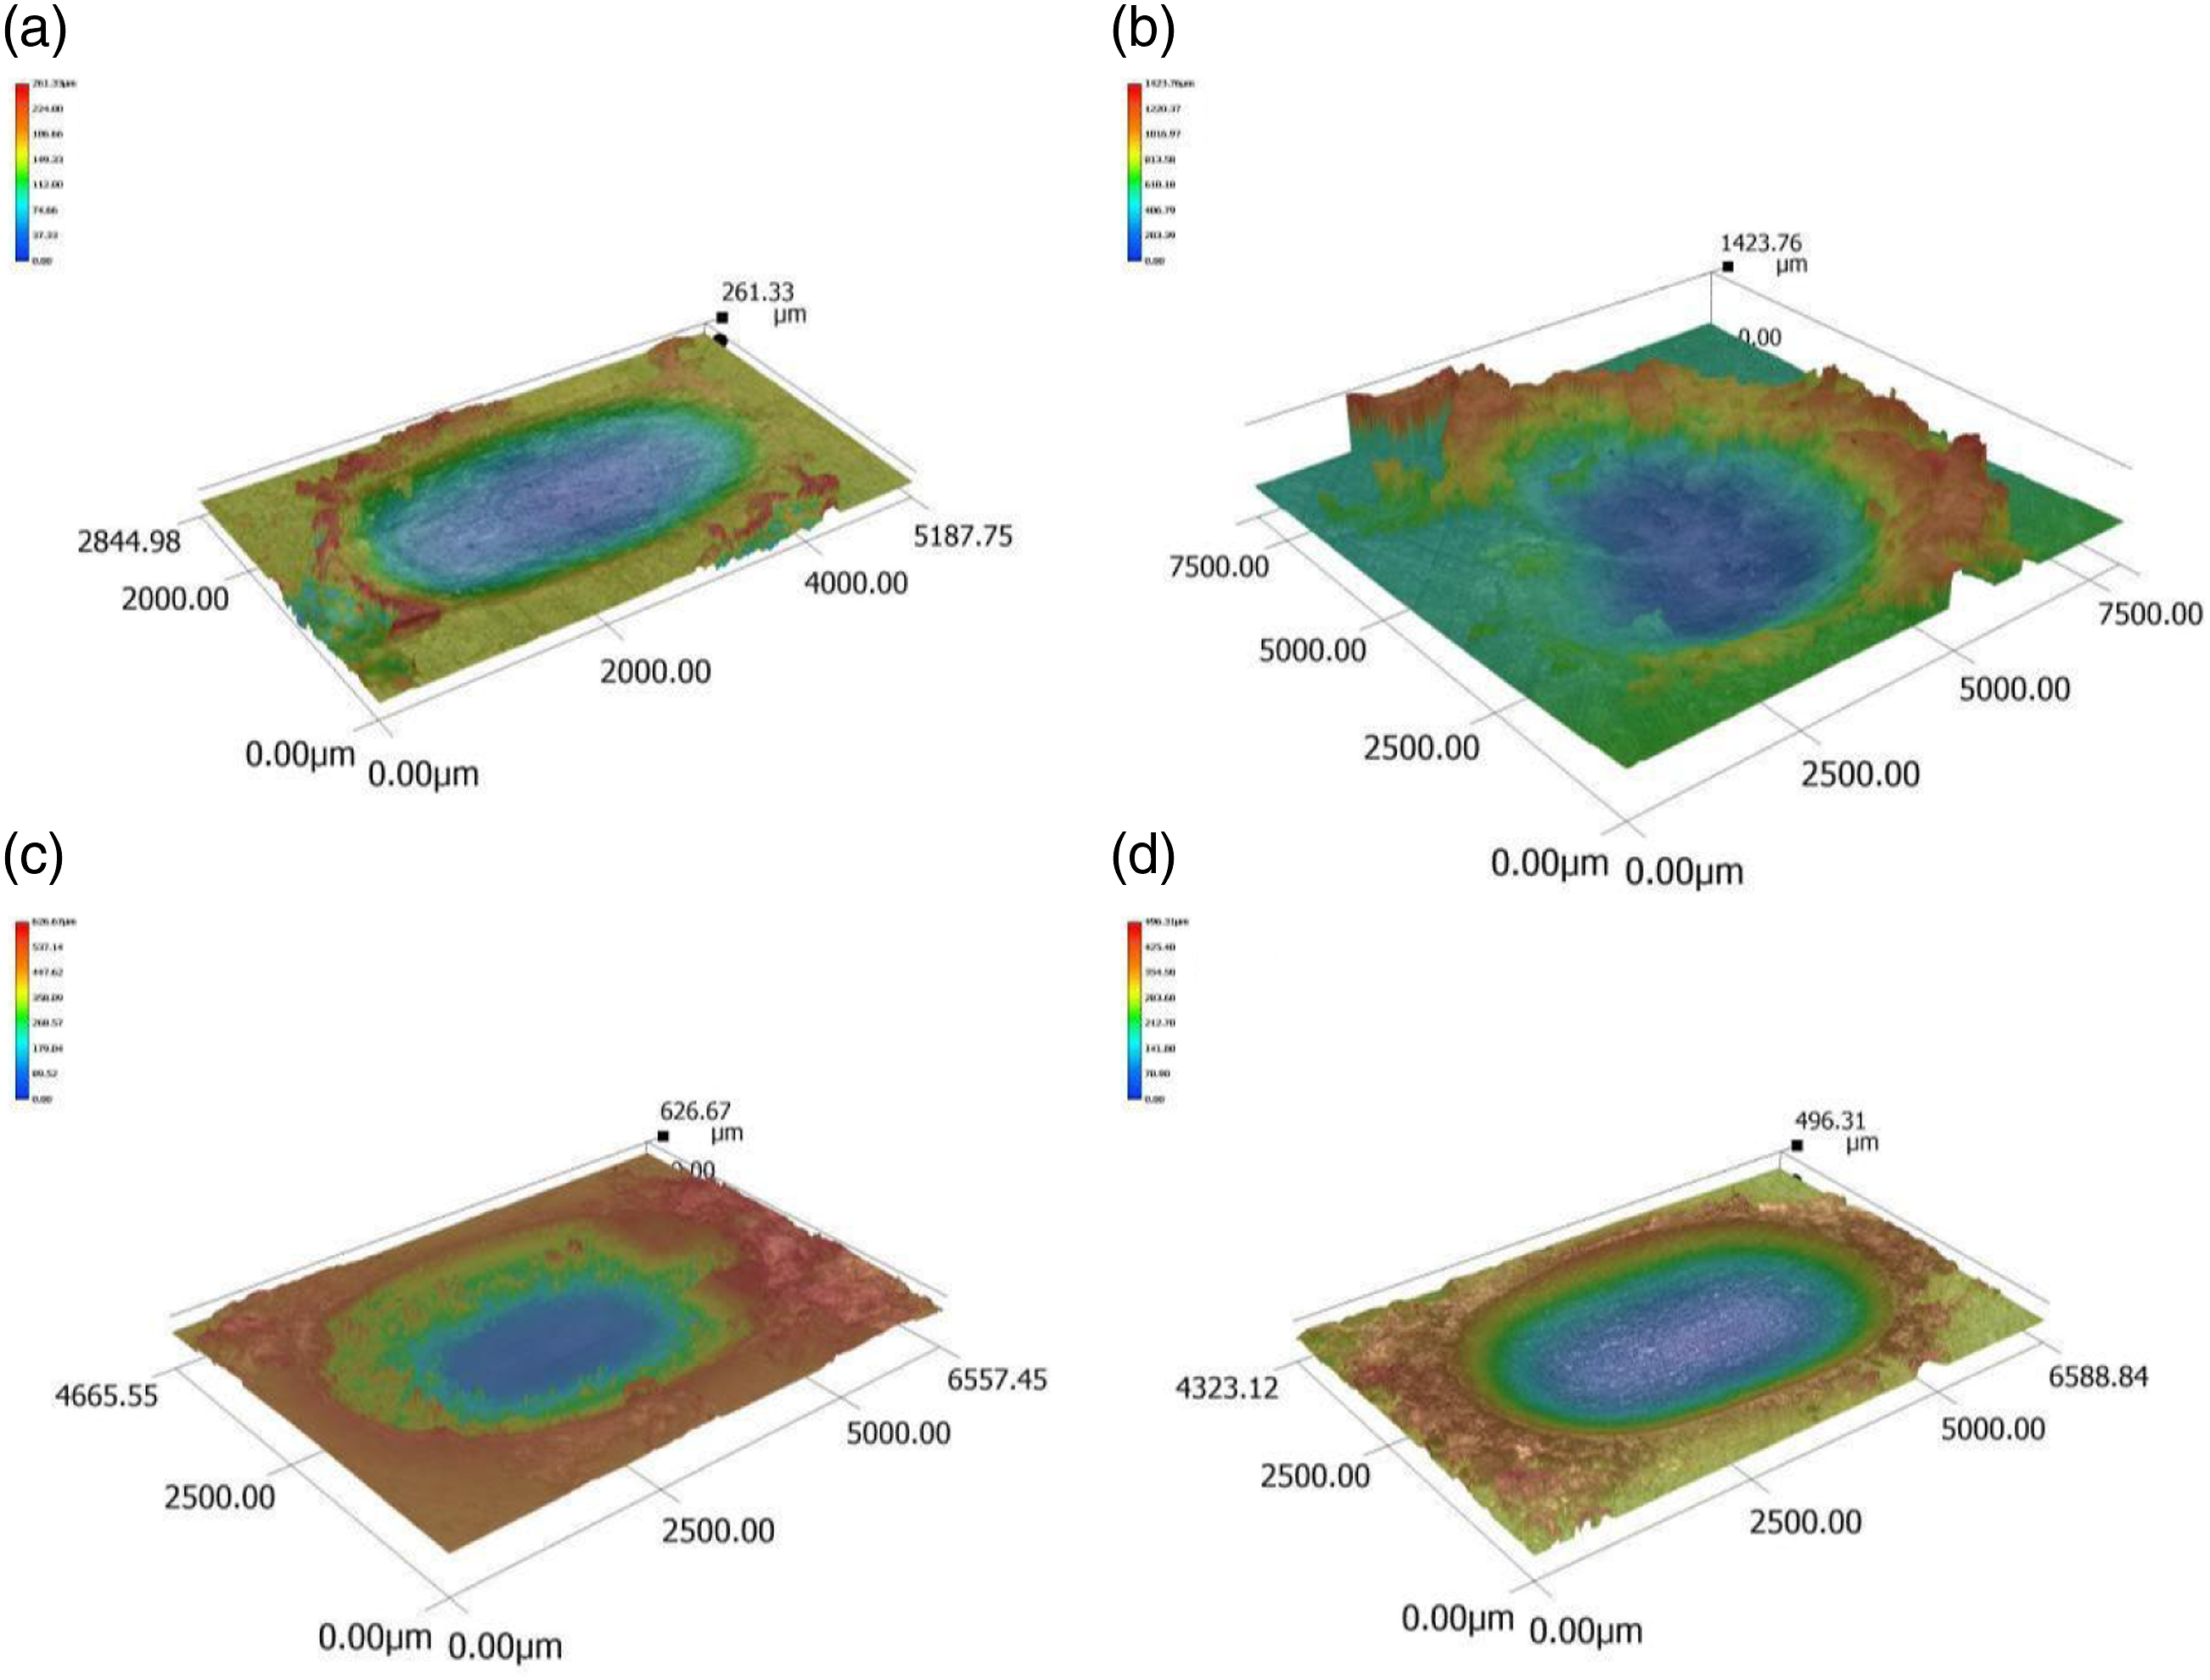
Influence on surface topography
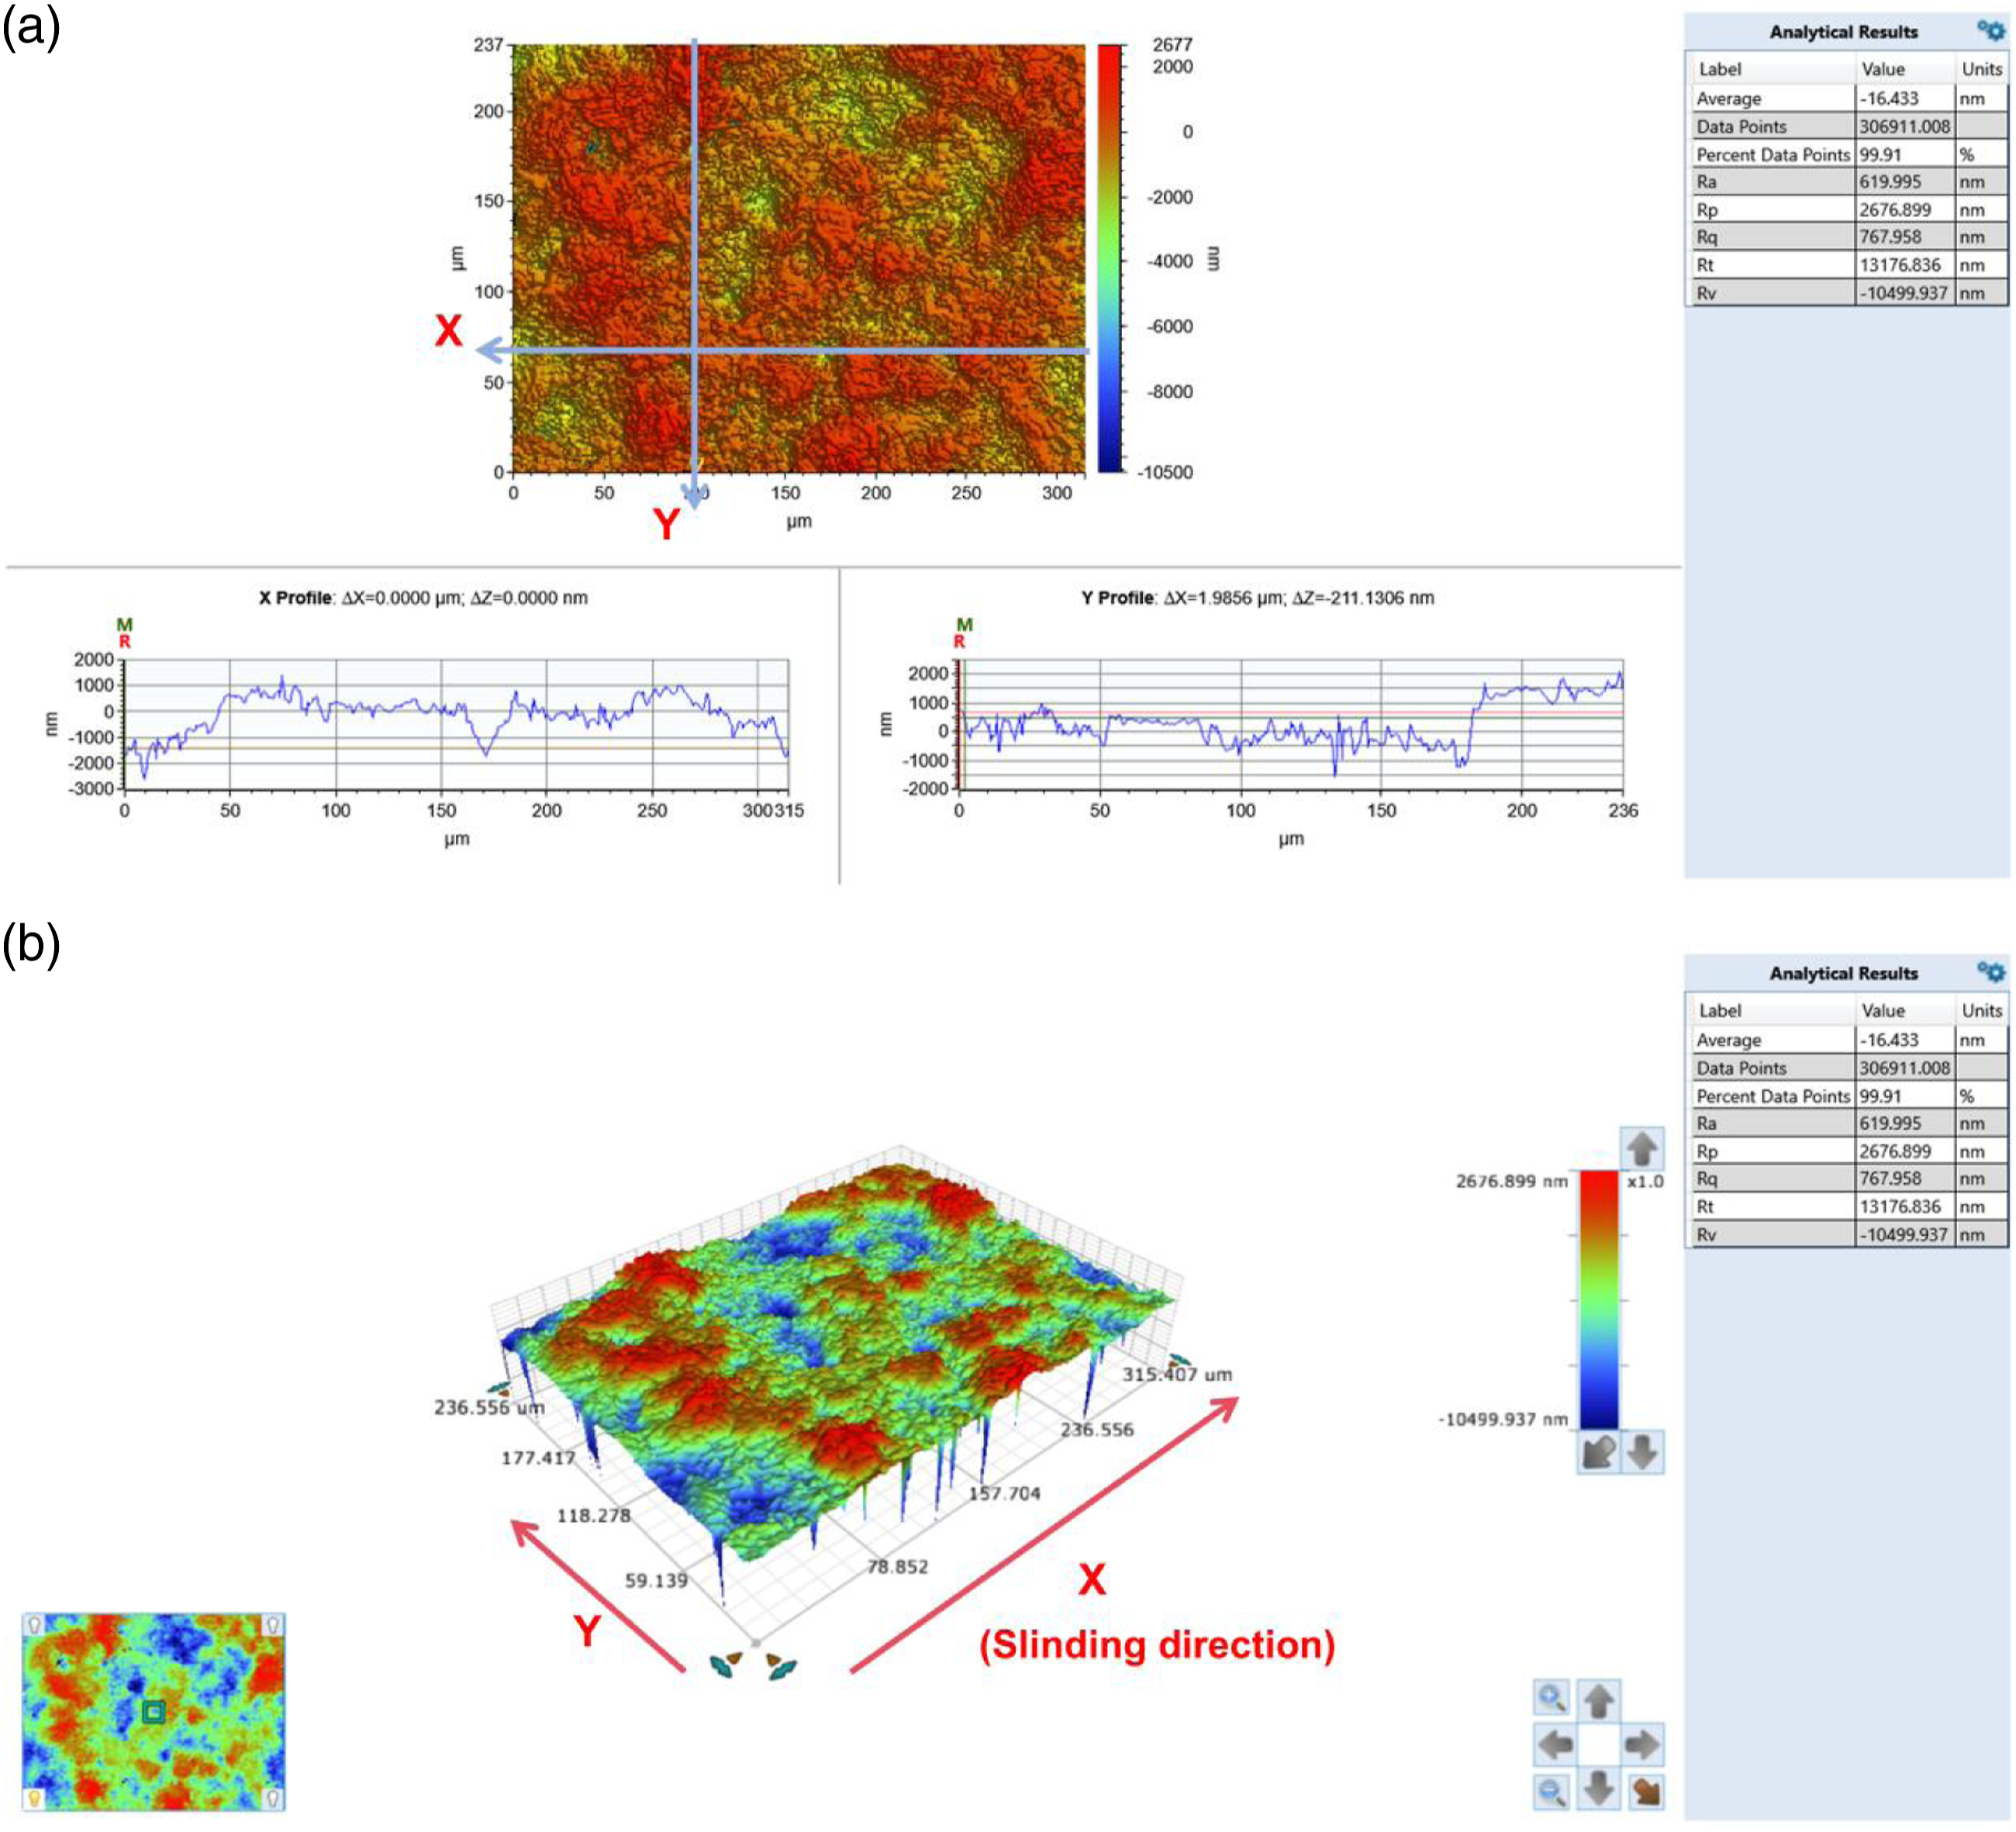
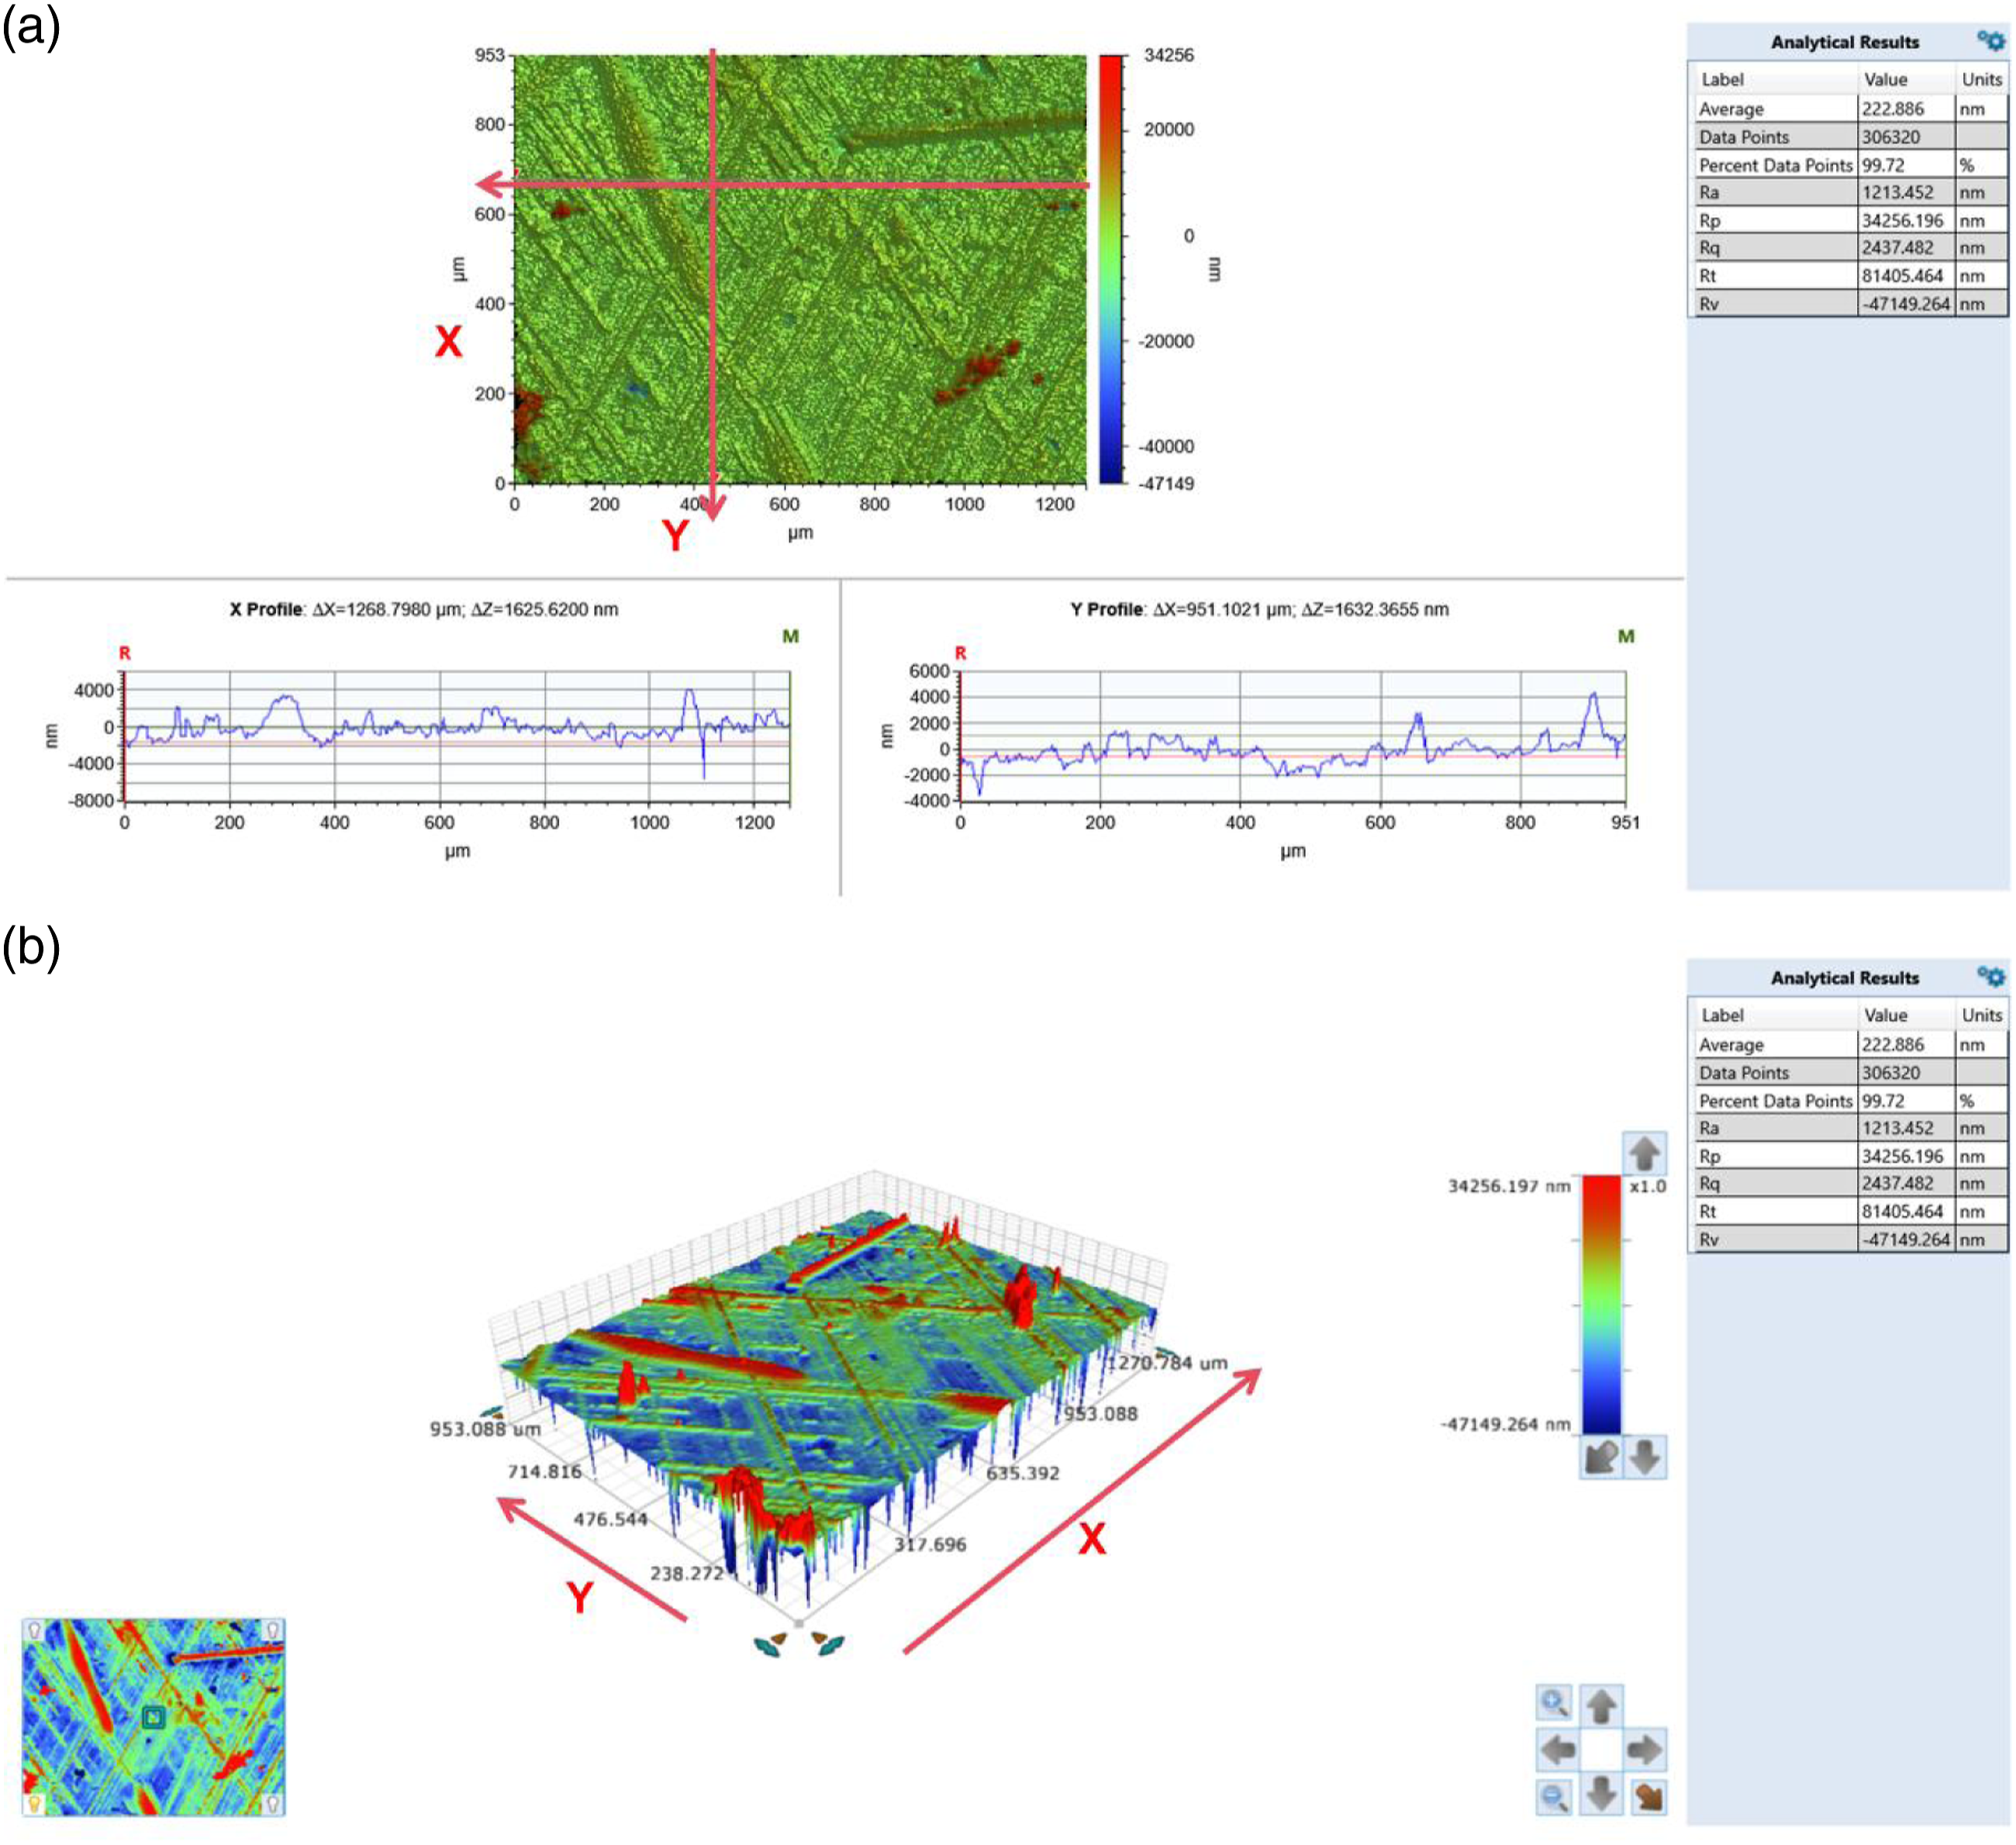
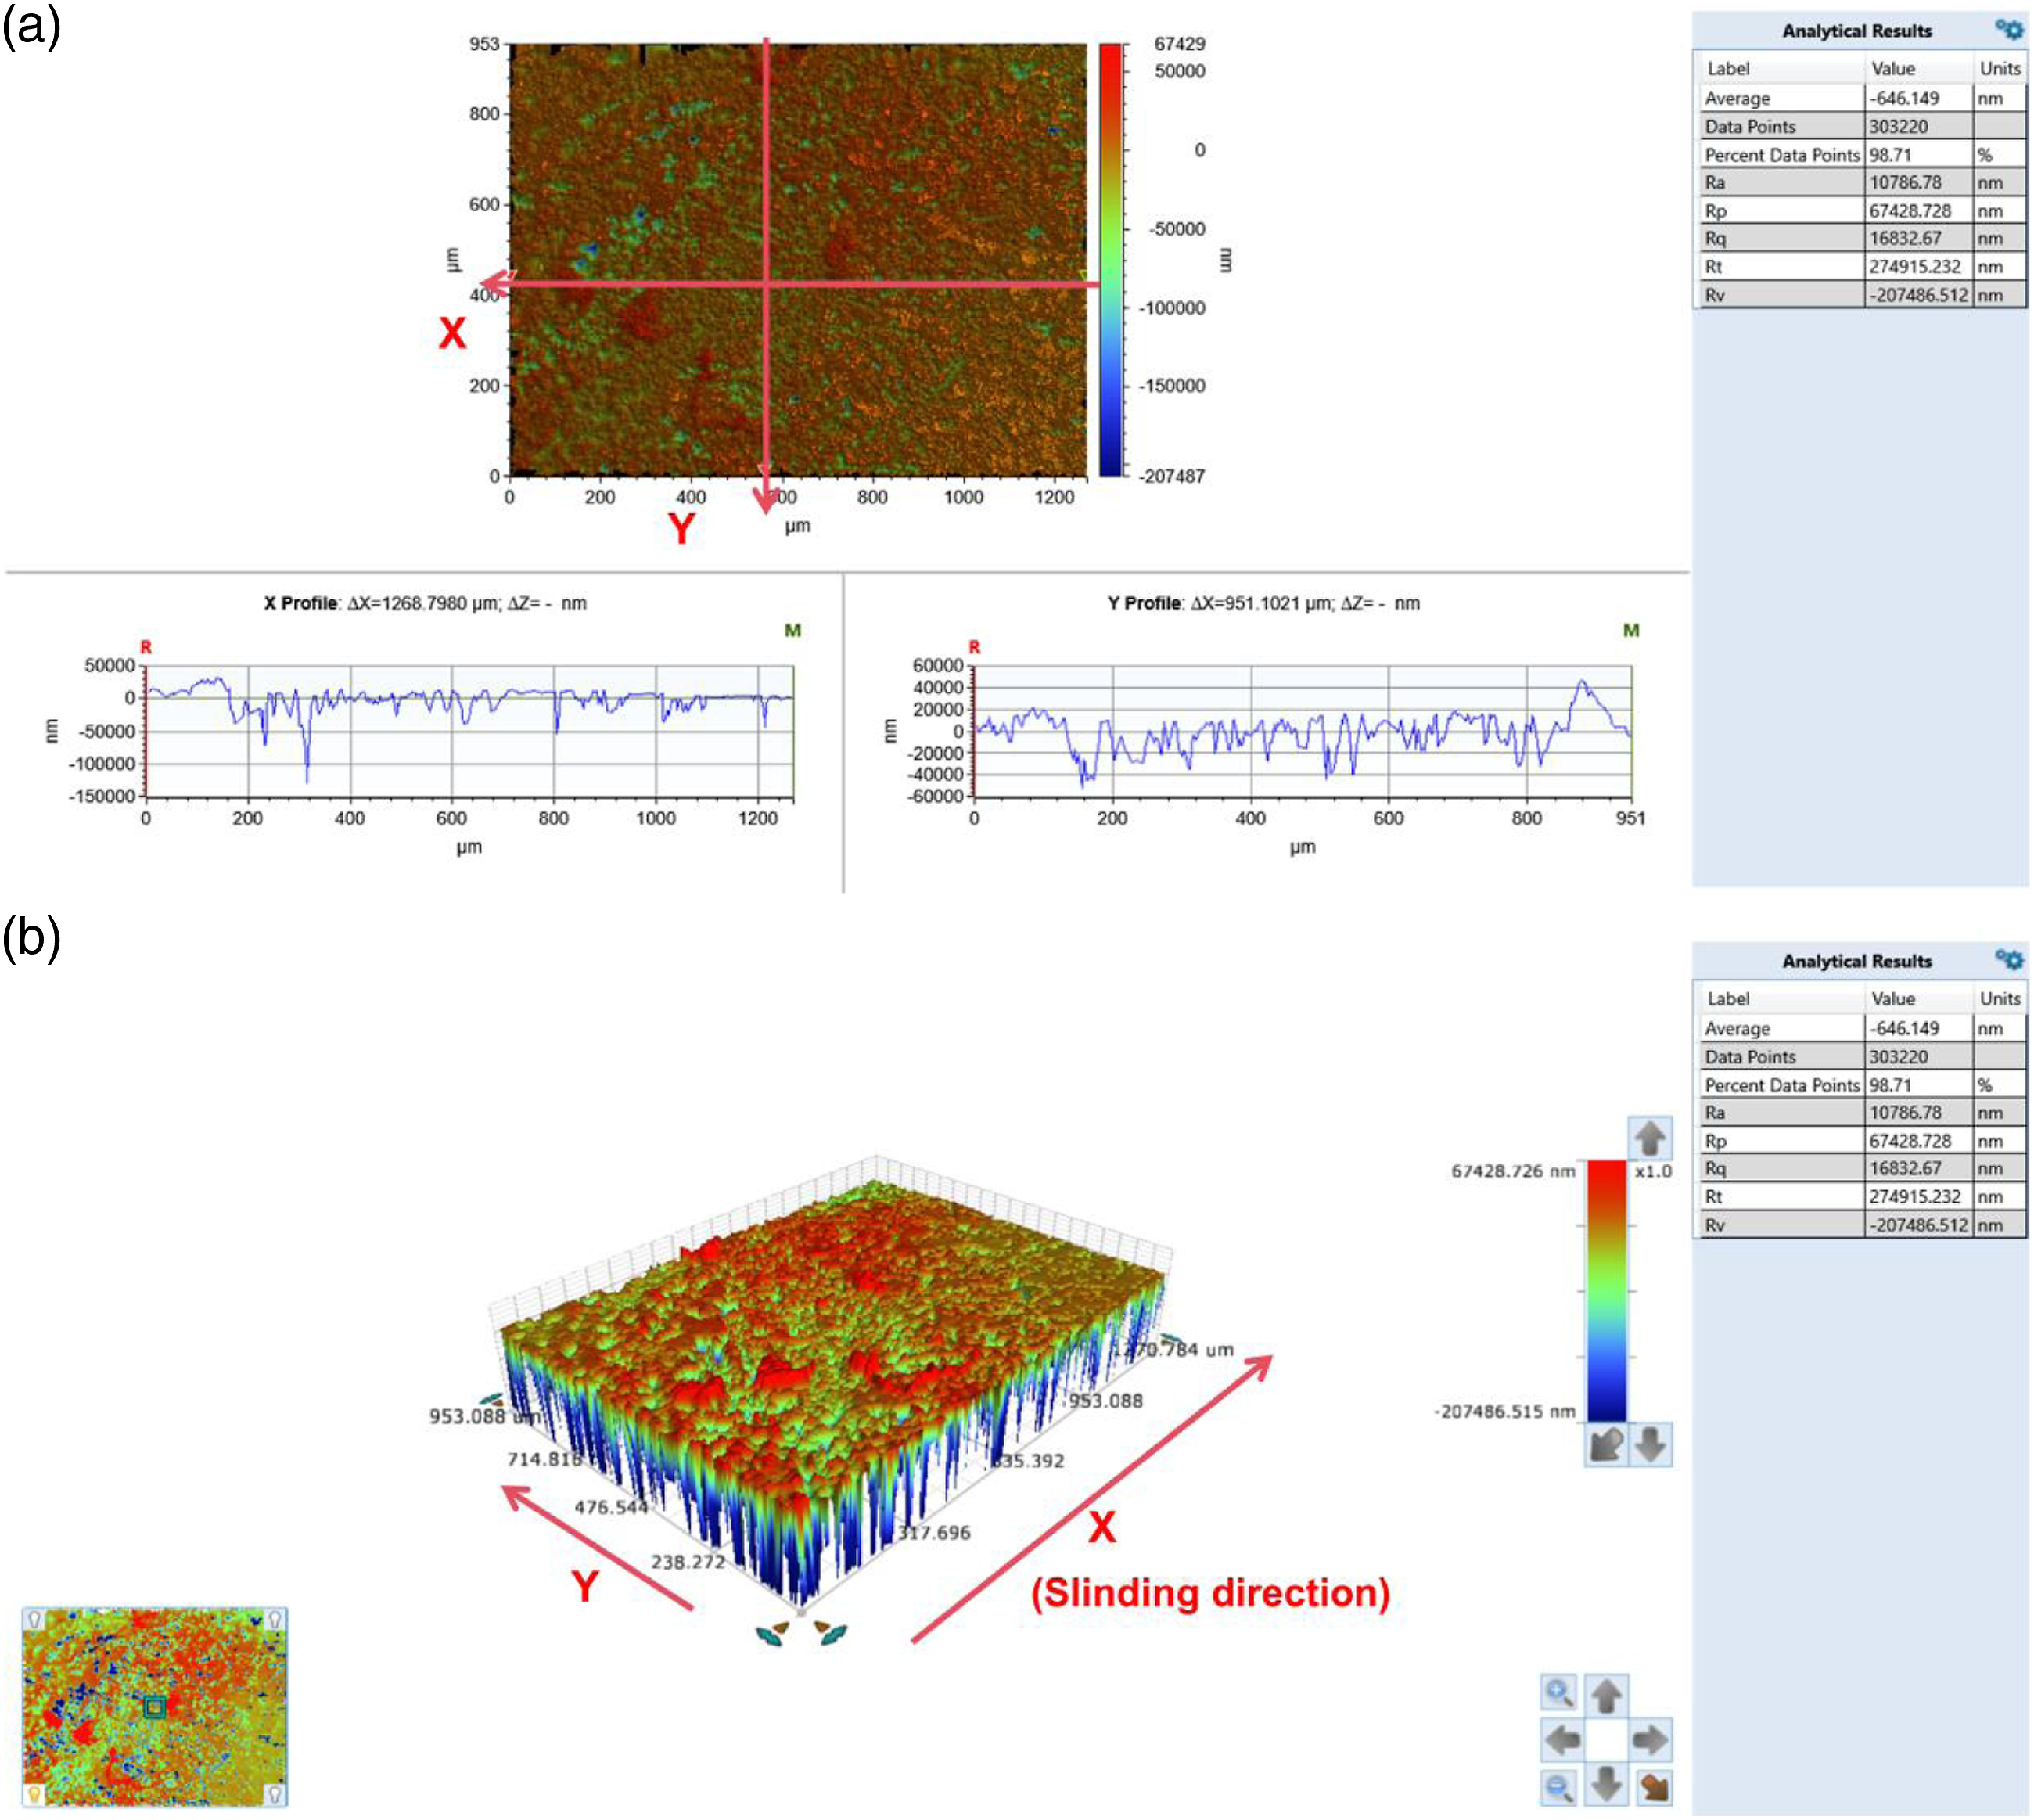
The 3D wear surface topographies of the pure PTFE as observed with an optical profiler are shown in Figures 13 and 14. The peaks and valleys on different surfaces of PTFE (wear zone, others) reflect surface irregularities which form the surface roughness. We used a reciprocating sliding rig used in the wear tests, so the surface profiles after testing were somewhat neat and linear. The surface profile of PTFE along the wear direction (x-axis) and the vertical direction (y-axis) are shown in Figure 13. Figure 14 shows the surface profile along the wear direction (x-axis) and the vertical direction (y-axis) of the wear zone. The maximum peak-valley value along x-axis is about 700 2D surface topographies(a) and 3D surface topographies(b) of pure PTFE. 2D surface topographies (a) and 3D surface topographies (b) in wear zone of pure PTFE.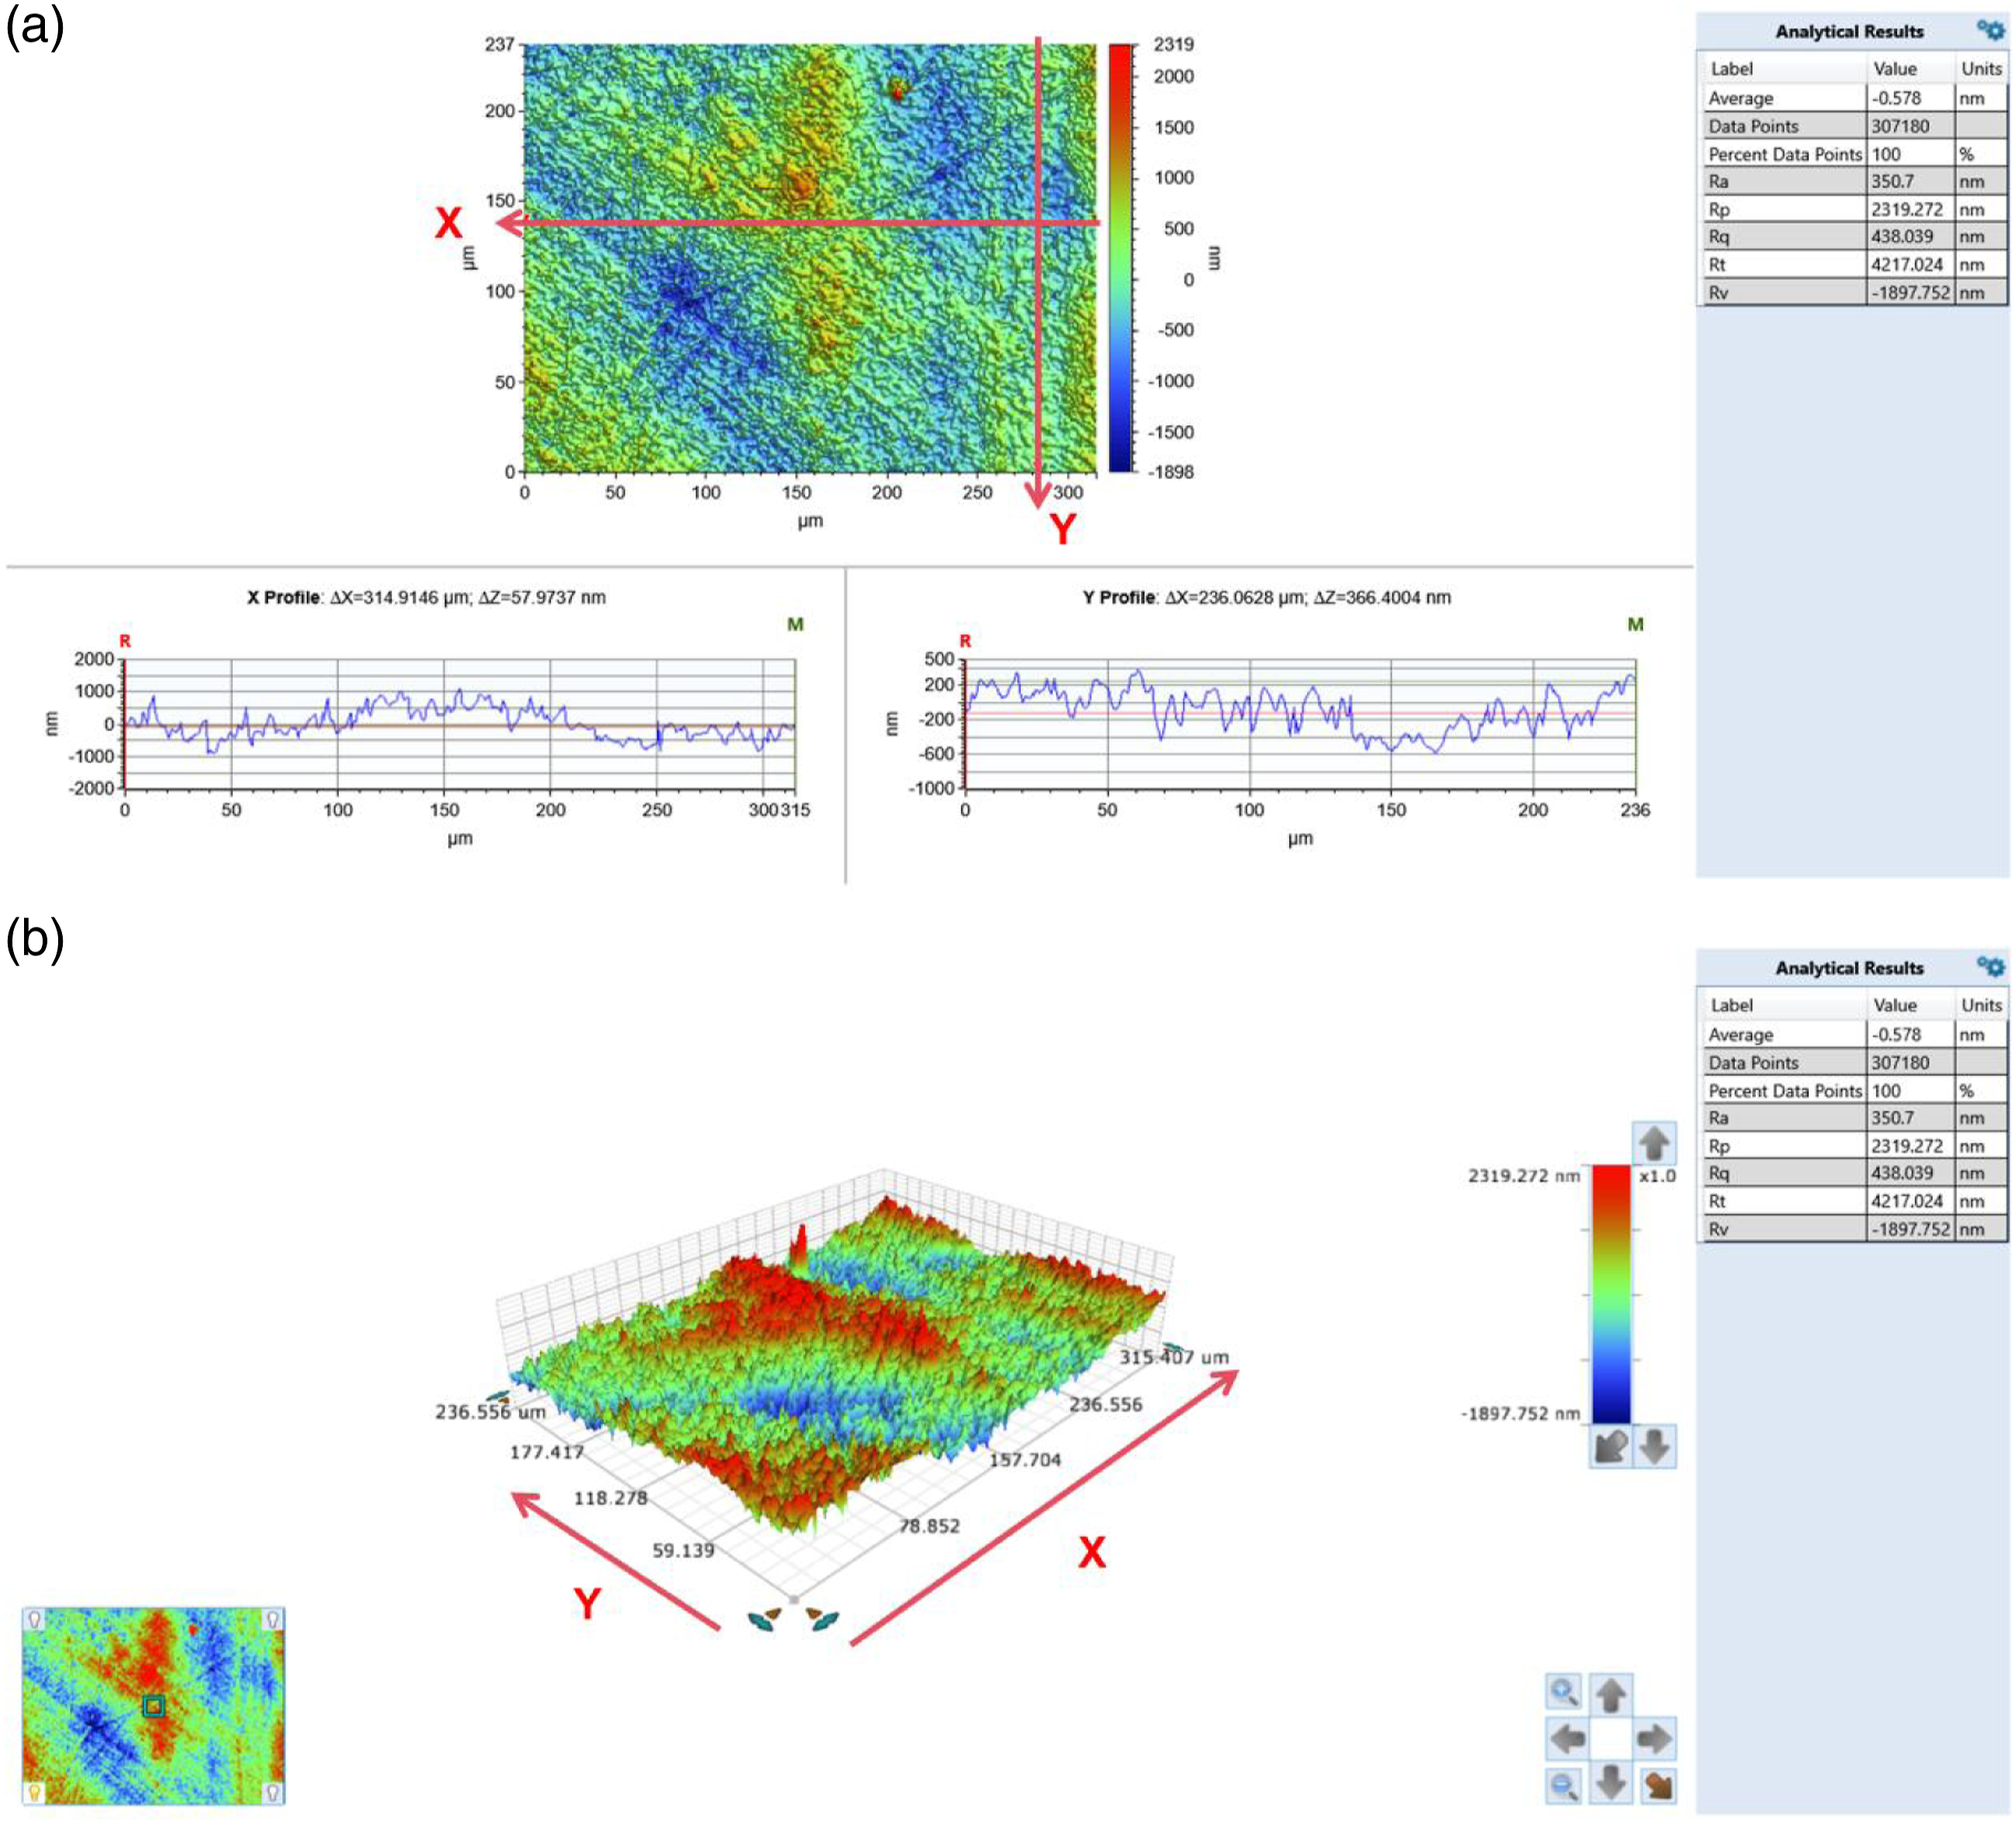
The 2D surface topographies (a) and 3D surface topographies (b) of PTFE-Cu. 2D surface topographies (a) and 3D surface topographies (b) in wear zone of PTFE-Cu.
And Figure 17 compares surface roughness values observed under different test conditions for PTFE (Figure 17(a)) and PTFE composites (Figure 17(b)). There is a trend toward increasing surface roughness as contact pressure and sliding speed increase. The surface roughness of pure PTFE is lower than those of PTFE-based composites. This is mainly because adding Cu particles to pure PTFE increases surface roughness significantly.11,44 Surface roughness of (a) PTFE and (b) PTFE-based composites in different test parameters.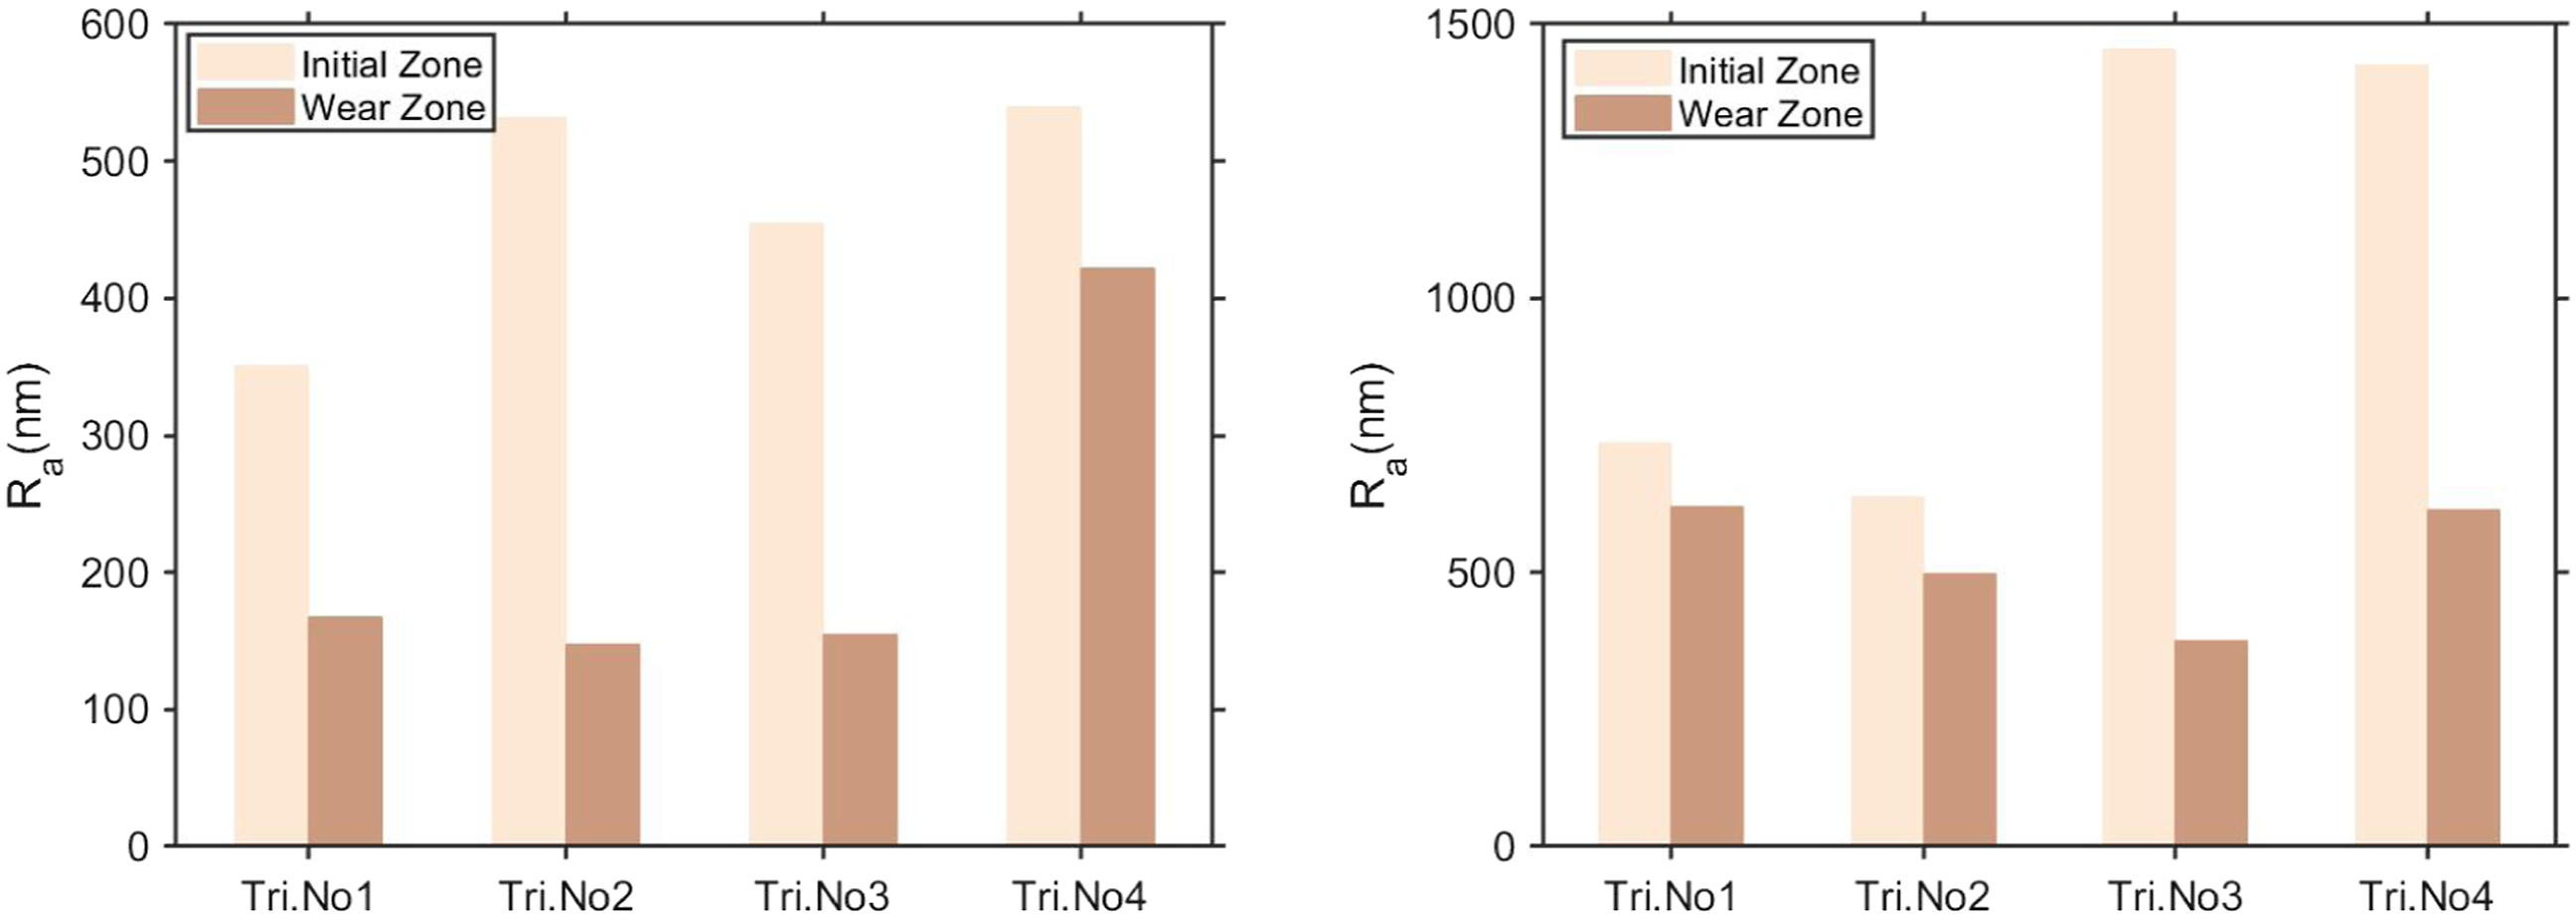
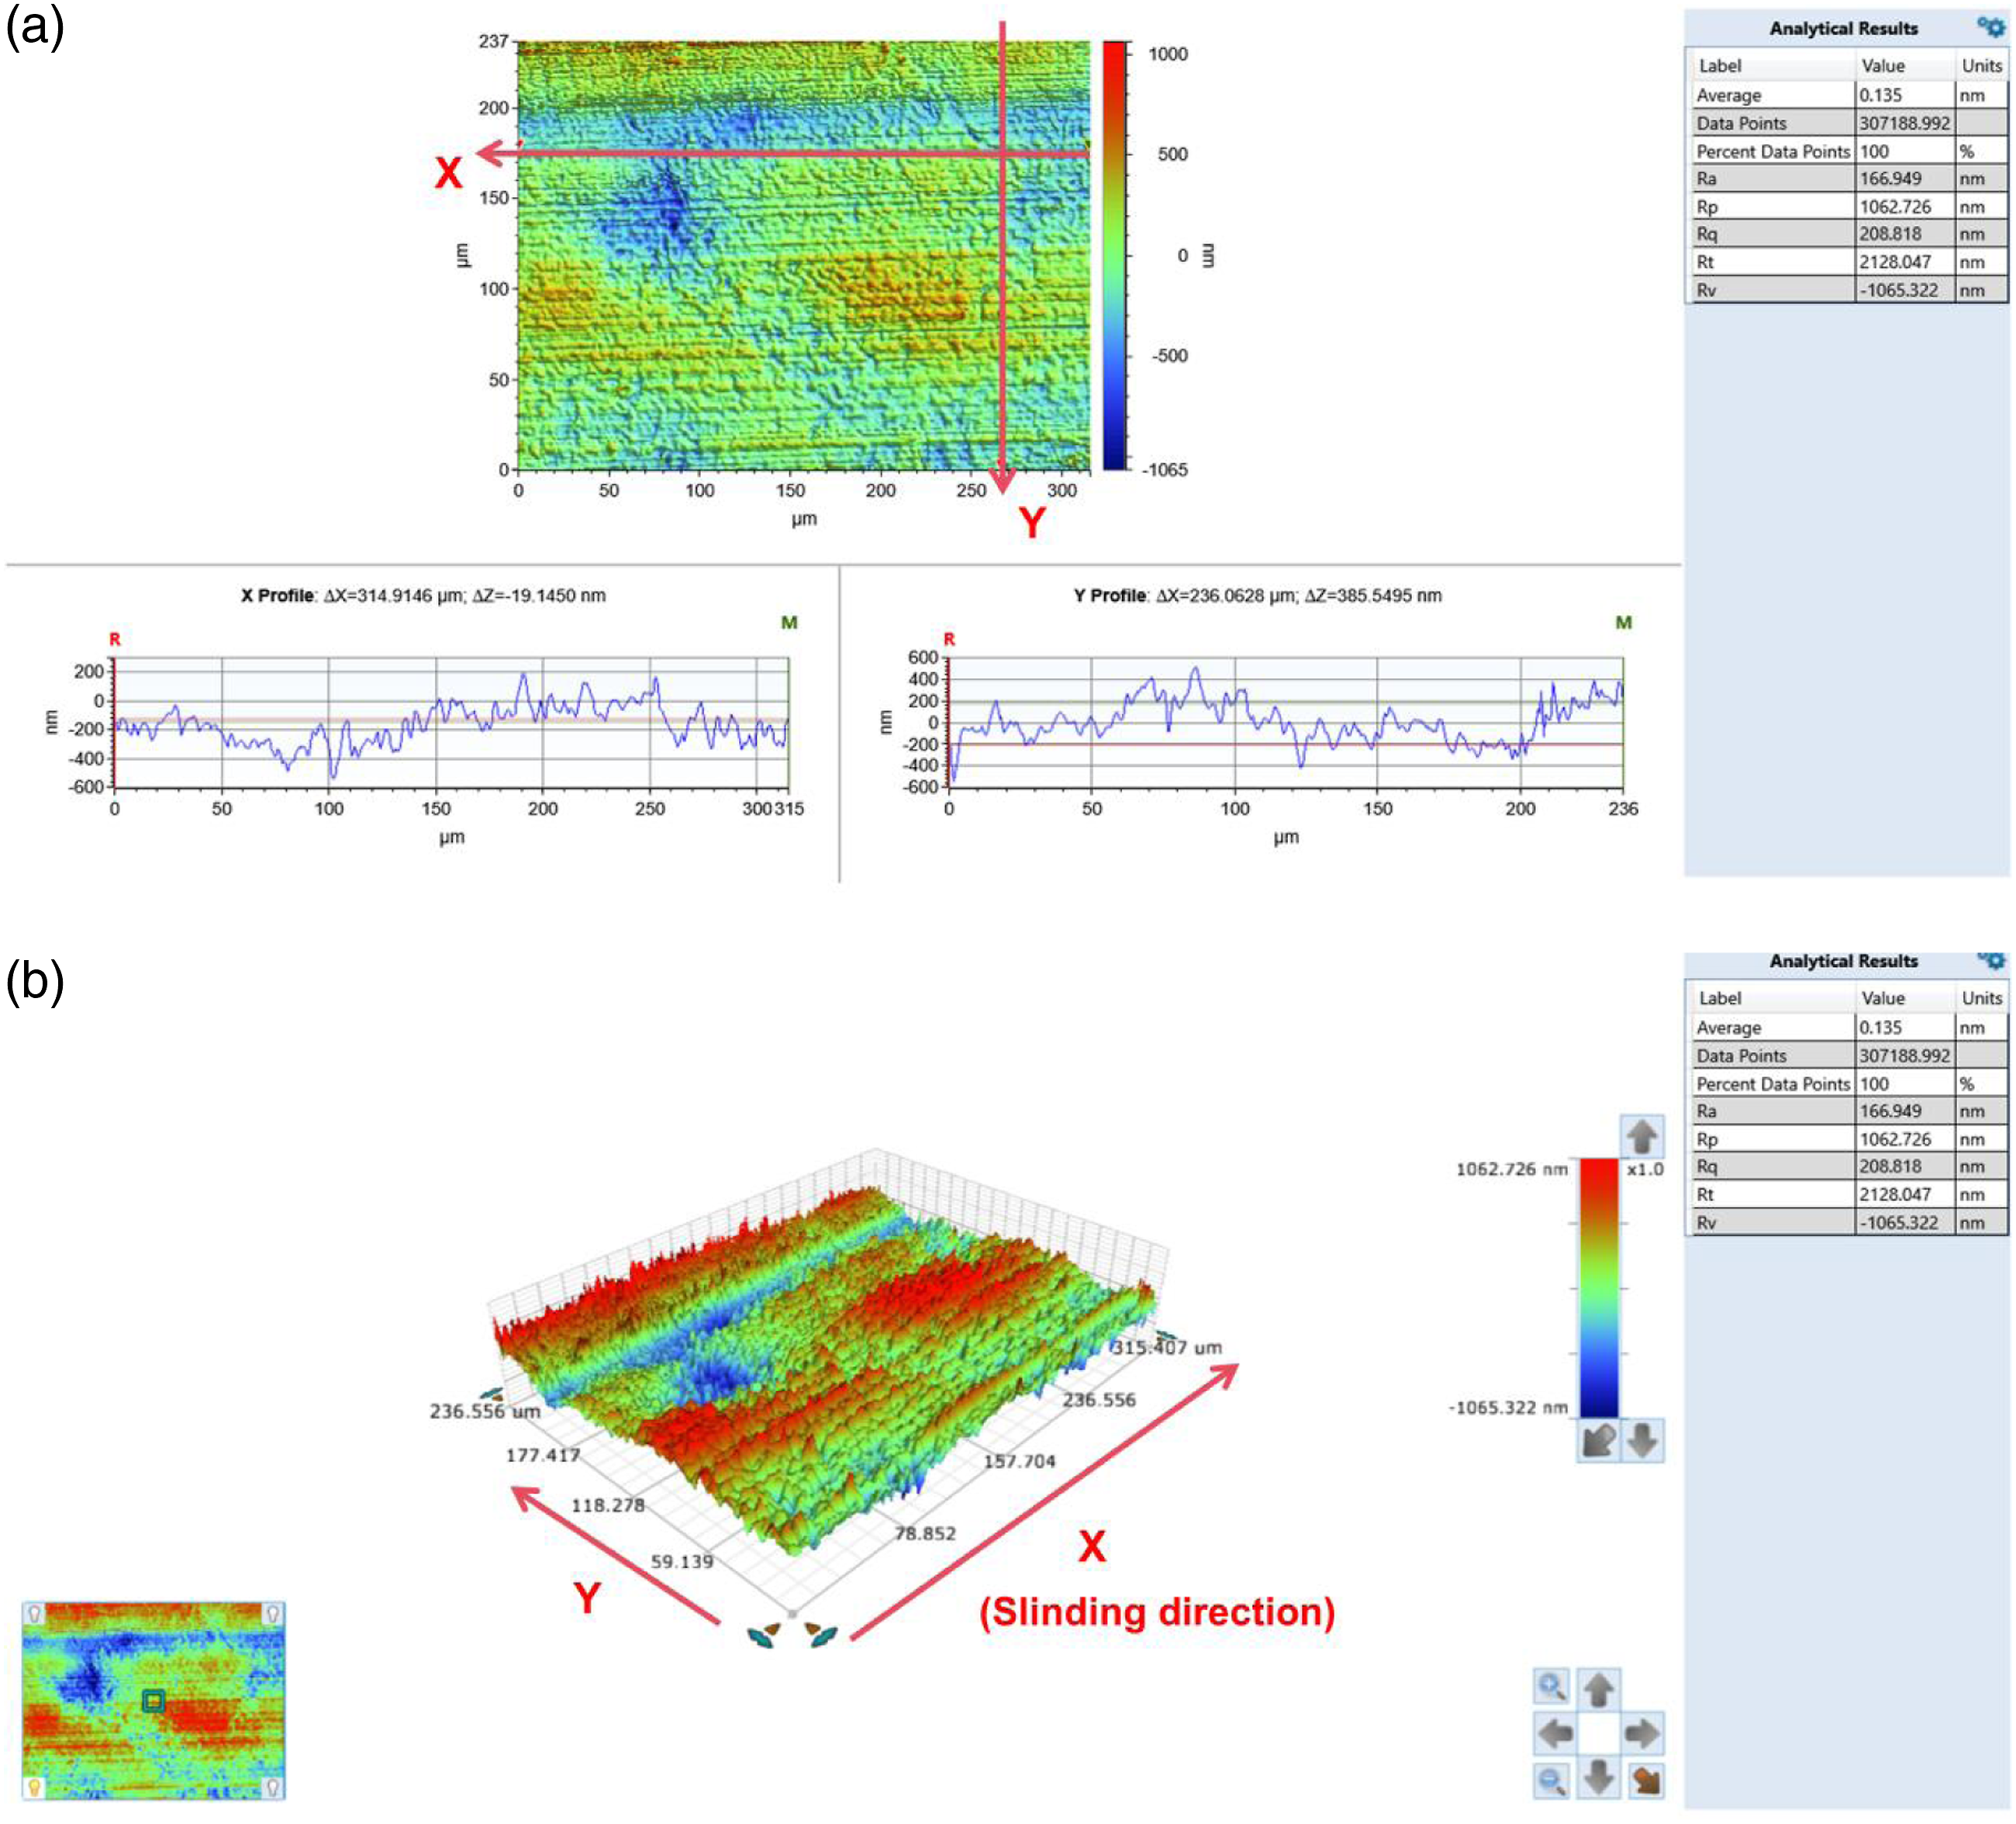
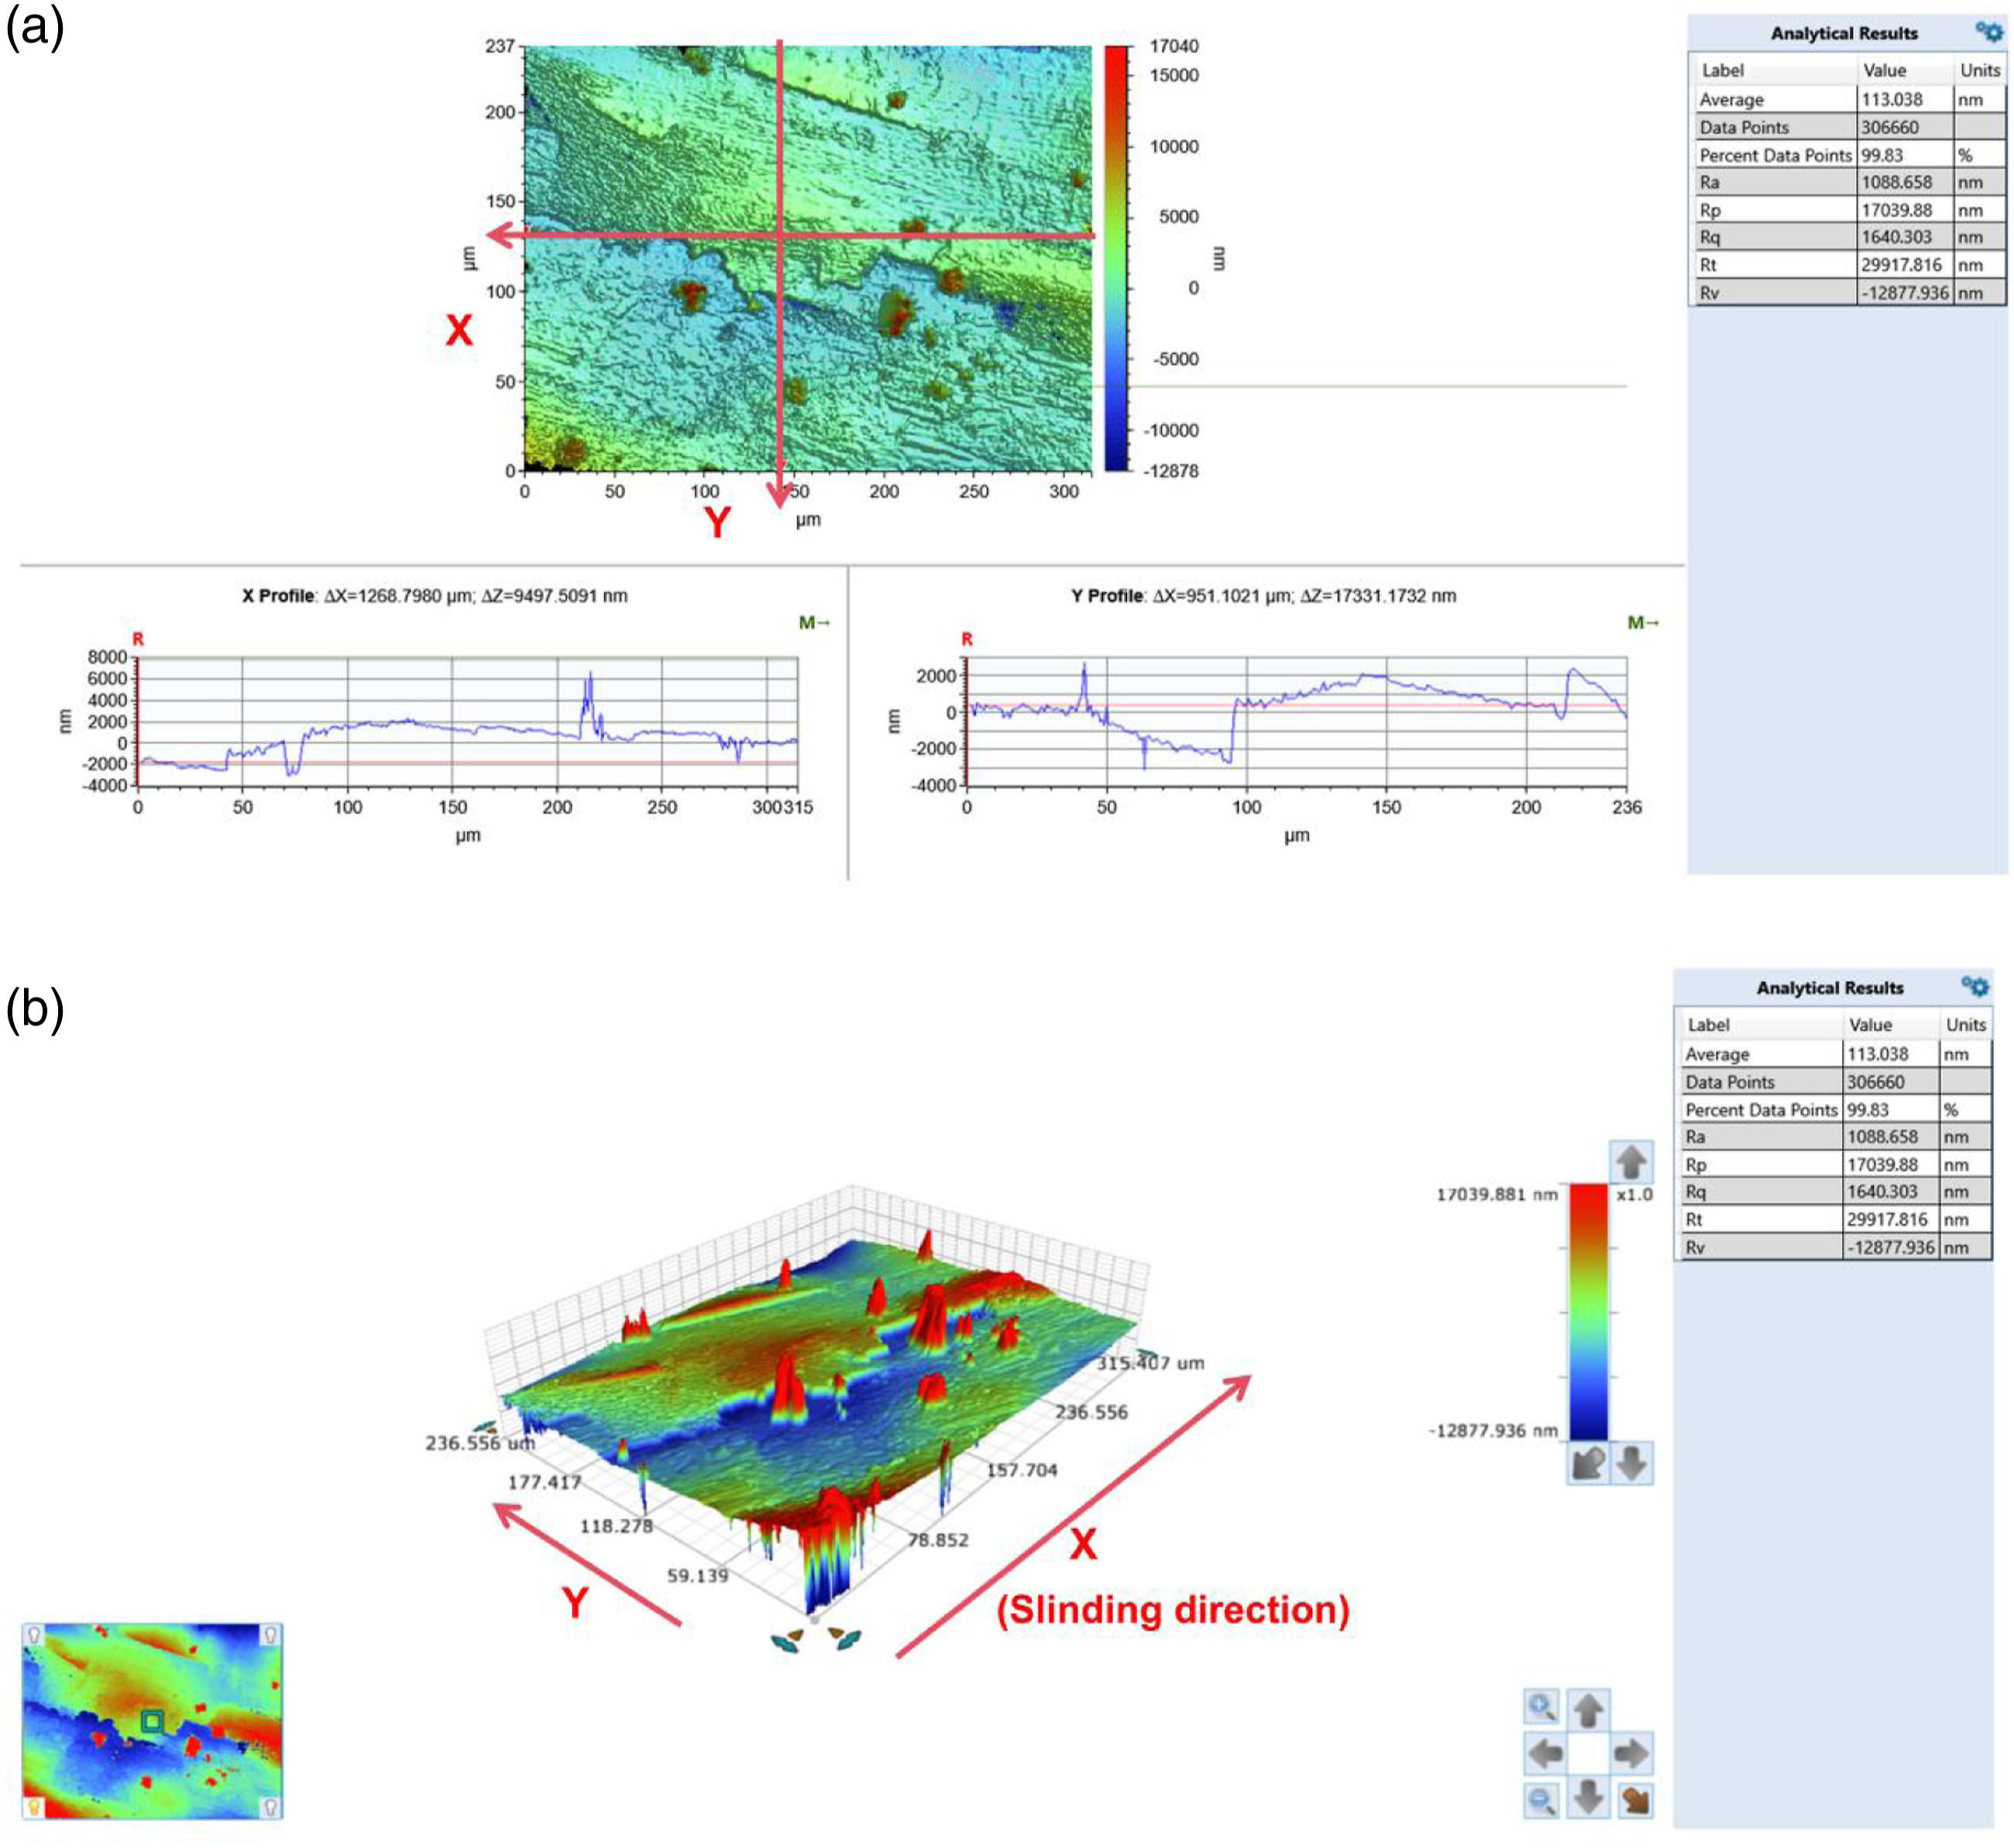
Interestingly, the surface roughness of PA- and PP-based composites significantly increased after the wear tests (Figures 18–21). In the wear zone, the surface profiles along the wear direction (x-axis) and vertical direction (y-axis) were observed as shown in Figures 19 and 21. The maximum peak-valley value of PA-based composites alone the x-axis is about 9000 2D surface topographies (a) and 3D surface topographies (b) of PA composites. 2D surface topographies (a) and 3D surface topographies (b) in wear zones of PA composites. 2D surface topographies (a) and 3D surface topographies (b) of PP composites. 2D surface topographies (a) and 3D surface topographies (b) in wear zones of PP composites.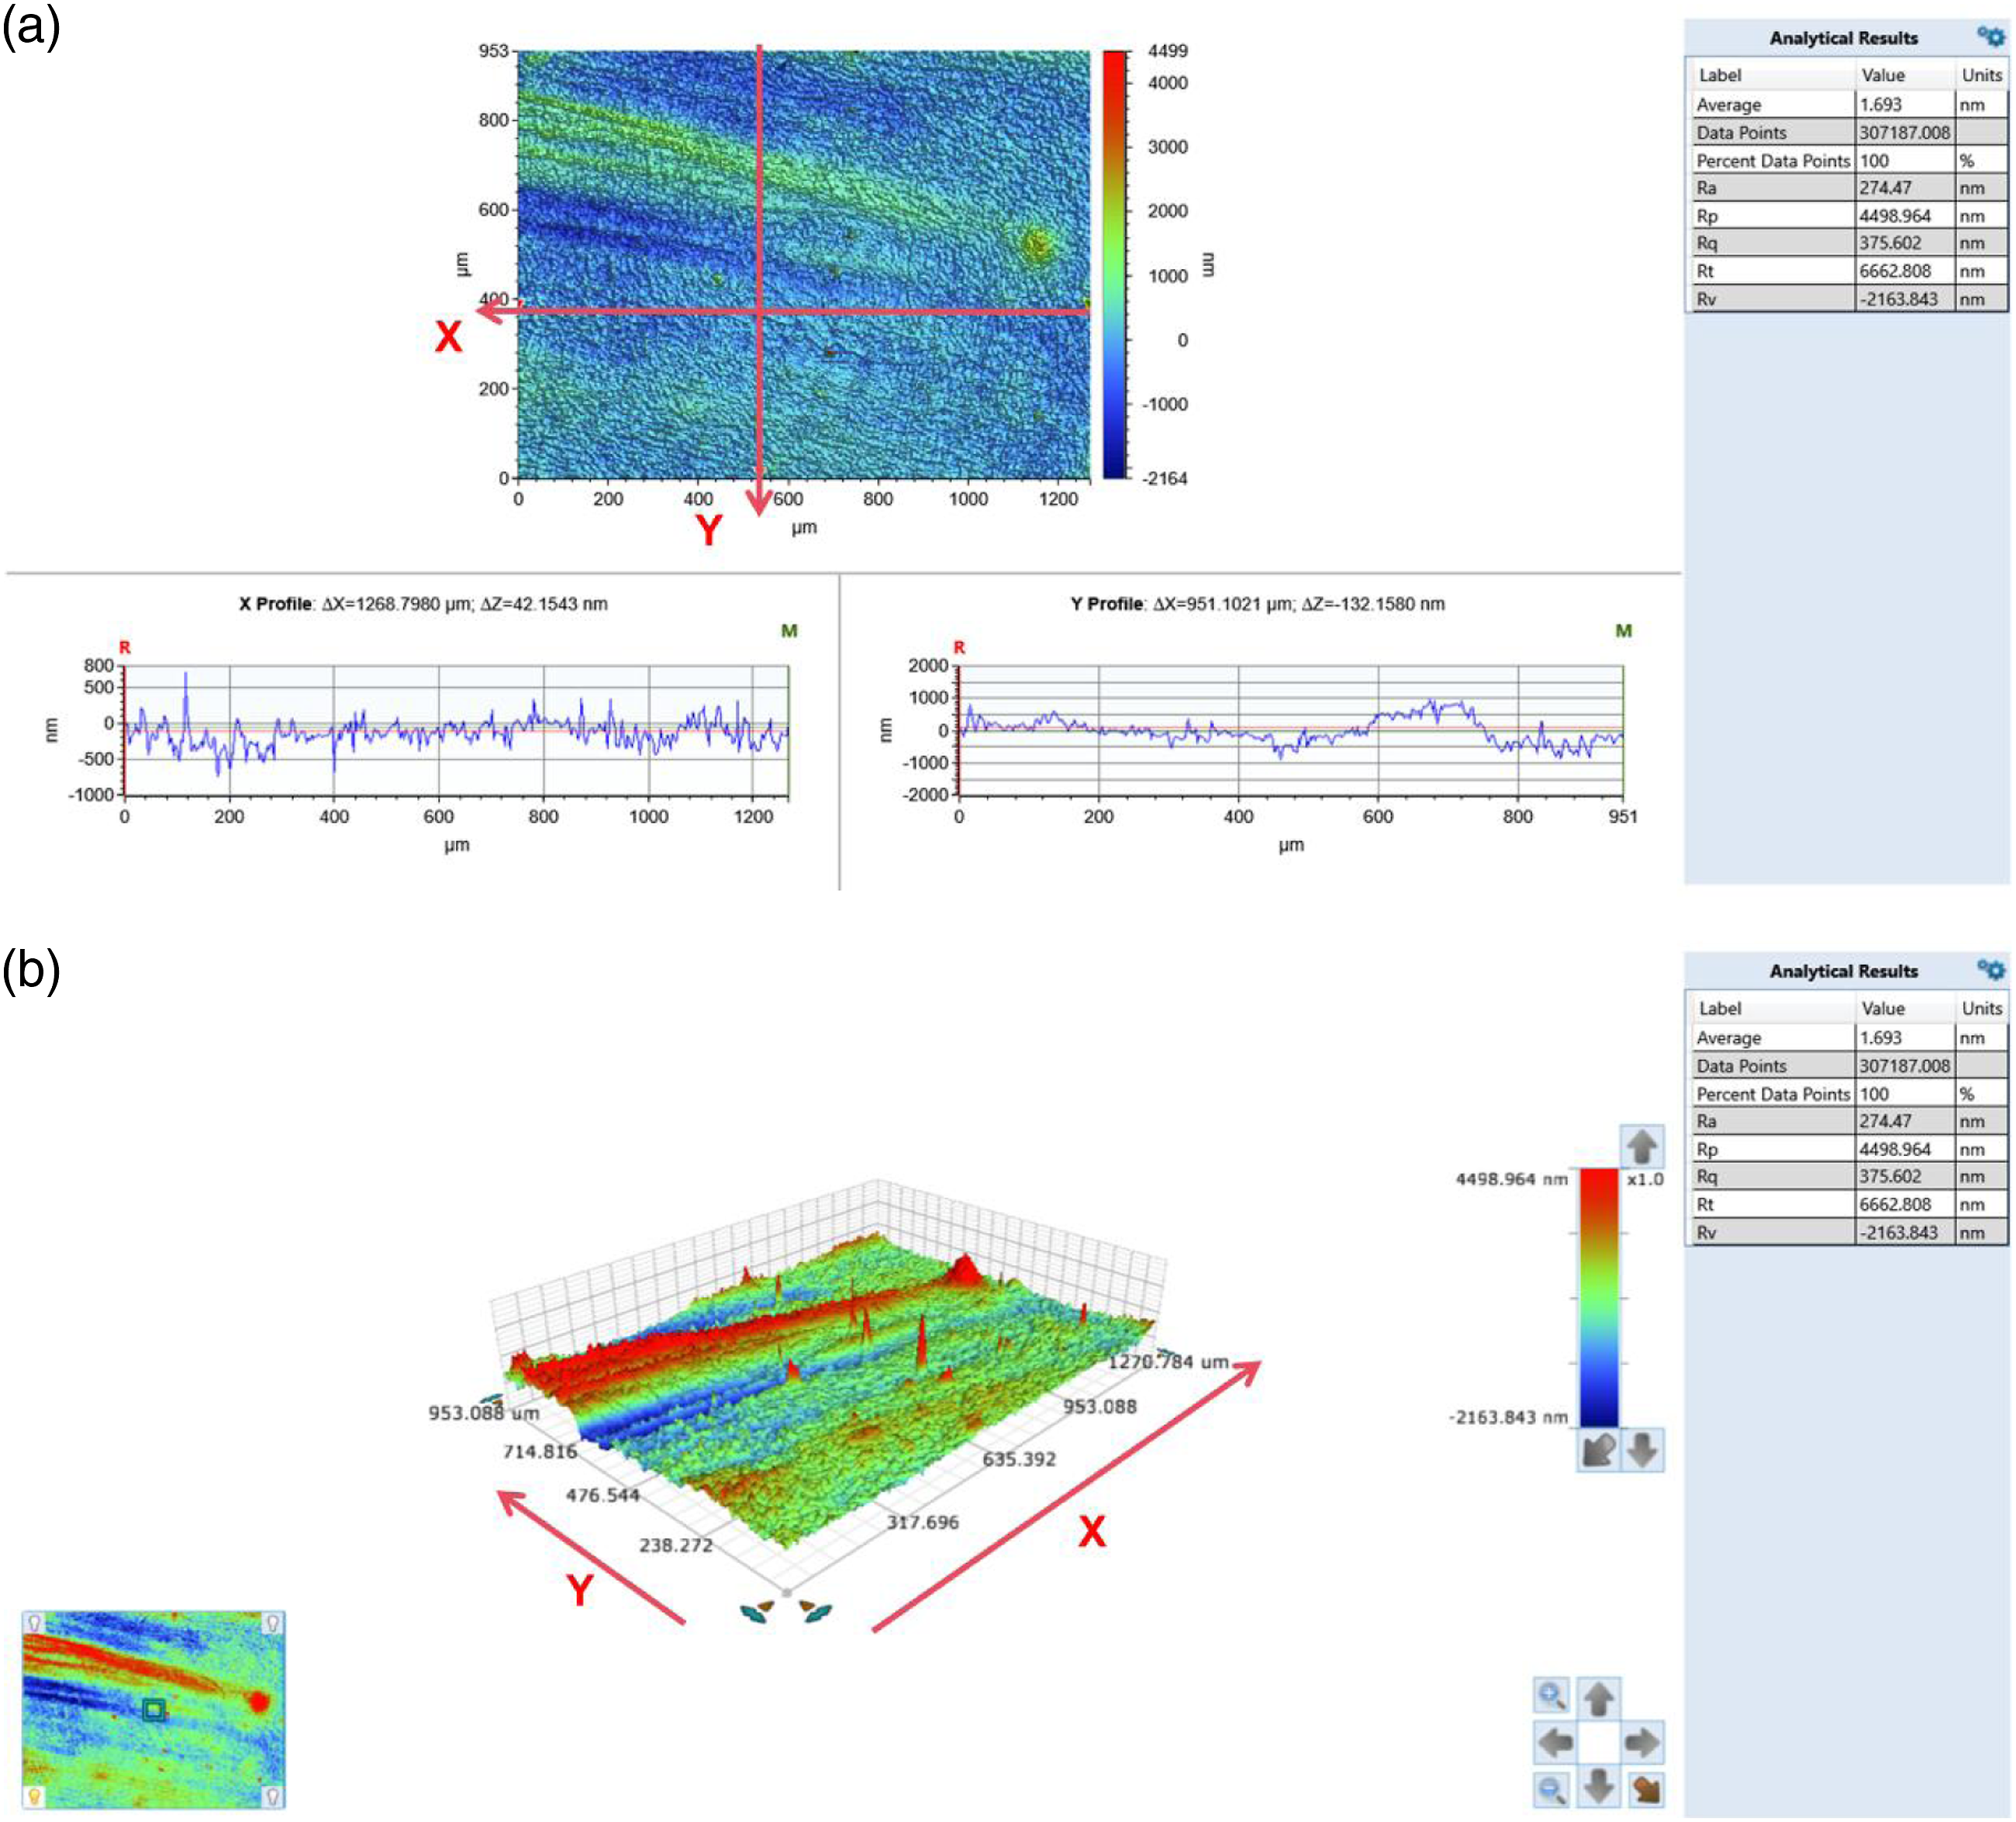
Among the four different wear interfaces, we found that the surface of PA composites is smoothest while the surface of PP composites is roughest (Figure 22). The roughness of PA composites is smallest. It is one of the reason why PA composites exhibited better anti-wear performance, as previous researchers have also observed.
33
Surface roughness values of PTFE, PA, PP composites.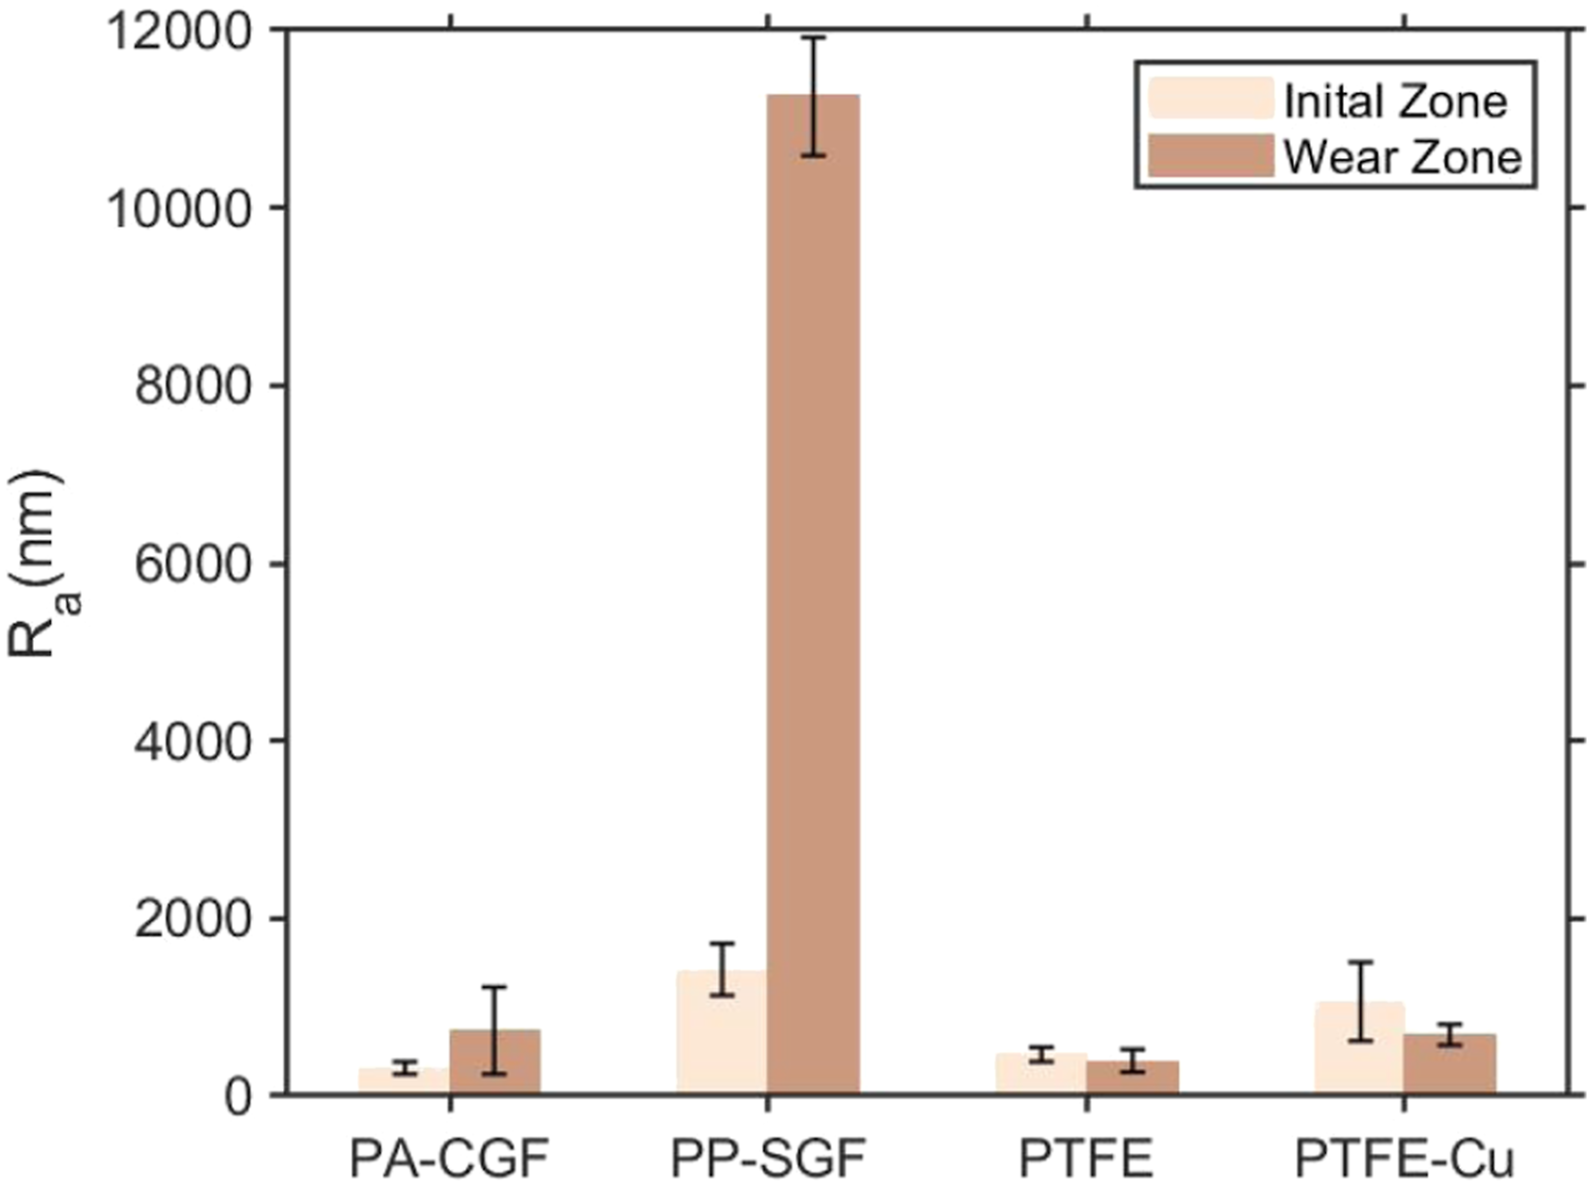
Grinding surface morphology
As shown in Figures 23–25, we examined the grinding surface morphologies of different composites. Plastic deformation occurred in the wear process of PTFE, indicating that the wear process was adhesive wear. It can be seen that the severe flaky spalling and large-scale wear debris with high sliding speed (Figure 23(a),a’)) and contact pressure (Figure 23(c),c’)), which is consistent with the high friction coefficient and wear rate of the composite in Figure 6(c). With 30mm/s speed and 5MPa contact pressure,the worn surface of PTFE is relatively smooth and exposure of slightly furrows (see Figure 23(b),b’)). Grinding surface morphologies of PTFE for different sliding speeds and normal loads: (a,a’) Tri. No1(50mm/s, 5MPa), (b,b’) Tri.No2(30mm/s, 5MPa), (c,c’) Tri.No3(30mm/s, 6MPa). Grinding surface morphology of PTFE-Cu for different sliding speeds and normal loads: (a,a’,a’’) Tri. No1(50mm/s, 5MPa), (b,b’) Tri. No3(30mm/s, 6MPa), (c,c’) Tri. No4(50mm/s, 6MPa). Grinding surface morphologies for (a,a’) PTFE, (b,b’) PTFE-Cu, (c,c’) PA-CGF and (d,d’)PP-SGF with the same sliding conditions(50mm/s, 6MPa).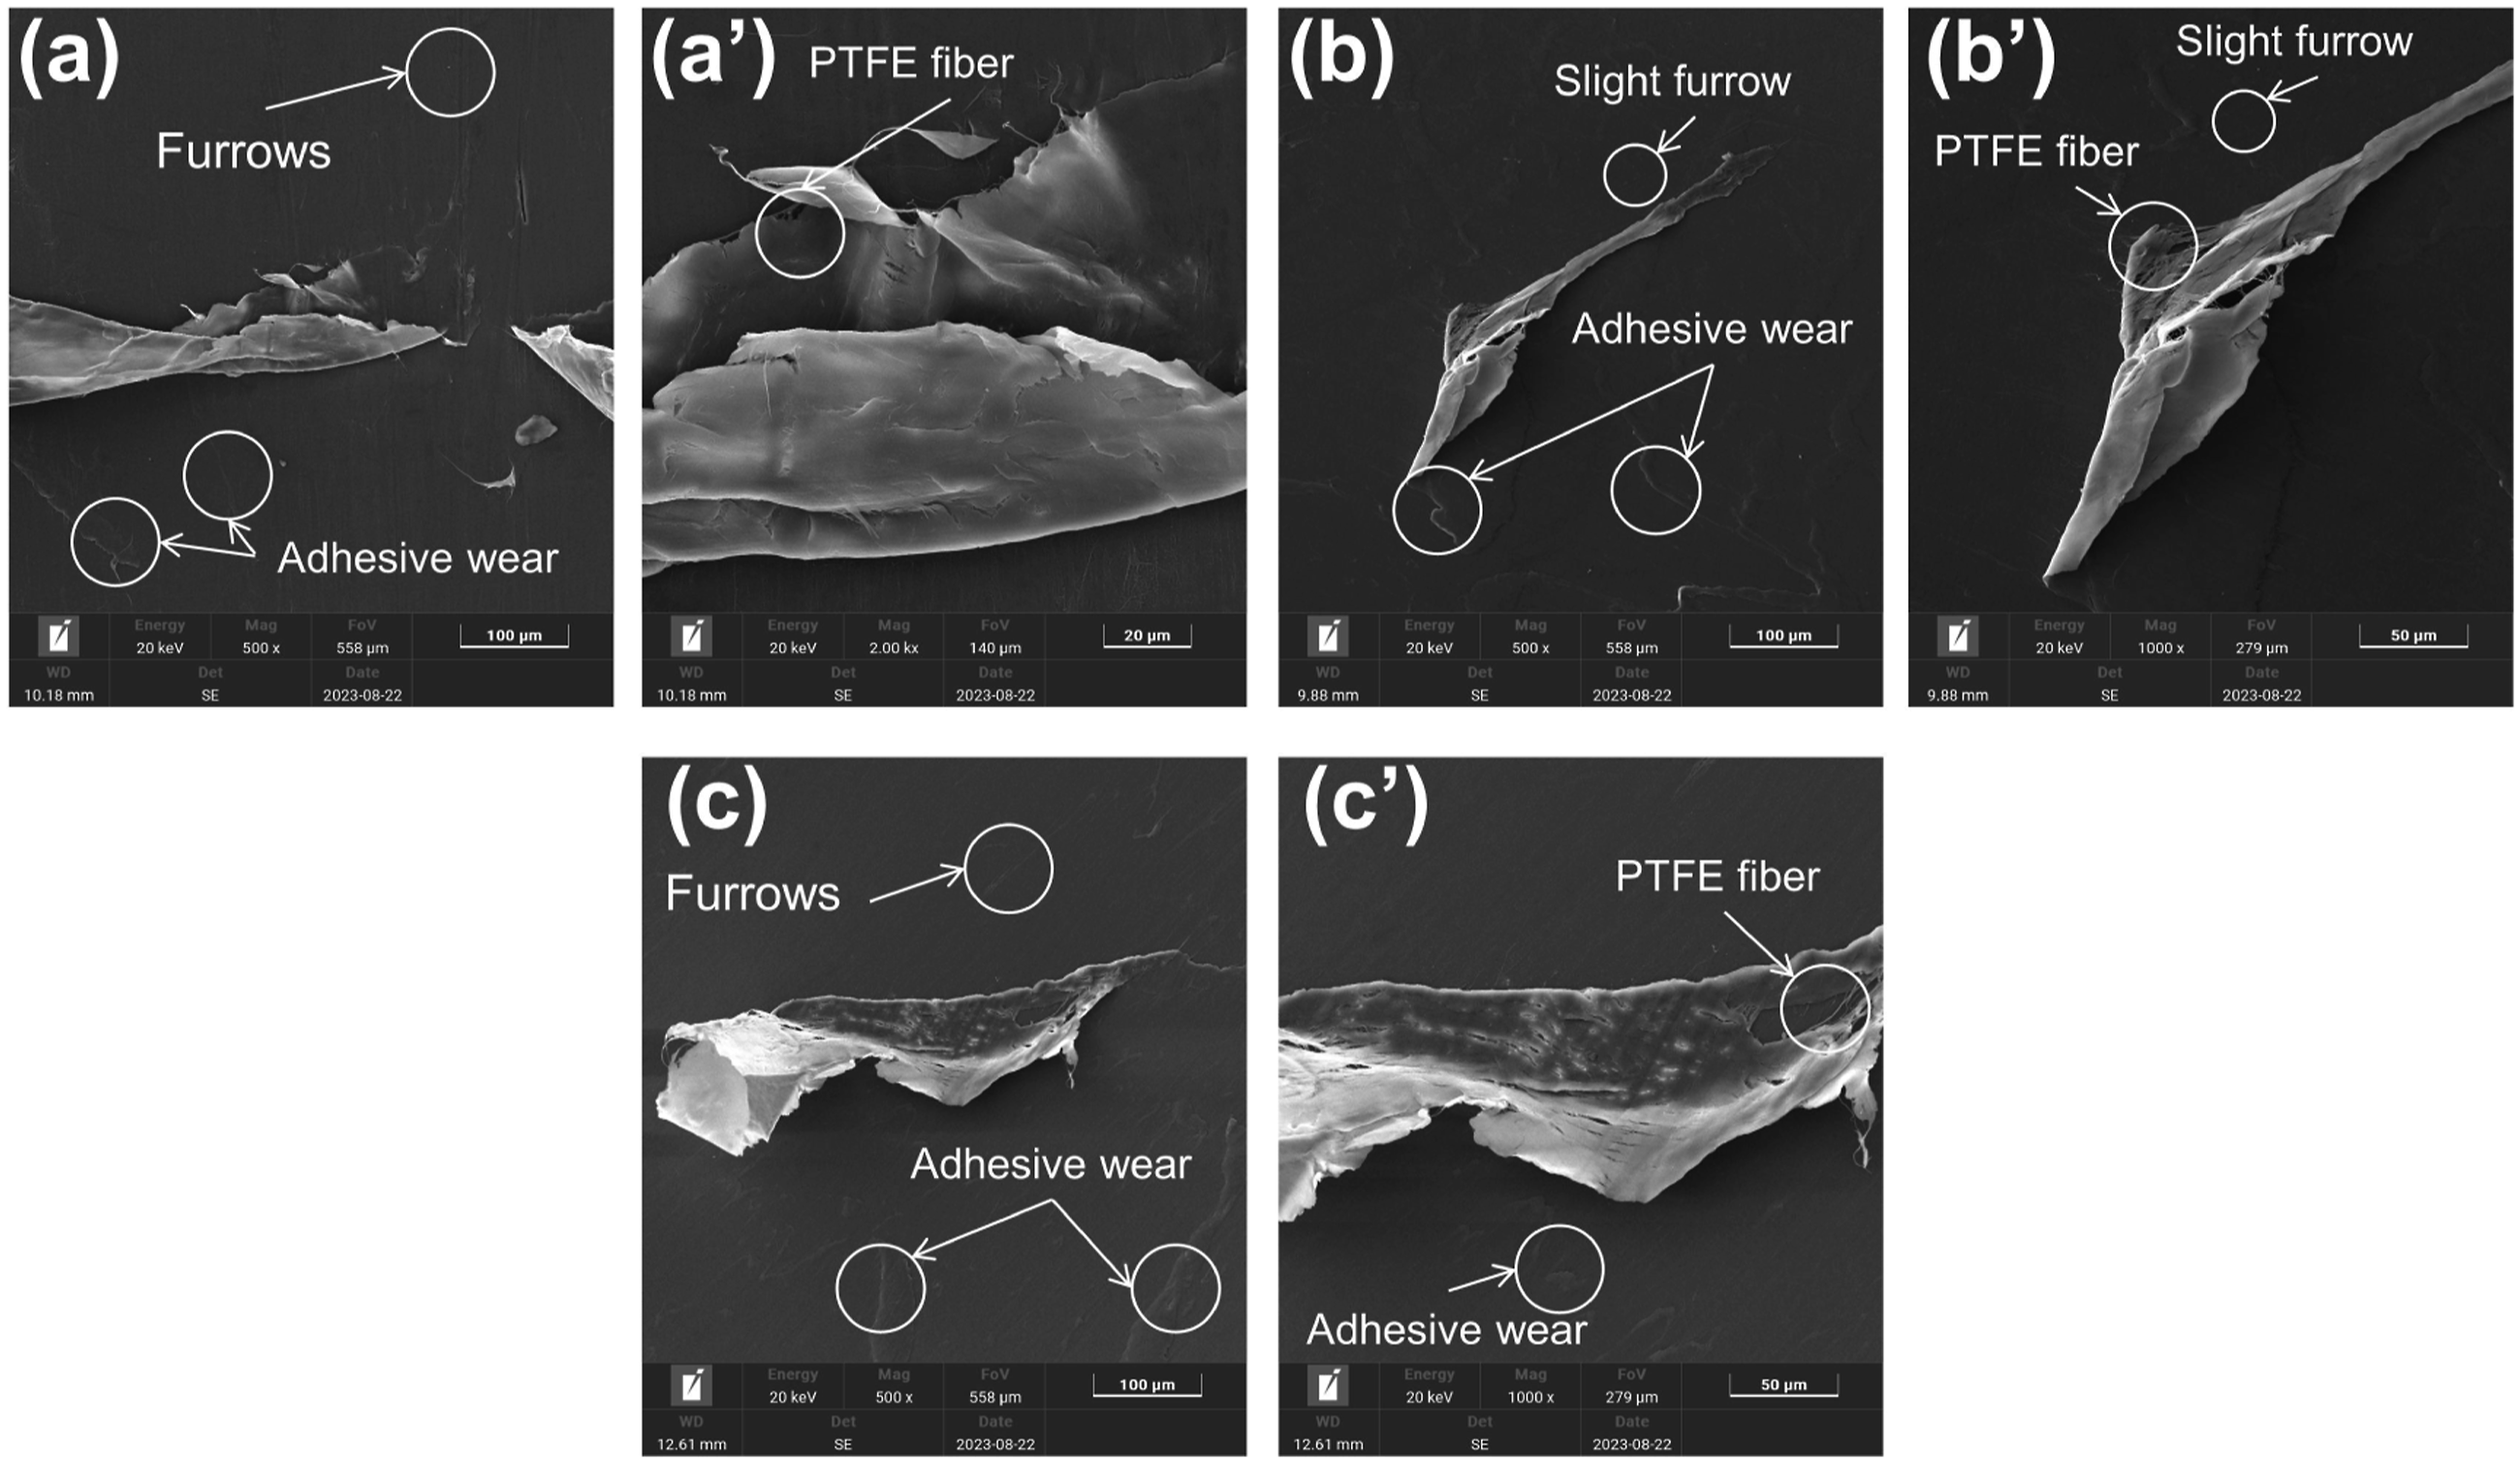
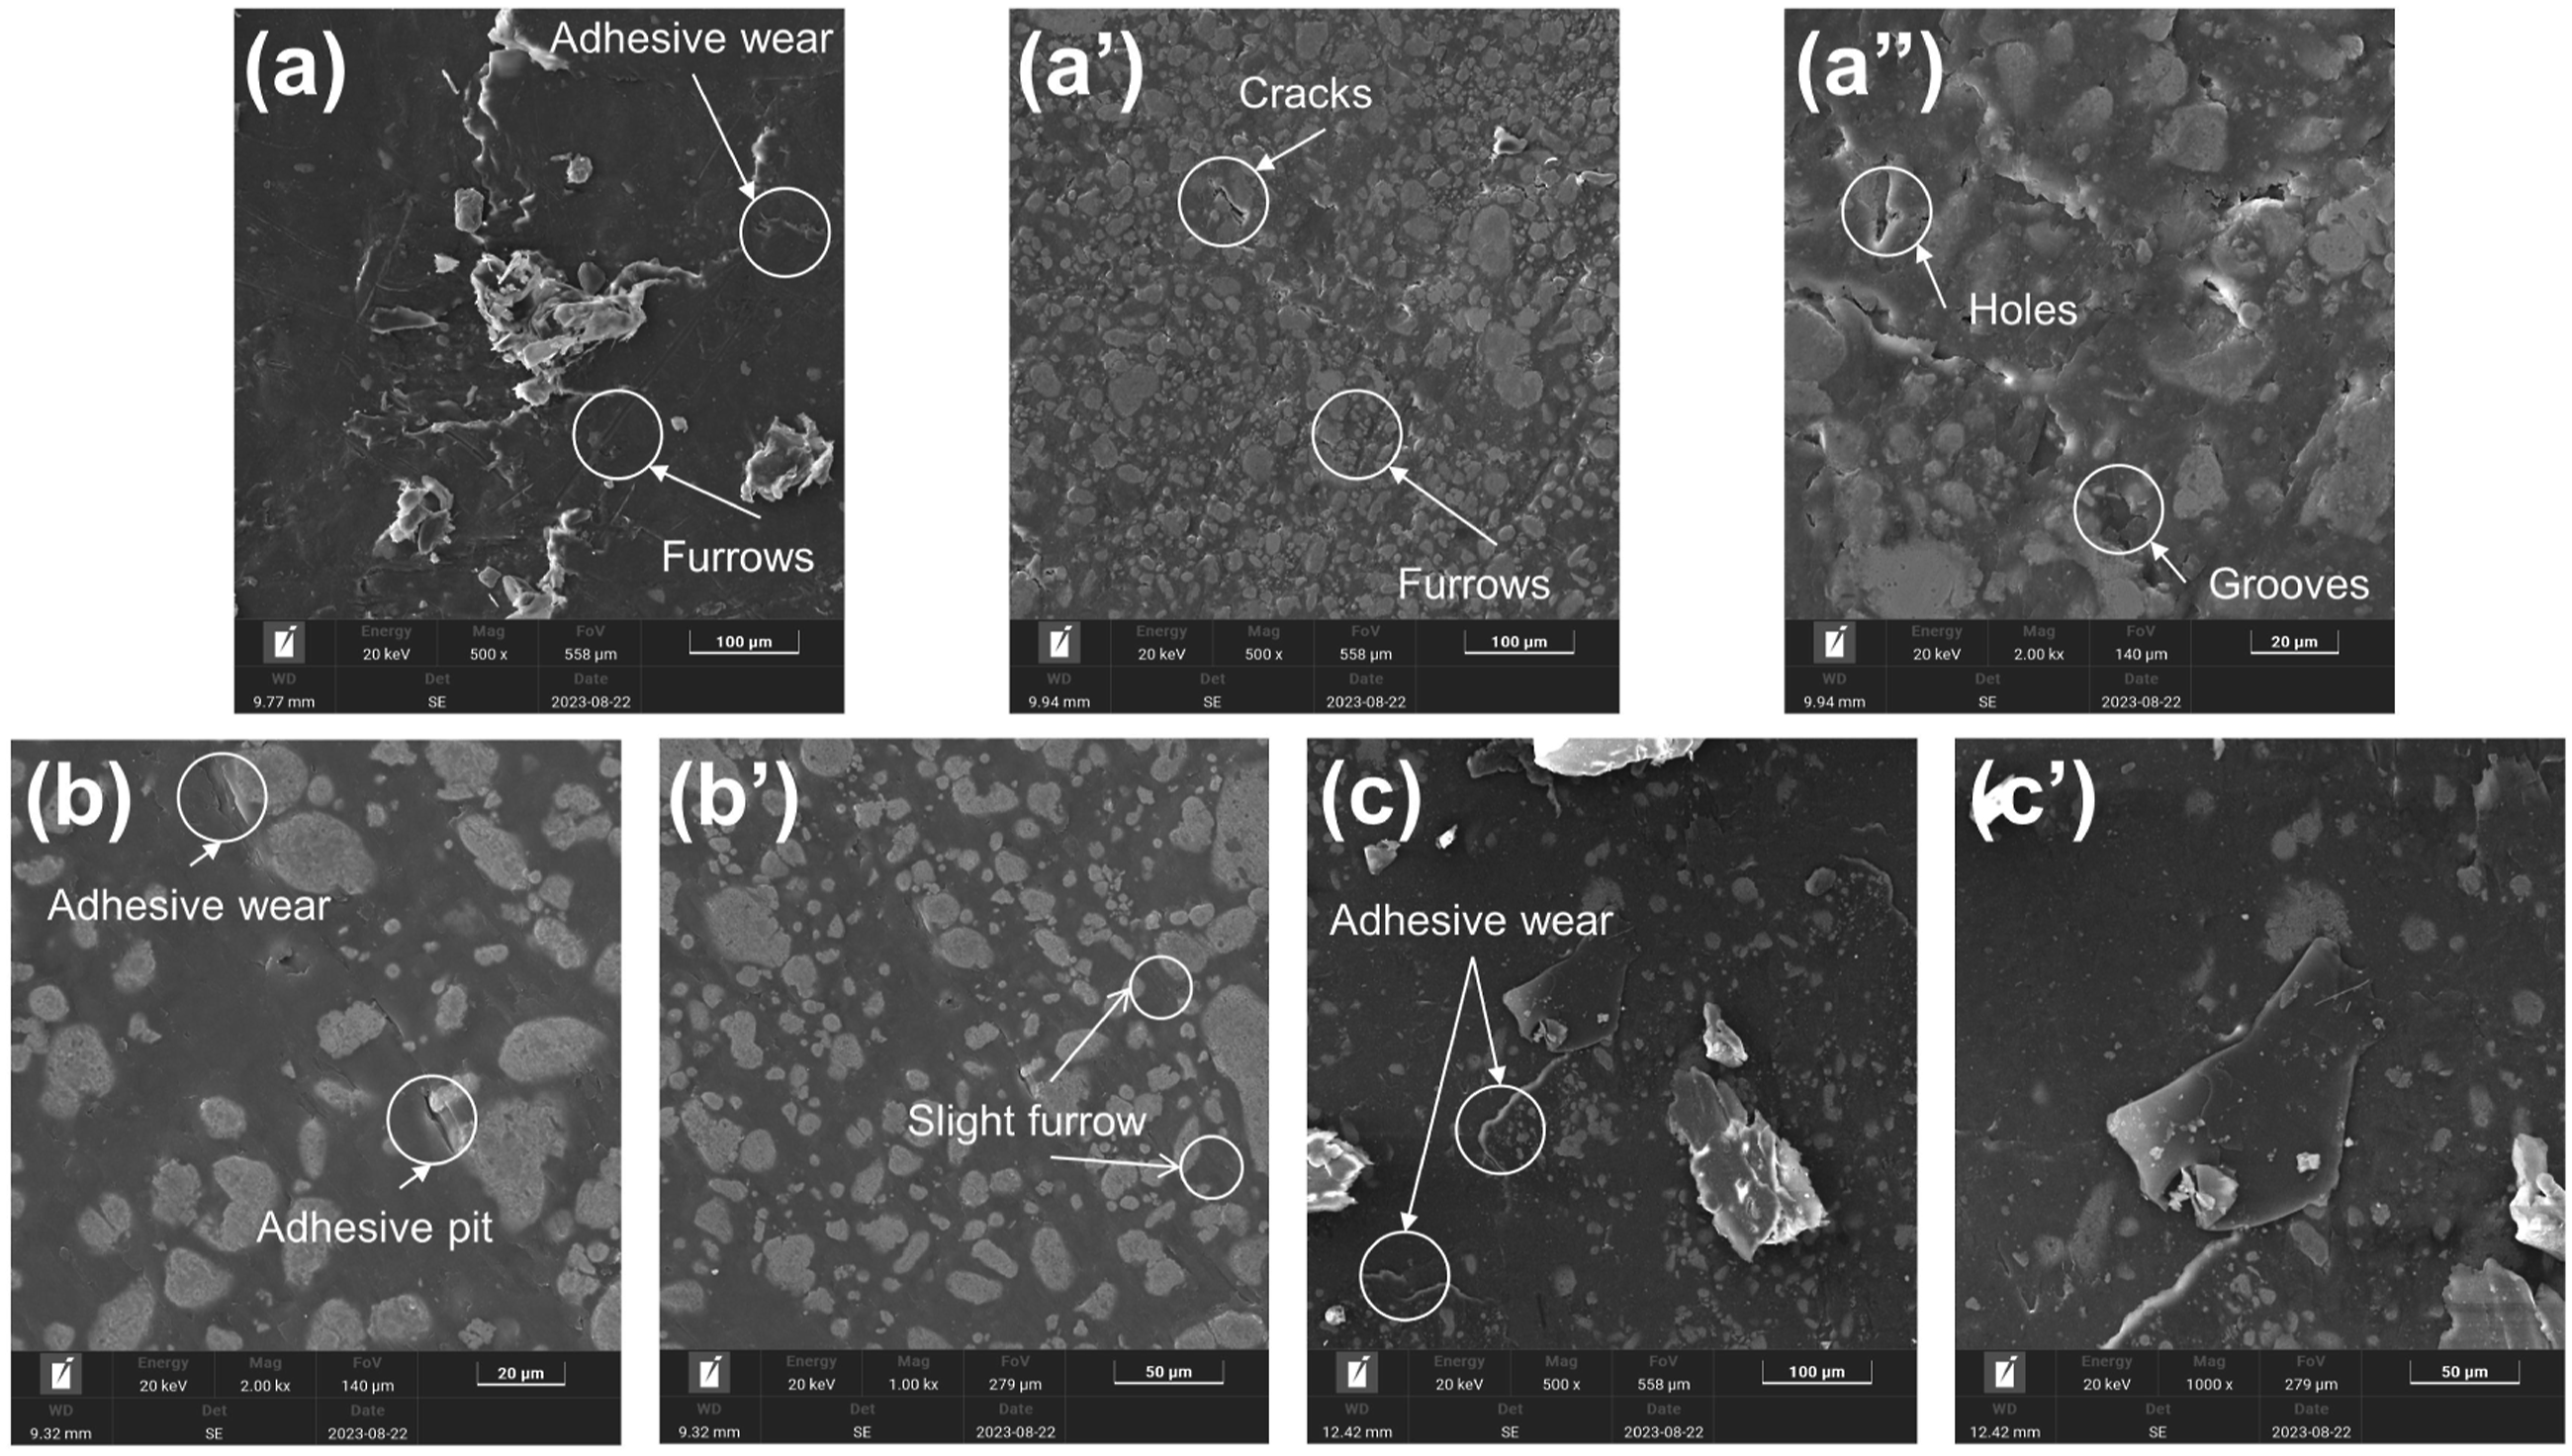
The wear surface of PTFE-Cu is relatively rough and shows abrasive flakes or crumb and some furrowing phenomenon in Figure 24. In Figure 24(a,a’,a’’), the larger and deeper furrows on friction surface are observed,but these furrows are impeded by the hard phase(Cu particles). The wear surface also shows obvious plastic deformation of Cu particles and some debris attached in the form of flakes (Figure 24(c,c;)). Based on the surface morphology (Figure 24), we noted that bronze paticles detached during friction and embedded in worn surface,and act as a third body,and thus becoming wear debris. The wear form is mainly abrasive wear, with some characteristics of adhesive wear. The SEM results demonstrate that the anti-wear property of the PTFE filled with Cu particles is better than the pure PTFE.
As shown in Figure 24,the worn surface of PTFE-Cu with higher contact pressure 6MPa is exhibit relatively smooth and exposure of slight furrows (Figure 24(b),b’) and Figure 24(c),c’)). We also notice the presence of holes and glooves in the wear area as sliding speed increases (see Figure 24(a),a’)). This is consistent with the high friction coefficient and wear rate of the composite in Figure 6(c) with high sliding speed.
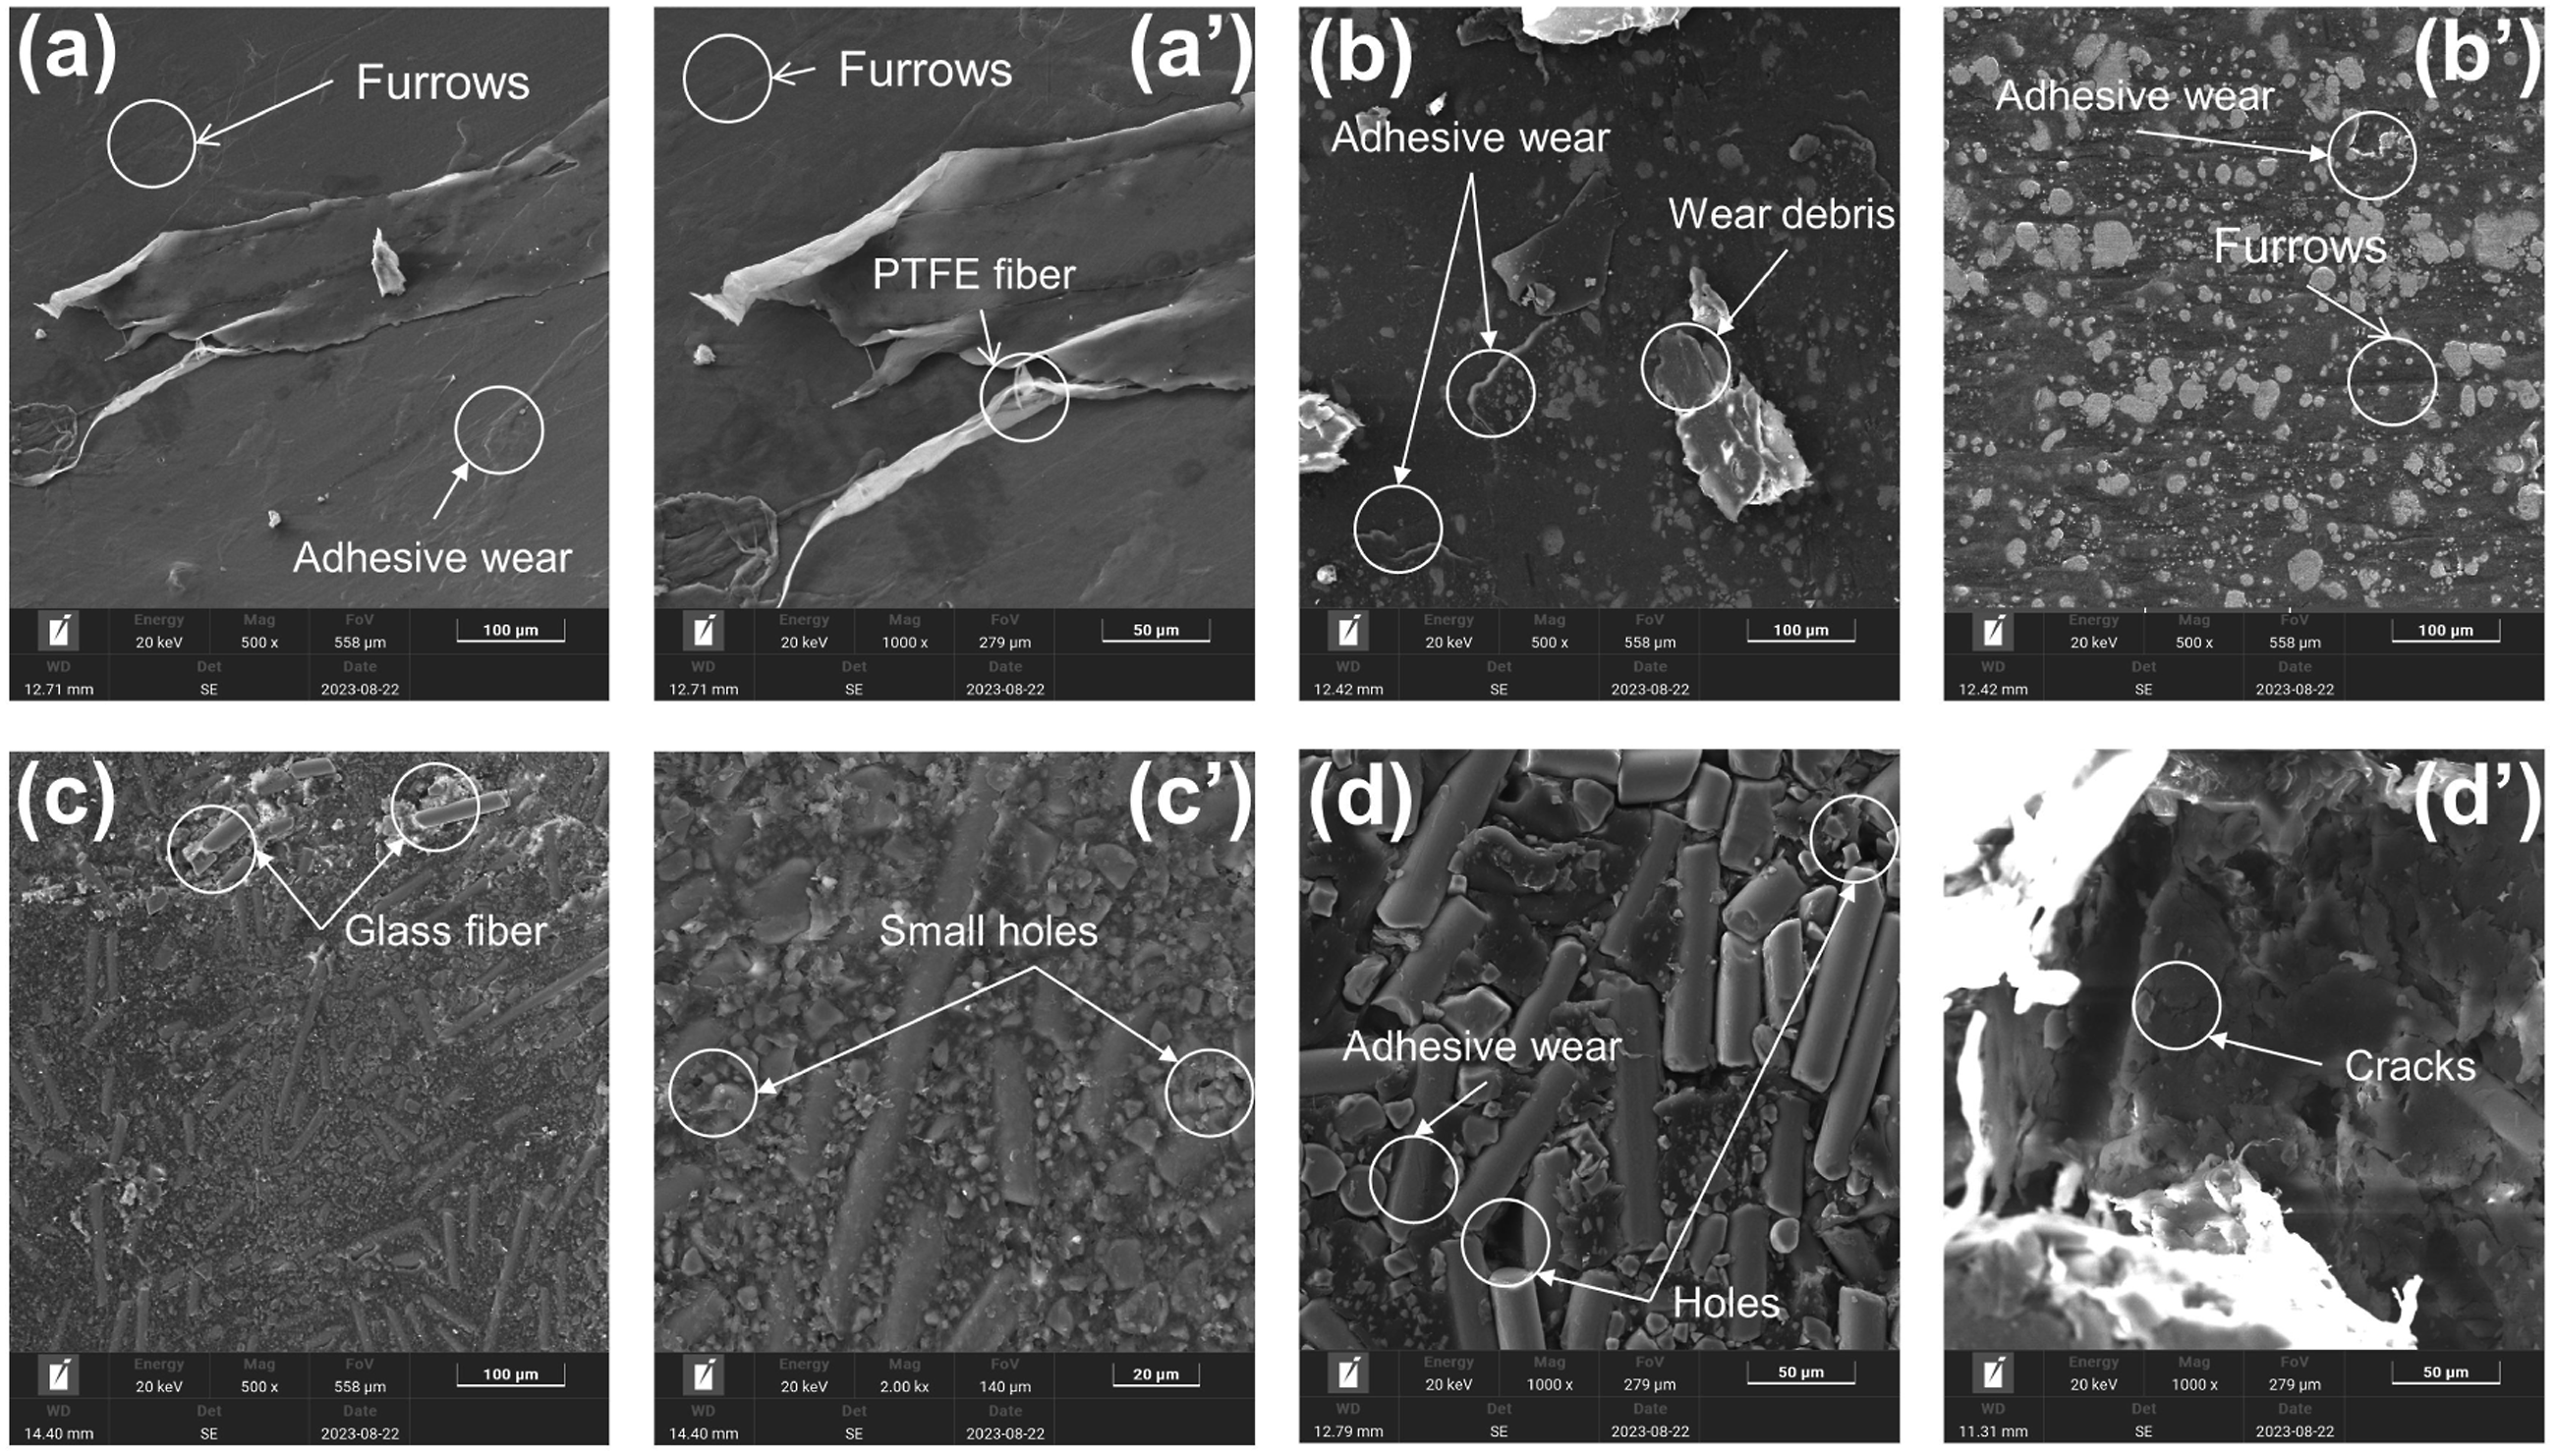
Figure 25 shows the worn surface of PTFE,PA and PP composites with the same working conditions(Tri.No4(50mm/s, 6MPa). Typical Flaky adhesive wear marks, sticking spalling and furrows are observed in Figure 25(a,a’), which are the major characteristics for pure PTFE matrix. When adding Cu particles to PTFE matrix,the Cu particles appeared flattened and sank well into the matrix after friction. Wear scars or furrows are impeded by the hard Cu particles and further these Cu particles which prior to carry the load, occupy a large area of the contact region. By changing the structure of the composite,the presence of filler material improved the resistance of the PTFE composite to adhesion wear. And in clear contrast,the smaller-scale wear debris and slight plastic deformation are observed in Figure 25(b,b’). This is consistent with the high friction coefficient and wear rate of the PTFE composite in Figures 6 and 7 and Figure 11.
Microcracking and subsequent spalling of material is an important wear mode for reinforcement polymer-based composites. 26 As shown in (Figure 25(c),c’,d,d’), several abrasive GF particles were found on the worn surfaces of PP-SGF and PA-CGF, where peeling occurred between GF and the polymer matrix. Additionally,the fibers peeled from the surface layer at the sliding contact surface of the PA and PP composites were lead to the occurrence of the three-body abrasion. Figure 25(d) shows that large filler fibers were fractured into fragments and many small glass fiber were peeled from the matrix leaving holes and cavities in the matrix. These holes and cavities would result in more cracks because of stress concentrations and thus leading to poor adhesion between the filler and matrix and high wear loss. Therefore,the PP-SGF wear surface shows large cracks and holes and the wear is mainly abrasive and adhesion. In clear contrast,the worn surface of PA-CGF is relatively smooth and the peeling of matrix and fibers are constrained, which is attributed to the fact that the glass fibers effectively support the load. There are small holes and some flaky debris in the PA-CGF wear interface; the wear form is a combination of abrasive and fatigue wear. The wear surface of PP-SGF is rougher than that of PA-CGF, which confirms the larger surface roughness and worse friction and wear(Figures 7 and 8, Figures 11, and 22).
Conclusion
In this study PTFE, PA, and PP composites were prepared and examined to determine their respective tribological characteristics. We compared the friction behavior of the three sealing composites under several sliding speeds and contact conditions. All the filler materials tested in this study influenced the wear resistance of PTFE, PA, and PP. Our findings can be summarized as follows. (1) Increased speed and load generally increase friction and wear volume for pure PTFE,but the coefficient of friction for PTFE-Cu decreases with the increase in the applied load value. The highest friction levels were observed in short GF-filled PP, followed by Cu particle-filled PTFE and pure PTFE, and finally CGF-filled PA. The addition of CGF reduced the coefficient of friction of pure PA. Under extremely high sliding speed, PTFE shows the highest friction levels. (2) The highest wear levels were observed in pure PTFE, followed by the short GF-filled PP and Cu paticle-filled PTFE, and finally CGF-filled PA. The optimal wear resistance of PA-CGF may be attributable to the incorporation of CGF. The addition of short GF enhanced the wear performance of pure PP as well. PA and PP composite materials showed better wear resistance compared to the currently widely used material PTFE. But under extremely high sliding speed,PP-SGF shows the highest wear levels. (3) The lowest surface roughness was observed in CGF-filled PA. The surface topographies of PTFE composites were smoother than PA or PP coated materials after wear testing. (4) The wear mechanisms we observed were dependent on material compositions. Plastic deformation was observed in the wear track of pure PTFE. The surfaces of PTFE-Cu composites showed rougher surface appearance, plastic deformation, peeling fillers (Cu particles), and micro-ploughing. The debonding of GF was observed in both PA and PP composites. Larger-scale and more abundant wear debris with holes and cavities were found in PP composites and small holes and some flaky debris were found in the PA-based composite. SEM photos indicated that the wear mechanisms of the PA-based composite are fatigue detachment and abrasive filler wear, while the wear mechanisms of the PP-based composite is mainly abrasive filler wear. (5) Our comprehensive measurements indicate that PA composites are best suited as materials for sealing rings under different working conditions and even under extremely high sliding speed (50mm/s).
Footnotes
Acknowledgements
We are particularly grateful to Associate Prof. Zhai Zhanyu. For his help of preparation of the continuous glass fiber-filled PA and short glass fiber-filled PP.
Declaration of conflicting interests
The author(s) declared no potential conflicts of interest with respect to the research, authorship, and/or publication of this article.
Funding
The author(s) disclosed receipt of the following financial support for the research, authorship, and/or publication of this article: The project supported by the National Natural Science Foundation of China (Grant No.52275397, No.51805551, No. U21A20132), Natural Science Foundation of Hunan Province (Grant No.2019JJ50799), Project of State Key Laboratory of High Performance Complex Manufacturing, Central South University (Grant No. ZZYJKT2018-15), and the Open Foundation of the State Key Laboratory of Fluid Power and Mechatronic Systems (Grant No. GZKF-201924).