
Abstract
Fused deposition modeling (FDM) is one of the additive manufacturing (AM) techniques in which intricate shapes are produced effectively with time and cost. Thermoplastics and filler-incorporated thermoplastics composite materials were used in the form of filament. The mechanical properties of the printed sample varies with the parameters involved in FDM printing. In the present investigation, polyamide 6 (PA) with 20 wt.% of short carbon fiber (CF) was used as filament. The filaments were printed with different raster orientations namely 0°, 45°, 90°, and ±45° by keeping other printing parameters constant such as 100% infill density, 0.2 mm layer thickness, 30 mm/min printing speed, 240°C printing temperature, 80°C bed temperature, and XY or 0° body orientation with a clear justification studied. The printed samples were investigated for structure, morphology and mechanical properties using tensile test and impact test respectively. The results shows that bidirectional ±45° raster orientation specimens show the highest tensile strength of 35.2 MPa in comparison with 0°,45°, and 90° raster orientation, and PACF composite material showed improved mechanical properties as compared to pure PA. The highest impact energy was observed for a PACF composite with a raster orientation of 90°. Morphological analysis of composites showed a uniform dispersion of CF in PA matrix and improved interfacial adhesion between matrix and reinforcement.
Introduction
The additive manufacturing (AM) process is used to produce a wide range of complicated, intricate geometrical structures from three-dimensional computer-aided design data by deposition of materials by layers on top of the preceding layer. AM techniques can build 3D structures which are improbable to achieve with conventional manufacturing techniques and it is perfect for producing prototypes rapidly, parts are made immediately from a 3D CAD file thus reducing the costs and time-consuming process of creating fixtures or dies. Furthermore, adjustments may be implemented in the middle of the process with little to no interruption. 1
FDM is also known as fused filament fabrication (FFF), it is a Material extrusion technique and one of the seven major categories of AM as per ISO/ASTM 52900. 2 FDM is the most extensively used 3D printing technique, with the great majority of 3D printer users worldwide, and is often the first 3D printing technology introduced for thermoplastic materials to the public. FDM creates 3D components by employing thermoplastic or composite filament into an extruding nozzle by feed rollers, where it is heated and melts before being deposited along a specified automated path layer by layer onto the build platform.3,4
However, only a few thermoplastic materials have been utilized as filaments in FDM so far. The most widely utilized thermoplastics for FDM technique are polylactic acid (PLA), 5 acrylonitrile butadiene styrene (ABS), 6 ABS/PLA, 7 PLA/Thermoplastic Polyurethane (TPU), 8 polyamide 6 (PA), 9 Polyethylene terephthalate glycol (PETG), 10 Polycarbonate (PC), 11 Polypropylene (PP), 12 Polyolefins, 13 Polyether ether ketone (PEEK) and Polyester. 14 More importantly, the mechanical strength of those pure thermoplastic printed components is often insufficient, which has severely limited their applicability. As a result, wood, clay, glass fiber, carbon fiber, ceramics, and metals are incorporated as fillers in composite filaments to offer additional qualities.15–17 Components containing composite materials are increasingly being produced using the fused deposition modeling technique in automotive, aerospace and medical industries.18,19
Among these materials, Polyamide 6 (PA) or Nylon 6 is the most versatile semi-crystalline polymer used extensively in the automobile industry as manifold, gear, and front-end modules20,21 and reinforcement carbon fiber (CF) has excellent mechanical, electrical, and thermal properties. 22 Continuous carbon fiber reinforced materials are stronger but printing them requires specialized equipment, whereas the short carbon fiber which act as reinforcement can utilised for high strength application without requiring equipment modifications. However, the strength of the composite reduces in certain cases owing to the agglomeration of reinforcement at higher concentration. Therefore proper mixing of CF and PA leads to the production of excellent parts with enhanced performance for various application. 23 Carbon fiber reinforced polymer (CFRP) composites possess exceptional mechanical properties, excellent environmental compatibility, high resistance to corrosion, long-term durability, chemical resilience, superior thermal and electrical conductivity. Additionally, they exhibit relatively high stiffness/density and strength/density ratios. On the contrary, CFRP composites are characterized as anisotropic materials, showing significantly higher tensile strength compared to their shear and compressive strengths.24,25 Furthermore, the developed PACF revealed interesting mechanical durability in hydro- thermal-oxidative conditions. 26 PACF composite material exhibits promising potential as a viable substitute for metals in various structural applications, including vehicular brackets, inspection gauges, manufacturing tools like robotic end effectors, and under-hood applications. Its utilization can lead to cost reductions and improved operational efficiencies. 27 In the research conducted by Elena Verdejo de Toro et al., 28 it was concluded that both tensile tests and compression tests revealed a more similar behavior of FDM printed parts and Injection Moulding (IM) parts, with only a marginal 4% improvement. Despite this similarity, the 3D printed samples exhibited higher stiffness values compared to the IM parts.
In the FDM manufacturing technique, the major important parameters are printing temperature, printing speed, layer thickness, bed temperature, infill density, body orientations, and raster orientations.29,30 The nozzle temperature in 3D printing is crucial for the proper extrusion of composite materials. If the temperature is set too high, there is an increased risk of material degradation, which can result in material slagging from the nozzle and ultimately lead to a decrease in part quality. On the other hand, when the temperature is excessively low, it causes a lack of sufficient adhesive properties between the adjacent layers, affecting the overall bonding and structural integrity of the printed object. Finding the optimal printing temperature is essential to achieve high-quality 3D prints. 31 The optimal print speed for the PLA specimens falls within the range of 30 to 60 mm/s. Within the range of 50 to 80 mm/s, the strength remains relatively consistent. However, when the print speed exceeds 80 mm/s, there is a significant decrease in strength. This decline can be attributed to the emergence of print defects caused by the limited capacity of the print head. 32 It is possible to print rapidly without losing print quality due to a lack of adhesion between beads, but this will depend on the type of 3D printer and the quality of the materials used. The printing duration of a 3D component is determined by the number of layers required. Printing the lower layers will take more time. Furthermore, reducing the layer thickness reduces the risk of bigger size voids and facilitates better fusion between adjacent layers, resulting in a smoother surface finish. Similarly, the print speed significantly impacts the quality of the print. Slower print speeds generally lead to higher dimensional accuracy. 33 The bed temperature is intended to prevent component warping, keeping the temperature within the proper range is vital for bigger parts. 34 Stronger components will come from a higher infill density, which indicates that there is more plastic within the print as the quantity of material utilized inside the print is decided by the infill density. 35 When components have pronounced overhangs and intricate angles, it becomes necessary to print support materials, which can increase the overall part cost. However, by minimizing the use of support material, optimal part orientation can be achieved, resulting in reduced material consumption, lower risk of print failure, and improved surface finish. For printing curves and angles, the X-Y axes are preferred as they offer the best results in terms of part orientation. 36 A layer thickness of 0.1 mm with a raster orientation of 90° resulted in the most substantial ultimate tensile strength (UTS) for both ABS and Nylon 6 samples. Conversely, when the layer thickness was increased to 0.3 mm and 0.4 mm, the ±45° raster orientation exhibited the highest ultimate tensile strength due to a greater close pack density. 30
The literature survey investigates the documented data concerning the processing parameters of FDM-printed carbon fiber (CF) reinforced with diverse polymer composite filaments.
Abdul Samad Khan et al. 37 conducted experiments using FDM specimens at various printing speeds and nozzle temperatures for ABS and CF/PLA composites. They found that the higher nozzle temperature (260°C for ABS and 225°C for CF/PLA) and higher printing speed (30 mm/sec) enhances the fracture toughness of the composites. Relatively higher printing speeds result in reduced time between layers, promoting better thermal fusion and adhesion between them, leading to increased interfacial fracture toughness. M. Kamaal et al 38 investigated the effect of FDM process parameters on part attributes, the effect of layer height, build direction, and infill% on the mechanical properties of the parts independently with 5.50% CF and PLA composite material according to TOPSIS, the optimal process parameters for tensile strength are 0.2 mm layer height, 80% infill, and X building direction, whereas 0.2 mm layer height, 80% infill, , and Y build direction are also supported by experimental findings. Syed Waqar Ahmed et al. 39 conducted two studies utilizing fused deposition modeling for multi-material laminar composites. In one study, they incorporated ABS and carbon fiber-reinforced PLA filament, determining optimal printing conditions for enhanced tensile strength and elongation. The balanced trade-off was achieved with speed 20 mm/s, infill density 67.838%, layer height 0.23 mm, and clad ratio 0.25. In another study, 40 they focused on interfacial bond strength (IFBS) of ABS and CF/PLA composites, revealing favorable parameters of printing speed 50.54 mm/s, infill density 79.82%, layer height 0.15, and layer thickness ratio 0.49. Furthermore, their findings indicated that printing speed predominantly influenced ultimate strength, while infill density solely affected elongation properties. Bin Hu et al. 41 determined that 2% CF improved FDM tensile strength, the tensile strength of CF-reinforced PEEK increased by 59% compared to injection-molded PEEK components, PEEK composites have the greatest tensile characteristics at 90° raster orientation, and the average elongation at break of the CF/PEEK is significantly less than that of pristine PEEK. Demei Lee et al. 42 also worked with CF PLA composites and studied the effect of raster orientation and infill density, determined that compared to components printed with a 90° degree ratser orientation, parts with a 45° raster orientation showed higher mechanical strength and a higher fill density signifies a greater degree of plastic compactness on the inside of the print, and hence a stronger printed product.
In an investgation conducted by Yahya Abderrafai et al., 43 it was demonstrated that reinforcing a PA12 matrix with CF resulted in a notable enhancements in both stiffness and tensile strength. When the printing was carried out under controlled environmental temperature, there was a significant increase in the tensile strength of the 3D printed samples with body oriented along the X-Y axis. J. M. Chacón et al. 44 analysed body orientation with CF and Nylon 6 and observed that Flat samples have higher tensile strength and stiffness values than on-edge samples. Frantisek Sedlacek et al. 45 found that adding short carbon fibers (SCF) to PA6 significantly increased its strength (up to 12% higher than regular nylon PA6) and improved temperature stability (heat deflection temperature more than three times higher than PA6). The longitudinal direction build direction of PA6/SCF showed up to 39% higher tensile strength and tensile modulus as compared to the transverse direction.
Sandeep et al. 46 used an artificial neural network integrated with a genetic algorithm to optimize the parameters for improved surface roughness of CF based nylon 6 (PA/CF) composite material generated components and attained roughness 5.01788 μm, correlating to different optimal input variables such as Layer thickness 0.1776 mm, Temperature 236.060°C, Speed 40.7369 mm/s, Raster angle 43.9177°.
In a study conducted by Nabilah Afiqah Mohd Radzuan et al., 47 various experiments were performed using different filler loadings of SCF into PA6 composites. Specimens are fabricated in FDM. The findings of the study clearly indicate that the samples with 20 wt.% carbon fiber loading exhibited superior mechanical performance compared to those with 40 wt.%.
The orientation of rasters significantly influences the tensile mechanical characteristics of FDM-fabricated samples, with the fiber or raster orientation (also known as beads) playing a crucial role in determining the part’s tensile strength and overall material properties. As a result, the raster angle has the most significant impact on both the failure mode and material properties.
This research paper addresses the optimization of process parameters for short carbon fiber reinforced with polyamide 6 materials. Specifically, there is a lack of studies focused on PA with short CF and the impact of raster orientation on mechanical properties. In light of this gap, the objective of this research is to thoroughly investigate the effects of raster orientation on key mechanical properties, including tensile strength and impact strength. In addition, the study delves into the structure and morphologies of the composite through comprehensive analysis using X-ray diffraction and scanning electron microscopy (SEM). By shedding light on these aspects, this research contributes to a better understanding of the relationship between raster orientation and mechanical properties, filling an important gap in the existing body of knowledge.
Materials and methods
In this study, we investigated the mechanical properties of pure polyamide 6 (PA) and a composite filament of PA with 20 wt.% carbon short fibers (PACF). The composite filament had a random fiber orientation, with carbon fibers measuring 10 μm in diameter and 30 μm in length. The filament was obtained from Shenzen esun Industrial co., Ltd. in China.
For the 3D printing experiments, we used a Wanhao Duplicator 4S FDM printer equipped with a 0.6 mm nozzle made of hardened stainless-steel material. To focus on the mechanical properties, we kept several parameters constant throughout the experiments. These included a shell count of 1 to minimize the influence of shell thickness on raster orientation with, a layer height of 0.2 mm, 100% infill density, printing speed of 30 mm/s, nozzle temperature of 240°C, platform temperature of 70°C, and with a XY printing orientation.
The focus of the study was on four specific raster orientations: 0°, 90°, +45° and ±45°. For the 0° raster orientation, beads of filament (raster) were arranged perpendicular to the axis of tensile load, for the Charpy impact test, the raster was oriented parallel to the charpy load direction. On the other hand, the 90° raster orientation the rasters aligned along the axis of tensile load, for the Charpy impact test, the raster was positioned perpendicular to the charpy load direction. Additionally, we investigated the difference between two other raster orientations: +45° (unidirectional) and ±45° (bidirectional), as illustrated in Figure 1. In the +45° configuration, the rasters were unidirectionally oriented at a 45° angle relative to the axis of tensile load. contrast, the ±45° configuration featured bidirectional rasters alignment at ±45° angles relative to the axis of tensile load. Flowchart of methodology.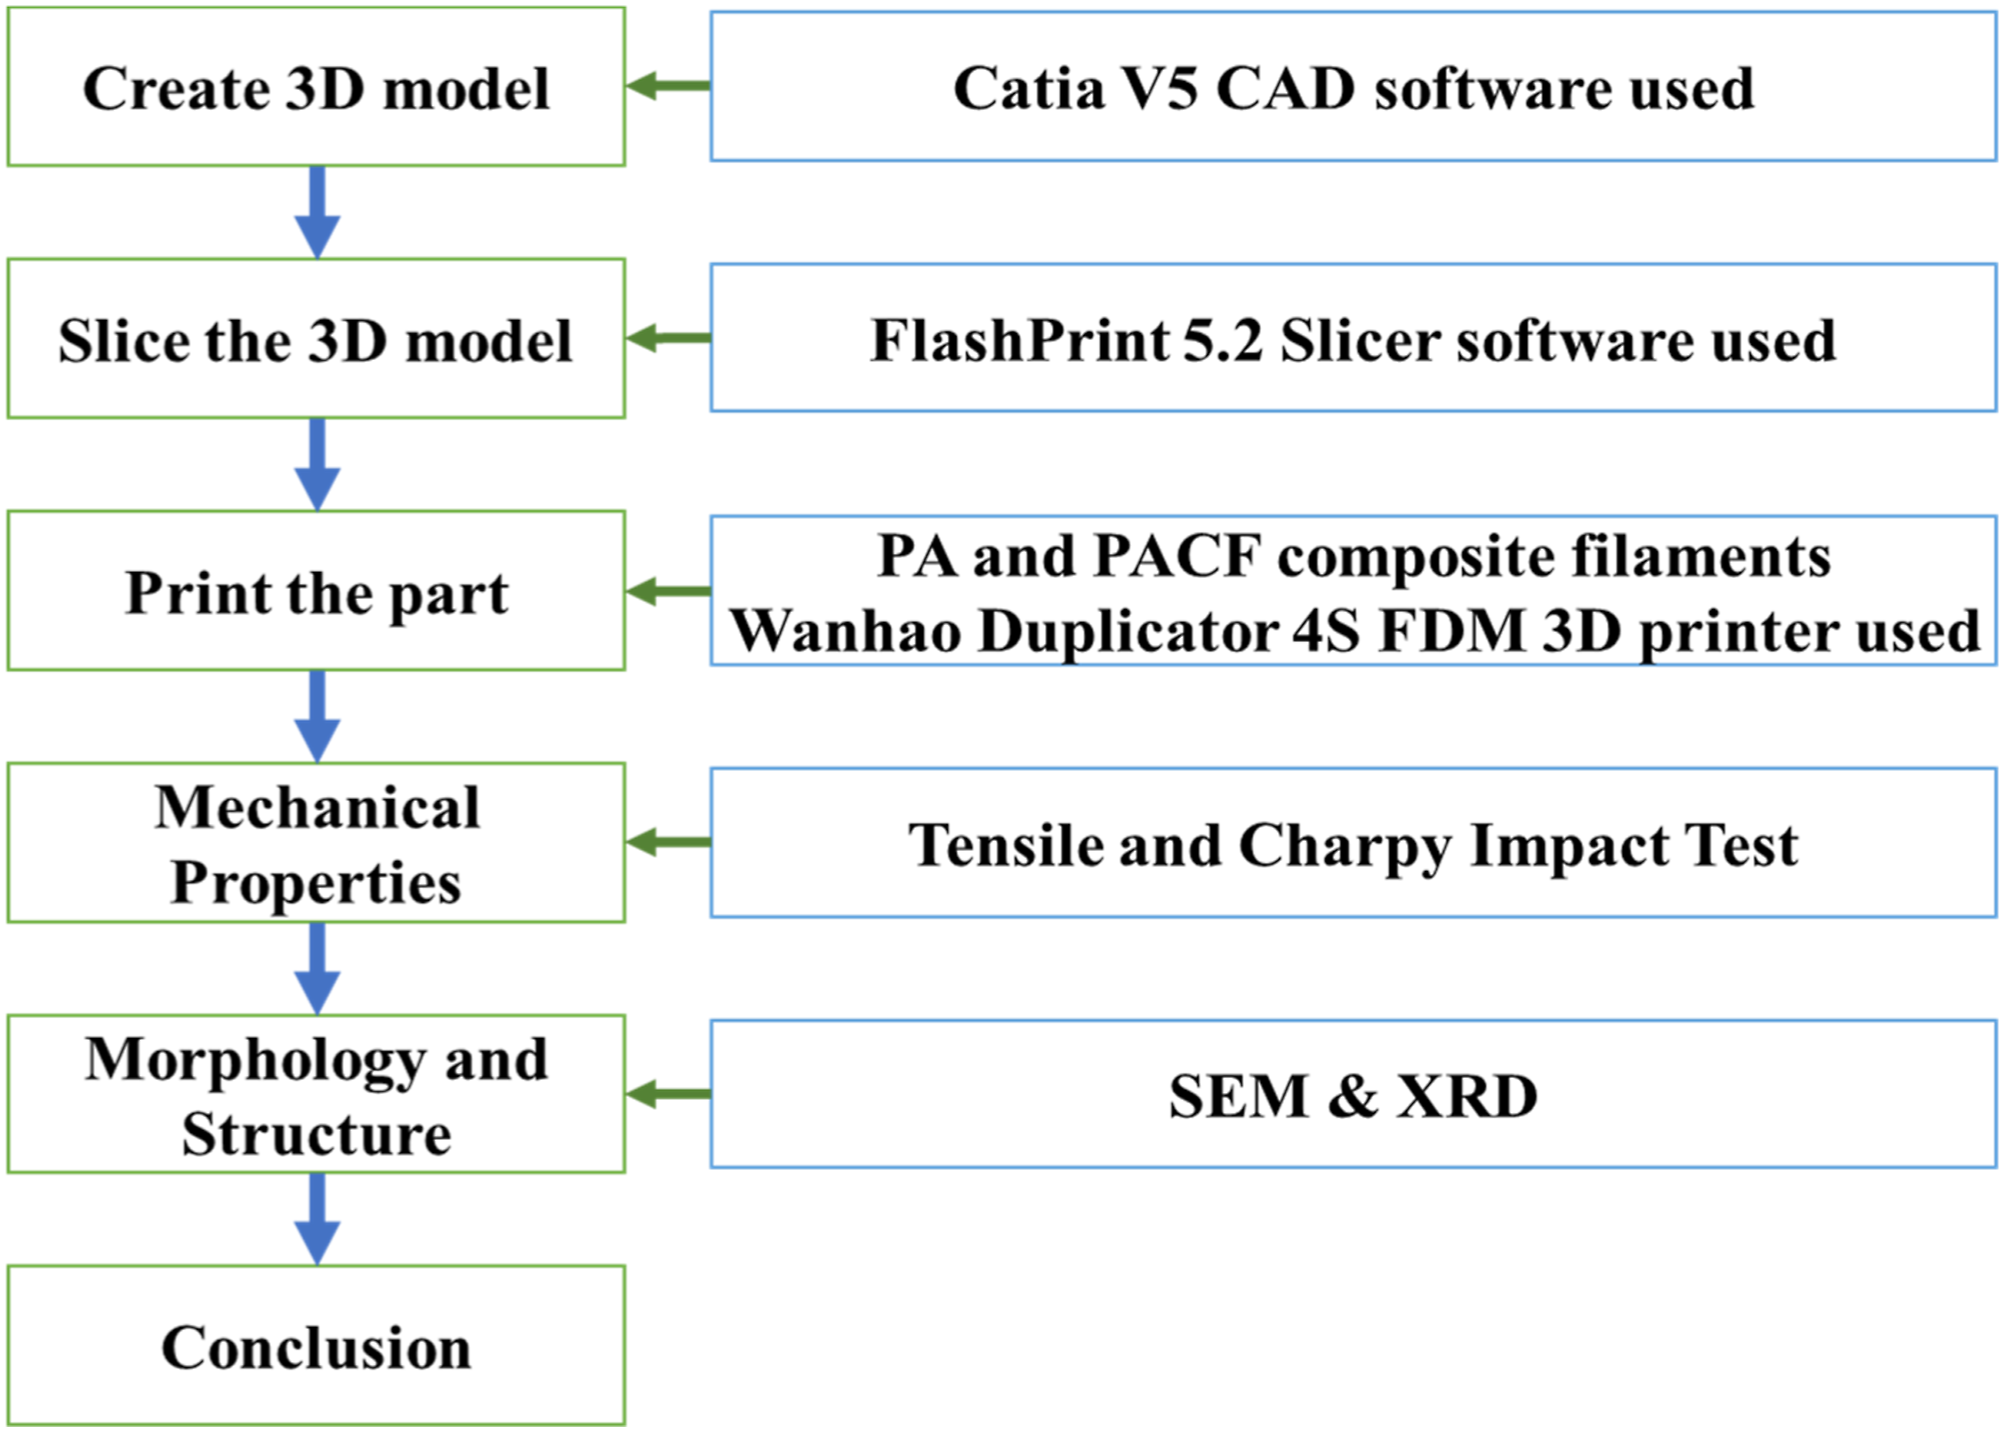
To create the CAD models, we utilized Catia V5 software, and the FlashPrint 5.2 slicer software was employed to configure all the mentioned parameters. In our study, we evaluated the tensile strength and Charpy impact test of the printed samples.
Additionally, we performed scanning electron microscopy (SEM) and X-ray diffraction (XRD) analysis to further examine the microstructure and crystalline properties of the PA and PACF samples. These techniques provided valuable insights into the morphology and crystallographic characteristics of the printed composites. Methodology was schematically represented in Figure 1.
Characterization techniques
Tensile test
Tensile test specimens were prepared as per ASTM D638 type IV,
48
and the specimens are printed with various raster angles like 0°, 45°, 90°, and ±45° shown in Figure 2(a). All the specimens were kept in an oven for around 6 h at 100°C to remove moisture content due to the hygroscopic nature of the polyamide-based materials. The test is performed in Tinius Olsen H10KL UTM with load cell 10 KN under a strain rate of 5 mm/min at room temperature. Five specimens are tested in each set and the result was shown by taking the average from obtained values. (a) Tensile Test Specimen, (b) Charpy Test Specimen.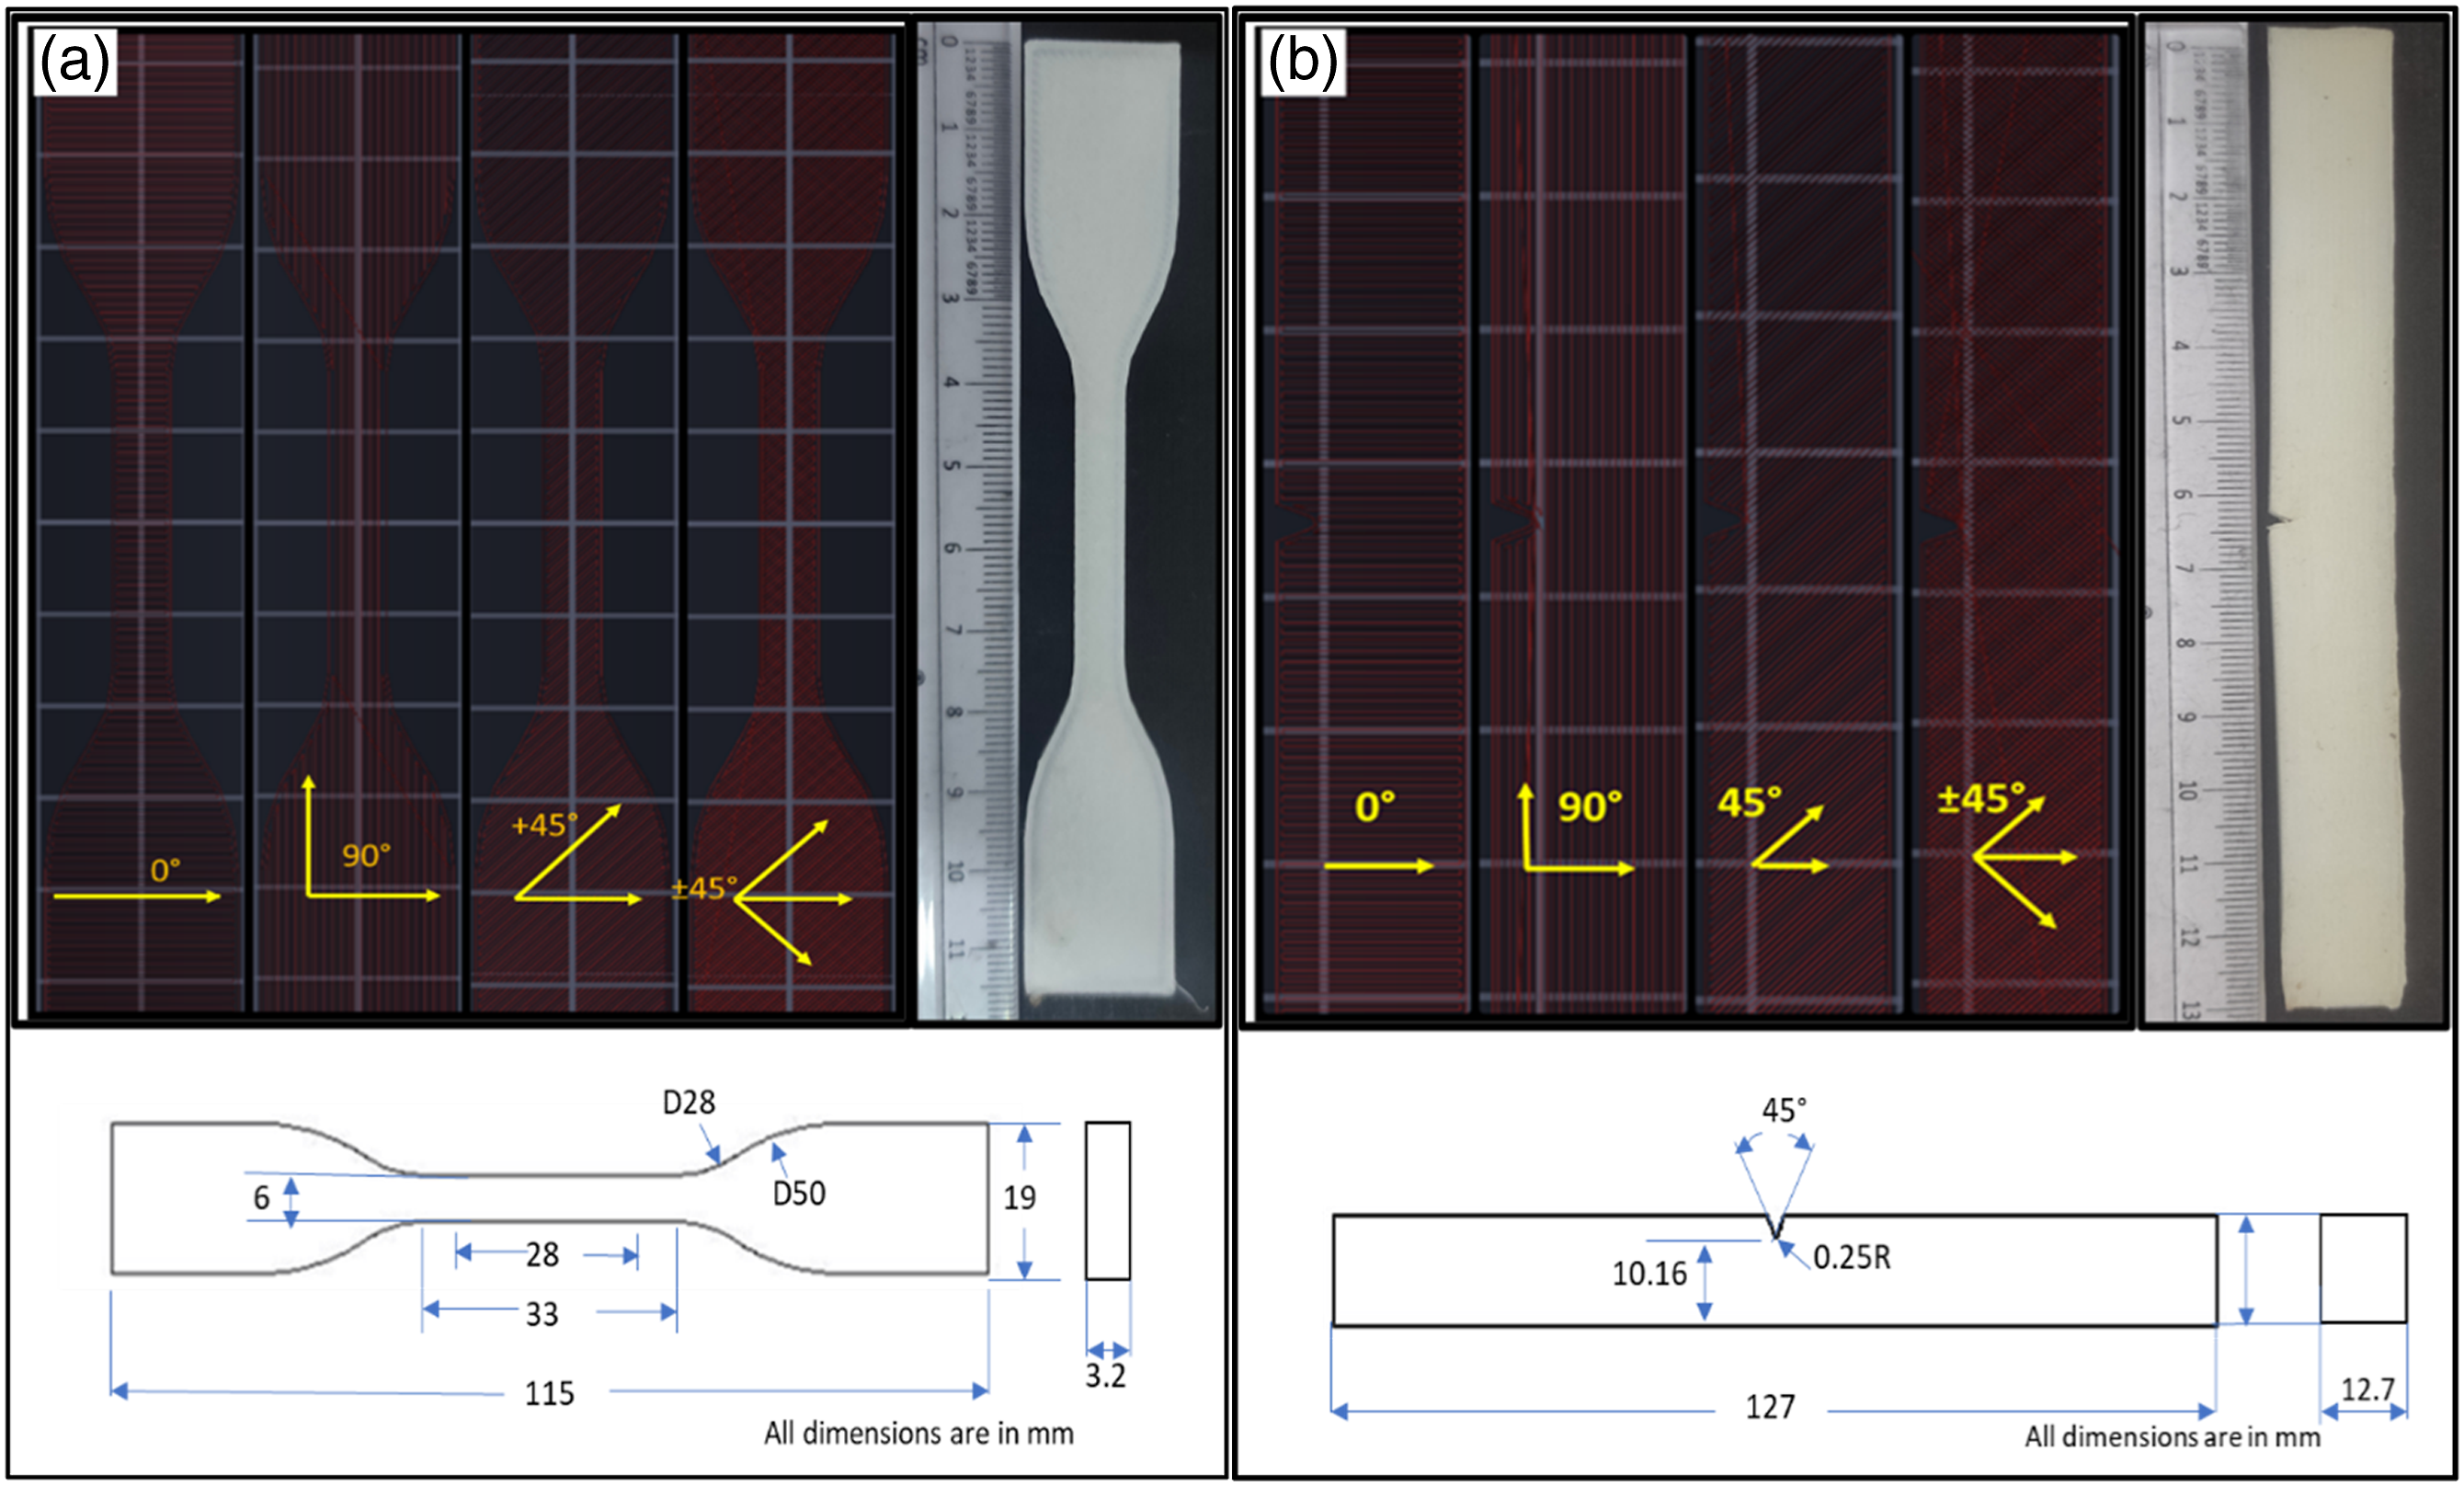
Charpy impact test
Charpy impact tests were performed with SC Dey & Company- model S1102 to study the energy absorption of the different samples. The Charpy test specimens are prepared according to ASTM D6110 with a notch, Specimens are printed with 0°, 45°, 90°, and ±45° raster orientations shown in Figure 2(b), and five samples for each set were tested and considered average values for discussion.
Field emission scanning electron microscope
Thermo fisher FEI Quanta 250FEG Field Emission Scanning Electron Microscope (FE-SEM) was used to study the phase morphology. The apparatus is fitted with a Schottky Field Emission Electron Gun, serving as the electron source, which functions within an operational voltage range of 5 kV to 30 kV. This setup allows for exceptional high resolution, achieving 1.2 nm at 30 kV under high vacuum conditions. The specimen was prepared by dipping in liquid nitrogen for 25 min and broken later cut into the required dimensions and then placed in a Quorum machine for gold sputter to improve the conductivity of the sample surface.
X-ray diffraction
Panalytical X pert3 X-ray Diffraction Analysis (XRD) instrument used to study the Crystalline morphology, electron source was 2.2 KW Cu anode Ceramic X-ray tube with Ni filter and Xcellator scientific used as a detector. 35 kV, 30 mA, and λ = 1.5406 Å over the range of 5° to 90° with the step size of 0.018°.
Results and discussion
Tensile test
The tensile properties of the samples were carried out for samples with varying raster angle orientation, namely 0°, +45°, 90°, and ±45° printed with PA and PACF materials. The ultimate tensile strength (UTS) of PA and PACF composites were determined and represented in Figure 3. Ultimate tensile strength of PA and PACF composite with varying raster angles.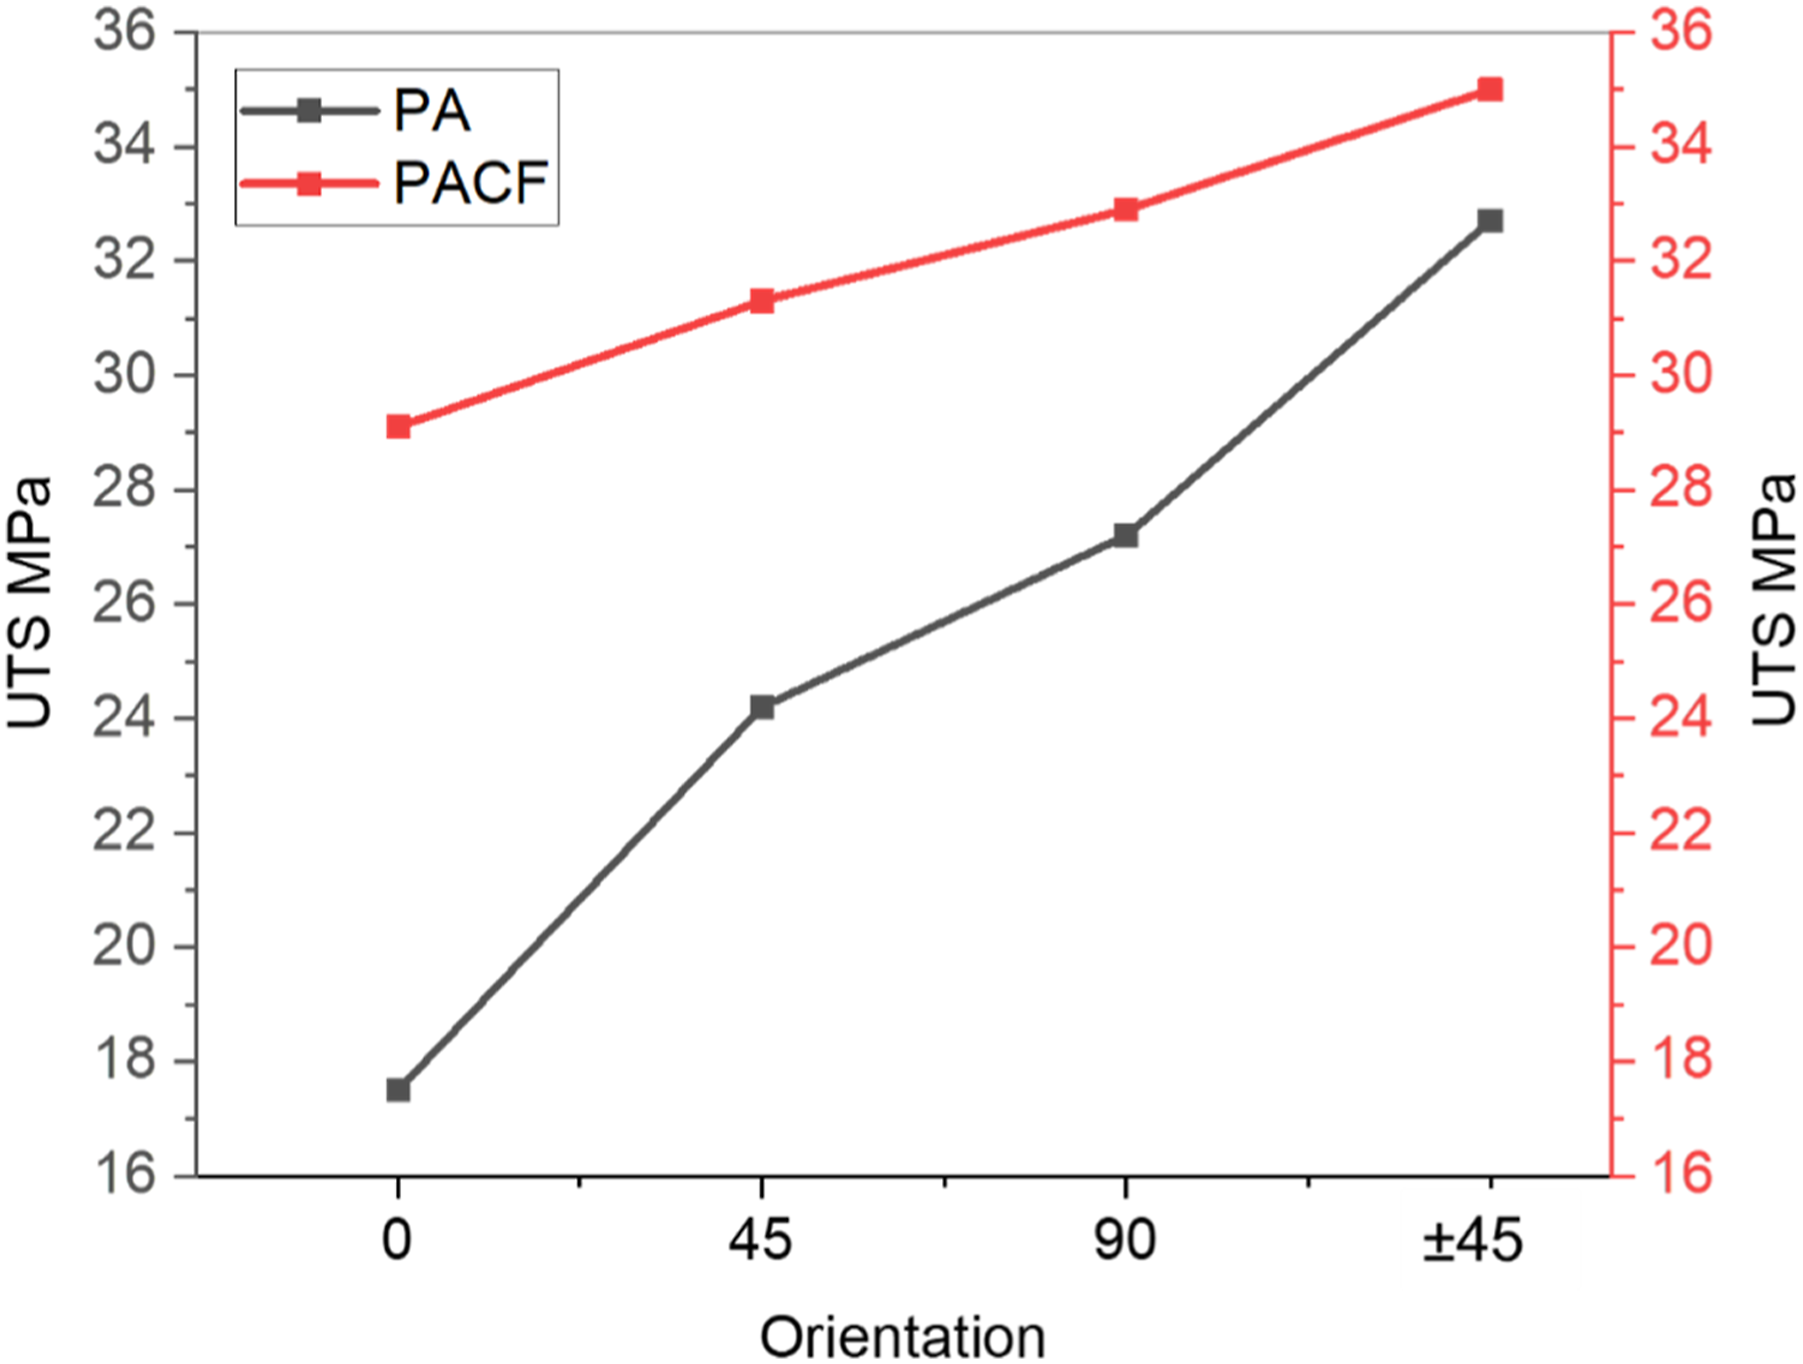
Figure 4 shows the engineering stress-strain curve for neat PA and PACF material fabricated with different raster orientations. It can be observed from the graph that the PA material printed with a 0° oriented raster showed the lowest UTS of 17.5 MPa. However, by orienting the raster angle to +45° the printed material has shown a 38% of increment in its UTS. This drastic variation in strength suggests that the raster angle orientation strongly affects the printed material property. Hence, an effort was made to print the material at 90° and ±45°. Surprisingly, it was found that the strength of the 90° printed PA showed a 55% increment, and the maximum strength was observed for ±45° which yielded the material with almost double the strength of 0° which was 32 MPa. Likewise, PACF composite material UTS values are observed from the figure that the 0° raster angle showed the lowest UTS of 29 MPa, nevertheless which was a 66% higher UTS value in comparison with neat PA 0° raster orientation moreover substantial increment of PACF UTS values seen for 45°, 90°, and ±45° orientations were 7%, 13%, and 20% respectively with 0° raster orientation printed with PACF material. The PACF with ±45° orientation shows the highest UTS of 35 MPa. Stress-strain curve for PA and PACF composite.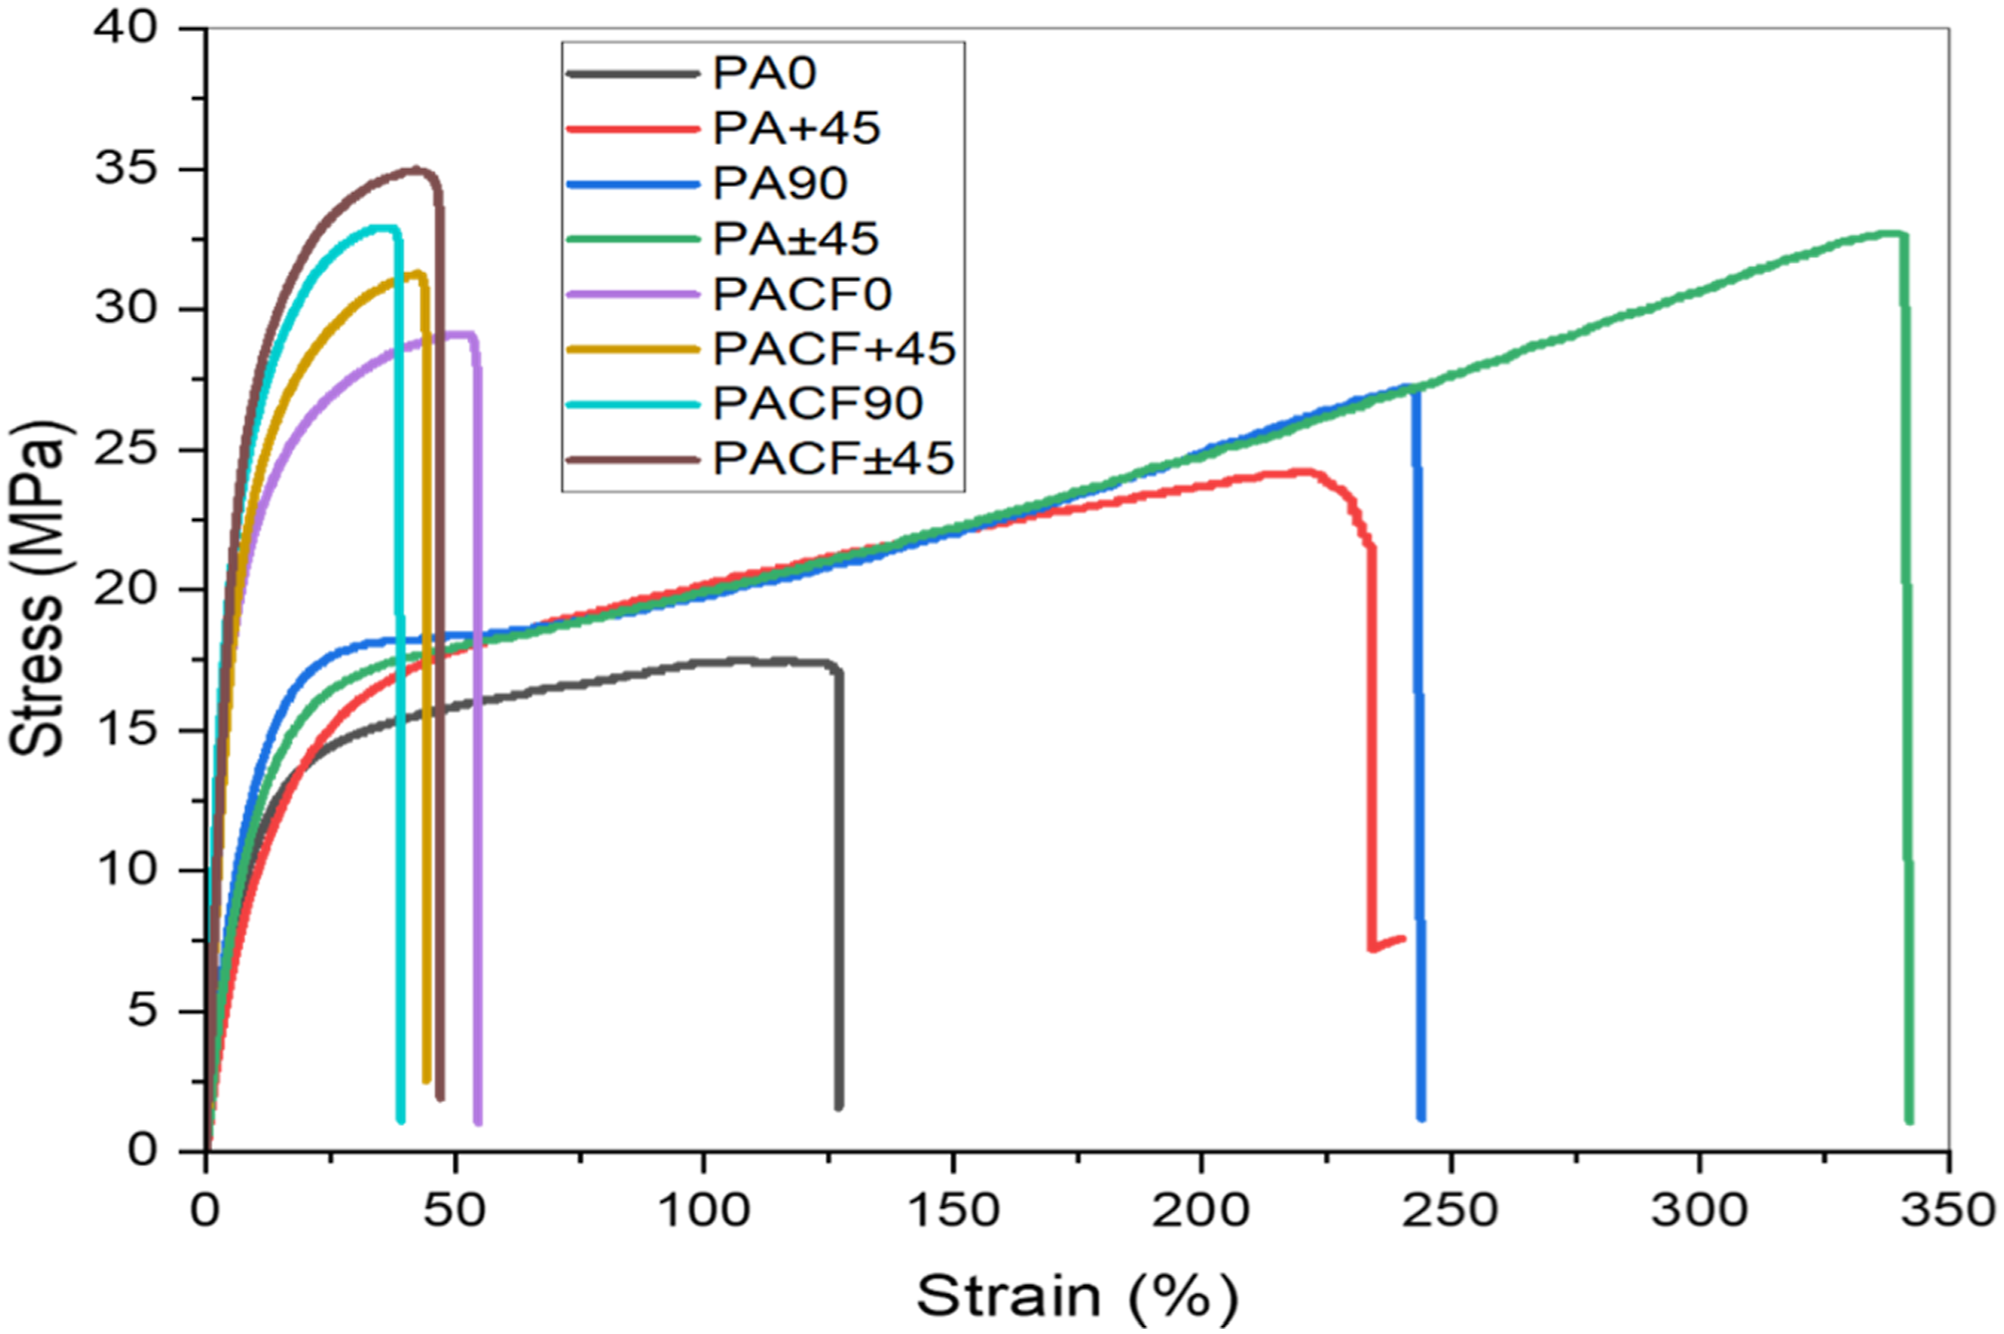
Figure 4 investigated the point of elongation of the PA and PACF materials, the lowest strain percentage at material break was observed in PA material with 0° raster orientation was 127, and elongation at break of 90°, +45°, and ±45° raster orientation was increased by 88%, 91%, and 168%, respectively compared to 0° raster angle printed with PA material. However, while the 0° raster orientation of PACF material resulted in a strain percentage of 54, it was reduced to 28%, 19%, and 13% for 90°, 45°, and ±45° respectively, when compared to the 0° raster orientation of PACF material.
The strength of the materials ±45° bidirectionally printed sample have higher UTS and was followed by unidirectionally printed sample with raster angles of 90°, +45°, and 0° in both the PA and PACF composite. This might be due to higher close pack density of bidirectionally printed samples compared to unidirectional printing. Also, it is clear that unidirectional sample with 90° raster orientation showed slightly less UTS due to less close pack density compared to bidirectional ±45° as shown in Figure 3. Figure 5 shows that the fracture pattern formed during tensile testing, since PA 0° raster orientation was the lowest tensile strength due to the fracture pattern being transverse to the applied load, and failure arises in between interlayer bonds. While the raster angle was 90°, the crack progressed in the transverse direction to the applied tensile load, however this time a fracture occurred because of raster failure. The specimen printed with a 90° raster orientation sample was stronger than the 0° raster orientation since the rasters are stronger than the bond strength of raster interfaces. The 45° unidirectional printed sample fractured due to failures of both rasters and interlayer bonding here shearing and tension effect acts on the sample during tensile testing, the crack beginning at the 45° angle and continuing in the same direction and the fracture occurred, with this reason the 45° raster-oriented sample UTS value located in between 0° and 90° raster orientated samples. Similar outcomes were observed by Betül Gülçimen Çakan in his work with ABS material.
49
Tensile fracture samples (a) Pure PA, (b) PACF material.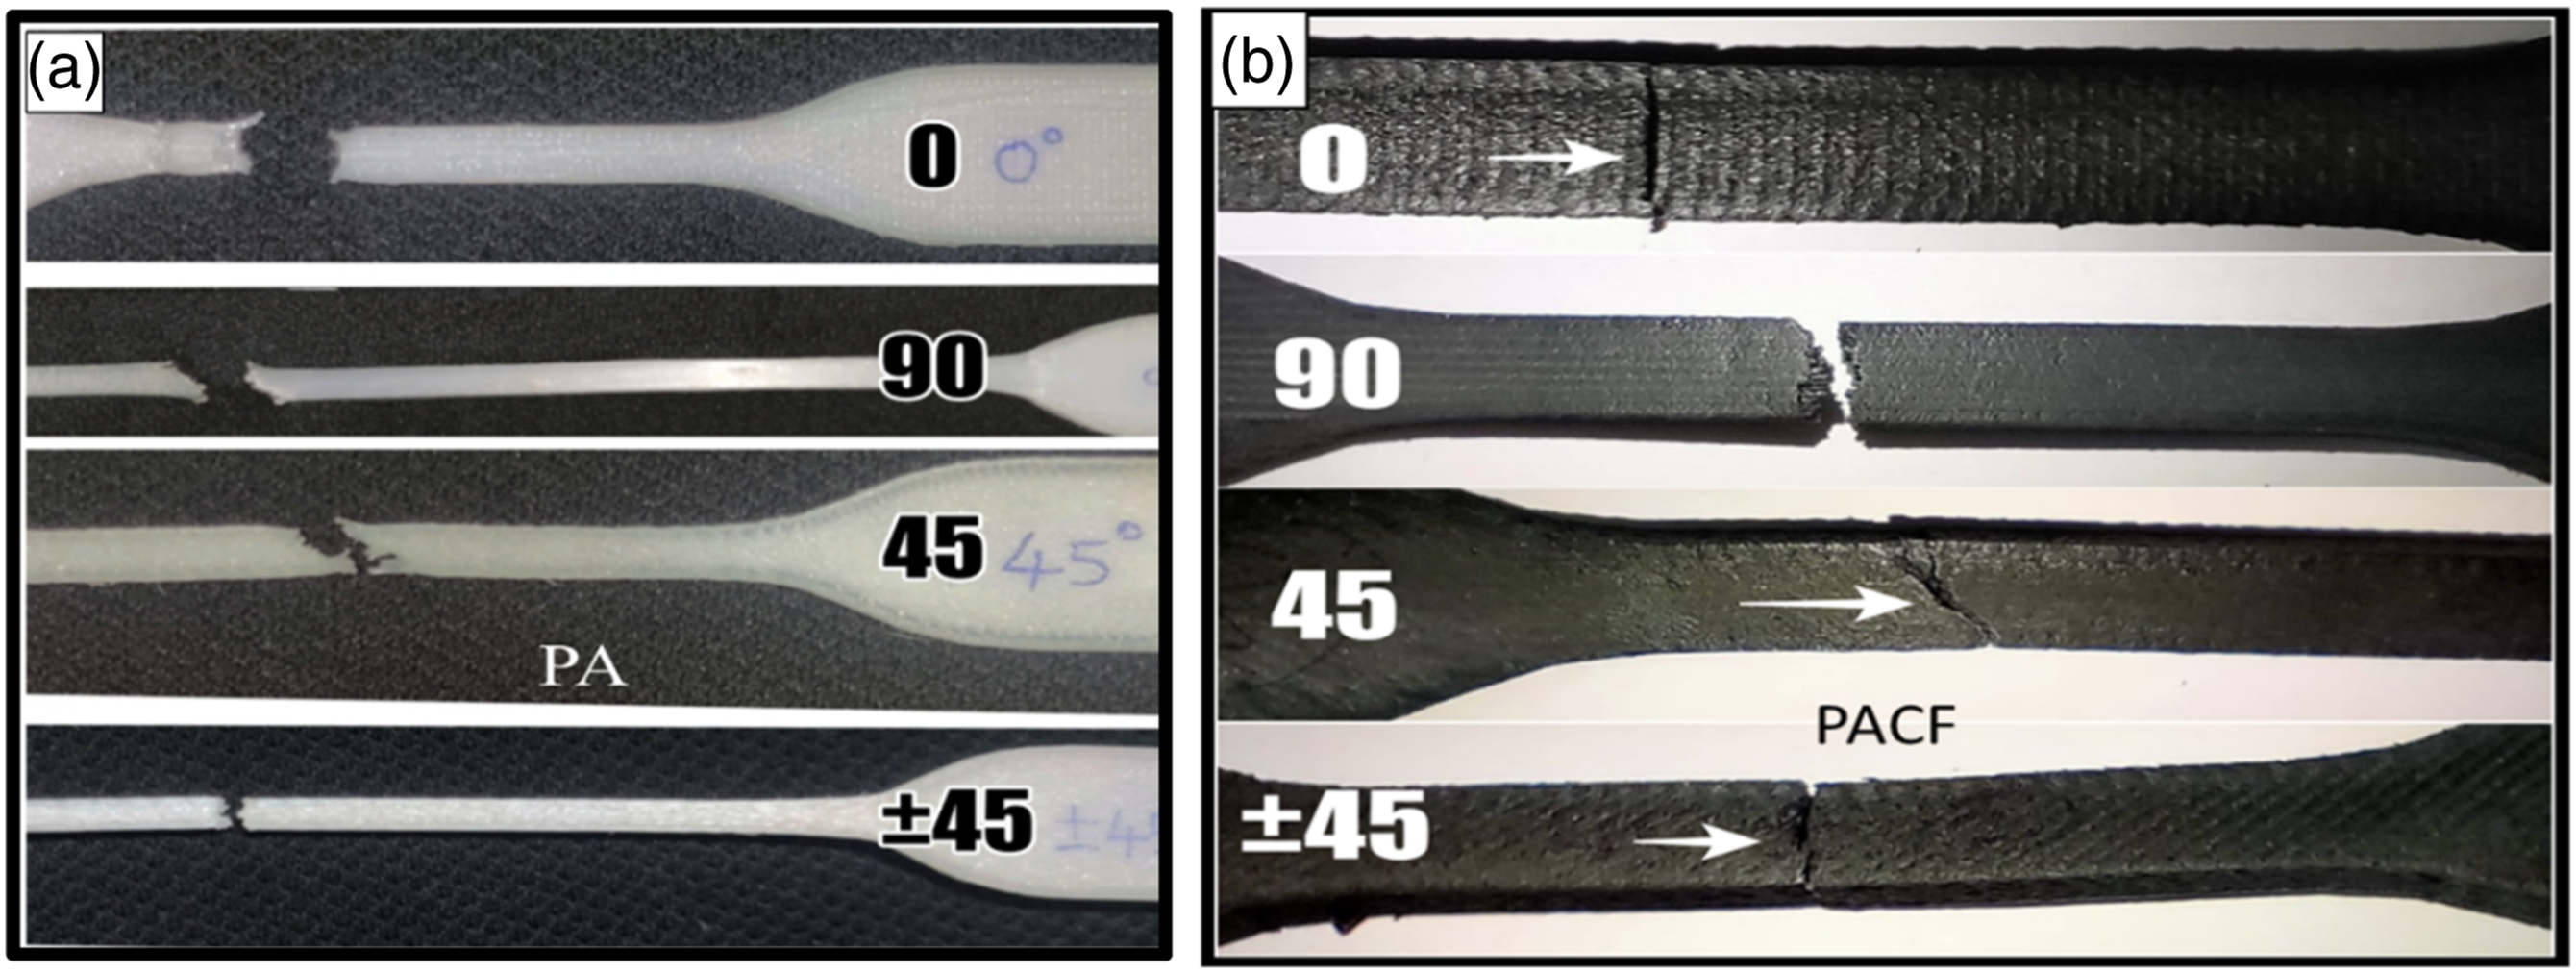
In unidirectional layups, the effect of fiber rotation was limited due to the rapid failure followed by raster debonding throughout all layers. However, in the bidirectional ±45°, alternate layups prevent such a failure and give extra resilience, allowing substantial fiber rotation. This results in higher elongation as well the rasters are overlapped and packed densely so that the highest UTS value was obtained. 41
Charpy impact test
Figure 6 shows the Charpy impact energy, the impact energy of neat PA with ±45° raster orientation was 24.5 kJm−2 and then decreased in the order of 22, 20.9, and 18.5 kJm−2 for 0°, 90°, and 45° raster orientation respectively. In the case of PACF composite material with 90° raster orientation observed at 64.1 kJm−2, decreased in the order of 54, 46, and 42 kJm−2 for ±45°,0°, and 45° respectively. Impact energy of PA and PACF composite with varying raster orientations.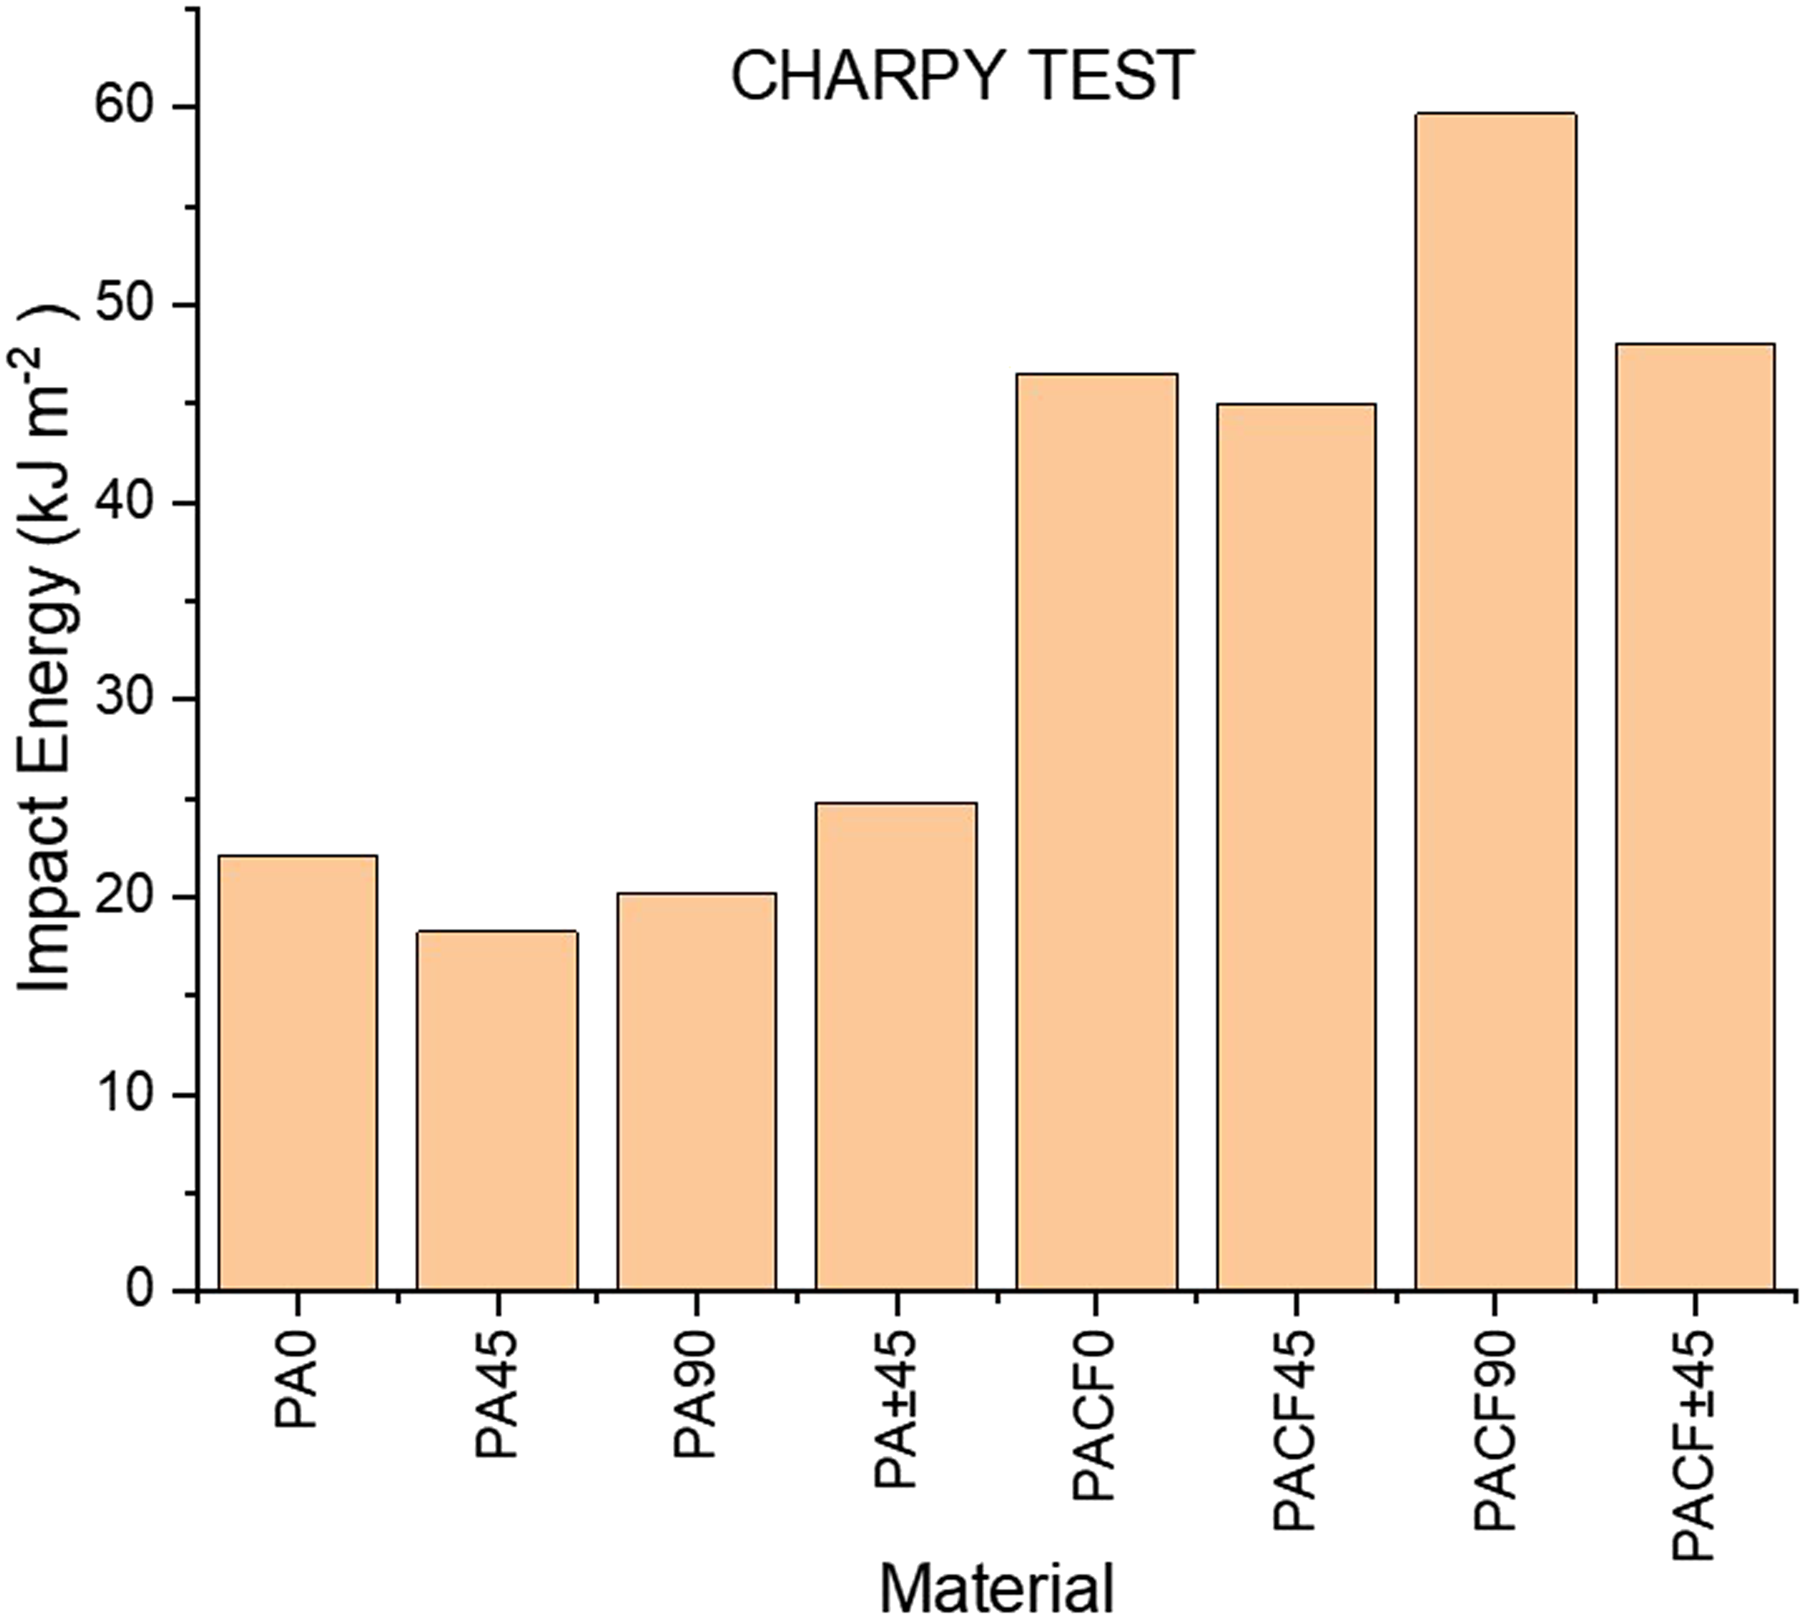
Figure 7 shows the fracture pattern of the Charpy specimen. The crack propagated in the loading direction deformed due to raster detachment from each other in a 0° raster-oriented specimen, revealing the strength of the bond between each raster. Also it is clearly seen that a zigzag mode of failure pattern in the 45° orientation. This mode of failure occurs with rasters and bonding between adjacent rasters, so that lower impact energy absorption is compared to all other than the unidirectional 45° raster-oriented sample. The PACF material was printed with a 90° raster orientation fracture pattern denotes that rasters break and become deformed, but in pure PA specimens, the rasters are delaminated rather than breaking. These rasters indicate inadequate adhesion since there is insufficient bonding between the layers with higher elongation and also anisotropic nature.
50
Angel R. Torrado et al.
51
aimed to minimize anisotropy in FDM printed samples by improving ABS with additions, studied six polymer matrices and four polymer blends and it was demonstrated that anisotropy decreased with the addition of additives. Fracture pattern of Charpy specimen.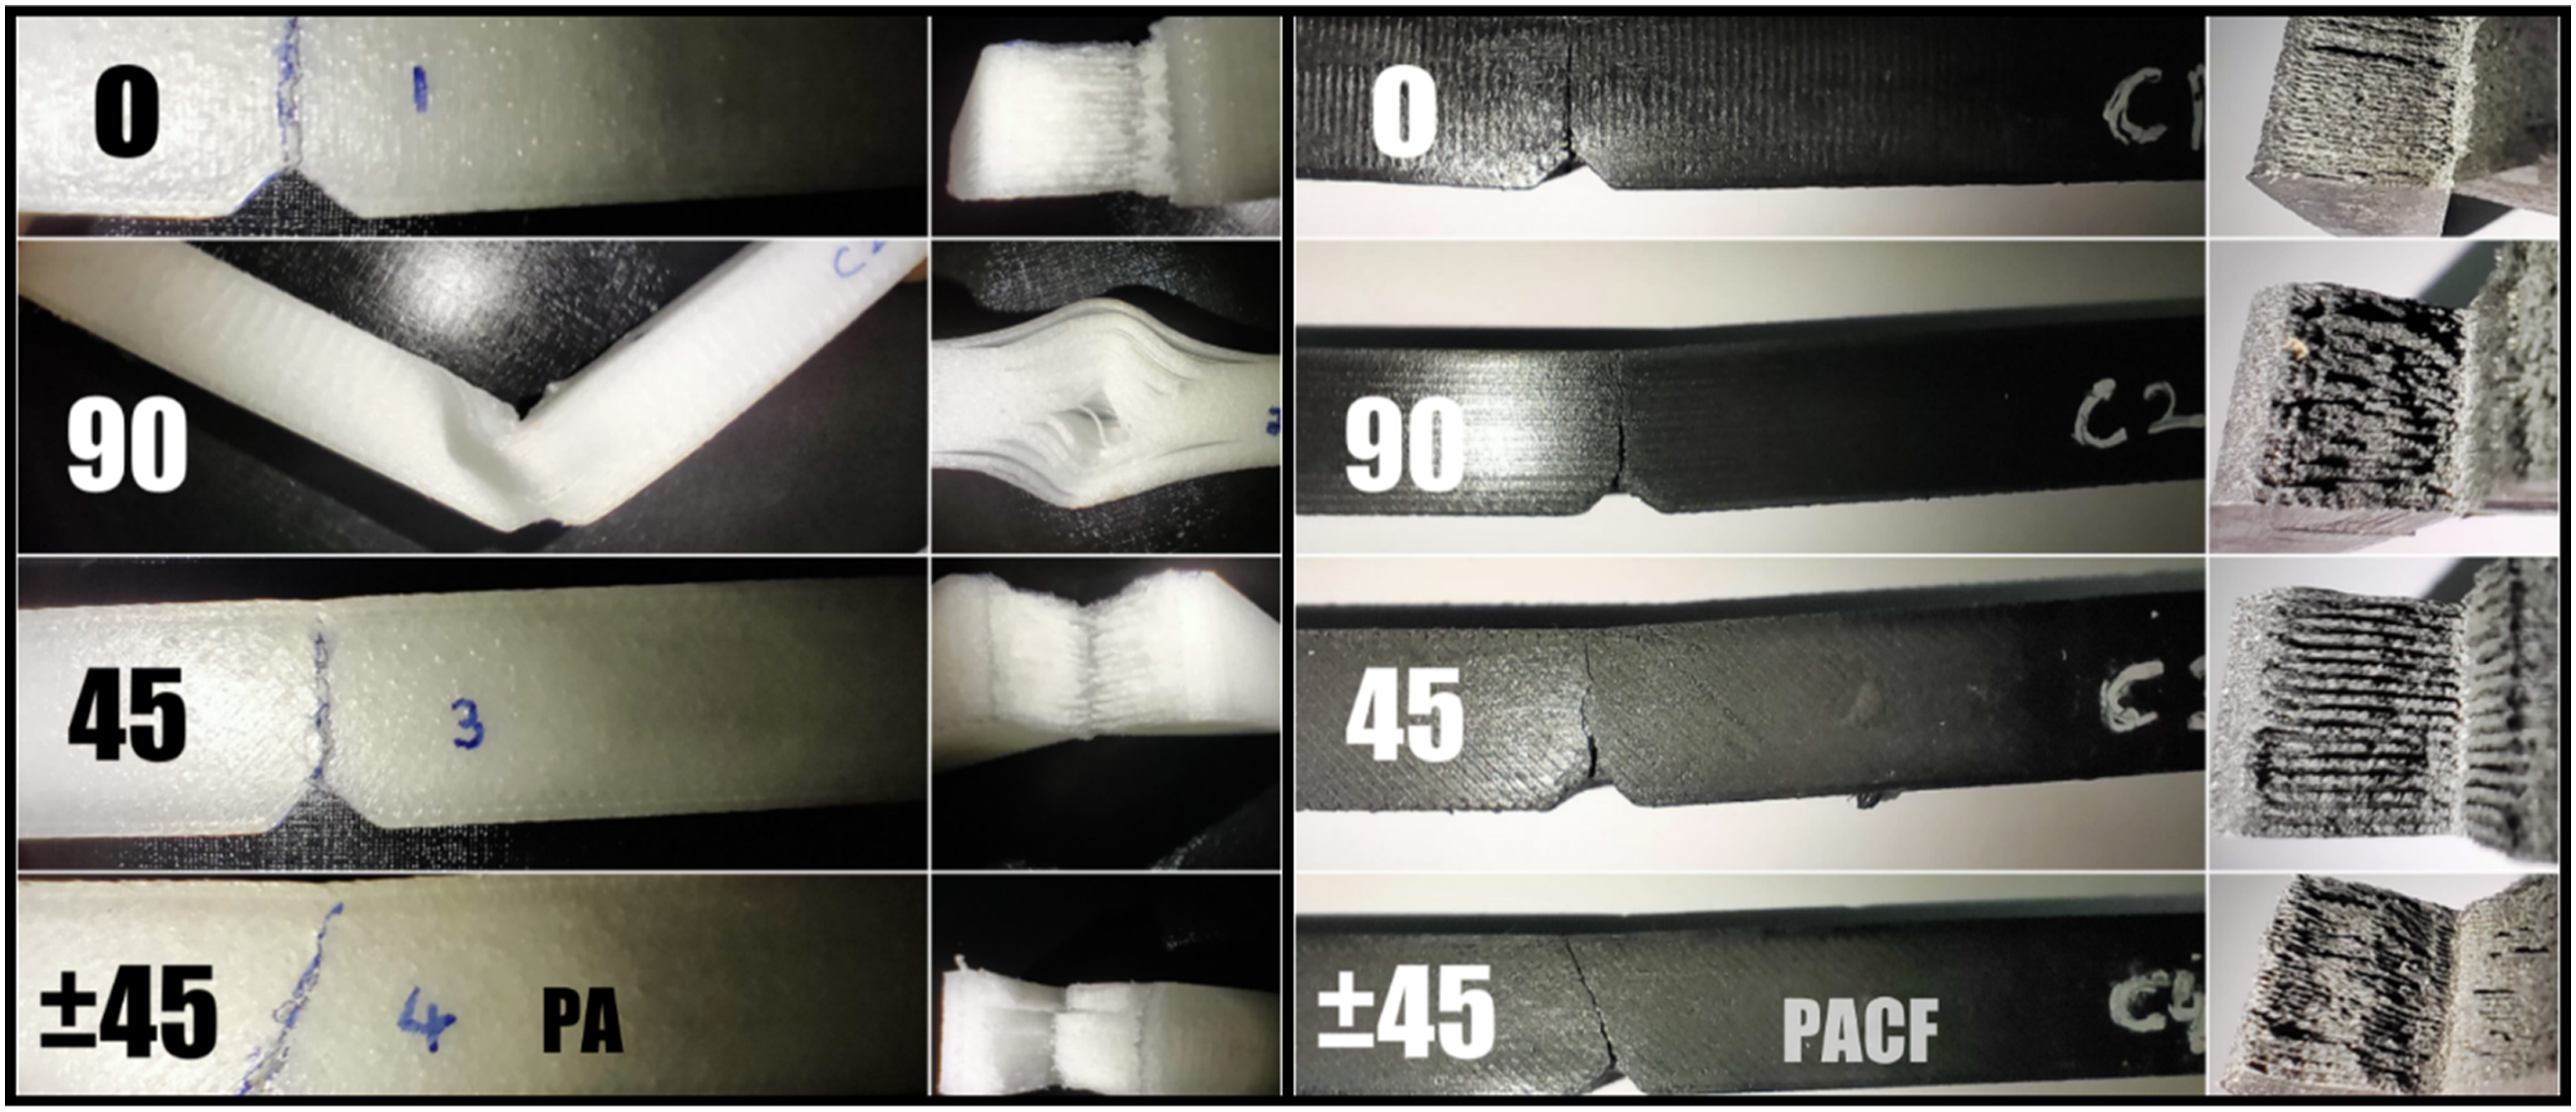
The samples are printed with ±45° bidirectional raster orientation was observed that the crack propagated at 45° to the impact load. The PA material specimen printed with bidirectional ±45° shows higher values of impact strength than those unidirectional oriented 0° and 45°, PA material oriented with 90° was not accounted for because of the incomplete fracture. In the case of PACF 90° raster orientation specimen gave the highest impact energy compared to all others. This is because, while performing the Charpy impact tests, the orientation of rasters perpendicular to the direction of the applied stress in the former fosters a higher toughness or energy absorption at failure. 52
Morphological analysis of PACF composite
Figure 8 shows FE-SEM image of the printed specimen with raster orientation ±45° with PACF filament. Carbon fiber, fiber pull-out hole, and porosity void areas are present in the raster and are indicated by black, blue, and red colour circles, respectively. The author Fuda Ning
53
observed that the porosity decreased for specimens with increasing CF content. In this study Figure 8(a) shows that the porosity in the bead was observed with a 20 wt.% CF content in the PA matrix at a lower magnification. These porosity or void areas will form because of air evolution, which will occur mostly during the extrusion of feedstock filament. During material deposited using FDM, porosity and CF distributions in the filament caused uneven layer fusion. Morphological analysis of PACF composite observed at (a) Lower magnification and (b) higher magnification.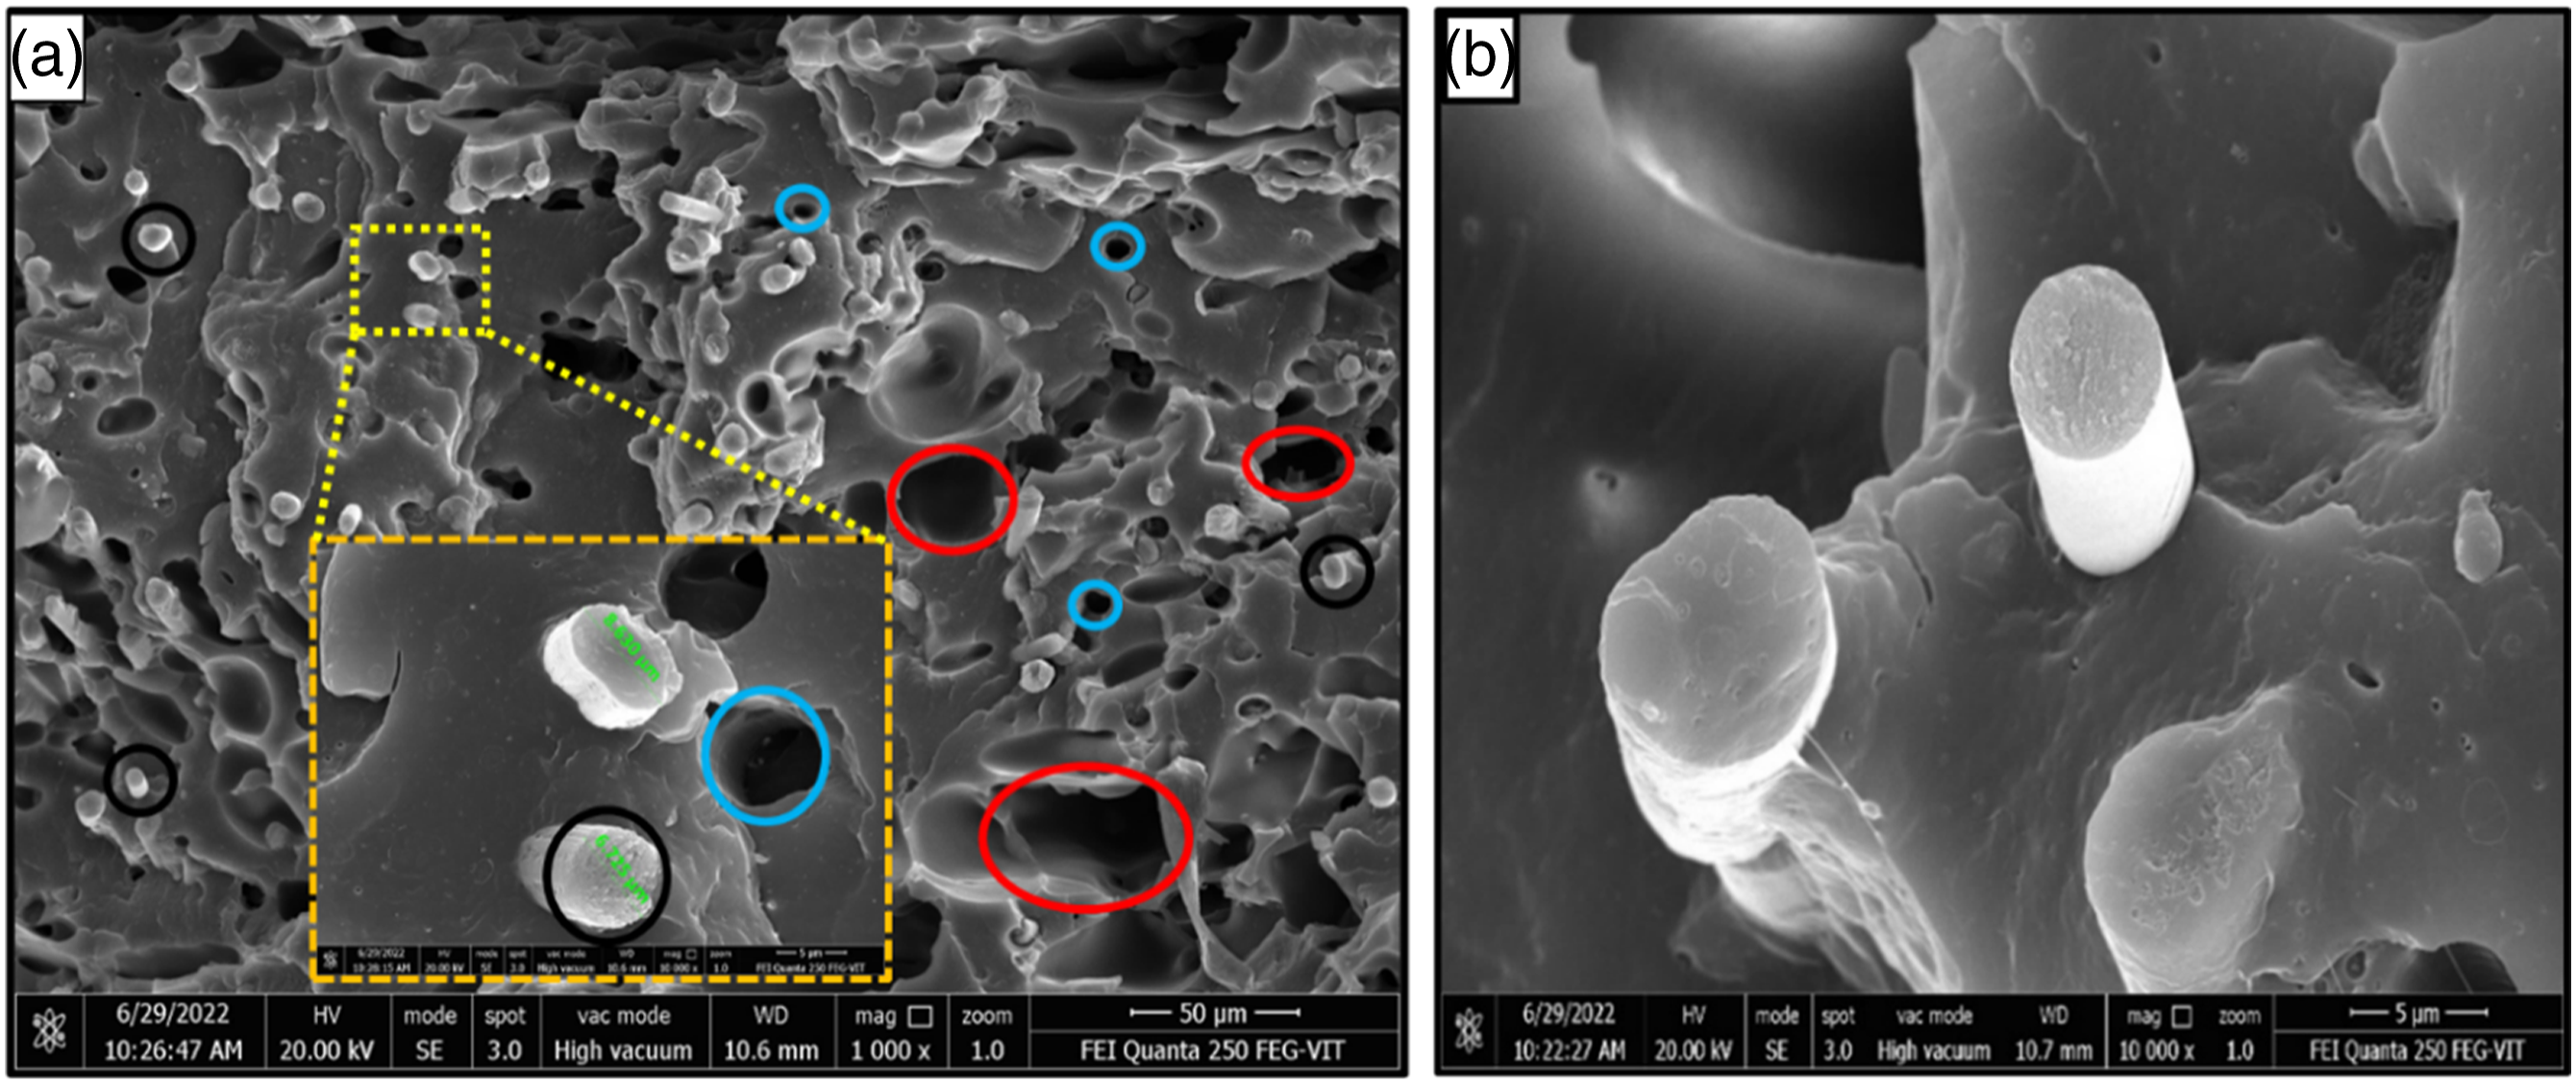
The pull-out holes also appeared on the fracture interface of the specimen caused by the pulled-out CF and however, these holes should not be regarded as the specimen’s inherent porosity. According to the SEM micrographs Figure 8(b), the interfacial bonding between the PA and CF was sufficient to give outstanding reinforcement characteristics of composites. Also, there is a good compaction between the subsequent layers without much voids or gap during printing. The PACF composites are strongly adhered together, and the interface shows very good interaction, which leads to superior mechanical properties. 22
X-ray diffraction analysis
The XRD diffractograms of pure PA and PACF reinforced composite are presented in Figure 9. It is clear from the graph that pure PA revealed two intense peaks at 2θ of 20.3° and 22.9° exhibiting (100) and (010,110)54,55 respectively. X-ray diffraction of pure PA and PACF Composite.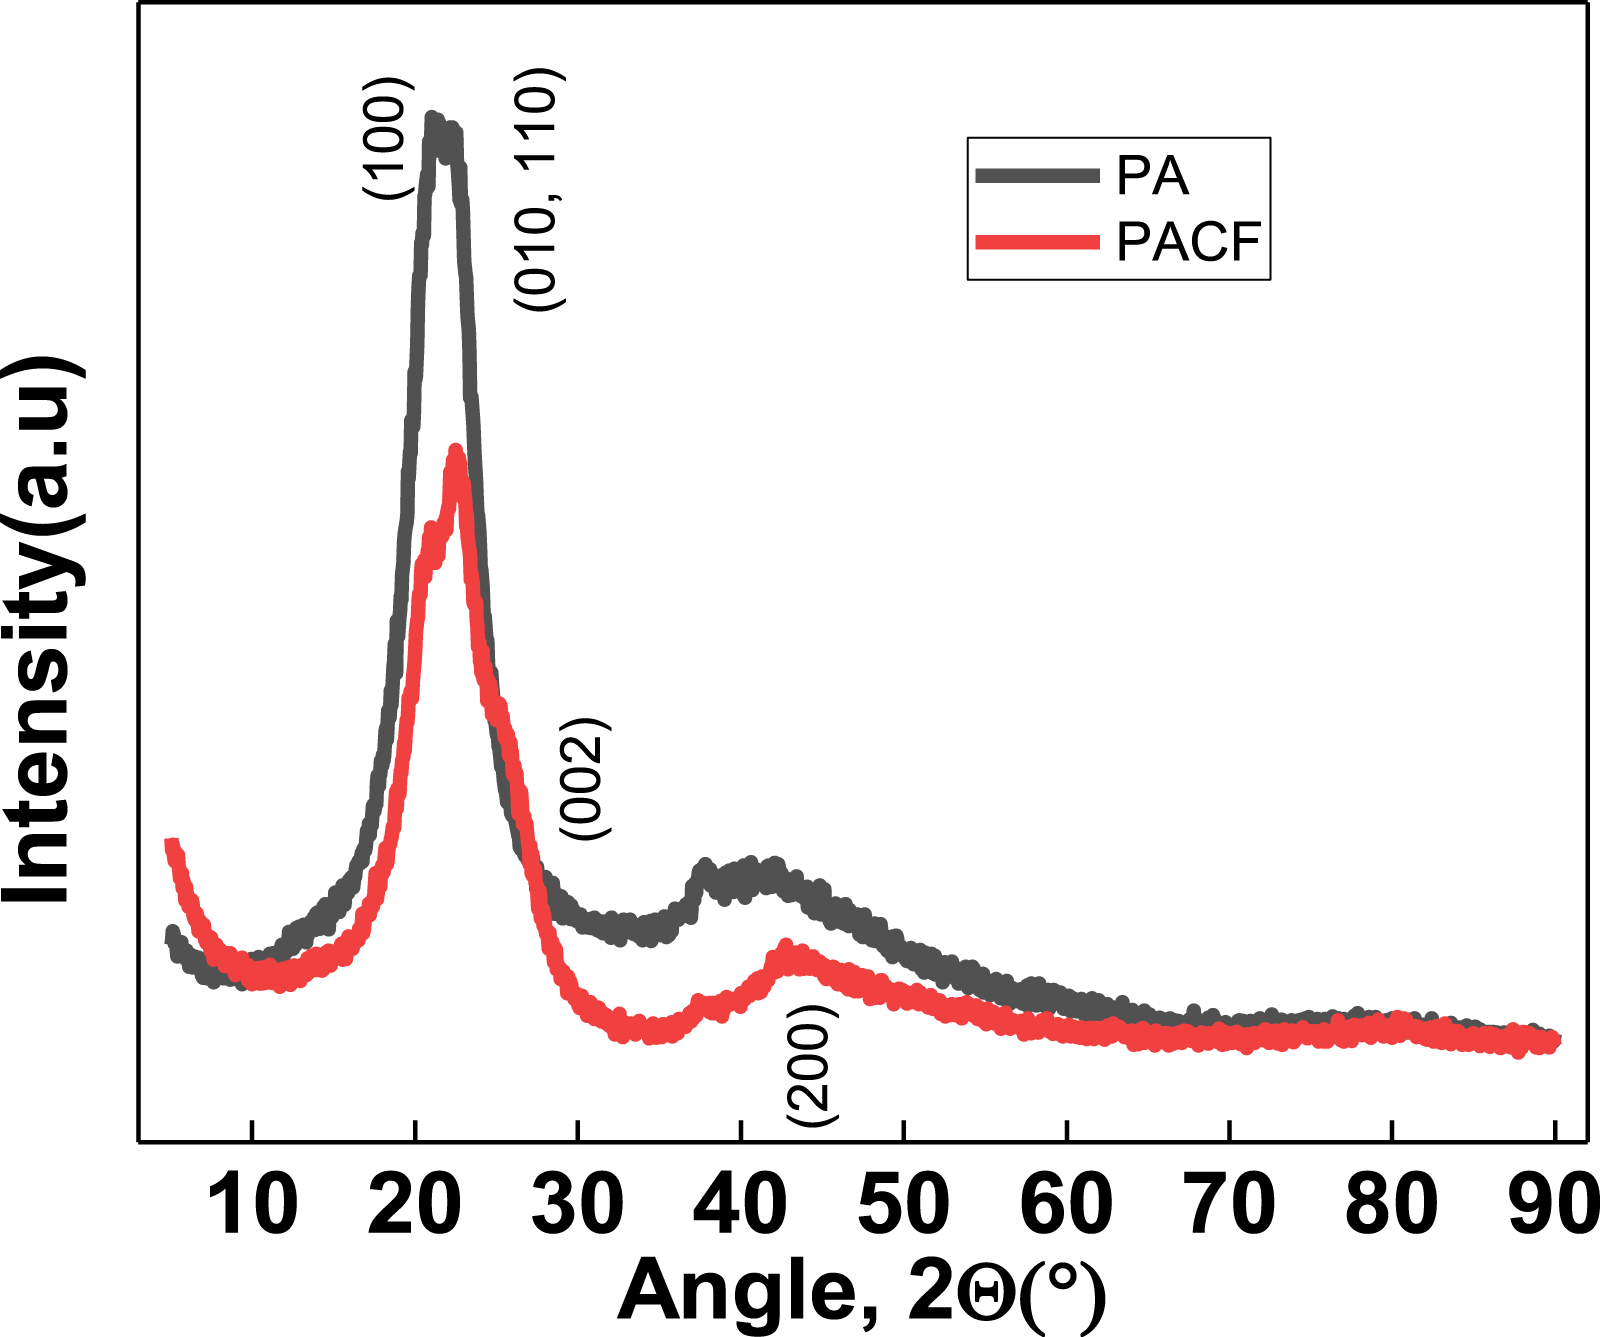
In case of PACF composite, the peak at 2θ of 20.3° corresponds to PA and another intense peak at 2θ of 22.9° form a sharper peak in the case of PACF composite material. Moreover, two new peaks appeared at 2θ of 26.5° and 42.8° confirming the presence of carbon fiber, corresponding to the (002) and (200) crystal plane of the carbonaceous materials. 56 The XRD of PACF composites shows the peaks corresponding to PA and CF respectively.
Conclusion
The comprehensive investigation on the influence of raster orientation on the mechanical properties of PA and PACF composites has revealed valuable insights in FDM based manufacturing technique. The ultimate tensile strength of both neat PA and PACF composite exhibited its highest value, when the raster orientation was set at ±45° bidirectional as comparison to 0°, 45°, and 90° unidirectional raster orientations. PACF composite showed the highest value of ultimate tensile strength of 35.2 MPa at ±45° bidirectional orientation and this might be due to the highest close pack density. This finding highlights the importance of bidirectional alignment in FDM technique in achieving superior mechanical performance in these materials.
Furthermore, the investigation demonstrated that PACF composites displayed a significantly higher enhancement in ultimate tensile strength as compared to pure PA. Notably, at 0° raster orientation, the PACF composite showed an impressive 66% increase in ultimate tensile strength compared to neat PA, show casing the potential for substantial improvements through composite reinforcement. Moreover, the investigation identified that a raster orientation of 90° led to the highest impact energy observed in PACF composites, indicating the importance of this orientation for impact-resistant applications. Importantly, the morphological examination of the composites confirmed strong adhesion between PA and CF, which plays a crucial role in contributing to the superior mechanical properties observed in PACF composites.
The present investigation the significance of raster orientation in tailoring the mechanical properties of PA and PACF composites, offering valuable knowledge that can guide the design and manufacturing of high-performance materials manufactured by FDM based additive manufacturing for various engineering applications. The findings contribute to advancing our understanding of composite materials, ultimately opening new avenues for the development of stronger, more resilient, and efficient materials in the future.
Footnotes
Acknowledgements
The authors thank Vellore Institute of Technology, Vellore for providing ‘VIT SEED Grant - RGEMS fund (SG20220116) for carrying out this research work. The study reported here was carried out using resources at the Additive Manufacturing Laboratory (Polymer), School of Mechanical Engineering, VIT, Vellore.
Declaration of conflicting interests
The author(s) declared no potential conflicts of interest with respect to the research, authorship, and/or publication of this article.
Funding
The author(s) disclosed receipt of the following financial support for the research, authorship, and/or publication of this article: This work was supported by the VIT University (SG20220116).