
Abstract
There is growing industrial and academic interest in manufacturing of biocomposite parts comprised of natural fibers in a thermoplastic matrix that begin as a commingled, unconsolidated preform. Unfortunately, little thermal property data exists in the literature for simulation/analysis of processes used to make parts (e.g., pultrusion, Automated Fiber Placement (AFP), and compression molding). In this paper, the authors explain how specific heat capacity and thermal conductivity values of both constituent materials and the biocomposite preform are measured in a direction transverse to the fiber length, and how the effect of entrained air is included. Thermal property values for hemp and flax fibers along with polypropylene and polyethylene filaments, measured both individually and combined into apparent values for the preforms, are compared with experimental values. Finally, determination of thermal properties for use in pultrusion simulation is explained as a case study.
Introduction
Polymer composite materials consist of strong and stiff reinforcement fibers such as glass, carbon, aramid, or basalt encapsulated in a thermoset or thermoplastic resin matrix. The combination of these constituent materials provides superior mechanical properties (e.g., high specific strength and stiffness) and other advantages as compared to their homogenous counterparts. As such, the worldwide composites market, estimated to be worth $86 billion in 2020, is expected to increase at a compound annual growth rate (CAGR) of 6.6% from 2021 to 2028. 1 Strong natural bast fibers such as hemp and flax are also gaining in popularity for use in composites, because they offer specific mechanical properties similar to glass or basalt for many applications but as more sustainable alternatives. Accordingly, the market for such ‘biocomposites’ is expected to explode at a CAGR of 14.20%, from $21 billion in 2020 to $61 billion in 2028. 2 Another important trend in composites is that thermoplastic matrices are oftentimes preferred over thermosets because of their superior toughness, inherent bendability, better reprocessibility, and lower carbon footprint, 3 although their use in biocomposites is quite limited.
The expected increased use of thermoplastic biocomposites in products (based on the aforementioned trends) will involve process simulation, but such analysis requires unique material properties due to the format of the raw materials. Since thermoplastic melt viscosities are commonly 3–4 orders-of-magnitude higher than those of uncured thermoset resins (e.g., epoxy), which makes reinforcement impregnation difficult, a common method that avoids this problem is to commingle fibers with thermoplastic filaments to melt in place and minimize impregnation distances. There are several manufacturing processes currently used to fabricate parts comprised of commingled, unidirectional tow comprised of natural fibers, thermoplastic filaments, and entrained air (Figure 1(a)) including pultrusion, automated fiber placement (AFP), and compression molding.
4
Thermal analysis of these composite processes and related tooling requires heat transfer properties, particularly thermal conductivity and specific heat capacity, of the unconsolidated tow (fiber + thermoplastic filament + air) in a direction transverse to the direction of fibers and filaments. Schematics of (a) a unidirectional tow consisting of thermoplastic matrix filaments commingled with natural fibers and (b) a pultrusion process utilizing a commingled rope as input.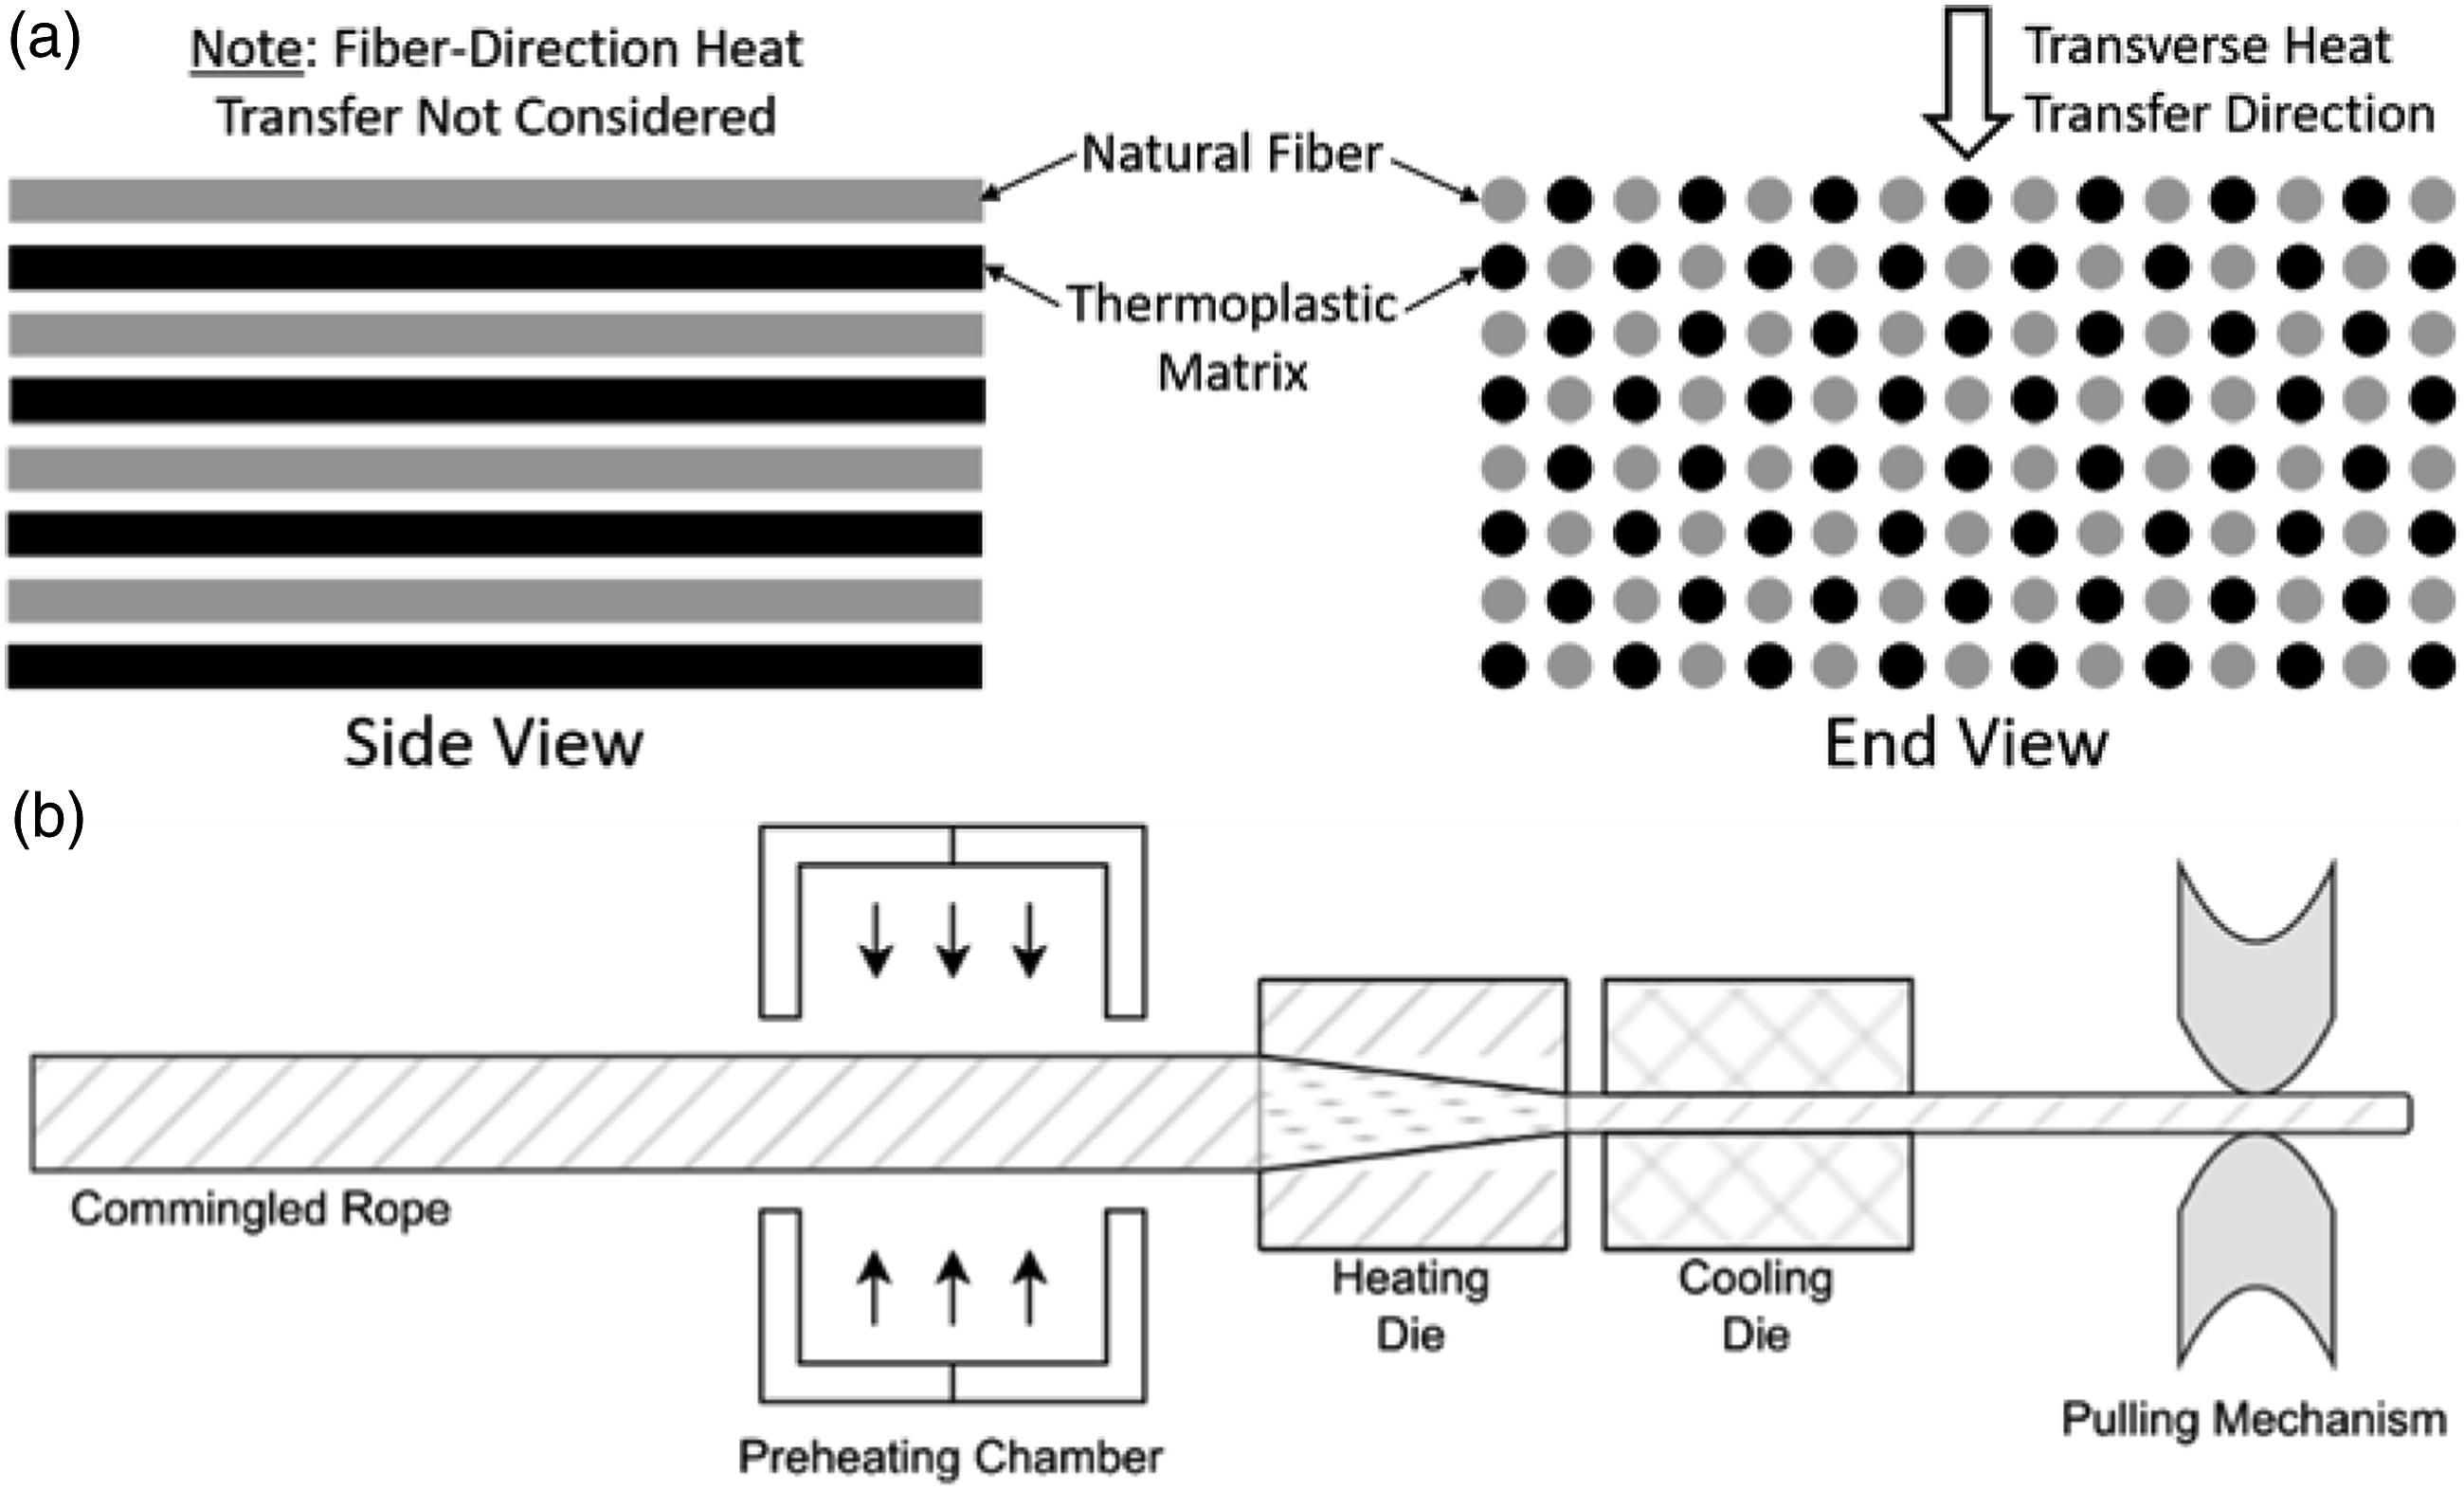
Related research on each of these processes in the context of thermoplastic biocomposites is as follows. • Pultrusion, a continuous manufacturing process used to manufacture biocomposites with constant cross sections (cylindrical, rectangular), has been successfully demonstrated for thermoplastic composites and biocomposites such as graphite/PPS (polyphenylene sulfide),
5
flax/polypropylene
6
and, flax/polylactic acid (PLA).
7
Thermoplastic composite pultrusion, shown schematically in Figure 1(b), differs from pultrusion of thermoset composites in that it uses: commingled tows as input; a preheating device for the input material; a heated die to finish melting the matrix then consolidate and ensure good fiber impregnation and consolidation; and an additional cooling die to impart dimensional stability to the final pultruded part by solidification.
7
Linganiso et al. pultruded biocomposites of flax/PLA commingled yarn,
7
and Van de Velde et al.
8
and Angelov et al.
9
worked with flax/polypropylene commingled yarn. Van de Velde concluded that flax fiber is a desirable reinforcement material due to its environmental advantages. Angelov
9
found that for a particular pultrusion speed (24 cm/min) and die temperatures (230°C), the pultruded flax/PP profiles had comparable mechanical performance to those of compression-molded parts. Memon and Nakai
10
also developed a pultrusion system for jute/PLA commingled yarn. • Automated fiber placement (AFP), an advanced manufacturing process used to manufacture complex aircraft parts, uses a robotic/gantry system with an attached fiber placement head to heat and lay down multiple strips of thermoplastic composite tow onto a tool surface and simultaneously consolidate it. Adhesion between the tows is ensured by appropriate heating, compaction, and tow tensioning systems.
11
Lamontia et al.
12
developed a three-stage out-of-autoclave AFP layup specifically for thermoplastic matrices. The first hot line compactor establishes initial intimate contact and healing, the second compactor maintains temperature to complete healing of the polymer chains, and the third cold compactor chills the material and compresses voids. • Compression molding uses heated matched molds and external pressure to melt and consolidate commingled thermoplastic composite tows and/or textiles into high-performance components. The combination of heat and pressure produces a composite part with low void content and high fiber volume fraction. Compression molding has been utilized to develop various biocomposite systems such as wood fiber/polypropylene,
13
sisal/epoxy
14
and jute/glass hybrid composites.
15
To expand on the main point previously mentioned, effective tooling design using analytical and/or computational modeling for the aforementioned manufacturing processes involving a commingled natural fiber/thermoplastic filament material format requires accurate transverse thermal properties to predict the degree of fiber impregnation with thermoplastic resin. Discussion of such properties is sparse the literature. Accordingly, this paper focuses on this gap in knowledge by: (1) discussing the methodology and equipment used for determining thermal properties for a commingled format; (2) comparing different material models for estimating the combined properties of commingled fiber and matrix filaments; and (3) providing specific heat capacity and the transverse thermal conductivity of four specific biocomposite material systems – all combinations of two common recyclable thermoplastics, polyethylene and polypropylene, and the two strongest natural bast fibers, hemp and flax.
Background
Fibers from bast fiber plants, primarily hemp and flax, have been used as reinforcement in various composite systems as reflected in numerous research studies6,16–19 related to the mechanical properties of the consolidated composite material. Hemp fiber-reinforced composites are considered an emerging market in the US since the production of hemp was only legalized in 2018 under the Farm Bill. 20 Flax was once one of the most important crops for US farmers, but it is now grown almost exclusively in North Dakota and Minnesota. 21 Bast fiber-reinforced thermoplastics have many advantages over their thermoset counterparts such as low processing cost and design flexibility. 15
There has been significant research on hemp- and flax-based thermoplastic composites and characterization of their mechanical properties 16–18,22–24 yet studies pertaining to the thermal properties are less prevalent. Volk et al. 25 pultruded large thermoplastic profiles of up to 40 mm diameter using glass fiber/PET commingled yarns. They were able to manufacture such large profiles only through careful die design and the selection of the processing parameters based on FEM thermal modeling. This further affirms the importance of the thermal properties of the flax/hemp commingled (unconsolidated) mix, irrespective of the manufacturing process used. Li et al. 26 attempted to determine the thermal conductivity and specific heat capacity of flax/polyethylene biocomposites prepared through extrusion where the thermal properties did not change significantly in the range of 170–200°C. The properties decreased with increasing fiber content. Aydin et al. 27 observed the effect of alkali treatment on Digital Scanning Calorimeter (DSC) thermograms of Flax/PLA based composites, but they failed to determine the specific heat capacity from the thermograms nor thermal conductivity. Kannan et al. 28 performed a similar study with Flax/polypropylene composites, yet the DSC analysis does not extend to the calculation of specific heat capacity and there is no mention of thermal conductivity analysis as well. Behzad and Sain 29 measured the thermal conductivities for hemp thermoset composite manufactured through a novel solution-based technique in both in-plane and transverse directions and their empirical conductivities showed good agreement with mathematical models. Their work focused on thermal conductivity of pure hemp fiber only. To the best of the authors’ knowledge, these are the only studies that provide information on the thermal properties of either hemp or flax fiber composites, and nothing in the literature discusses commingled yarns.
Experimental and theoretical plan
The experimental and theoretical plan addresses two specific thermal properties in the transverse direction only of comingled fibers comprising a porous preform with entrained air present: (1) specific heat capacity and (2) thermal conductivity. Both of these properties along with density are essential for both analytical and computational modeling of the aforementioned processes.
Materials used in this study were sourced domestically. The hemp and flax fibers were combed top roving from Living Dreams Yarn (Rainier, WA, USA). Polyethylene (PE) filaments with an average diameter of 0.13 mm were obtained from Berkley FireLine, USA. Polypropylene (PP) twine with an average diameter of 2.16 mm was obtained from HyperTough, Inc. The PP twine was eventually separated into individual filaments for testing. Low density PE and PP sheets of 1.75 mm, 3 mm and, 4.5 mm thicknesses made of the same polymer grade as the filaments were used to measure thermal conductivity of the virgin PP and PE with no porosity. For this study, natural fiber and thermoplastic filaments were commingled in a 50:50 ratio by volume, i.e. V f = fiber volume fraction = V m = matrix volume fraction = 50% when consolidated (i.e. no air).
Specific heat experimental procedure and analysis
The specific heat capacity of the materials is determined according to ASTM E1269 using a TA Q1000 DSC machine, where materials tested are heated at a specified rate in a controlled environment. All the materials are put in a DSC aluminum pan and sealed with an aluminum lid. The difference in heat flow in the test specimen pan and an empty pan is continuously monitored and recorded.
The detailed procedure of the DSC experiment is as follows. The DSC machine is purged with dry nitrogen throughout the experiment. The empty specimen holder plus lid is weighed to a precision of ±0.01 mg. Next, a sapphire standard (reference material) is put in the specimen holder and weighed to the same precision. The DSC chamber is heated from or cooled to a reference temperature of 40°C. The chamber is allowed to stay at this temperature for 5 min to ensure equilibrium. Next, the sapphire standard material along with the empty pan and lid is heated up to 320°C at a rate of 20°C/min. The thermal curve showing heat flow versus temperature is continuously recorded, as seen in Figure 2. The chamber remains at 320°C for 5 min to ensure equilibrium and then the thermal curve is terminated. The chamber is allowed to cool to ambient temperature. The same series of steps are followed for five test specimens of flax and hemp as bast fiber reinforcement, one test specimen of PP and PE as thermoplastic matrices (since they are already well characterized in the literature) and, one test specimen each of the four combinations of natural fibers and thermoplastic filaments. Typical DSC thermal curve (PMMA) as an example showing Dst at 75°C and Ds at 175°C.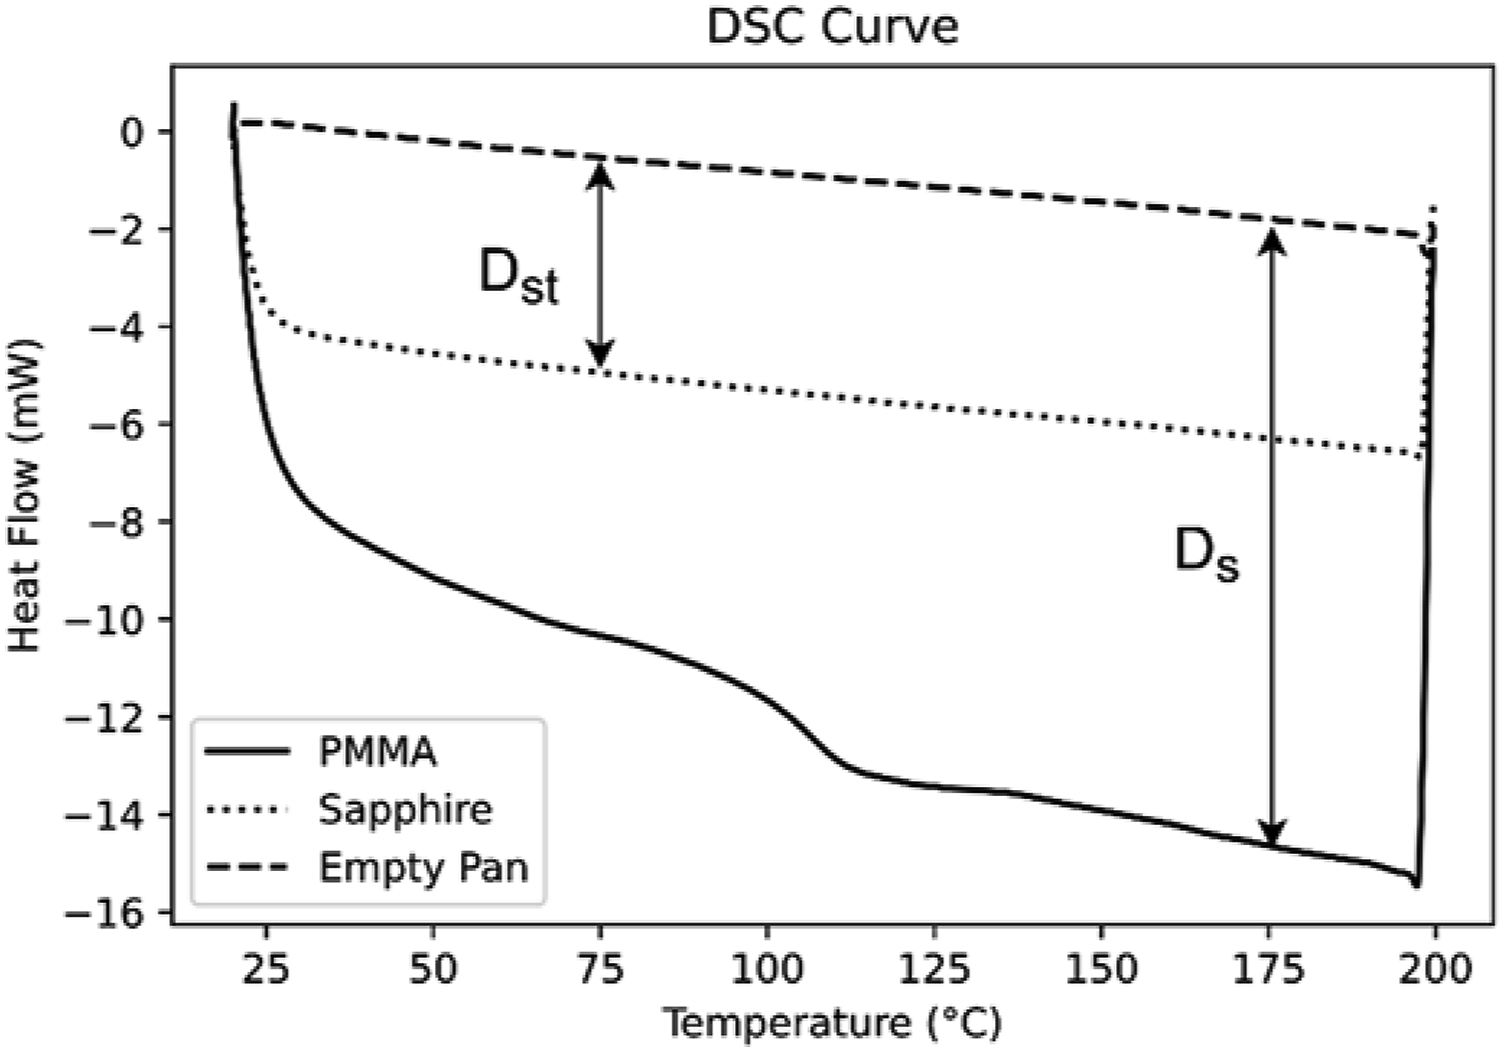
Once the thermal curve is recorded, the specific heat capacity is calculated in the following manner. Data for temperatures between 30°C to 180°C at 10°C increments is recorded. Next, calorimetric sensitivity E, is calculated as per the ASTM standard using
Using the calorimetric sensitivity E, the specific heat capacity of the test specimen, C
s
, at a specific temperature can be calculated using
After obtaining the DSC curves of the individual materials, the Series, Parallel and Lewis-Nielson models, represented mathematically in equations (3)–(5) and primarily intended for thermally conductivity, are used to predict the specific heat capacities of the composites, and the predictions are compared against the experimentally obtained specific heat capacities of the four composite combinations.


Lastly, the specific heat of the commingled tows with unidirectional fibers is calculated using the rule of mixtures. Although the tow is modeled as a mixture of fiber and matrix in a particular volume ratio, there is a significant amount of air trapped in the system as previously mentioned. The effective area of air present in the composite preform (e.g., rope) cross section is calculated by subtracting the individual component (fiber and matrix) cross sectional areas from the total preform area as


The area of the individual constituents are determined by dividing their mass by the corresponding density and the length. The specific heat capacity, C
p
, can then be calculated using equation

Thermal conductivity experimental procedure and analysis
The apparent transverse thermal conductivity of the four composite preform combinations were experimentally measured using a procedure adopted from the work of Pashayi et al.,
31
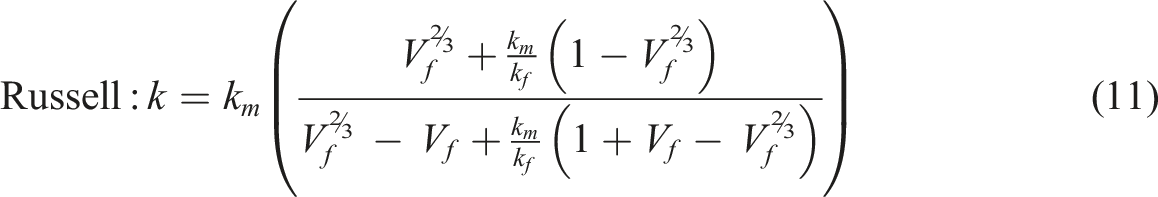
which is similar to ASTM D5470-17. Since the term “thermal conductivity” is applicable only to homogeneous materials, the term “apparent thermal conductivity” is used for heterogeneous materials such as unconsolidated and consolidated composites. Here, a custom-built test apparatus consisting of two temperature-controlled platens sandwiching a test specimen, as shown in Figure 3(a), is used. Since the specimens containing natural fibers are difficult to contain within the platen area, the correct amount of material is weighed and contained within an insulative acrylic fixture, which is essentially a frame. The thickness of the fixture essentially determines the gap between platens and, hence, the volume fractions during testing. With this apparatus, the experimental transverse thermal conductivity (k) value of any individual materials or commingled mixes are determined. Next, the experimentally obtained transverse k-values of the commingled mixes are compared to predictions from various composite thermal conductivity models. The literature provides various mathematical models for determining the apparent thermal conductivity of a composite including Series, Maxwell, Russel, and Lewis-Nielson.26,30 The mathematical representation of each model are provided in equations (9), (10), (11) and (12) (a) Thermal conductivity experimental setup, (b) schematic showing various thermal and electrical components, and (c) equivalent thermal resistance circuit.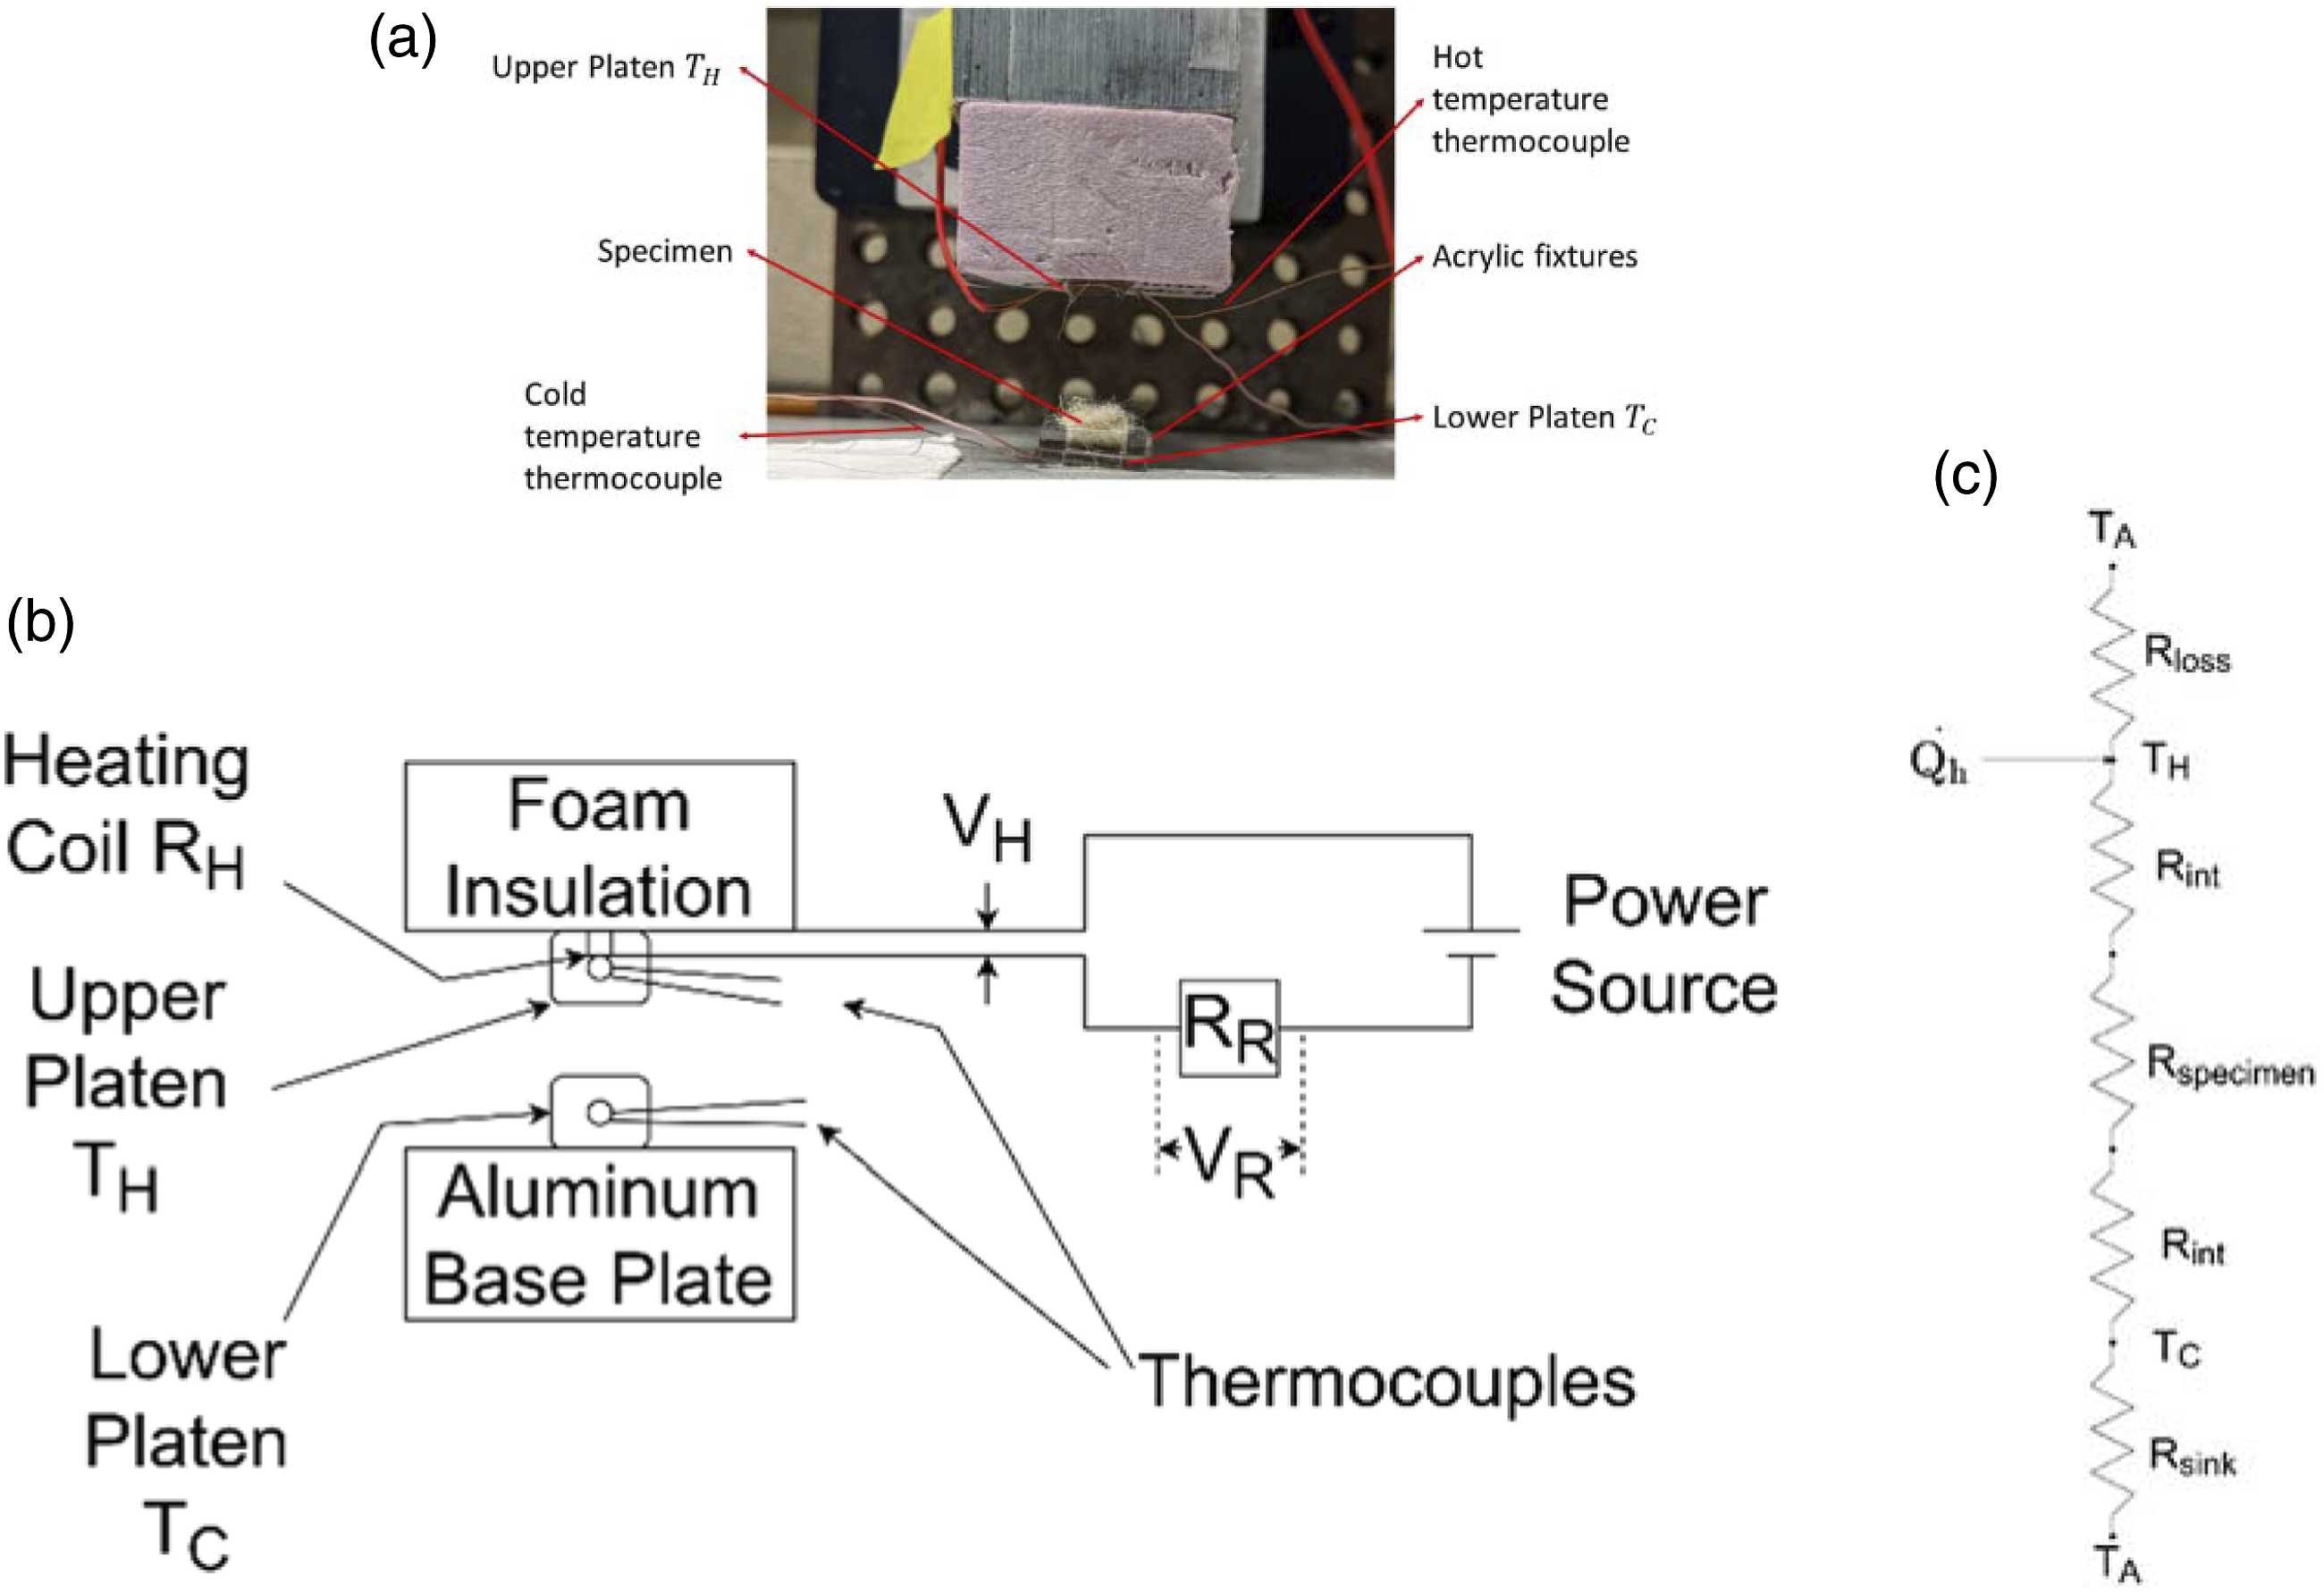

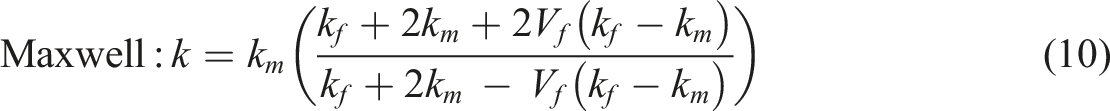

The detailed procedure for determined k-values involves recording the platen temperatures and voltage of the DC power source continuously. Referring to Figure 3(b), the top platen at temperature T
H
is heated with an electrical resistance heater connected to a regulated DC power source. The voltage across the heating coil is V
H
(in volts), and the corresponding resistance is
Additionally, the apparatus inherently loses heat to ambient air by natural convection, and this can be modeled as a loss resistance that is measured by running an experiment on the apparatus with no specimen loaded. The loss resistance,

The rate of heat transfer between two surfaces is equal to the temperature difference divided by the total thermal resistance between two surfaces. Therefore, (a) Temperature difference versus Power plot (b) Contact resistance versus thickness plot.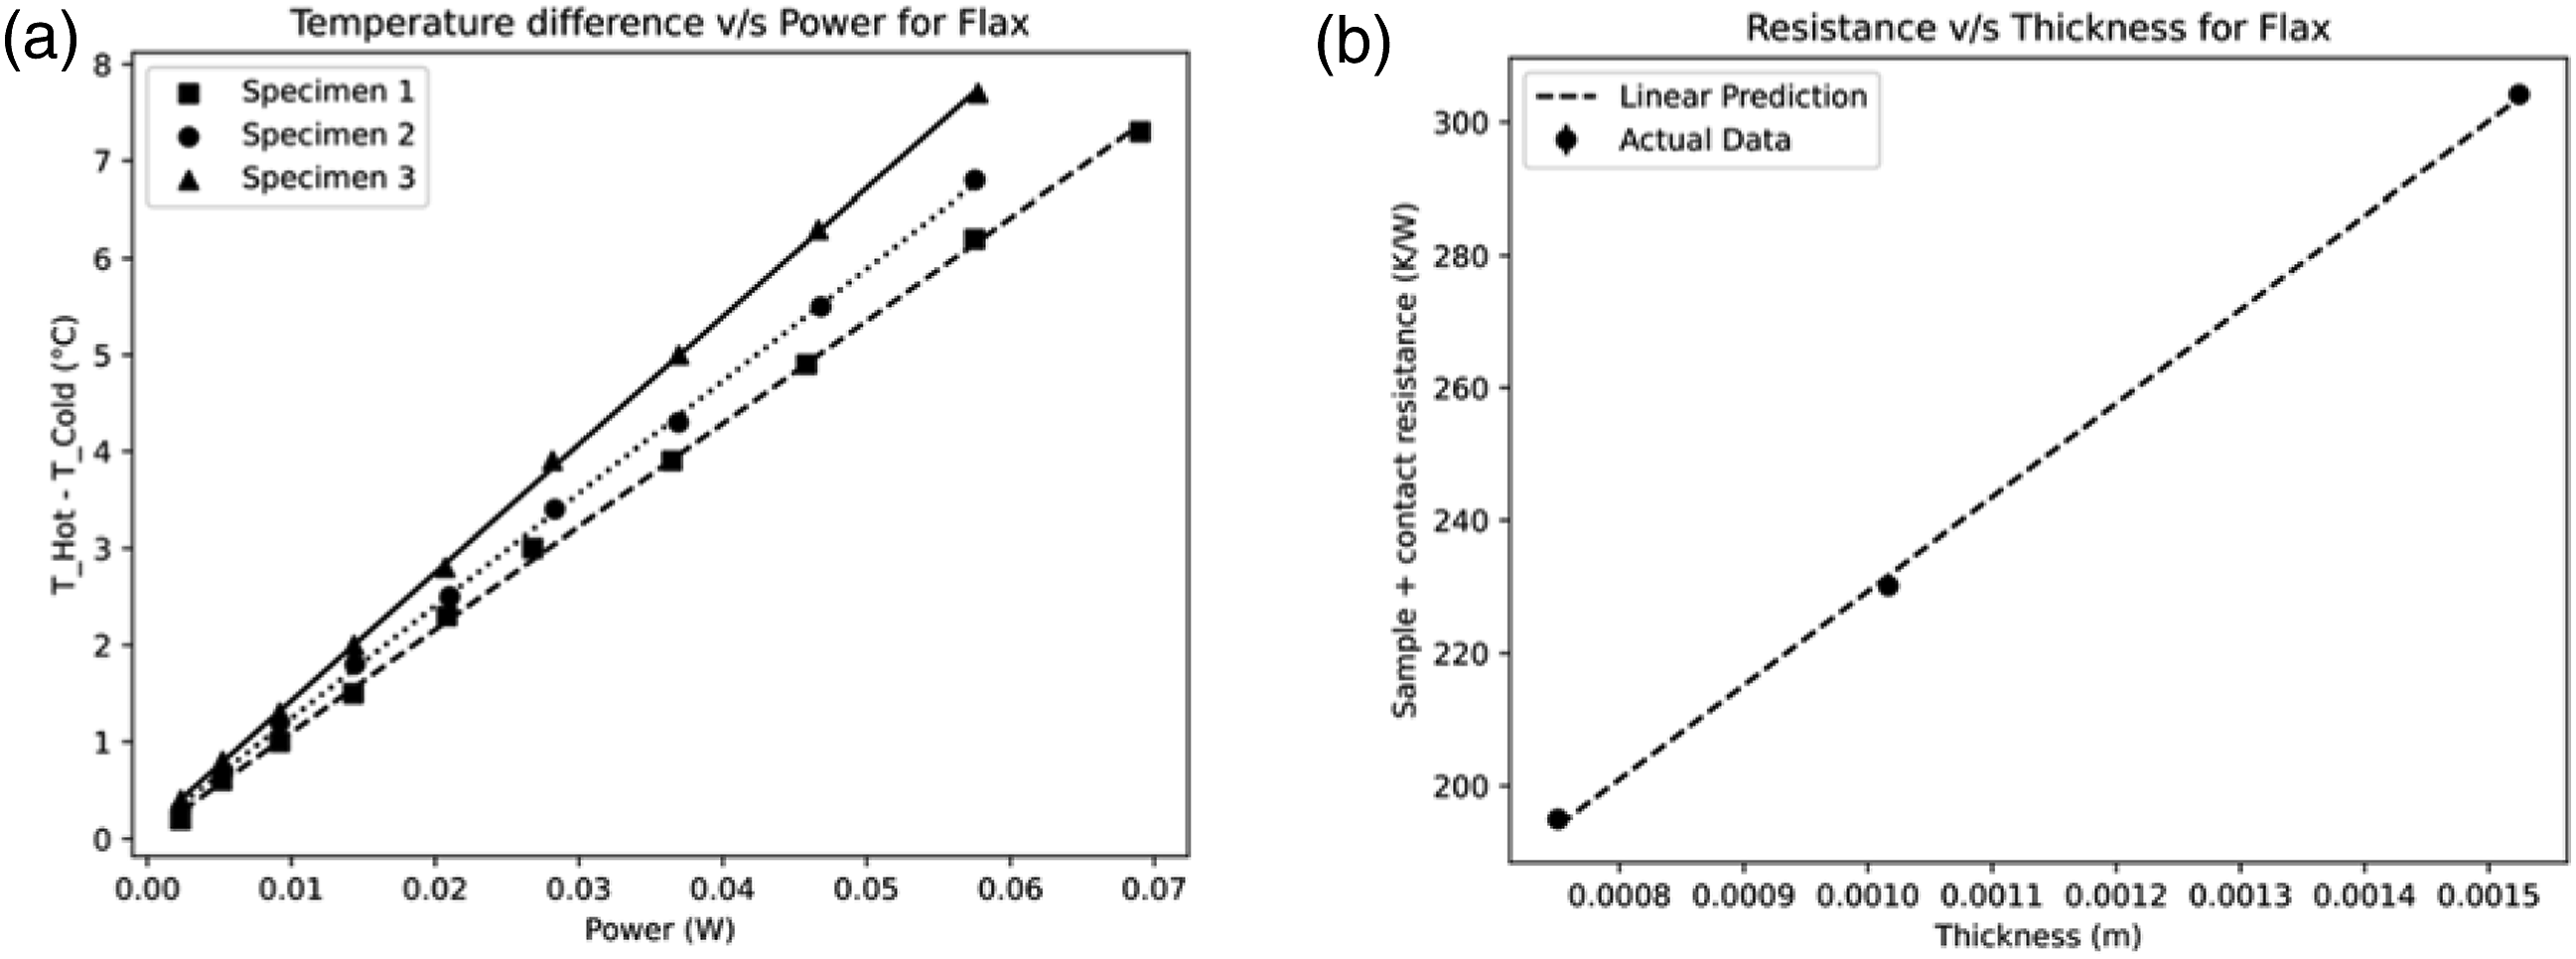

R
specimen
is equivalent to
An illustrative plot for a Flax specimen is shown in Figure 4(b). The error bars reside within the markers. For obtaining a best-fit line, specimens of varying thickness need to be tested. In equation (17), the two unknowns are
Three experiments were performed for the natural fibers, since fibers may show high thermal property variability. In addition, one experiment each was conducted for the two thermoplastic matrices and the four combinations of the composite mix. Lastly, similar to specific heat capacity, the thermal conductivity of the commingled fibers, k, can be calculated as

Results and discussion
Experimental results related to specific heat capacity and thermal conductivities values for the four different biocomposite material combinations along with comparison with model predictions are presented and discussed in this section.
Specific heat capacity
DSC runs for five specimens each of hemp and flax fibers performed over a temperature range of 40–320°C (see Figure 5) allow characterization of their composition (primarily cellulose, lignin and hemicellulose for fibers) or melt behavior (for polymers). Both hemp and flax fibers are primarily comprised of semicrystalline cellulose (65–75 wt%) .
32
According to Kabir et al.,
33
hemicellulose degrades at a lower temperature range (25–290°C) as compared to lignin (150–420°C) and cellulose (250–350°C). At least three specimens for flax showed a drop around 150°C, which indicates hemicellulose decomposition. A second drop near temperatures of 200°C shows the onset of cellulose and lignin decomposition. Hemp fibers show a similar trend where the first drop in three specimens occurred at around 150–170°C indicating hemicellulose decomposition. A second drop in the temperature ranges of 230–260°C indicates cellulose and lignin degradation. Lastly, sharp drops for two of the hemp specimens at ∼120°C might indicate the release of bonded water, as was also observed by Han et al.
34
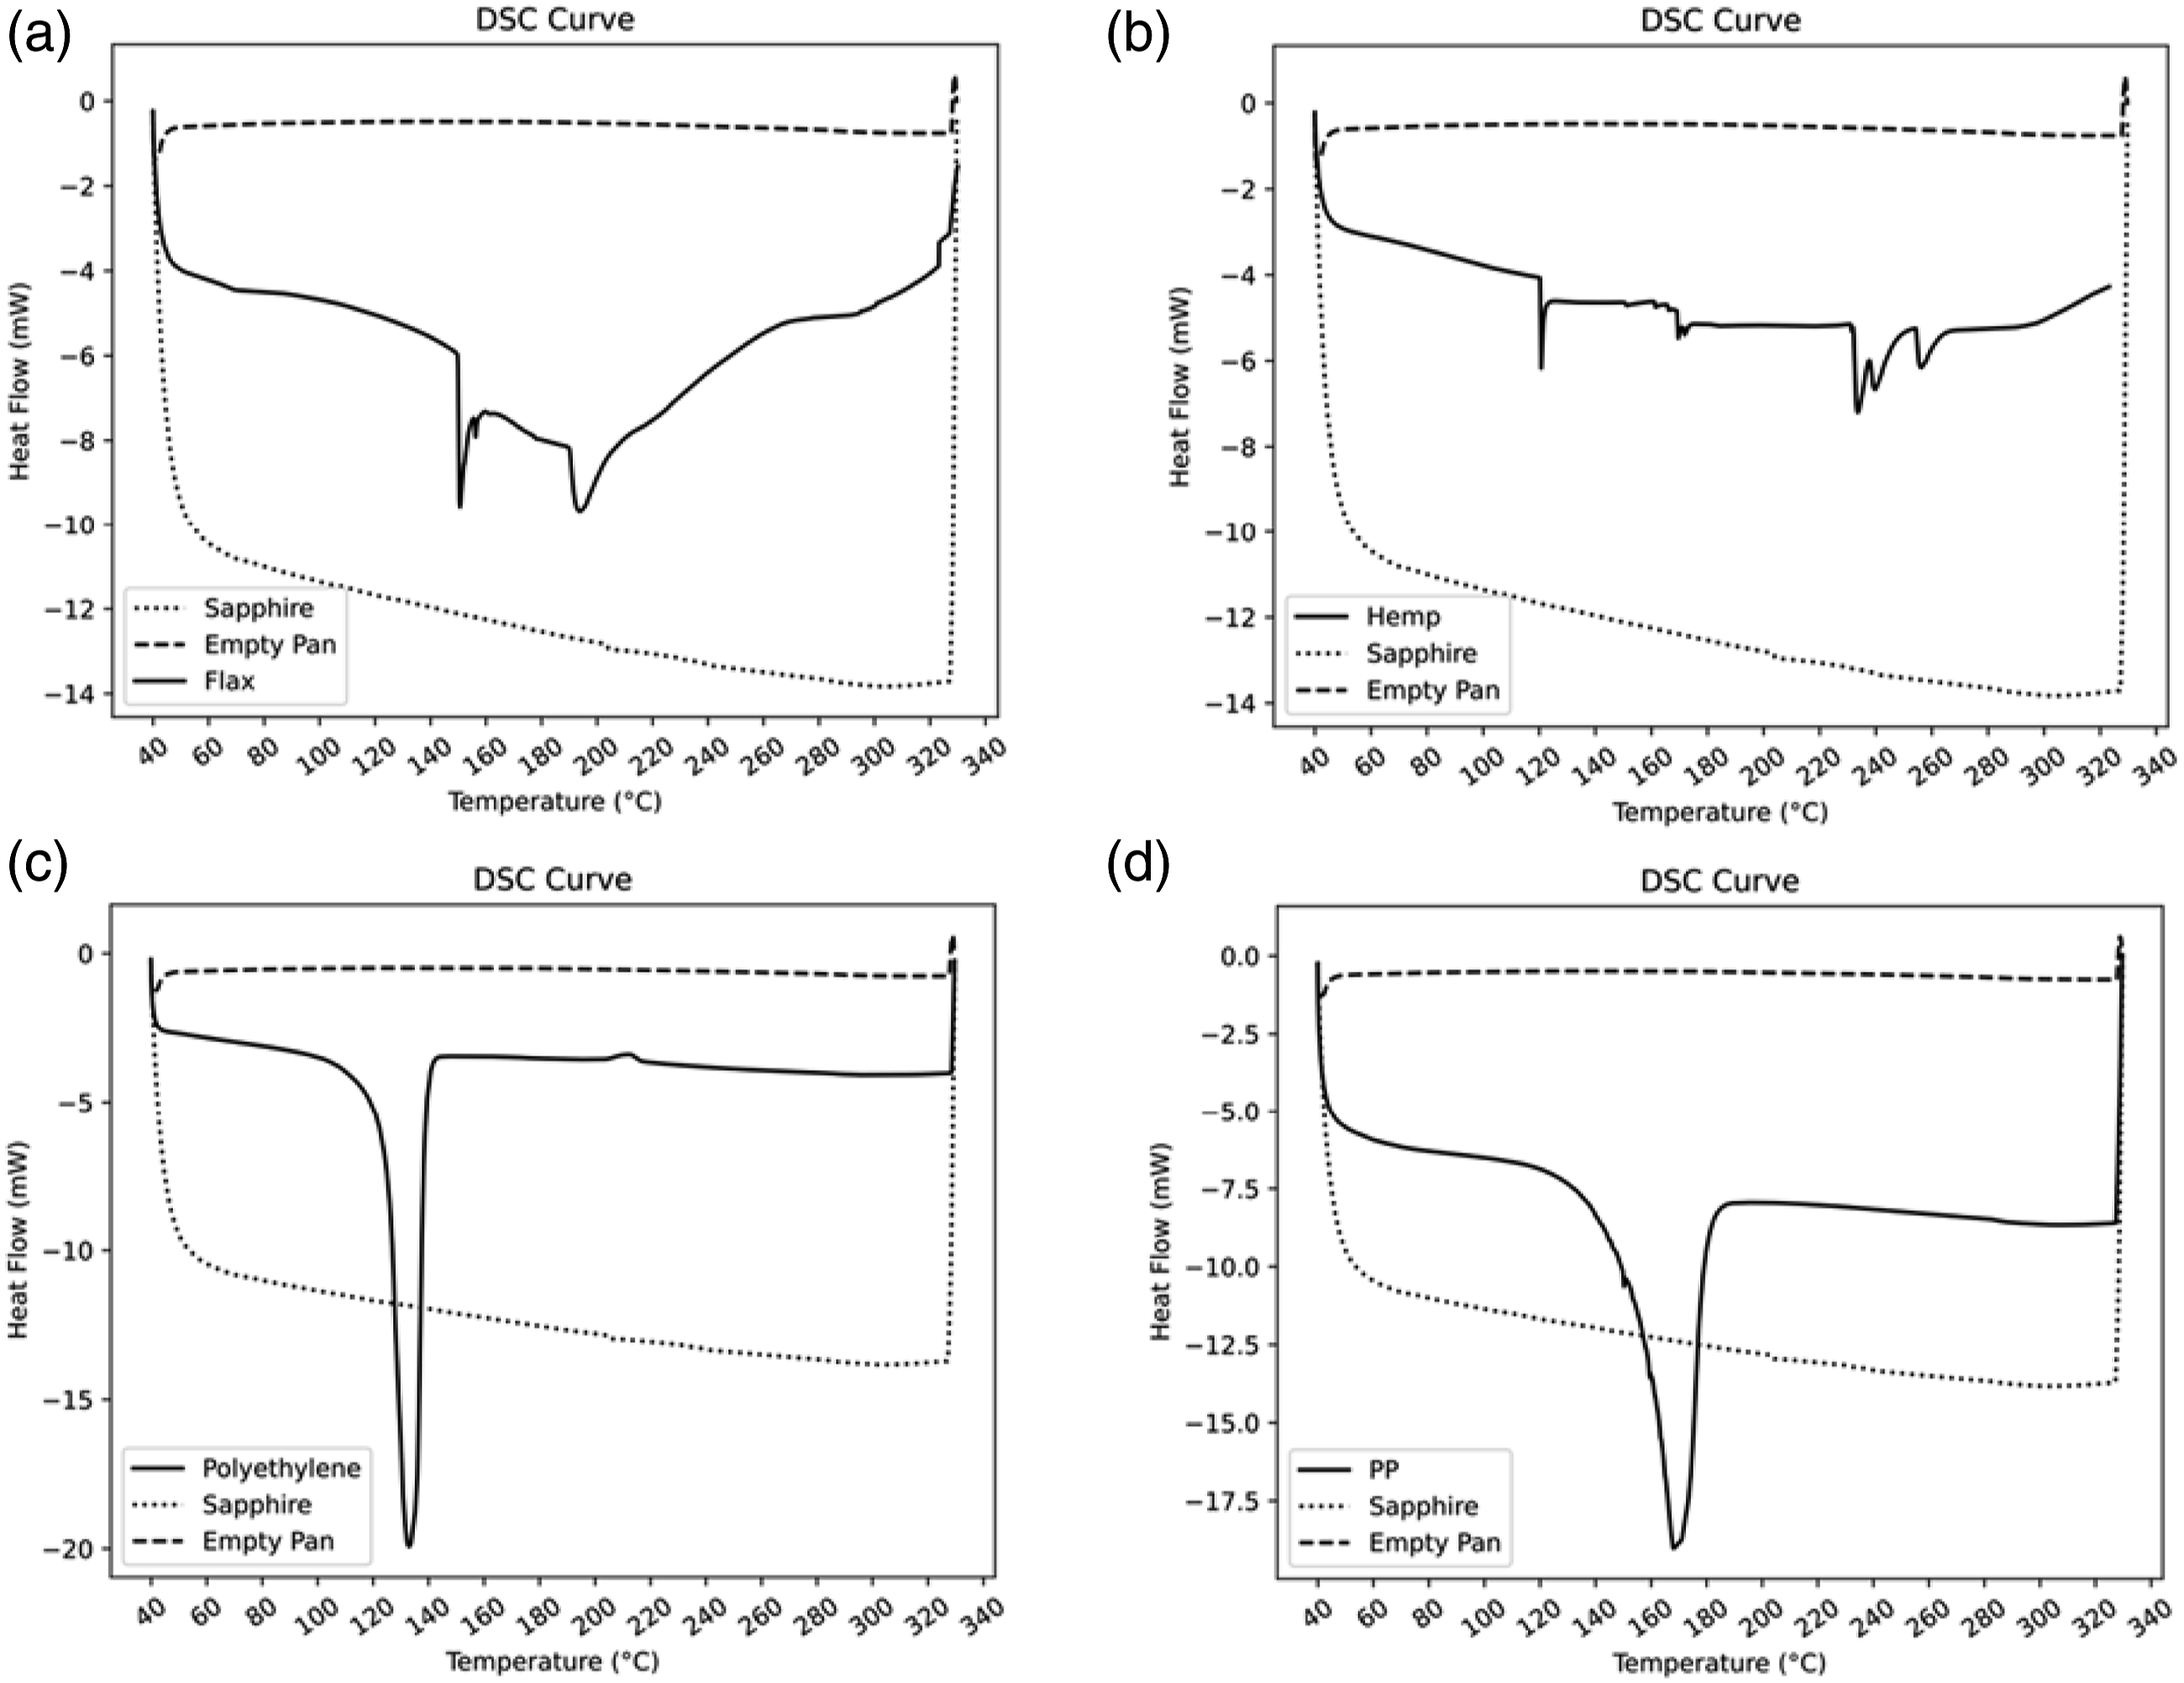
The thermal curves obtained for the four materials from the DSC equipment are shown in Figure 6. The average of the data obtained from the five specimens of both natural fibers is shown in the thermal curves of Flax and Hemp in Figures 6(a) and (b). From Figures 6(c) and (d), the melting point of the plastics can be determined by the steep drop in the heat flow. Polyethylene shows a melting point between of 130–132°C, which agrees well with 134°C obtained by Mathot et al.
35
in their DSC study. The melting point of polypropylene is estimated to be around 165°C. This melting peak is comparable with the peak obtained by Mucha et al.
36
in their polypropylene DSC study. The calorimetric sensitivity, E, distance D
s
, and specific heat capacity C
s
of each material at various temperatures based five specimens are provided in Table 1. DSC curves for all five specimens of (a) flax and (b) hemp fibers along with the average curve. DSC curves for (a) flax (average), (b) hemp (average), (c) PE, and (d) PP. Data obtained from DSC experiments.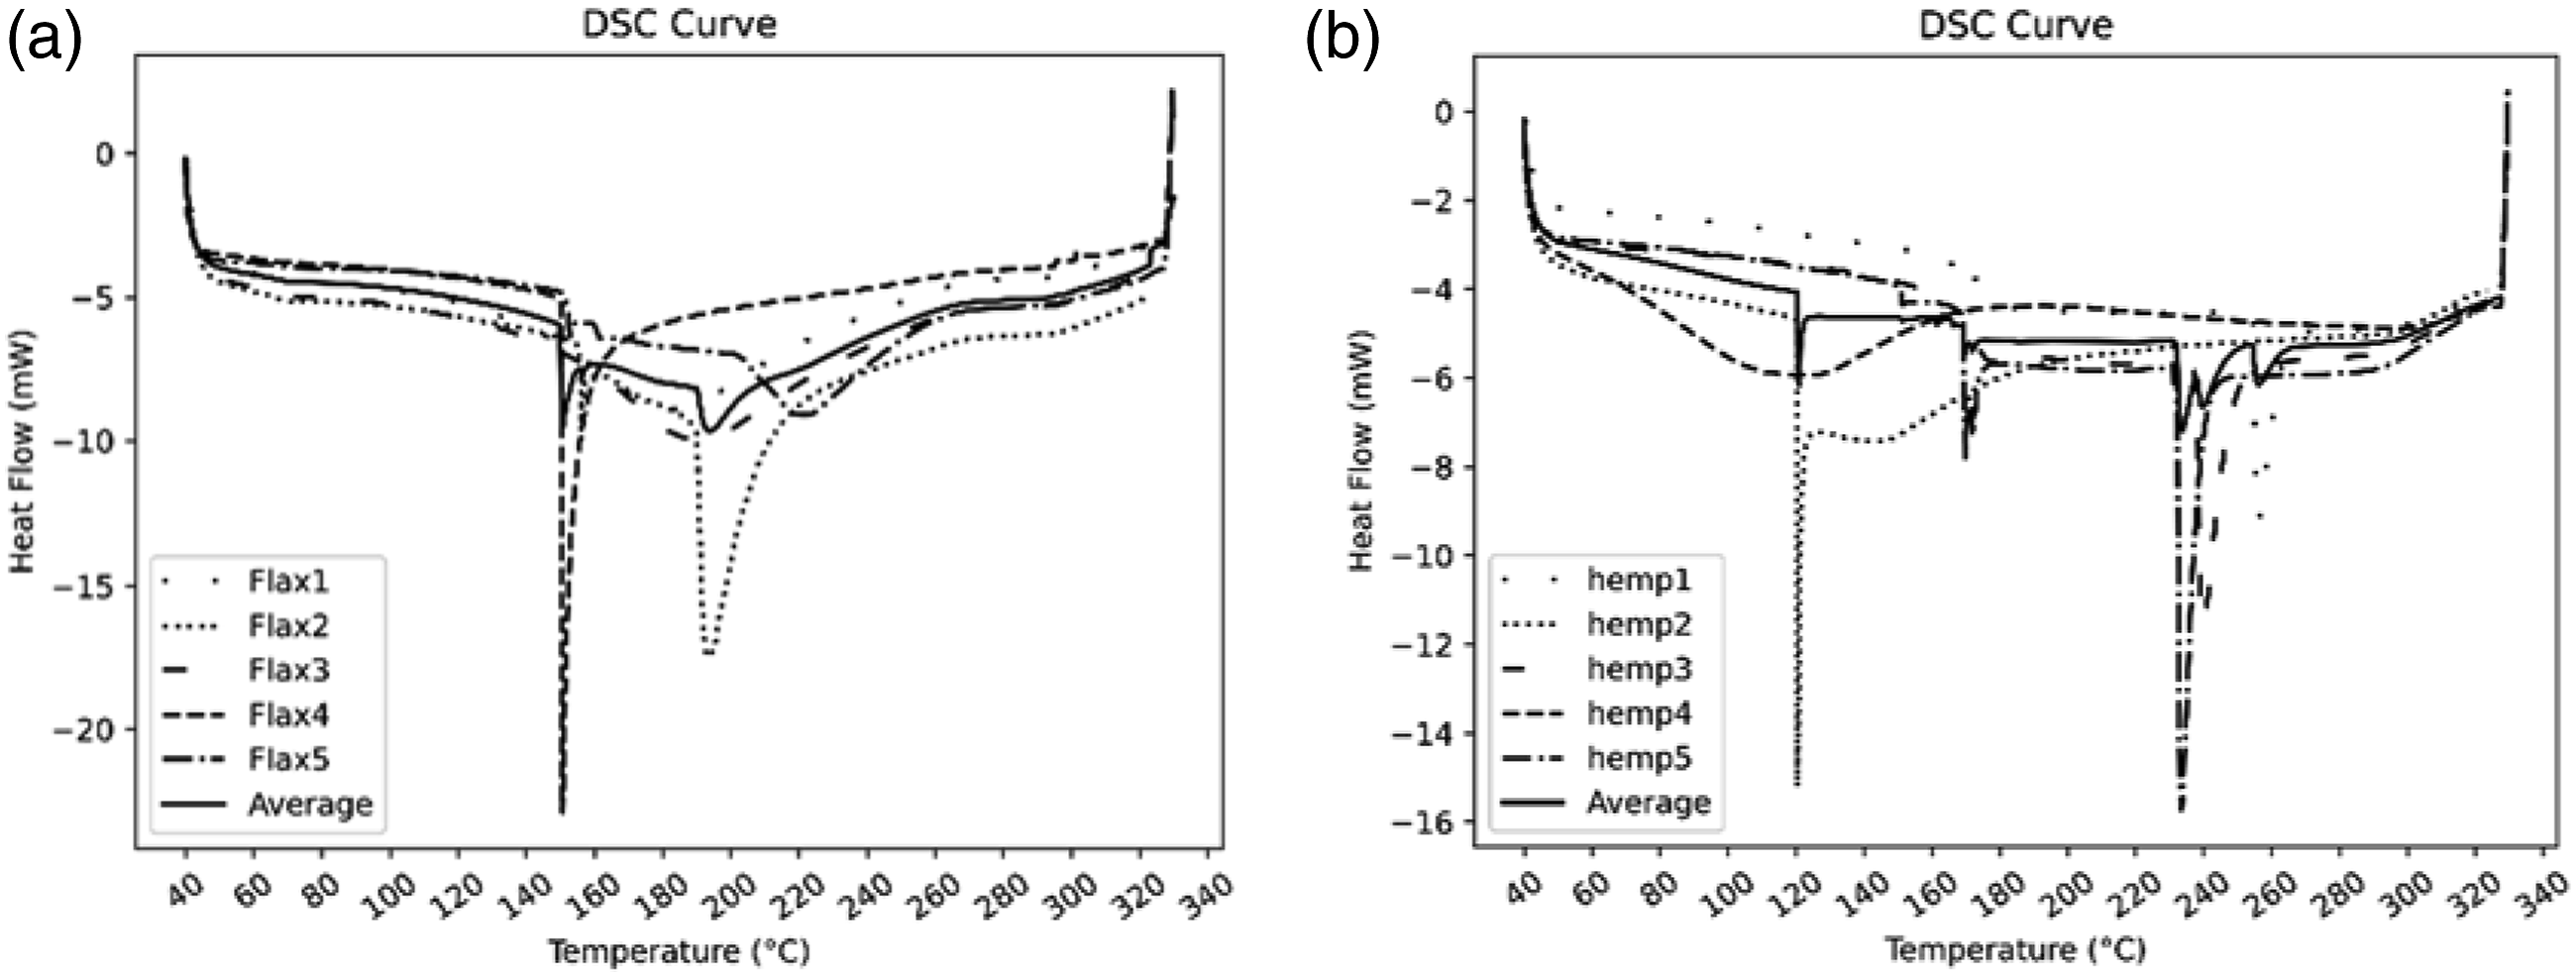
The experimentally determined specific heat capacities for the four materials with respect to the temperature and curve fits of this data for use in process simulation are shown in Figure 7. Fourth-order polynomials fit the natural fiber data most accurately. Specific heat capacity versus temperature for (a) flax, (b) hemp, (c) polyethylene, and (d) Polypropylene.

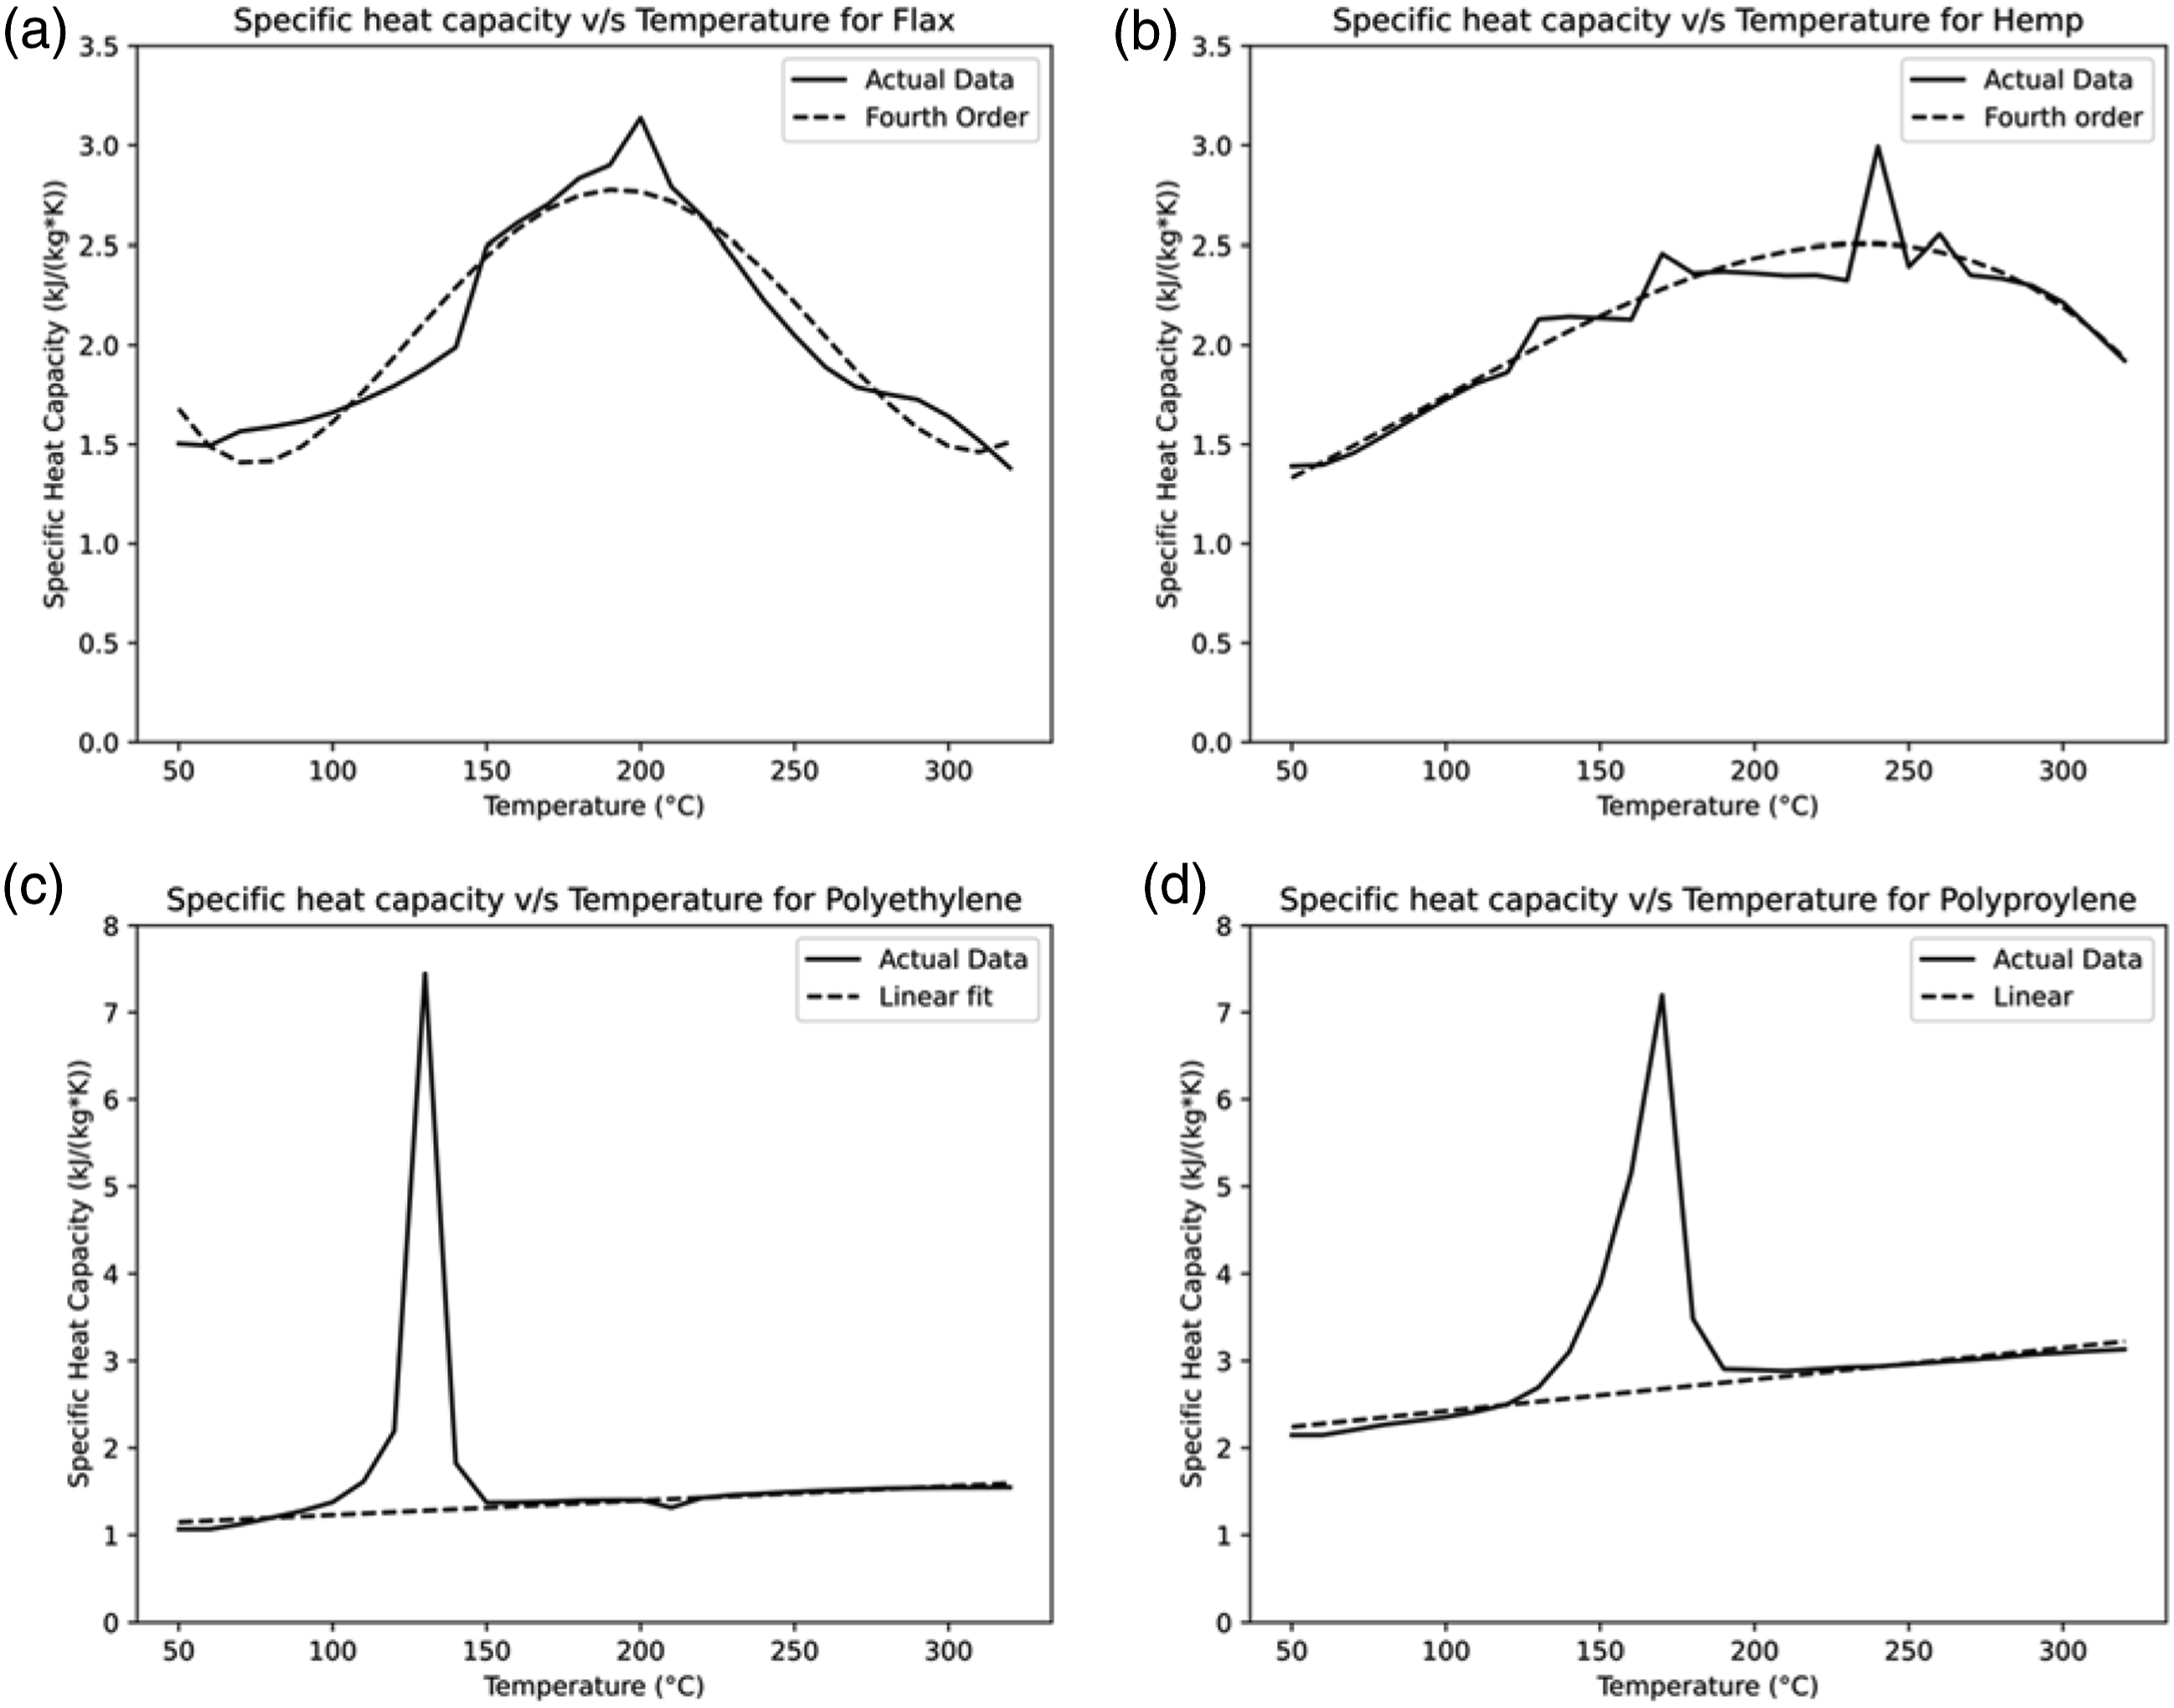
Other than a spike in C near the polymer’s melting point (correlated to the latent heat), a linear data fit suffices for most of the temperature range.

A mathematical method adopted from the work of Franquet et al.
37
can be used to capture the spike in specific heat in the thermoplastic’s phase change region by allowing indirect incorporation of the latent heat information into the specific heat capacity using
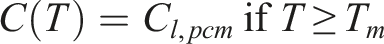
Although validity of the Franquet method needs to be studied further, it is demonstrated for PP in Figure 8. Complete Specific heat capacity curve fit for PP after incorporating latent heat (Lf) indirectly using Franquet method.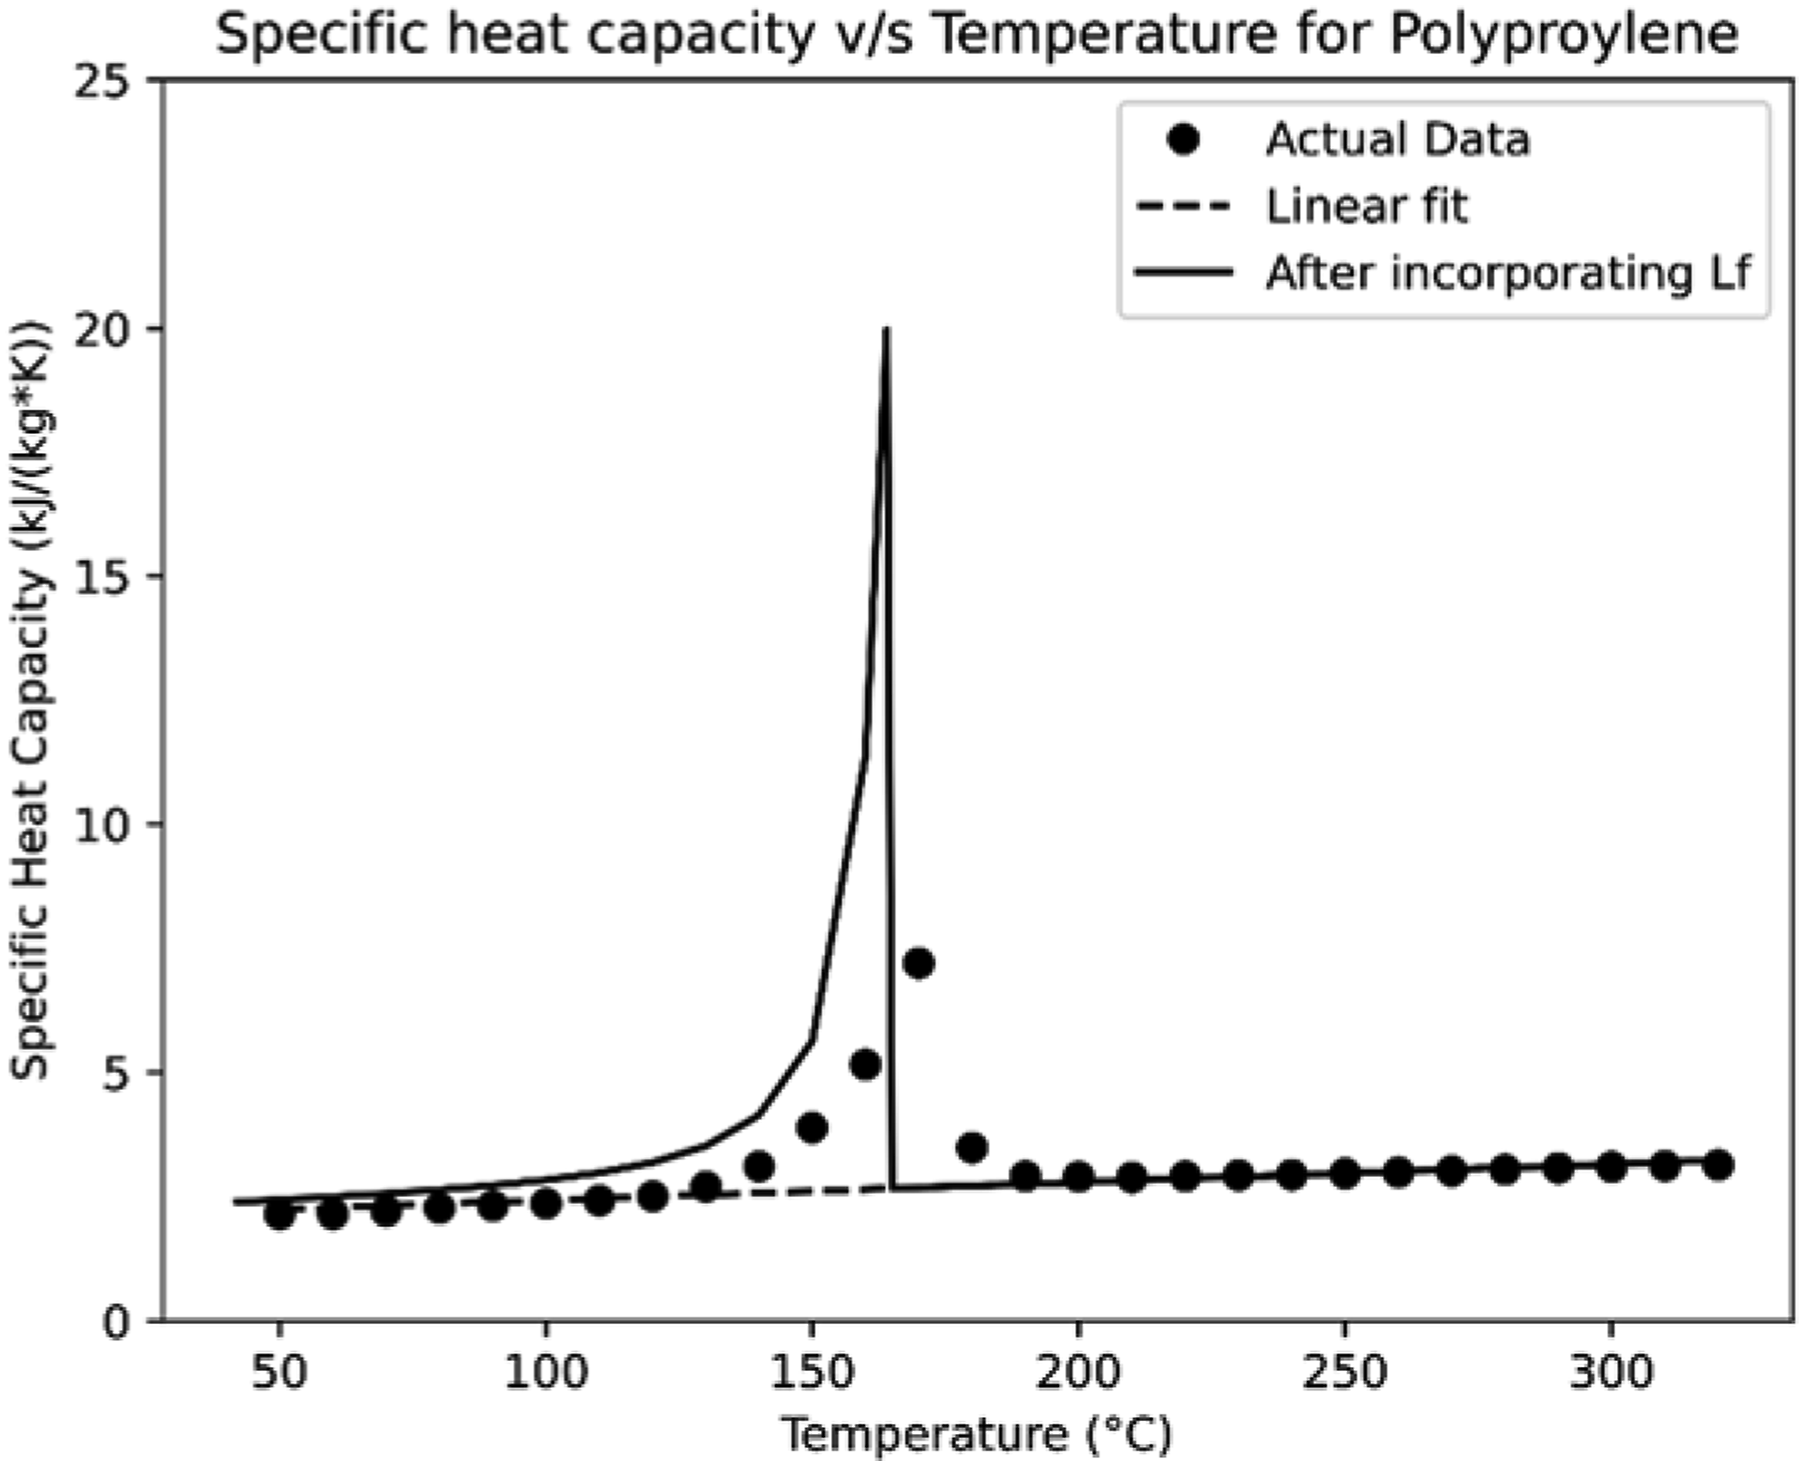
The experimental and model-based specific heat capacity curves for all four composite combinations are shown in Figure 9. All three mathematical models (Series, Parallel, Lewis-Nielson) fail to predict the experimental data accurately, although the Series model comes the closest in general. Li et al.
26
found that the specific heat capacity of the composite mix decreases as the fiber percent increases. Therefore, at a 50% fiber volume fraction, the specific heat capacity of the composites was considerably lower than the pure matrix materials and hence the result obtained in this study fits the trend observed by others. Since the Series, Parallel, and Lewis-Nielsen models were originally developed to predict the thermal conductivity of a composite,
30
and there is a lack of similar studies comparing experimental values to the mathematical predictions, this indicates that these models are not appropriate predictors for combined specific heat capacity. Therefore, the authors suggest that experimentally obtained specific heat capacity values be used for process simulation instead. Specific heat capacities of the composite mix along with the mathematical model predictions for (a) hemp/PP, (b) hemp/PE, (c) flax/PP, and (d) flax/PE.
Apparent thermal conductivity
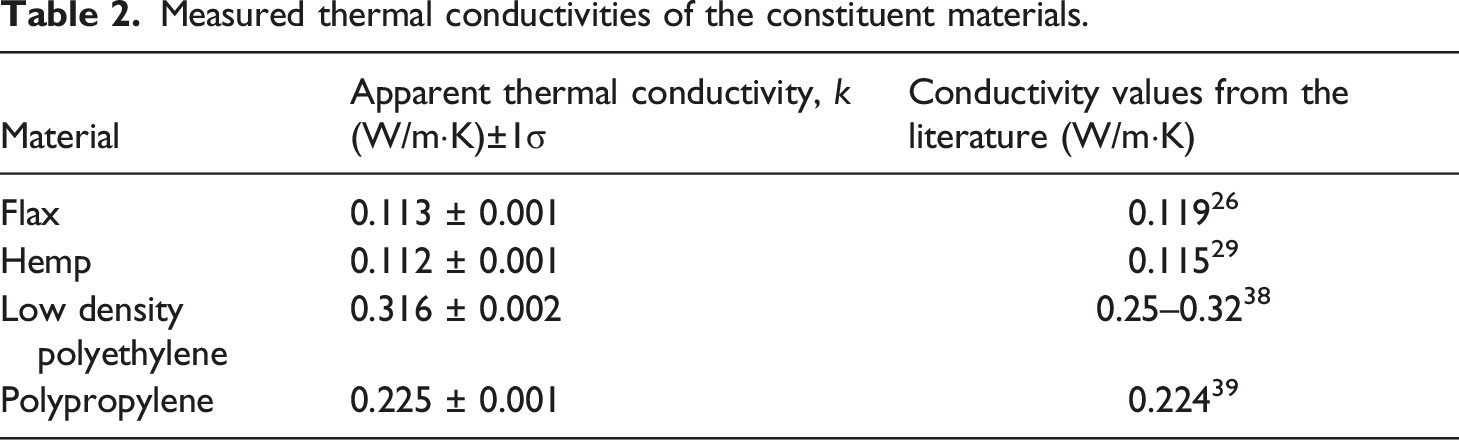
Measured thermal conductivities of the constituent materials.
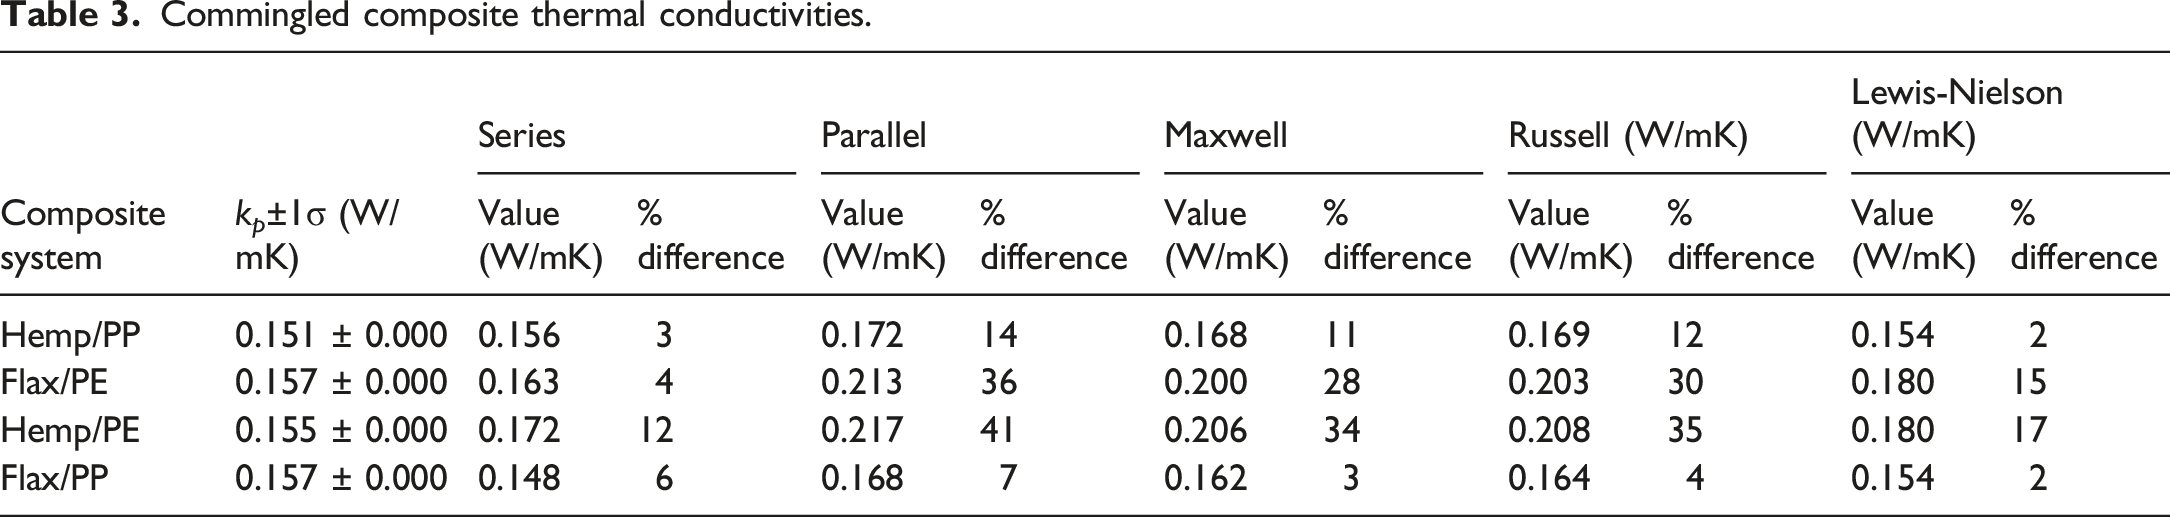
Commingled composite thermal conductivities.
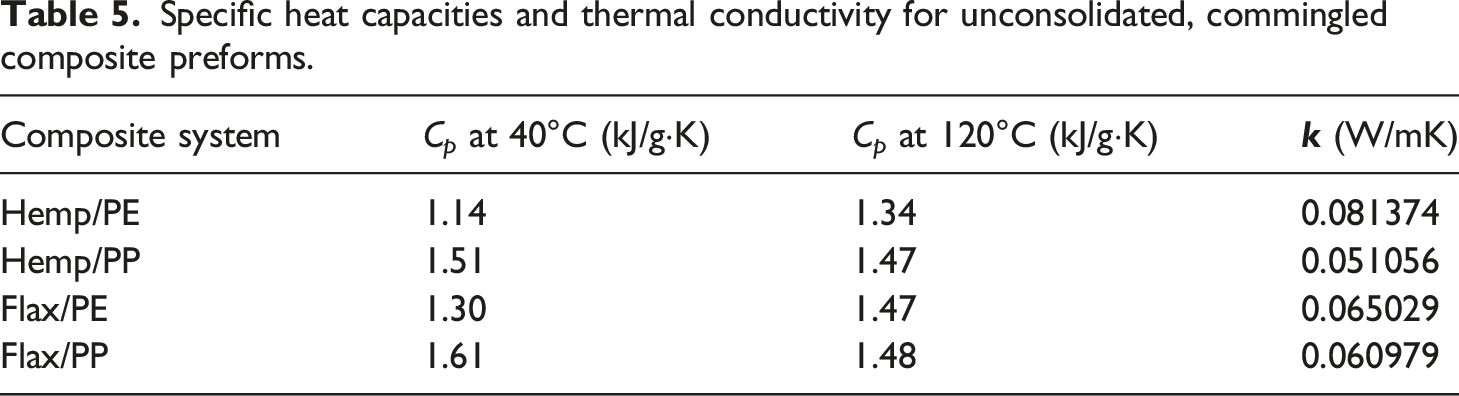
Case study: Commingled fiber properties for pultrusion preform
To demonstrate how transverse material properties are determined for a practical situation, a case study involving commingled thermoplastic matrix/natural fiber rope preforms intended for pultrusion is discussed. The final cross-sectional diameter and area for V
f
= 50% and complete consolidation are 1.00 cm and 0.785 cm2, respectively. In this case, total cross-sectional area of the matrix filament and natural fiber are both A
c
= 0.785(0.5) = 0.393 cm2. The required mass of each constituent material, m
c
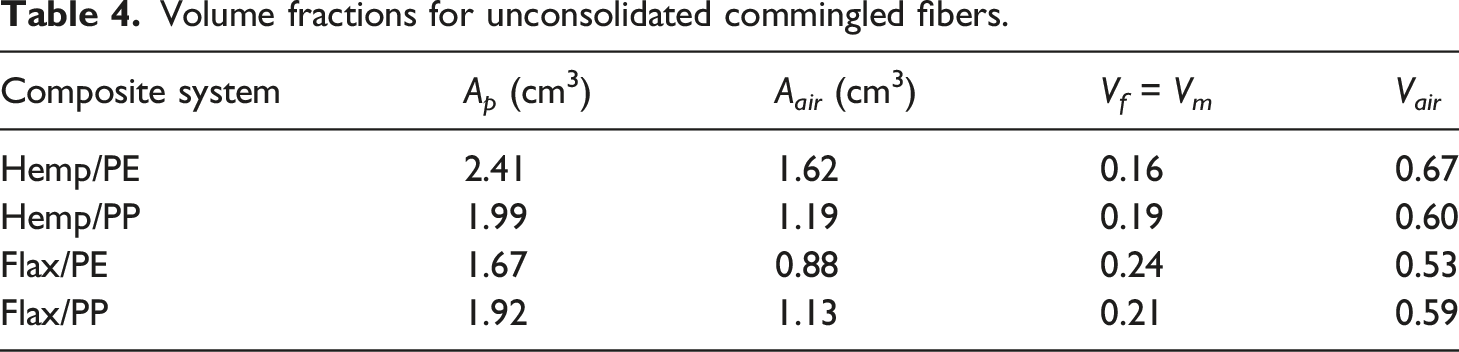
, for the unconsolidated preform of length L, is related by the equation Homemade commingled fibers from left to right: Flax/PP, Hemp/PP, Hemp/PE, and Flax/PE. Volume fractions for unconsolidated commingled fibers.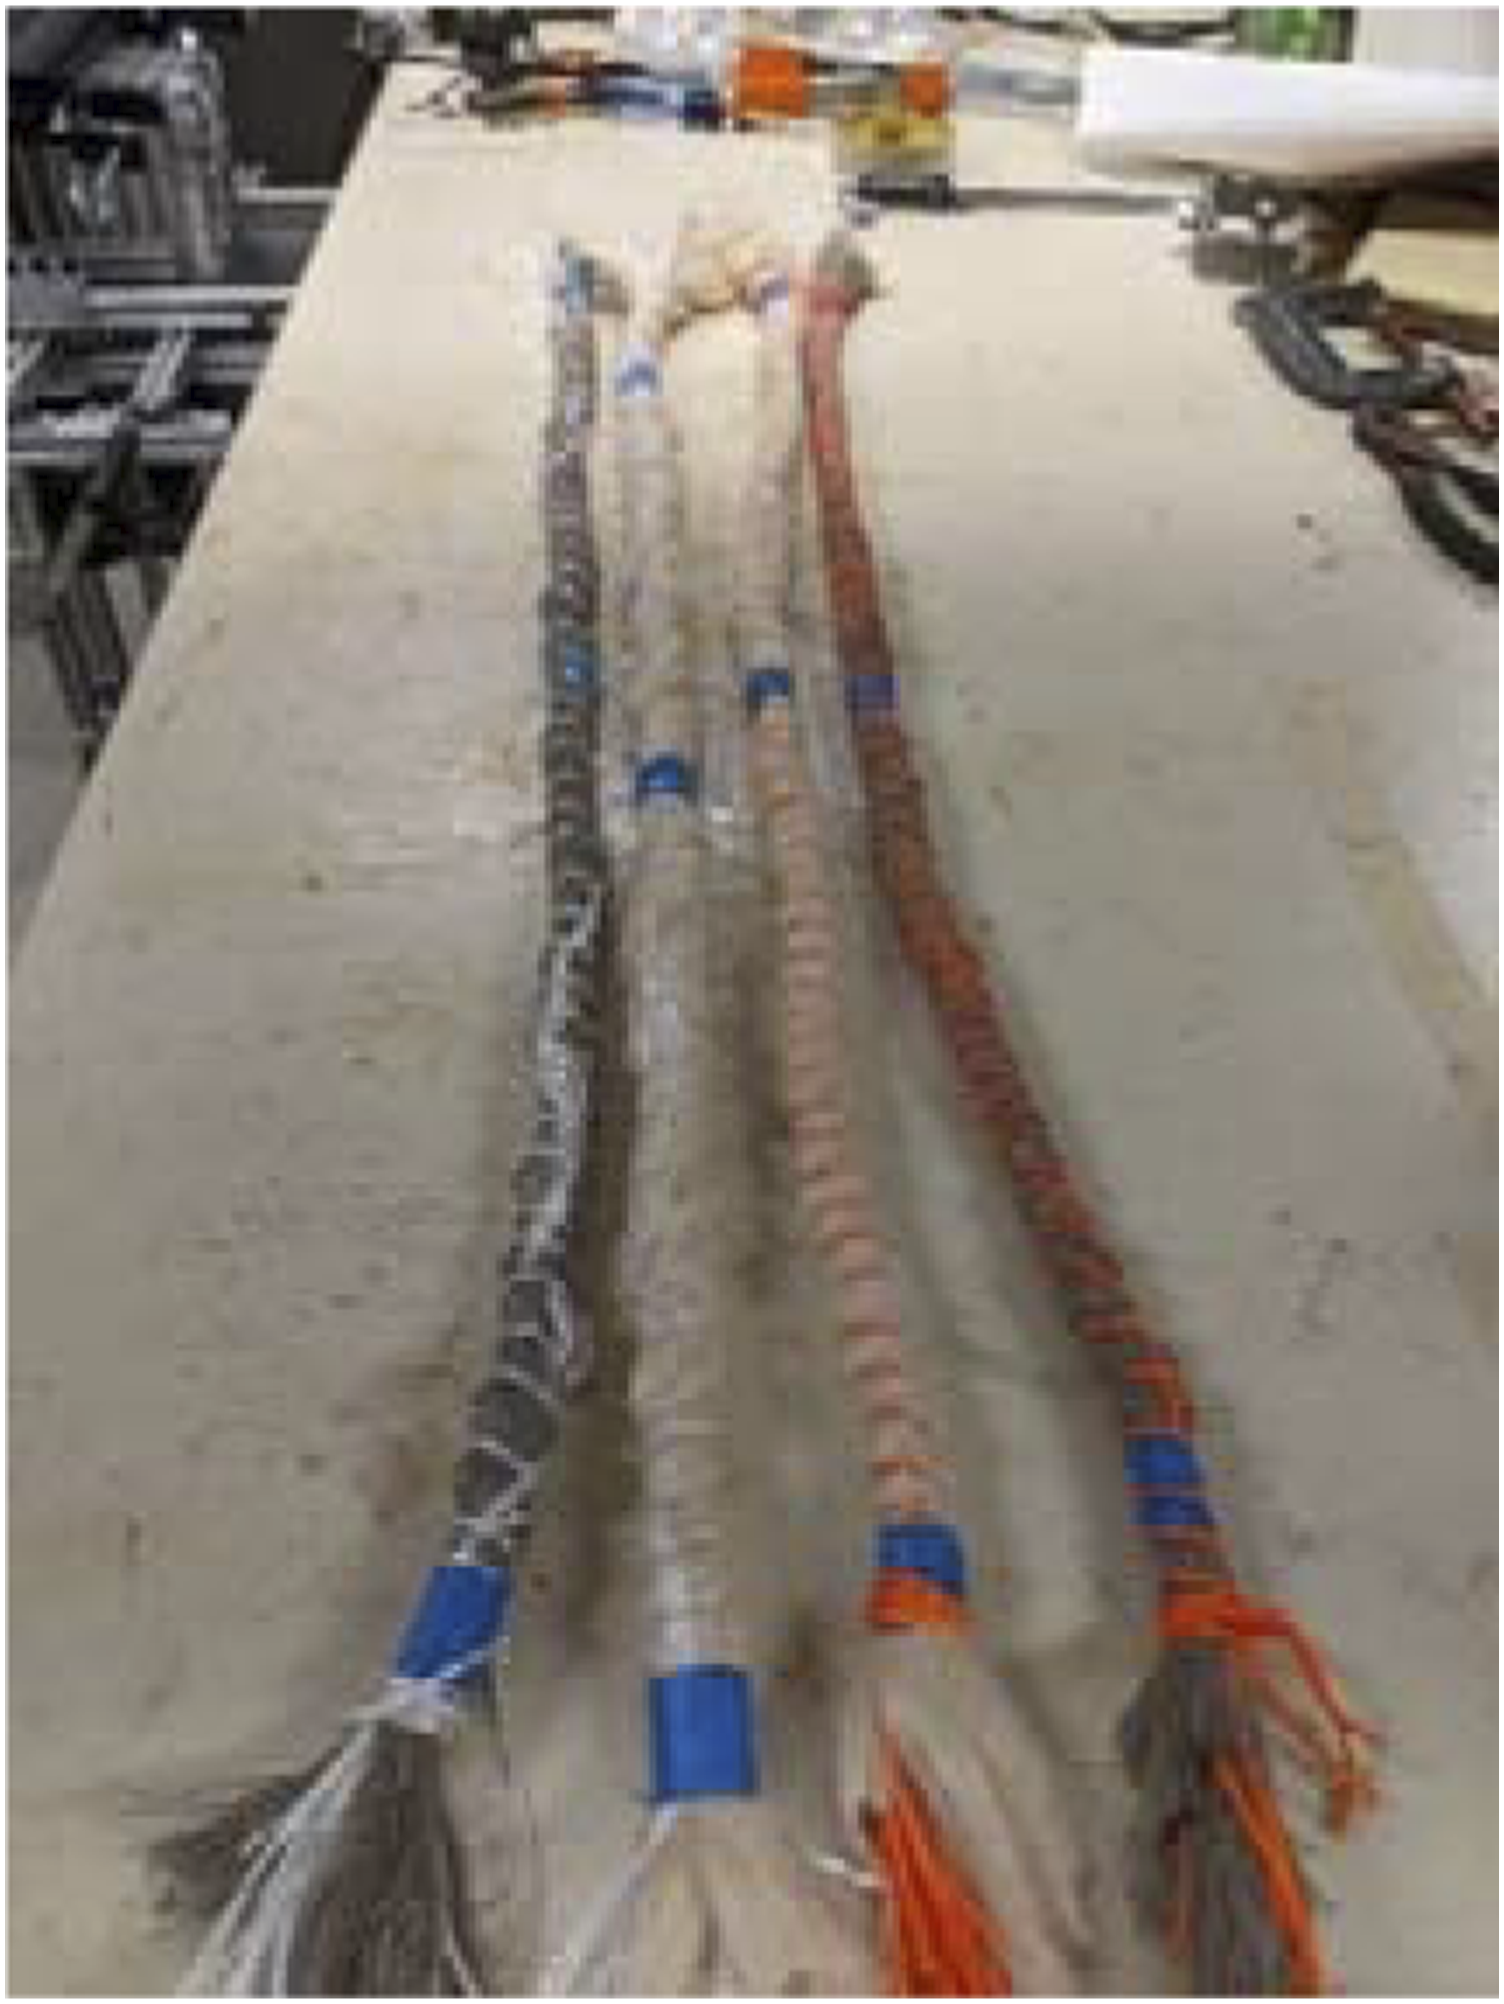
Specific heat capacities and thermal conductivity for unconsolidated, commingled composite preforms.
Conclusion and future work
Thermal properties transverse to fiber direction (Figure 1) are arguably the most important model parameters required for analysis and simulation of composite manufacturing processes that involve commingled fiber and thermoplastic filament (e.g., pultrusion, AFP, and compression molding). Furthermore, interest in natural fibers combined with thermoplastics is growing, but there is little prior art on these thermal properties or how they are measured. In this paper, ASTM standard-based methods for measuring transverse C and k of commingled, unconsolidated, and porous mixes of natural fiber and thermoplastic filament in the presence of air are explained in detail. Specific heat capacity of flax and hemp, which initially increases then eventually decreases with temperature rise, is captured by a fourth-order polynomial curve fit; whereas values for PP and PE show a slight linear increase with temperature and a sharp spike during phase transition at their melting points. Unfortunately, constituent property and volume fraction data combined into an apparent C for the preform using series, parallel, and Lewis-Nielson models does not match experimental values. Hence, experimental data for the apparent C-values should be used in simulation instead. Experimentally measured k-values for the same commingled and unconsolidated preforms closely match those found in the literature. As expected, constituent data combined into an apparent k for the preform using a series model (one of five examined) closely matches experimental values. Finally, apparent thermal properties are determined from constituent properties as a case study for use in a pultrusion simulation.
Future work related to thermal properties for these types of composite manufacturing processes includes: (1) experimental characterization of a wider range of natural and synthetic reinforcement fibers and thermoplastic matrices (including bioplastics) and (2) a similar study on thermal properties along the fiber direction.
Footnotes
Declaration of conflicting interests
The author(s) declared no potential conflicts of interest with respect to the research, authorship, and/or publication of this article.
Funding
The author disclosed receipt of the following financial support for the research, authorship, and/or publication of this article: This work was supported by the Empire State Development’s Division of Science, Technology and Innovation (NYSTAR) in New York State through their Centers for Advanced Technology program [Contract #C140134].