
Abstract
This study aimed to investigate the impact of including teak wood in recycled high-density polyethylene wood plastic composites (WPC) with pine wood on their resistance to degradation caused by termite attack and accelerated weathering. A 23 factorial experimental design was conducted with three repetitions in the center to analyze the weight loss and termite mortality during the experiments. The factors studied were the days of exposure to accelerated weathering, days of exposure to termite attack, and the concentration of teak wood in the composite. Surface characterizations (SEM and FTIR) were carried out to analyze the exposed surfaces and determine the chemical modification of the composite components. The results showed that the WPC manufacturing process promotes a heterogeneous distribution of the wood particles, being greater within the center of the samples than on the surface. Specimens exposed to both accelerated weathering and termite attack resulted in a certain weight loss and termite mortality, depending on the material, conditions of exposure, and the content of teak wood in the WPC. When those compounds were subjected to accelerated weathering followed by termite attack they exhibited a higher termite attack. The presence of teak wood in the WPC produced a reduction in the effects of termite attack and accelerated weathering on weight loss and an increase in termite mortality compared to the WPC with only pine wood, as teak wood contains extractables with termiticidal action. The lowest value of weight loss (0.06%) was observed for the WPC with the highest amount of teak wood with termite attack, resulting in a termite mortality rate of 100% after 17 days of exposure.
Introduction
Wood plastic composites (WPC) are materials that have gained attention in recent years due to their promising potential for replacing various wood-based products. They can be produced using recovered plastics and lignocellulosic residues, such as wood residues, along with different additives. Currently, the market offers a wide range of WPC products, including extruded boards and flooring for the construction industry, as well as injection-molded objects like containers, automotive parts, and household items.
The utilization of wood residues as fillers in plastics, instead of inorganic substances or synthetic fibers, offers significant environmental benefits. Compared to synthetic fibers, wood residues provide advantages such as low densities, non-abrasiveness, non-toxicity, high stiffness, and specific properties like excellent thermal and acoustic insulation, improved mechanical properties, biodegradability, low cost, and good calorific value. 1 Moreover, wood residues are abundant and renewable resources. However, one of the primary motivations for utilizing lignocellulosic residues in the production of WPC products is to reduce the overall cost. Wood residues are generally more cost-effective than the plastic component (i.e., the polymer matrix). Achieving a good balance of physical and mechanical properties at a reasonable cost is essential. This balance depends on the intrinsic mechanical properties of the lignocellulosic component and the polymer matrix, as well as their interaction. Previous studies have reported that the best balance is typically achieved with wood flour contents ranging from 30% to 40% by weight. 2
Furthermore, the optimal cost-benefit ratio is said to be obtained with contents between 40% and 60% by weight of the lignocellulosic component.3,4 In all cases, the use of coupling agents is essential to enhance the physical interaction between the polymer matrix and the lignocellulosic component, thus achieving the desired balance of properties when utilizing recovered plastics.5–7
WPC exhibit resistance to termites and natural or accelerated weathering, which is influenced by the type and quantity of materials that compose them, the manufacturing process, and the time and environmental conditions to which they are exposed.8–12 Environmental factors include biotic factors such as insects, fungi, and bacterial activity, as well as abiotic factors like temperature, humidity, and sunlight, among others.13,14
One of the main advantages of WPC over wood is its increased resistance to biotic factors due to the partial or total encapsulation of the dispersed phase (i.e., wood flour particles) by a polymeric matrix.9,10 The degradation of WPC generally begins when abiotic factors cause the initial breakdown of the polymeric matrix, leading to microcracks on the surface that exposes the dispersed phase to both biotic15,16 and abiotic factors. WPC with polyolefin matrices absorb UV light due to the presence of residual chromophore groups, which initiates photodegradation17,18 and causes changes in crystallinity, crosslinking, and chain breaks. This makes the material more brittle and reduces its mechanical properties. Lignocellulosic fillers, such as wood flour, in WPC are susceptible to degradation by UV ultraviolet radiation, oxidation, rain, and attack by fungi, termites, and bacteria. When exposed to these factors, the hydrophilic nature of the lignocellulosic component causes it to absorb moisture, leading to swelling of the wood particles and the generation of microcracks in the surrounding polymeric matrix due to dimensional changes. This increases the pathways for moisture to reach new lignocellulosic material, which promotes the degradation process. Conversely, when the drying process occurs (i.e., desorption), the wood particles shrink, creating a vacuum between them that prevents the matrix from transferring stresses to which it may be subjected. 19 This decreases the mechanical resistance of the composite.
Several studies have investigated the resistance of WPC to termite attack.8–13,20,21 Some of these studies have focused on determining the weight loss of materials due to termite activity, as well as its relationship with termite mortality and its effects on physical, mechanical, and chemical properties.1–3,6 Other works have explored the impact of weathering and termite attack on the properties of exposed WPC.12,13 In many of these studies, termites of the species Nasutitermes corniger were used, as they can feed on almost any source of lignocellulosic material.20,21 A notable characteristic of these termites is their ability to relocate their nests after an event that has damaged or destroyed their original nest, and they can remain hidden for extended periods as long as they have access to food and water. 20
Selecting the right type of wood flour is a sustainable way to reduce biotic degradation in WPC. The natural durability of wood varies from species to species and from different parts of the tree. 22 For instance, the heartwood, which provides structural resistance of certain trees contains extractable chemical substances that confer greater natural durability, 23 while the sapwood, which transports water and nutrients, is more susceptible to attack by biotic agents like fungi and insects. 24 Teak, a native species of Southeast Asia, has been introduced to different tropical and subtropical zones in Australia, Africa, and Latin America. 25 About 3% of commercial forest plantations worldwide consist of the Tectona genus, with this figure reaching 12.4% in Mexico. 26 The heartwood of teak (Tectona grandis) is renowned for its greater natural durability25,27 against fungi 28 and termites27,29,30 due to the presence of certain chemical compounds, such as tectoquinone (2-methyl anthraquinone), 27 which has insecticidal properties, and 4',5'-dihydroxy-epiisocatalponol, 1,4-naphthoquinone, 31 and lapachol, which have antifungal properties.28,32
This study aims to assess whether the addition of teak wood flour to a WPC (Wood-Plastic Composite) made of pine wood flour and recycled high-density polyethylene can mitigate biodeterioration when subjected to accelerated artificial weathering and termite attack. The resistance to biodegradation will be evaluated by measuring the weight loss of the WPC and the mortality rate of termites. The main objective of this research is to investigate the potential of teak wood flour as an affordable and sustainable natural biocide.
Experimental
Materials
Recycled high-density polyethylene (rHDPE) from whitish 19-L capacity buckets was used as the polymeric matrix, which was purchased from Home Depot México, S. de R.L. de C.V (Merida Branch). The HDPE buckets were first cut into small pieces using a ChunLin band saw, model MJ344N (Grupo Continente Internacional, Guadalajara, Mexico), and then ground in a Pagani mill, model 2030 (Dycomet, Mexico City, Mexico) with a 2 mm screen. The ground material was then further processed in a Brabender mill, type 880,804 (Brabender, Duisburg, Germany), using a 1 mm sieve to obtain the final product.
Pine wood sawdust (PW) (Pinus sp.) was provided by Maderas Bajce (Merida, Mexico), while Teak wood (TW) (Tectona grandis) in the form of chips was donated by Grupo Constructor Samco S.A. de C.V. (Morelia, Mexico). To eliminate the excess moisture, both materials were first air-dried and then subjected to further drying in a convection oven (Fisher Scientific, Pittsburgh, PA) at 103 ± 2°C for 24 h, following the ASTM D4442 standard. 33 After drying, each material was ground separately using the same process as for the rHDPE and screened using a Tyler nest of sieves for 5 min using a sieve shaker (model RX-29, W.S. Tyler® Industrial Group, Ohio, USA) prior to use. The wood flour collected from both PW and TW, retained between meshes #30 and #40 (particles sizes ranging from approximately 0.43 to 0.60 mm), was used for the study.
Maleic anhydride-grafted HDPE (Polybond 3009) supplied by Brenntag México, S.A. de C.V. (Tultitlán, Estado de México, Mexico) was used as a coupling agent (CA). Struktol TPW 113 (a blend of modified fatty acid esters) from Struktol Company of America (Stow, OH, USA) was used as a processing aid (PA). Both CA and PA were ground using the Brabender mill described previously. They were necessary to formulate the WPC.
Termites
Arboreal termites were obtained from a nest located in a green area of the Yucatan’s Science and Technology Park in Merida, Mexico, at the coordinates 21°07’54.08” N and 86°46’44.14” W. The termites were identified as Nasutitermes corniger based on their taxonomic characteristics reported in the literature. 34 The termite nest was fractionated and placed in aluminum trays with a wet paper towel on top to select only live and healthy termites. Termites that migrated to the wet paper within a few minutes were considered vigorous and were placed in a separate 22 L plastic box with more wet and crumpled paper at the bottom, covered by two layers of dry paper folded in half. These vigorous termites were selected for the experiment.
Wood residues composition determination
To determine the basic chemical composition of the wood residues (both TW and PW), analysis was carried out at the Department of Wood, Cellulose, and Paper of the University of Guadalajara (Mexico). Additionally, the number of extractables from TW residues in dichloromethane was determined using the Soxhlet technique following the TAPPI T-204 cm-07 standard. 35
Experimental design
Factors and levels of the experimental design.
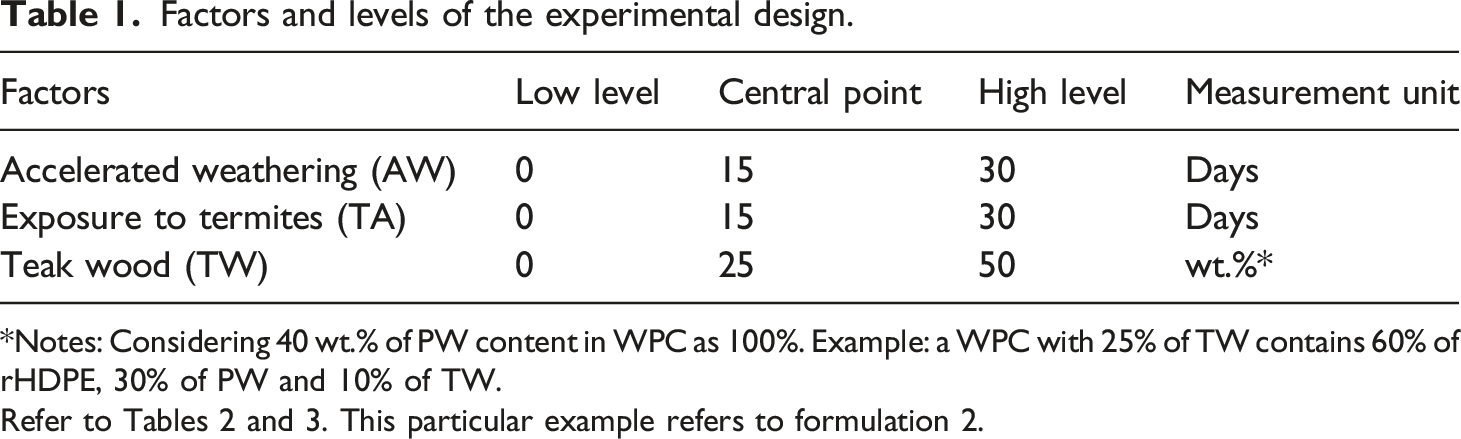
*Notes: Considering 40 wt.% of PW content in WPC as 100%. Example: a WPC with 25% of TW contains 60% of rHDPE, 30% of PW and 10% of TW.
Experimental design matrix.
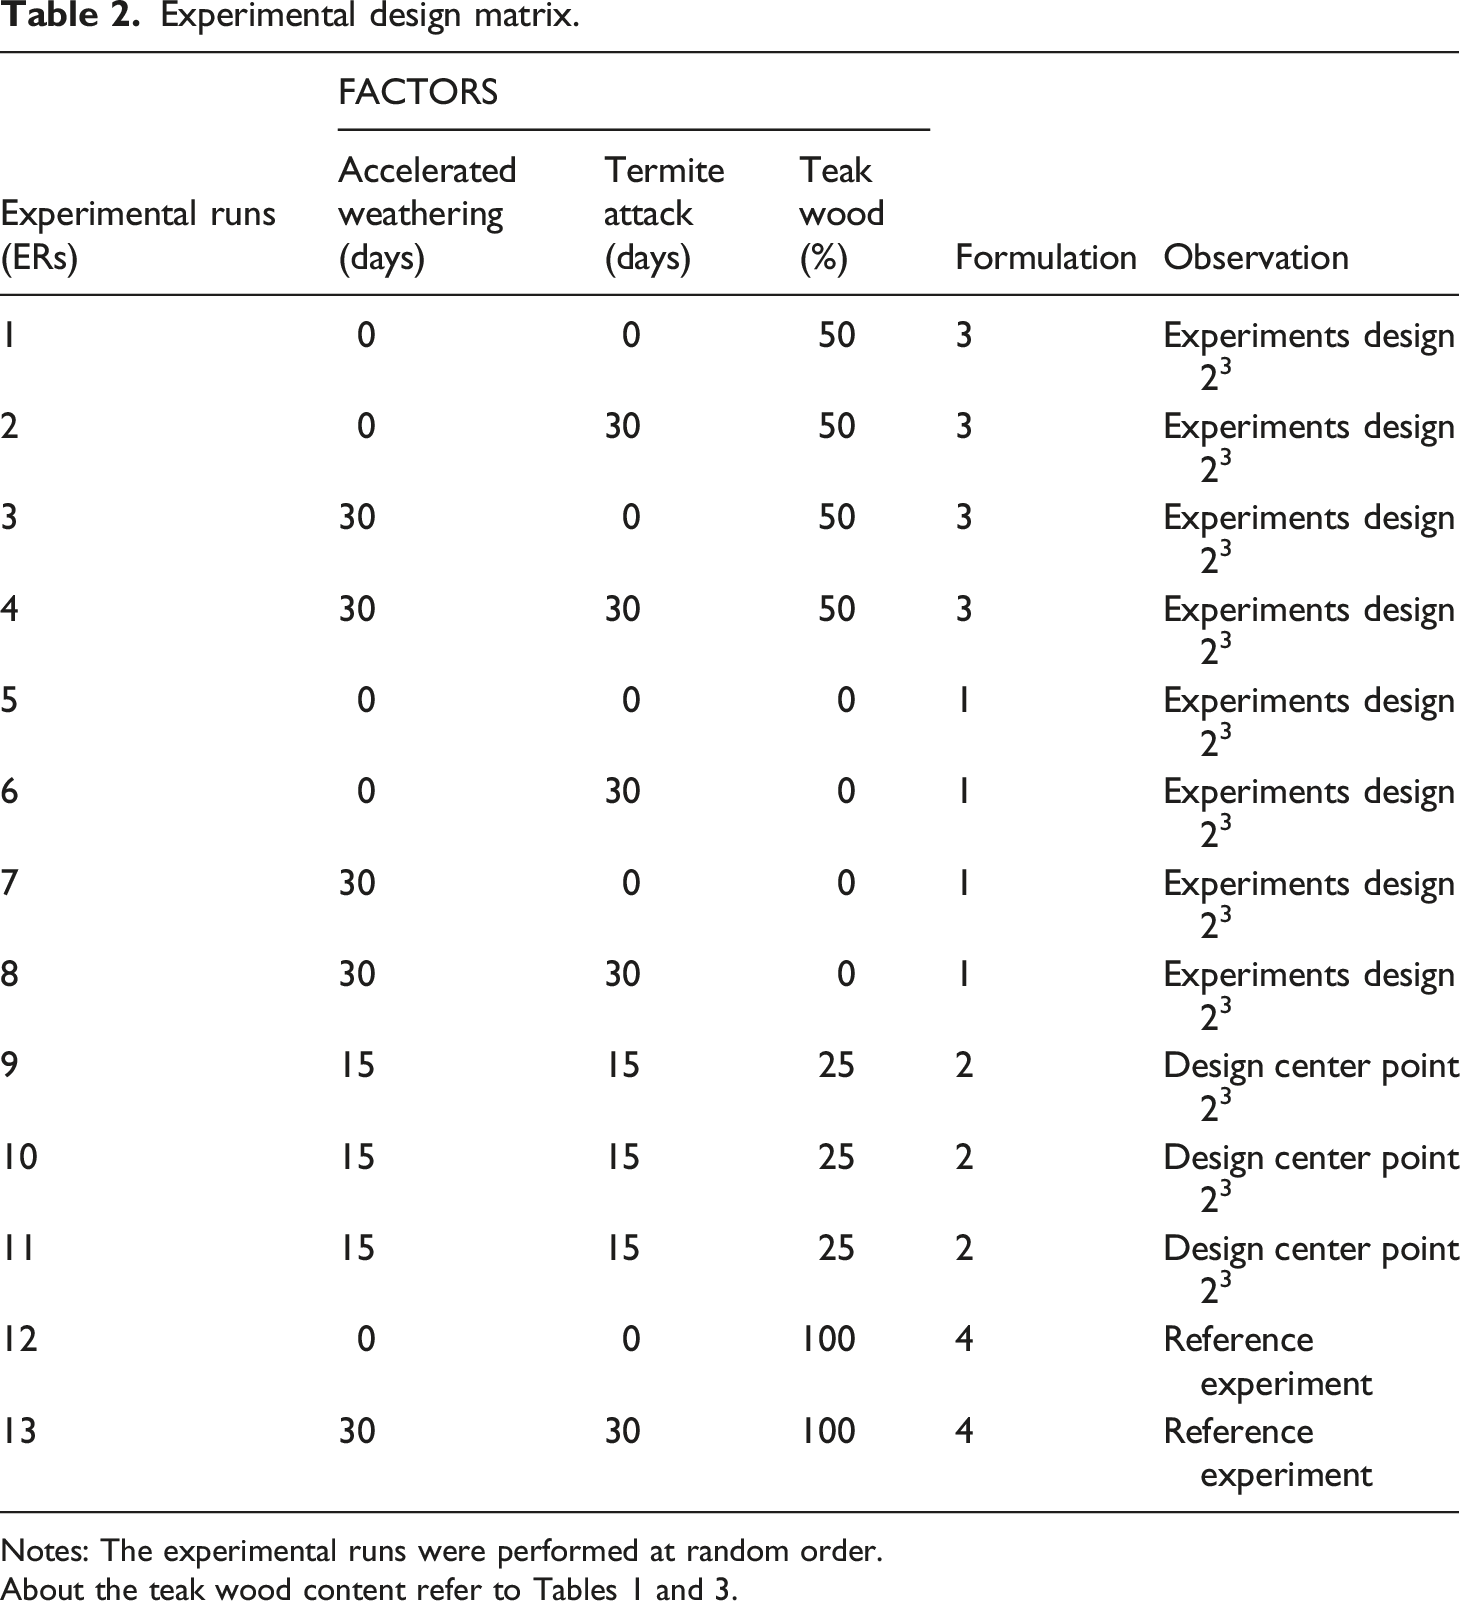
Notes: The experimental runs were performed at random order.
WPC Formulations studied based on wood residues and rHDPE.
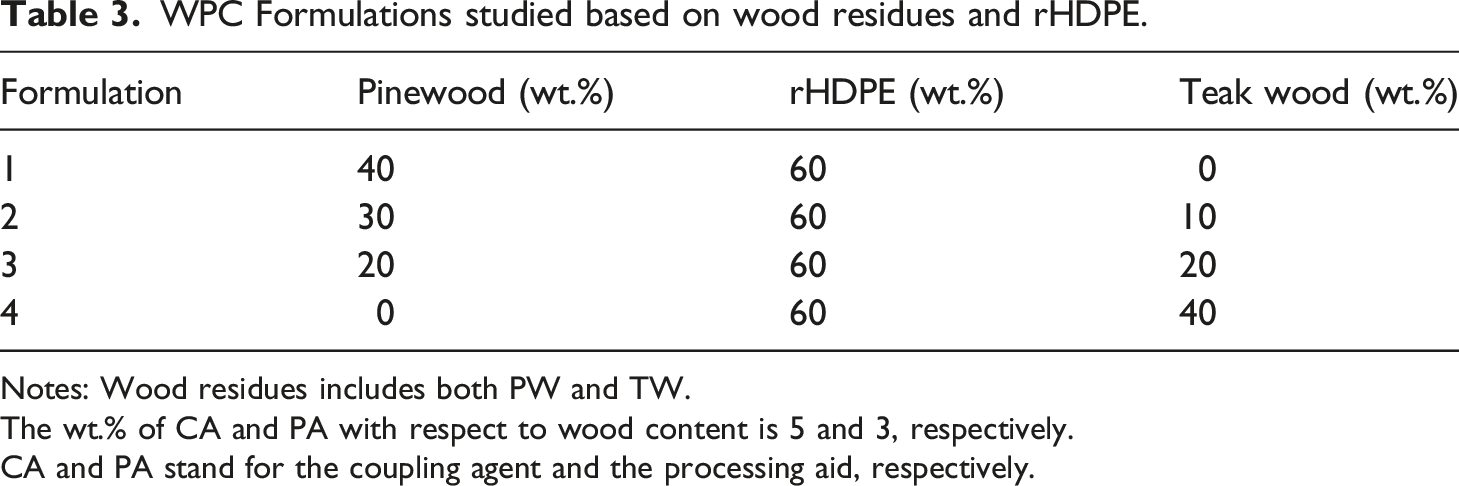
Notes: Wood residues includes both PW and TW.
The wt.% of CA and PA with respect to wood content is 5 and 3, respectively.
CA and PA stand for the coupling agent and the processing aid, respectively.
Statistics
The Qualitek-4 software (Nutek, Inc., 3829 Quarton Rd Ste 102, Bloomfield Hills, 48,302 Michigan, MI, USA) was used to assess the impacts of the factors listed in Table 1 on weight loss of the samples, utilizing standard analysis with the average of results and “smaller is better” as a quality control parameter.
Composites and test specimens’ preparation
Pine wood, TW, rHDPE, and additives were premixed in a horizontal mixer model ML-5 (Intertécnica, Mexico City, Mexico) with a helical agitator, according to the composition detailed in Table 3. The components were added sequentially, and the resulting mixtures were dried in a convection oven (Fisher Scientific, Pittsburgh, PA) at 103 ± 2°C for 24 h before compounding. Formulation 1 (Table 3) served as the base formulation, with 40 wt.% of PW and 60 wt.% of rHDPE. In the other formulations, PW was replaced by TW according to the experimental design shown in Table 2. The amount of additives used was 5 wt.% of CA and 3 wt.% of CA with respect to the content of PW. Each formulation was processed by extrusion in a laboratory Brabender modular twin-screw extruder, TSE 20/40 model (C.W. Brabender Instruments, NJ, USA), using a 4 cm long extrusion cylindrical die with a 3 mm internal diameter fitted to the extruder. The extrusion was done at a screw speed of 15 rpm and at a barrel and die temperature of 180°C. The extrudates were pelletized using a Brabender laboratory pelletizer machine, type 12-72-000 (C.W. Brabender Instruments, NJ, USA). The test specimens were prepared using the pellets obtained. They were hot-pressed at 180°C for 10 min using an automatic hydraulic press, model 3819 (Carver, IN, USA), with a compression force of approximately 40 kN (8900 lbf) to obtain 15 cm x 15 cm x 3 mm flat plaques. The resultant plaques were machined to obtain specimens with the dimensions and geometry specified in the ASTM D790 standard. 36 Rectangular specimens 6 mm wide, 3 mm thick, and 120 mm long were obtained for the exposure tests to AW and TA, with 10 specimens prepared for each of the experimental runs (ER) (Table 2).
Accelerated weathering experiments
The rectangular specimens underwent accelerated weathering (AW) testing according to ASTM D4329 37 and ASTM G154 38 standards in a Q-Panel UV light test chamber, model QUV/SE (Quality Instruments de México, Querétaro, México), equipped with UVB-313 lamps (Atlas Electric Devices, Chicago, IL). The specimens’ surface was subjected to cycles of UV radiation and condensing moisture, consisting of 8 h of UV radiation at 60°C, followed by 4 h of condensation at 50°C. The exposure time and specimens' formulation details can be found in Tables 2 and 3 10 samples per each ER were tested.
Exposure to termites
The specimens subjected to AW were subsequently exposed to TA, following the ASTM D3345 standard
39
merely as a reference guide for the experiment. To set up the experiment, rectangular plastic boxes with a capacity of 12.6 L were first cleaned and sterilized. A layer of clean sand without organic matter, weighing 1.72 kg, was then added to each box, along with 480 mL of deionized water. The boxes were left to settle for 24 h before adding the dried (at 80°C for 24 h) and weighed specimens, which were left in the boxes with sand for an additional 24 h. To initiate the experiment, 5 g of termites with a ratio of 60/40 workers to soldiers were introduced into each box, and the boxes were maintained under laboratory conditions of 27 °C–28°C and 70%–80% humidity for 24 h before the start of termite exposure. Trays filled with water were placed beneath the boxes as a precautionary measure to prevent termite escape (Figure 1). View of the system used for the experiment with termites.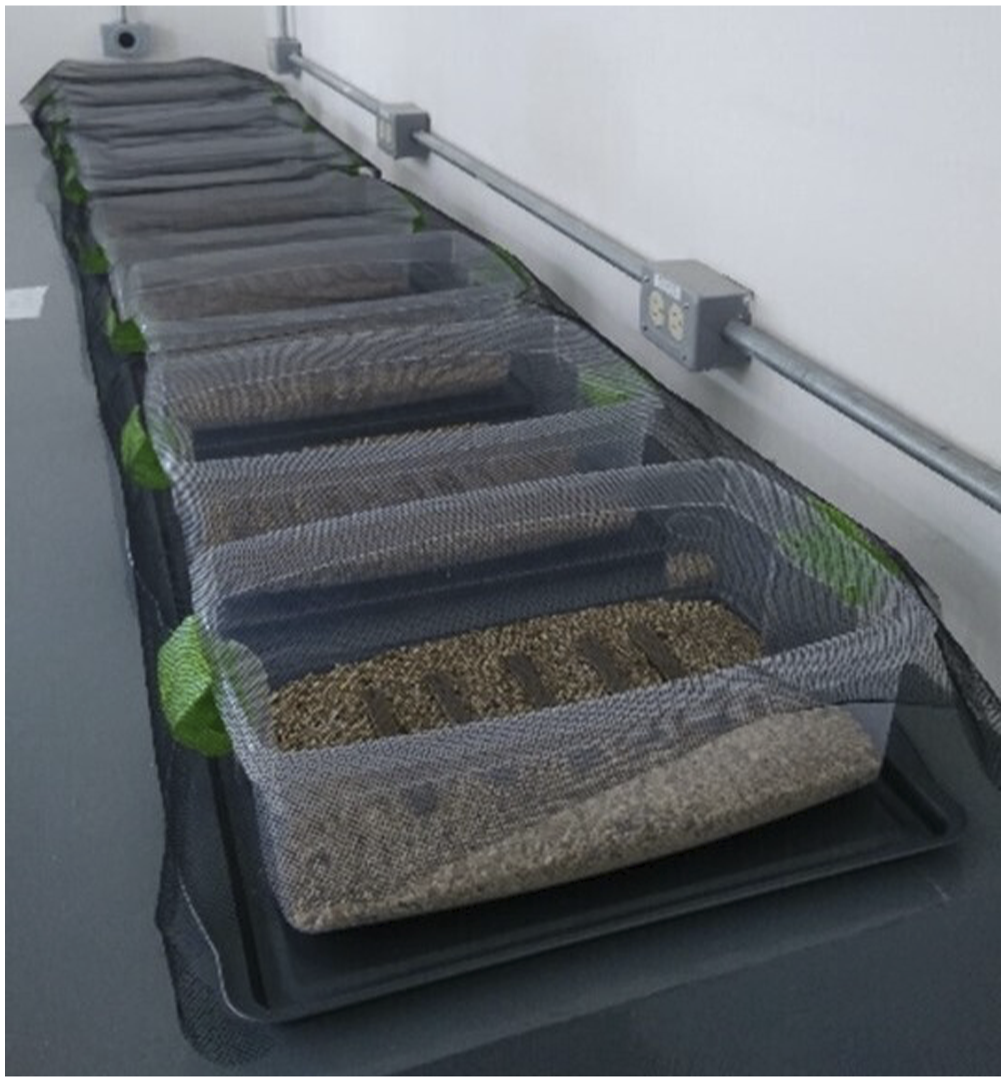
The experimental design involved exposing the specimens to TA for various periods (0, 15, and 30 days) (Table 2). As mentioned, the boxes with termites were kept in a laboratory under controlled conditions, with temperatures ranging from 27 to 29°C and humidity between 70 and 80%. The boxes were weighed daily to maintain their initial moisture content, with additional water added as necessary. After 1 week, termite mortality was assessed to ensure the validity of the experiment. Upon completion of the designated exposure time, the specimens were dried in the aforementioned convection oven at 80°C for 2 h to measure the weight loss due to insect attack. To prevent termite spread, the termite nest was appropriately disposed of.
Scanning electron microscopy of WPC
Morphological analysis of the WPC specimens' surface exposed to AW and TA was carried out using scanning electron microscopy (SEM). A JSM-6360 LV electron microscope (Jeol USA, Inc., Peabody, MA) was used. The specimens were examined at a working distance of approximately 20 mm and operating the instrument at a voltage of 10 kV. The samples were prepared by cutting them into small sections (6 mm x 6 mm) using a razor blade, mounting them onto stubs, and then gold-coating them using a Denton Vacuum Desk II sputter coater (Moorestown, NJ, USA). The samples were analyzed at 70X magnification.
Fourier transform infrared spectroscopy
Fourier transform infrared spectroscopy (FTIR) was conducted using a Cole-Parmer Thermo Scientific Nicolet 8700 spectrometer (Vernon Hills, IL, USA). It was performed to provide a detailed analysis of the functional groups in TW and PW and also on WPC specimens subjected to different degradation processes. The aim was to determine the probable cause of such degradation. Scans were performed at a resolution of 4 cm−1. For each sample, 100 scans were recorded from 4000 to 500 cm−1. The attenuated total reflectance (ATR) technique with a germanium crystal was utilized. Both TW and PW were analyzed to identify their characteristic absorption bands, as well as some bands that differentiate them.
Results and discussion
Composition of the wood residues
Basic chemical composition of PW and TW respectively in % w/w.
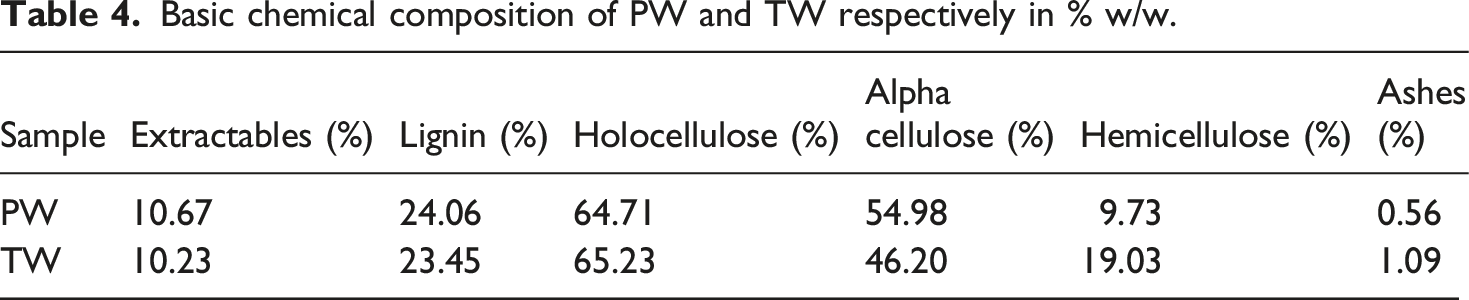
In teak wood samples, it was also determined how much of the total extractables corresponded to extracts soluble in dichloromethane using the Soxhlet technique. The analysis revealed a weight percentage of 5.81% and 7.60% for a total average of 6.71% by weight. These extractables have been reported to exhibit a biocidal effect. 23 The values of 0.67% and 1.34% obtained for the formulations with 10 and 20 wt.% of TW are within the range of biocides such as zinc borate used in this type of composite, which is up to 2%.40,41 Other types of extractables in wood with potential biocidal effects have been identified, such as those in ethanol. 42
Fourier transform infrared spectroscopy of PW and TW
Assignments of the intensities of the main absorption peaks in the FTIR spectra of TW and PW.
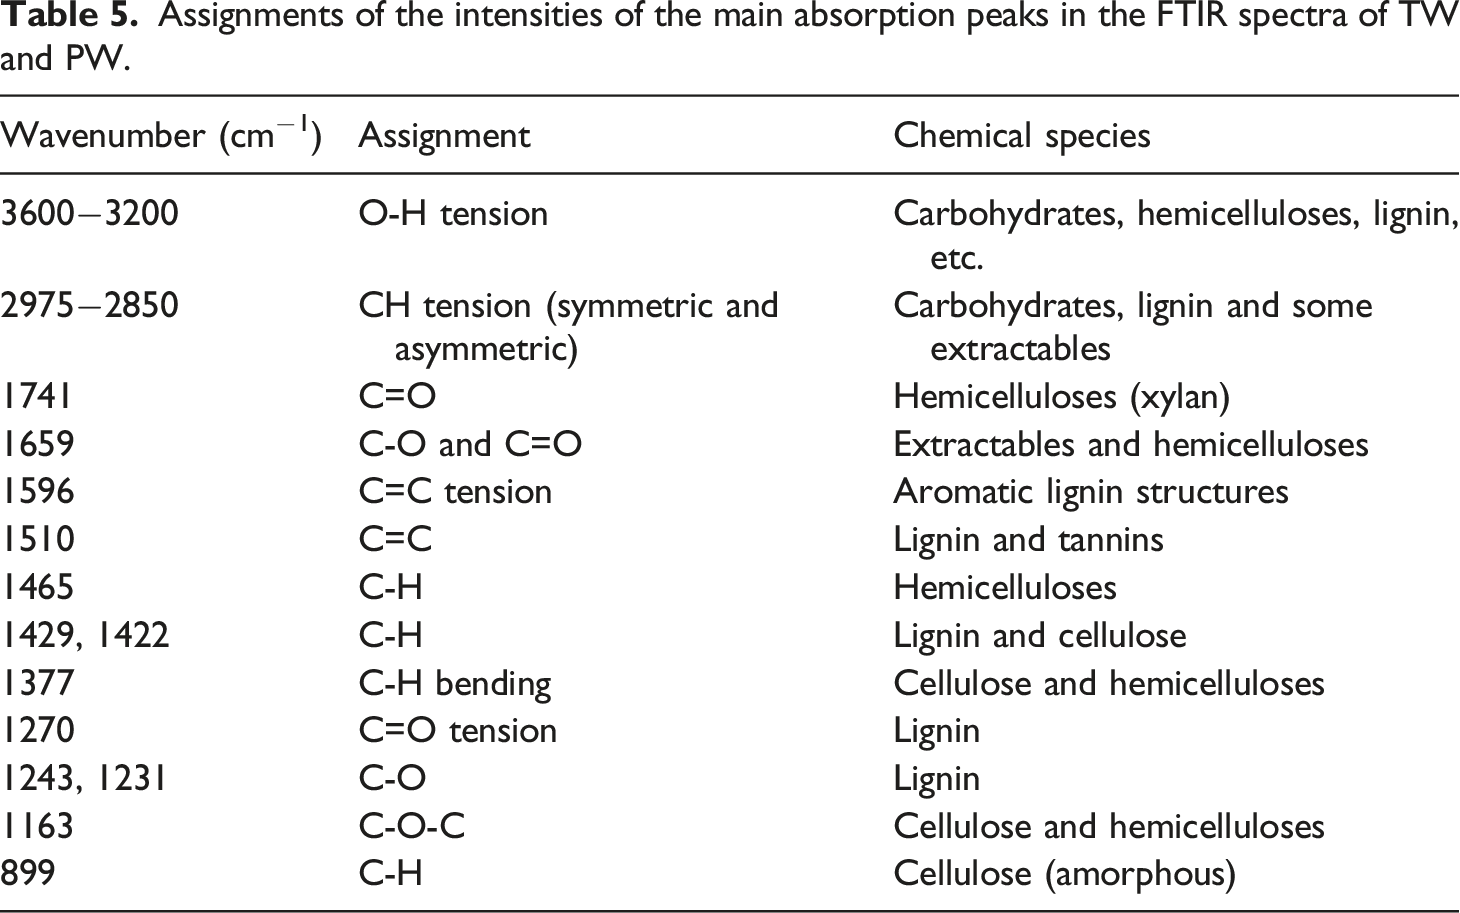
Figure 2 shows the characteristic bands for each type of wood and some distinctive bands. In the spectra of both kinds of wood, a broadband between 3600 and 3200 cm−1 was observed, indicating strain vibration of OH groups of all macromolecular components and some extractables.32,43 The region of 2970−2850 cm−1 showed a set of bands that correspond to the symmetric and asymmetric vibration of the methyl and methylene groups present in the different primary and secondary metabolites of the wood.
43
At 1741 cm−1 a C=O tension band of carbonyl and acetyl groups of hemicelluloses was detected, with partially acetylated glucuronoxylans predominating in TW.
32
For PW this type of hemicellulose is less common, which reflects a lower hemicellulose content than in teak wood (Table 4). The peak at 1659 cm−1 in TW indicated the presence of the C-O group of conjugated quinones coupled with C=O groups,
44
which contribute to the natural durability of TW. FTIR spectra of teak and pine wood.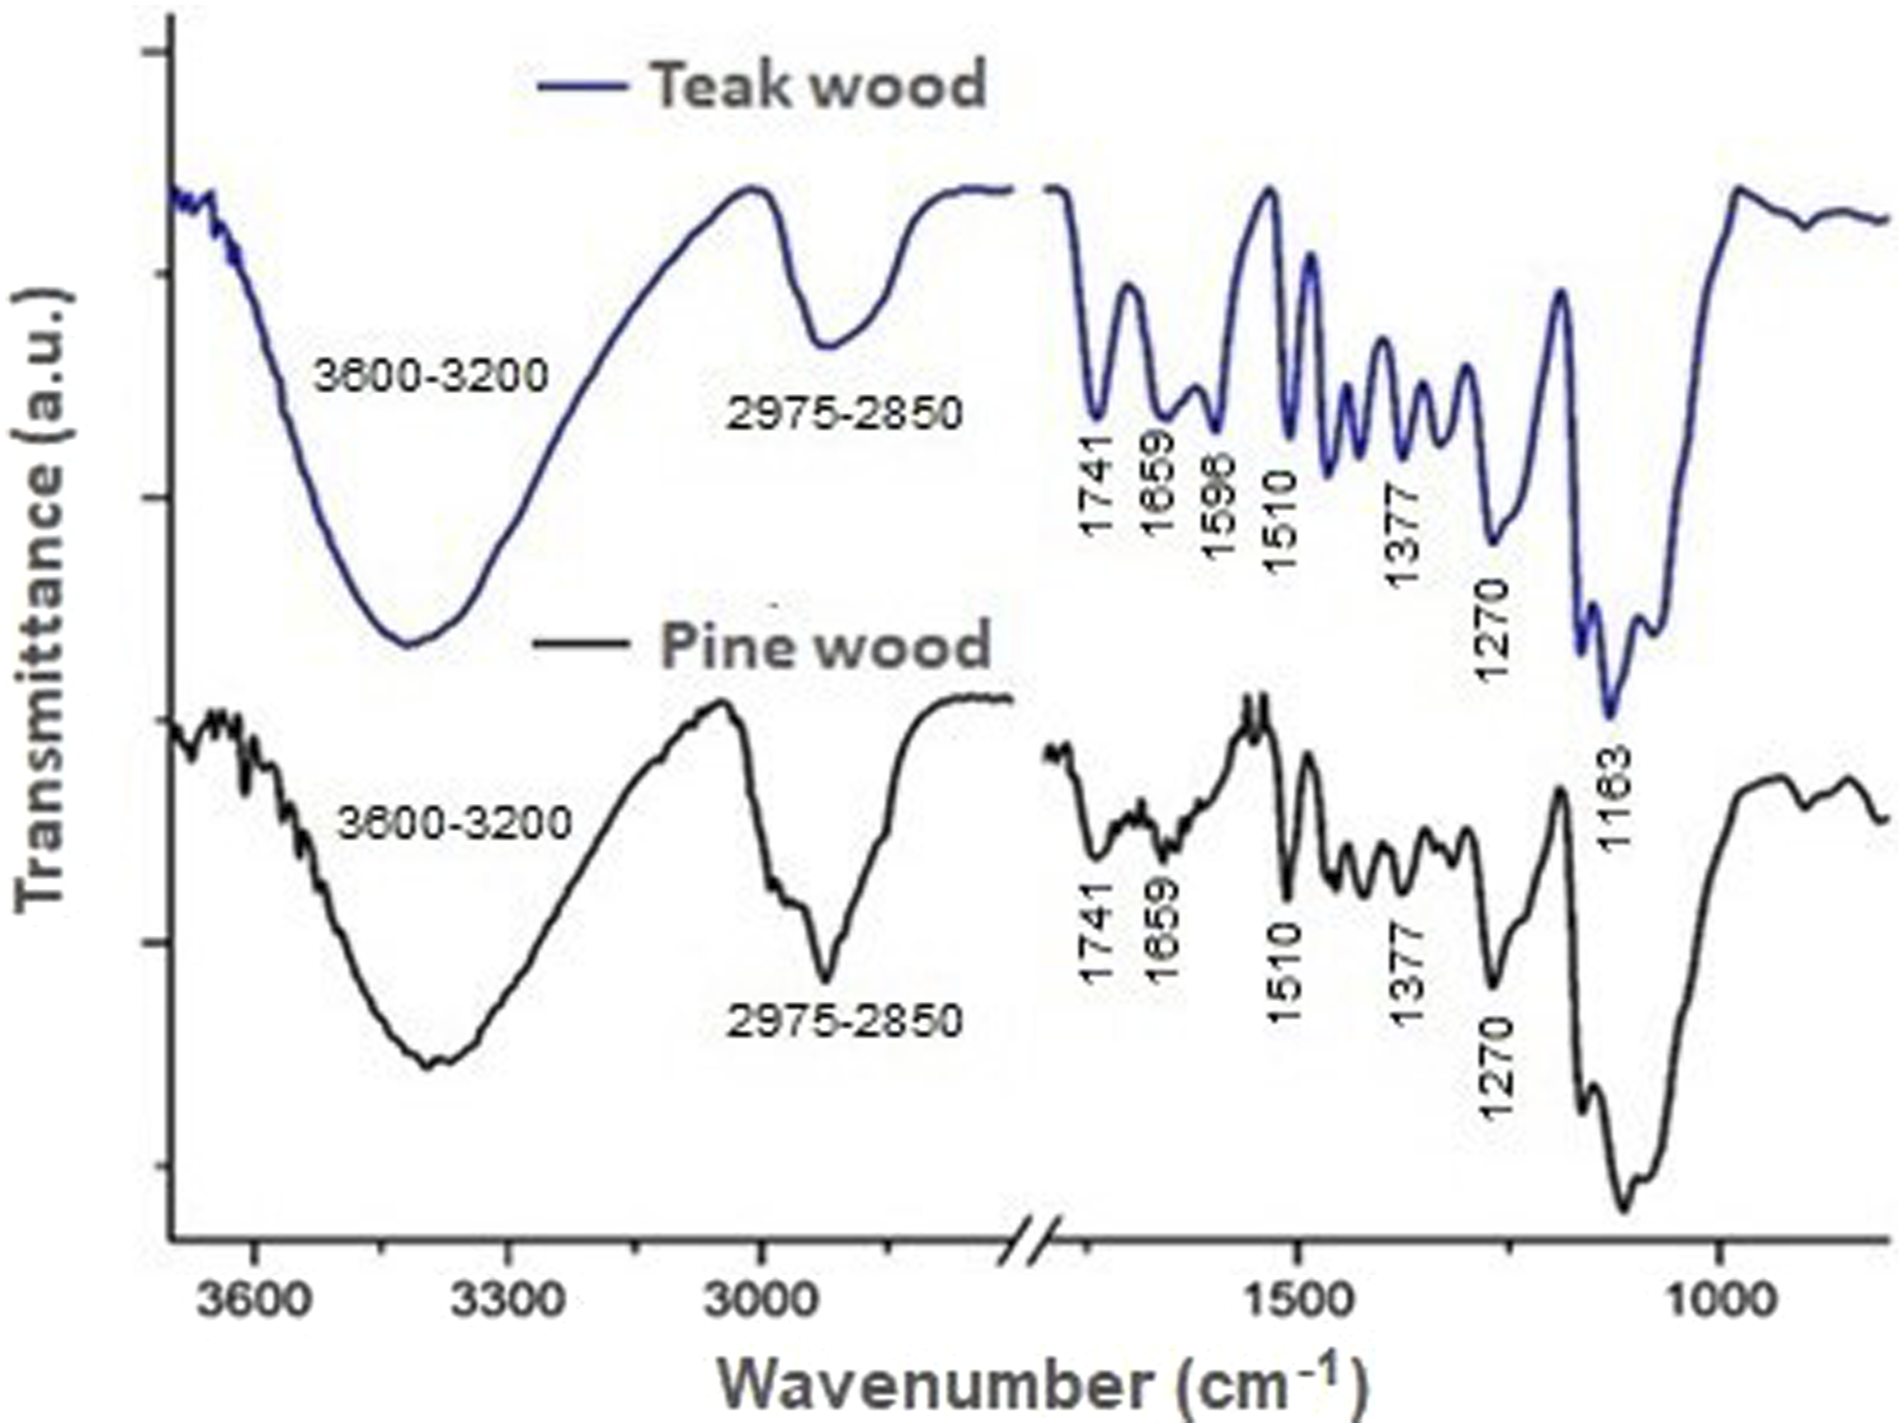
The C=C tension of aromatic lignin structures 44 was detected at 1596 cm−1, and the peak at 1510 cm−1 corresponded to C=C aromatic structures of a benzene ring, possibly belonging to the phenylpropanoid lignin guaiacyl,14,32,43 where the intensity of this peak could be due to the presence of certain extractables such as tannins with aromatic rings. The peak at 1465 cm−1 was attributed to the xylan strain of hemicellulose. The peaks at 1429 cm−1 and 1422 cm−1 corresponded to C-H vibrations in aromatic structures associated with cellulose or lignin 32 . The peak at 1377 cm−1 was associated with C-H bending in cellulose and hemicellulose,14,32 while that at 1270 cm−1 corresponded to the tension vibration of the C=O groups of guaiacyl rings of lignin.14,43,45 The C-O bond of lignin syringyl rings occurred at 1243 cm−1 and 1231 cm−1 for TW and PW, respectively. 14 The peak at 1163 cm−1 was associated with the C-O-C tensile vibration of the pyranose rings. 14 Finally, the low-intensity peak at 899 cm−1 indicated C-H deformation in amorphous cellulose. 45 These differences in the spectra may explain the higher hemicellulose content and greater durability of TW wood in comparison with PW, which will be explained below.
Termite mortality
Weight loss (wt.%) and mortality rate, only of ER specimens exposed to termite Attack.
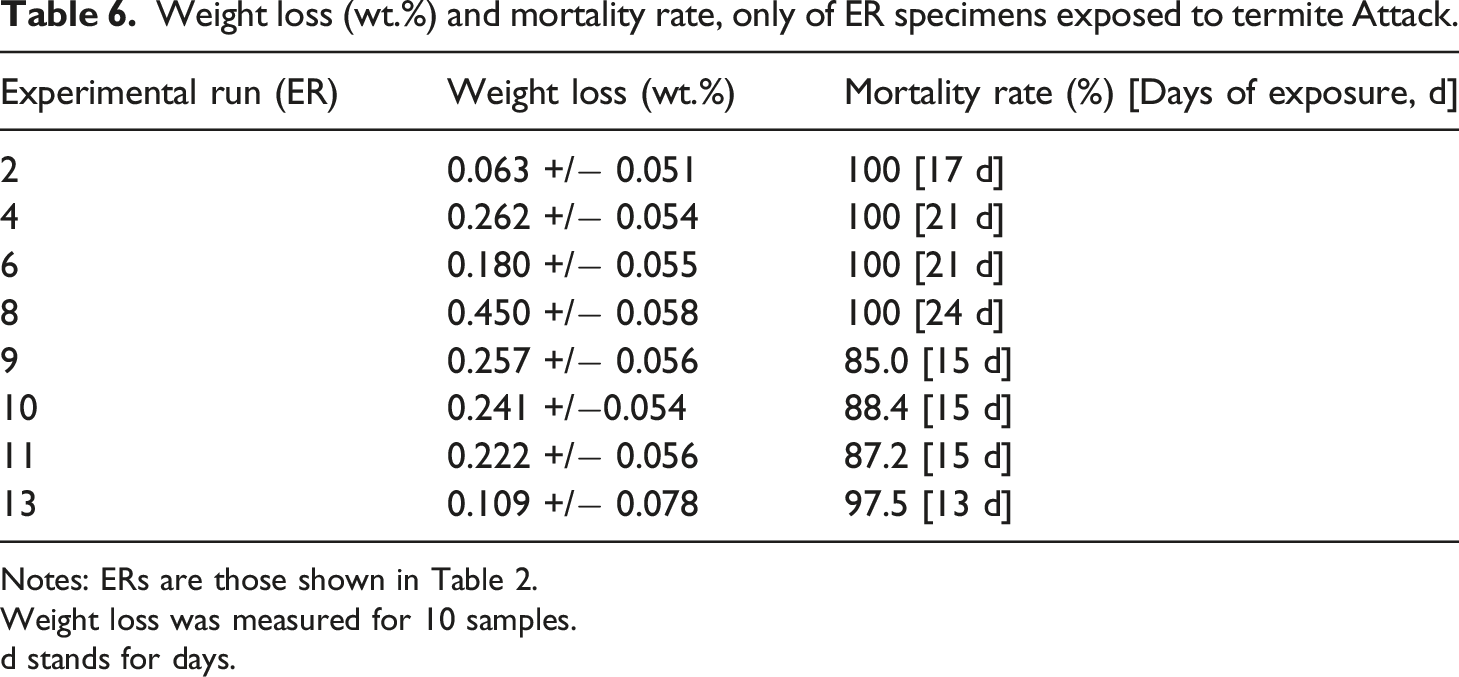
Notes: ERs are those shown in Table 2.
Weight loss was measured for 10 samples.
d stands for days.
During the first week of the experiments, all termites remained alive (i.e., 0% mortality). It is important to note that the percentage of termite mortality only accounts for healthy termites capable of migrating towards the wet paper at a specific time, as described in the experimental section. In most plastic boxes, the termites preferred to locate in areas farthest from the light, beneath the test specimens. This behavior is characteristic of termites, as they are lucifugal insects that avoid light. However, notable differences in their activity were observed depending on the composition of the WPC samples.
For composites with a certain PW content, the termites showed more active behavior, moving between different specimens, and leaving traces of their characteristic metabolic product. Conversely, for test samples containing only TW (ER 13), termites showed sporadic activity and only positioned themselves under two of the 10 exposed samples. Furthermore, after 13 days of exposure, almost all the termites died (i.e., 97.5% mortality). One possible cause of this is the contact of termites with TW extractables, both outside and inside the specimens. It is possible that such extractables had insecticidal properties 46 causing termites to move away and preventing them from feeding on the WPC samples, which ultimately led to their death from starvation.
After 15 days of exposure to TA, the test specimens corresponding to ERs 9, 10, and 11 exhibited termite mortality rates of 85.0%, 88.4% and 87.2%, respectively, with an overall average of 86.9% for the experiments.
Termite mortality rates of 100% were observed for ERs 2, 4, and 6 after 21 days. For ER 8 full termite mortality was reached after 24 days of exposure. These specimens contained varying amounts of PW, with ERs 6 and 8 having 100 wt.% of PW in WPC. The difference in mortality times between these two identical formulations was due to the prior treatment with AW in ER 8, while samples of ER 6 did not undergo such treatment. For the first two identical formulations (ERs 2 and 4), both containing 50 wt.% of TW (Tables 2 and 3), the effect of AW (30 days of exposure) on ER 4 was not significant enough to produce differences in termite mortality time compared to ER 2. It is noteworthy that in most of the plastic boxes, the termites formed tunnels in the sand (Figure 3), which is considered a sign of their vigor according to the ASTM D3345 standard.
39
Exposure of specimens of ERs to a termite attack: tunnel formed by termites during the exposure.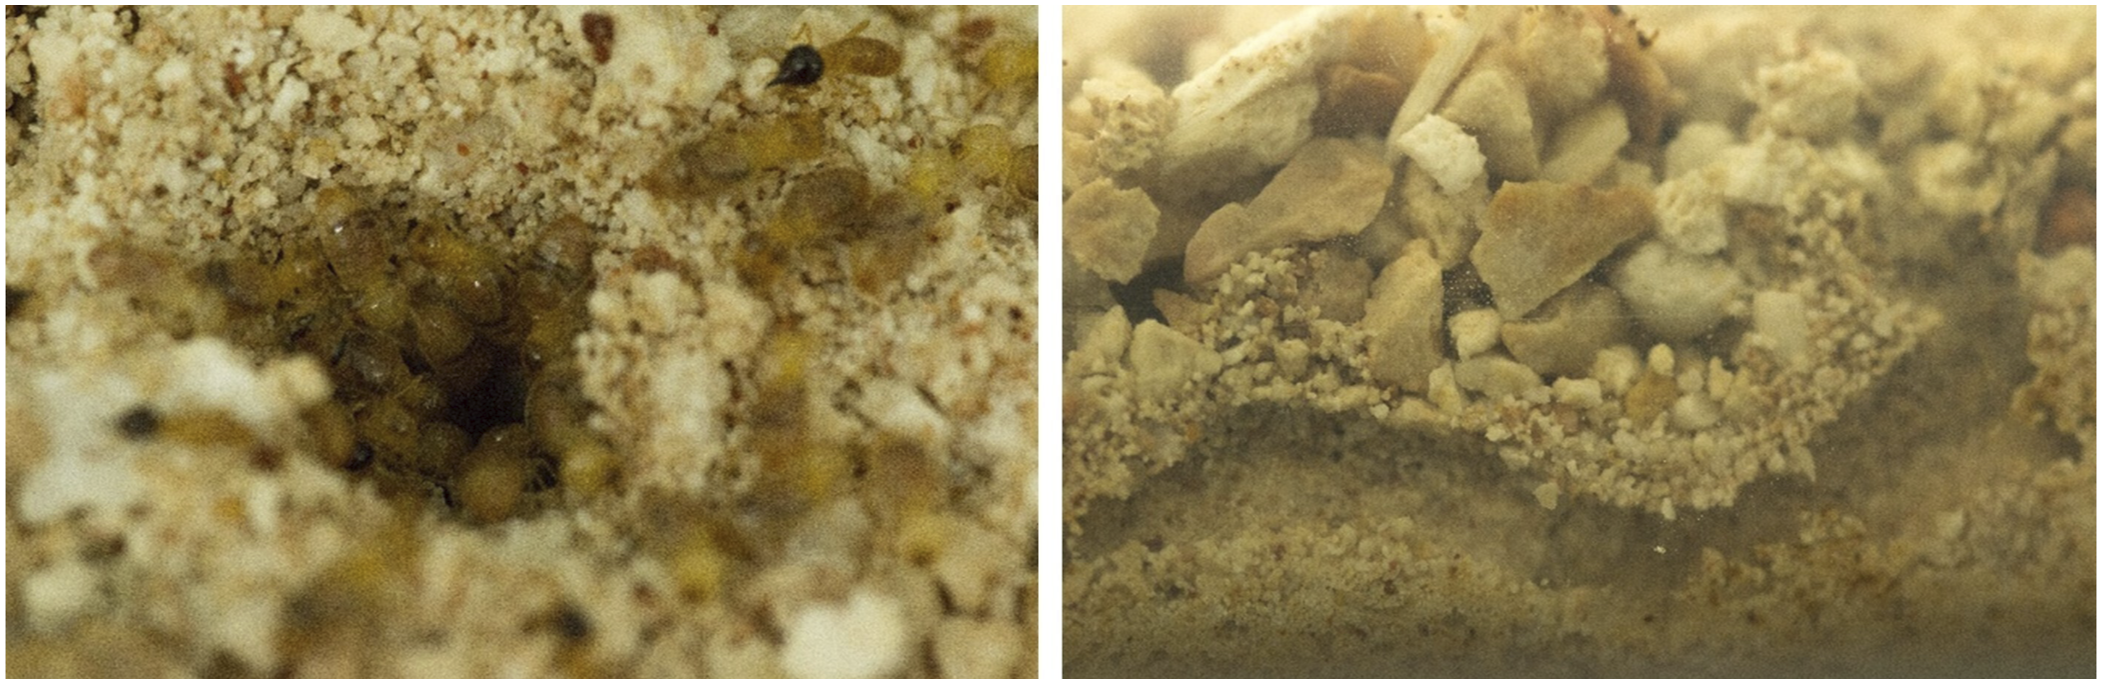
WPC weight loss due to exposure to termites
The weight loss of the specimens was determined at the end of the exposure time (i.e., AW or TA) according to the experimental design (Table 2). Samples from ERs 1, 3, 5, 7, and 12 retained their total weight since they were not exposed to TA. However, the other specimens that were exposed to TA for 15 or 30 days experienced weight loss (i.e., ERs 2, 4, 6, 8, 9, 10, 11, and 13). For instance, the samples with 25% by weight of TW, that is, ERs 9, 10 and 11, which are the central points of the experimental design, and which were exposed to TA for 15 days had an average weight loss of 0.24%. The other samples corresponding to the other ERs had values higher or lower than this value, as shown in Table 6.
Specimens containing only PW and subjected to 30 days of AW followed by 30 days of TA (refer to Tables 2 and 3) showed the highest weight loss with 0.45%, that is, ER 8 (Table 6). In contrast, specimens with only PW and exposed only to TA (ER 6) had a weight loss of only 0.18%. In the first case, exposure to AW led to areas with macro and microcracks on the surface of the samples, which in turn more easily exposed the PW particles to the termites on which they fed (hence, these samples were heavily attacked), resulting in different areas with damaged surfaces.
The Incorporation of TW in specimens containing PW with 50 wt% of TW resulted in lower weight loss compared to specimens without TW. For example, compare the results for samples from ERs 2 and 6, and the results for samples from ERs 4 and 8. Samples from ERs 6 and 8 do not contain TW.
Furthermore, additional exposure to AW (ER 4) caused a greater weight loss than specimens not exposed to AW (ER 2), which had the lowest weight loss (0.06%).
Based on these findings, the statistical analysis using variance analysis (ANOVA) revealed that the weight loss of the specimens was significantly influenced by TA, contributing to 53.70% of the total variation. However, the effects of AW (8.99%), TW (0.79%) were not statistically significant as they were smaller than the experimental error (36.52%), as is seen in Figure 4. No statistically significant effects were observed for any of the potential interactions between variables, namely AW-TA (accelerated weathering-termite attack), AW-TW (accelerated weathering-teak wood flour), and TA-TW (termite attack-teak wood flour), on the weight loss. Effect of TA, AW, and TW on the weight loss of the WPC.
Overall, it was observed that termites primarily attacked areas that were exposed to the AW treatment and the edges of the specimens. This is likely because these areas had more readily available access to the lignocellulosic materials that served as a food source for the termites. Furthermore, the appearance of micro and macro cracks on the surface and edges of the samples caused by the initial abiotic degradation caused by AW likely contributed to the susceptibility of the specimens to termite attack.
Another noteworthy observation was the adaptability of certain groups of termites, especially in specimens of ERs 8 and 11. These specimens showed the formation of structures that resembled termite nests (Figure 5), possibly related to the higher weight loss that occurred in ER 8. Exposure of specimens of ERs to a termite attack: apparent signs of a termite nest formation process in samples from ER8 (left) and ER11 (right).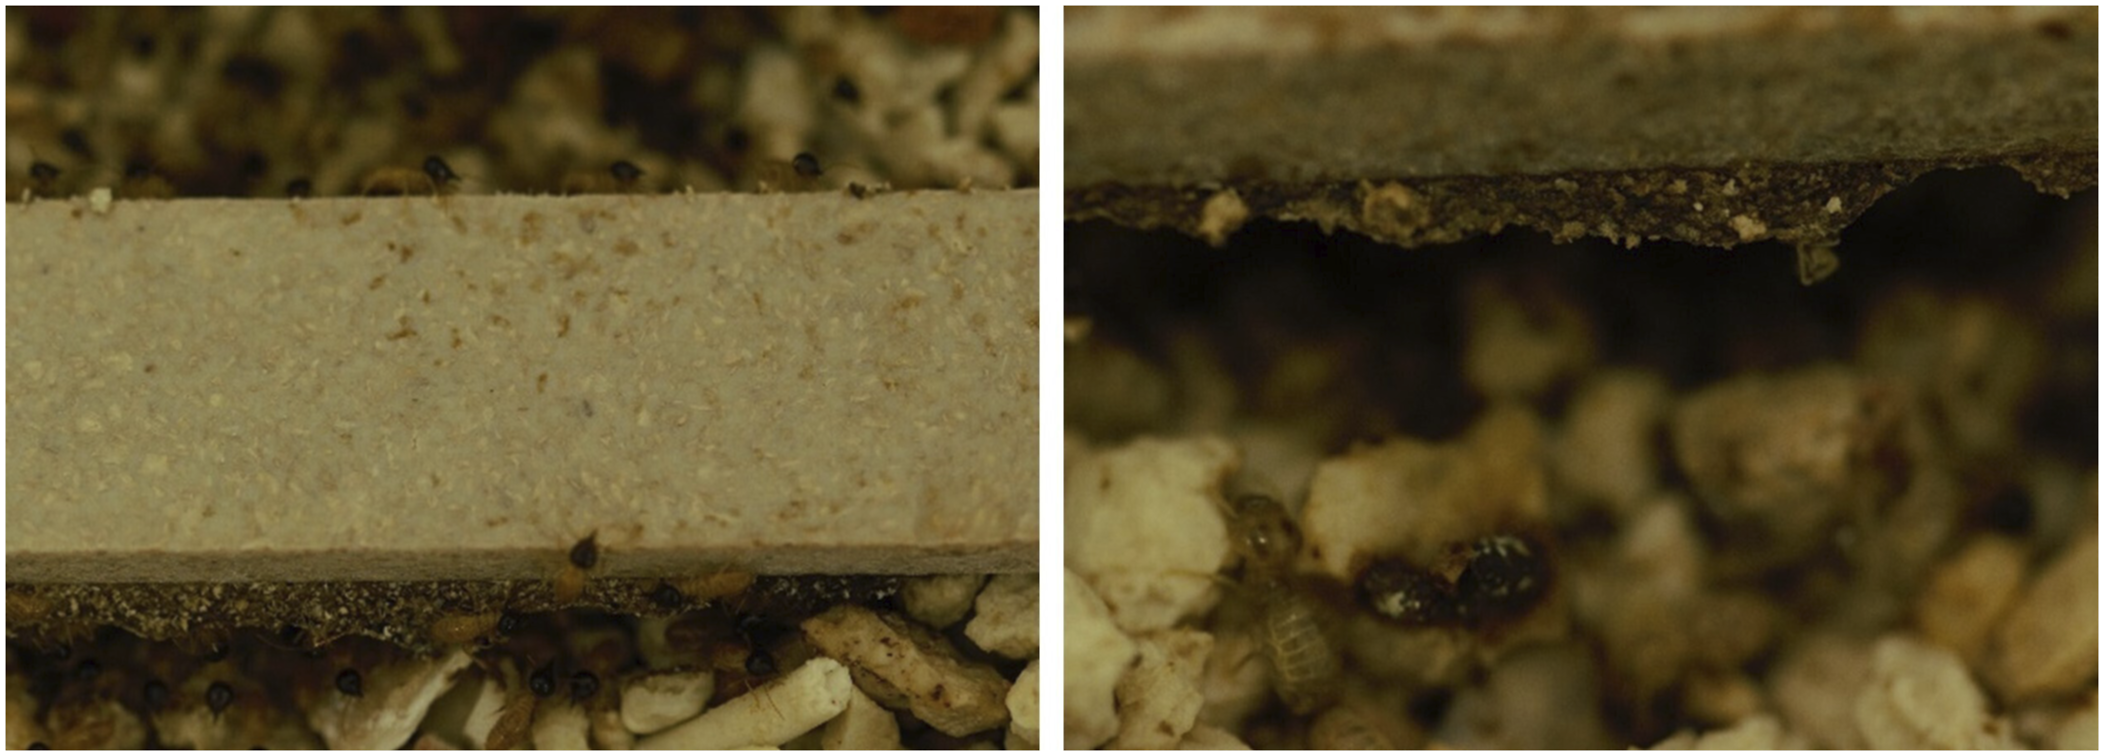
Scanning electron microscopy of WPC
Figure 6 displays the surface morphology of selected WPC specimens. Their compositions are those shown in Table 2 (i.e., they are named as ER1, ER2, and so on, as appropriate). For more detail on their compositions, also consult the information provided in Table 3. Selected SEM micrographs of the surface of specimens corresponding to different ERs: a) ER5; b) ER1; c) ER7; d) ER3; e) ER10; and f) ER2. Surface damages are encircled in yellow, and cracks are encircled in green.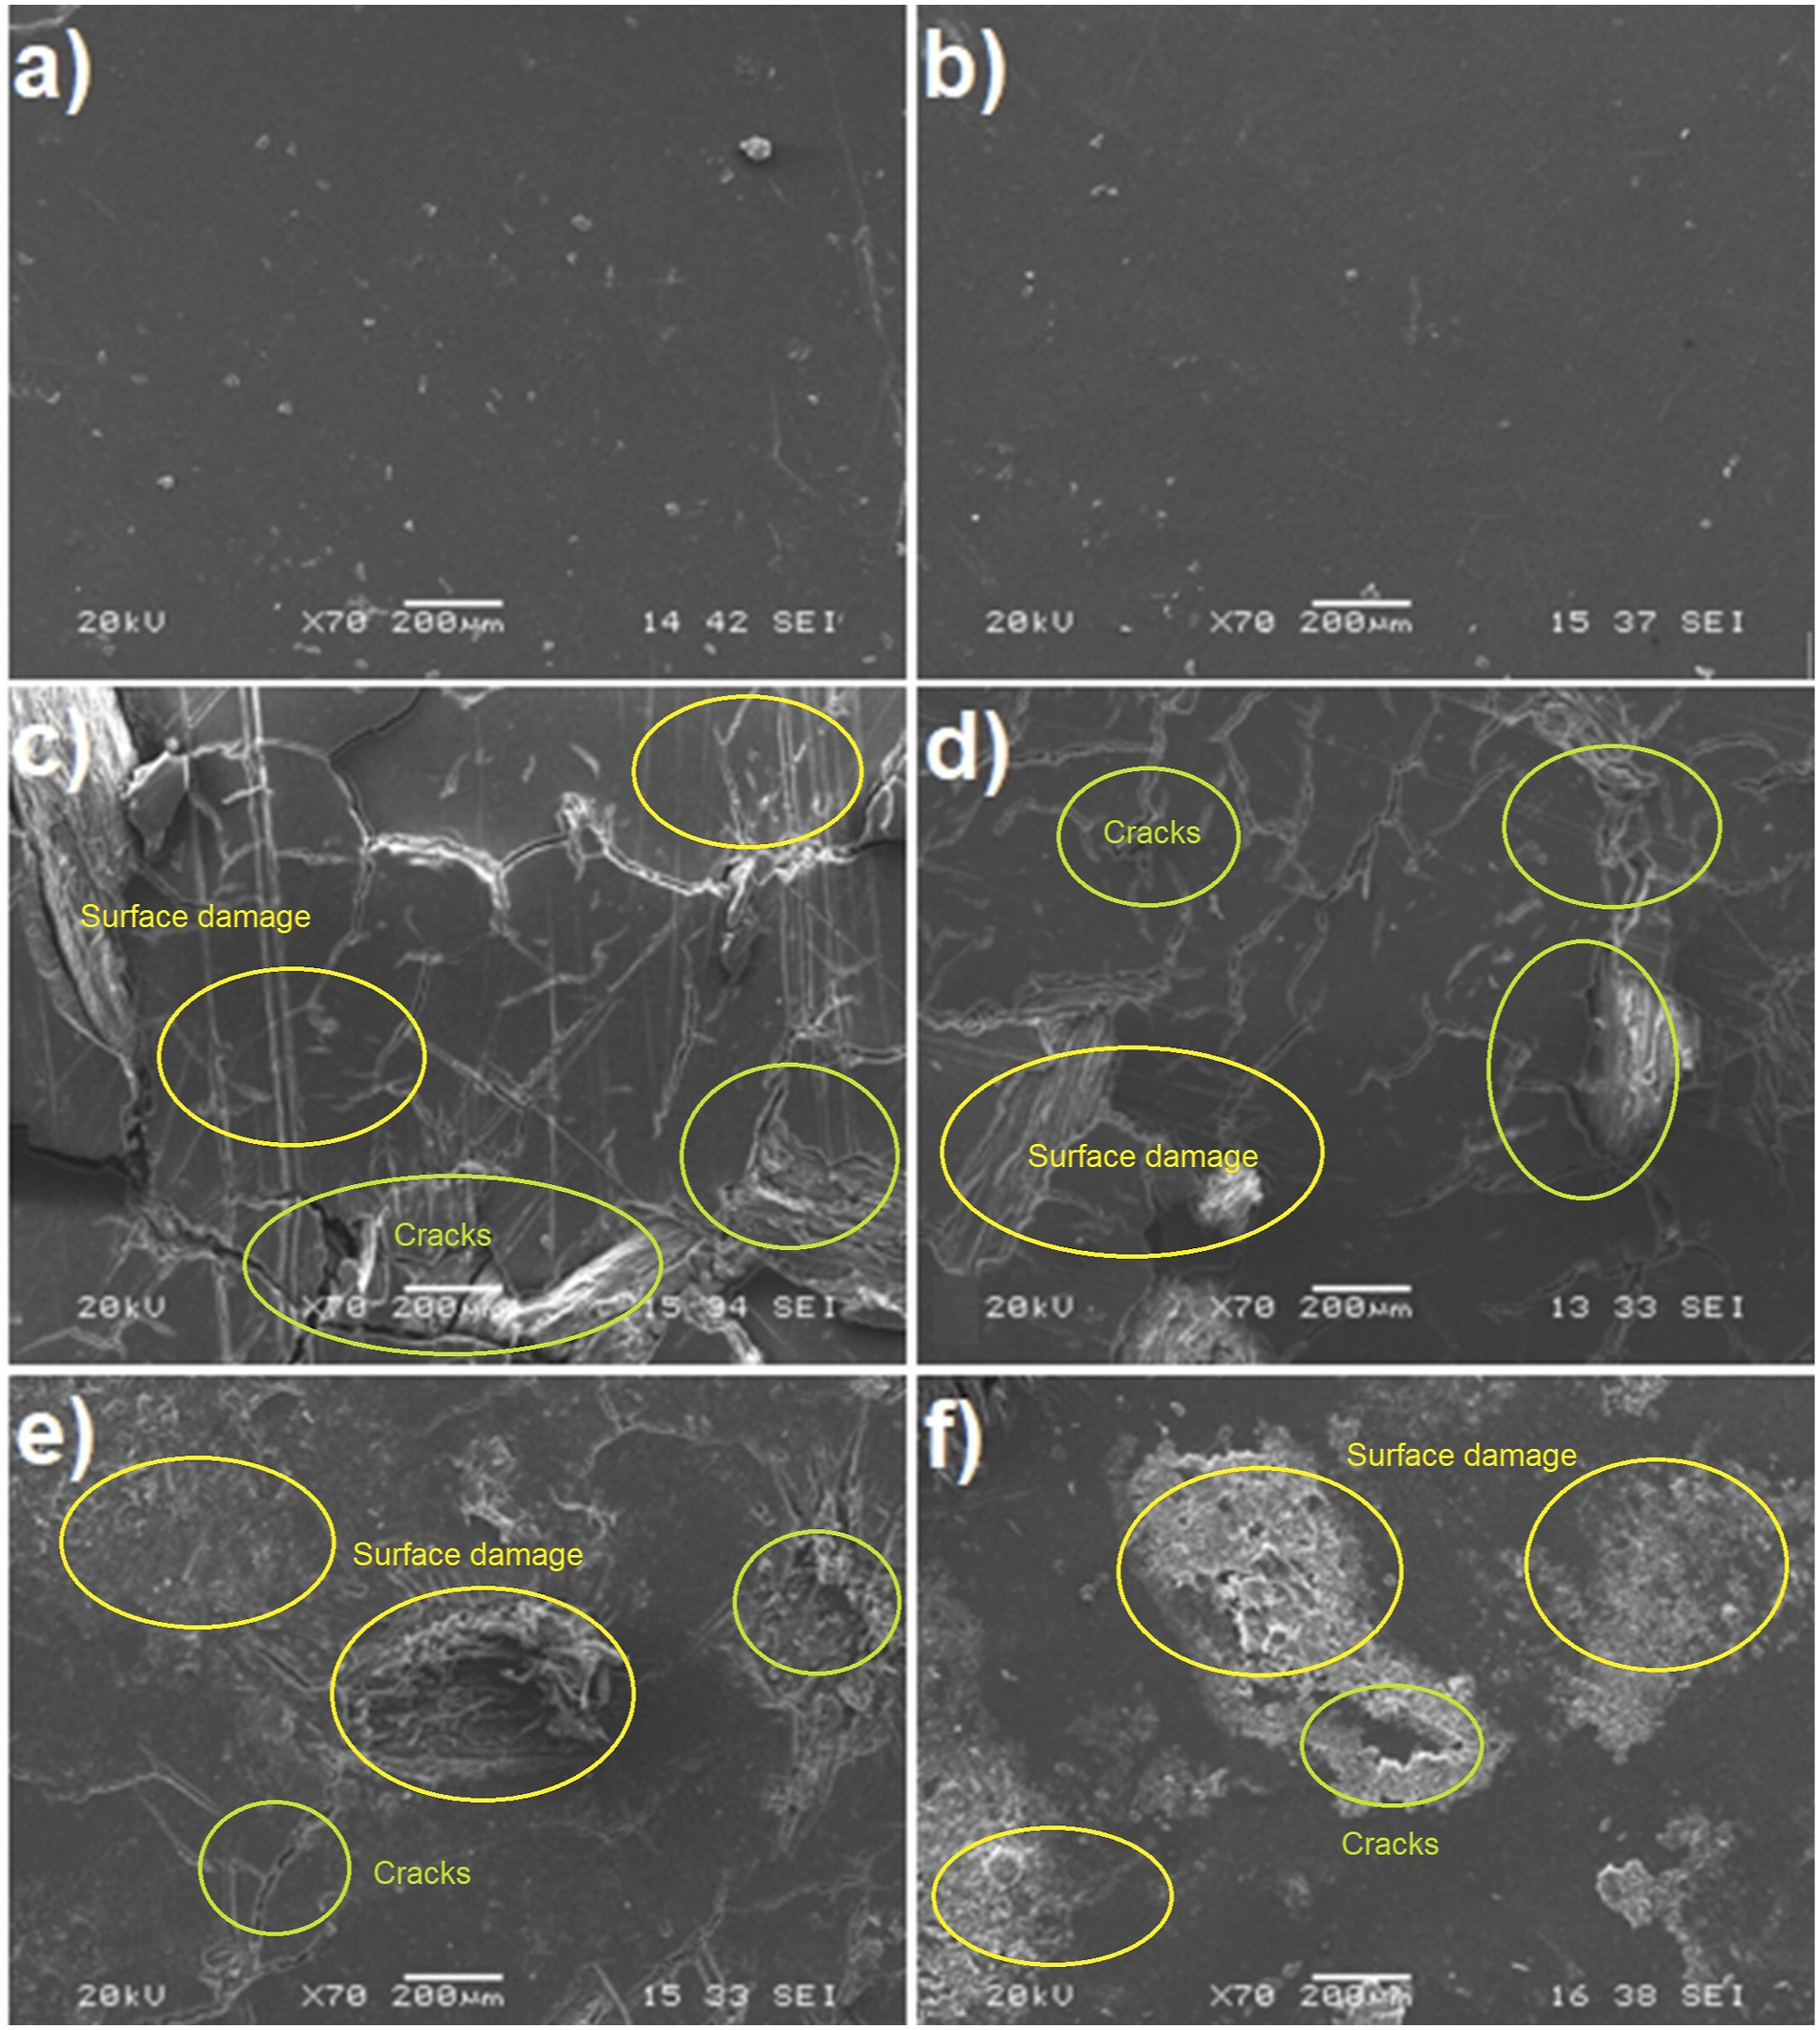
Micrographs of ERs 5 and 1 (Figure 6(a) and (b), respectively) depict a smooth surface with minor agglomerates of PW and/or TW and marks caused by the flowing and cooling process of the molten composite.
ERs 7 and 3 (Figure 6(c) and (d), respectively) show the effect of AW, with the presence of cracks and surface damage. The cracks and surface damage are more significant in the specimen with 100 wt% of PW (Figure 6(c)) than in the specimen with a TW/PW ratio of 50/50 (Figure 6(d)). This may be due to the lower viscosity of the latter composite, which aids in achieving better flow and cooling in the mold. Due to the higher content of hemicellulose in teak wood, there is a higher probability of stronger interactions with the coupling agent (Maleic anhydride-grafted HDPE ). As a result, the surface of teak wood flour (in ER3) becomes more lubricious compared to pine flour (in ER7) during the melting process. This is attributed to the interactions between the coupling agent grafted onto the teak wood and the HDPE matrix. These interactions lead to increased slippage between the polymeric chains, facilitating smoother processing.
The impact of TA time is evident by comparing Figure 6(e) and (f) (ERs 10 and 2, respectively). That is, the surface of ER 2 (Figure 6(f)) looks more damaged due to the longest exposure time to TA (i.e., 30 days) compared to the surface of ERs 10 (Figure 6(e)) with only 15 days of exposure.
Fourier transform infrared spectroscopy of WPC
This analysis technique was used to indirectly observe changes in the composition of the WPC due to their exposure to AW and TA, and due to the presence of TW in them. It was found that the WPC with a high content of HDPE had a more heterogeneous distribution of wood particles, which resulted in the encapsulation of them by the rHDPE. The exposure of WPC to UV radiation and termites led to their degradation, causing the wood particles to be uncovered (i.e., unprotected) by the rHDPE, and oxidation of this thermoplastic matrix. The FTIR spectra showed changes in the hydroxyl and carbonyl groups of the wood and rHDPE, which were attributed to the effects of abiotic and biotic degradation. This is explained as follows.
Samples of ERs of formulation 3 (Table 3), with a PW/TW wt.% ratio of 50/50, were initially analyzed, specifically ERs 1 to 4 (please see Table 2 for details). The FTIR spectrum of the ER1 specimen served as the reference (Figure 7) since it was not exposed to AW or TA. FTIR spectra of selected specimens of ERs: 1, 2, 3 and 4.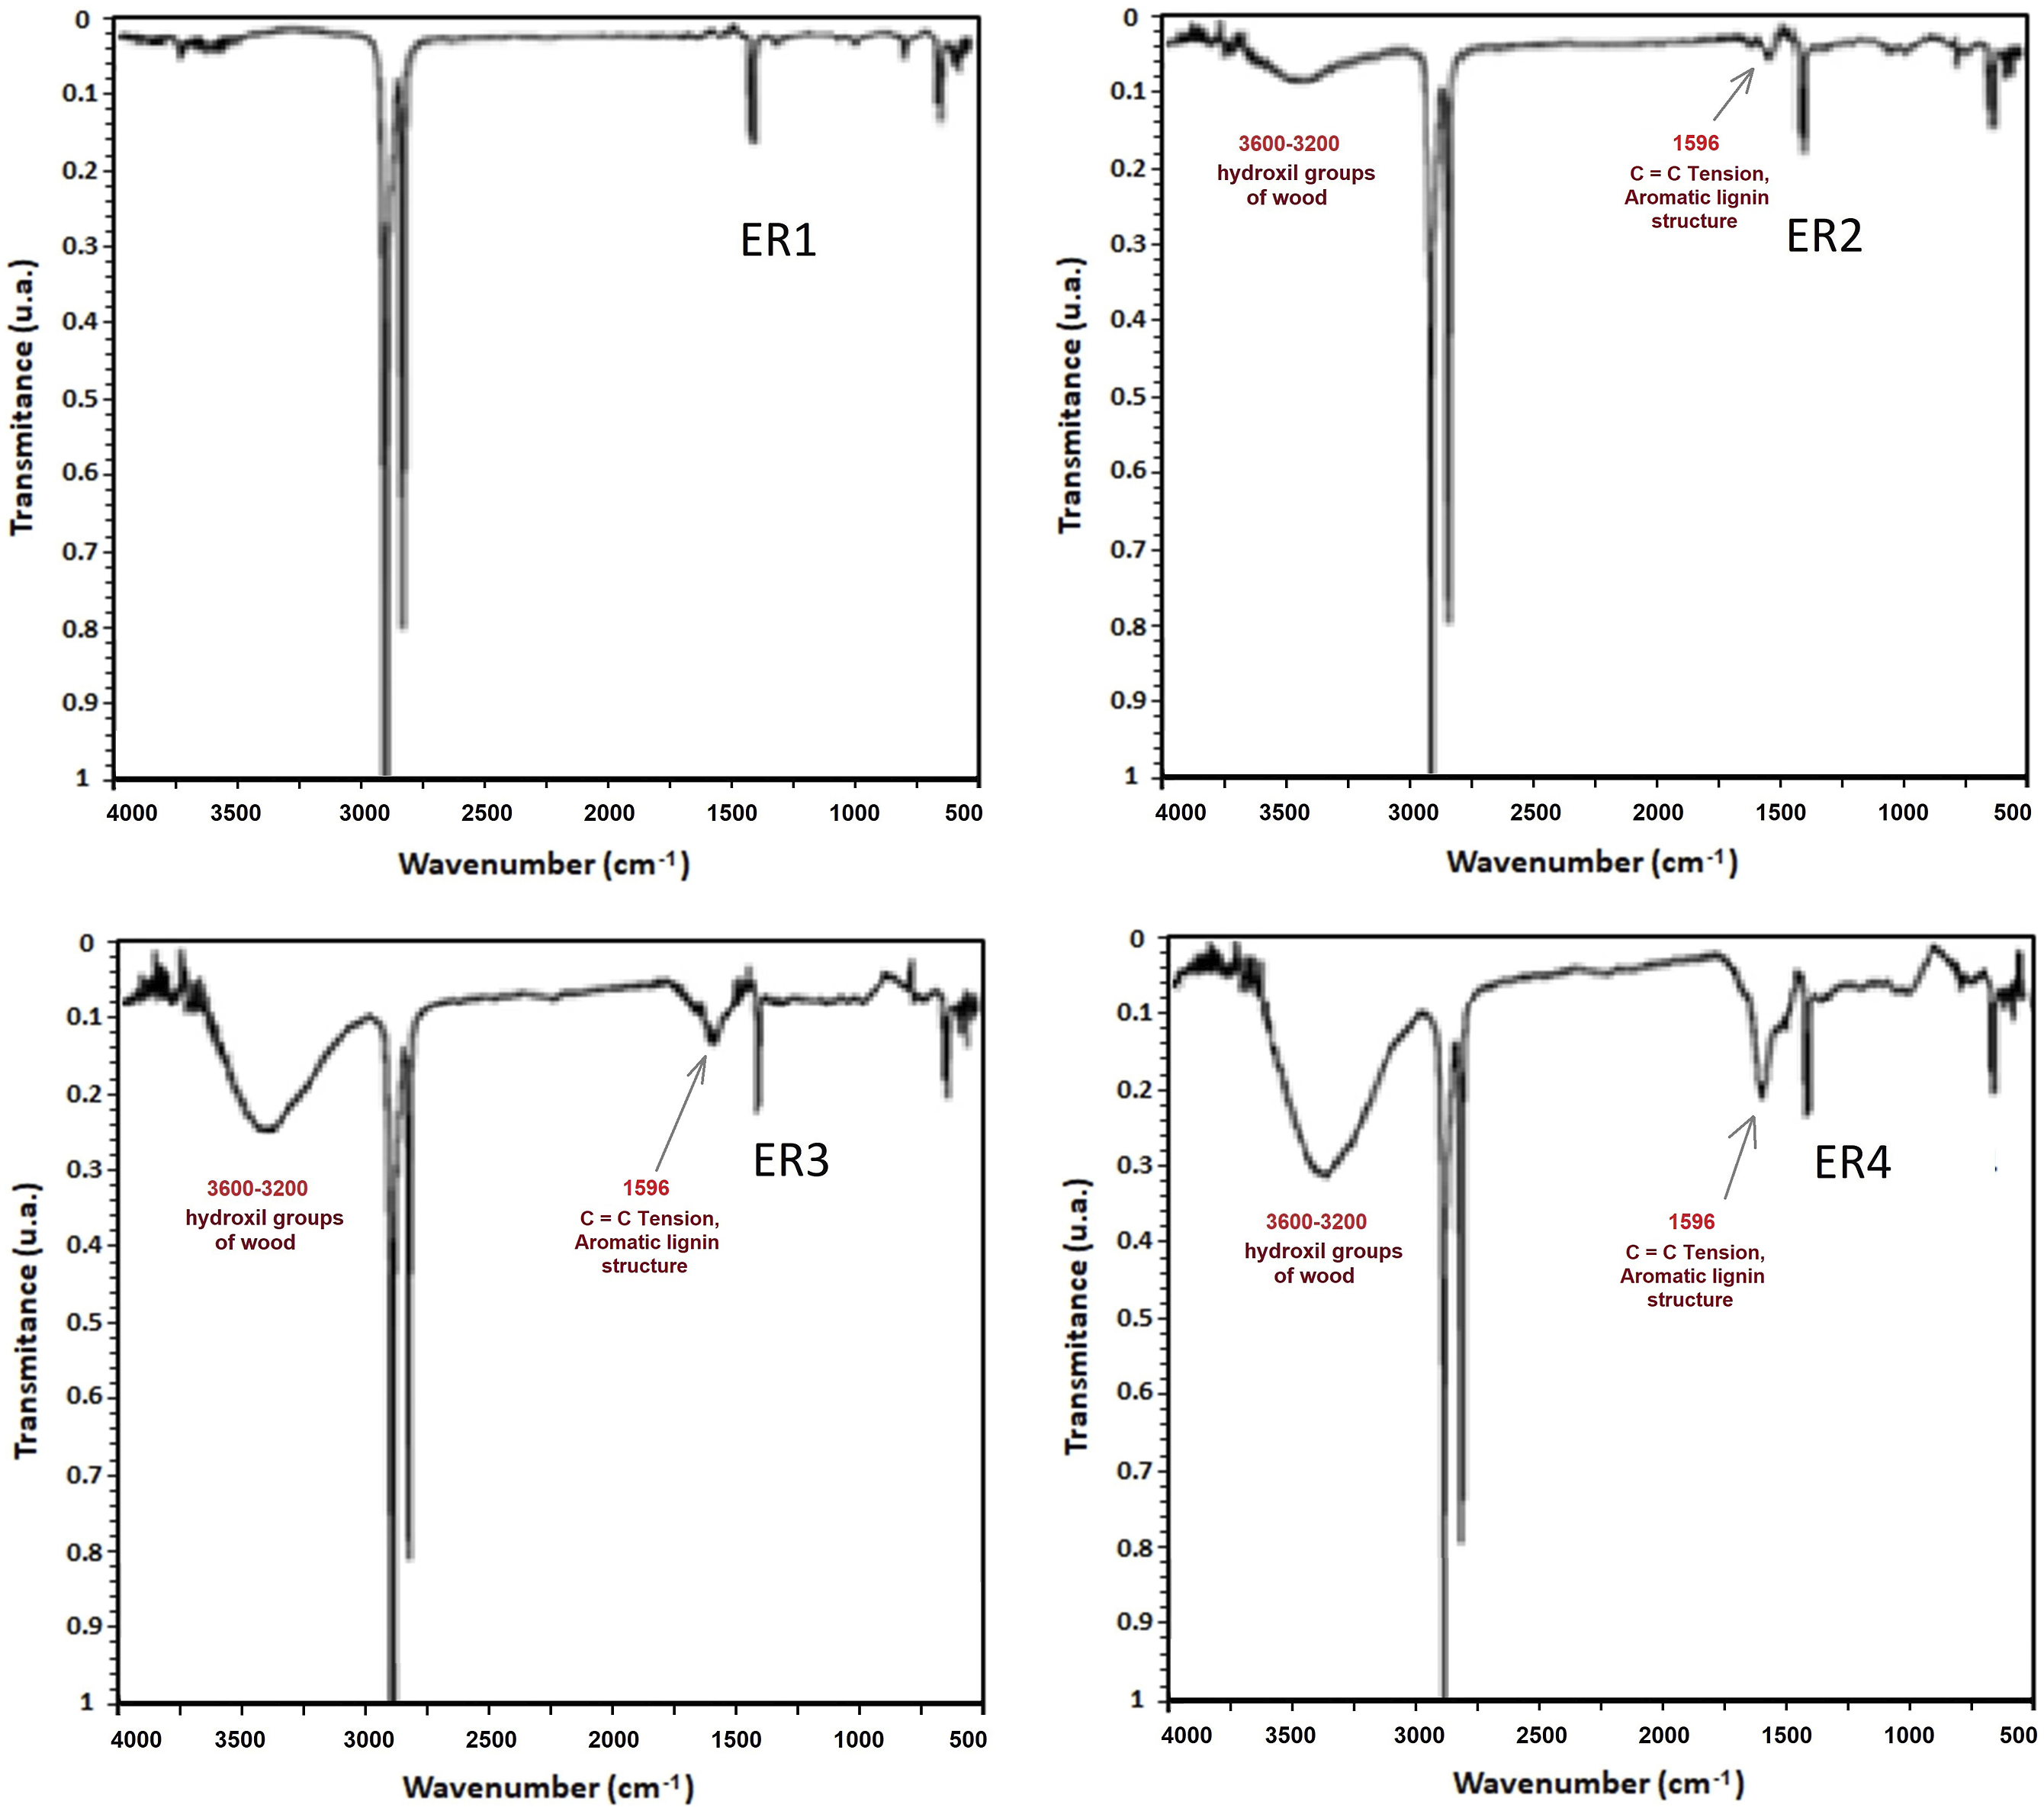
Several prominent bands corresponding to rHDPE can be seen, indicating that the compression molding process caused a greater amount of HDPE to be to the walls of the material than to the center, due to the greater fluidity of the plastic compared to the wood-HDPE mixture. This finding is consistent with what is observed in Figure 6(b), where a dark and smooth surface with isolated light-toned agglomerates of wood particles can be seen. The heterogeneous distribution in compression-molded specimens promotes the encapsulation of wood particles by rHDPE, as reported in a study 47 that used injection-molded WPC (wood and rHDPE) specimens. This results in the surface of the specimens being initially degraded by abiotic factors, causing some wood agglomerates to be exposed, followed by biotic degradation by termites.
The FTIR spectrum of a specimen of ER3 corresponds to a sample of formulation 3 that was subjected to 30 days of AW, but not to TA. In this spectrum, an increase in the band of hydroxyl groups of the wood in the region of 3600-3200 cm−1 is observed. Compared to the specimen of ER1, it indicates that both PW and TW wood particles began to be exposed. Additionally, small bands in the region of 1750-1700 cm−1 are observed due to the generation of carbonyl groups caused by the oxidation of the rHDPE matrix mainly because of the exposure to UV radiation, as reported in a previous study. 48 Photodegradation of rHDPE produces cracks in the form of lines on the specimen’s surface, as seen in the SEM micrograph in Figure 6(d). The appearance of cracks on the WPC specimen surface causes some wood particles to be exposed, which are detected by the FTIR spectrum in the 3600−3200 cm−1 region.
The FTIR spectrum of ER2 corresponds to a sample that was exposed to 30 days of TA only. The spectrum shows a small band in the 3600-3200 cm−1 region corresponding to wood hydroxyl groups and smaller peaks in the 1750−1700 cm−1 region with lower intensity than those shown in the spectra of ER3 and ER1. The presence of hydroxyl groups in the wood could indicate that termites partially consumed the exposed wood, mainly PW, leaving only TW visible, which has been reported to have extracts with insecticidal effects.32,49,50 Additionally, the small peaks corresponding to carbonyl groups of rHDPE in areas with cracks suggest that the termites may have consumed some of the degraded polyethylene, as reported in a study that found plastic in the stomachs of termites after attacking exposed plastics. 8 These findings are consistent with what is observed in the SEM micrograph of the ER2 specimen surface.
The FTIR spectrum of ER4, which was subjected to 30 days of AW and 30 days of TA, was similar to that of ER3, with more intense bands observed in the ranges of 3600−3200 cm−1 and 1750-1700 cm−1, corresponding respectively to the hydroxyl and carbonyl groups of the wood resulting from the oxidation of the rHDPE matrix. This could be attributed to the chemical consequences of the abiotic exposure (i.e., AW) of the samples, which facilitated the attack by termites (TA). It is possible that termites preferentially consumed PW and degraded rHDPE, as evidenced by the intensification of the FTIR bands.
Figure 8 displays selected FTIR spectra of specimens of ERs 8, 9, 12 and 13. The specimen of ER8, containing 100 wt% of PW and subjected to 30 days of AW followed by 30 days of TA (see Tables 2 and 3), shows a spectrum similar to that of ER1 (Figure 7). No bands corresponding to hydroxyl groups of wood or carbonyl groups of rHDPE are visible. This could be due because the ER8 specimen suffered the most damage from both AW and TA, with termites likely consuming most of the exposed PW and degraded the rHDPE. FTIR spectra of selected specimens of ERs: 8, 9, 12 and 13.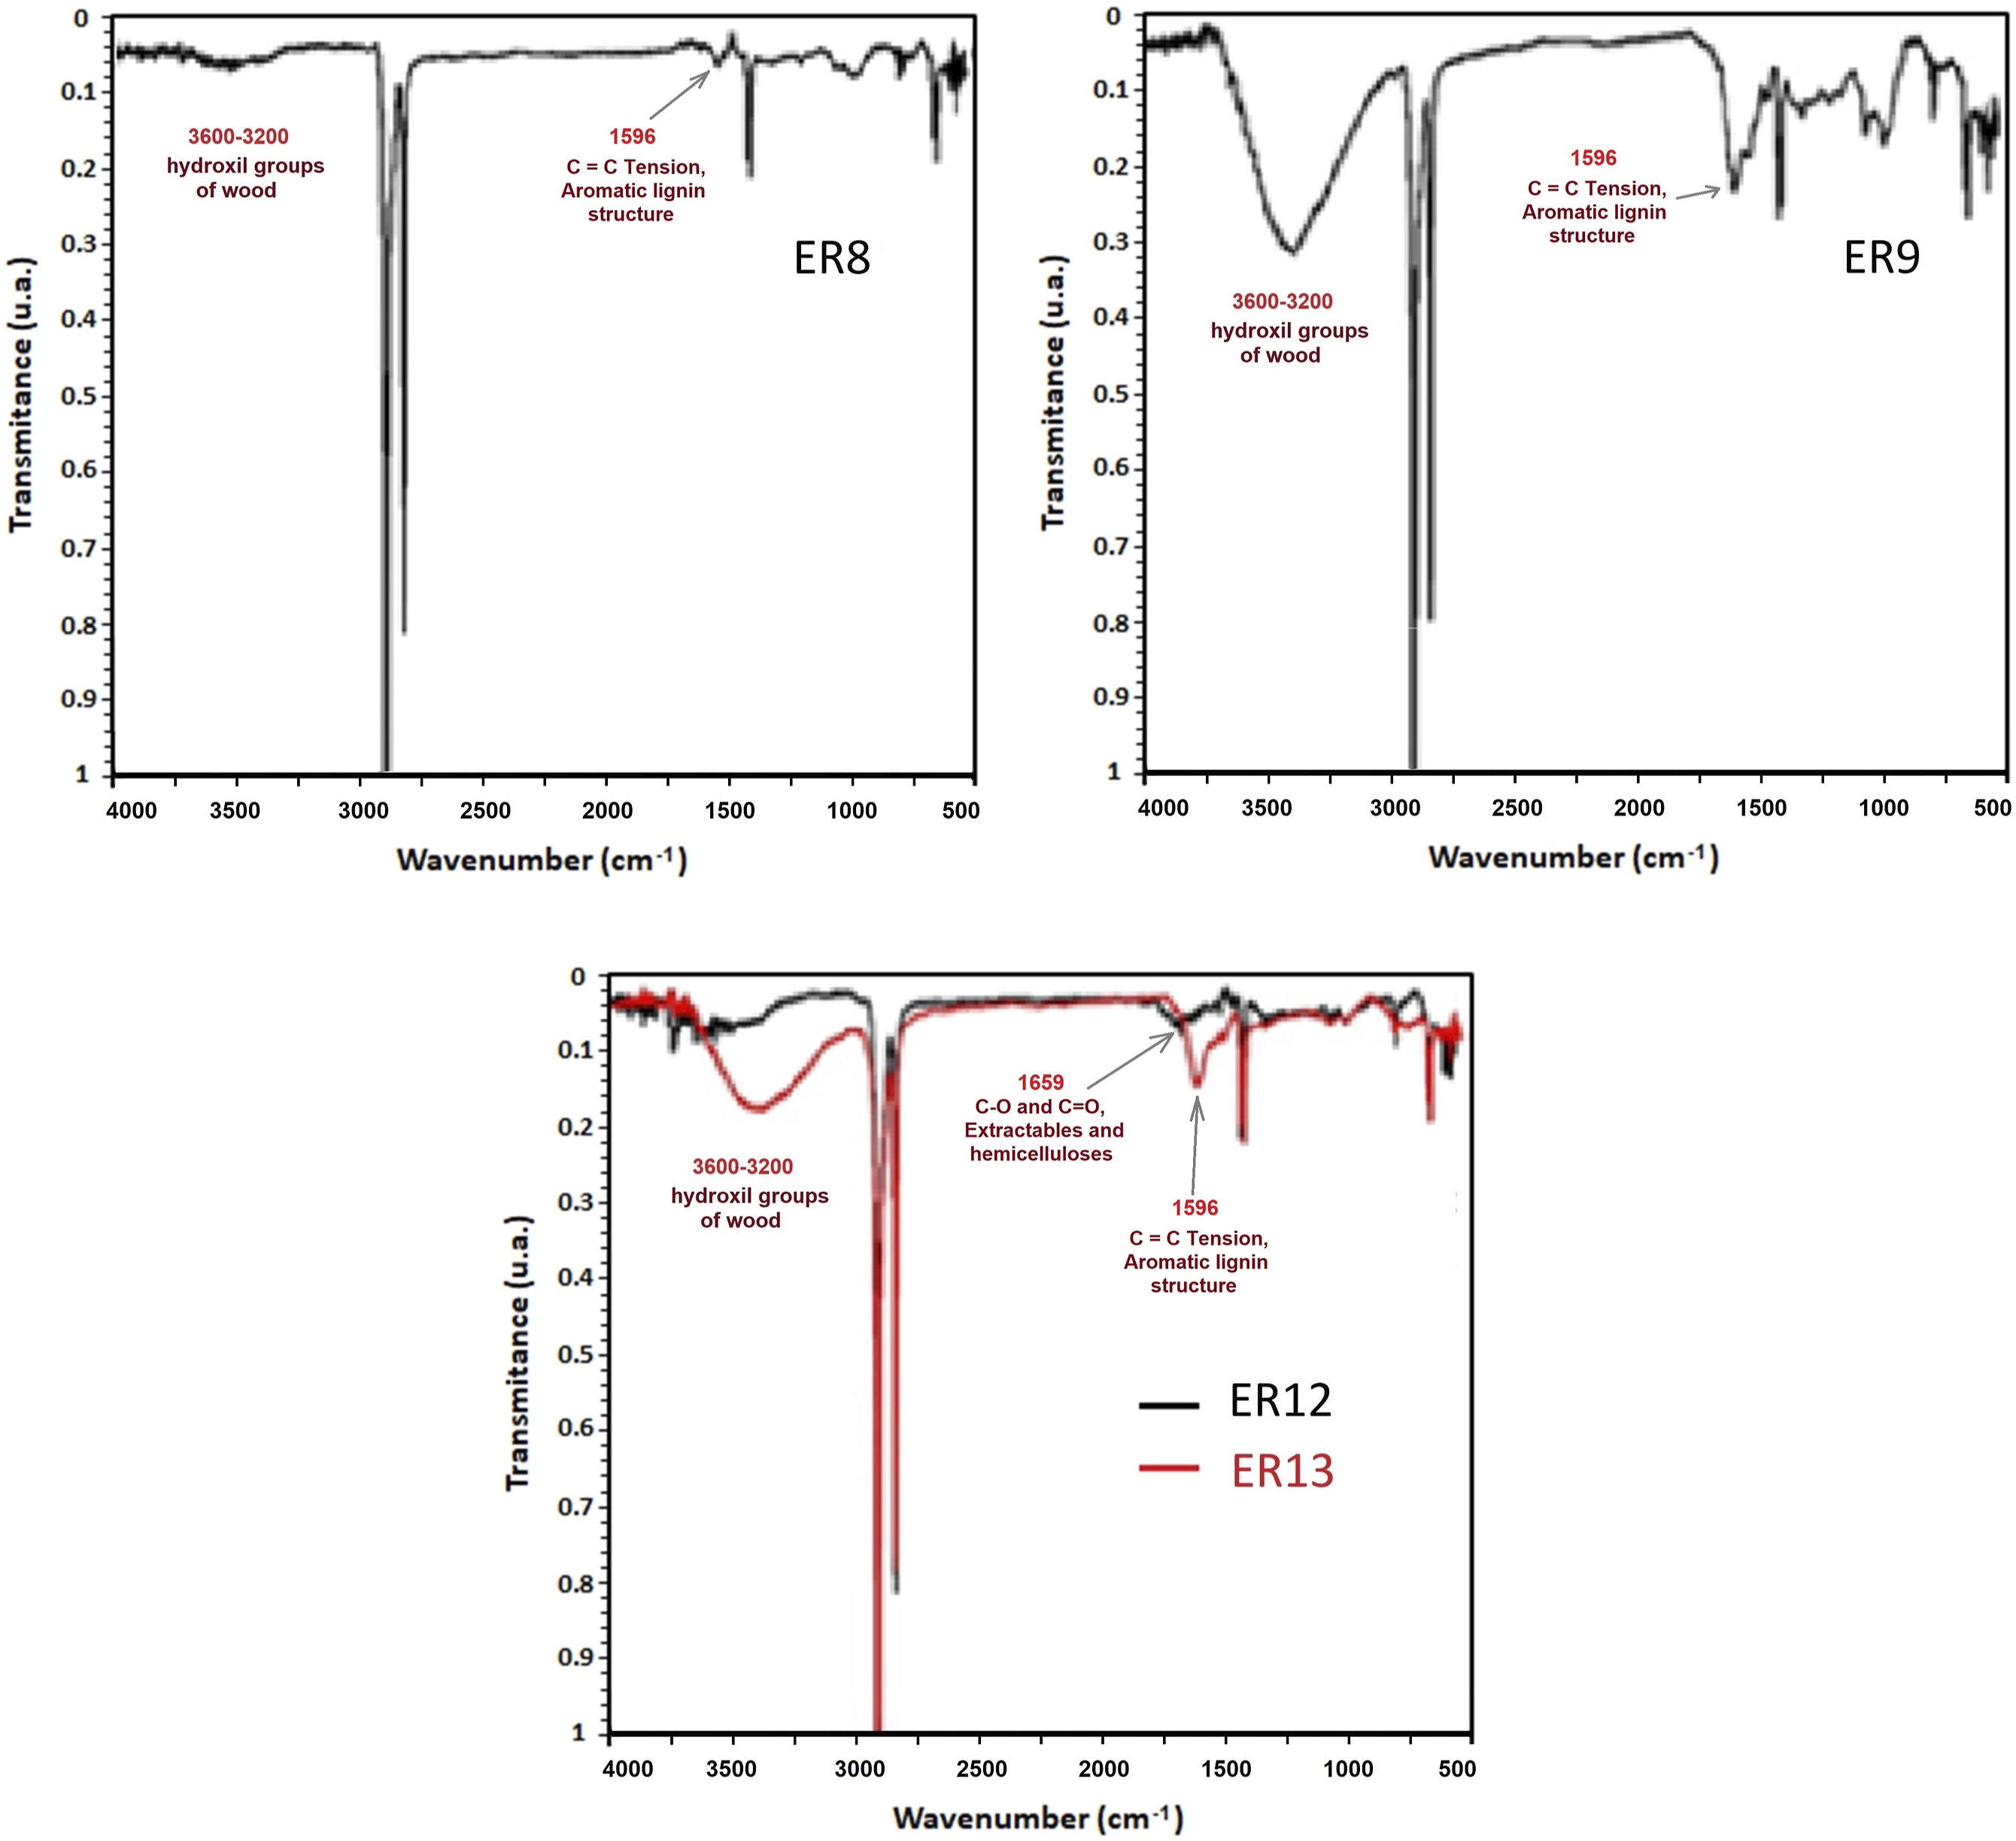
One of the design center point samples (either ERs 9, 10 or 11), which had intermediate levels of the factors studied, showed moderate increases in the bands corresponding to the hydroxyl groups of the wood and the carbonyl groups of the degraded rHDPE. The specimen of ER 9 exhibited this behavior, which may be due to termites feeding on the PW while also degrading the rHDPE.
It seems that specimens of ERs 1 and 12, which contained 50% and 100% TW, respectively, had similar FTIR spectra, and their surfaces remained smooth and intact since they were not subjected to AW and TA. On the other hand, specimen of ER 13, which had a similar composition to that of ER 12 but was exposed to 30 days of AW and 30 days of AT, showed an increase in the bands corresponding to wood hydroxyl groups and bands of rHDPE, corresponding to carbonyl groups (Figure 8), albeit to a lesser extent than other samples that were subjected to both AW and TA.
Conclusions
Termite mortality and weight loss observed in the WPC specimens can be explained by the chemical composition of the wood residues and the exposure time to termites.
The FTIR analysis of the wood residues showed differences in extractables, lignin, holocellulose, hemicellulose, and ash content in the pine and teak wood, which may account for the different behavior of the termites towards the composites. In particular, the higher hemicellulose content and the presence of conjugated quinones in teak wood may contribute to its greater natural durability and lower susceptibility to termite attack.
The SEM analysis of the WPC specimens also revealed the effect of composition and exposure time on the surface morphology, with cracks and surface damage observed in specimens exposed to artificial weathering and termites. Consequently, it is highly probable that WPC products incorporating teak wood flour possess a longer useful lifespan compared to similar products made solely from pine wood flour.
These results suggest that the chemical and physical properties of the wood residues and the exposure time to termites and environmental factors can significantly affect the performance and durability of the WPC composite.
ORCID iDs
Ricardo H Cruz-Estrada https://orcid.org/0000-0001-8139-3747
Javier Guillen-Mallette https://orcid.org/0000-0001-6341-7629
Edgar J Lopez-Naranjo https://orcid.org/0000-0002-2811-8807
Footnotes
Acknowledgements
Gratitude is expressed toward Department of Wood, Cellulose, and Paper of the University of Guadalajara for the assistance provided. Additional thanks are given to Carlos V. Cupul-Manzano and Silvia B. Andrade-Canto.
Declaration of conflicting interests
The author(s) declared no potential conflicts of interest with respect to the research, authorship, and/or publication of this article.
Funding
The authors disclosed receipt of the following financial support for the research, authorship, and/or publication of this article: This work was supported by the Centro de Investigación Científica de Yucatán project “Analysis of the biotic and abiotic degradation of composites with lignocellulosic and thermoplastic residues” (grant number UMT-2016-0009).