
Abstract
The present study is an attempt to optimize the electrospinning parameters to fabricate chitosan/polyethylene oxide hybrid nanofiber composite with minimum diameter and coefficient of variation (homogeneity) by using response surface methodology (RSM). Based on central composite design (CCD), four factors (the chitosan/PEO ratio, the applied voltage, the needle-to-collector distance, and the spinning angle) was applied to evaluate the individual and combined effects of the parameters on the average diameter of nanofibers. Chitosan (CH) was blended with Polyethylene oxide (PEO) at weight ratios of 1:1, 2:1, 3:1, 4:1, and 5:1. As the composition ratio of chitosan was reduced, the viscosity of the chitosan/PEO blend solution also dropped. The RSM model identified the following conditions as necessary to produce the desired and most uniform CS/PEO fiber diameter: a CS/PEO blend ratio of 2:1 (w/w), a voltage of 25 kV, a distance of 20 cm, and a spinning angle of 45°. The average nanofiber diameter and homogeneity under these conditions were calculated to be 73 nm and 20.5%, respectively, compared to the predicted values of 71 nm and 15.58%, respectively.
Introduction
Nanofibers have drawn a lot of interest because of their cutting-edge characteristics, including their high surface area, high porosity, flexibility in surface functions, tiny diameter, and exceptional mechanical performance (e.g., stiffness and tensile strength). 1 Nanofibers are fibers with a diameter ranging from one to one hundred nanometers. 2 The nano size of these materials supplies specific advantages, including a large surface area, a quantum effect, and fewer surface defects/imperfections in the material, all of which improve material qualities. Nanofibers can be created using a variety of methods. Template synthesis, phase separation, and self-assembly are examples of these processes. However, electrospinning is the simplest, easiest, and least expensive method of creating nano- and micro-sized fibers in a short amount of time with minimal expenditure. 3 Electrospinning is an electrohydrodynamic process in which electrically charged droplets form a jet that is then stretched and dried to form fibers. 4 Understanding the electrospinning working parameters is critical because they influence fiber morphologies. Solution properties (viscosity, surface tension, conductivity) and process parameters (applied electric field, needle-to-collector distance, flow rate) are the prime factors impacting the transformation of a polymer solution into ultrafine fibers.5,6 Biomaterials such as chitosan, gelatin, and other natural and synthetic polymers, as well as calcium phosphate ceramics, have been electrospun to produce nanofibers. 7 Polystyrene loaded with varied exfoliated graphite nanosheets composite nanofiber concentrations has been effectively produced using the electrospinning method. 8 Nylon 6,6/epoxy (NY/EP) hybrid nanofibril composites reinforced with treated basalt fiber (TBF) were created using the electrospinning technique. 9
Chitosan is made by deacetylating chitin, which is the world’s second most abundant polysaccharide after cellulose and is chemically and biologically comparable to cellulose.10,11 Chitin has a strong intra and intermolecular hydrogen bonding network, which contributes to its insoluble nature in organic and inorganic solvents.
12
Chitin is abundant in a wide range of creatures, especially in the exoskeletons of insects, lobsters, shrimp, and crabs. Chitosan is made by removing the acetyl group (CH3-CO) of chitin (poly-(β-1
Electrospun chitosan nanofibers are therefore promising candidates for a variety of applications in tissue engineering, as wound dressings, and as drug delivery systems for mucosal and cutaneous applications.17,18 Due to the fact that significant intermolecular entanglement is required for the creation of nanofibers by electrospinning, chitosan has limited spinability as a result of its polycationic structure and restricted chain flexibility. 19 Because of the limited applications and qualities of pure chitosan, which are mostly due to its poor mechanical capabilities, several researchers have attempted to create chitosan-polymer blends. 20 An alternative strategy to improve the spinability of chitosan is to blend in a co-spinning polymer such as polyethylene oxide (PEO),21,22 polyvinyl alcohol (PVA),23–25 polylactic acid (PLA), 26 and collagen, 27 which have excellent spinability and therefore can facilitate the electrospinning of chitosan.
PEO (poly (ethylene oxide)) is a biocompatible, porous polymer that is a good choice for enzymes as chemical catalysts and scaffolding in tissue engineering. 28 This non-ionic polymer is water soluble. 29 PEO is a biocompatible and non-toxic inert polymer that interacts with chitosan to increase the spinability of the polymeric solution by reducing chain entanglement and charge carrying capacity of electrospinning blends. When PEO and chitosan are combined, they generate a noncovalent, homogenous polymeric blend that reduces the viscosity of highly concentrated chitosan solutions. Therefore, combining chitosan and PEO could result in an electrospun matrix that is appropriate for a variety of biomedical applications. 30
It is important to systematically investigate the effect of electrospinning parameters such as the chitosan/PEO ratio, the applied voltage, the spinning angle and needle-to-collector distance on the qualitative and quantitative characteristics of the output nanofibers. Response surface methodology (RSM) is one of the most effective methods for determining the optimum conditions in a multivariable system. 31 RSM is a collection of mathematical and statistical methods for defining the relationships between the response and the independent variables. This experimental methodology provides a mathematical model in addition to examining the effects of the independent variables. 32 Before using the RSM methodology, you must first choose an experimental design that specifies which tests should be performed in the experimental region under consideration. 33 The design of an experiment is a versatile method that may be applied to a variety of cases to identify essential input parameters (input variables) and how they are correlated to the outputs (response variable). With the use of appropriate statistical software, DOE may be swiftly created and analyzed. There are some commercial and freeware statistical packages available for this purpose. Minitab, Statistica, SPSS, SAS, Design-Expert, Statgraphics, Prisma, and other well-known commercial packages are examples. 34 Continuous thermoplastics reinforced with carbon fiber can be produced using the 3D printing technology called fused deposition modelling. The response surface approach has been used to examine and optimize a range of parameters, such as the number of reinforced layers, material impact, and interlayer spacing. 35 Mathematical modelling and process optimization for thermoplastic composite pultrusion. 36
Regarding the uses of these electrospun chitosan materials, it must be noted that they are critical for cell cultures, tissue engineering, as well as for ion adsorption or water purification. It is also important to note that chitin derivatives are created in addition to chitosan and chitin electrospun materials. This study investigated the effect of processing variables (Chitosan/PEO ratio, applied voltage, spinning angle, and needle to collector distance) on the average diameters and homogeneity of CS/PEO nanofibers. The electrospinning process was modelled and optimized using RSM with a central composite design to minimize the diameter of the nanofibers.
Experimental procedure
Materials
Medium molecular weight chitosan (CS, 75–85% deacetylated), polyethylene oxide (PEO) (average Mv ∼ 900,000, powder) and acetic acid (glacial, ≥99%) were obtained from Sigma-Aldrich.
Preparation of CS/PEO solutions and viscosity measurements
Chitosan powder was dissolved under magnetic stirring at room temperature in an aqueous acetic acid solution (50% v/v) to obtain a 2 wt.% polymer concentration. In another 50% v/v aqueous acetic acid solution, polyethylene oxide (PEO) powder was dissolved to produce a 3.5 wt.% polymer solution. Both were stirred separately at room temperature for 72 and 24 h, respectively, to produce homogenous solutions. Then, the chitosan and polyethylene oxide solutions were blended in different proportions and stirred gently for 24 h. The weight ratios of chitosan to polyethylene oxide (CS/PEO) were selected as 1:1, 2:1, 3:1, 4:1, and 5:1, respectively. The viscosities of the different solutions were measured with a Brookfield viscometer (Model DV-III Ultra, UK) at 22°c as a function of time for polymeric solutions (National Research Center, Egypt). The polymeric solutions were put in the built-in stainless-steel container attached to a temperature controller. The measurements were done using S21 spindle at 50 r/min under uniform temperature.
Electrospinning setup
The electrospinning setup has been presented in Figure 1. The CS/PEO solutions were poured into a 10 mL glass syringe with a metal needle of 0.9 mm diameter. A high-voltage electric field for the electrospinning process was generated by a changeable high-voltage power supply (30 KV maximum voltages). The electrospun fibers were collected on a 15 × 15 cm metal collector (aluminum foil) that also served as a grounded counter electrode. Procedure of preparation CH/PEO solutions and electrospinning set up.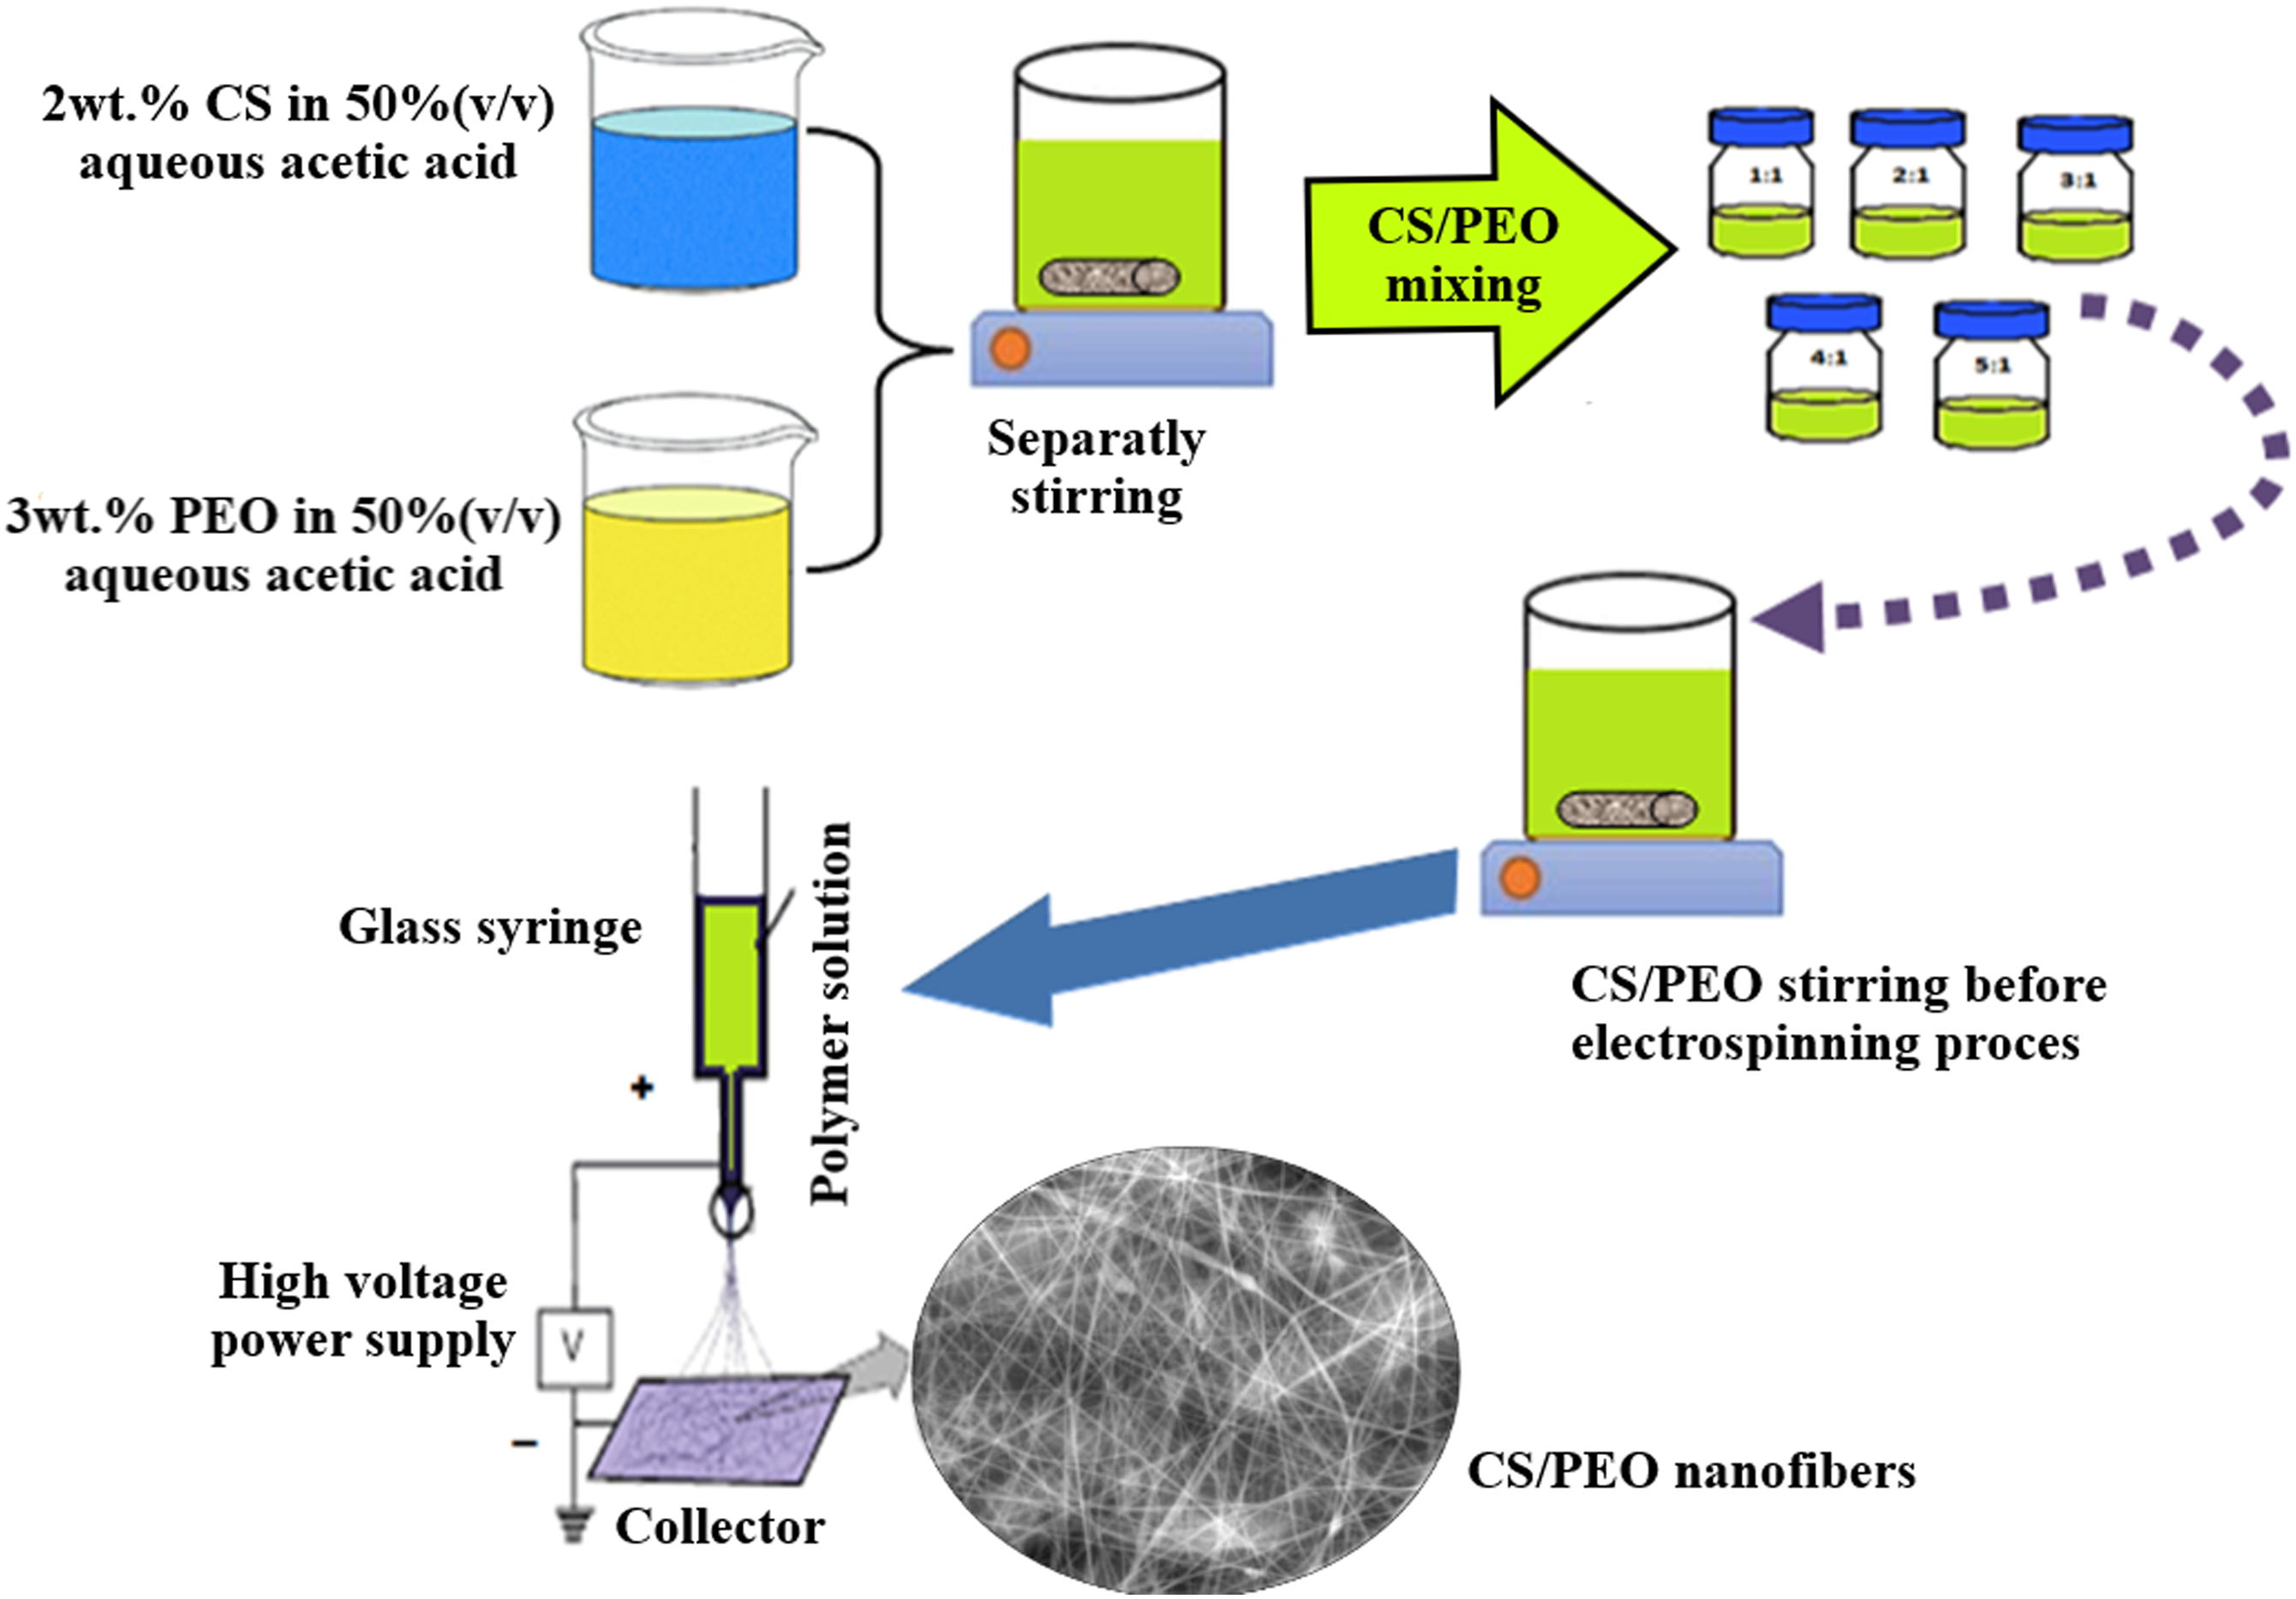
RSM-based experimental design
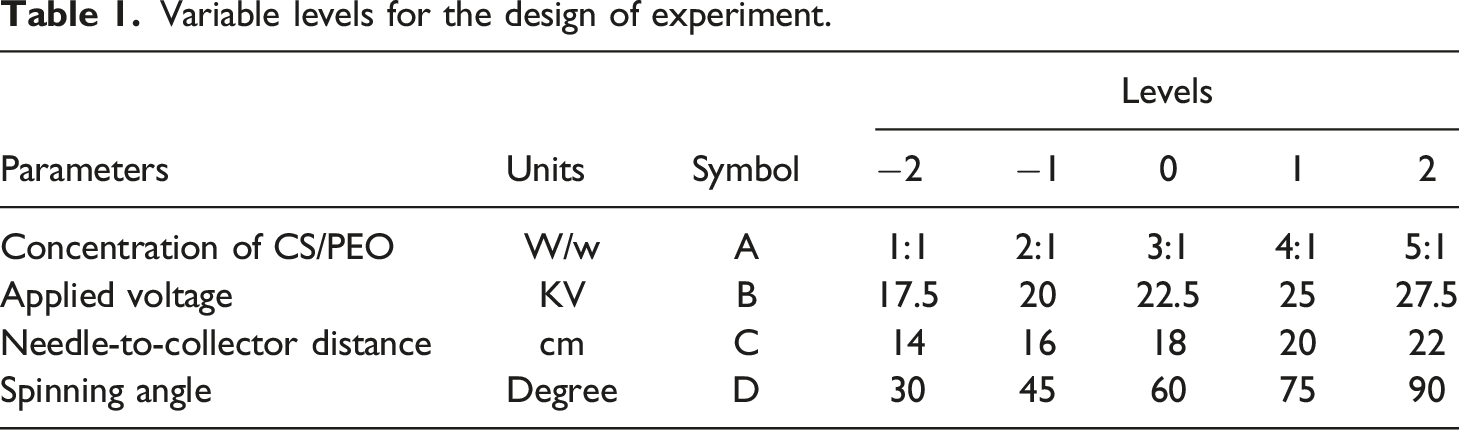
Variable levels for the design of experiment.
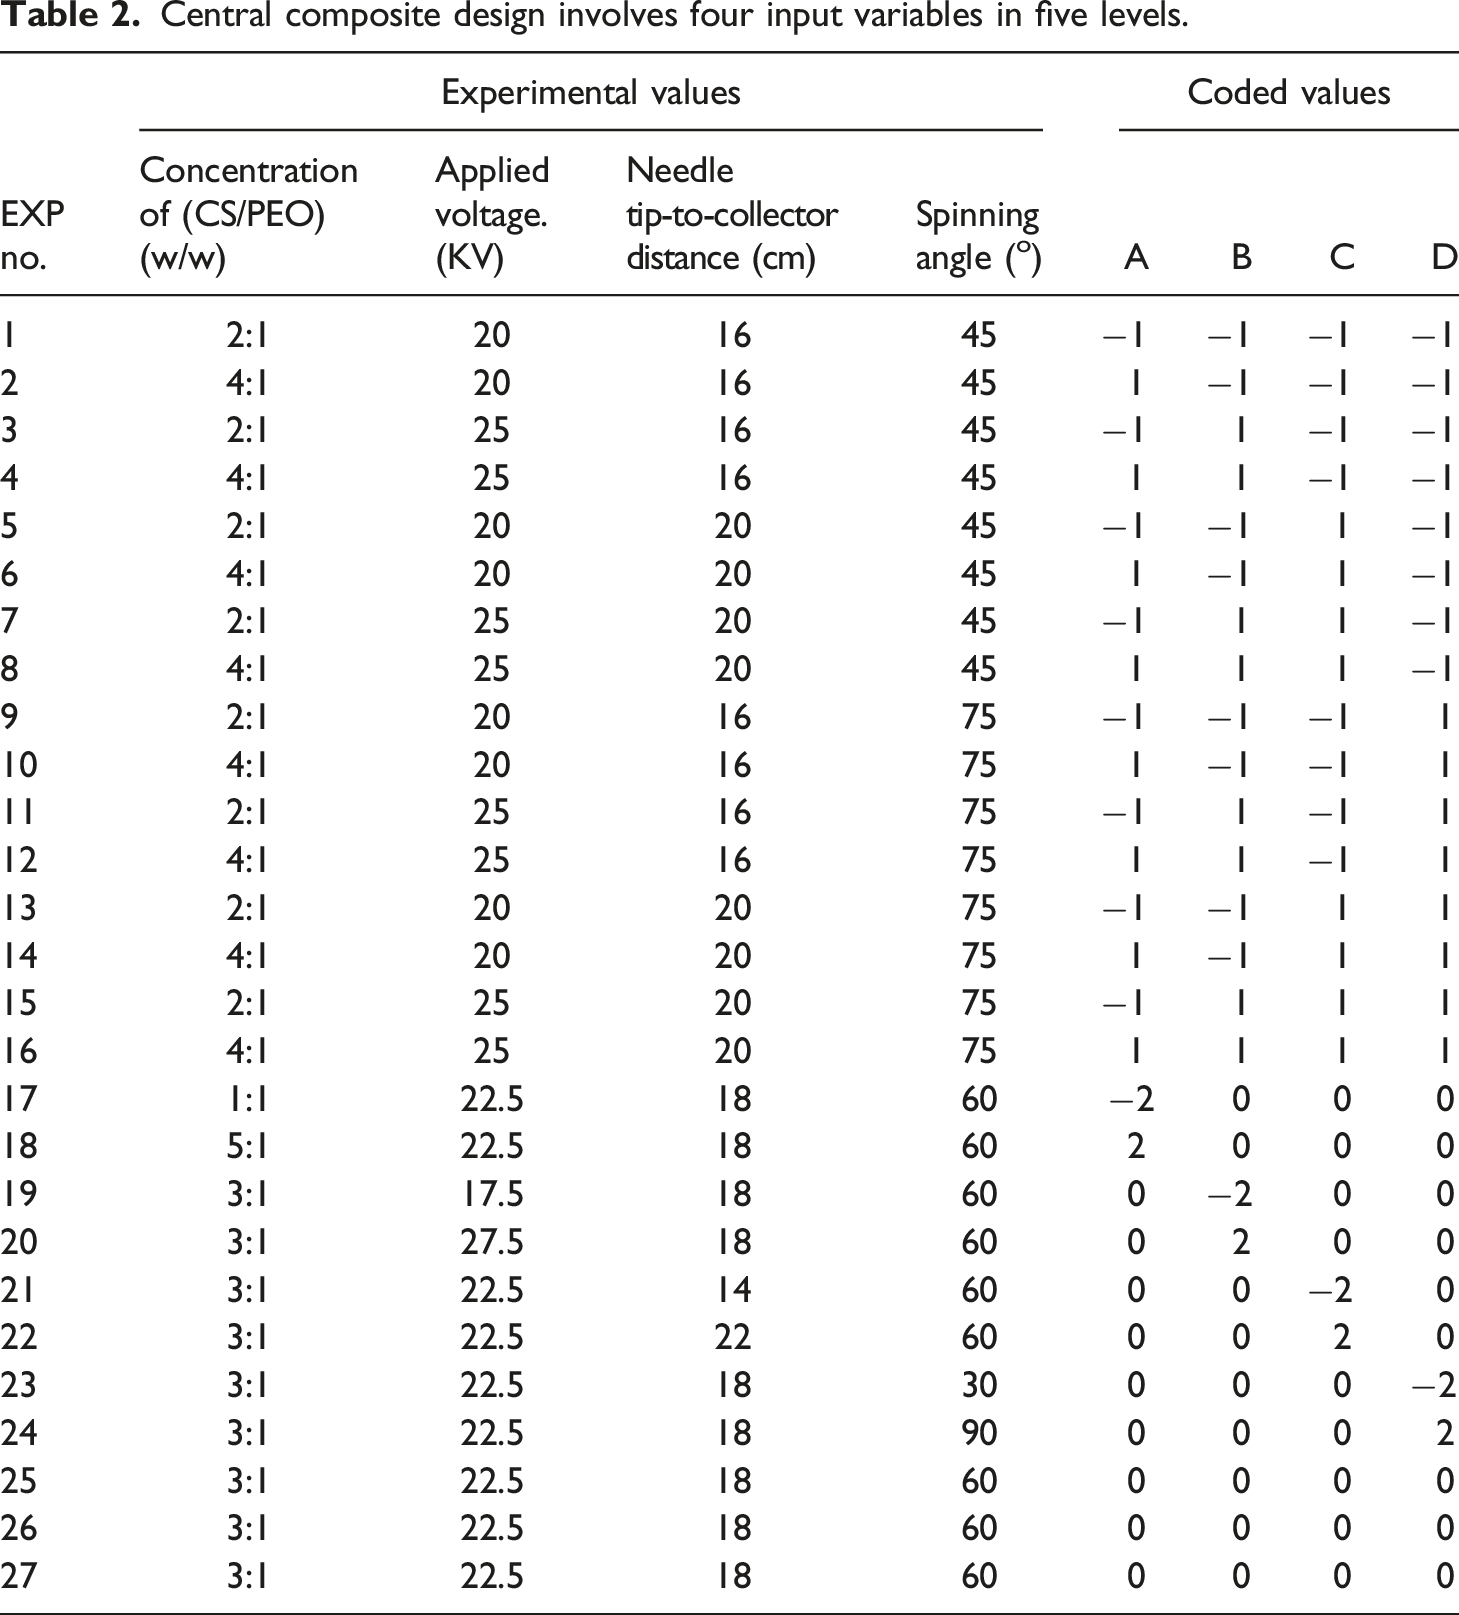
Central composite design involves four input variables in five levels.
The response surface model that was developed between the electrospinning process variables x and each response y (nanofiber diameter nm and CV%) can be represented by the second-order polynomial equation (1)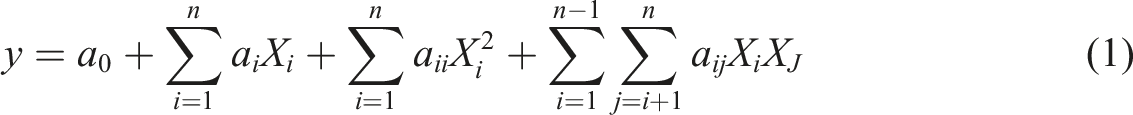
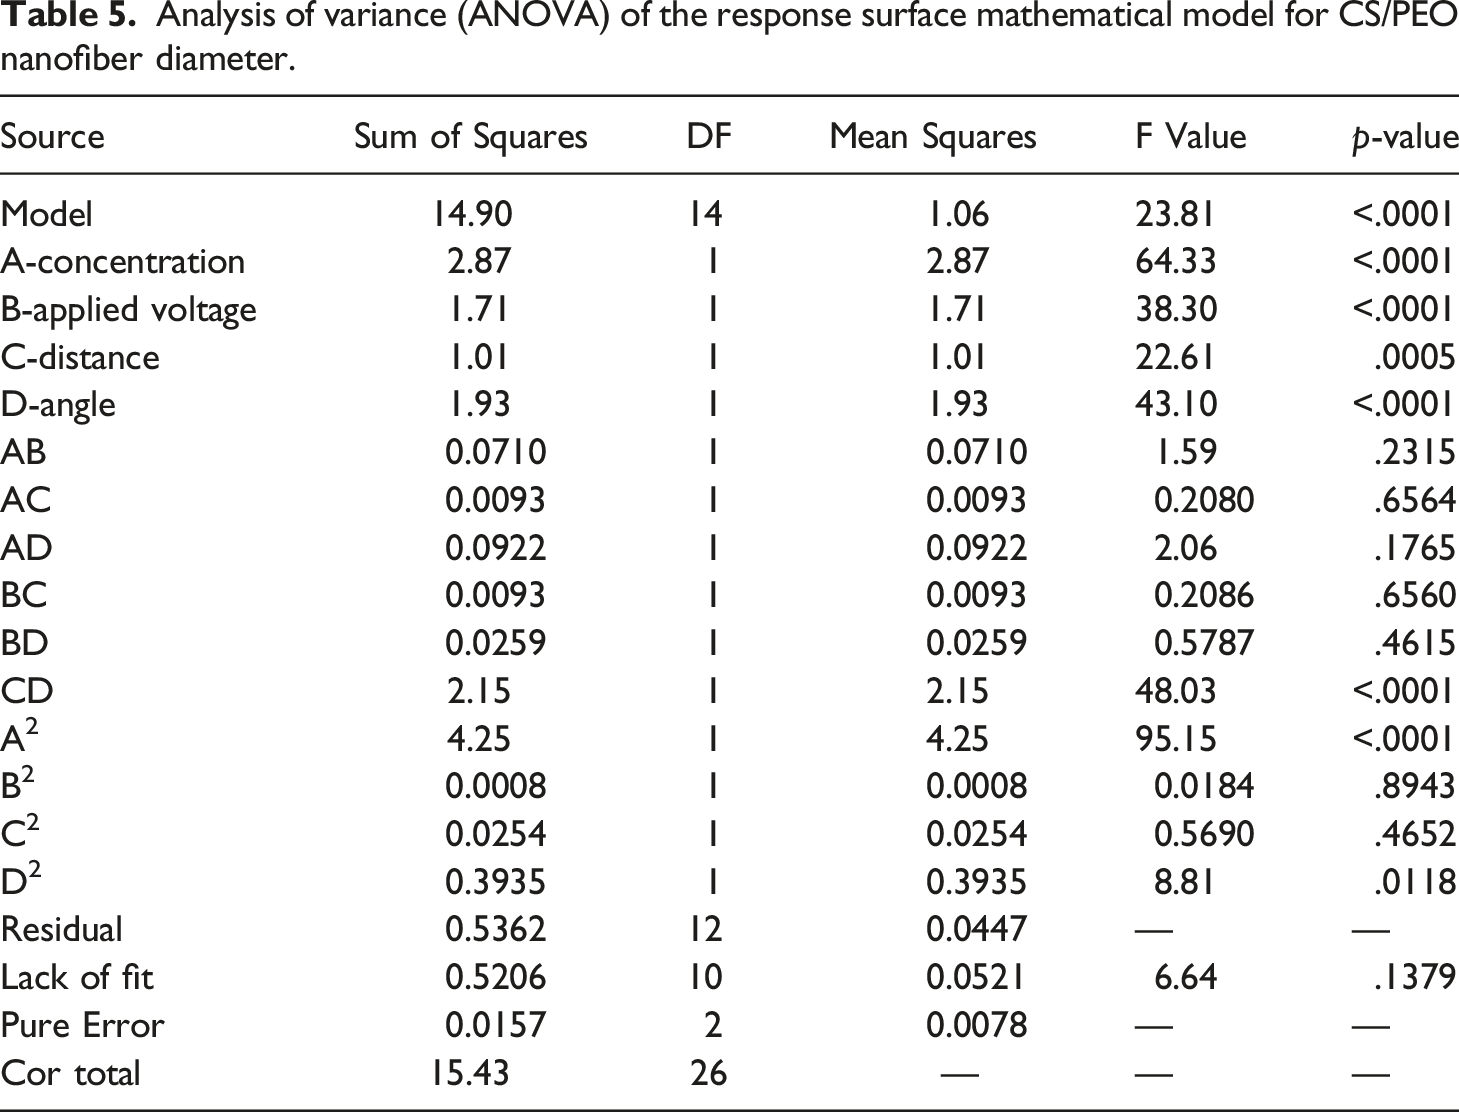
The presented mathematical model was examined using the analysis of variance (ANOVA). When F and p-values were examined, the significance of each term in the proposed model could be constrained. p-values <.05 show that the variable significantly affects the diameter of the nanofiber.37,38 Additionally, to confirm the validity and suitability of the adequate model R2coefficient of determination and adjusted-R2 were investigated. R2 represents the percentage of total variability that the regression model has shown. Therefore, a value higher R2 denotes a more reliable model. Larger values of (R2) and adjusted-R2 show better agreement between the model and the actual results.39,40
Characterization of CH/PEO nanofiber composite
Scanning electron microscope (SEM, FEI Quanta 250, Hillsboro, Oregon, USA) at the Egypt Desalination Research Center of Excellence (EDRC), Desert Research Center (DRC), Egypt, was utilized to evaluate the diameters and morphology of the electrospun fibers. The average diameter and distribution of the electrospun fibers were measured precisely by correlating the number of the points (about 100 random nanofibers). Each image was magnified appropriately with Image J software to determine the distance from the SEM.
Results and discussion
Rheological behavior
Measurements of electrospinning solution viscosities.
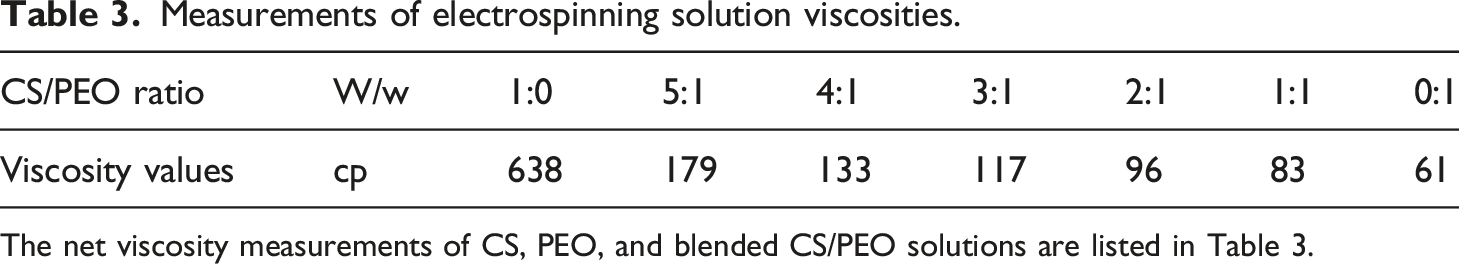
The net viscosity measurements of CS, PEO, and blended CS/PEO solutions are listed in Table 3.
The intermolecular interactions between polymer chains affect how viscous a polymer solution is.
42
As the composition ratio of chitosan in chitosan/PEO solutions was reduced, the blend solution’s viscosity also fell, as presented in Figure 2. The viscosity of the polymer solution decreased due to less stretching of the solution in a strong electric field, which led to an increase in the diameter of the nanofibers. High-viscosity solutions of pure chitosan (0.64 Pa.s) are produced as a result of strong hydrogen bonding between the NH2 and OH groups of the CS chains, making them unsuitable for electrospinning. The proper amount of PEO was needed in the chitosan solution because it functioned as a plasticizer to avoid chitosan chain tangling during jet formation and made the solution more spinable, which was necessary to create nanofiber with a bead-less shape.
30
An optimum viscosity value was obtained at a 2:1 blend ratio of CS/PEO solution, which is 0.1 Pa.s (96 cp). Viscosities of CS, PEO, and blended CS/PEO solutions.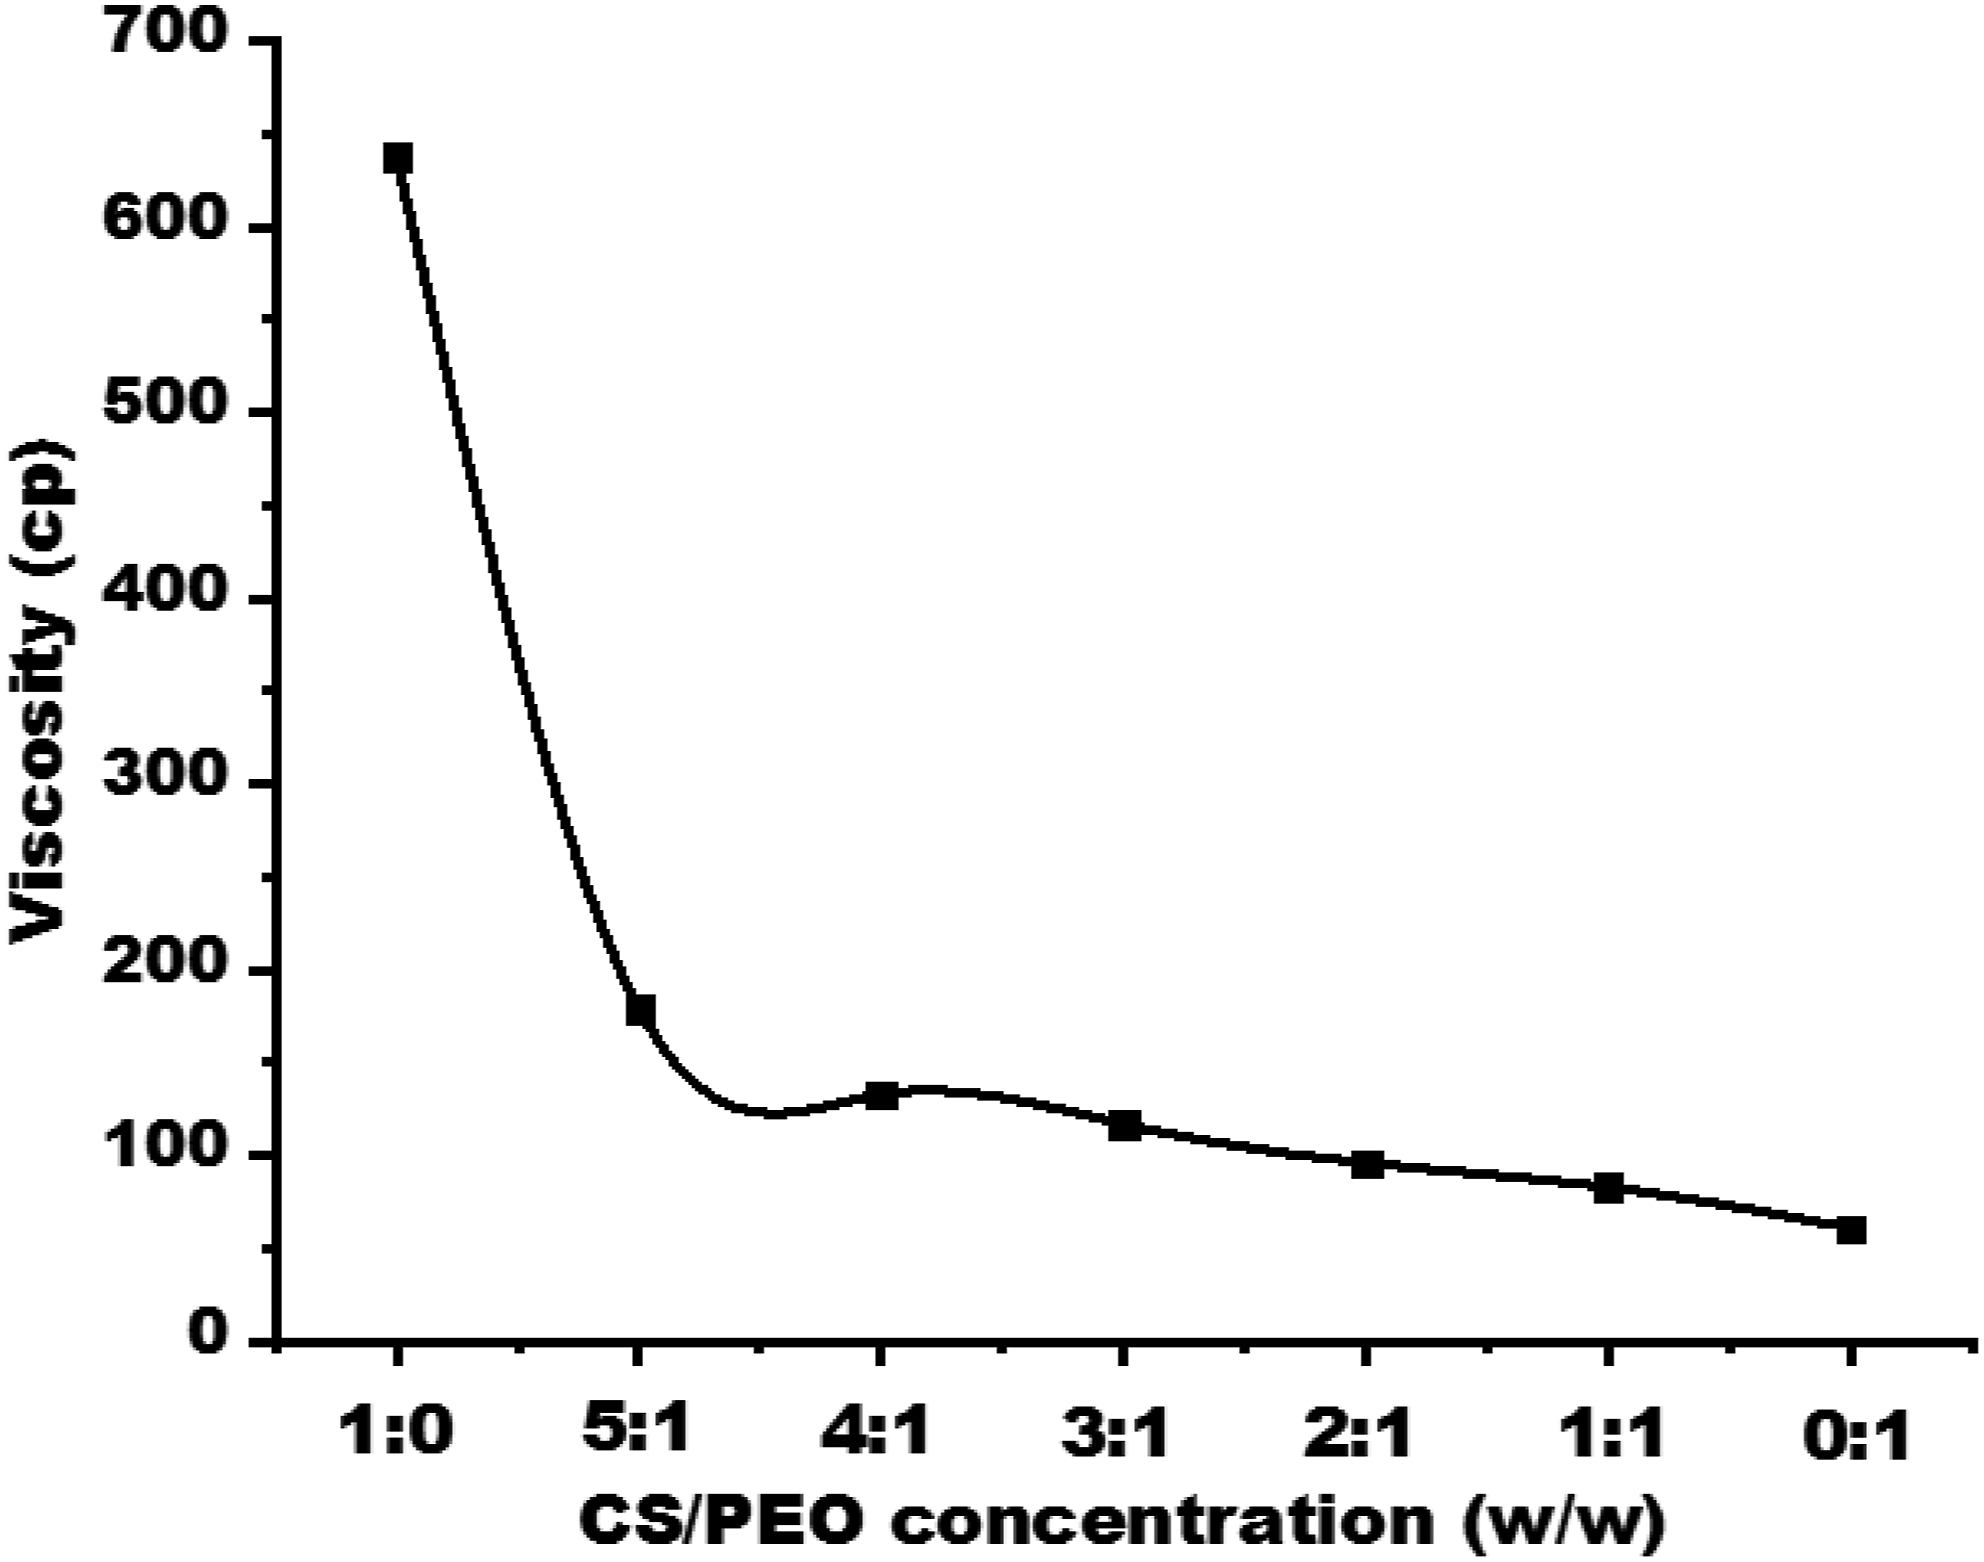
Morphology of CS/PEO Nanofibers
Beads or droplets were deposited rather than fibers when pure chitosan was used. When PEO was added to chitosan, a well-defined Taylor cone formed, a jet was created, and a deposition that appeared to be the creation of nanofibers was observed on the surface of the collecting plate.
43
The morphology of electrospun CS/PEO nanofibers are shown in Figure 3 and were obtained using the input variables, listed in Table 2. As seen in Figure 3(a), more beads are observed among the fibers as a result of the low viscosity of the solution at a concentration of CS/PEO 1:1. The samples obtained from 2:1 CS/PEO blend solutions have the best structure in terms of fiber homogeneity, as shown in Figures 3(b) and (c). Beads and a small amount of beaded-fibers were formed with quite a few continuous ultrafine fibers when the CS/PEO weight ratio was increased to 3:1 and 4:1 (Figures 3(d)–(i)). This result led to the hypothesis that the connecting fibers are made of PEO and the beads are made of chitosan.
44
The electrospinning process and fiber deposition on the collector plate surface were exceedingly challenging, with very little fiber production when the CS/PEO weight ratio was 5:1. This is caused by the increased viscosity of this ratio compared to other ratios, as observed in Figure 3(i). The SEM images of the blended solutions of CS/PEO at different ratios. (a) 1:1, exp 17; (b) 2:1, exp 9; (c) 2:1, exp 11; (d) 3:1, exp 19; (e) 3:1, exp 20; (f) 3:1, exp 25; (g) 4:1, exp 14; (h) 4:1, exp 16; and (i) 5:1, exp 18.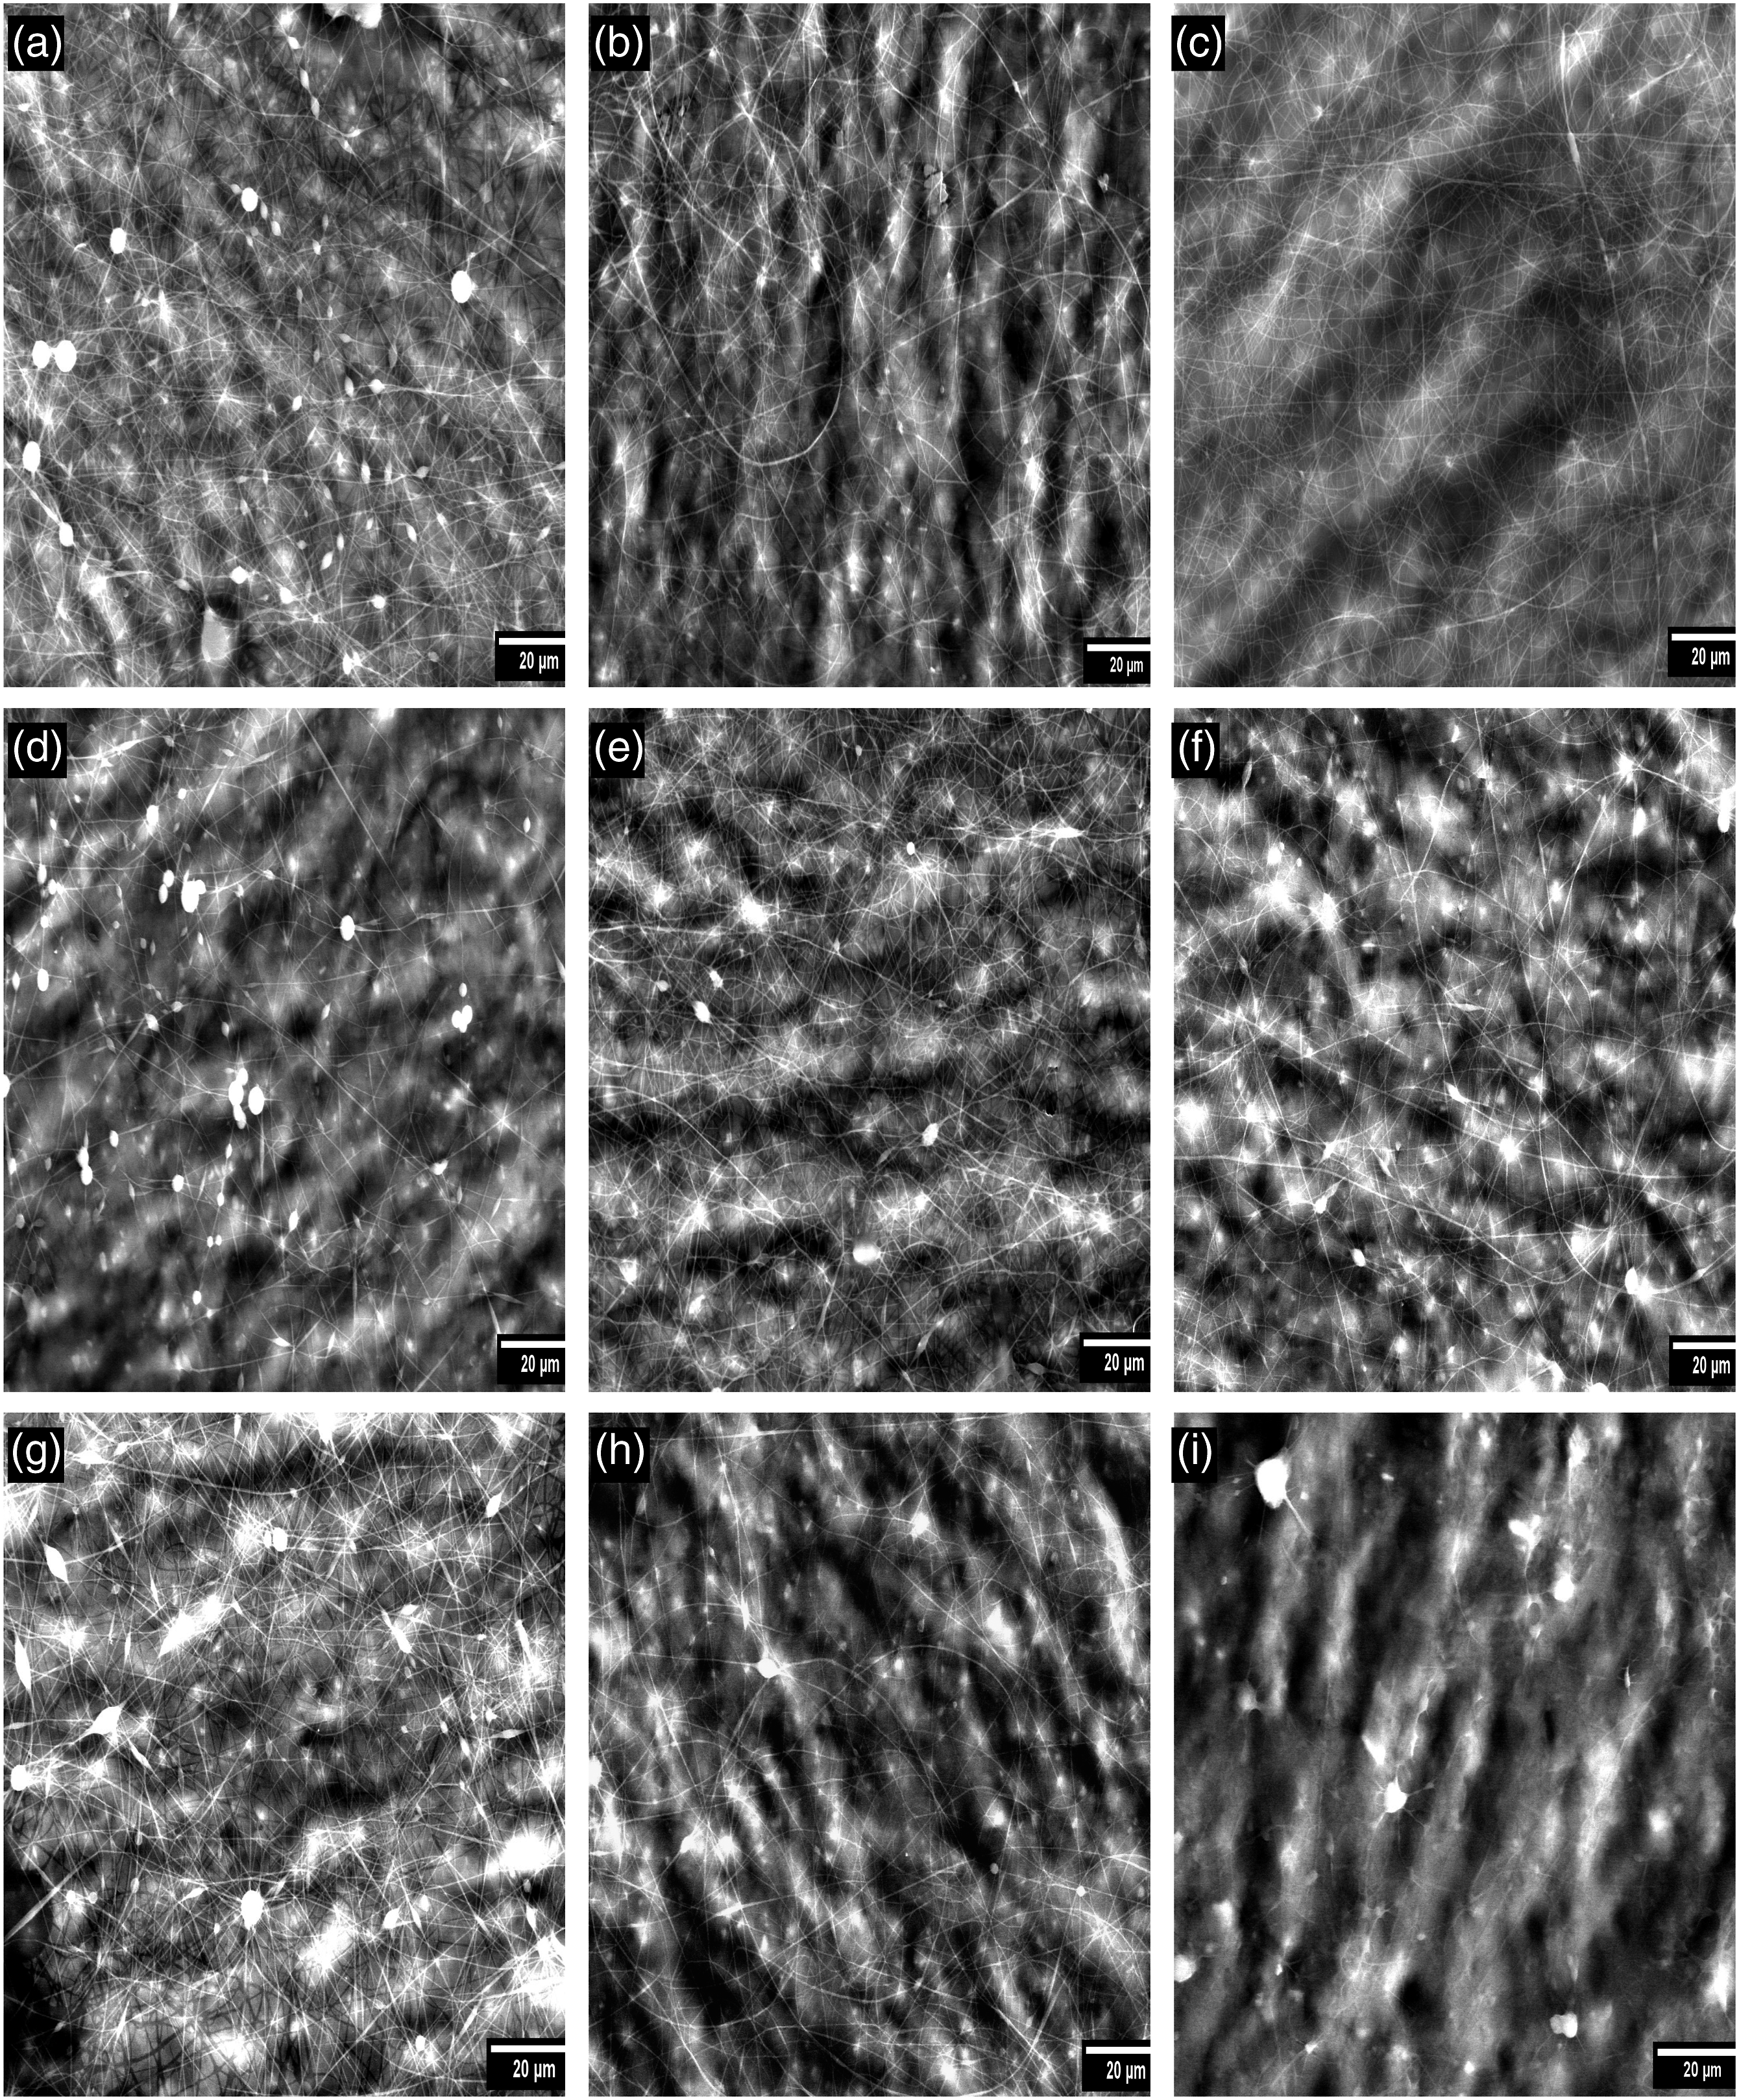
Analysis and statistical fitting of process models
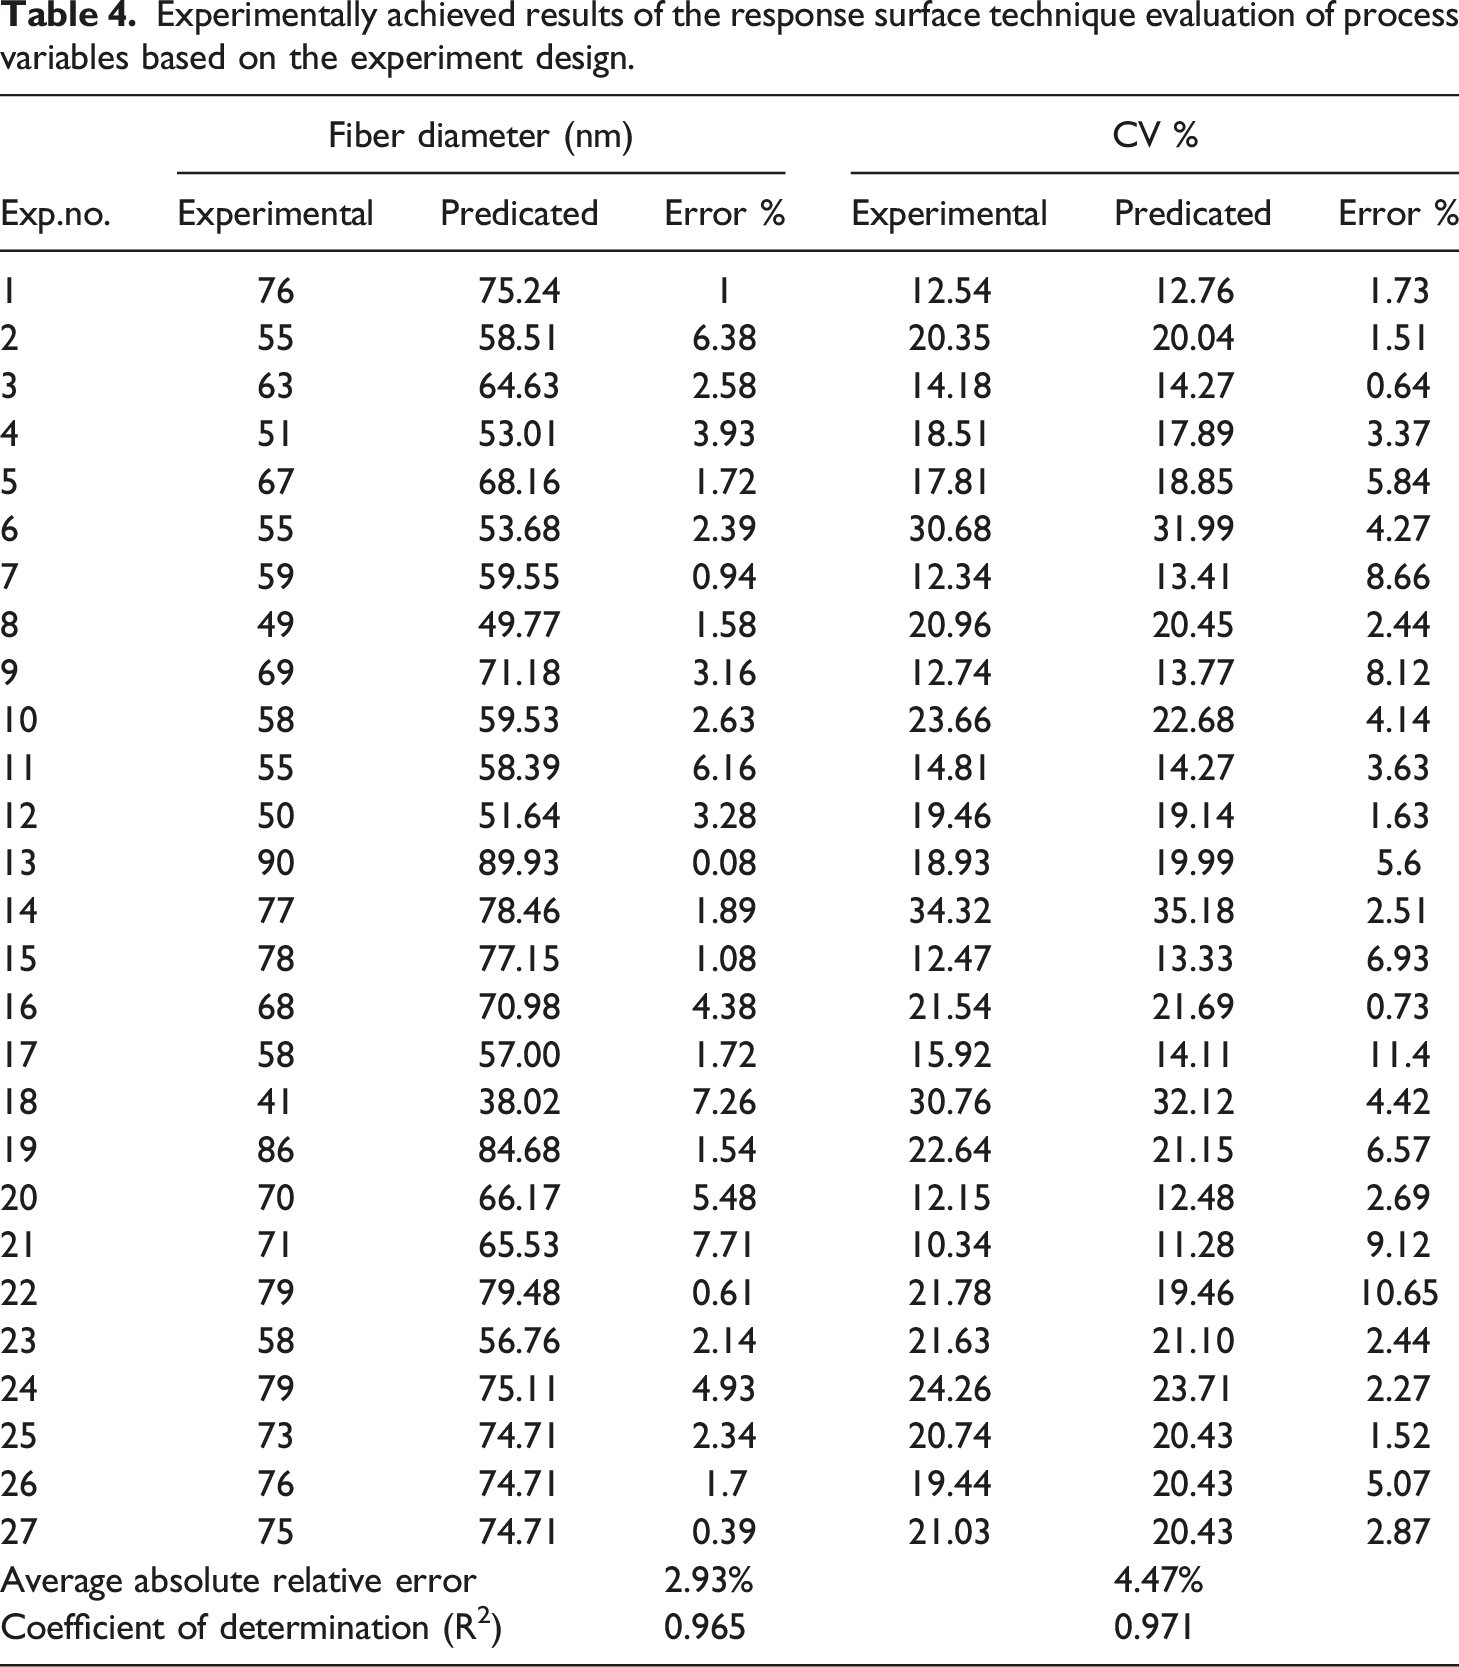
Experimentally achieved results of the response surface technique evaluation of process variables based on the experiment design.
Analysis of variance (ANOVA) of the response surface mathematical model for CS/PEO nanofiber diameter.
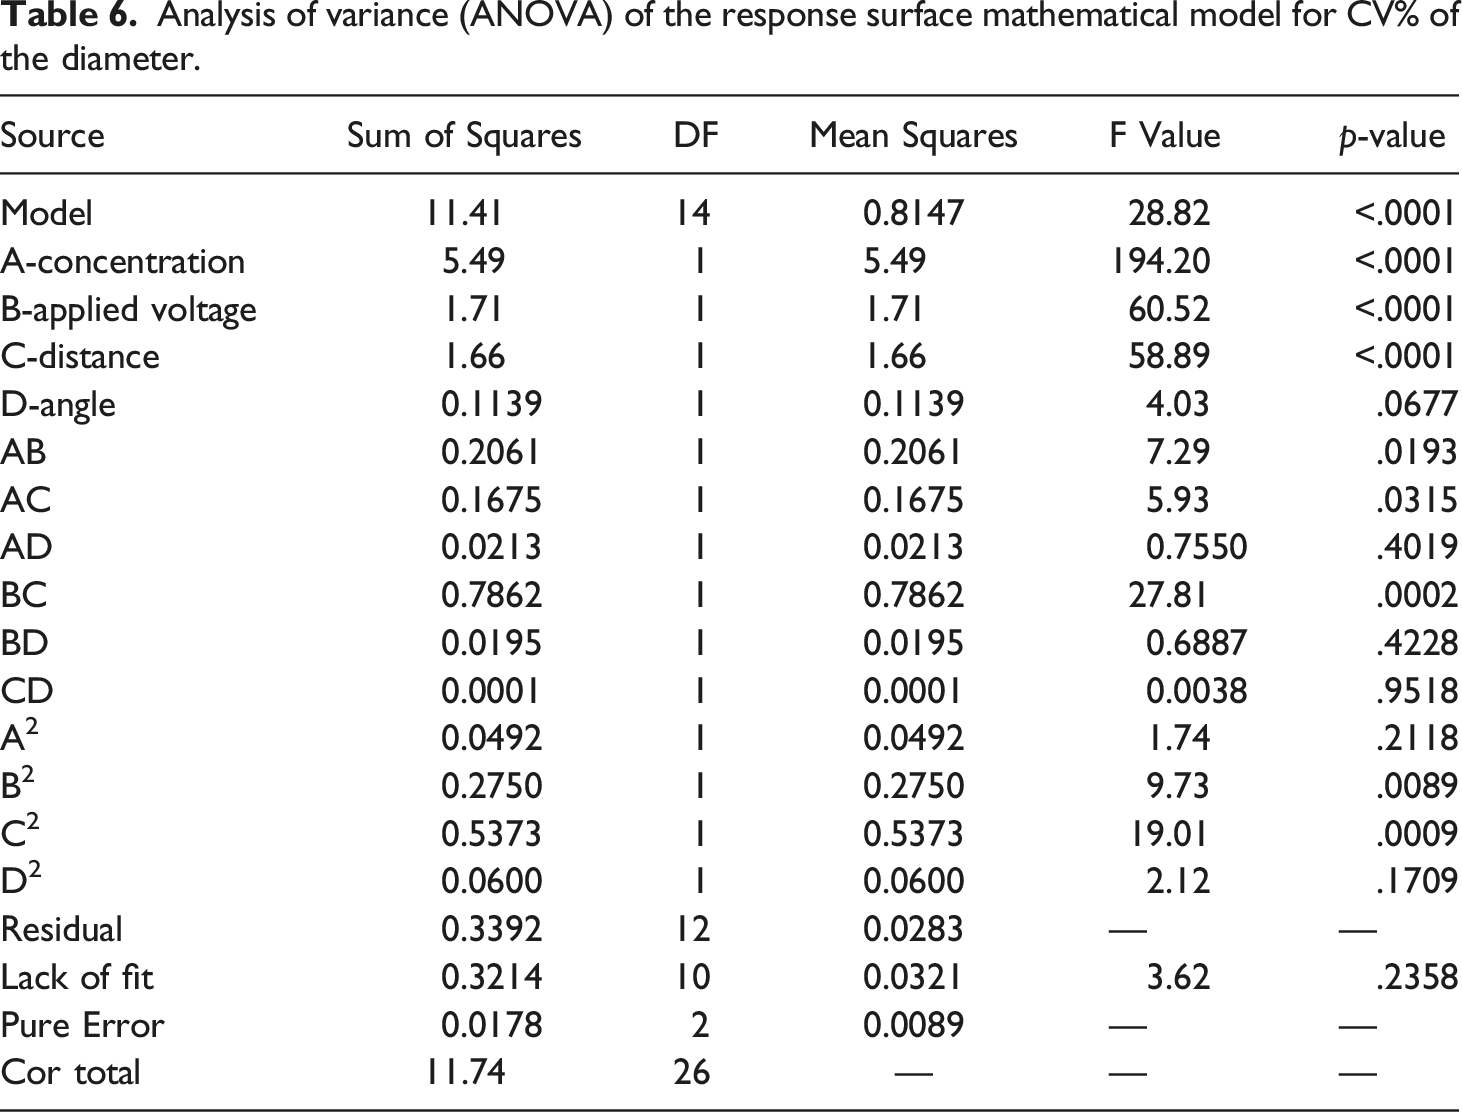
Analysis of variance (ANOVA) of the response surface mathematical model for CV% of the diameter.
Response surface mathematical models for response variables.
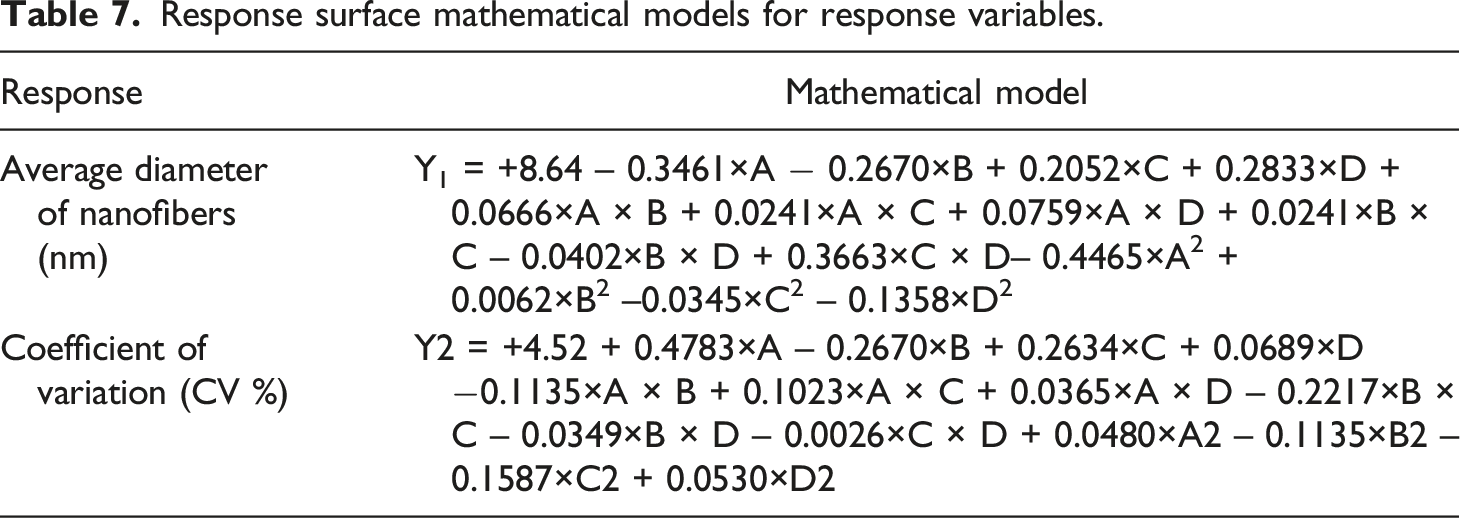
Figure 4(a) compares the average diameter of CS/PEO electrospun nanofibers that were acquired during tests with the average diameter predicted by the RSM model. The graph in Figure 4(b) compares the measured CV% of the diameter (homogeneity) of CS/PEO nanofibers to the CV% of the diameter predicted by the fitted RSM model. According toFigure 4, when experimental data is compared to the outcomes predicted by RSM models, there is a good agreement ( Plot of experimental versus RSM-predicted responses for a: average diameter, and b: the CV% of the diameter (homogeneity) of nanofibers.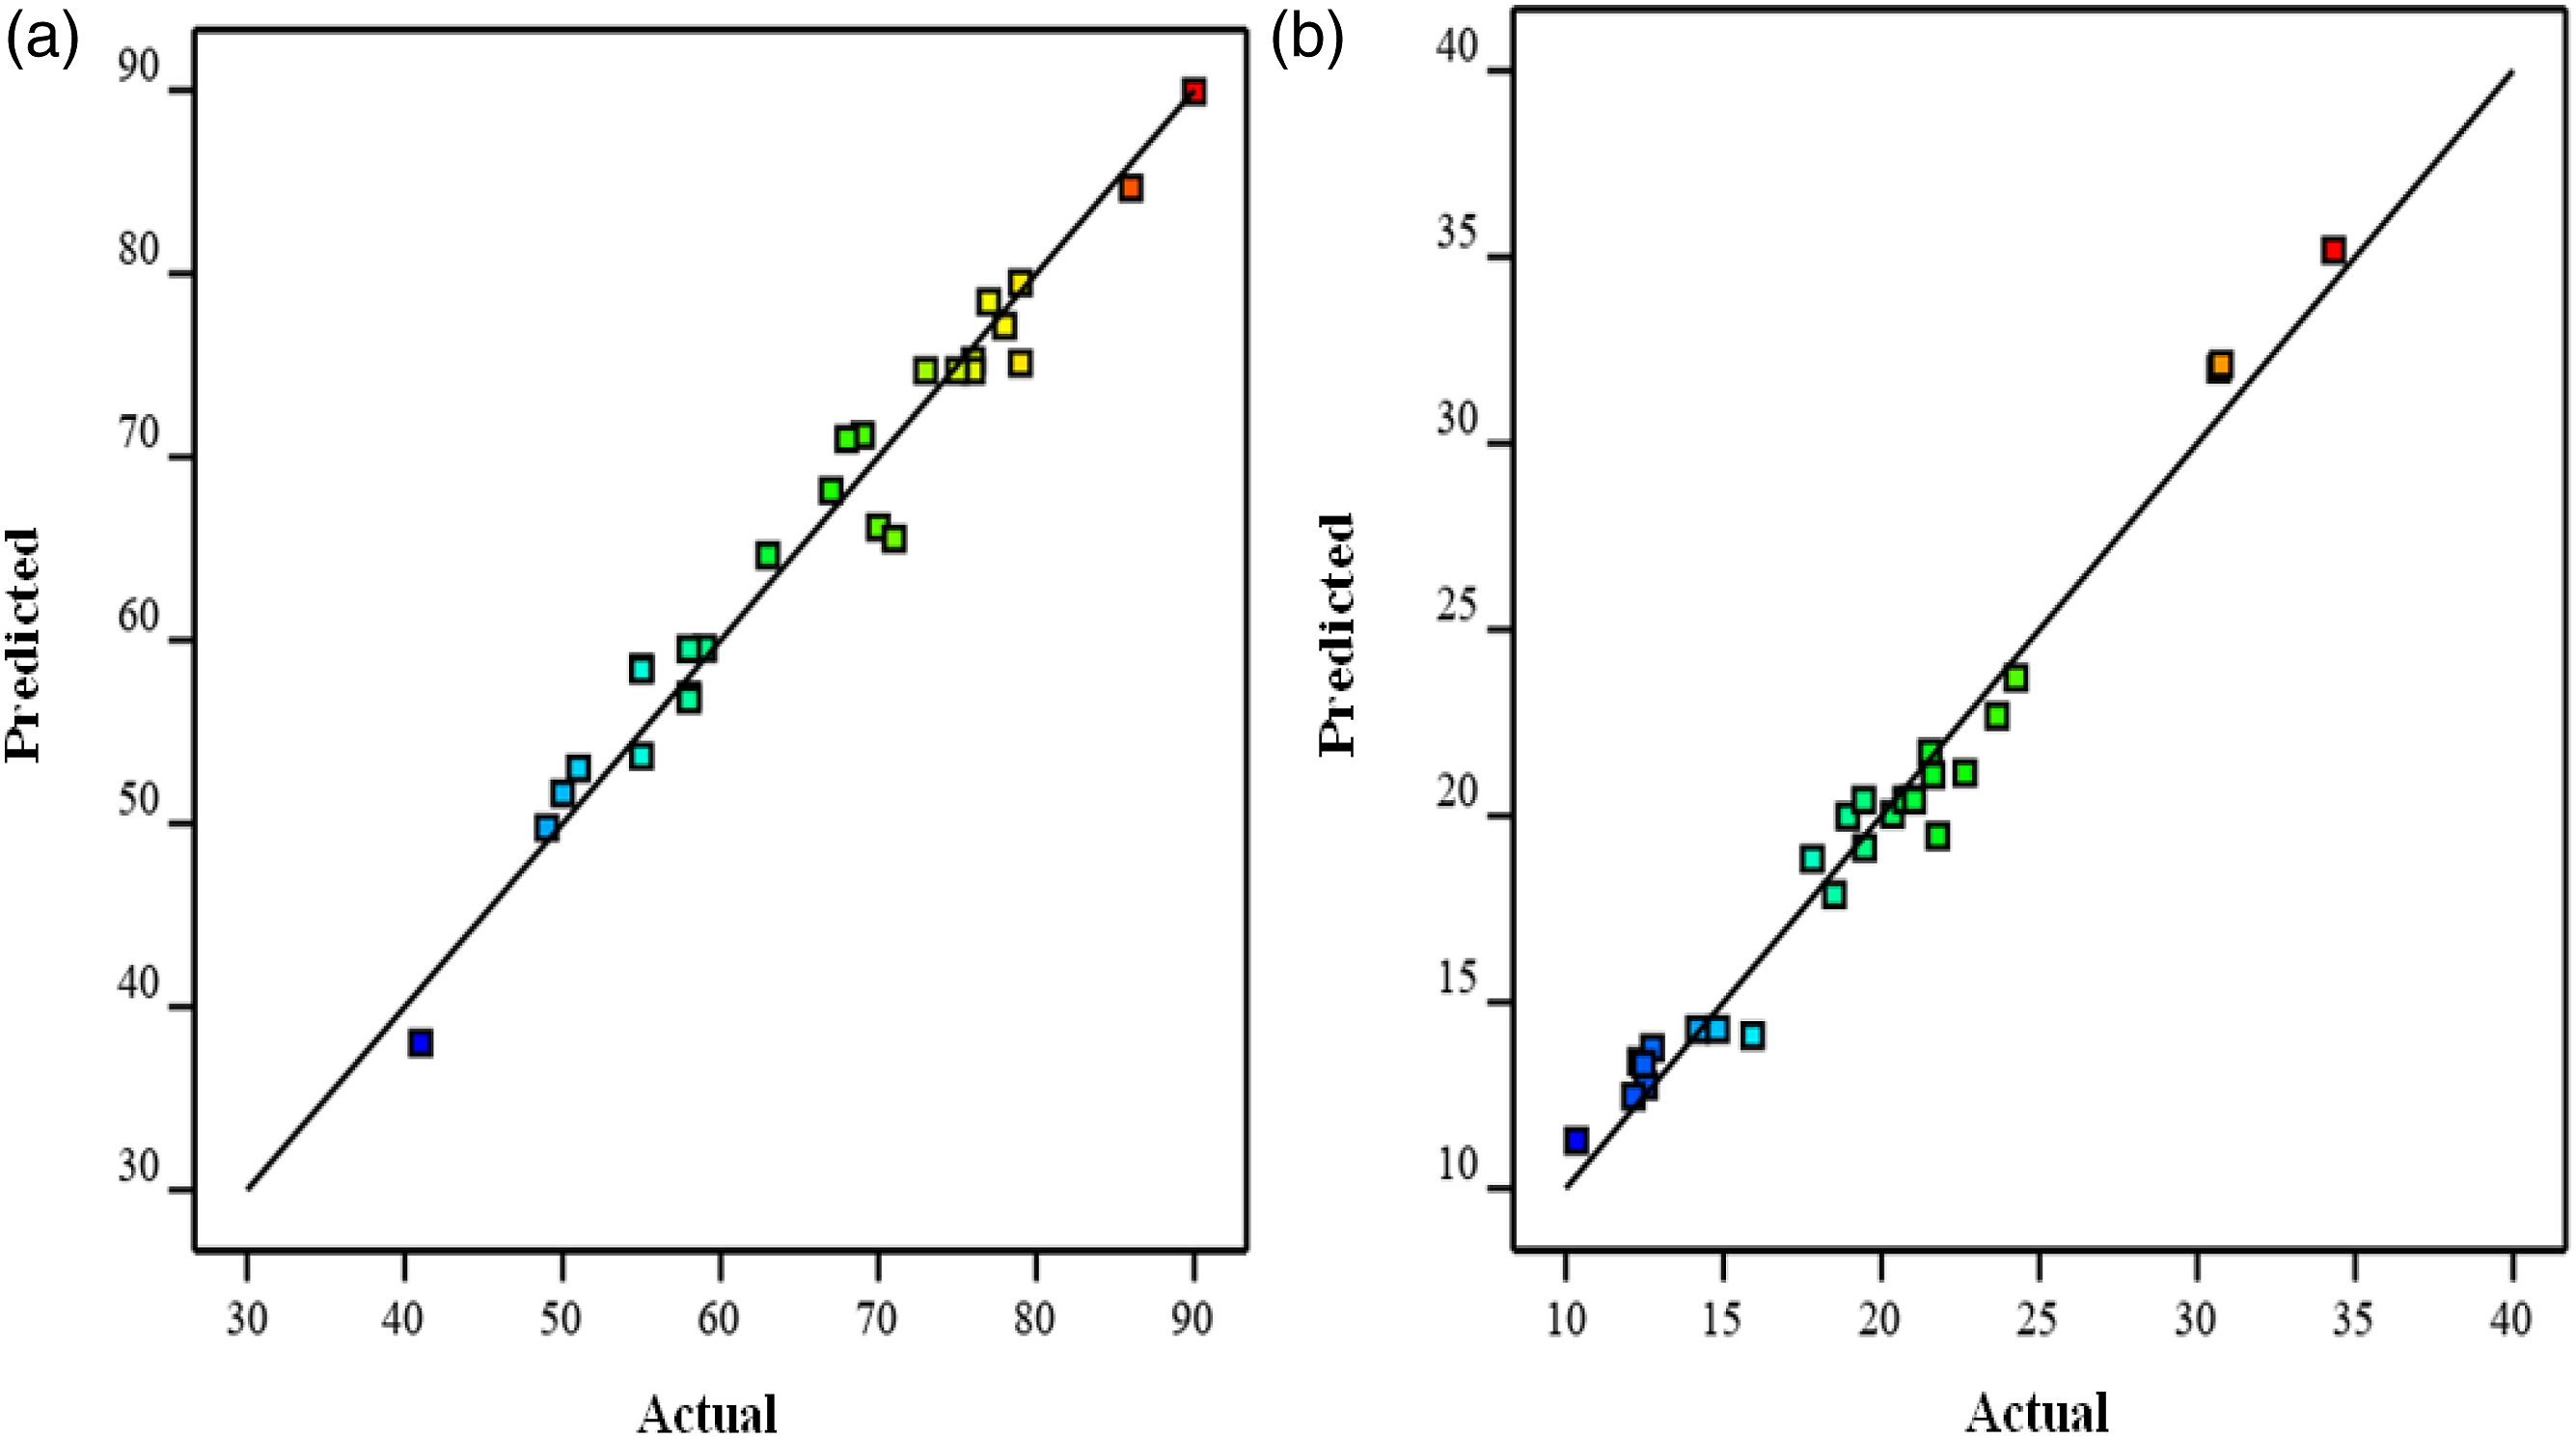
Investigation of the effect of processing variables on the responses
Investigate how each term affects the solution using these equations (Table 7). The greater the coefficient of each term, the greater its influence on the response. Additionally, each term’s positive coefficient in the transcript denotes its direct relationship to the solution. An inverse association is indicated by a negative coefficient.
Effects of processing variables on the average fiber diameter
Figure 5(a) shows that a higher CS weight ratio in a CS/PEO blended polymer solution results in a smaller average diameter (r = −0.3461, p value <.0001). It implies that increasing the CS content of a CS/PEO polymer blend increases the number of amino groups that can be protonated in acidic solutions while also increasing the surface charge density of the polymer jet flow. As a result, increased surface charge density results in nanofibers with smaller diameters and increases the drag force imposed on the polymer jet flow.45,46 Main effects of the defined variables on CS/PEO fiber diameter a) concentration, b) voltage, c) distance, and d) angle.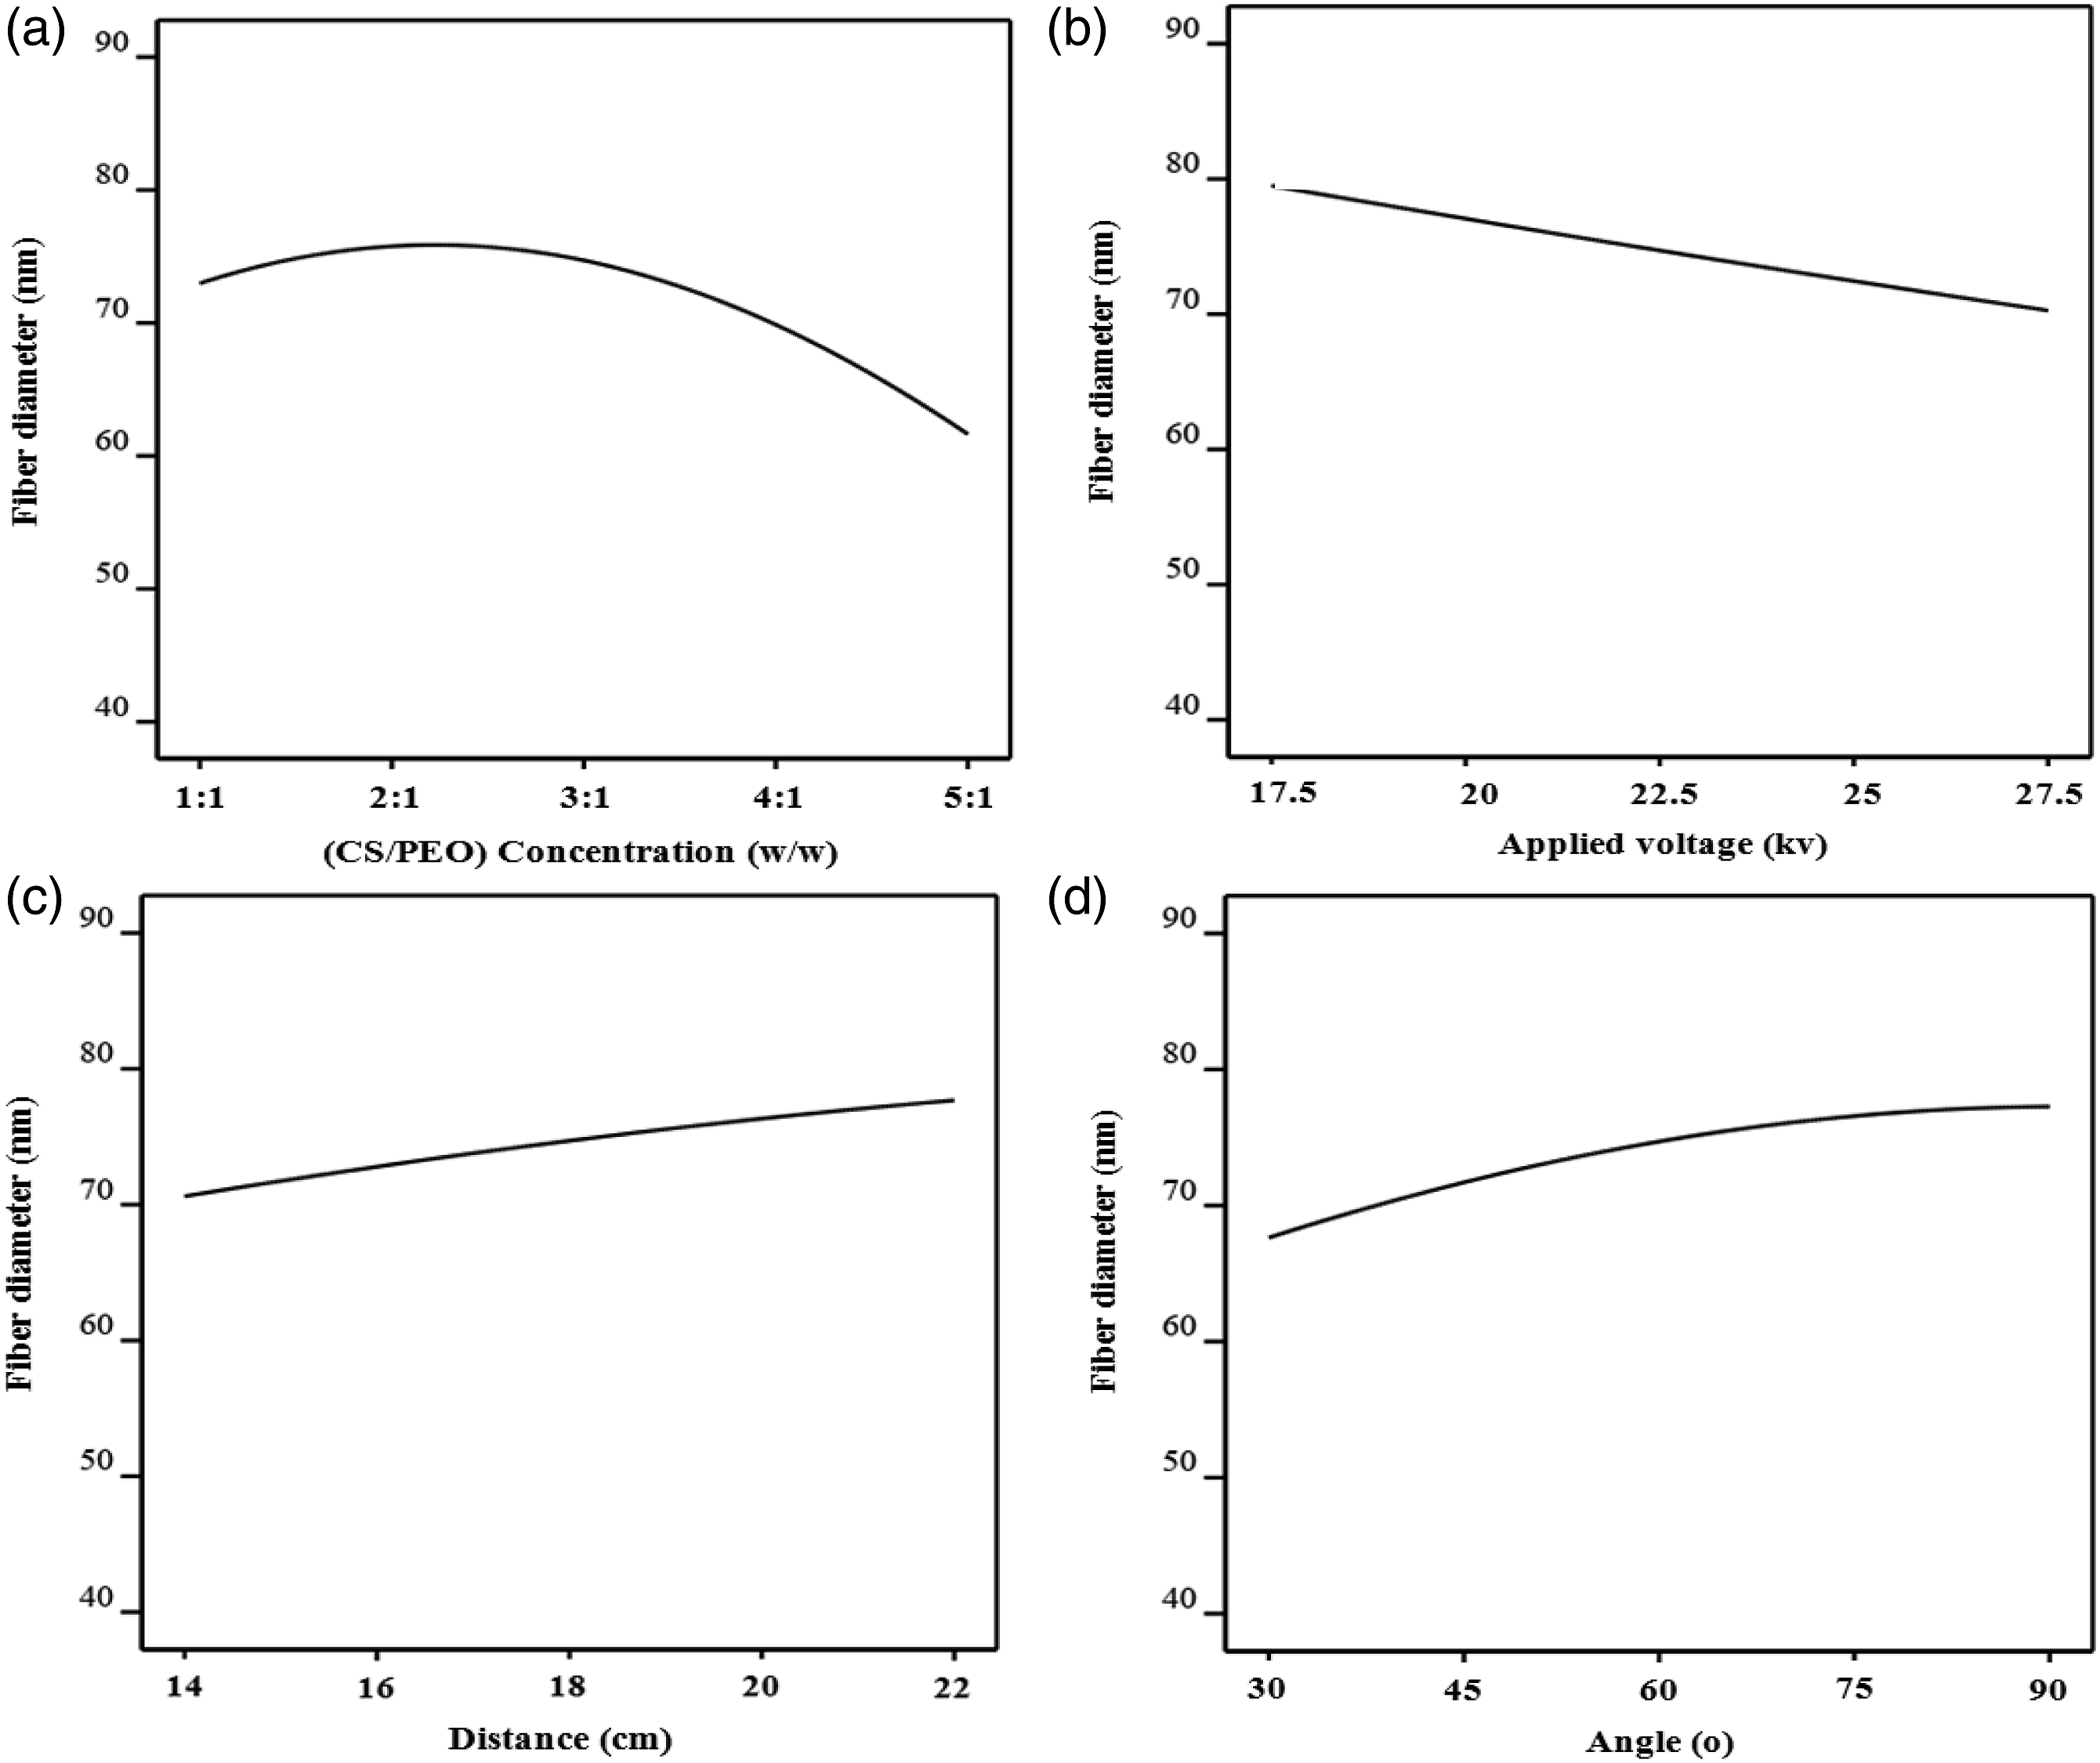
The obtained term coefficient between electrospinning parameters and response variables indicated that the mean diameter of nanofibers significantly decreased with an increase in the applied voltage (r = − 0.267, p value <.0001). In Figure 5(b), The inverse relationship between the applied voltage and the average diameter of the fiber is explained by the fact that increasing the applied voltage increases the strength of the electric field and electrostatic stretching force, which results in an accelerated jet and thinner nanofibers. 47 A stronger electrical field affects the ejected jet as the applied voltage is raised. As the jet becomes longer, beads begin to elongate into fibers, reducing the quantity of beads in the electrospun fabric. 6
The needle tip-to-collector distance and the mean diameter of nanofibers were shown to be positively correlated, as obtained in Figure 5(c) (r = 0.2052, p value <.0001). Competition between long- and short-range effects determines the needle tip-to-collector distance effect. Shorter distances produced thinner fibers as a result of a higher electric field, but larger distances produced longer jet stretching as a result of longer flight periods. 48 This behavior can be attributed to the fibers being stretched as a result of the electrostatic force decreasing due to a weakening of the electrostatic field strength.42,49 It was established in Figure 5(d) that there is a positive correlation between the spinning angle and the average diameter of nanofibers (r = 0.2833, p value <.0001). The spinning-angle effect is determined by the conflict between long- and short-path effects. Because of their longer paths, lower angles resulted in thinner fibers, whereas greater angles focused on the grounded screen’s edges, moving along shorter courses and producing larger fiber diameters. 50 On the other hand, in Figure 5(d), the impact of spinning angle on homogeneity was marginal (r = 0.0689, p value .05).
Effects of processing variables on coefficient of variation (CV%)
The obtained results indicated that the homogeneity of produced nanofibers decreases significantly by increasing the amount of CS in a CS/PEO polymer blend (r = 0.4783, p value <.01). This demonstrates that continuous fiber production during electrospinning was hampered by the repellent interactions between ionic groups in the chitosan backbone (Figure 6(a)).
31
The homogeneity was observed to significantly increase with increasing applied voltage, as seen in Figure 6(b) (r = − 0.2670, p value <.01). The stronger electrostatic force within the polymer jet and the increased homogeneity of electrospun nanofibers can both be attributed to the increased charge density brought on by an increase in applied voltage.
51
Main effects of the defined variables on coefficient of variation a) concentration, b) voltage, c) distance, and d) angle.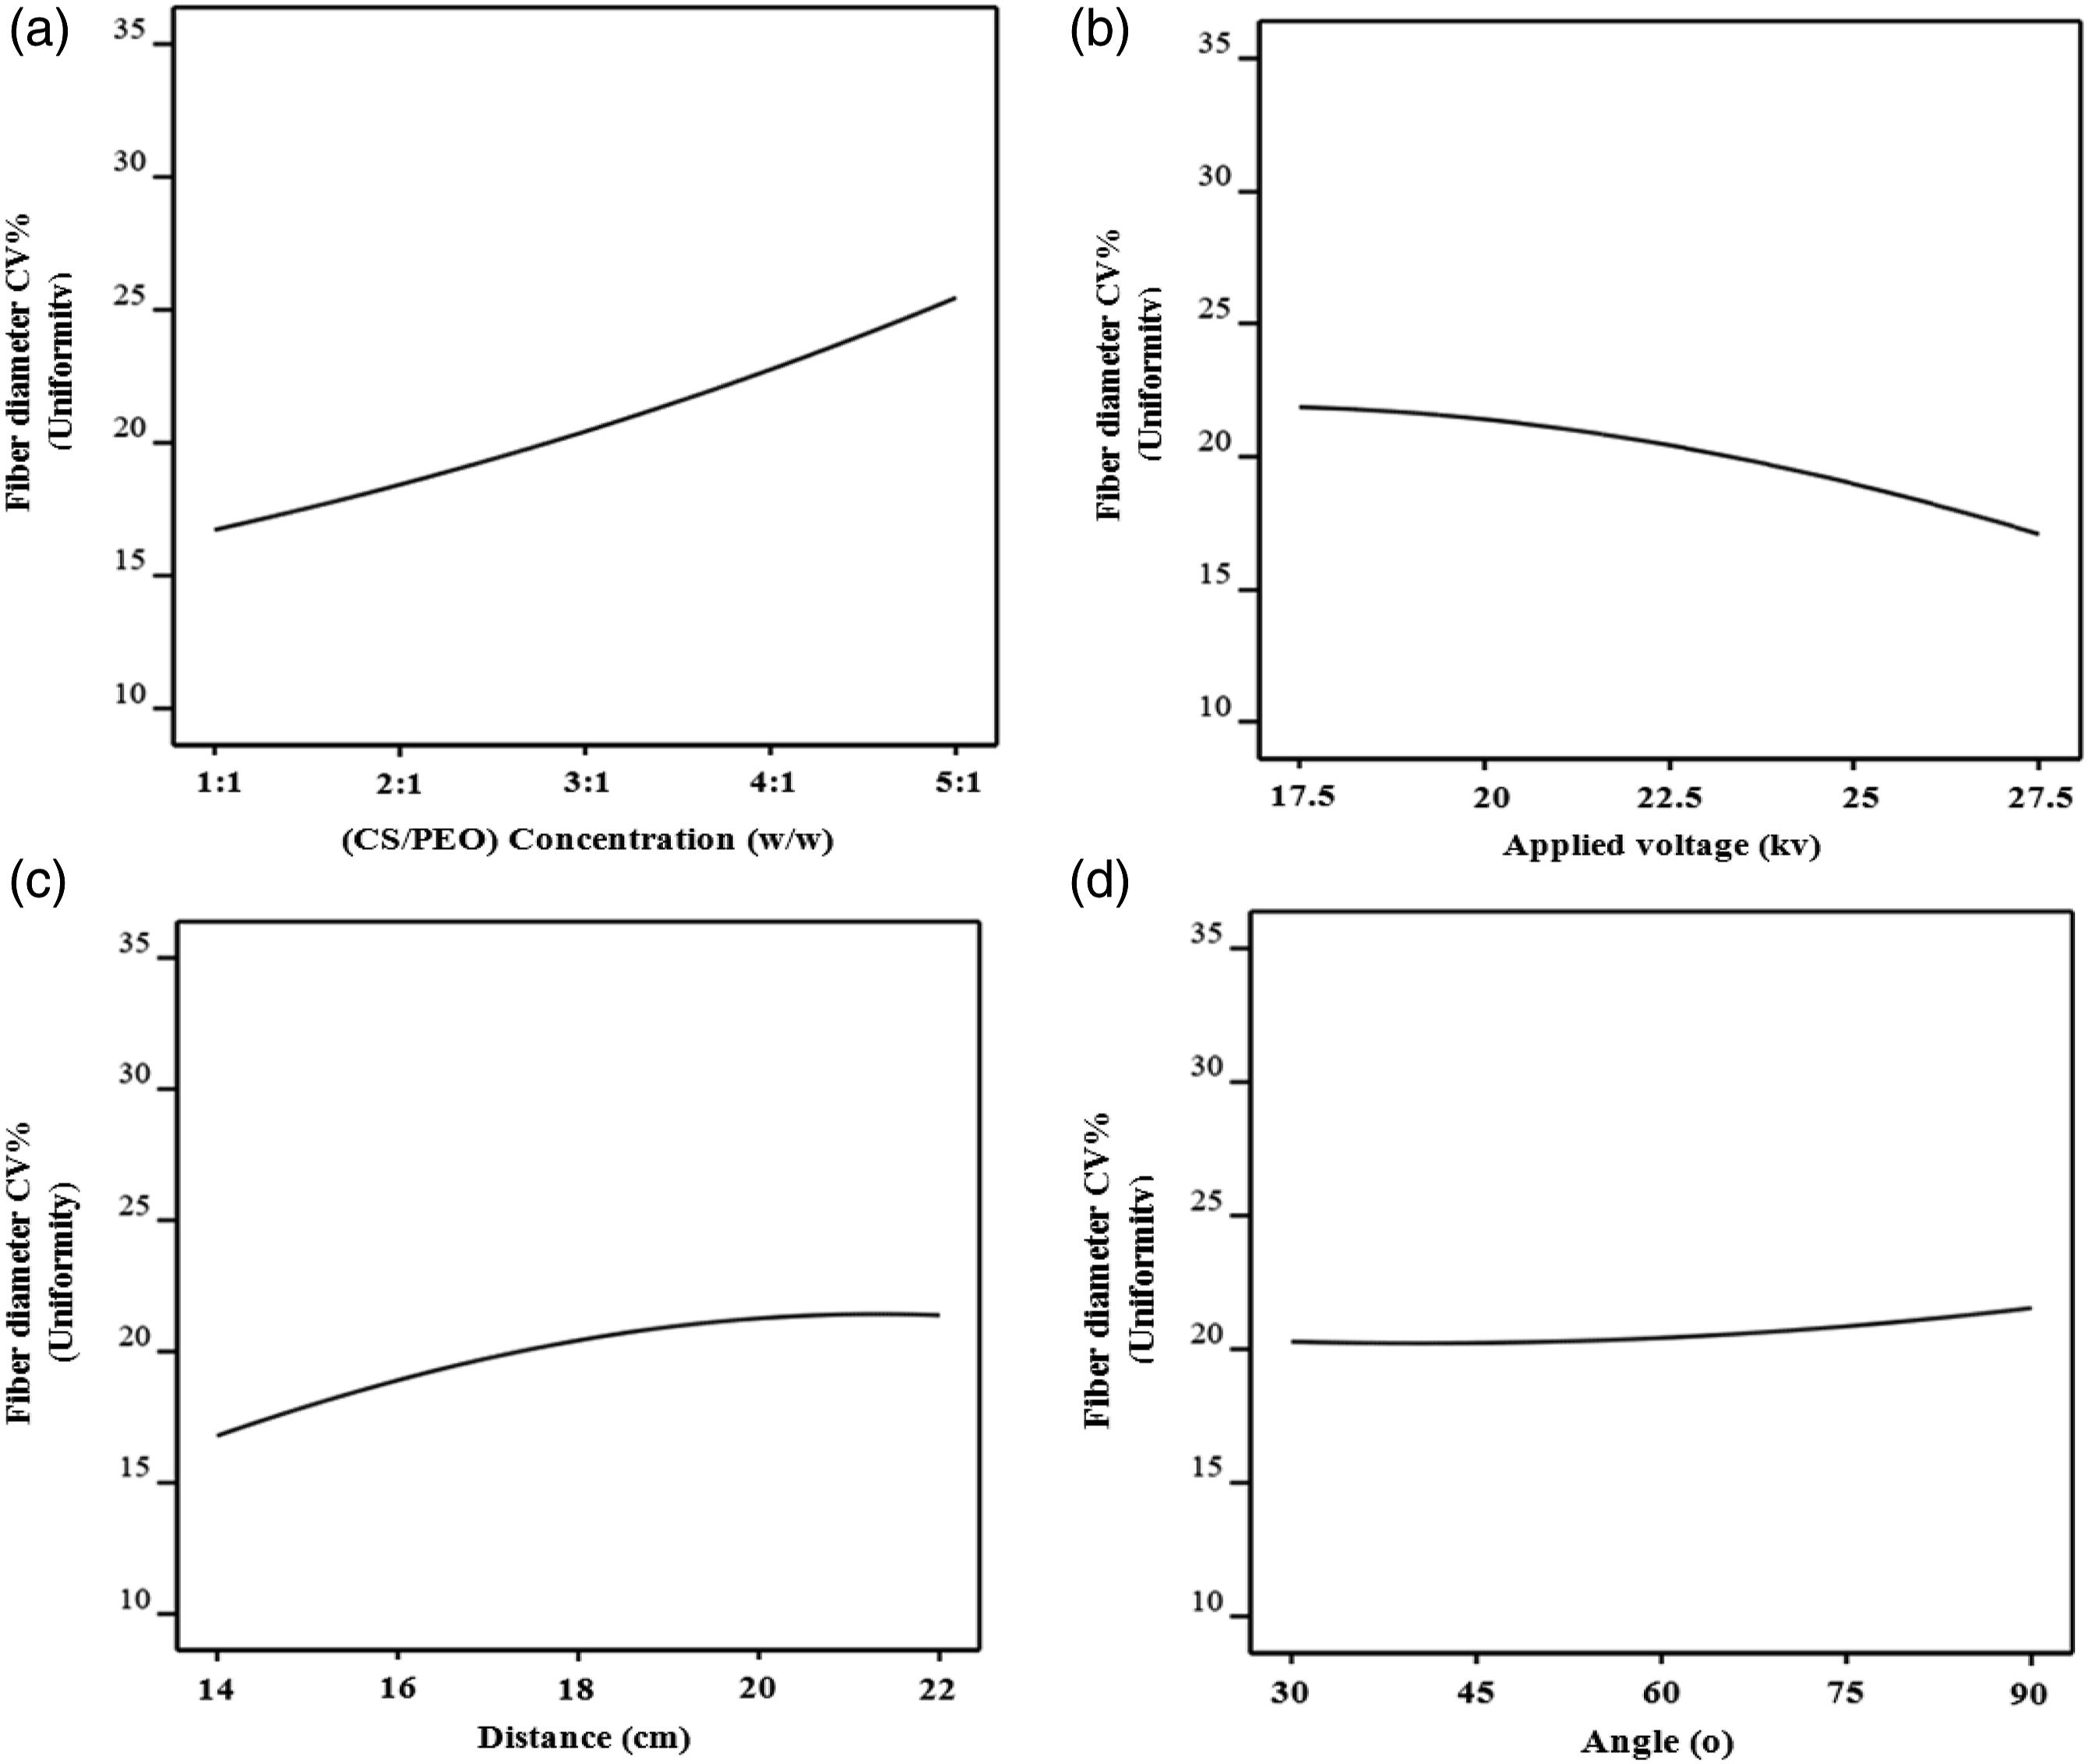
The results showed that as the distance between the needle tip and the collector is increased, the homogeneity of the created nanofibers decreases (r = 0.2634, p value <.01) (Figure 6(c)). This behavior is explained by the fibers being stretched as a result of the electrostatic force reducing as a result of the electrostatic field strength weakening. 46 Moreover, the homogeneity of fiber was only marginally affected by the spinning angle (Figure 6(d)).
Evaluating contour and 3D surface plots
The interaction between CS/PEO concentration and applied voltage (Figure 7(a)), CS/PEO concentration and tip-to-collector-distance (Figure 7(b))and applied voltage and tip-to-collector-distance (Figure 7(c)) has a significant impact on nanofiber diameter, according to ANOVA analysis. As previously mentioned, the fiber diameter increased with increasing tip-to-collector distance while decreasing with increasing CS/PEO concentration and applied voltage. Any two of them that intersect each other produce a greater diameter. Contour and 3D surface plots of fiber diameter versus (a) CS/PEO concentration and applied voltage, (b) CS/PEO concentration and tip-to-collector-distance, and (c) applied voltage and tip-to-collector-distance.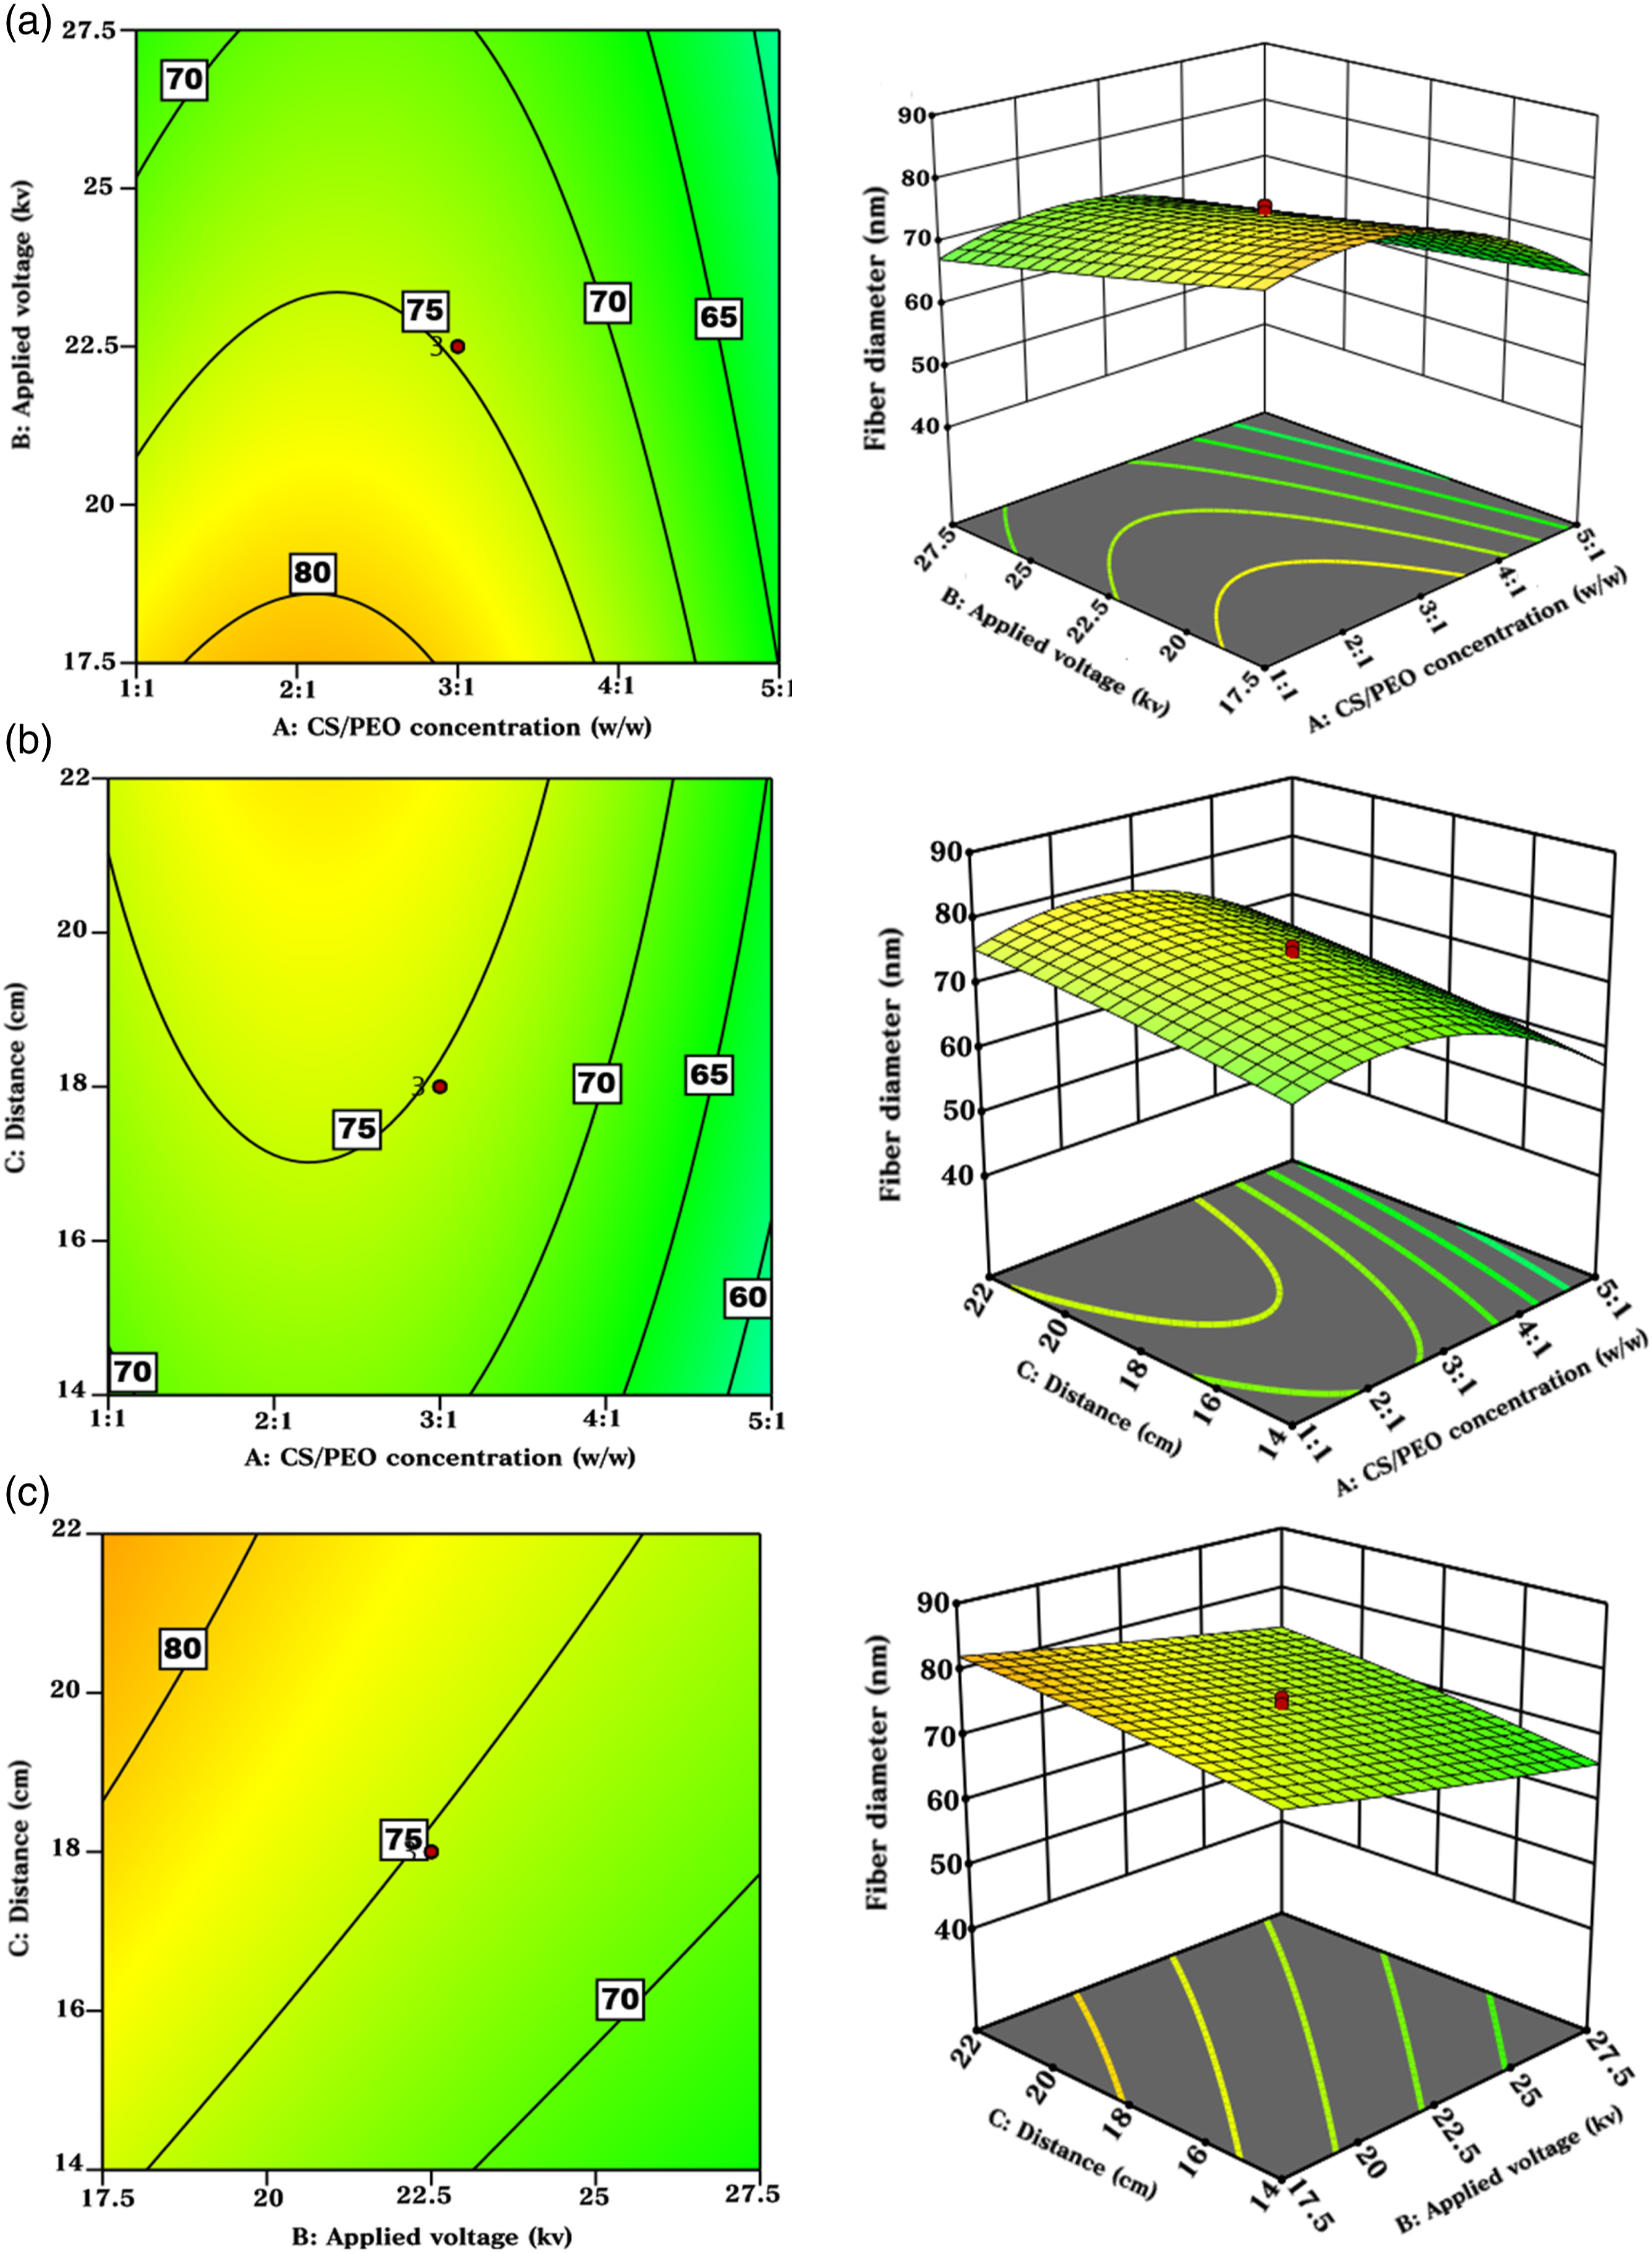
The homogeneity of the formed nanofibers, as shown in Figure 8(a), is significantly influenced by the interaction between the CS/PEO mixture and the applied voltage. Due to the repellent interactions between ionic groups in the chitosan backbone, the homogeneity of produced nanofibers decreases as the amount of CS in a CS/PEO polymer blend increases, whereas the electric strength increases with increasing applied voltage, increasing the homogeneity of produced nanofibers. It has been discovered that raising both of them simultaneously reduces the coefficient of variance and increases homogeneity. Contour and 3D surface plots of CV% versus (a) CS/PEO concentration and applied voltage, (b) CS/PEO concentration and tip-to-collector-distance, and (c) applied voltage and tip-to-collector-distance.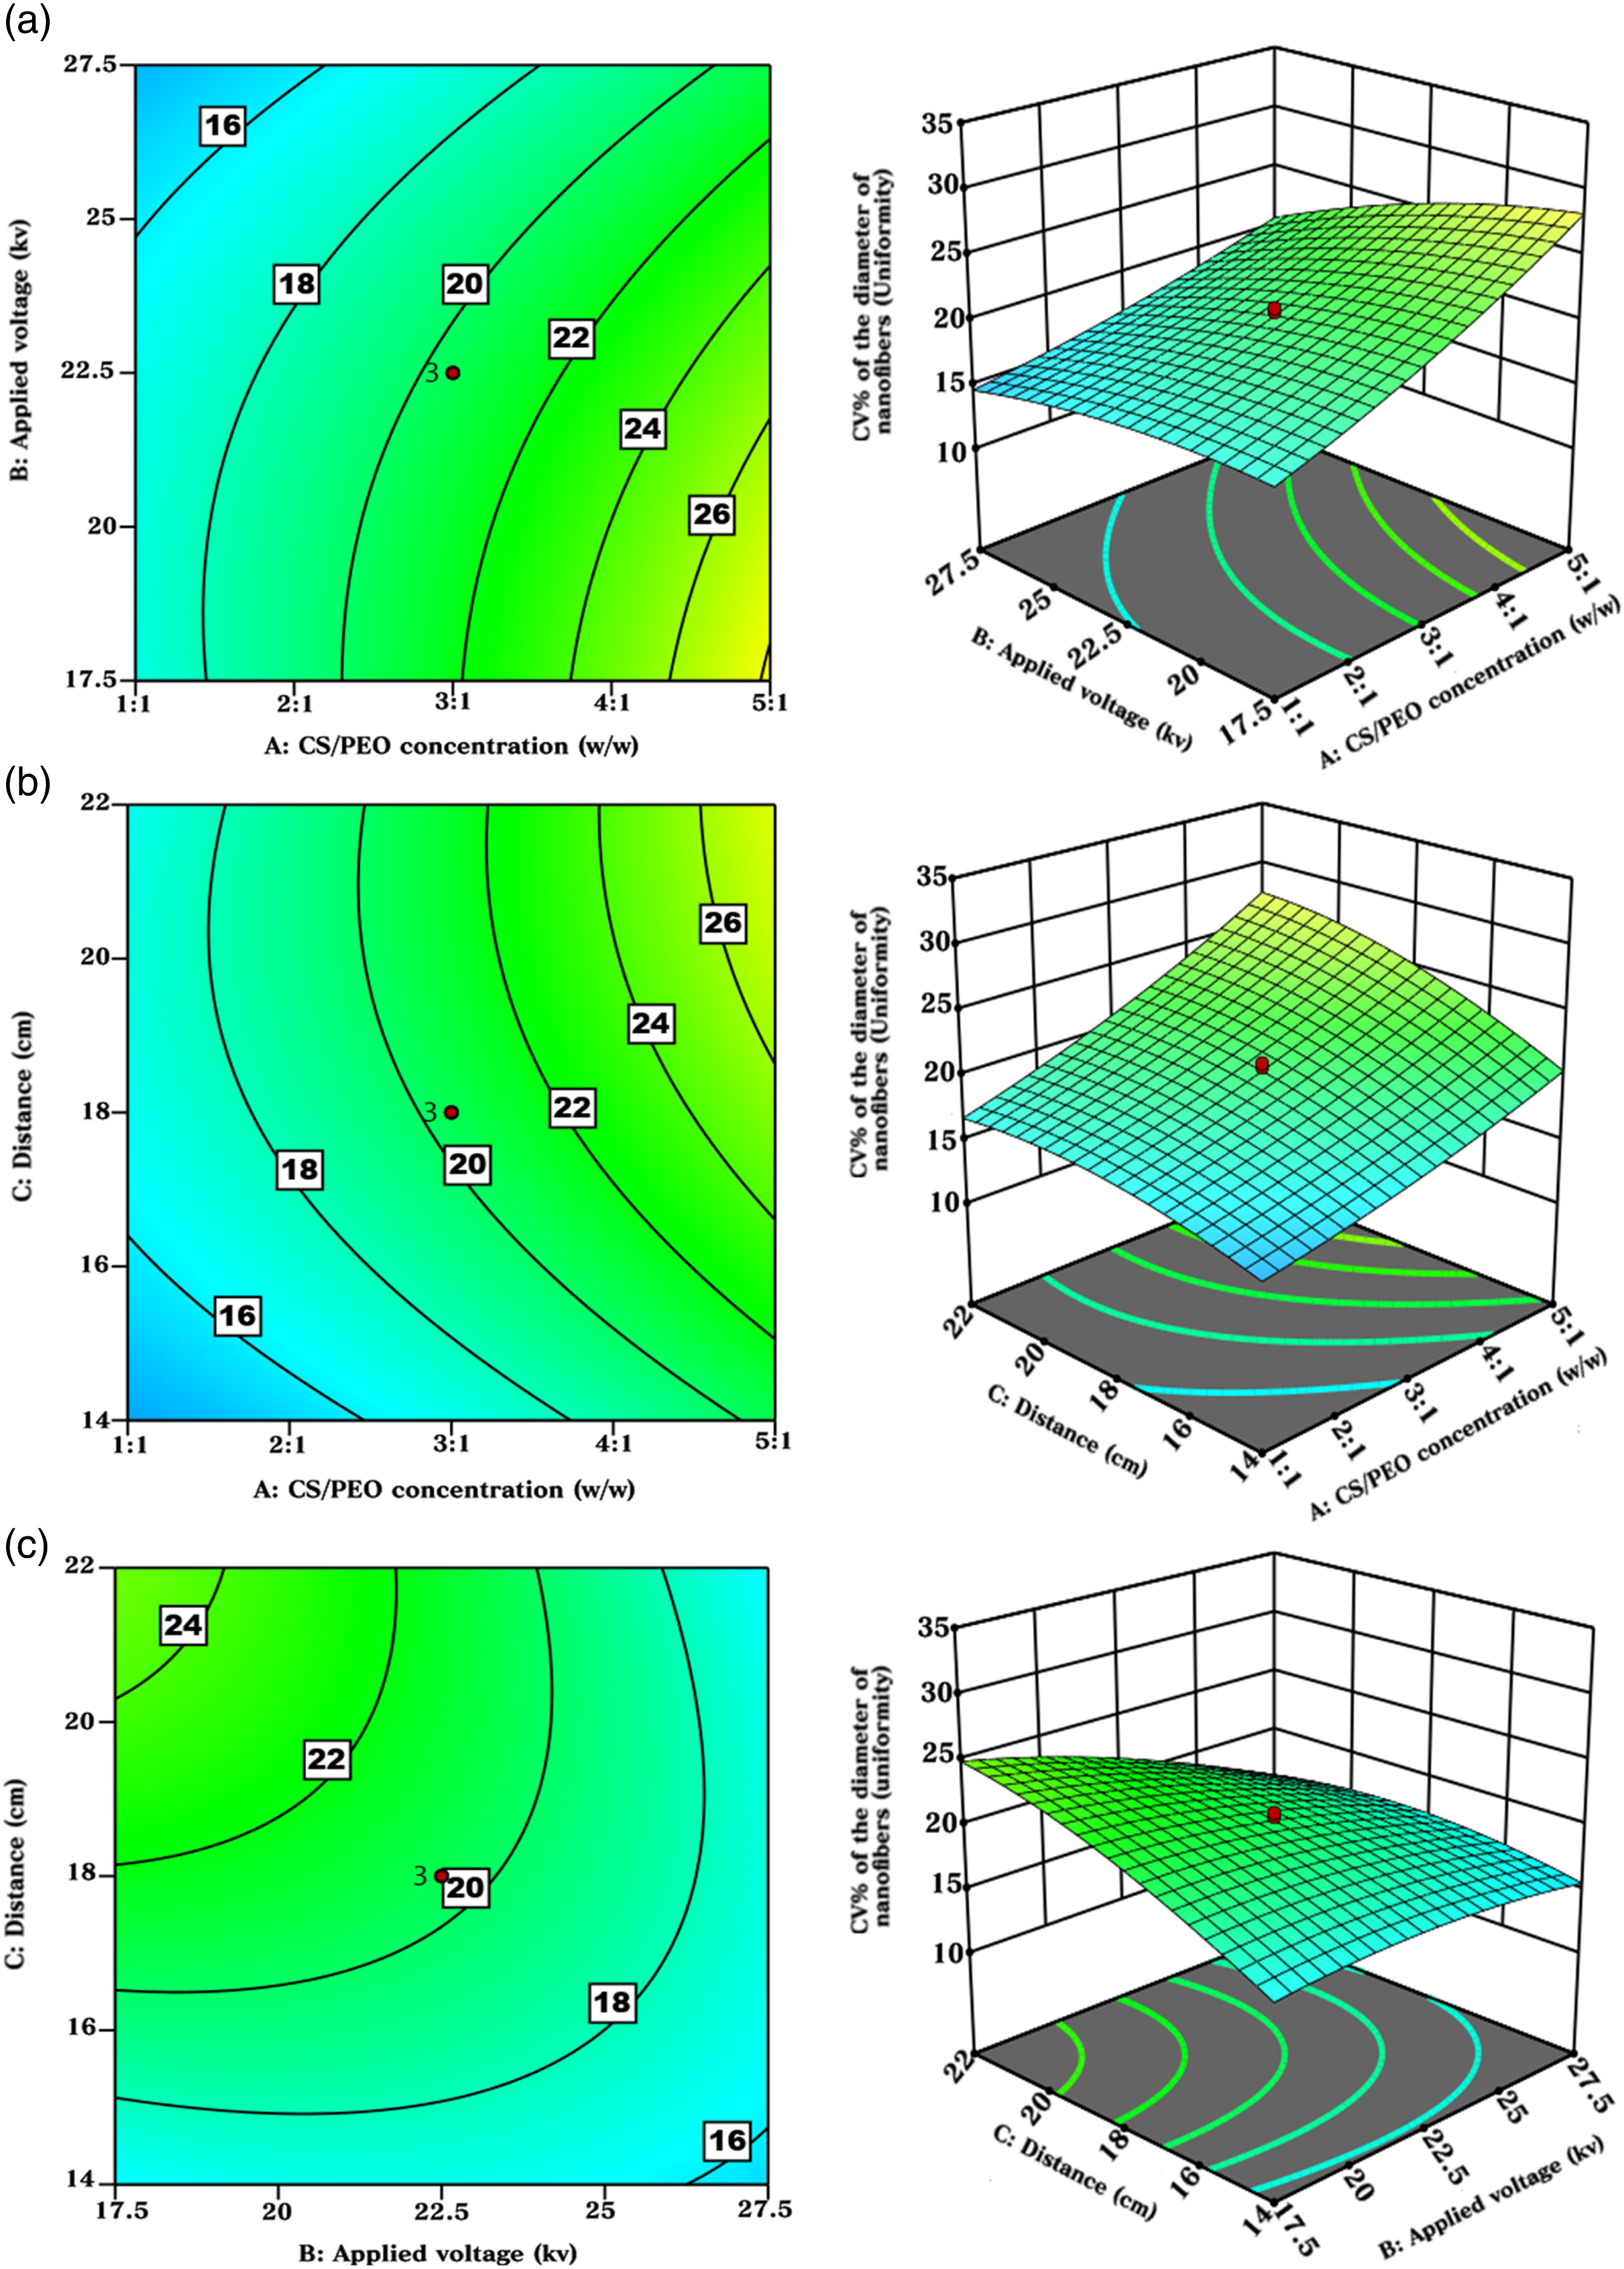
The results showed that as the tip-to-collector distance is increased, the homogeneity of the created nanofibers decreases. The coefficient of variation increases while the homogeneity decreases as the CS/PEO mixture and tip-to-collector distance concurrently increase (Figure 8(b)). In Figure 8(c), increasing both the applied voltage and tip-to-collector distance increases the homogeneity of the nanofibers produced.
Determining the optimum electrospinning conditions
In a response surface optimization study, the objective is to find a desirable location in the design space. The demanded point could be a minimum, a maximum, or a special region where response is stable. In our study, the goal was to obtain uniform, bead-less with a smoother distribution of fiber diameter, which may provide maximum fiber surface area. The conditions for obtaining the finest CS/PEO fiber diameter as determined by RSM model were CS/PEO polymer concentration = 2:1 (w/w), voltage = 25 kV, distance = 20 cm, and spinning angle = 45°. Figure 9 shows the nanofiber morphology observed by SEM together with the corresponding histogram of the nanofiber diameter distribution. With diameters ranging from 40 to 120 nm, the average nanofiber diameter and coefficient of variation were estimated to be 73 ± 15 nm and 20.5%, respectively. The theoretical fiber diameter and coefficient of variation under the above conditions were 71 nm and 15.58%, respectively. The experimental fiber diameter results observed (73 nm) were 2.7% greater than the predicted value under the same electrospinning settings. A comparison of the experimental value and the response provided by the model shows that the RSM model has acceptable performance in the optimization study. SEM photograph of electrospun nanofibers and corresponding fiber diameter distribution at optimum conditions.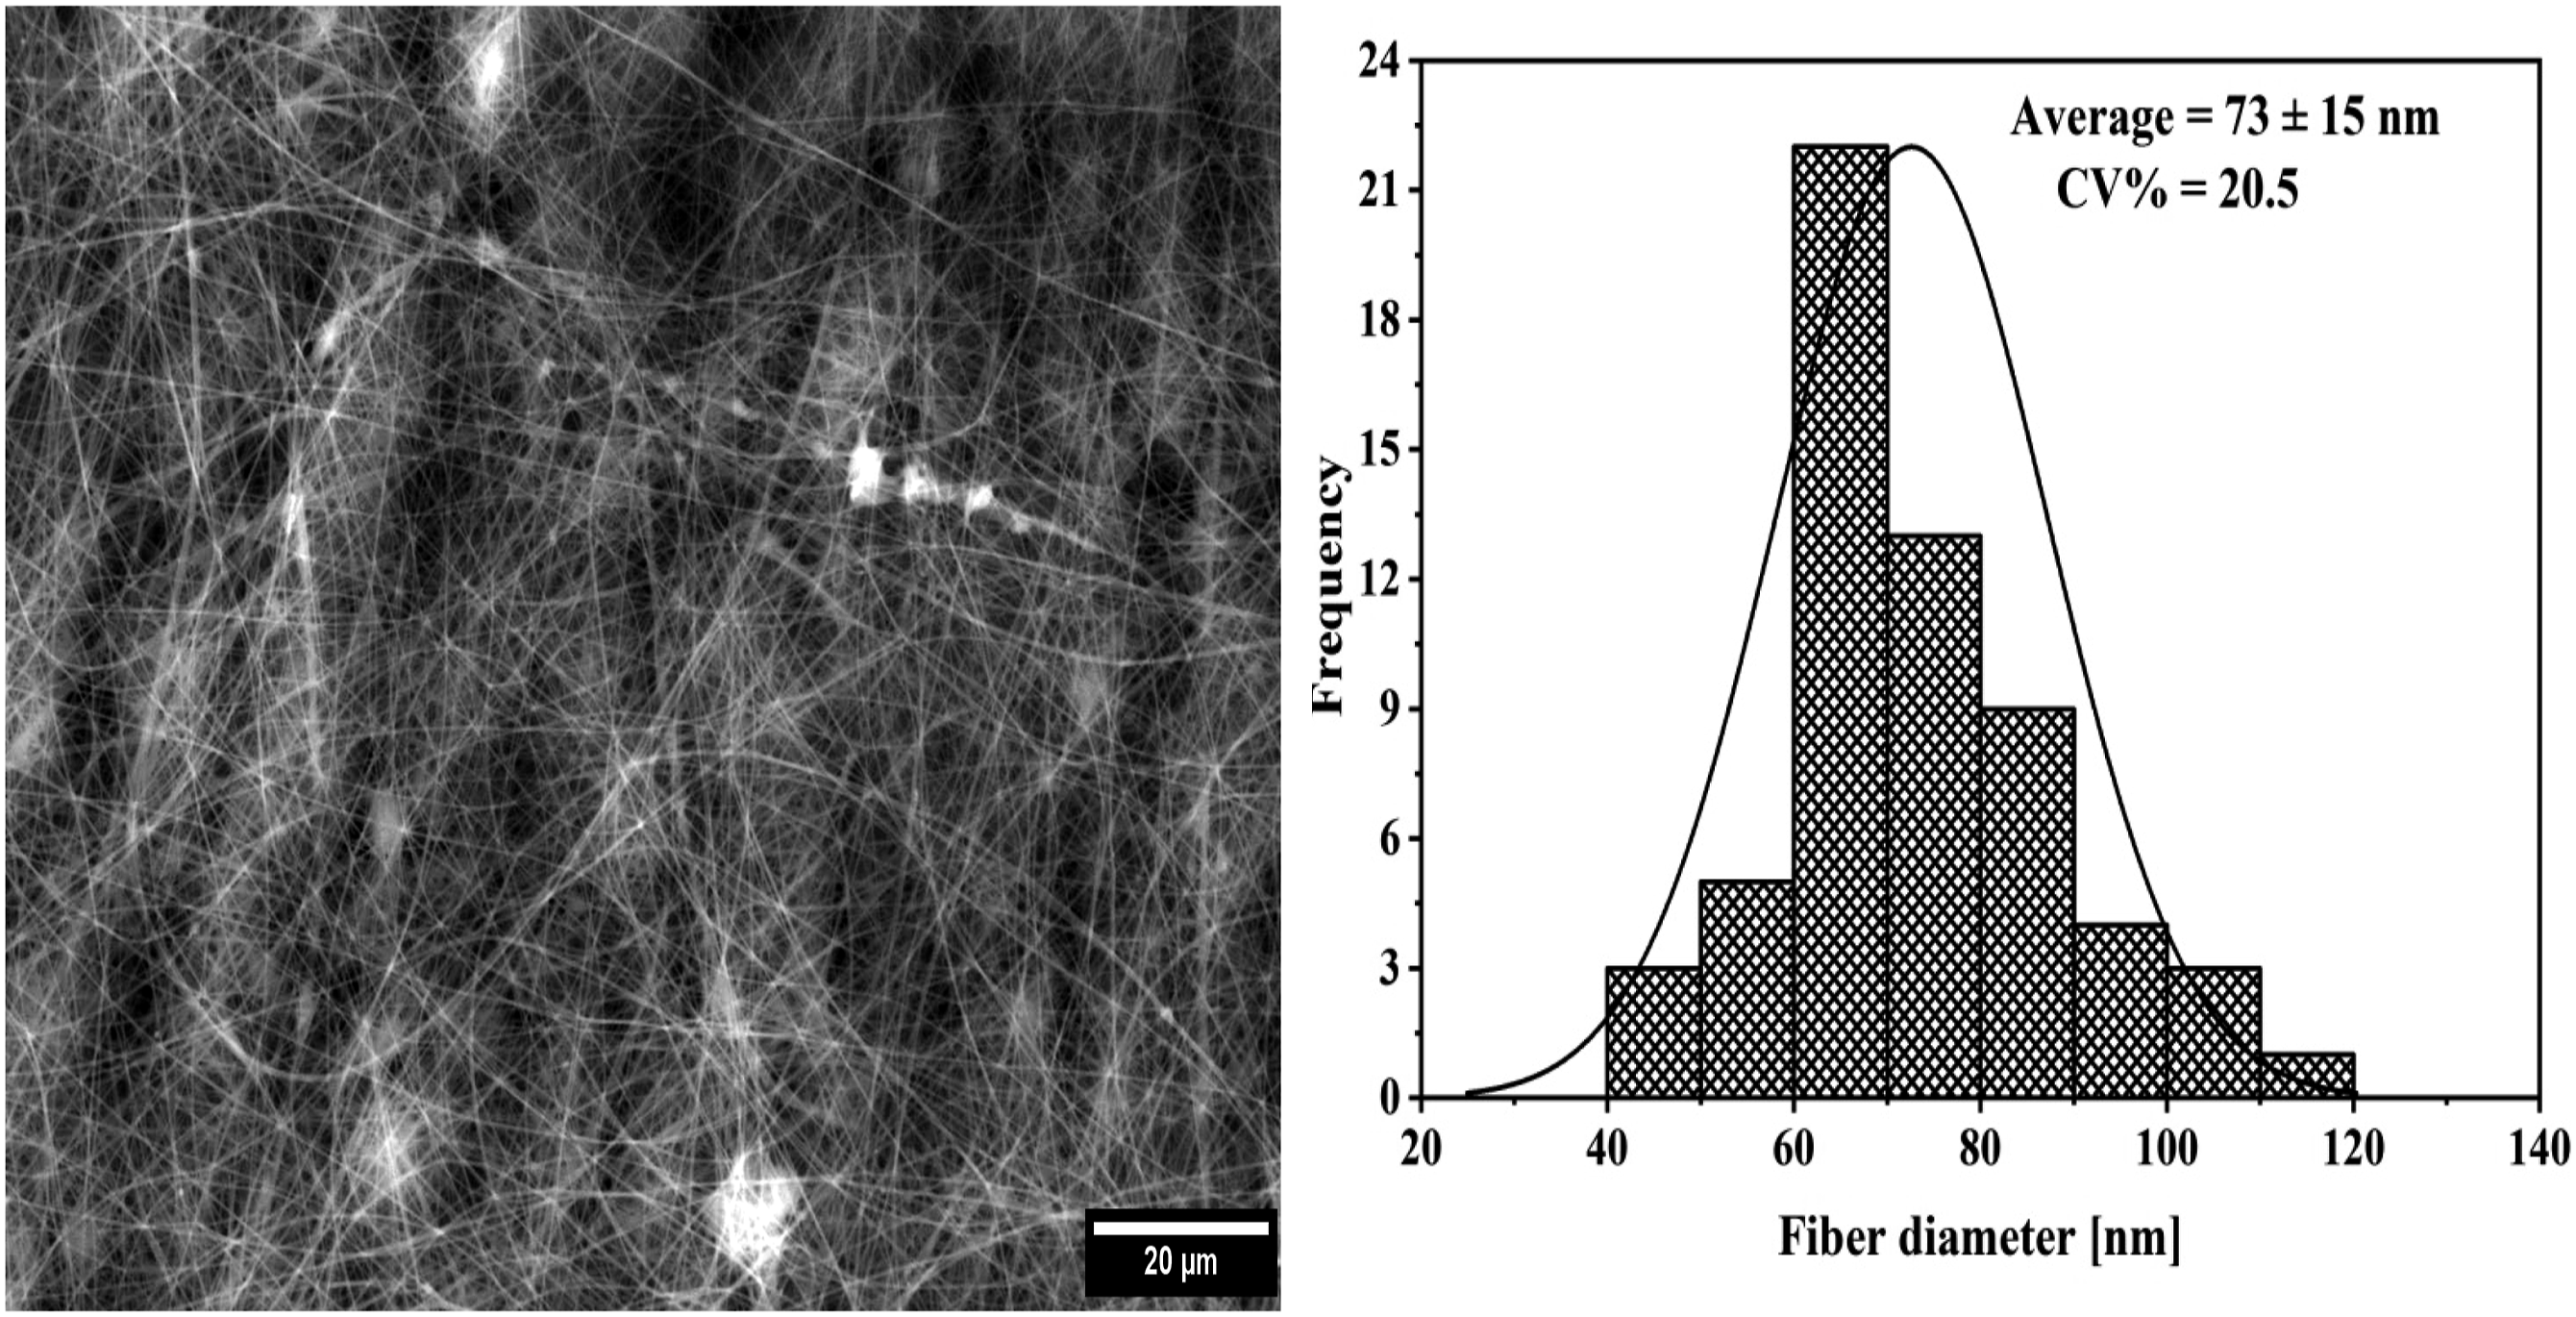
Validation of the RSM model
Validation of mathematical model using different levels of input variables.
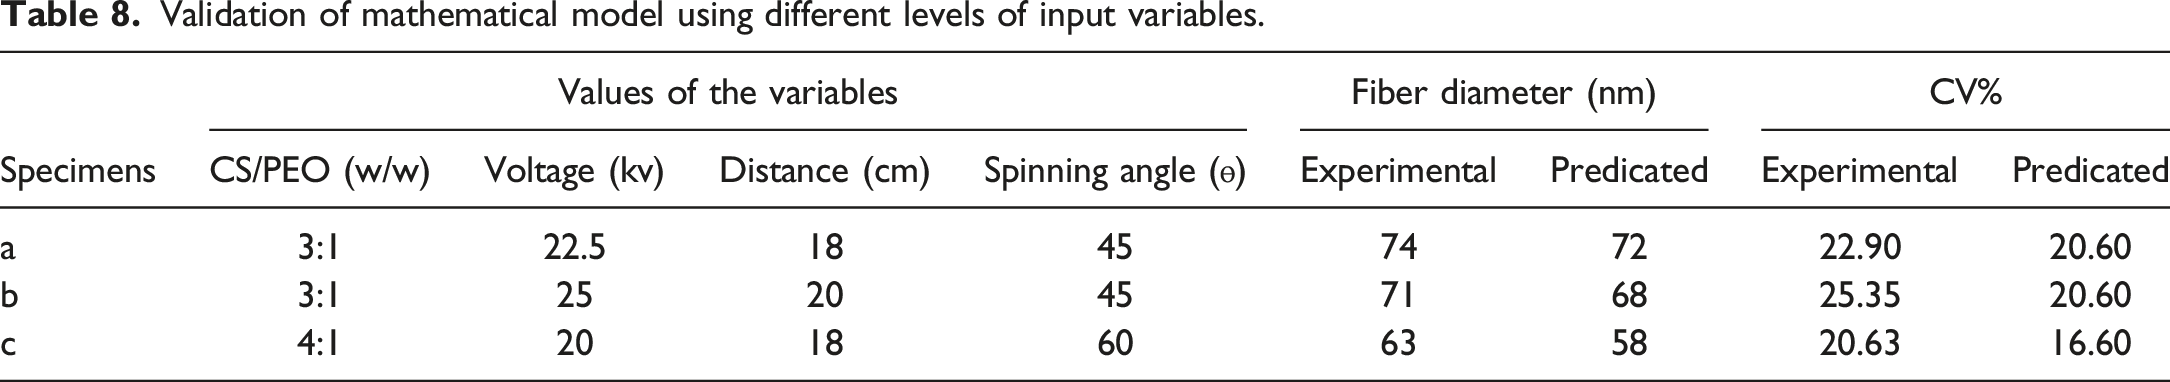
Figure 10 shows the nanofiber morphology observed by SEM together with the corresponding histogram of the nanofiber diameter distribution from related studies in Table 8. Nanofiber SEM micrographs show that RSM makes accurate predictions under the new experimental circumstances. It may be inferred that the models discussed above are appropriate for all space designs when taking into account RSM outcomes in additional experimental situations that follow the initial data. SEM photograph of electrospun nanofibers and corresponding fiber diameter distribution from related studies in Table 8(a-c).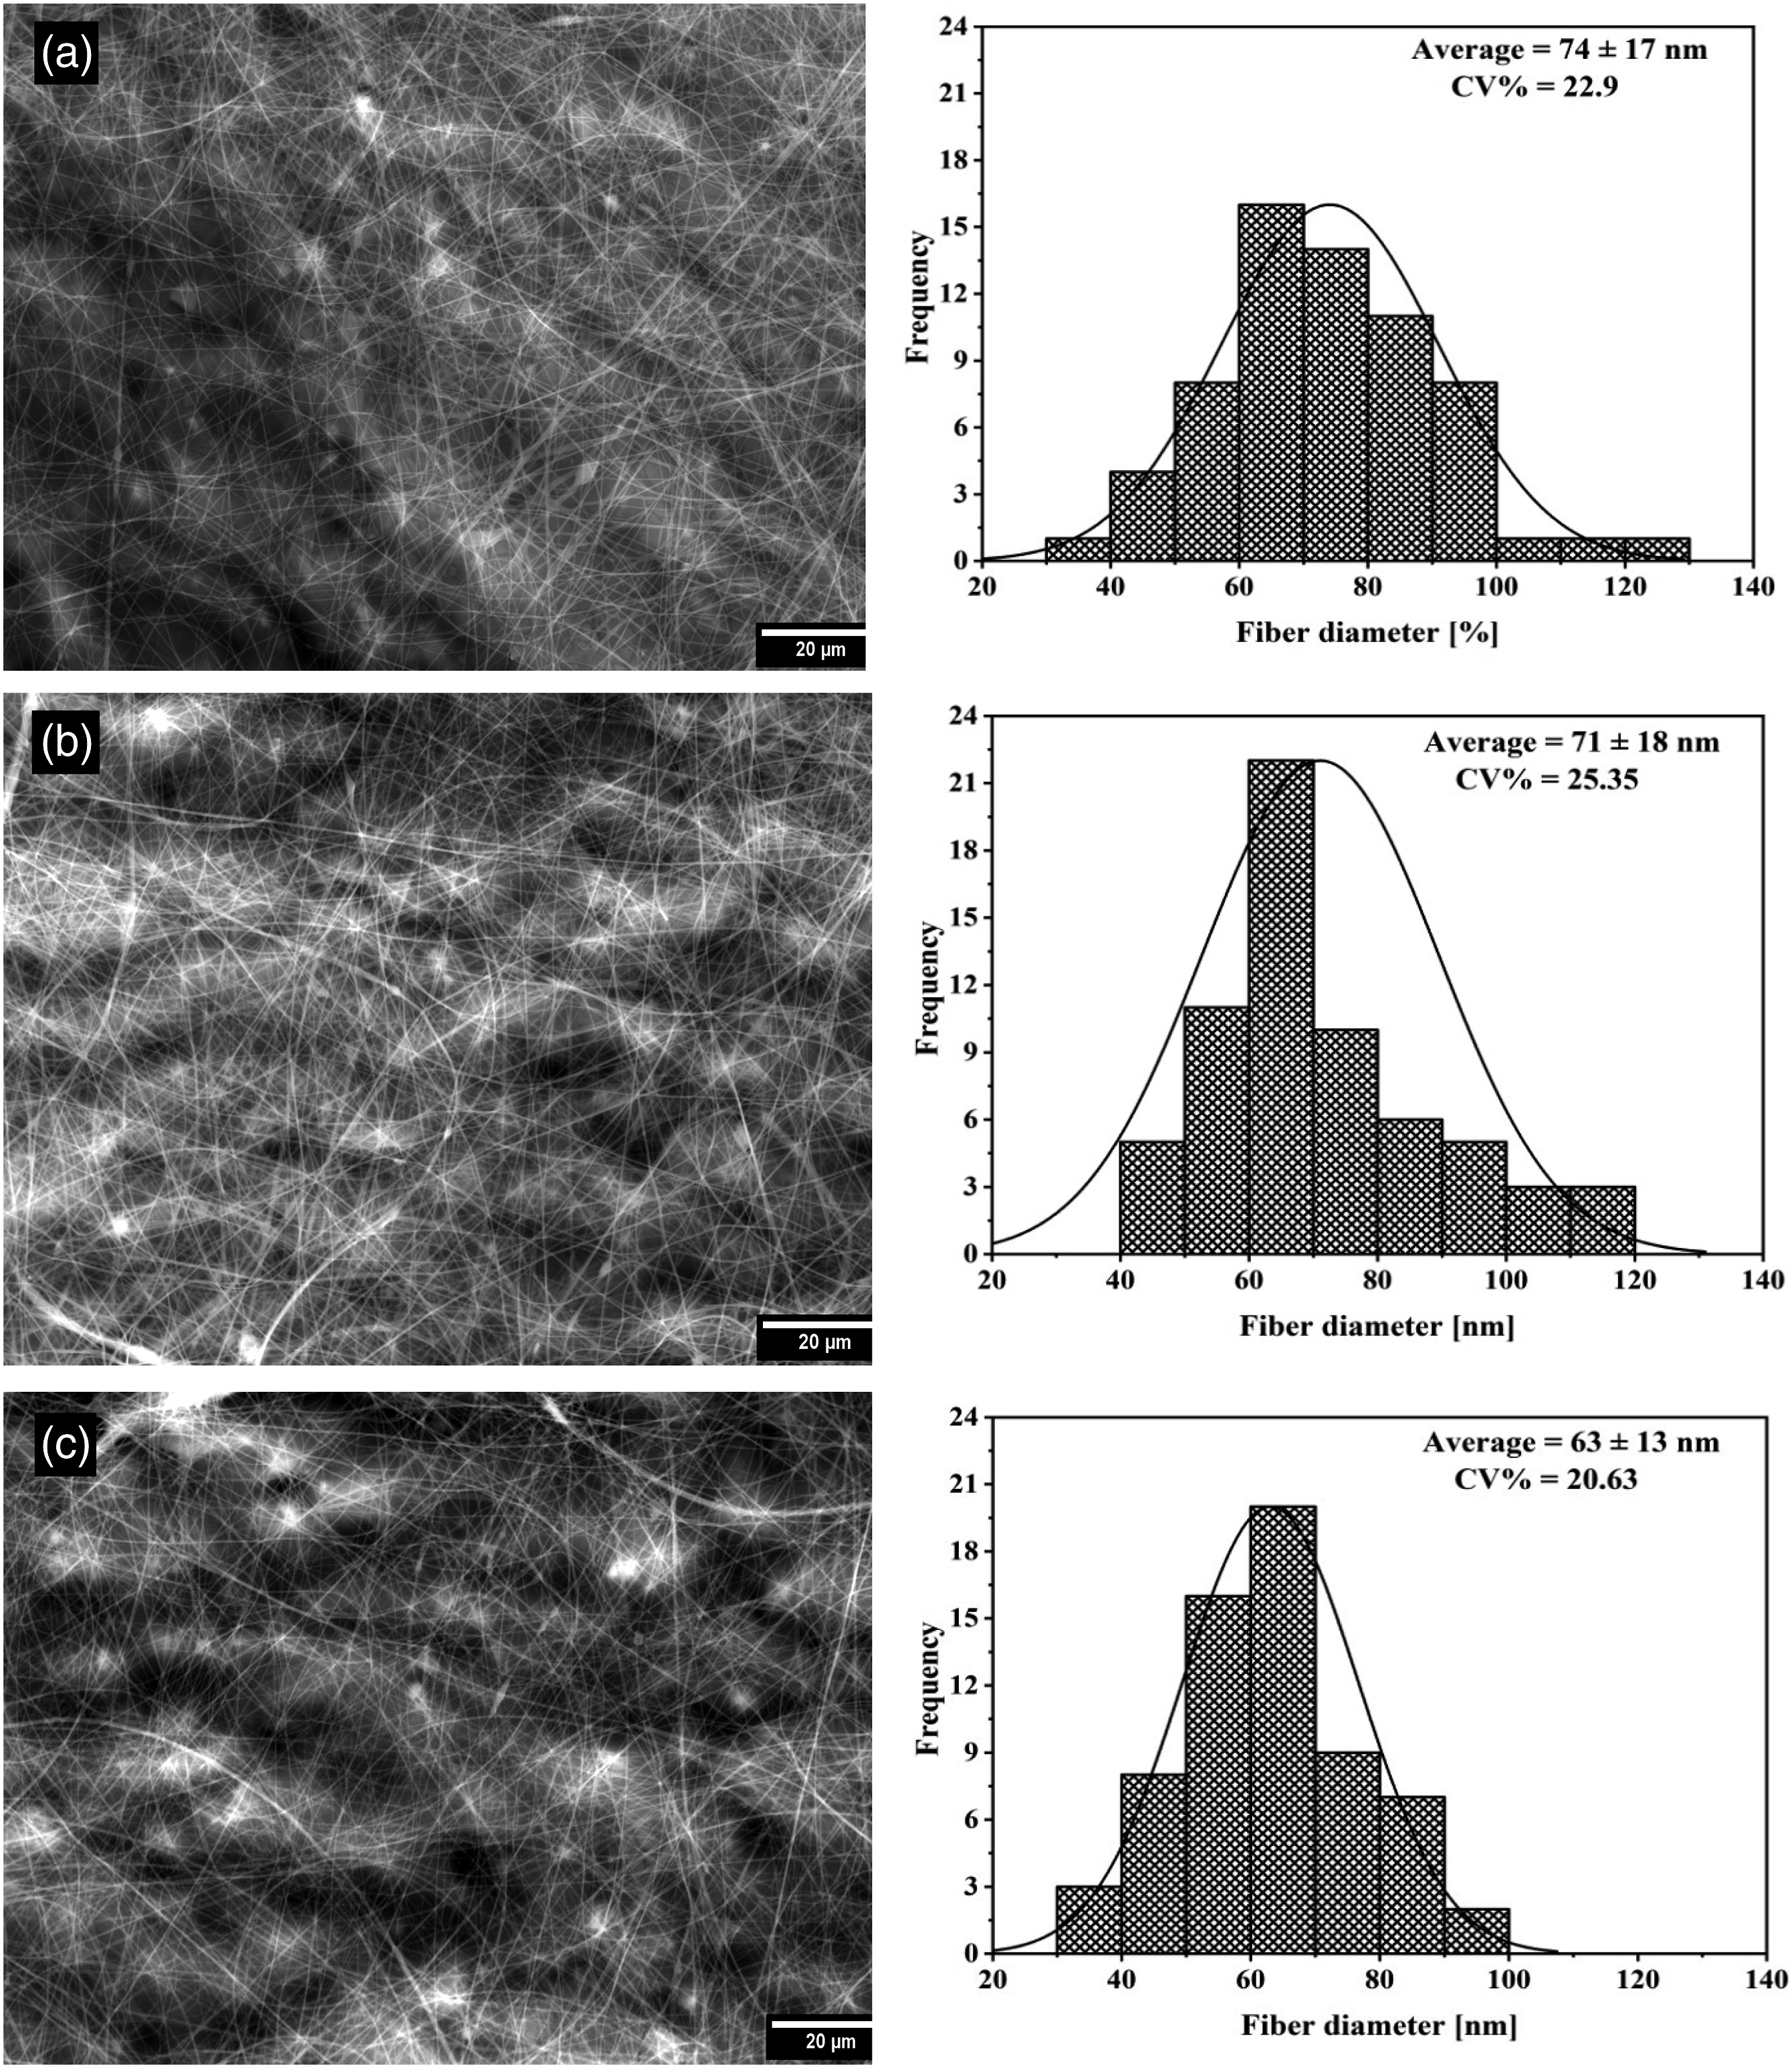
Conclusion
In the current investigation, aqueous acetic acid solutions were electrospun to create chitosan/PEO nanofibers. The electrospinning procedure for producing CS/PEO nanofibers was effectively optimised, and RSM statistical models were used to examine the impacts of various variables on the mean diameter and coefficient of variation CV% (homogeneity) of electrospun nanofibers. The main conclusions and findings of this study can be summed up as follows: 1- The diameter of CS/PEO nanofiber composite and CV % have been modeled by RSM. 2- Significant variables in the minimization of CS/PEO nanofibers diameter were the concentration of the electrospinning solution, applied voltage, spinning angle, and collector distance. 3- ANOVA analysis revealed that the model terms A, B, C, D, CD, A2, D2, were significant for the diameter of electrospun nanofibers, and the model terms (A, B, C, AB, AC, BC, B2, C2) were significant for the CV% of the diameter (homogeneity) of CS/PEO nanofibers. 4- The mathematical model of central composite design has minimum coefficient of determination (R2) of 0.965 for fiber diameter and 0.971 for CV%. 5- The conditions for obtaining the finest and most uniform CS/PEO fiber diameter as determined by the RSM model were CS/PEO polymer concentration = 2:1 (w/w), voltage = 25 kV, distance = 20 cm, and spinning angle = 45°, at which the average nanofiber diameter and homogeneity were estimated to be 73 nm and 20.5%, respectively. 6- The application of CS/PEO nanofibers has been found to be advantageous for future biological applications, such as the therapy of burn pain or hyperplastic scarring. 7- The possible biological activity of CS/PEO nanofibers (alone or after incorporation of suitable drugs) in improving wound healing will be investigated in normal and in diabetic experimental animals.
Footnotes
Declaration of conflicting interests
The author(s) declared no potential conflicts of interest with respect to the research, authorship, and/or publication of this article.
Funding
The author(s) received no financial support for the research, authorship, and/or publication of this article.