
Abstract
Demand for natural fibers has increased in recent years due to the requirement for biodegradable materials. Owing to the increasing awareness on the overuse and over-dumping of plastics in the environment, the current work focused on a solution by using tree leaves as a particulate reinforcement which is one of the common waste products of trees. In this regard, Norfolk pine (NOP) tree leaf particulates filled High-Density Polyethylene (HDPE) composites were fabricated through injection moulding technique with different filler weight % of 0, 10, 20, 30, 40, and 50 wt. %. The study of the crystalline structure of the fillers and the detection of functional compounds in the materials were carried out through X-ray diffraction (XRD) and Energy dispersive X-ray spectroscopic (EDX) analysis. Tensile strength, compressive strength, and flexural strength of the fabricated composite specimens were also assessed. Results revealed that the mechanical properties of the 30 wt. % pine tree leaf-filled HDPE composites were found to be superior when compared to pure HDPE composites. The failure surface morphology of the composite samples was examined using scanning electron microscopy (SEM). The melting point and decomposition of 30 wt. % NOP leaf particulate-filled HDPE composites specimen, whose mechanical properties were higher, were examined using thermo-gravimetric analysis (TGA) and differential scanning calorimetry (DSC). From the results, it was found that NOP fillers can be used as an effective reinforcement in polymer composites.
Keywords
Introduction
As global plastic wastage is increasing at an alarming rate of around 380 million tonnes every year, there is a high need to reduce the utilization of plastic-based materials and new ways to promote the use of natural materials without compromising the material strength.1,2 As a result, natural fibre reinforced polymer composites with fibre particulates as filler have been developed.3–5 Natural fibres are gaining popularity as reinforcing materials not only in thermosetting composites but also in thermoplastic polymer composites. Natural fibres or filler materials derived from renewable sources have the potential to serve as biodegradable and biocompatible reinforcements in the polymer sector and also as an alternative to glass or carbon fibre. Natural fibres are made up of cellulose and lignin; celluloses are made up of numerous fibrils that are linked together by hydrogen bonds to provide strength and flexibility.6–8 Hence particulates derived from natural fibre are quite obviously eco-friendly materials.9–11 Natural fibres provide the some benefits including high specific strength, cheaper cost, lightweight, biodegradability, renewable nature, lack of health dangers, capability of modification of fibre surface and high non-abrasiveness.12–14 This opened doors for the natural fiber composites for their applications in packaging, defence, automotive, sporting goods, aerospace, marine, building and furniture-based industries.15–18
Many researchers were carried out in natural fiber and natural filler reinforced polymer composites to assess various properties of the composites. Tensile strength of the hemp fiber reinforced polymer composites was assessed and found that tensile strength of the composites is found in range between 200 MPa to 250 MPa. In addition, it is also found that tensile strength of the jute fiber based polyhydroxybutyrate composite gets increased by 130–150% compared to the pure matrix composites.19,20 The addition of an ideal quantity of filler material improves the characteristics of these composite materials even more. Combining natural and synthetic fibres increased the qualities of natural fibres. In comparison to natural composite materials, hybrid composite materials have a higher strength.21–23 The tensile strength and other mechanical properties of these fibres have been compared to synthetic fibres such as glass or carbon fibres in several studies. However, the temperature stability of polymers limits their extensive use and remains an issue to be addressed.24–26
Few previous experimental trials were carried out on pine needles as reinforcement in polymer composites. The experimental results reveald that when urea-formaldehyde resin was used as a matrix with Pine needles as reinforcement, mechanical characteristics such as tensile strength, compressive strength, and wear resistance improve significantly. Furthermore, particulate reinforcement was found to be more effective than short and long fibre reinforcements. These findings showed that pine needles might be a good candidate for natural fibre reinforced polymer composites.27–29 Characteristics of pineapple leaf powder reinforced epoxy composites has been studied. It was found that tensile strength, tensile modulus, flexural strength, abrasion resistance, and hardness of the composites increased as the filler content increased. For all of the filler contents studied, elongation at break for pineapple leaf powder reinforced epoxy composites decreased as the filler quantity increased. The elongation at break of pineapple leaf powder reinforced epoxy composite reduced by 2.39% and 10.28% at 2% and 10% by weight of filler contents respectively. This result was used to decide the ratio of filler to be added to the matrix and it should be limited in between 0% and 50%30–32 Properties of the epoxy and pine leaves (powdered and needles) composites were investigated and stated that along with natural resins, average resilient energy of the composites improved due to pine leaves reinforcements.
Tensile strength of pine needles and their potential for use in composites has been investigated. 33 However, the strength values were found to range between 15 and 65 MPa, with mean values decreasing only slightly from 33.40 MPa for the 50 mm gauge length to 31.41 MPa for the 100 mm case, demonstrating that the mean value of tensile strength is gauge length independent and pine needles have lower tensile properties than their counterparts such as coir, coconut fibre, hemp, and so on. Pine leaves, on the other hand, are the cheapest and most readily available bio waste, and they have a growing demand, which is a requirement in current research. Qualities of HDPE changed as a result of several methods, and found that injection moulding yields samples with better mechanical properties than compression moulding. The yield strength values found, for instance, were 24.5 MPa and 22.3 MPa, respectively. Injection moulded samples had a higher degree of crystallinity (80.15%), which explains why they had a higher strength than compression moulded samples (74.84%). This indicates that the sample be processed using the injection moulding technique.34–36 Some results based on Palm fibre and the addition of other fibres also point to the usage of multi-fiber composites for a matrix, which have increased mechanical properties, particularly flexural strength. 37
Natural fibre of rice straw combined with HDPE under mechanical testing, with the results indicating that the wood plastic composite eliminates termite and insect problems that are common in natural wood materials. When the percentage of fibre in wood plastic composite was increased to 50%, the tensile strength was dramatically lowered, while the percentage of water absorption increase with the percentage of fibre content. This has set a restriction on the amount of filler to a maximum of 50% to avoid issues like hydrophilicity, strength loss, and so on.38–40 Owing to the better behaviour of pine tree-based reinforcements, a new filler from the same pine family called Norfolk Pine was adopted in the current study and HDPE matrix was used.41–43 In the current research, Norfolk pine tree leaves has been selected as it has low density, abundance and offer specific mechanical properties compared to glass fibres. The goal of this study is to create a composite material from bio-waste that can be turned into acceptable biomaterial for a vareity of applications. Injection moulding was used to fabricate the NOP-HDPE composite specimens. Field emission scanning electron microscope was also used to evaluate interfacial adhesion on the surface and failure surface morphology of the composites. Mechanical and thermal properties of Norfolk filler reinforced HDPE composites were then determined for various filler concentrations.
Materials and experimental methods
Extraction of fillers and Preparation of composite specimen
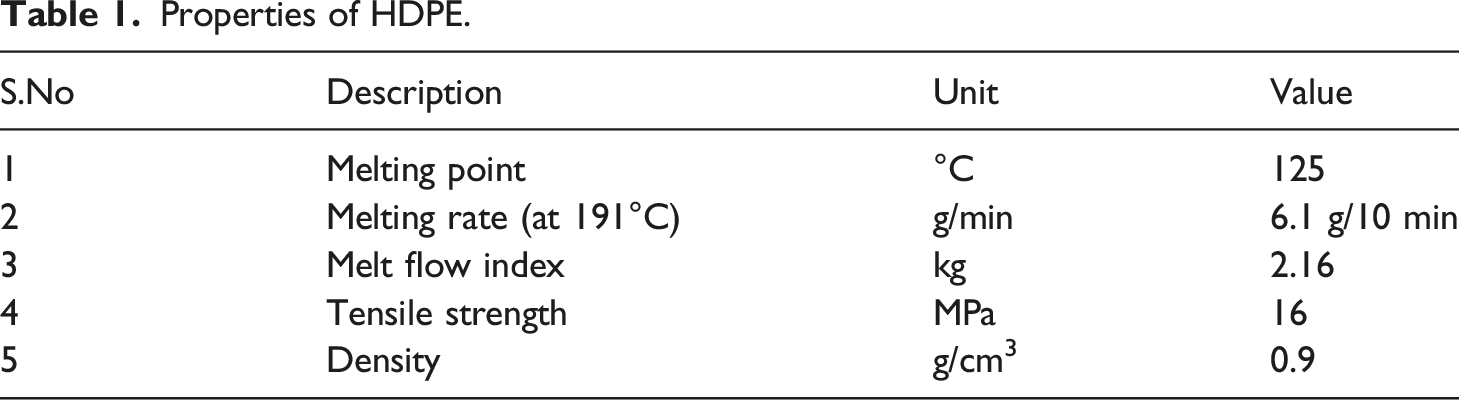
Properties of HDPE.
Norfolk pine tree leaf particulates used as fillers are shown in Figure 1. NOP particluates contain 57% of cellulose, 31% of hemicellulose, 9% of lignin and remaining wax, pectin and others. NOP leaves were collected and allowed to dry under sunlight for 7 days continuously by keeping them in a container to make them deviod of moisture content. After complete drying, they were ground to smaller size with almost unifomr particle size using a flour grinder and a planetray ball mill. Then they were sieved to obtain a uniform particle size of less than 100 nm. This process is repeated 2 to 3 times until the NOP powders were obtained as very fine powders. These powders were used as reinforcements in HDPE matrix to manufacture NOP/HDPE composites. (a) NOP Tree Leaves (b) Dried NOP leaves (c) NOP Fillers.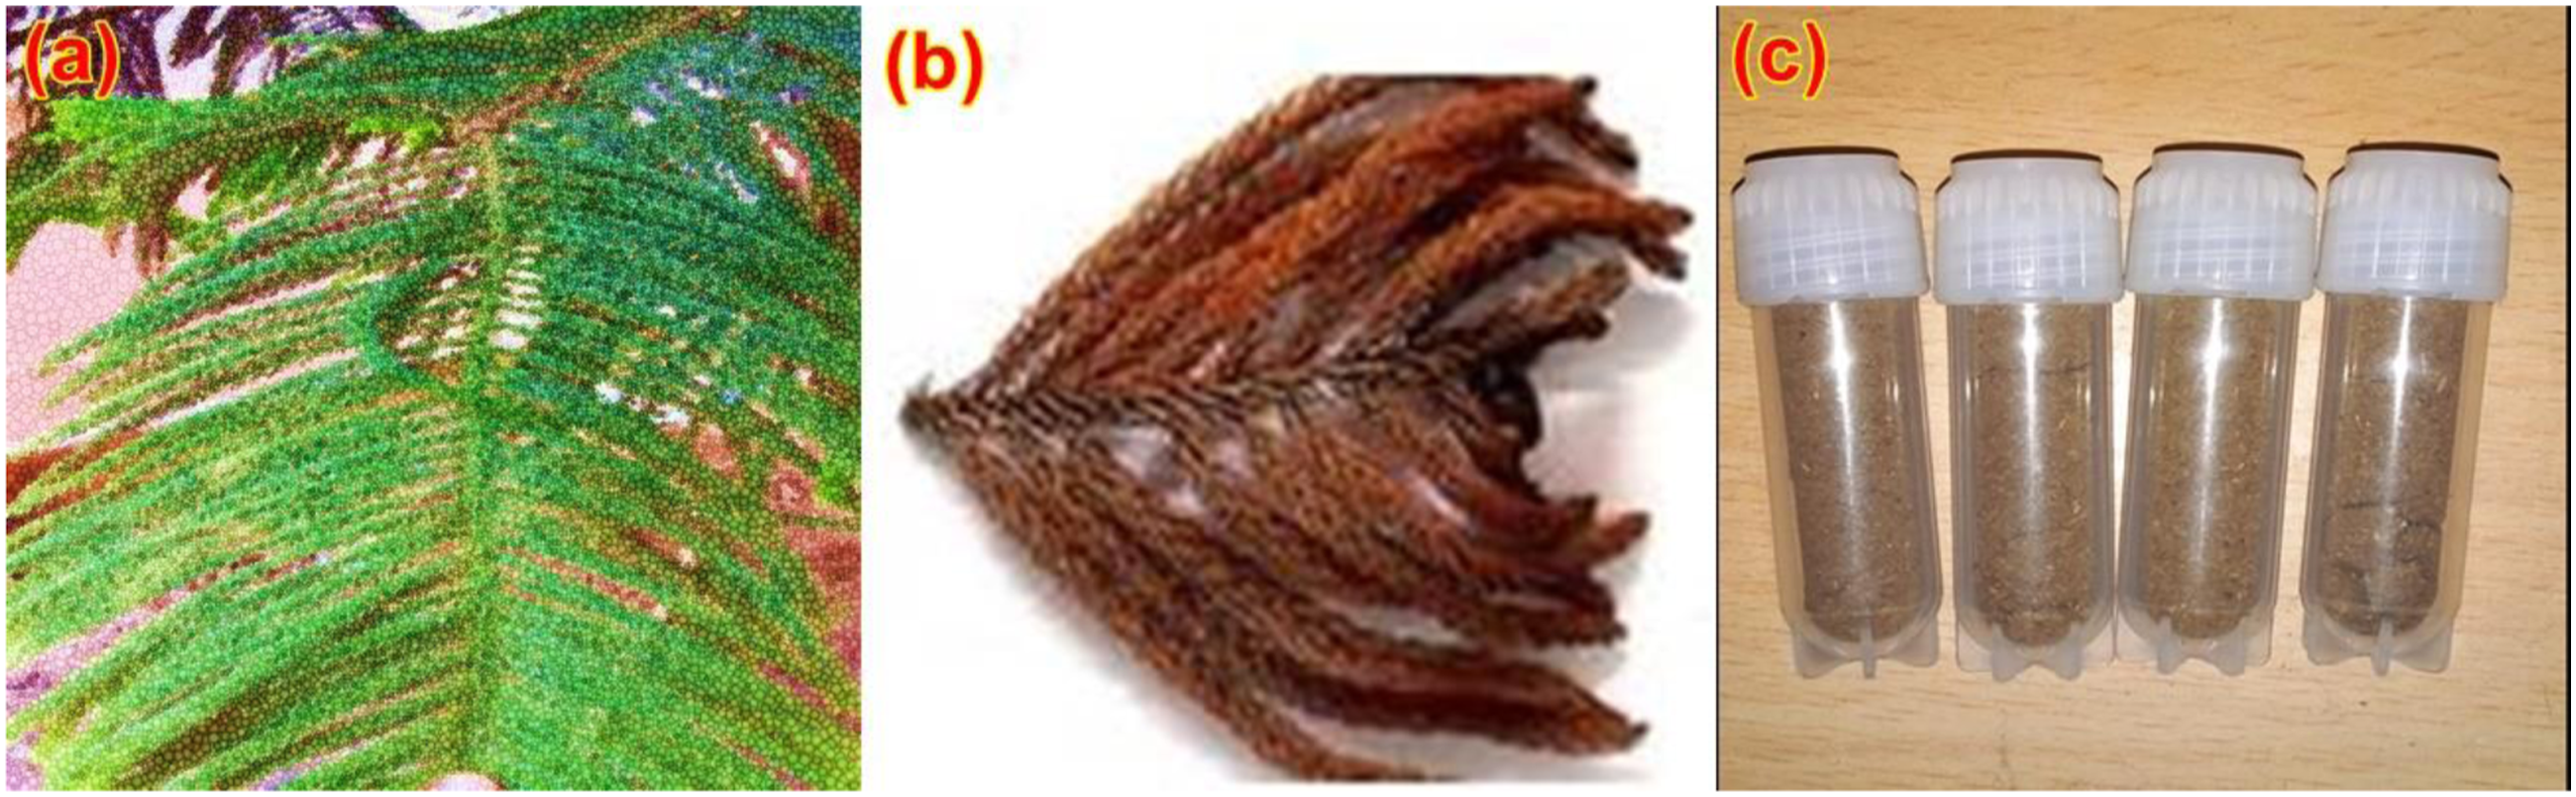
Weight fraction of the NOP fillers were varied in between 10 wt. % and 50 wt. % at 10 wt. % intervals and were mixed with appropriate quantities of HDPE polymers. The mixer was poured in the heating chamber and heated in between 135 and 140°C to reach semi melting condition of NOP filled HDPE mixture. The semi melted mixture was then fed into die cavity through nozzle passage by applying the required pressure of 600 MPa into an automatic injection moulding machine of Nissei make (Model: FE80). Injection moulding dies were manufactured with two specimen moulds using EN8 steel material. The fabricated composite specimen were removed from the die and cured at room temperature to use them for further testing [14, 15].
XRD and EDX analysis
NOP leaves were characterized using XRD analysis to determine their crystallinity index (CI) and crystallite size (CS). It is a simple non-destructive testing method (NDT) which renders diffraction peaks as a result of interference of X-rays with NOP powders. XRD analysis was carried out in an XRD machine of Bruker make (Model: D8 advance) with CuKα radiation source having the X-ray wavelenth as 0.154 nm, working voltage and current as 40 kV and 35 mA respectively. NOP leaves were scanned with a Bragg’s angle (2θ) range of 10° to 80° to obtain the standard diffraction peaks. From the obtained peaks, CI of NOP powders were calculated using the following equation (1)15,44
Mechanical properties
In order to evaluate the mechanical properties of NOP/HDPE composites, tensile, compressive and flexural tests were carried out. All the tests were carried out in an Universal testing machine (UTM) (Make: Aimil) with 1000 kN load capacity. Tensile tests were carried out adopting ASTM D3379 standard with a specimen length of 250 mm, width of 25 mm. Tensile tests were carried out at room temperature with a relative humidity of around 65% and a cross head speed of 1.2 mm/min. Similarly, compressive tests were carried out according to ASTM D3410 standards with a specimen having 155 mm length and 25 mm width in the UTM. Shear load was applied to the longitudinal cross section of the specimen using a hydraulic jaw attachment. Flexural tests were carried out using three point bending method in the same UTM using flexural test attachement conforming to ASTM D790 standards. A transverse load was applied on the specimen until the breakage to evaluate its flexural strength. In all the mechanical proeprties, a total of three specimens were used and the average three values were taken for final analysis.
Thermal properties
The best composition of NOP/HDPE composites identified from mechanical tests were then subjected to thermal properties testing trough TGA and DSC. TGA was used to analyze the thermal stability of NOP/HDPE composites while DSC was used to detertmine their melting and crystallization behaviour. TGA was carried out in an apparatus of Perkin-Elmer make (TGA500 model) according to ASTM D3171 with a NOP/HDPE composite sample weight of 8–10 g. Temperature was varied between 10°C – 550°C at a heat flow rate of 10ºC/min in an nitrogen atmosphere. Mass loss of the samples were estimated at regular intervals which depicts the thermal stability of the composites. Similarly, DSC was carried out in Perkin-Elmer apparatus (DSC seven model) in which the samples were heated in between 10°C and 650°C at a heating rate of 10 ºC/min in an nitrogen atmosphere. Test was carried out as per ASTM D3418 standards. Around 8–10 g of composite sample was placed in a scan holder and they were heat scanned until the amorphous and crystalline regions undergo a significant thermal deformation. A single cycle of heating was performed assuming that the composites had no thermal history.
Results and discussion
Characterization fillers and composites
X-Ray Diffraction (XRD) Analysis
X-Ray Diffraction Analysis of NOP particulates is shown in Figure 2 which shows the crystalline peak at 2θ = 18.74° with corresponding miller indices as (1 1 0) and amorphous minimum intensity at 2θ = 21.67° peaks present in the particulates. As per the analusis made by few earlier researchers, miller indices value of crystalline peak should be (1 1 0).45,46 Major peak correspond to crytalline cellulose material while the minimum in intensity (with unit cell as (2 0 0)) correspond to amorphous hemicellulose, lignin and wax. Generally, diffractions from amorphous elements results in broader peaks which could be evidently seen from the figure.47,48 Based on the prominent diffraction peak data, CI of the NOP fillers were calculated to be 67%. Due to the presence of large quantity of cellulose in NOP particulates, CI value is also higher. Though higher value of CI results in brittleness, the strength of the composites in which the particulates are reinforced woud also be high. It could be noted that the CI of NOP particulates were more alike the other natural fibers like jute, sisal, Typha fibers.27,35,49 By using equation (2), CS of the NOP particulates were calculated to be 27.25 nm. It could be noted that the CS of other natural fillers like Pithecellobium dulce (24.1 nm)
50
were similar to the NOP particulates. XRD Peaks of NOP leaves.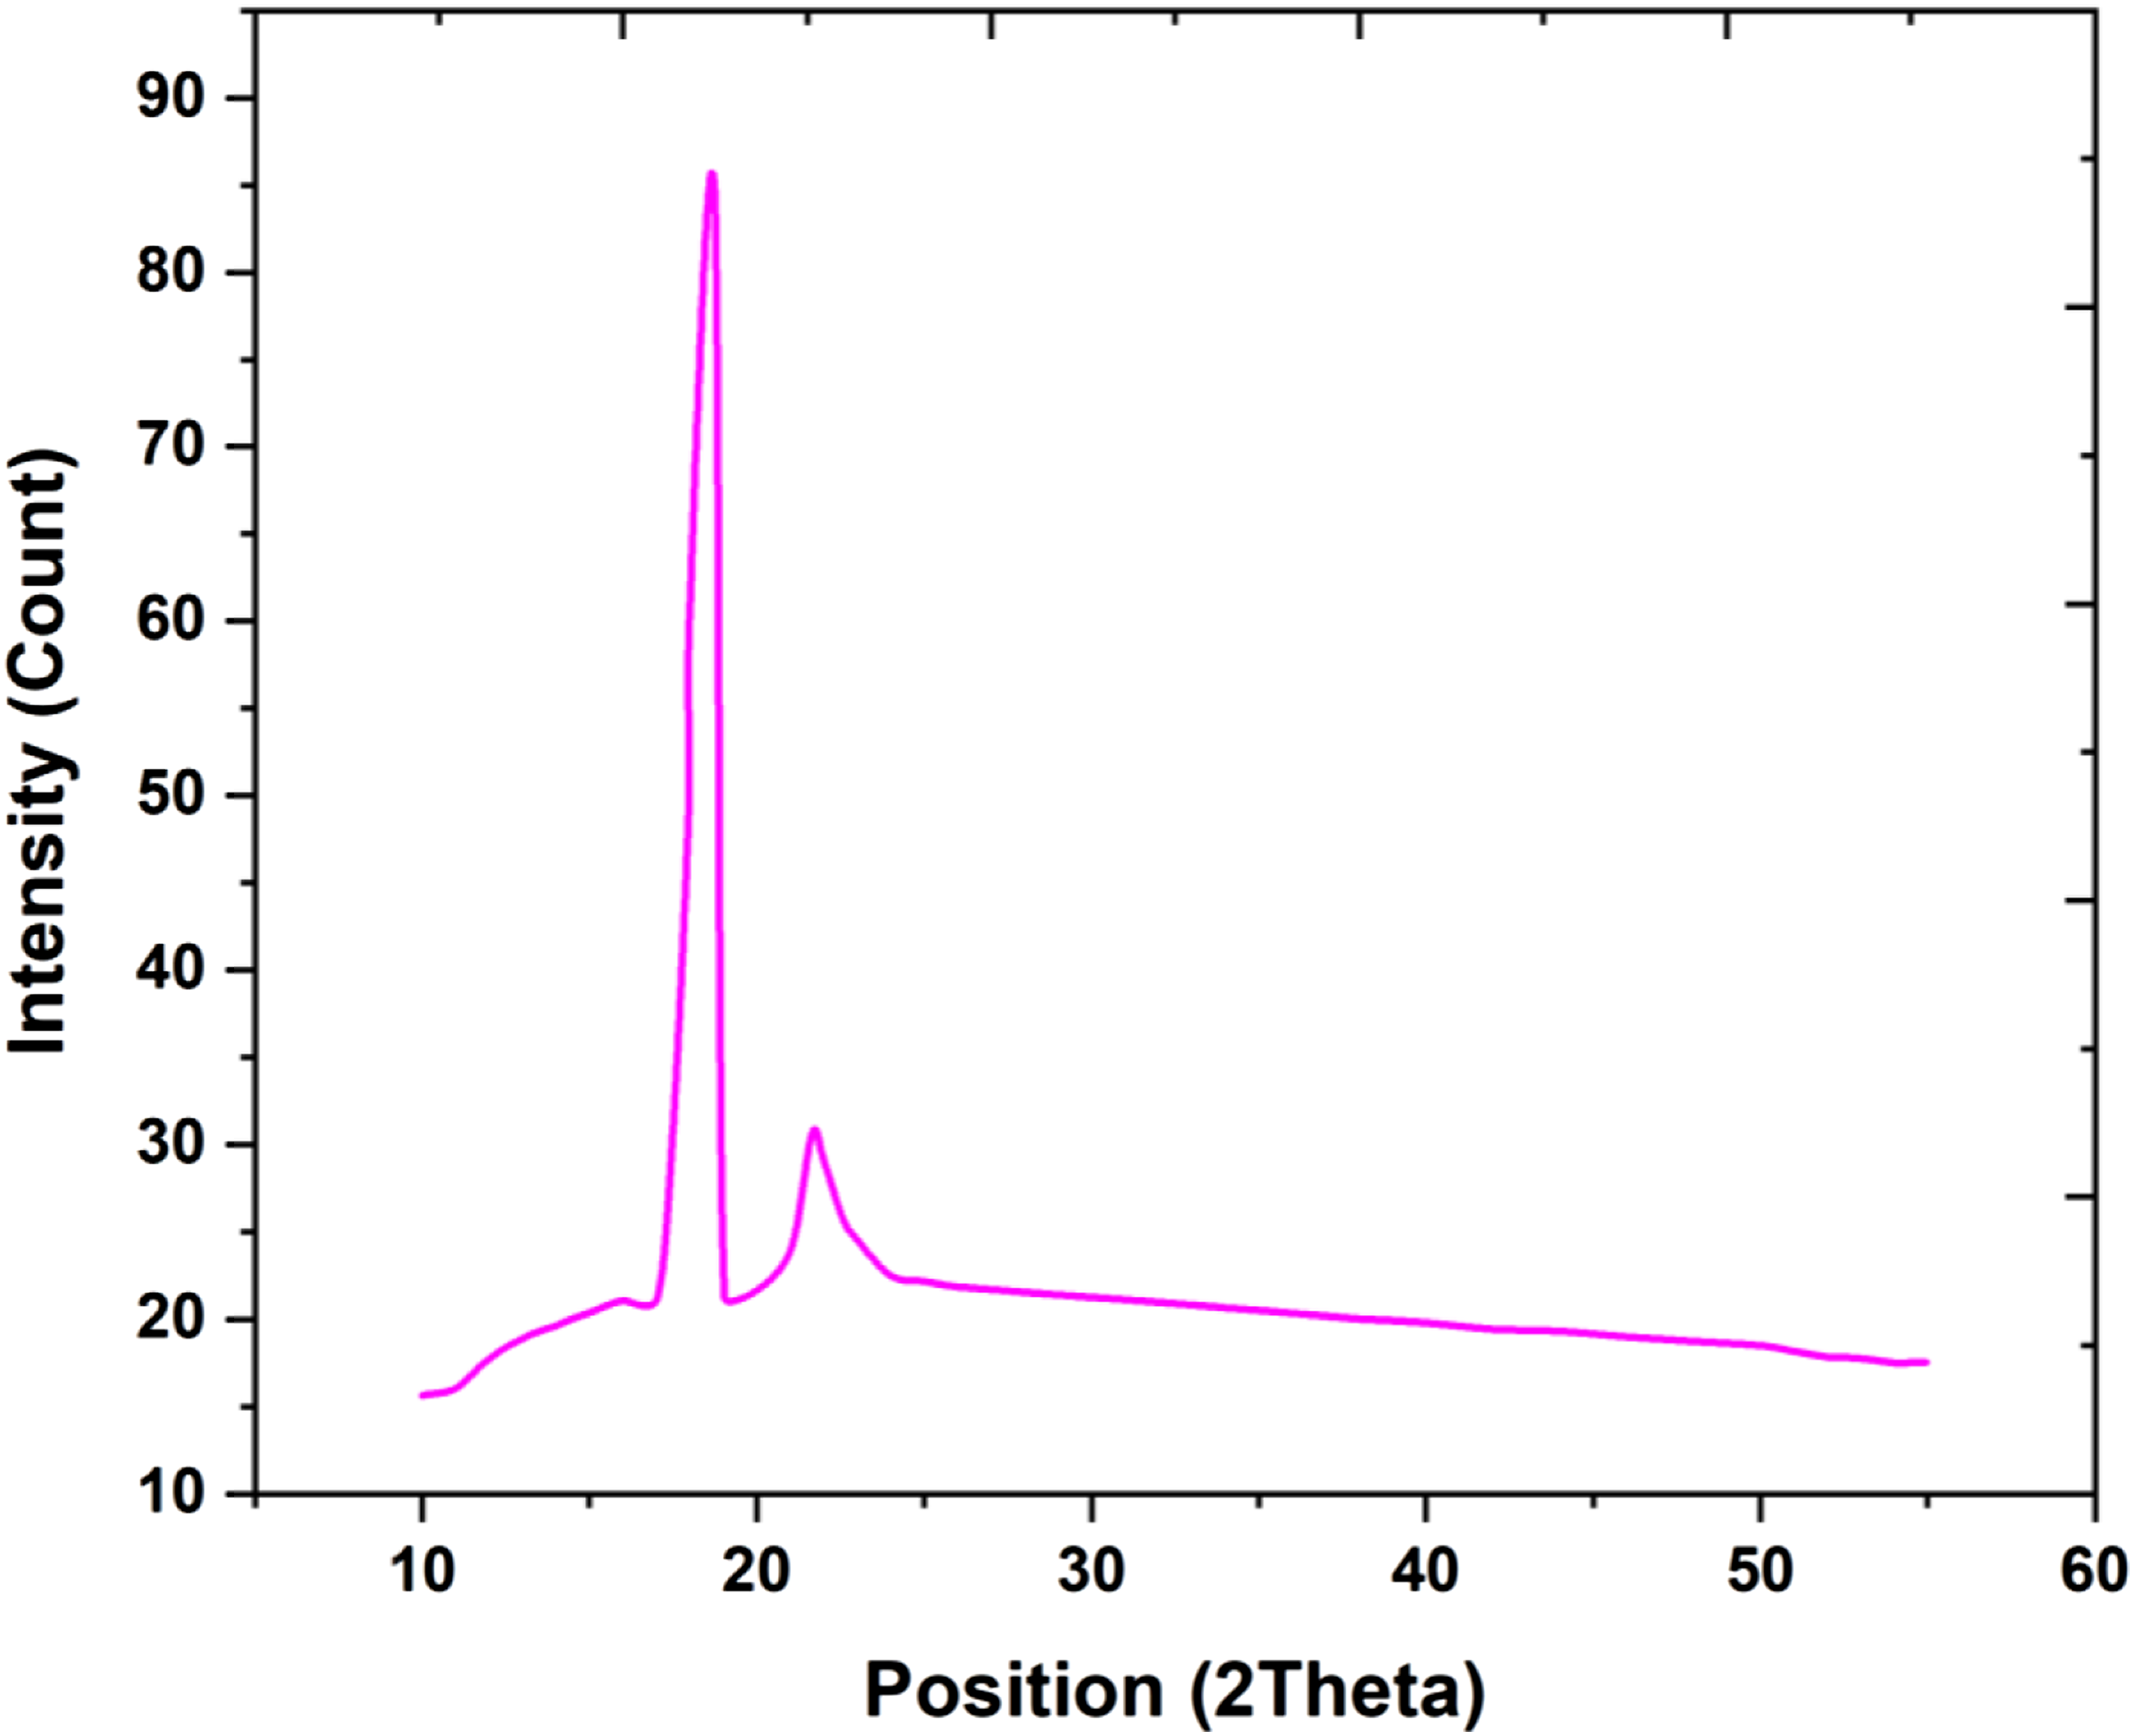
Energy dispersive spectroscopy (EDS) analysis
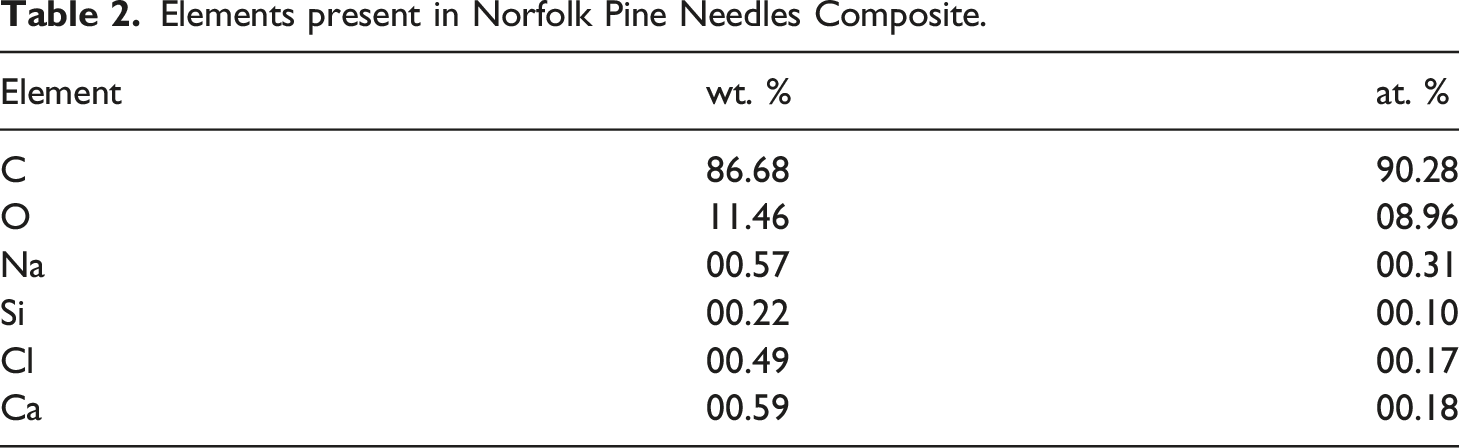
The energy dispersive spectrums of the NOP particulates filled HDPE composite are shown in Figure 3. Higher carbon content is observed in the spectrum along with other minor elements. EDS spectra of NOP/HDPE composites.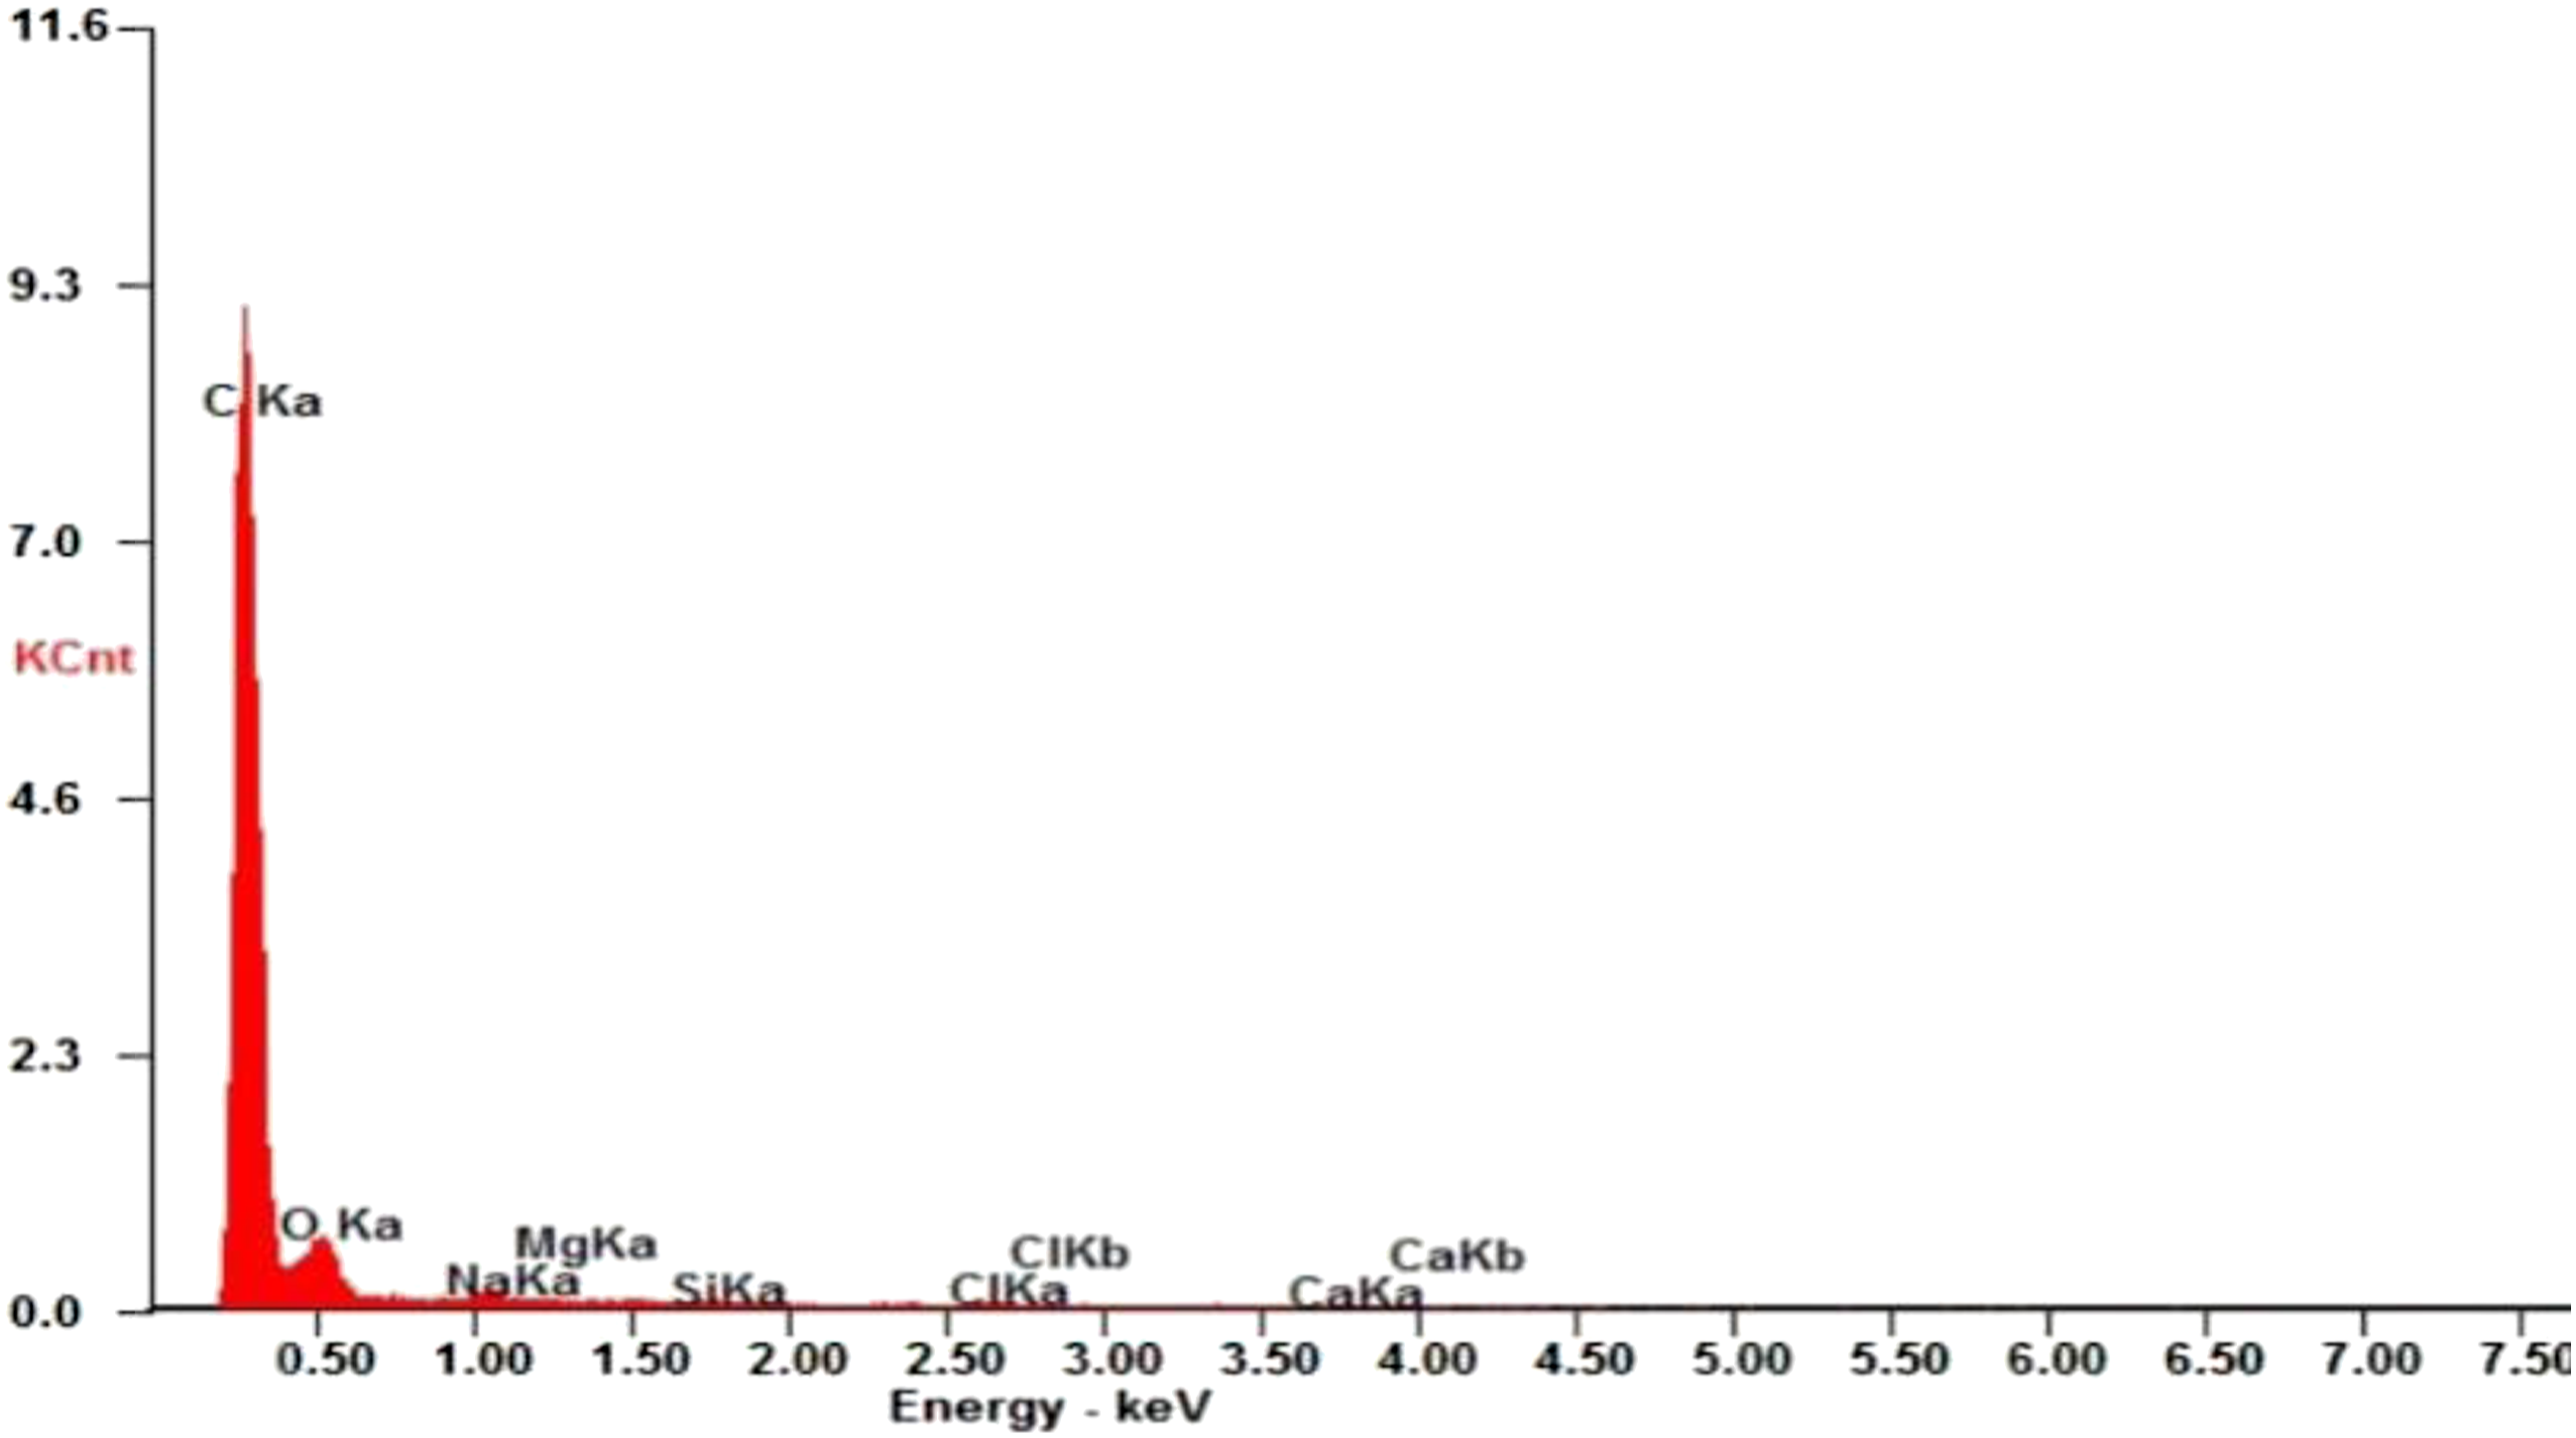
Elements present in Norfolk Pine Needles Composite.
Surface morphology of composite
Field emission scanning electron micrographs revealed the pine tree leaf particulate dispersion in the high-density polyethylene composite specimens as displayed in Figure 4. To improve the conductivity of the samples, the cubic samples of side 3 mm side were placed on gold sputtered stubs. The morphology of pine tree leaf particles that were filled in HDPE composite portrays a grey colour background representing the HDPE matrix, while the metallic silver dazzling hue represents the NOP fillers. No agglomeration or crater formation were observed in the NOP/HDPE composite. Few visible craters were presenting in the morphology depicting the setting of HDPE before filling the voids. SEM morphology of NOP/HDPE Composite.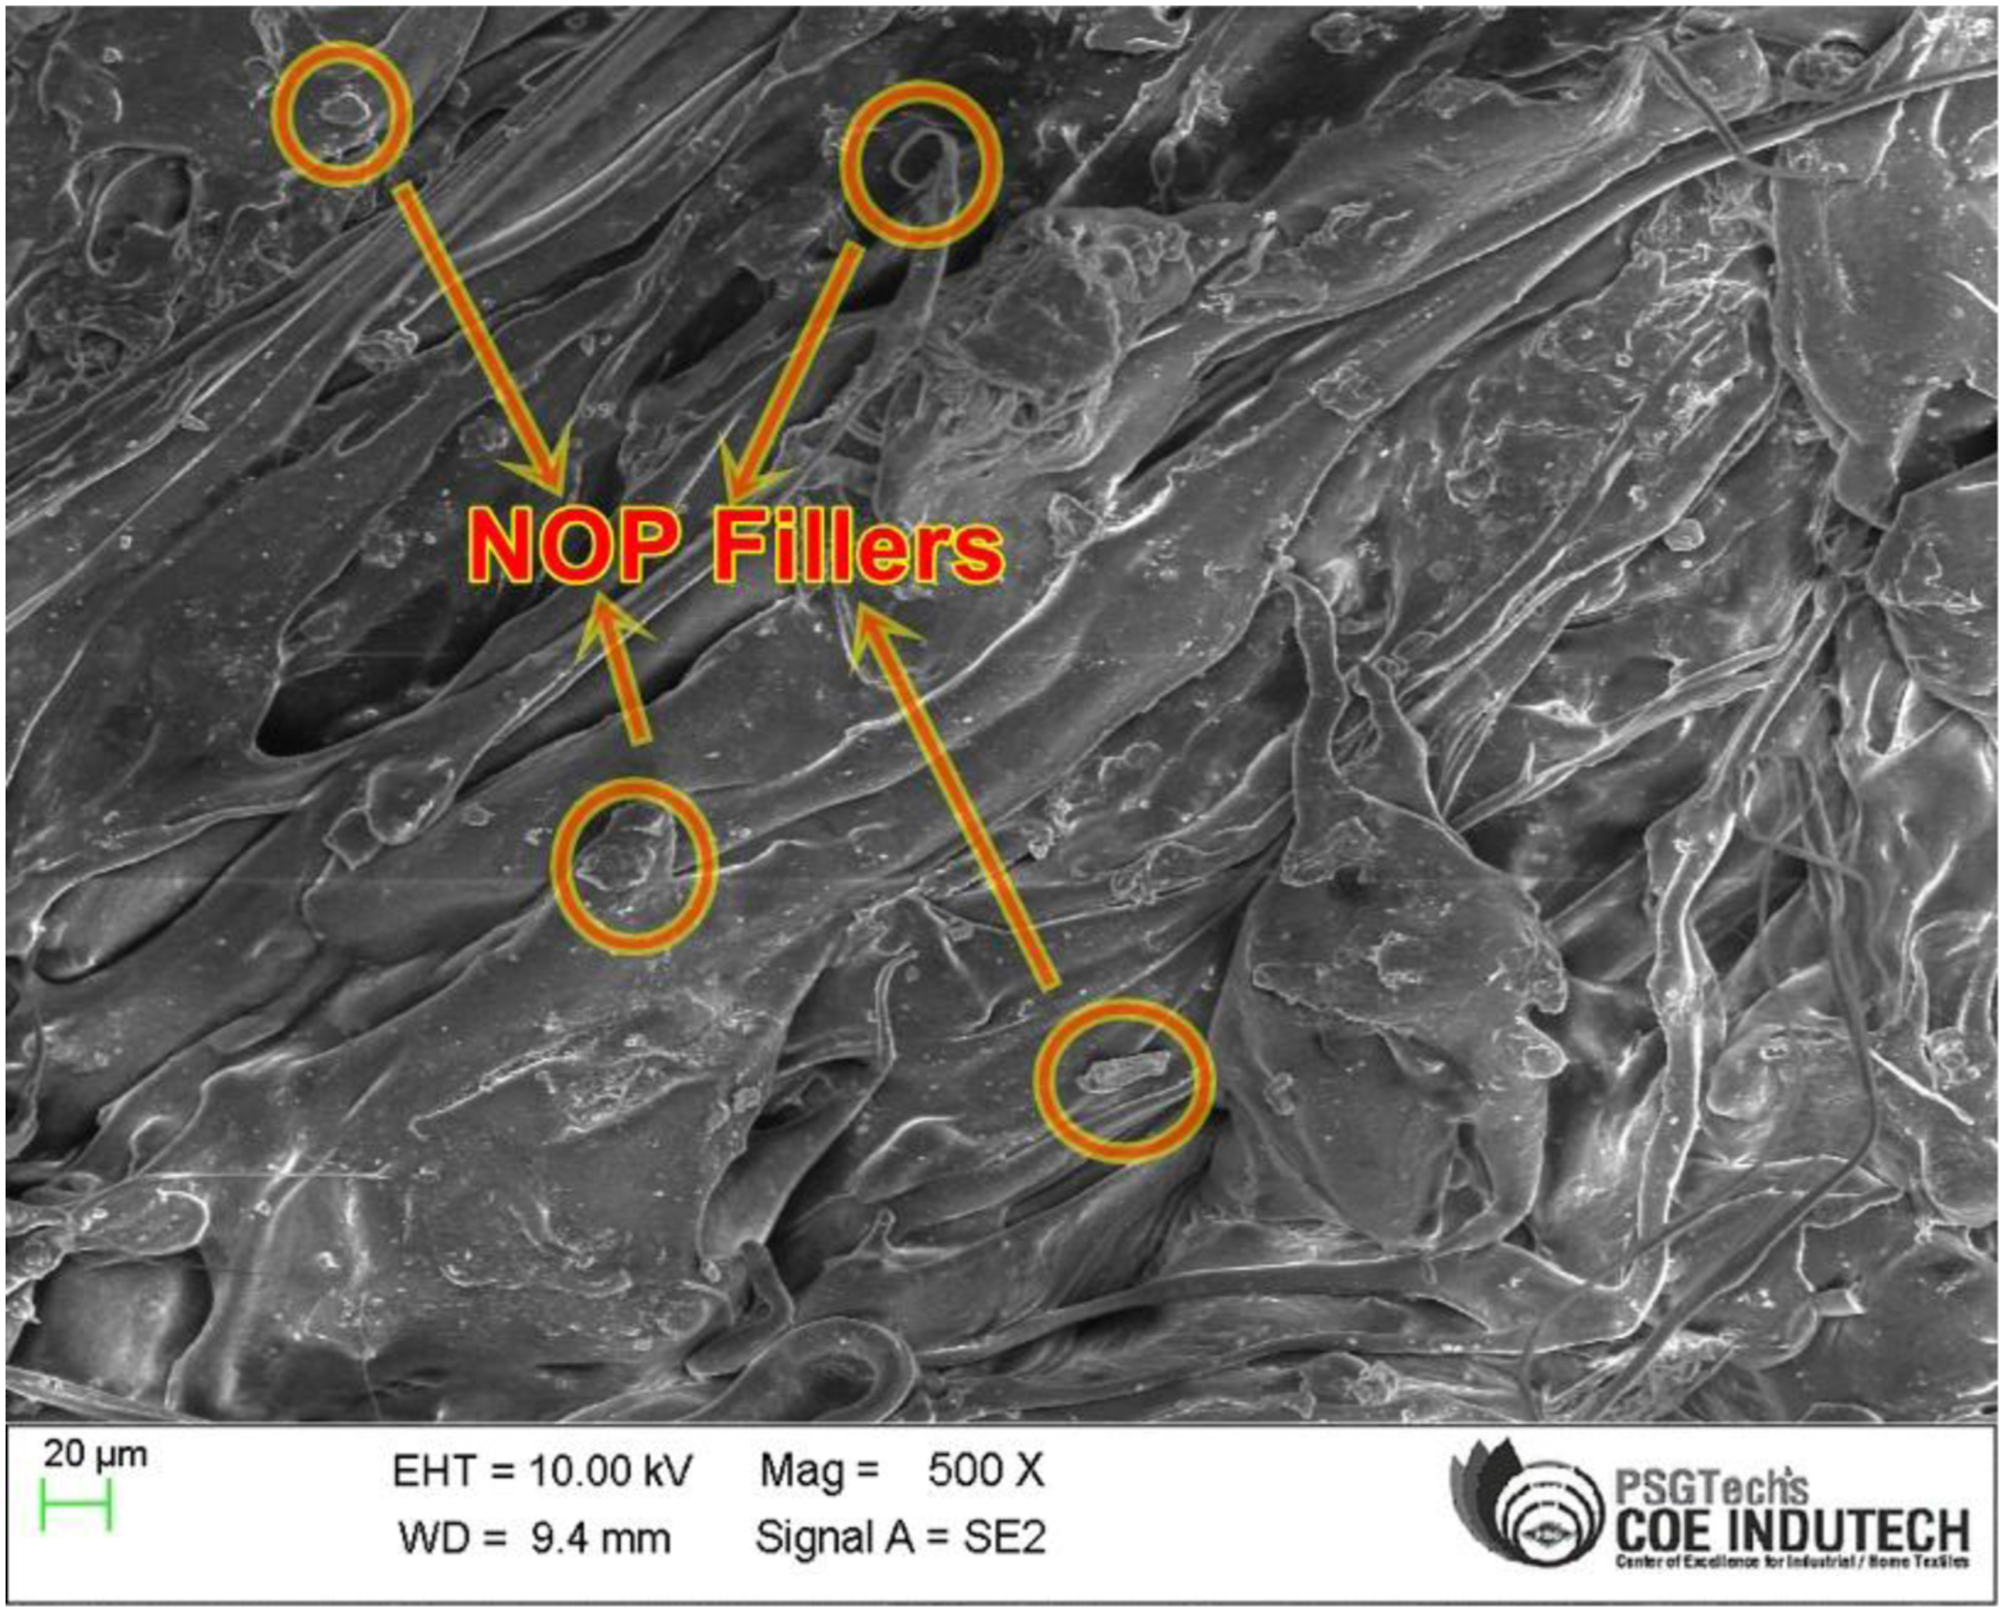
Mechanical Properties
Tensile Strength
The tensile test was performed as per for different weight fraction of NOP/HDPE composite specimens (0, 10, 20, 30, 40, 50 wt. %) and compared as shown in Figure 5. Tensile strength of the composites increased up to 30 wt. % NOP/HDPE composite, after which the specimen’s tensile strength gradually drops due to the material’s brittleness and low wettability. The tensile strength of a 30 wt. % NOP/HDPE composite specimen was raised from 12 MPa for pure HDPE to 18.52 MPa. Effective stress transfer would have occurred at this composition due to the availability of fillers for effective load carrying. After that tensile strength reduced due to agglomeration of fillers within the HDPE matrix. (a) Tensile strength for NOP/HDPE Composite. (b) Elongation at break values for NOP/HDPE composite.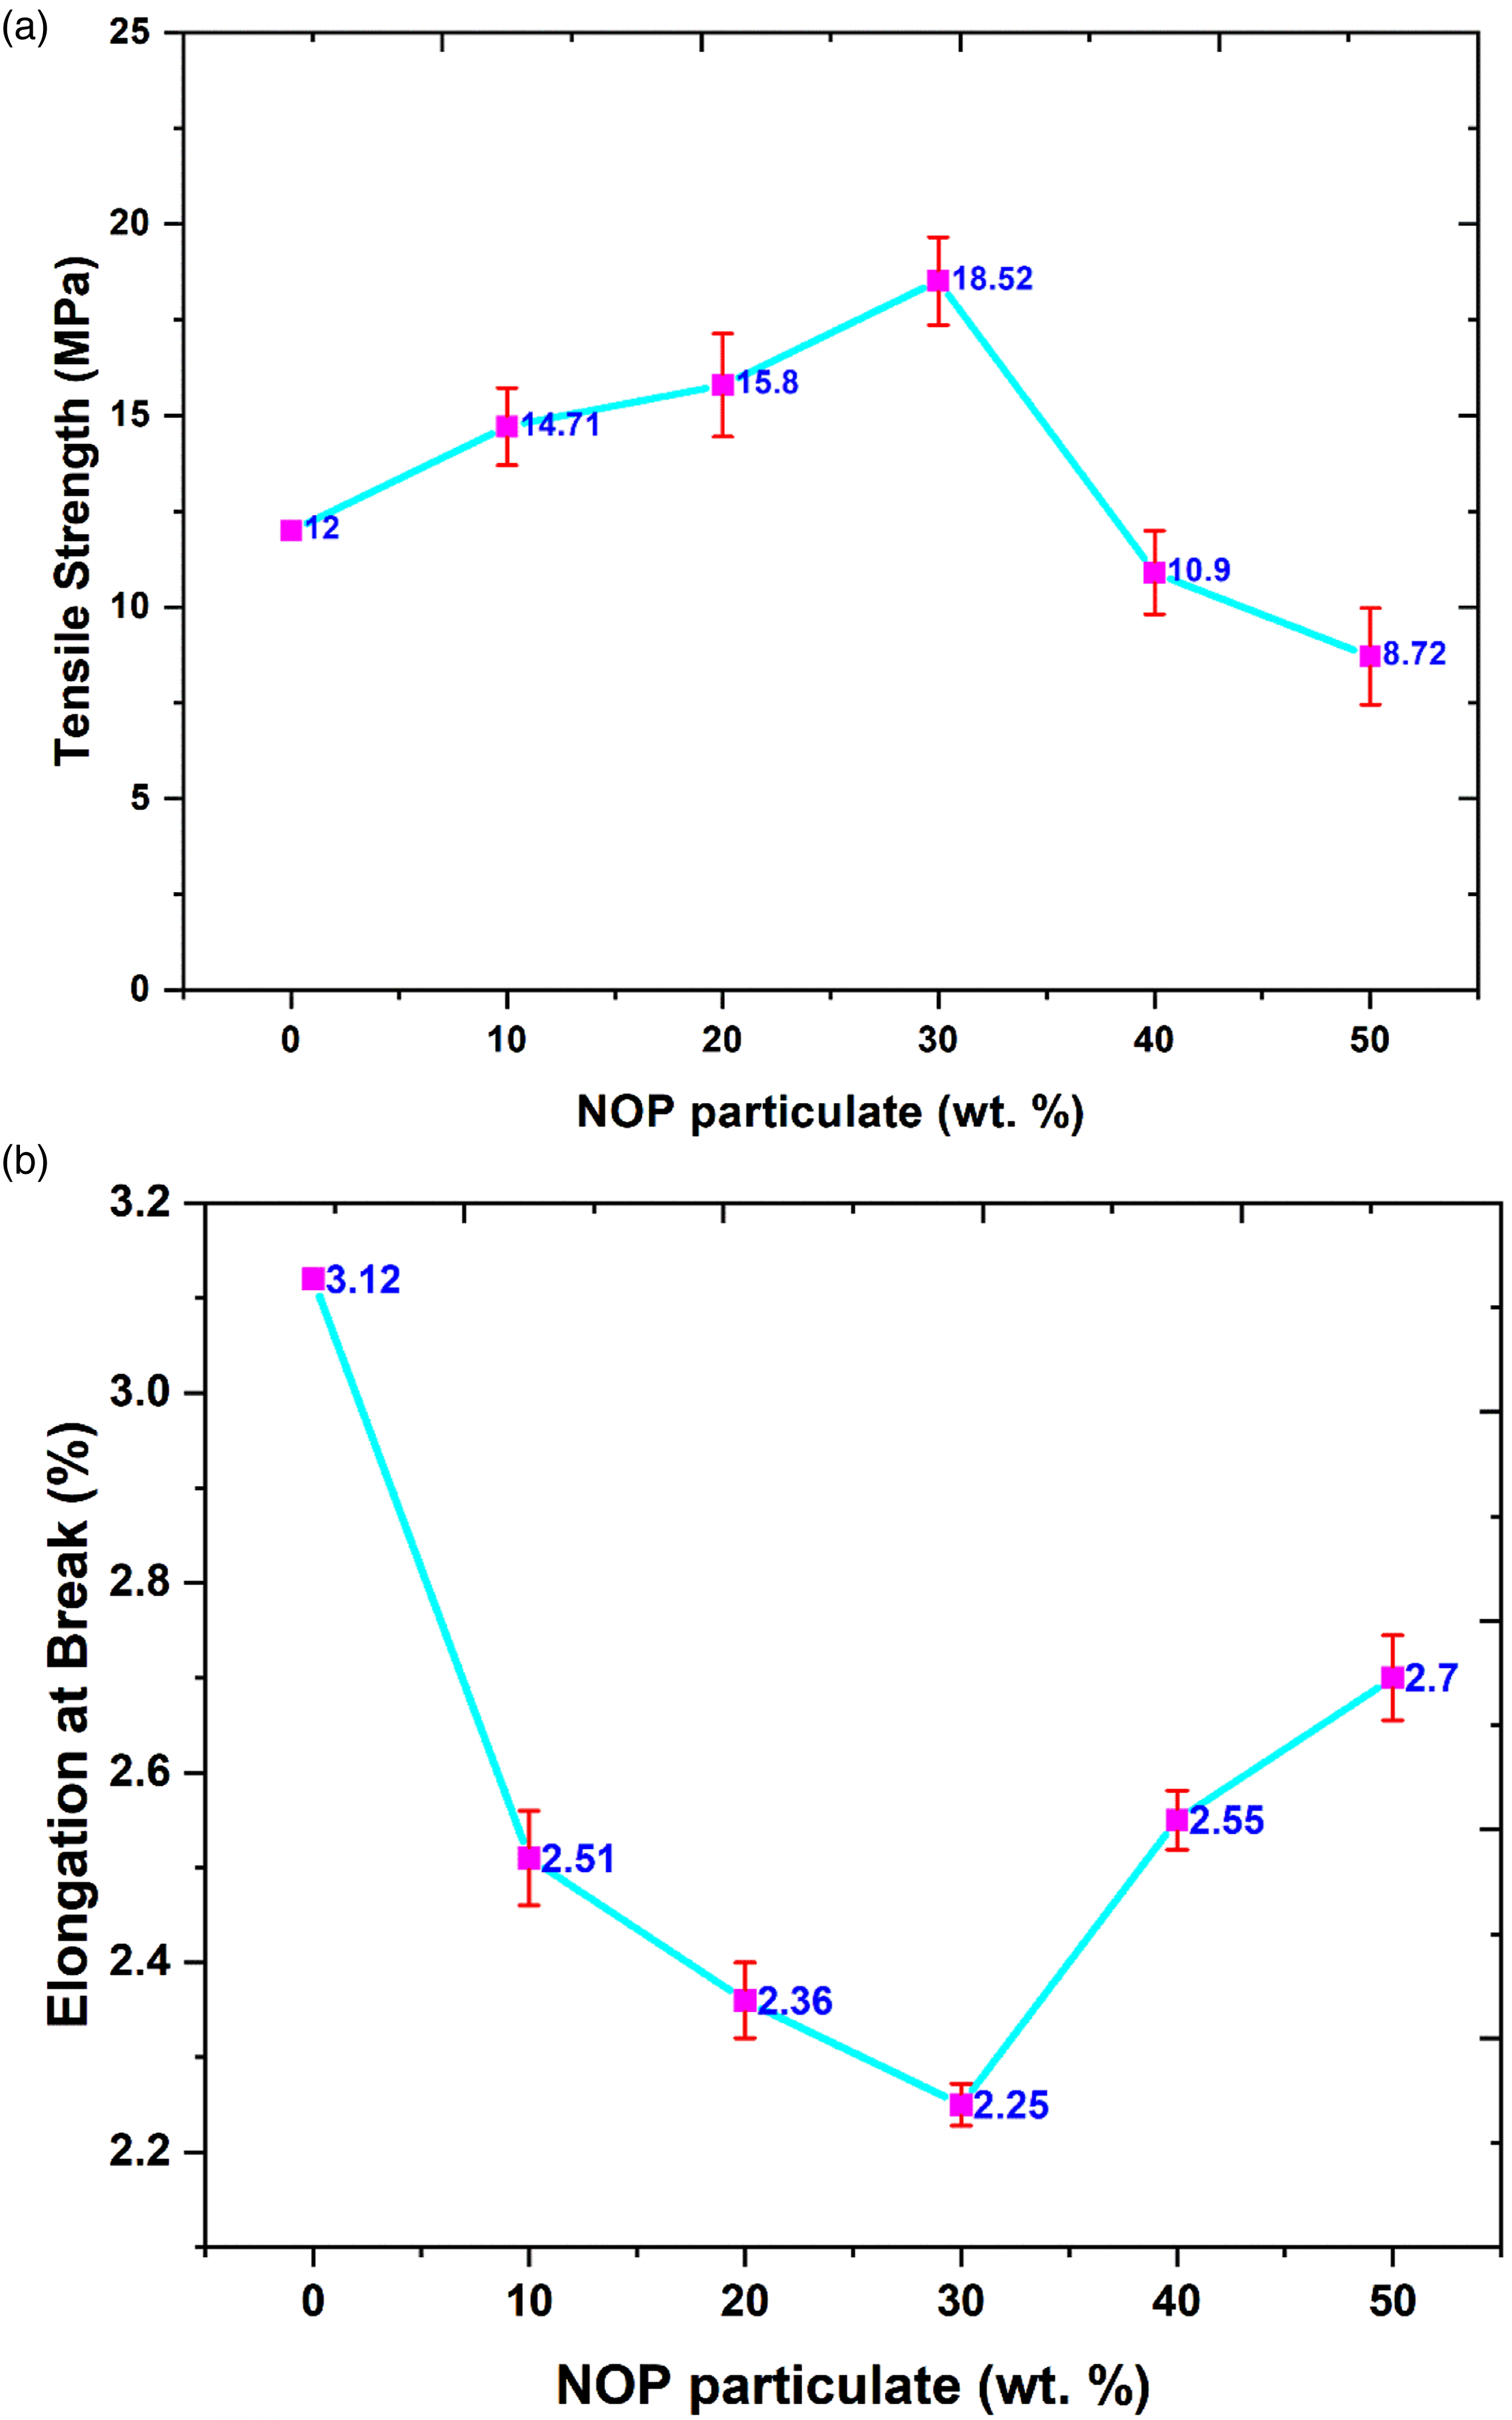
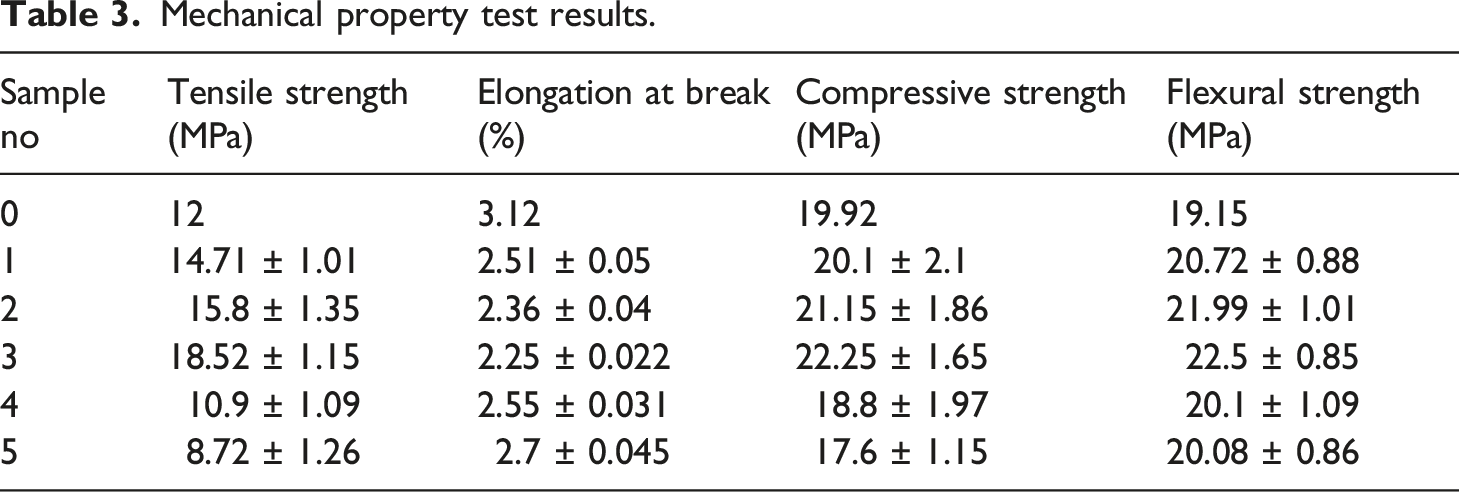
Mechanical property test results.
Compressive strength
Compression test is used to determine the compressive strength, breaking point, and ultimate strength of the material being tested. Figure 6 shows the variation of compressive strength with the weight fraction of the reinforcement. It could be noted that the composites with 30 wt. % of NOP fillers outperformed all other composites. This could be due to the effective interfacial behaviour of the NOP/HDPE composites which transferred the applied compressive load effectively among the fillers and matrices. Besides, due to good compatibility between the constituents, effective load transfer occurred at 30 wt. % NOP filler composites. Beyond 30 wt. %, compressive strength decreased due to the lumping of fillers inside the matrix. This reduced the effectiveness of the fillers during the stress transfer due to which the displacement of laminates increased significantly. Owing to the large filler-matrix delamination due to shear load, compressive strength of 40 and 50 wt. % NOP/HDPE composites dropped. Excessive adhesion and poor interfacial contact were also few other reasons for the drop in compressive strength beyond 30 wt. %. This was also observed by some other earlier researchers in case of some other natural or synthetic fillers.48,50 Compressive strength for NOP/HDPE composites.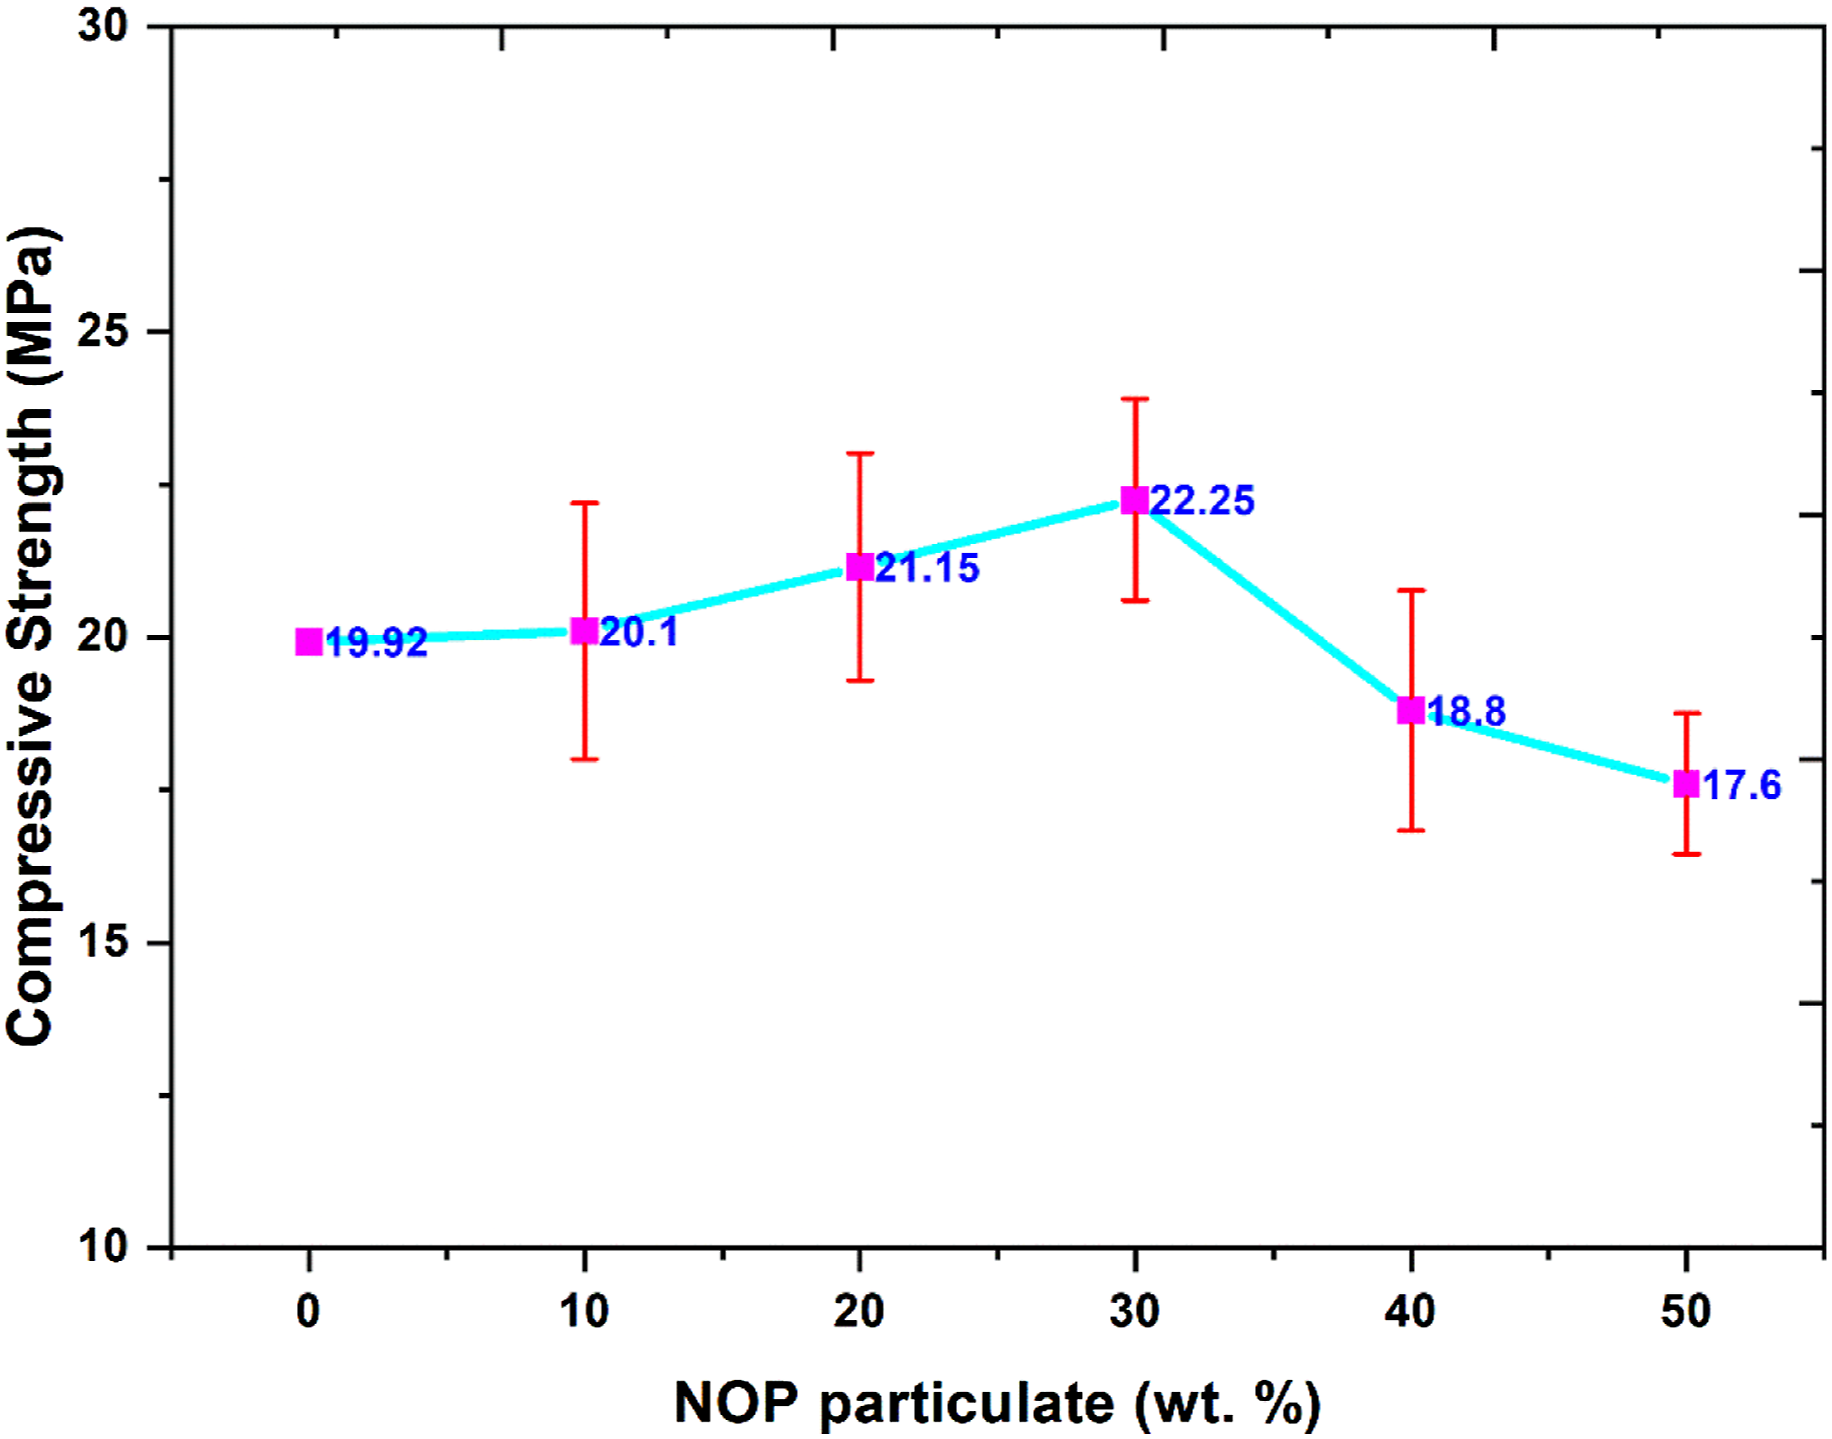
Flexural strength
The flexural test was performed on the test specimen using three-point bending test and the obtained results are shown Figure 7. It could be observed from the graph that the flexural strength of NOP/HDPE composites increase with the amount of reinforcement until 30 wt. % and then decrease. This trend could be due to the void content present in the composites. Due to the optimal quantity of particulates in 30 wt. % of composites, presence of voids was retarded during the composite manufacturing and the NOP particulates dispersed homogenously in HDPE matrix. This reduced the debonding of matrix and the reinforcement resulting in effective load carrying capacity of the NOP particulates. On the other hand, beyond 30 wt. %, due to agglomeration and non-homogenous dispersion of the particulates, stress transfer was constrained by the cluster of NOP particulates resulting in lower load carrying capacity of the composites. This reduced the flexural strength of the composites. Increase in filler-filler interaction and decrease in filler-matrix interaction could be a reason for the drop in flexural strength of NOP/HDPE composites beyond 30 wt. % of NOP particulates as observed by some earlier researchers in case of some other fillers.
51
Flexural strength for NOP/HDPE composites.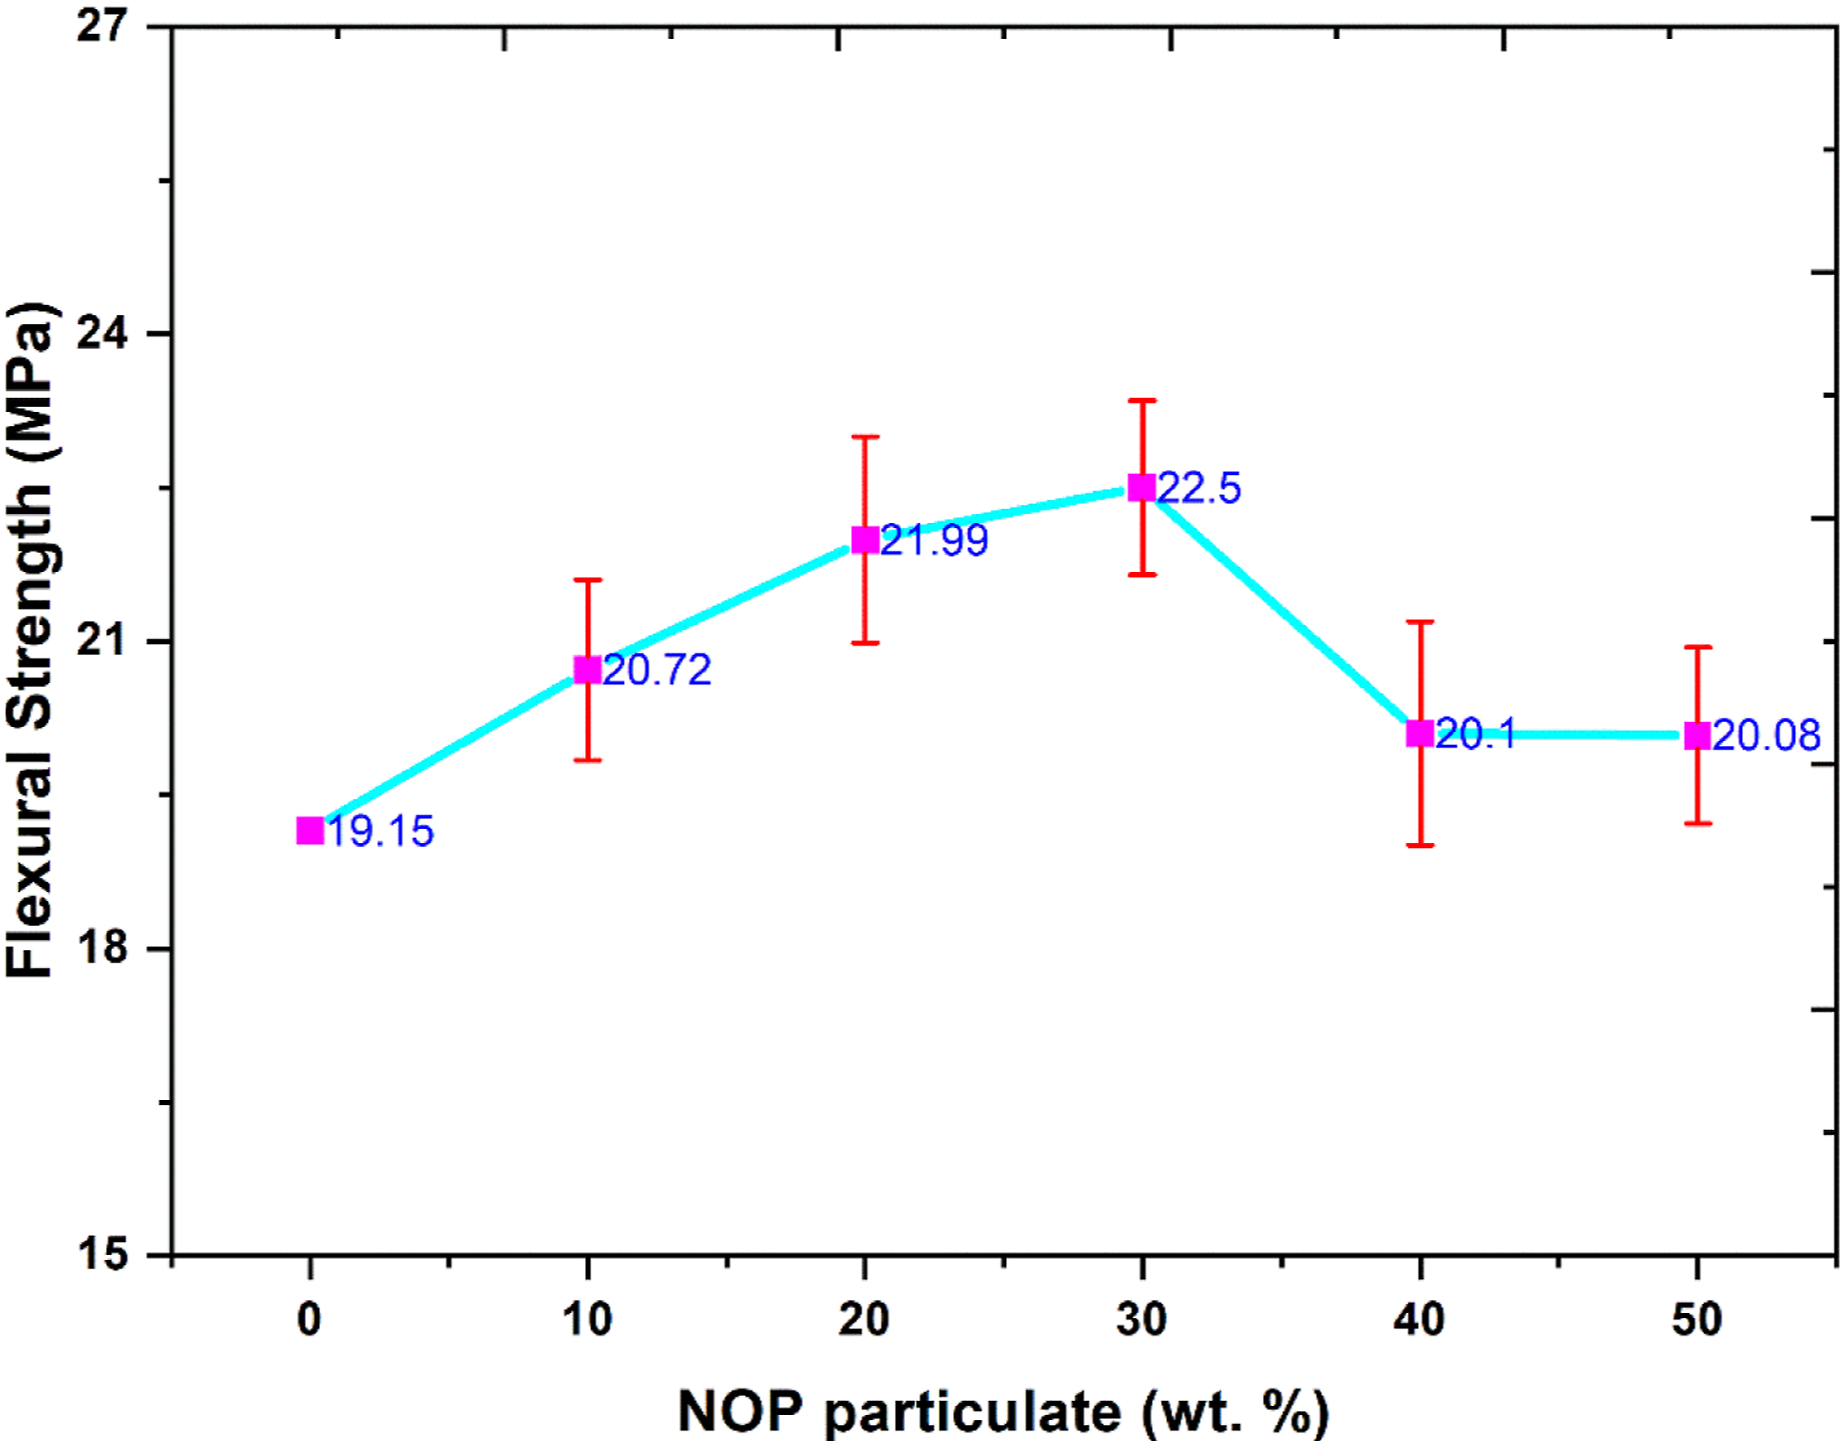
Morphological analysis
Fracture surface morphology of tensile and flexural failure specimens with 30% NOP filler concentration were depicted in Figure 8 a and b. From the figure it could be noted that the voids present were very minimum in both the samples portraying the uniform distribution of the fillers within HDPE matrix since filler agglomeration could not be witnessed at the micrographs. Pullout of fillers due to loading could also be observed from the micrographs which evidently shows the good interfacial adhesion between the HDPE matrix and NOP fillers. Owing to the very minimal defects in the composites at 30 wt. % concentration, tensile and flexural strength of the composites was found to be maximum at this composition. Though, delamination, cracking and debonding could not be evidently observed from the micrograph, they were not assumed to play an influential role in the strength of the composites. Most of these observations were reported in some of the previously published researches .6,52,53 Hence, reinforcing NOP fillers in HDPE matrix enhanced the strength of HDPE matrix by rendering good interface between matrix and the fillers. Fracture surface morphology of 30% NOP-HDPE composites (a) Tensile, (b) Flexural.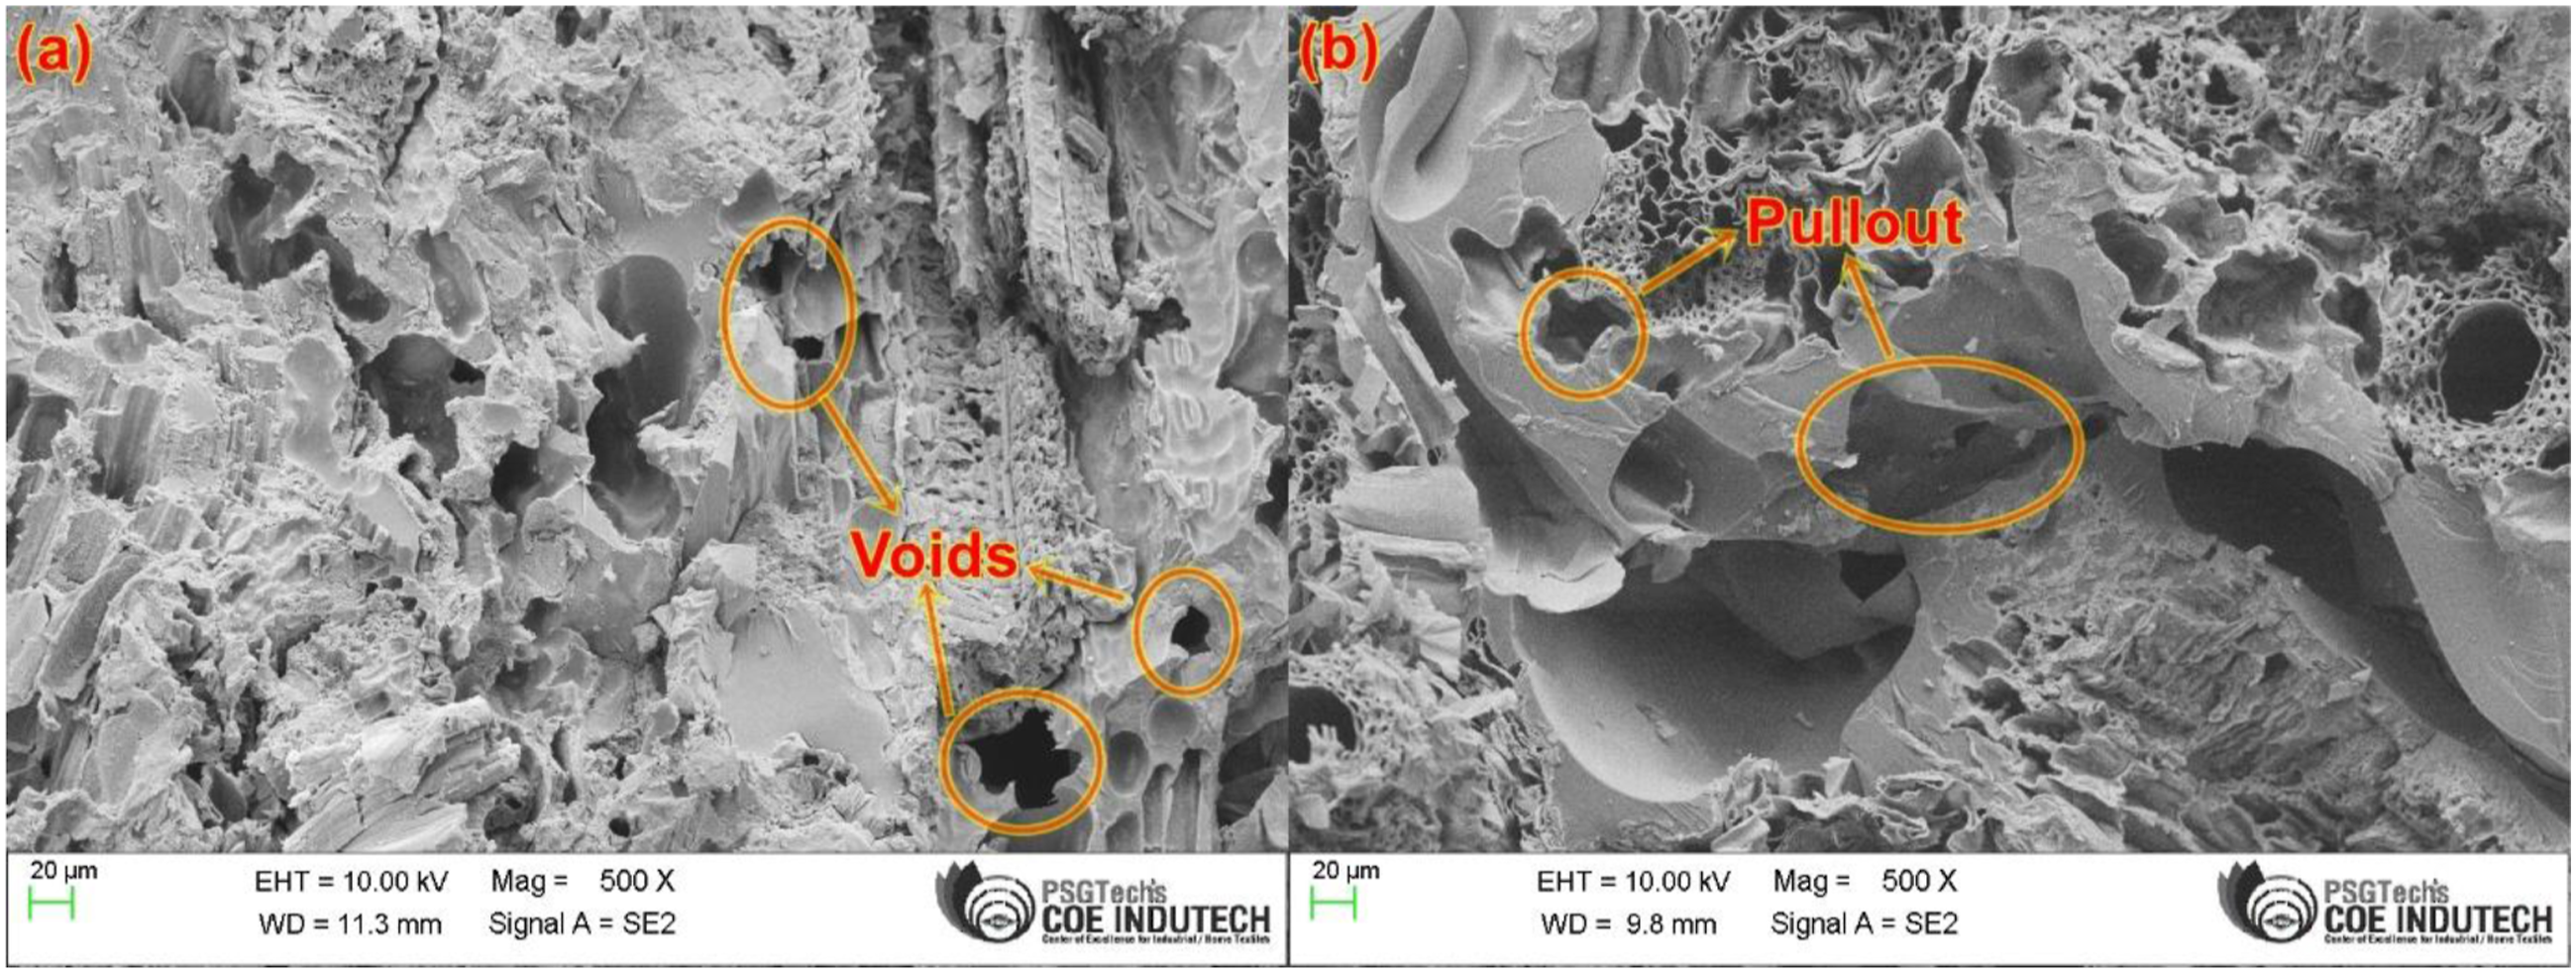
Thermal properties of NOP/HDPE composites
Differential scanning calorimetry (DSC)
DSC curve, as shown in Figure 9, showed the thermal behaviour of pure HDPE composite as a function of temperature rise. Melt onset temperature and the melt peak temperature of pure HDPE composite was found to be 120.3°C and 132.7°C respectively. The energy absorbed by the pure HDPE composite was found (121.8 J/g) owing to the endothermic reaction which is evident from the negative peak. Filled polymer composite has transitioned from a hard and glassy solid to a soft and more elastic material at this point. Finally, the HDPE blend composites was melted as the heat was gradually increased till the peak value was attained. The temperature could also be rapidly raised to the point where a totally amorphous polymer is formed. DSC curve of pure HDPE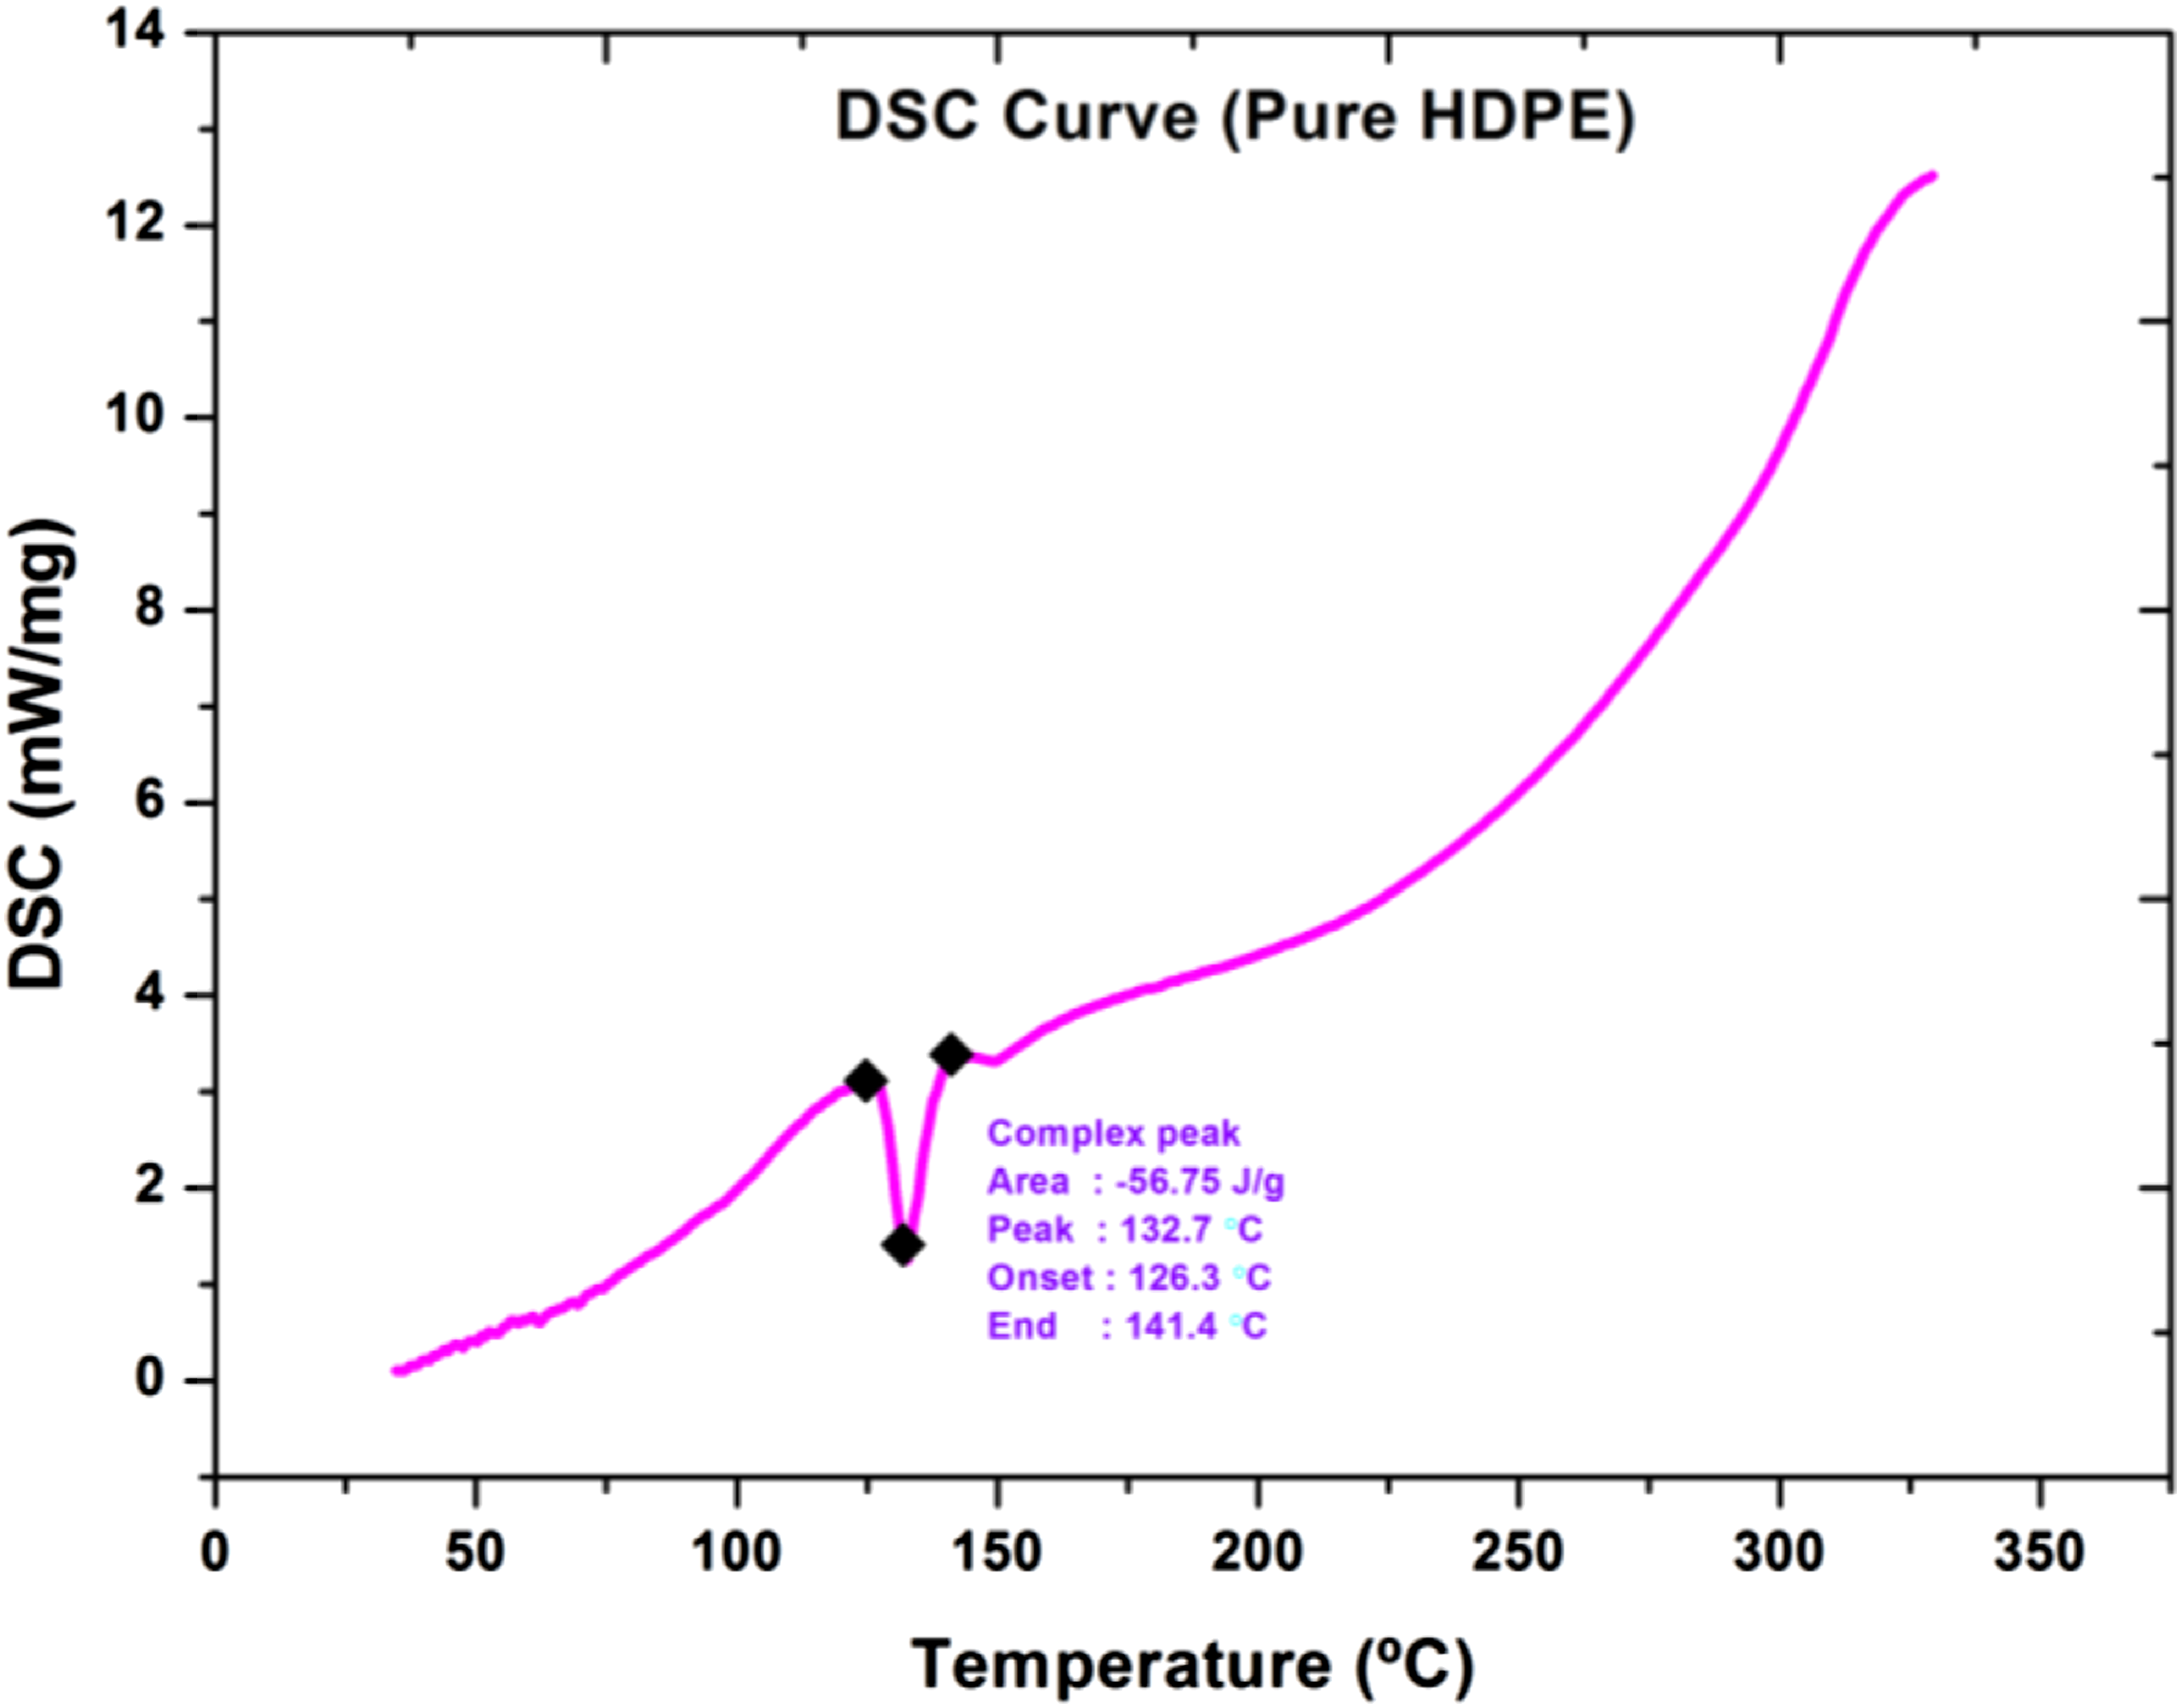
The differential scanning calorimetry curve depicted the behaviour of 30 wt. % pine tree leaf- HDPE composite as in Figure 10. Melt onset temperature was found as 125.3°C and melt peak temperature was at 135.5°C. The energy absorbed by the 30 wt. % pine tree leaf-HDPE composite was found (68.61 J/g) due to absorption of heat ending up in a negative peak similar to the previous case. DSC Curve of 30 wt. % NOP/HDPE composite.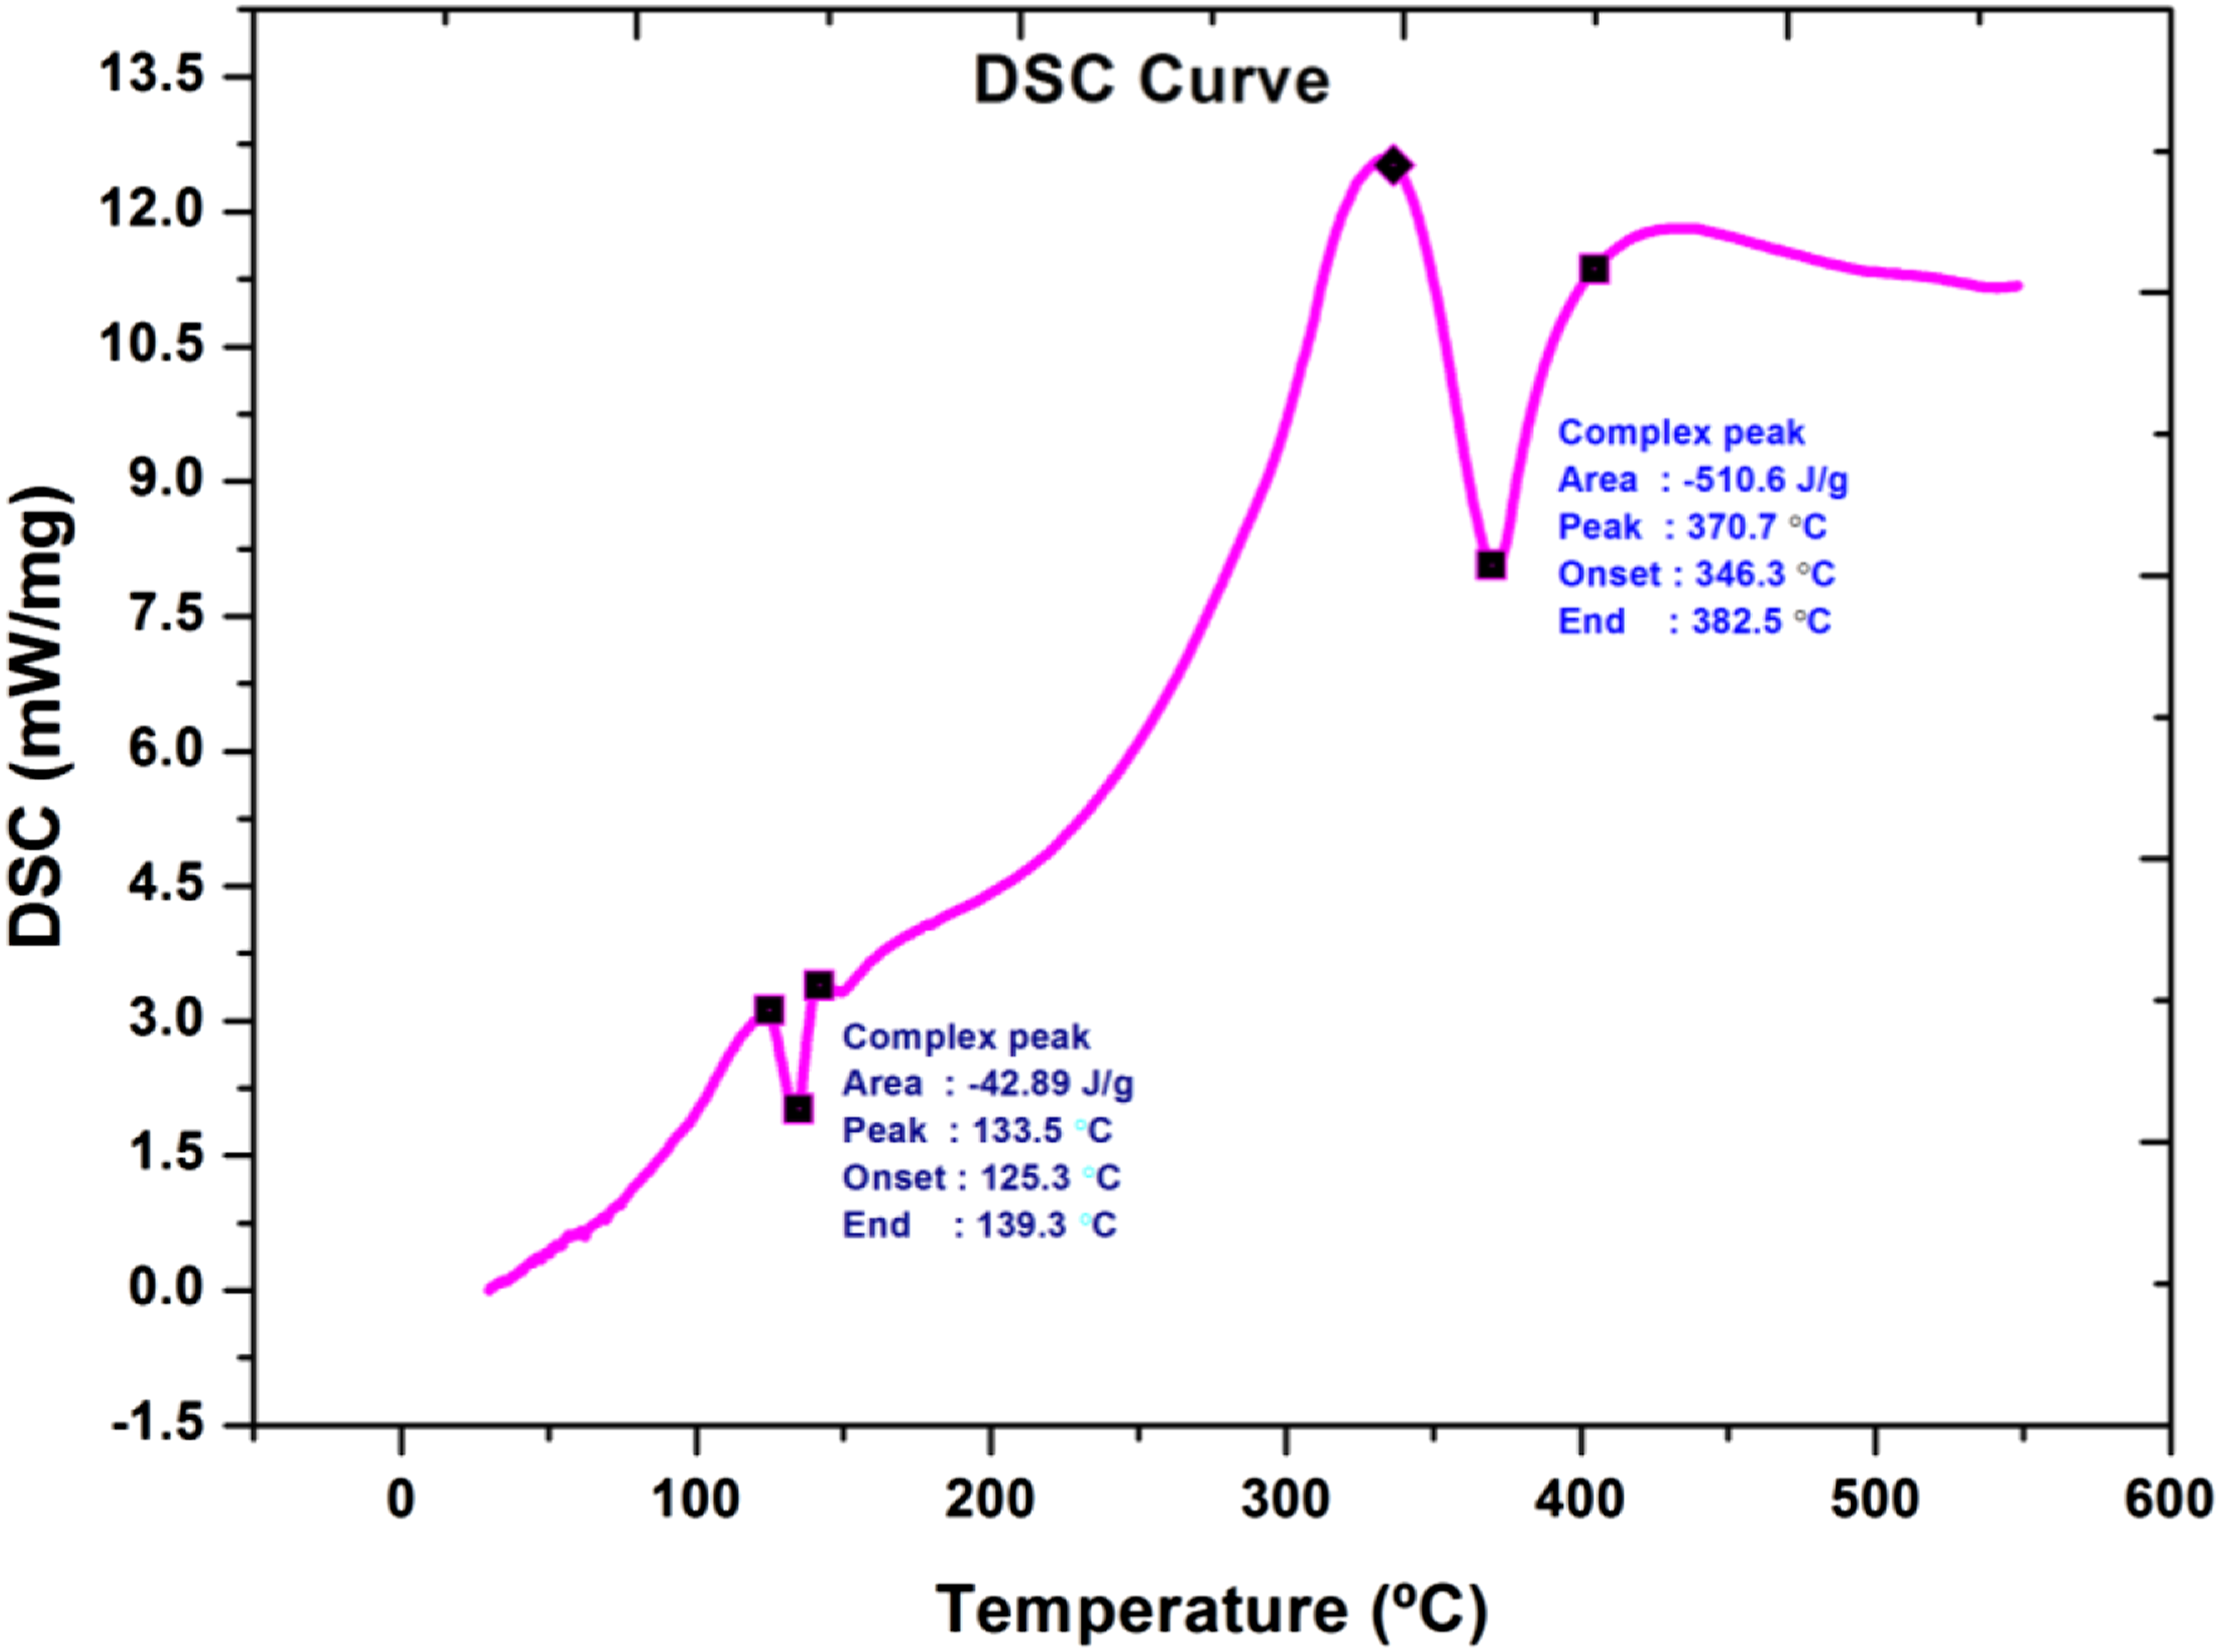
Transition of filled composites to a rubbery materials from hard solid happened at this temperature zone. Beyond 135.5°C, polymer structure gained enough flexibility to restructure amorphous phase into a crystalline form of composite with relatively lower energy. During crystallisation stage, atoms or molecules were restructured into a highly ordered formwhich resulted in a bound structure. From the area under the graph while phase change we can tell the heat required for phase change process. The heat required is −125.3 J/g for Pure HDPE whereas for Norfolk pine needles composite the heat rate is −68.61 J/g and −493.9 J/g. Negative sign indicates endothermic reaction. This decrease in the heating rate and increase in the phase change temperature clearly depicts that the incorporation of Norfolk pine powder to the HDPE results in increased thermal stability of the specimen.
Thermogravimetric analysis
The thermogravimetric analysis curve depicted the decreasing weight of the 30 wt.% particulates filled HDPE composite material as a function of temperature as shown in Figure 11. The temperature steadily rised from 29.83 to 404.83°C, while the mass loss remained consistent, dropping from 3.94 to 3.89 mg. The temperature was raised to 544.83°C in the next stage, and a massive mass of weight was reduced from 2.17 to 2.14 mg. By raising the temperature of the components, they become oxidised and eventually decomposed in the final stage. Up to 450°C, the weight of the 30% particulate-filled specimen stays unchanged. This signifies that up to this temperature, the specimen is thermally stable. After this temperature (450°C), specimen starts losing its weight, which indicates that the decomposition of specimen. The weight loss continues up to 502°C. So, the weight loss of specimen occurs between 450°C to 502°C. The mass of the substance remains constant beyond this temperature (502°C). TGA curve of 30 wt. % NOP/HDPE composites.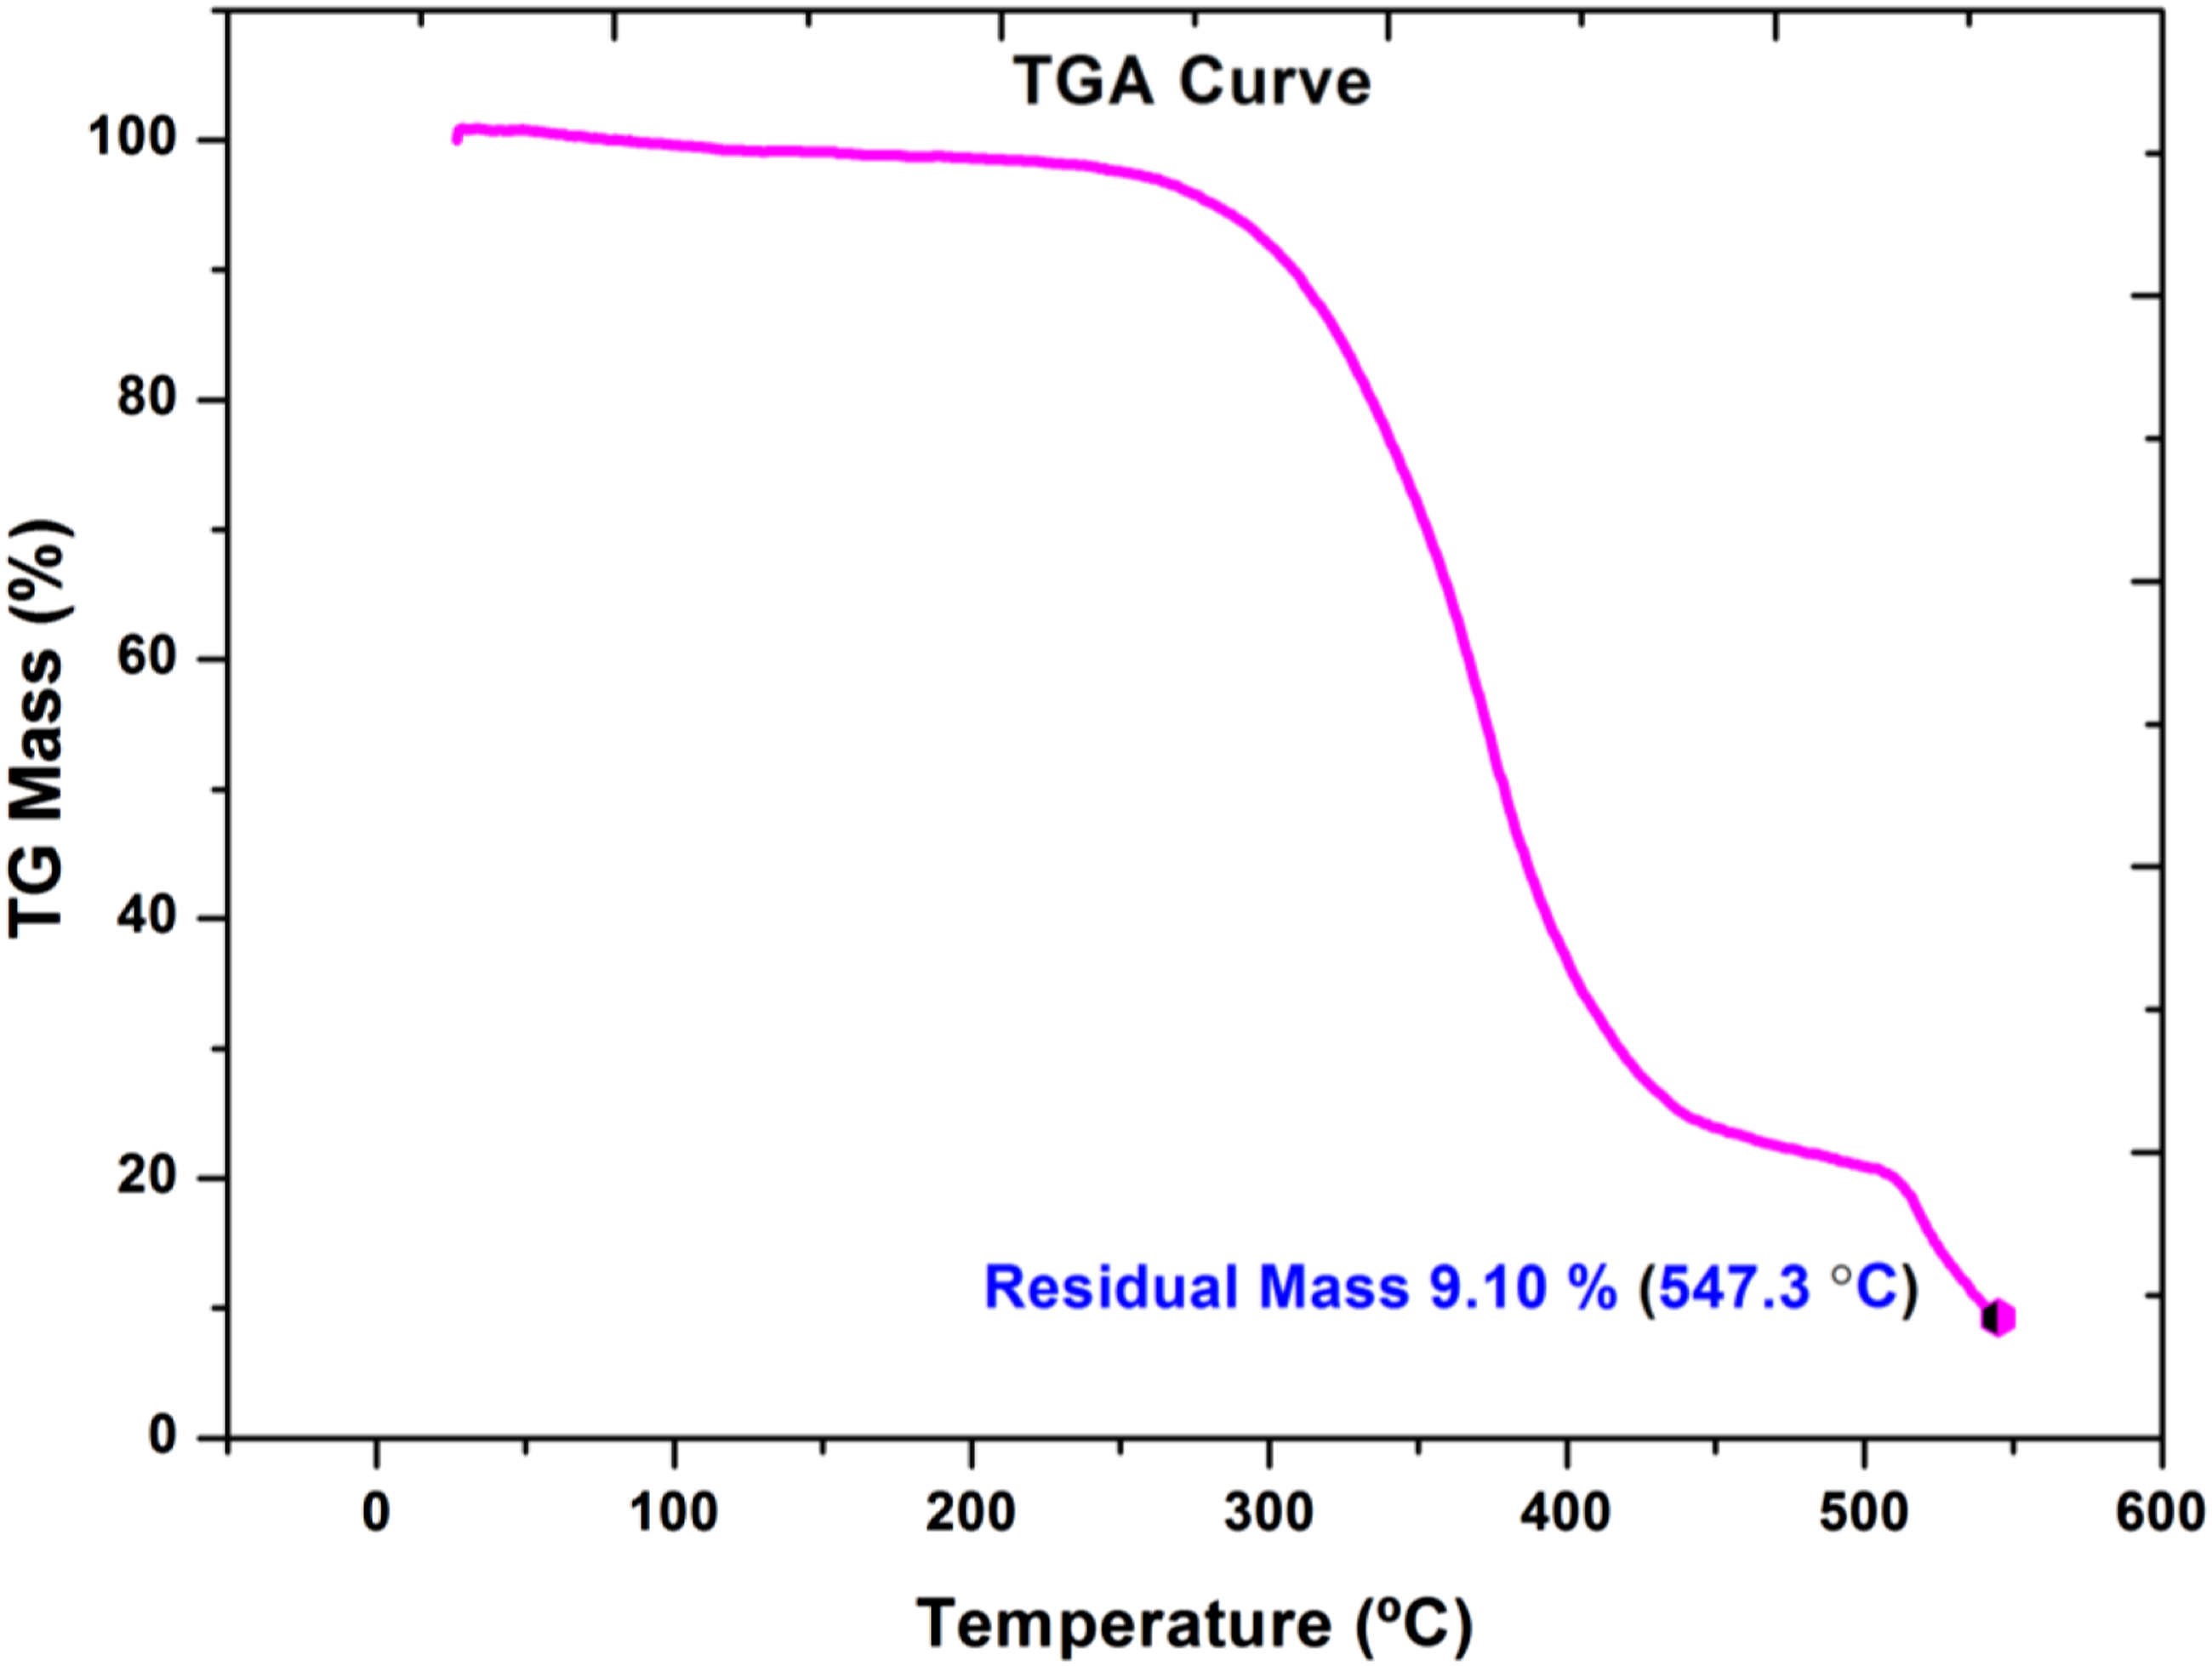
Conclusion
In the present work, NOP particulates were reinforced in HDPE matrix in various weight fractions, and the mechanical and thermal behaviour of NOP/HDPE composites were determined. The following are the conclusions of the characterization and testing of NOP particulates and their composites: • Characterization of Norfolk pine leaf fillers through X-ray diffraction revealed the presence of various crystalline and amorphous regions. The crystallinity index was found to be 38% and the crystallite size was 19.96 nm. • Energy dispersive spectroscopy revealed the presence of carbon and a few other secondary elements in the fabricated composites. Surface morphology of 30 wt. % of particulate-filled composites exhibited better attributes like homogenous dispersion, the presence of minimum defects, and voids. • Mechanical test results showed that the Norfolk pine tree particulates filled HDPE composites exhibited better mechanical strength when compared with pure HDPE composites. It was noted that for NOP-filled HDPE composites increase in tensile, compressive, and flexural strength were 35.2%, 10.5%, and 14.89% respectively for 30 wt. % of NOP fillers when compared with pure HDPE. This was due to better compatibility, adhesion, and interfacial strength between filler and matrix. Beyond 30 wt. %, the mechanical properties of the composites decreased. • Failure surface morphology of 30% NOP-filled HDPE composites depicted that there was good interfacial adhesion between the filler and the matrix with minimal failures. • Differential scanning calorimetry results clearly portrayed the decrease in the heating rate and increase in the phase change temperature in increased the thermal stability of the specimen. The melt onset temperature was obtained as 125.3°C. • Thermo-gravimetric analysis results depicted that the volatile compounds that formed around 220–240°C could certainly withstand higher operating or working temperature without a significant mass loss due to temperature.
Hence it could be concluded that the current research on Norfolk pine tree leaves natural filler indicated a positive glide to use them as reinforcements in high-density polyethylene matrix instead of pure high-density polyethylene in related applications with minimized material and maximized strength. These composites can be used in structural and semi-structural applications with low or medium loads.
Footnotes
Declaration of conflicting interests
The author(s) declared no potential conflicts of interest with respect to the research, authorship, and/or publication of this article.
Funding
The author(s) disclosed receipt of the following financial support for the research, authorship, and/or publication of this article: This work was supported by King Mongkut's University of Technology North Bangkok (KMUTNB-Post-66-03).