
Abstract
The thermal conductivity parameter of the materials is a fundamental parameter for thermal design and study of heat transfer processes. In our study, we combined the homogenization theory based on the finite element with the thermal conductivity order-of-magnitude analysis and similarity principle, to construct structural models of fibers, spheres, ellipsoids, sheets, and interfaces, and establish the topology of intermingling and encapsulation of different structures. Combined thermal conductivity calculations of mesoscopic composites and microscopic interface models using finite element and molecular dynamics methods. The anisotropy model of thermal conductivity was established by coordinate transformation. Based on the numerical verification of the reliability of the method, the mechanisms of the influence on the thermal transport of composites were analyzed for parameters such as volume fraction of different structural fillers, structural shape, thermal conductivity ratio, thickness of highly thermally conductive coatings, and spatial orientation distribution. The results showed that the effective thermal conductivity (ETC) of the continuous structural reinforced composite was mainly influenced by the volume fraction of the filler; the modulation of ETC with ellipsoidal particle structure form and distribution mode was comparable to the effect of changing the volume fraction modulation; the mutual fusion between ellipsoids randomly distributed in the plane could effectively enhance the heat transport effect of the composite, and as the volume fraction increased to more than 3%, the heat transport gain from mutual fusion was more obvious; spraying high thermally conductive copper coating on ellipsoidal particles could significantly enhance the ETC of the composites. The present work could provide reference for composites in terms of structural improvement and thermal performance enhancement.
Introduction
With the rapid advancement of electronic technology, electronic devices and equipment towards light, thin, short, small and other trends, resulting in the working environment of electronic components to move to high temperature, the performance requirements of the packaging materials for heat dissipation purposes are also increasingly sophisticated. 1 Especially in the packaging of high-power components in the aerospace and military defense fields as background, the requirements for electronic packaging and packaging materials are more stringent. Therefore, it is particularly vital to explore thermally conductive materials to reduce the operating temperature of electronic components.
Epoxy resins have been widely used in the packaging of electronic devices because of insulating properties, corrosion resistance and low cost. 2 However, low thermal conductivity (generally below 0.3 W/(m•K)) limited the effective heat dissipation of electronic components. To increase the thermal conductivity of epoxy resins, the preparation of polymer composites by filling polymer with inorganic fillers with high thermal conductivity was the most effective method.3,4 In the preparation process, the composite materials were prepared through controlling the percentage, distribution mode and type of different performance materials to achieve various special and comprehensive performance requirements. Filled composites are made of polymer as the matrix and compounded with thermally conductive fillers, which have the advantages of wide source of raw materials, simple process and adjustable performance, and are one of the development trends of thermally conductive materials. 5 The thickness, lateral dimensions and aspect ratios of different filler materials were intentionally chosen for their geometric similarity to each other, using different filler geometries to achieve a “synergistic” effect. 6 Kozako et al. 7 mixed spherical and flake Al2O3, spherical SiC, and scale-like BN filled with epoxy resin, which obviously increased the thermal conductivity of the composites. Nan et al. 8 proposed the theoretical formulation of the effective medium considering elliptical particle packing, using the aspect ratio to define the particle shape. Scholars have coated the surface of fibers and sheet fillers with silver for thermally conductive composites, and the thermal conductivity has been significantly improved.9–11 It has been shown that the performances of filled composites were not only related to the properties of the matrix, but also to the morphology, content and distribution of the added fillers, among which the shape structure of the fillers was considered to as one of the main factors influencing the thermal conductivity.12–14 To obtain the effective thermal conductivity of filled polymers easily and quickly, scholars have used various methods to obtain different theoretical prediction models, such as parallel model, 15 Maxwell model, 16 Fricke model, 17 Rayleigh model, 18 etc. However, these theoretical models mainly took into account the effect of the volume fraction of the incorporated fillers and the own properties on the effective thermal conductivity of the composites, while ignoring the particle shape, spatial distribution and degree of binding of the thermally conductive fillers. 19 Therefore, these models showed unacceptable deviations when used to calculate the thermal conductivity of composites with complex filler distribution versus complex structure.
While experimental studies can accurately predict the thermal conductivity of more complex composites in reality, there are uncertainties in experimental studies, operational errors in the process of experimental studies, etc., which can consume a great deal of experimental materials, be expensive and not guarantee the correctness of the results. Scholars have used finite element (FE)-based numerical computational methods for studying the ETC of composites made with various structural fillers.20,21 For example, Javanbakht et al. 22 investigated the thermal transport properties of carbon fibers with random distribution within the composites using FEM method. Jung et al. 23 studied the thermomechanical properties of SiC particle-reinforced materials using the FEM. For simulation models, common drawbacks of molecular dynamics, 24 and lattice Boltzmann methods 25 included the difficulty of generating complex microstructures and the high computational power and time requirements. 26 The advantages of FEM numerical simulation as the main computational model to predict the thermal properties of complex structural materials were significantly demonstrated in terms of cost effectiveness. Molecular dynamics simulations can be used to calculate the thermal conductivity of the interface model. 27 In many advanced device applications, interfacial thermal conductivity (ITC) is commonly the limiting factor in managing heat. MD simulations are commonly used to describe the interface of materials at the atomic level. Liu et al. 28 revealed the enhanced mechanism of thermal energy transport at the interface of graphene/hexagonal boron nitride heterostructures by NEMD simulations. Feng et al. 29 used the NEMD method to calculate the ITC between CNT arrays and silicon films. Weng et al. 30 calculated the interfacial thermal resistance between the polypropylene layer and the nickel layer using the NEMD method. Xu et al. 31 considered the temperature dependence of the Al/Cu interface for different temperatures and the size effect of thickness based on the NEMD method. The combination of numerical techniques using FEM, finite volume method, and molecular dynamics is the best and most economical choice to predict the thermal behavior of complex structural composites. The accuracy and validity of the finite element numerical simulations as well as molecular dynamics simulations were well illustrated.
Filled polymers enable the adjustment of polymer mechanical properties as well as thermal properties through selection of filler material type and variation of filler volume fraction. 32 Because the complexity of the filler structure of composite materials and the diversity of factors influencing the thermal conductivity, there is no universal formula. However, new thermal conductivity models could play an important role in the design of composite structures with continuous optimization and improvement of traditional models in combination with a large amount of data. Although some progress has been made, the prediction accuracy of effective medium theory was generally low for composites with high filling volume fractions, 26 while not conducive to processing performance and cost savings. The construction of an effective thermal conductivity network can be the critical to increase the thermal conductivity of filled polymer composites, but the composites have a well-defined filler loading threshold.33,34 In the present work, the relationship between the thermal conductivity of epoxy resin-based composites and various influencing factors, such as the filler structure shape, the filler interfusion, and the filler distribution in the matrix, was investigated to achieve comparable results to the volume fraction modulation of thermal conductivity. The effect of interfacial effects was also considered to provide new ideas for the large-scale preparation of polymeric thermally conductive composites.
Mathematical models
Structure reconstruction
In this work, the fibers were assumed to be cylindrical. The fiber geometry was modeled by the linear equation of the point

The anisotropy of the fiber thermal conductivity was fully expressed by the coordinate transformation. The coordinate transformations work as follows

Ellipsoidal particles must satisfy the equation for surface constraint
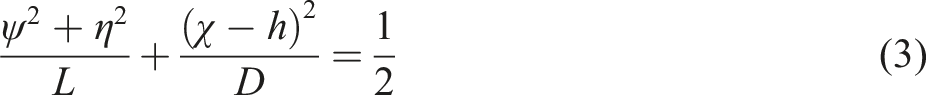
Rotation (selection of direction tensor a = diag (1/2,1/2,0) and a = diag (1/3,1/3,1/3)) according to the direction fixed for the filler (random 2D or random 3D random direction) and generated the rest of the structure in turn. Figure 1 represents the random distribution of particles in space. Schematic diagram of the structure of ellipsoidal particles.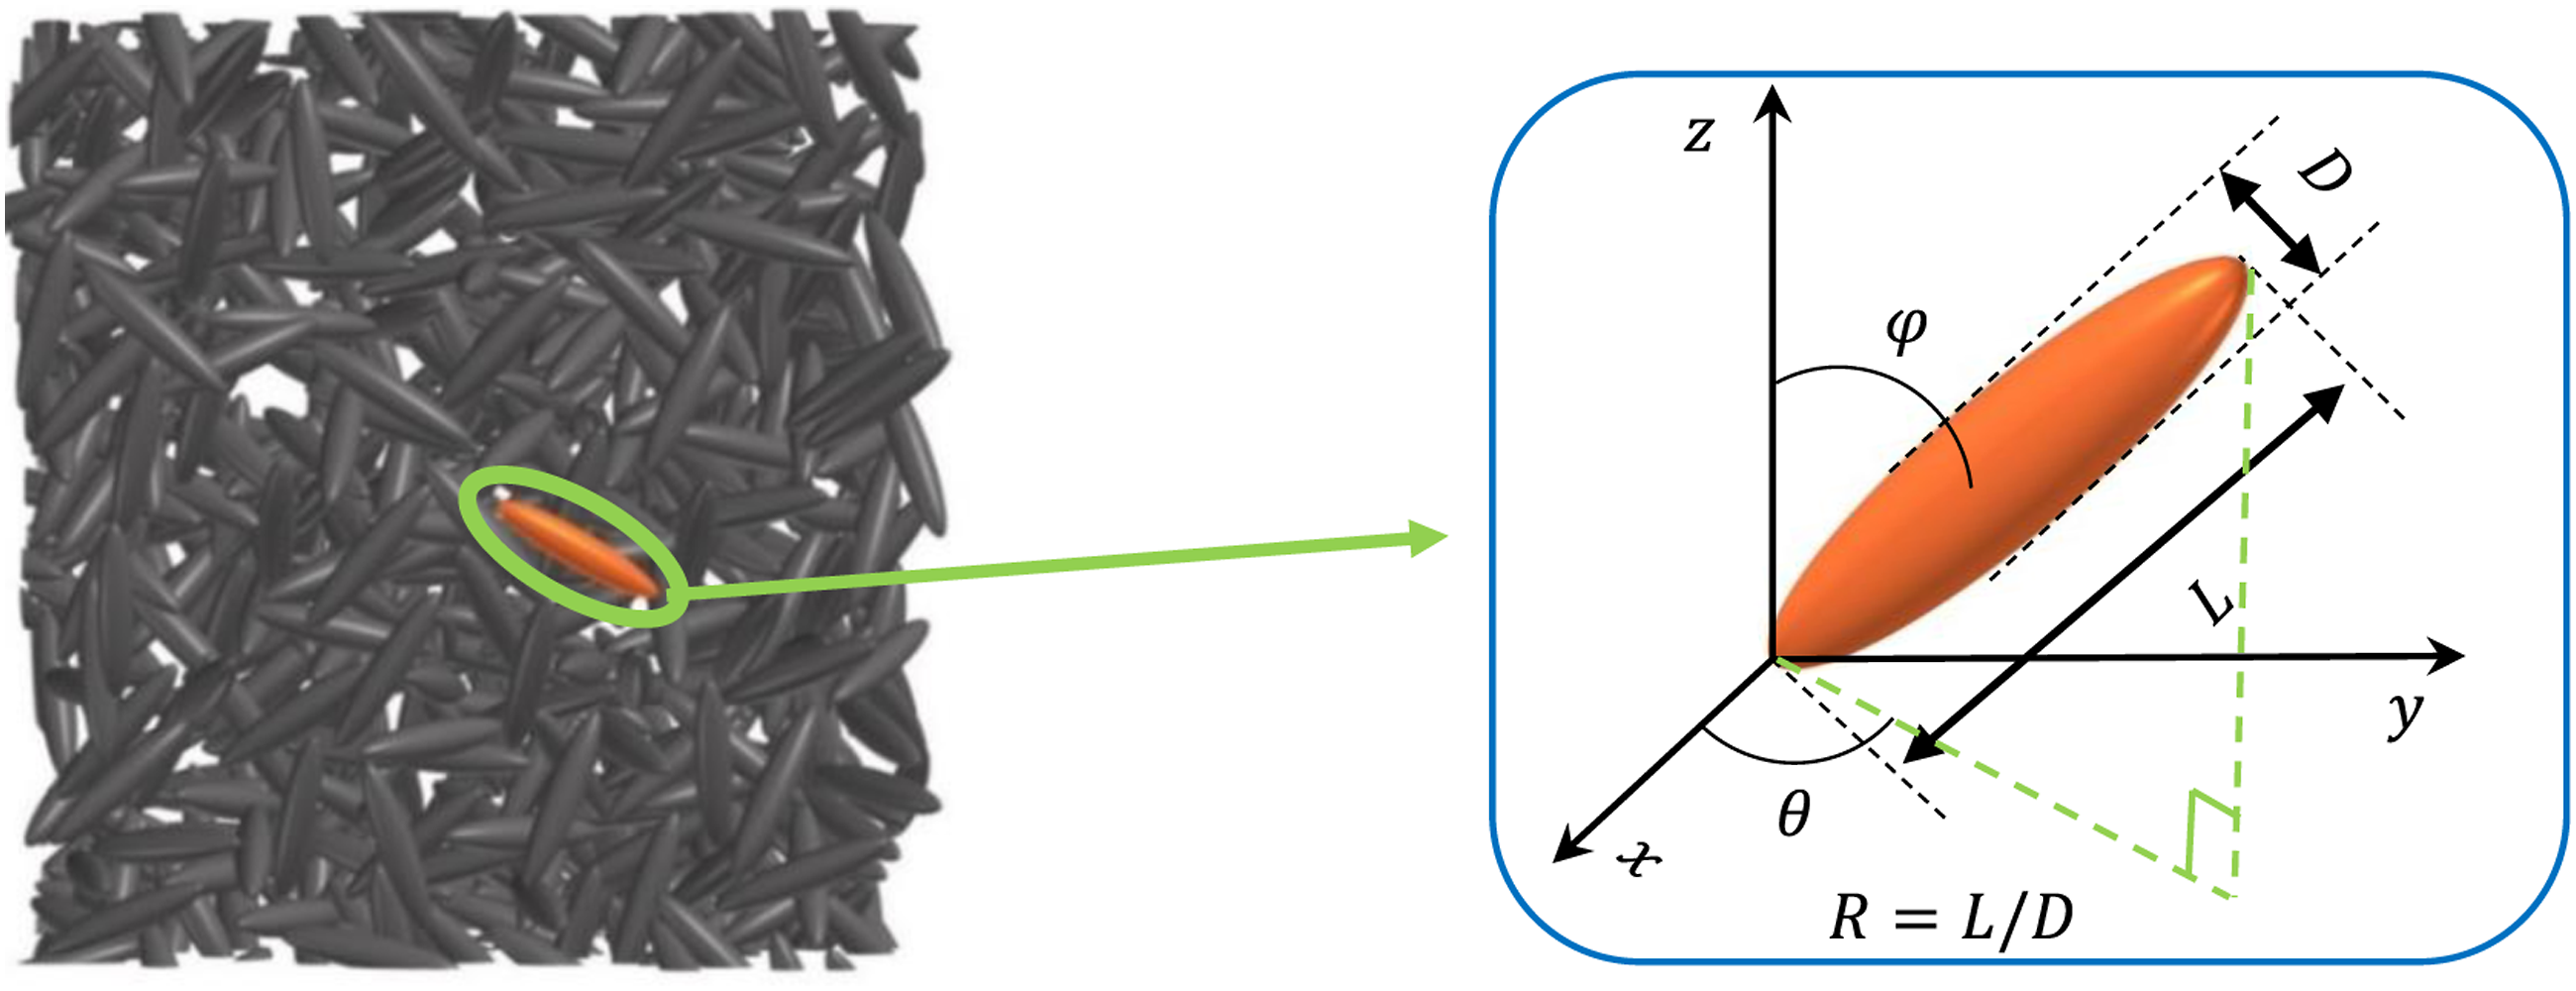
Interface model
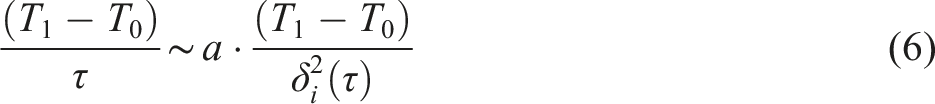
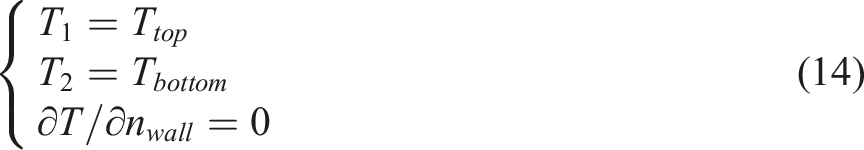
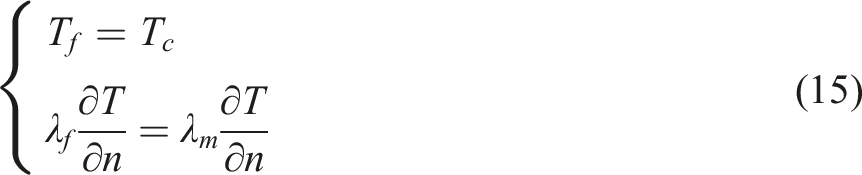
In the present work, the thermal conductivity problem with the first type of boundary conditions was analyzed using order-of-magnitude analysis and similarity principle to derive the criterion number about the thermal conductivity problem. Thus, it is possible to cross-scale accurately establish the microscopic model of the internal interface of composite materials (As shown in Figure 2). Taking the ITC problem as the object of study, the temperature in molecular dynamics was constantly changing with time and the problem under consideration was non-stationary, and the mathematical descriptive equation was established as follows. Schematic diagram of composite structure and heat transfer. The red flow lines indicate the main heat flow direction, and the blue arrows indicate the direction of heat flow with high thermal resistance inside the material.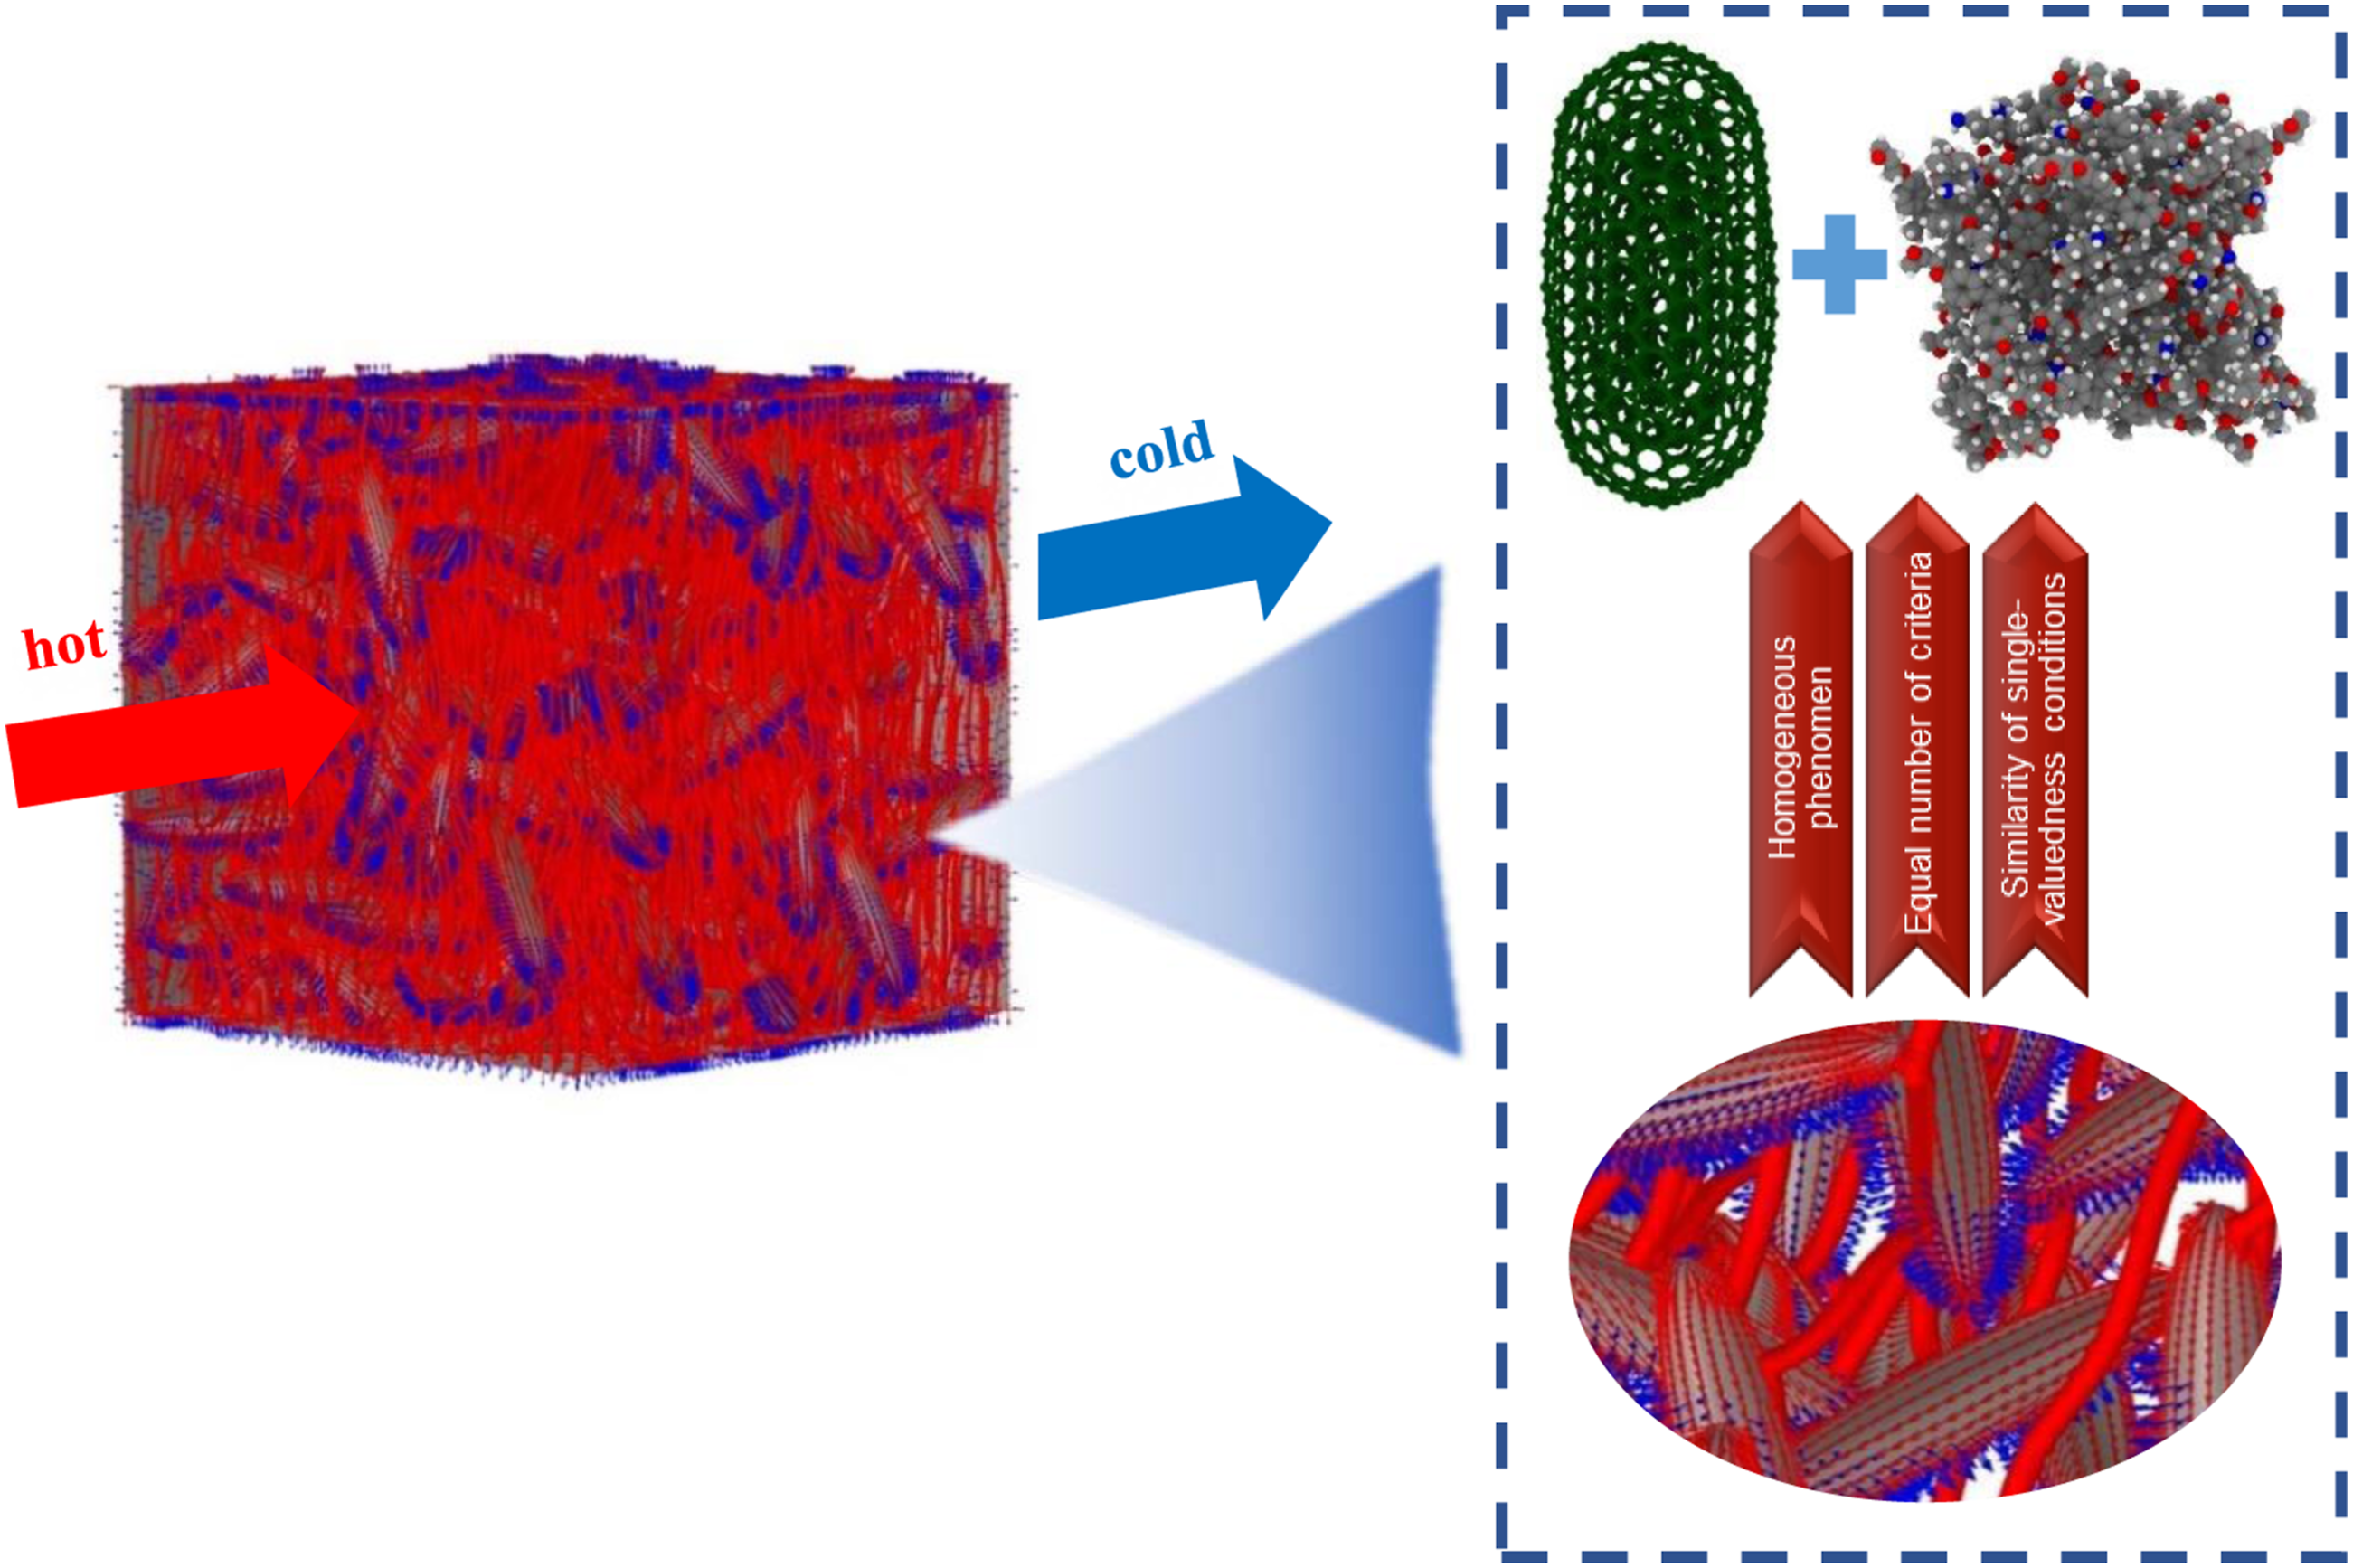

The order-of-magnitude analysis was performed for

Let
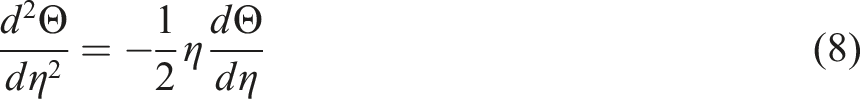
From the boundary conditions, the temperature distribution was similar. When
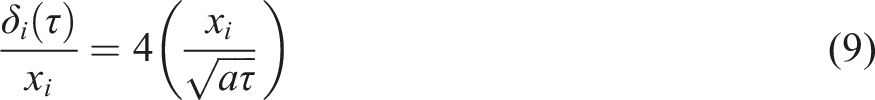
Defining the thermal conductivity Reynolds number
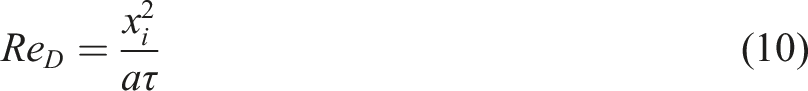
By continuously adjusting the interface model structure, the thermal conductivity Reynolds number at the microscopic and mesoscopic levels could be consistent, which effectively reduced the interface thermal resistance calculation error.
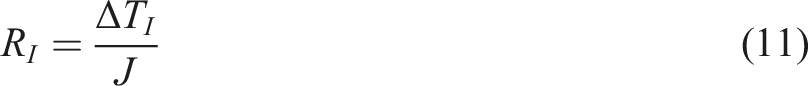
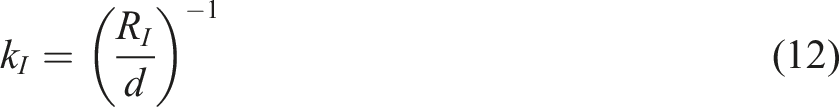
The NEMD is widely used to calculate the thermal resistance of interfaces of large heterogeneous structures. In the present work, the epoxy resin molecular model and graphene were used to model the interface of the composite. As shown in Figure 3, the NEMD calculation method was used to calculate the ITR for different structural models. The method works by applying different amounts of heat to the two sides of the simulated system, resulting in collisions between atoms and the formation of a temperature gradient. The temperature recorded near the hot bath may be inaccurate, and the hot bath is usually far away from the interface. The interface model was modeled with periodic boundary conditions in the X, Y direction with the length direction (Z) of 8 nm. The model with the length of 8 nm proved to be large enough to include all significant heat transport modes, eliminating the size dependence of the thermal conductivity of the interface. To quantify the thermal conductivity of the interface, ITR and thermal conductivity can be calculated using the following equation.
37
NEMD calculation system schematic.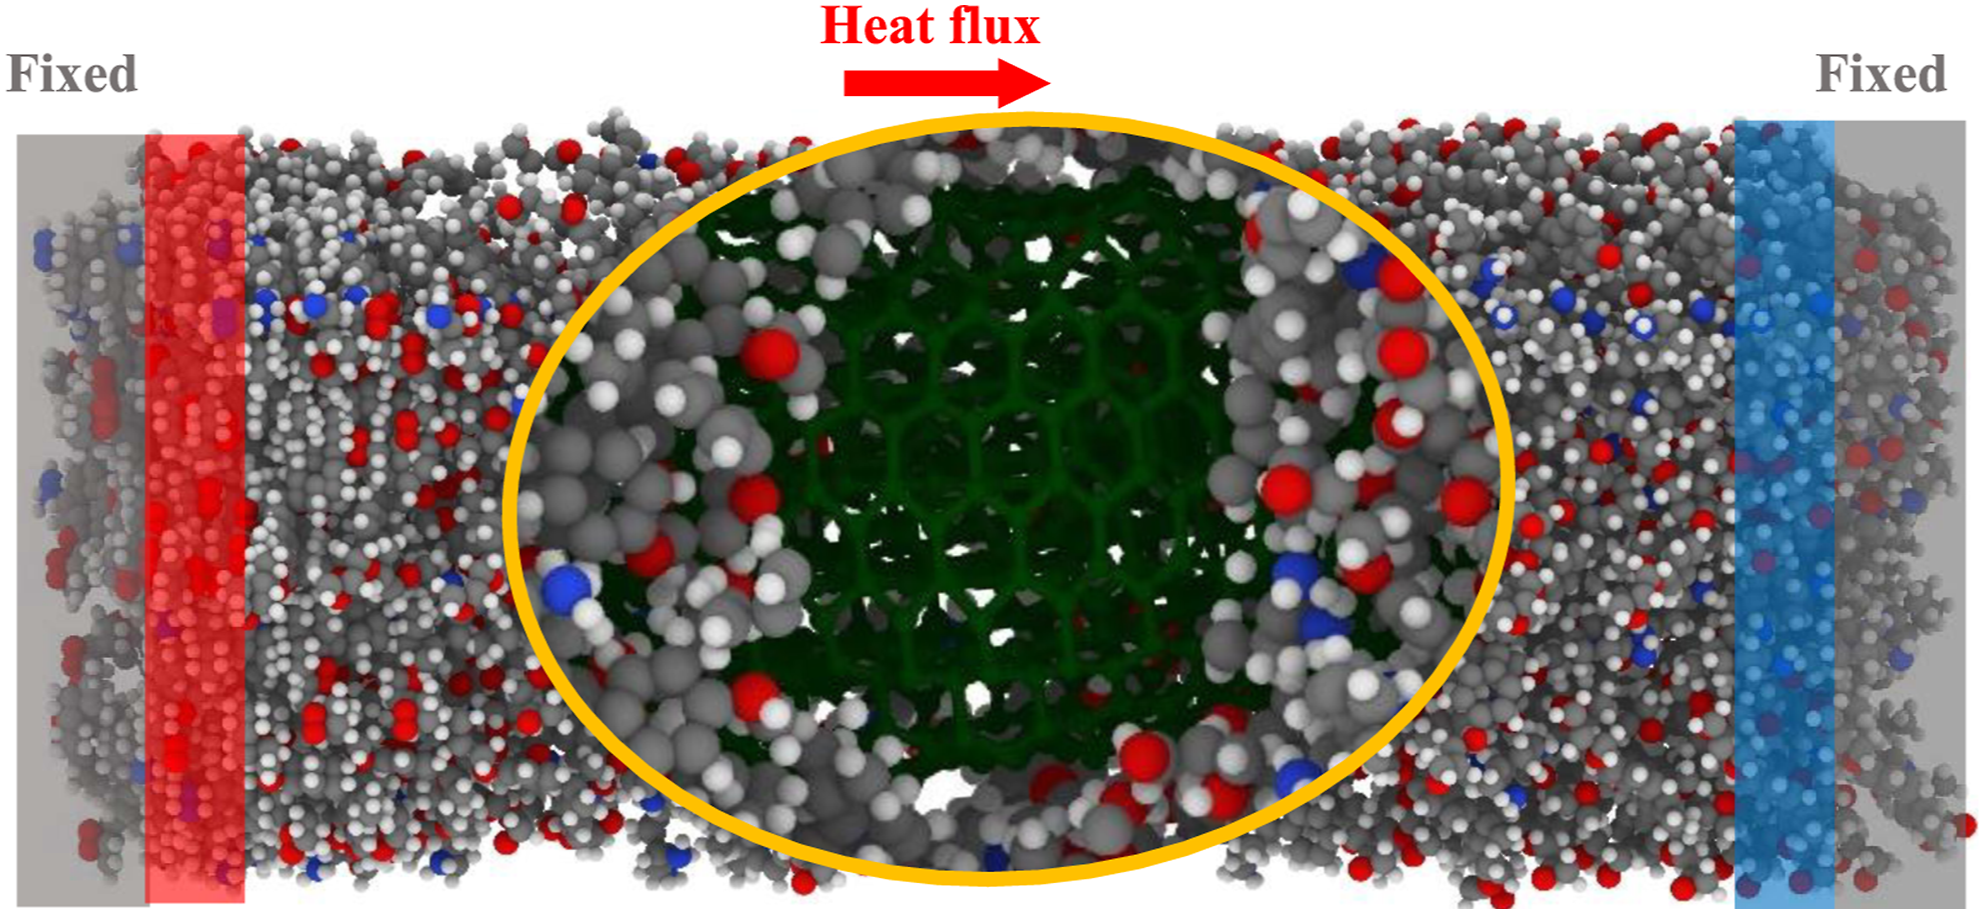
It is a commonly adopted method for calculating thermal resistance and has been successfully applied to various systems.38,39
The PCFF (Polymer Consistent Force Field Series) force field parameters used in the simulation calculations have been successfully used to study the mechanical properties of various polymers, while the functional form of the interaction parameters was obtained by ab initio calculations.37,40 In the calculation of non-bonded interactions, the potential cut-off point of 1.2 nm was used. Both van der Waals (vdW) forces and electrostatic forces were included in the simulations. The COMPASS force field enables the simulation of metal ions, metal oxides, and metals. The COMPASS force field was used to calculate the thermal resistance of copper coating interface.
The van der Waals interaction potential between epoxy substrates, i.e., the 9-6 LennardJones (LJ) potential, is expressed as
The modeling of microscopic interfaces focused on cross-linked epoxy resins, graphene structures, and copper coatings. The commonly used monomers and curing agents for epoxy resins are Bisphenol A Diglycidyl Ether (DGEBA) and Methylcyclohexanediamine (HTDA), respectively. The corresponding structures were shown in Figure 4. Through labeling the active carbon atoms in DGEBA and the nitrogen atoms in HTDA, to achieve precise identification of cross-linking atoms during the cross-linking process. The epoxy resin was modeled by breaking the bonds of the epoxy groups to form hydroxyl groups. Monomers and curing agents commonly used in epoxy resins.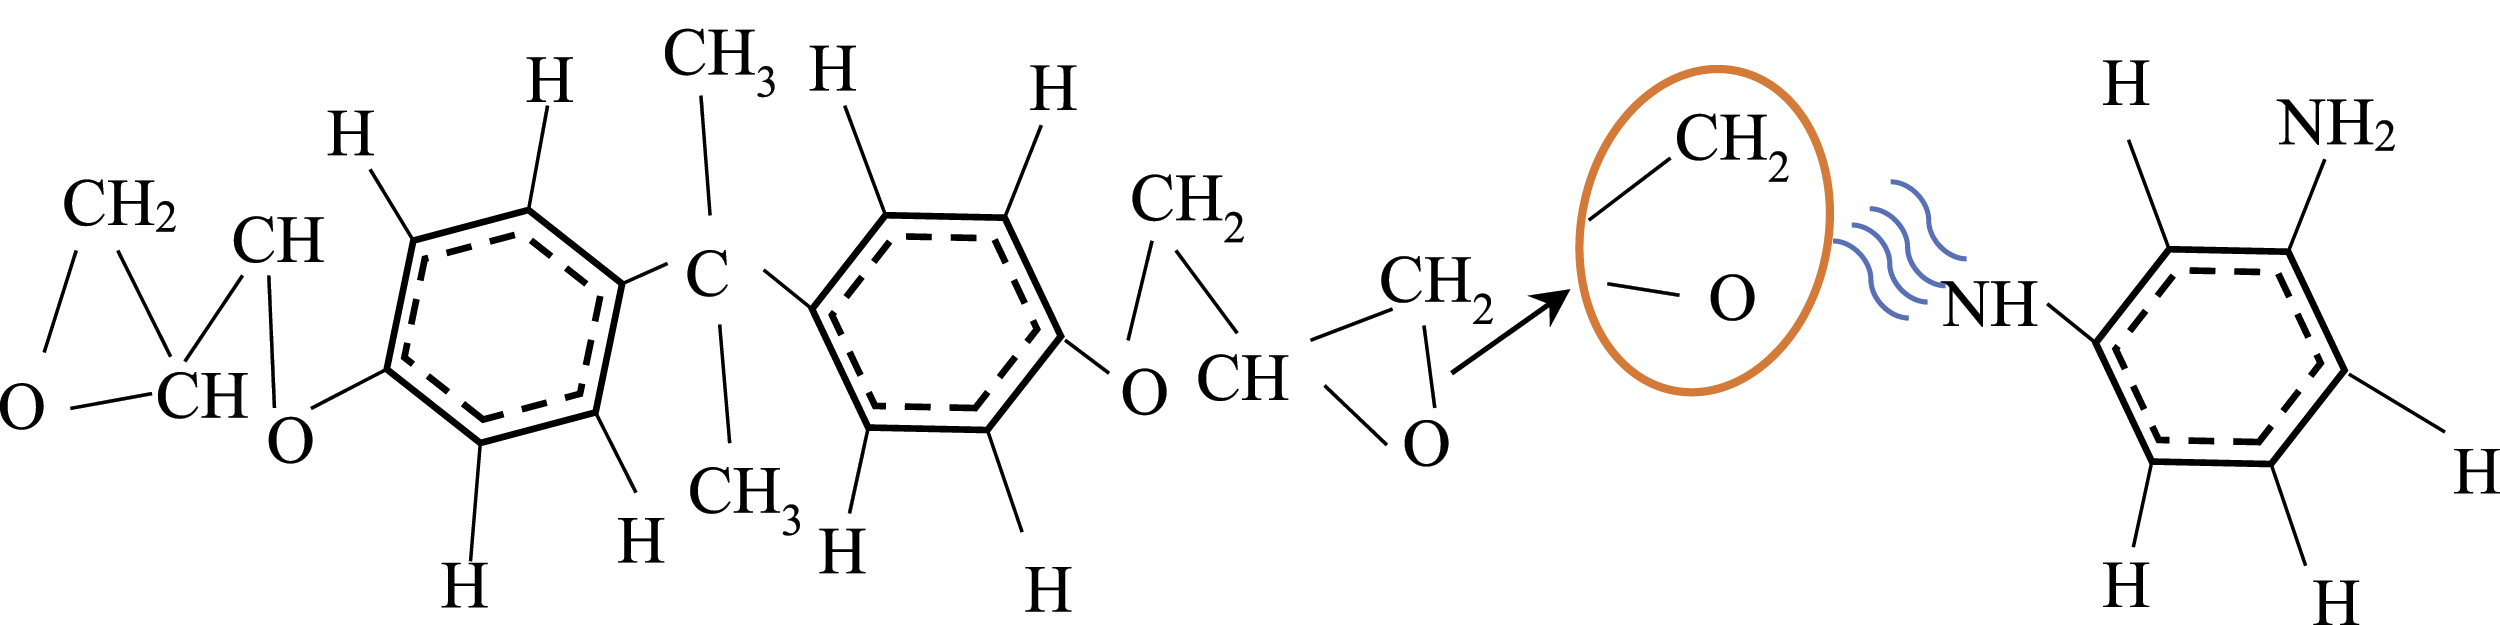
Thermal conduction control equation
The steady-state temperature field of RVE was obtained by solving the following Laplace equation for the differential equation of thermal conductivity of materials as
The computational procedure ignored the effect of ITR first. At the boundary between the resin material and the fiber material, it must be noted that, assuming perfect bonding conditions between the fiber and the resin matrix, the following conditions should be met at the interface of the different materials.
The mesh division of the composite material was carried out by custom, and the resin structure and the filler structure were divided by tetrahedral mesh respectively. Since the internal structure of the filler was complex, a tetrahedral mesh was used for discretization. The internal temperature field obtained by numerical calculation of the composite material by the FEM, and the
The FEM was used for calculation, therefore, the
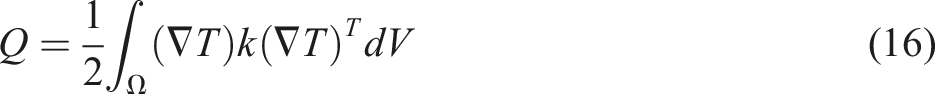
In summary, the total thermal resistance


To validate the present method, the calculation was first performed for the reinforced composites filled with fibers in the matrix, and then the accuracy of the calculation model for the filled spherical and sheet reinforced composites was verified in turn, as shown in Figure 5. Comparison and validation of the numerical results of the computational model with the results of existing models and literature.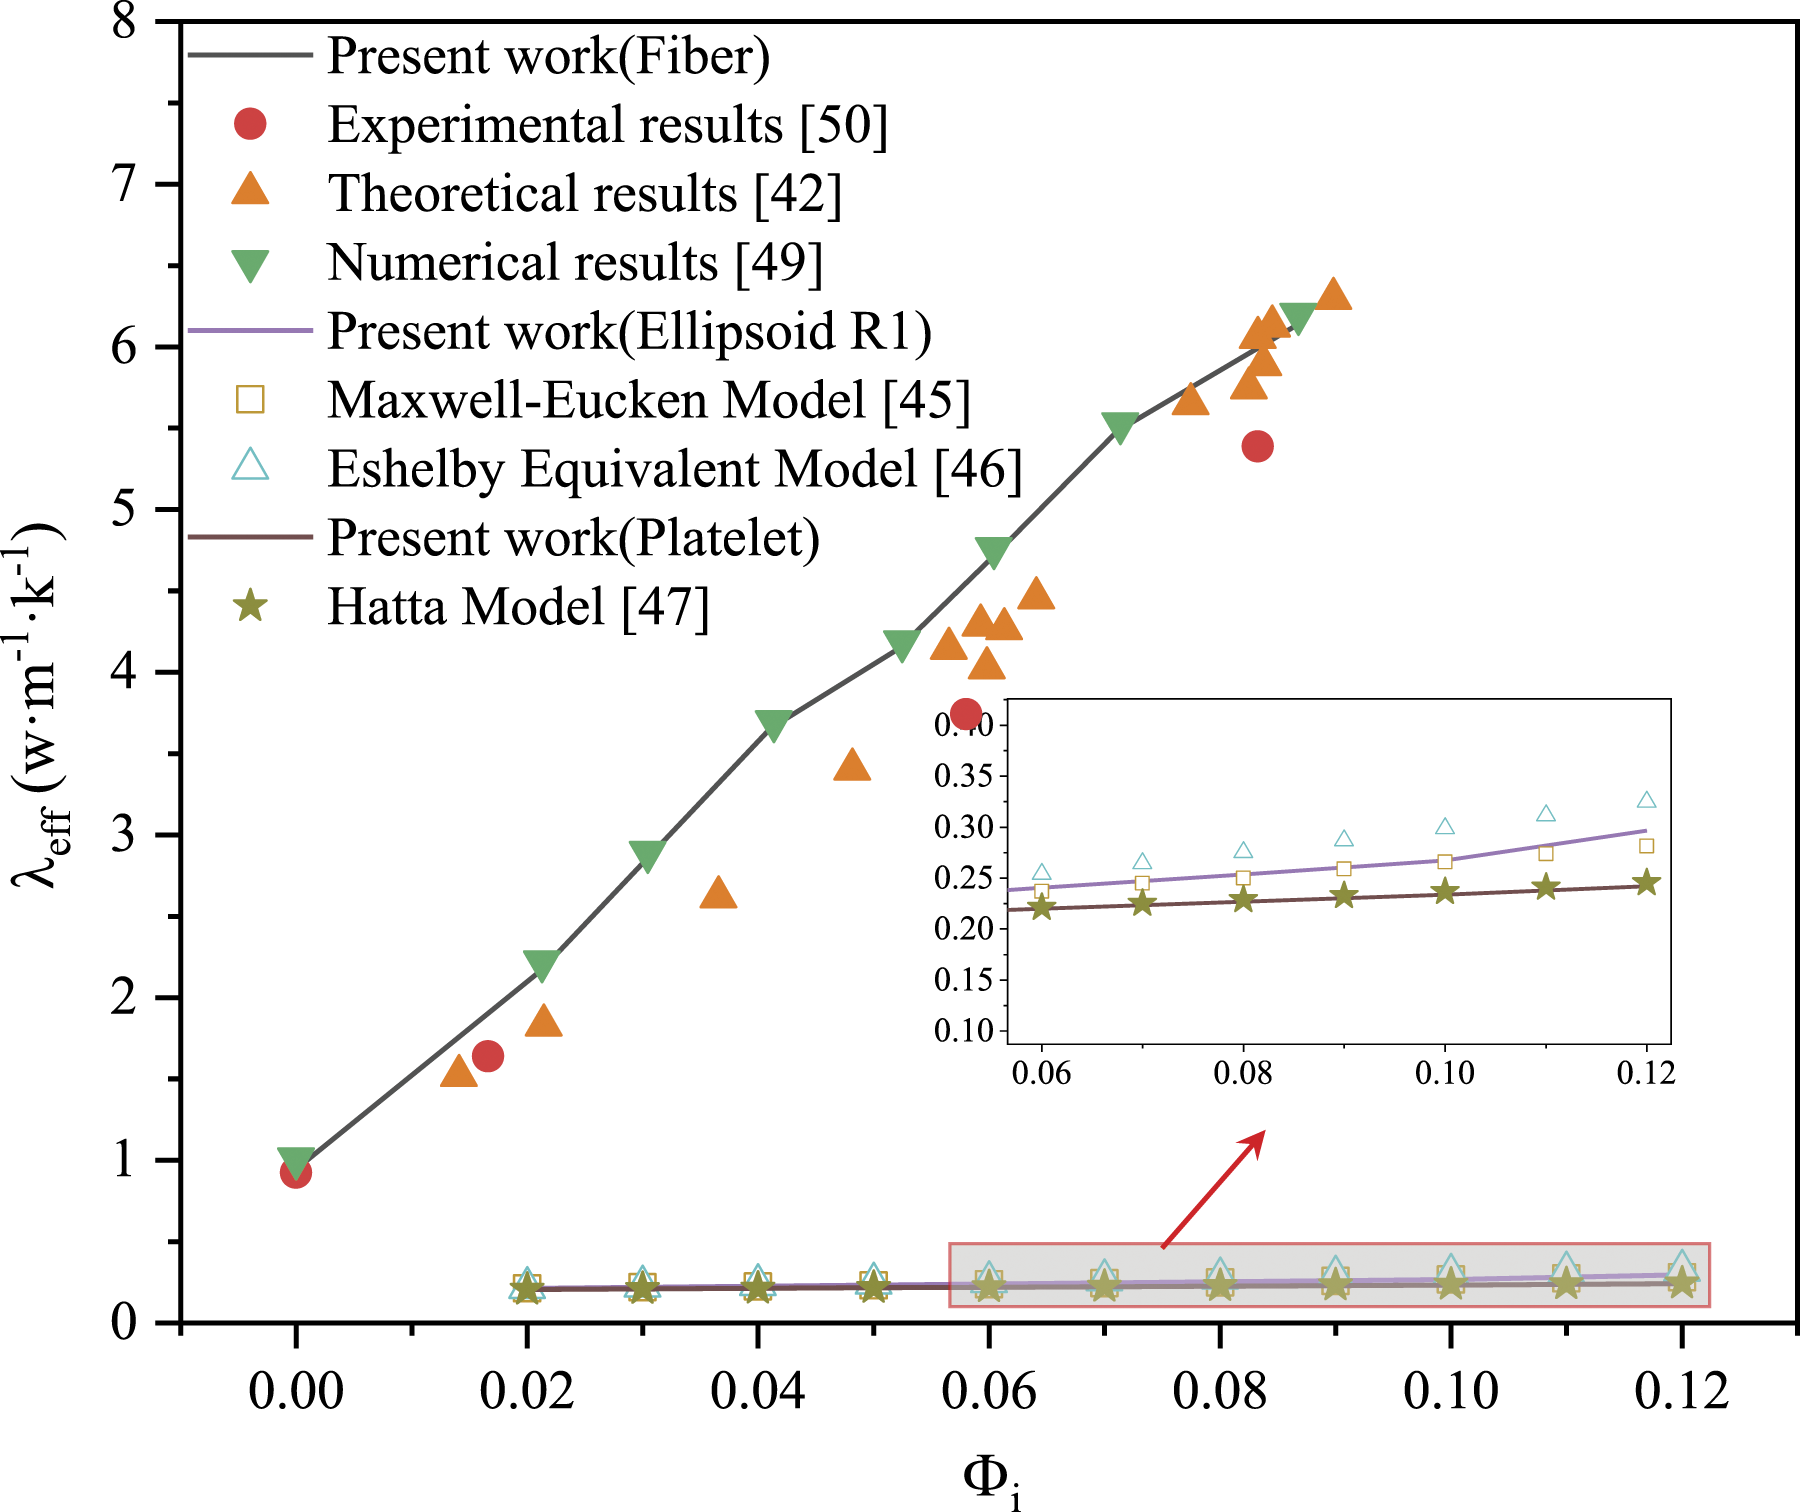
Maxwell-Eucken Model
44
Eshelby Equivalent Model
45
Hatta Model
46
The thermal conductivity results of the fiber-reinforced resin calculated by Zhu et al. were verified using the computational model of this work. 47 Also, the numerical calculation results of spherical and lamellar were compared with the theoretical values of spherical 44 and lamellar. 48 The comparison showed that the calculated results of this paper were in good agreement with the existing experimental results of Liu et al. and were in high agreement with the results of Zhu et al. 47 numerically calculated using the lattice Boltzmann method. The figure showed that the calculated results of the present numerical model demonstrated a high degree of agreement with the experimental results of Frustri et al. 49 The figure also plots the numerical results of Wang et al. 50 using lattice Boltzmann calculations and the numerical calculation results of Zhu et al. using MRT-LBM. The numerical calculation results of spherical and flake filler reinforced composites were compared with the existing models, theoretical values, and both showed a high degree of agreement to verify the accuracy of the computational models. It can be seen that the numerical calculation results of this calculation model for complex materials have computational accuracy and validity.
Results and discussion
In the present work, the thermal conductivity of the filled epoxy composites were simulated using the finite element combined with molecular dynamics approach. The factors such as shape, nature, orientation and coating thickness of the fillers were studied on the thermal conductivity of the composite system. The variation of the ETC of the composites was mainly dominated on the excellence of the heat network constituted by the fillers. Therefore, the most direct way to control the magnitude of ETC of fiber composites is to construct thermally conductive pathways. It is beneficial to control the heat transfer directions for composite applications on account of the anisotropy of the filler structure. In addition to controlling the filler volume fraction to modify the ETC of the composite, the pattern of influence of the filler structure on the heat transfer direction becomes crucial. As mentioned above, there are a number of factors that affect the thermal transport properties of composites.
Influence of filler structure
In the process of high precision heat transfer, the influence of structure shape and interface thermal resistance on heat transfer cannot be ignored. The interface model of ellipsoidal packing was continuously adjusted by the application of similar principles. Ellipsoidal graphene was used to represent the ellipsoidal interface. The computational model was divided into 40 blocks along the Z-axis, and the temperature gradient was calculated between each two blocks. During molecular dynamics simulations, the heat flux was generated by the exchange of velocities between atoms in different regions. In the present work, molecular dynamics simulations were calculated with 100 ps duration and 0.1 fs time step.
The ellipsoidal interface structure established by a similar principle was different from that of the graphene interface, and its ITC also exhibited significant differences. As shown in the Figure 6, the calculated ITC of the ellipsoidal interface was larger than that of the multilayer graphene interface. The phonon density of states calculation showed that the overlap area of ellipsoidal interface DOS and cross-linked epoxy resin was larger near 50 THz, which was favorable to the phonon vibration matching degree of both materials. When copper was coated on the elliptical interface structure, the ITC increased significantly, indicating that the interfacial thermal resistance between copper and elliptical graphene was minimized, which effectively reduced phonon scattering and facilitated phonon transport. Through the DOS plot analysis, it can be intuitively found that in the relatively low frequency range, the phonon vibration strength of copper-clad elliptical graphene was significant and could match almost all materials in the paper, which was beneficial to reduce the interfacial thermal resistance. However, near the low frequency of 0THz, the copper-clad ellipsoidal graphene was not overlapped and phonon scattering existed. Compared with the interface model without copper coating, the interfacial thermal resistance was effectively reduced after copper coating, which facilitated the internal heat transfer of the material. (a) Variation of thermal conductivity with time for different structural interface models and (b) variation of DOS distribution with frequency for different materials.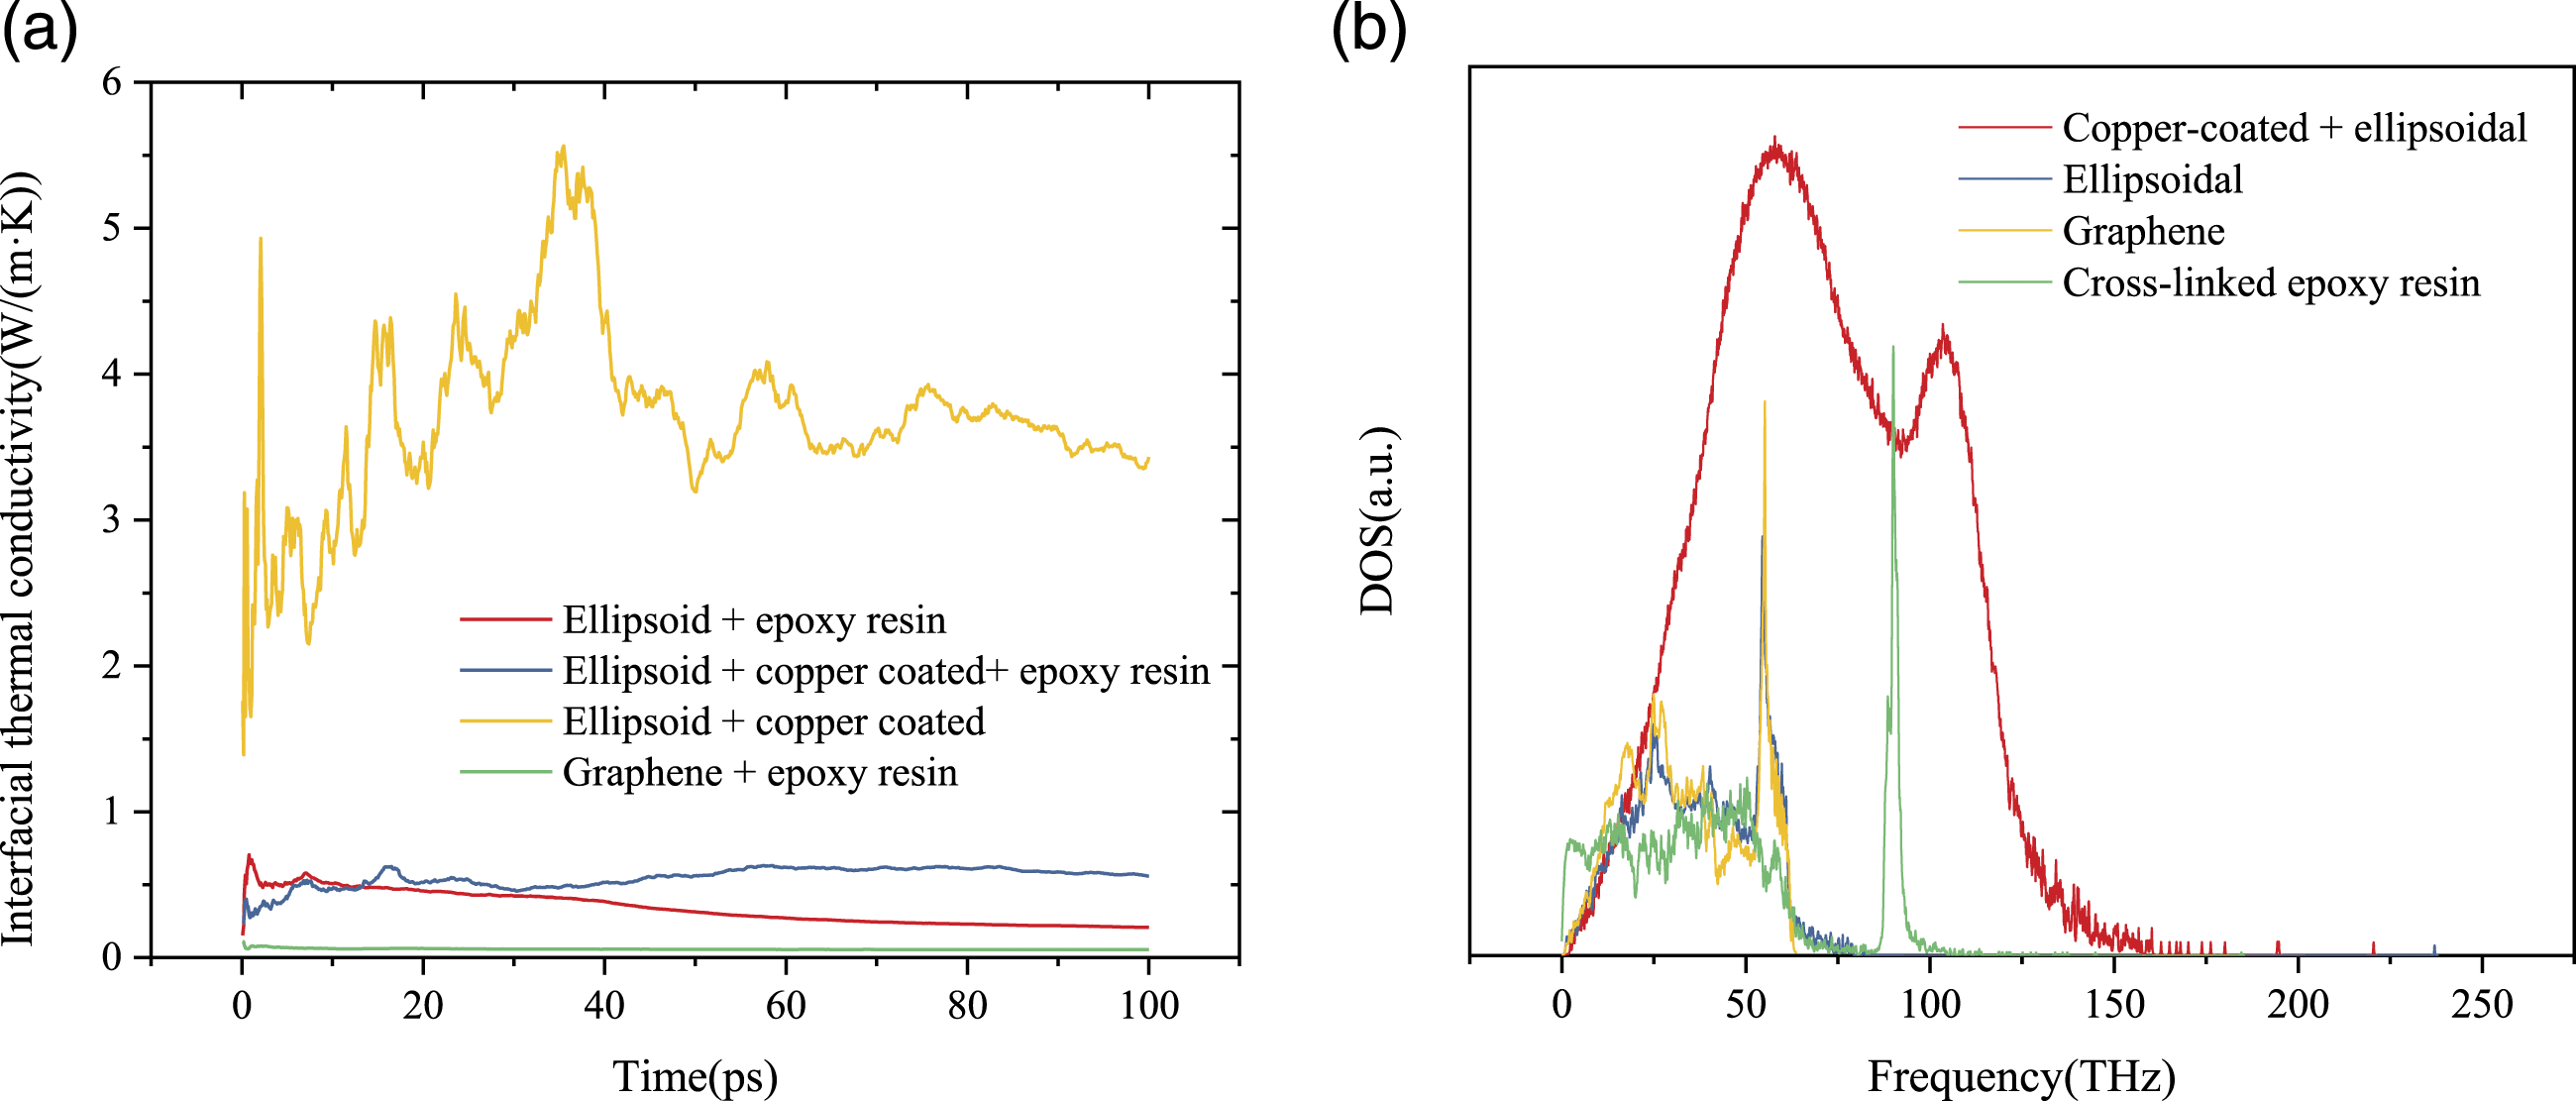
All ellipsoid distribution directions shown in Figure 7 were kept consistent, setting the ellipsoid length direction as the temperature gradient direction. The variation of normalized ETC with volume fraction for different structured particle filler reinforced composites as shown in the Figure 7. The interface model of ellipsoidal filler was built using similar principles, and the interface models of other shapes of filler models were built using multilayer graphene and epoxy resin. The results showed that the variation of thermal conductivity with filler volume fraction was not affected with filler structure and all exhibited the linear variation. The thermal transport properties of fiber-reinforced composites were the most influenced of volume fraction. The ETC could achieve maximum 3600% growth over the range of 0–12% volume fraction variation. The ETC of the matrix can be significantly improved as the fibers distributed within the matrix in the direction of temperature gradient and combined with the matrix in a parallel manner. The use of increasing fiber volume fraction to enhance the matrix ETC was the most effective method. Influence of filler geometry on the normalized ETC of the composites.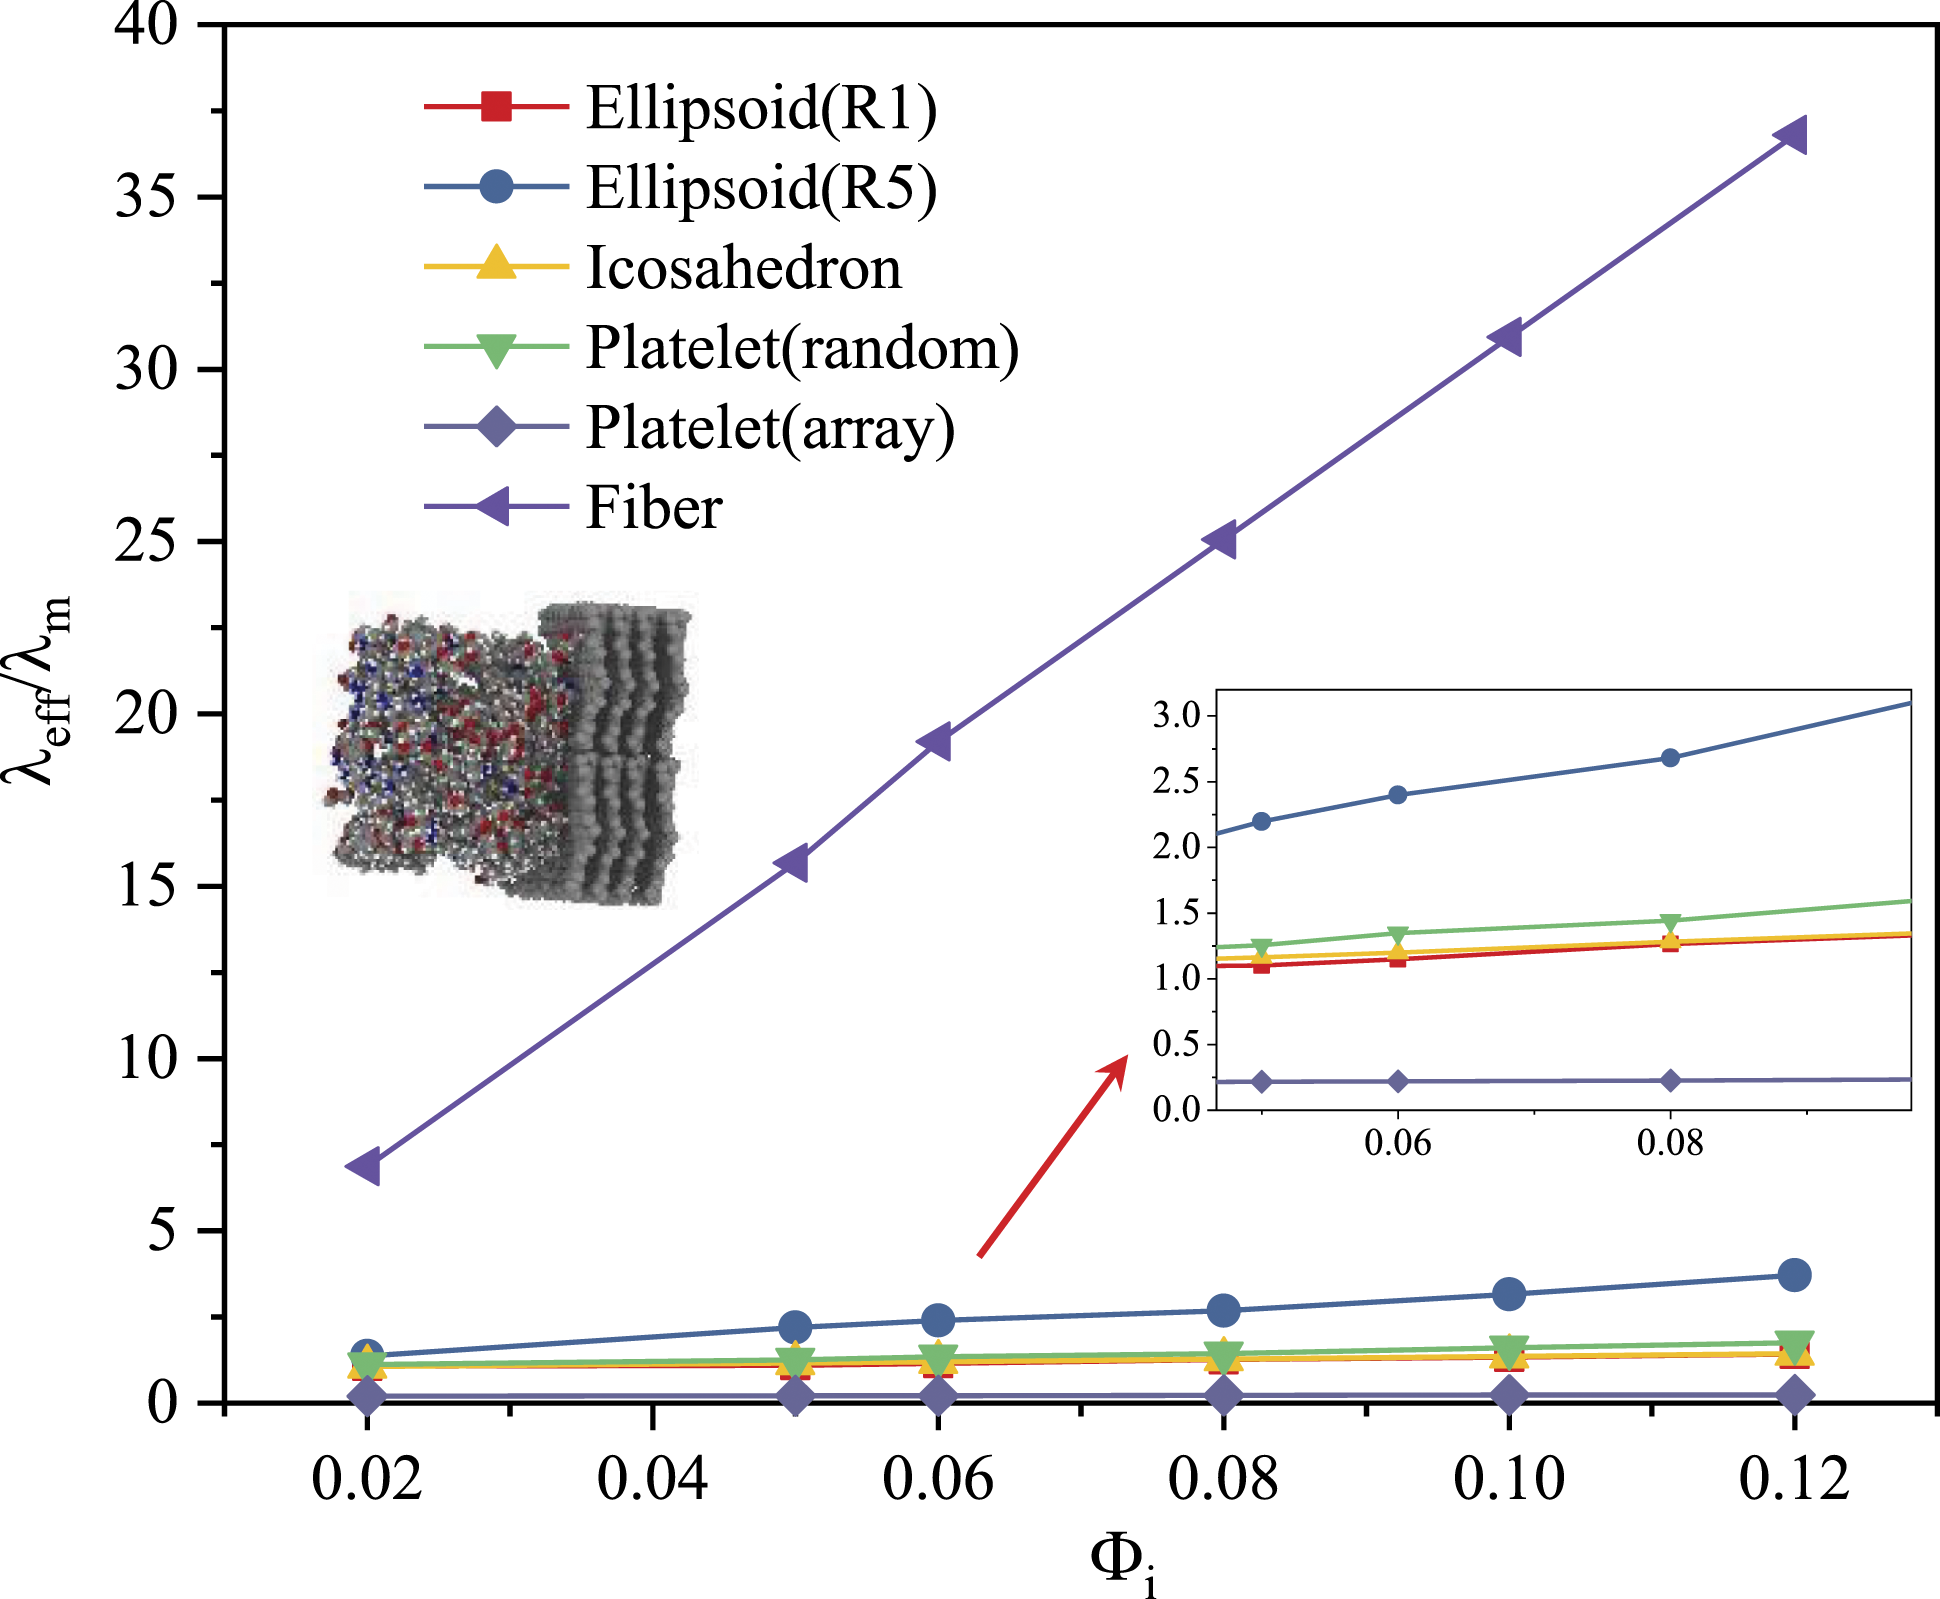
When the fillers were discontinuous particle-type shapes, the normalized ETC of spheres, ellipsoids, icosahedra and flakes were slightly different at low volume fractions (less than 2%), which did not have a significant effect on heat transport. With increasing volume fraction, the minor differences became apparent, and the normalized ETC of the ellipsoid showed a larger growth rate in the heat transfer direction, and the growth trend became more pronounced with increasing volume fraction. The normalized ETC of composites prepared with flake fillers randomly distributed in the substrate space was similar to that of sphere- and dodecahedral-reinforced composites. The main reason for this was the similarity in overall combined structure of the random distribution of the lamellae to the spheres and the consistency of the distribution within the matrix. The ETC variation patterns of the sphere and dodecahedron filled composites almost overlap. As a result of the structural similarity, the heat transfer properties exhibited were basically the identical. The difference between the normalized ETC variation law of the plates randomly distributed in space and that of the sphere can be basically negligible, because the combination of distributions formed with multiple plates randomly distributed in space was similar to the sphere and thus exhibited great consistency with the variation law of the sphere. The above analysis indicated that continuous fiber-reinforced composites ETC reinforced most effectively with increasing filler volume fraction and more easily formed continuous high thermal conductivity heat transfer network pathways. The particle-like fillers with limited ECT reinforcement effect and the changes in structure lead to changes in ETC variation trends, which can be realized to provide a reference for the adaptation of composite applications with specific ETC variation requirements.
The structural shape of the particle fillers is an influencing factor for the normalized ETC of the composites, and it is valuable to further study the influence law of the aspect ratio and fillers distribution on the ETC of the composites. The aspect ratio of the ellipsoid established in this paper was set in the range of 1–5. When the aspect ratio was too large, its influence on the thermal transport properties of the reinforced composites was similar to the fibers.
As shown in Figure 8(a), it was proved that the way of distribution of the filler was one of the influencing factors for the ETC of the composite. When the length direction of homogeneous particles was distributed parallel to the temperature difference direction, the ETC varied significantly with the volume fraction, which showed more significant modulation effect and more obvious reinforcement effect compared with the random distribution. The maximum increase of ETC up to 370% was achieved in the volume fraction range of 0–12%. The normalized ETC of the composite constructed with large aspect ratio particles randomly distributed in the xoy plane and in space was plotted in the figure. In the case of low volume fraction, the influence of the ellipsoidal aspect ratio on the normalized ETC of the composites can be negligible. As shown in Figure 8(b), the particle-reinforced composites with different directional distributions showed a linear increase with increasing volume fraction, but the reinforcement effect exhibited by different directional distributions produced significant differences. The reinforcement effect of ellipsoidal particle-reinforced composites arranged along the heat flow direction was better than that of particle-reinforced composites with planar and spatial random distributions. In the filler volume fraction range from 0% to 12%, the normalized ETC of particle-reinforced composites with different aspect ratios could reach 0%–170% enhancement. When the volume fraction of filled particles was large, the influence of volume fraction and aspect ratio on the ETC of particle-based reinforced composites could be comparable, and the modification of the ETC of composites with the structure and distribution of particles instead of a single increase in volume fraction could be achieved. Variation pattern of normalized ETC with (a) volume fraction and (b) aspect ratio of fillers in filler-reinforced composites with different distribution patterns.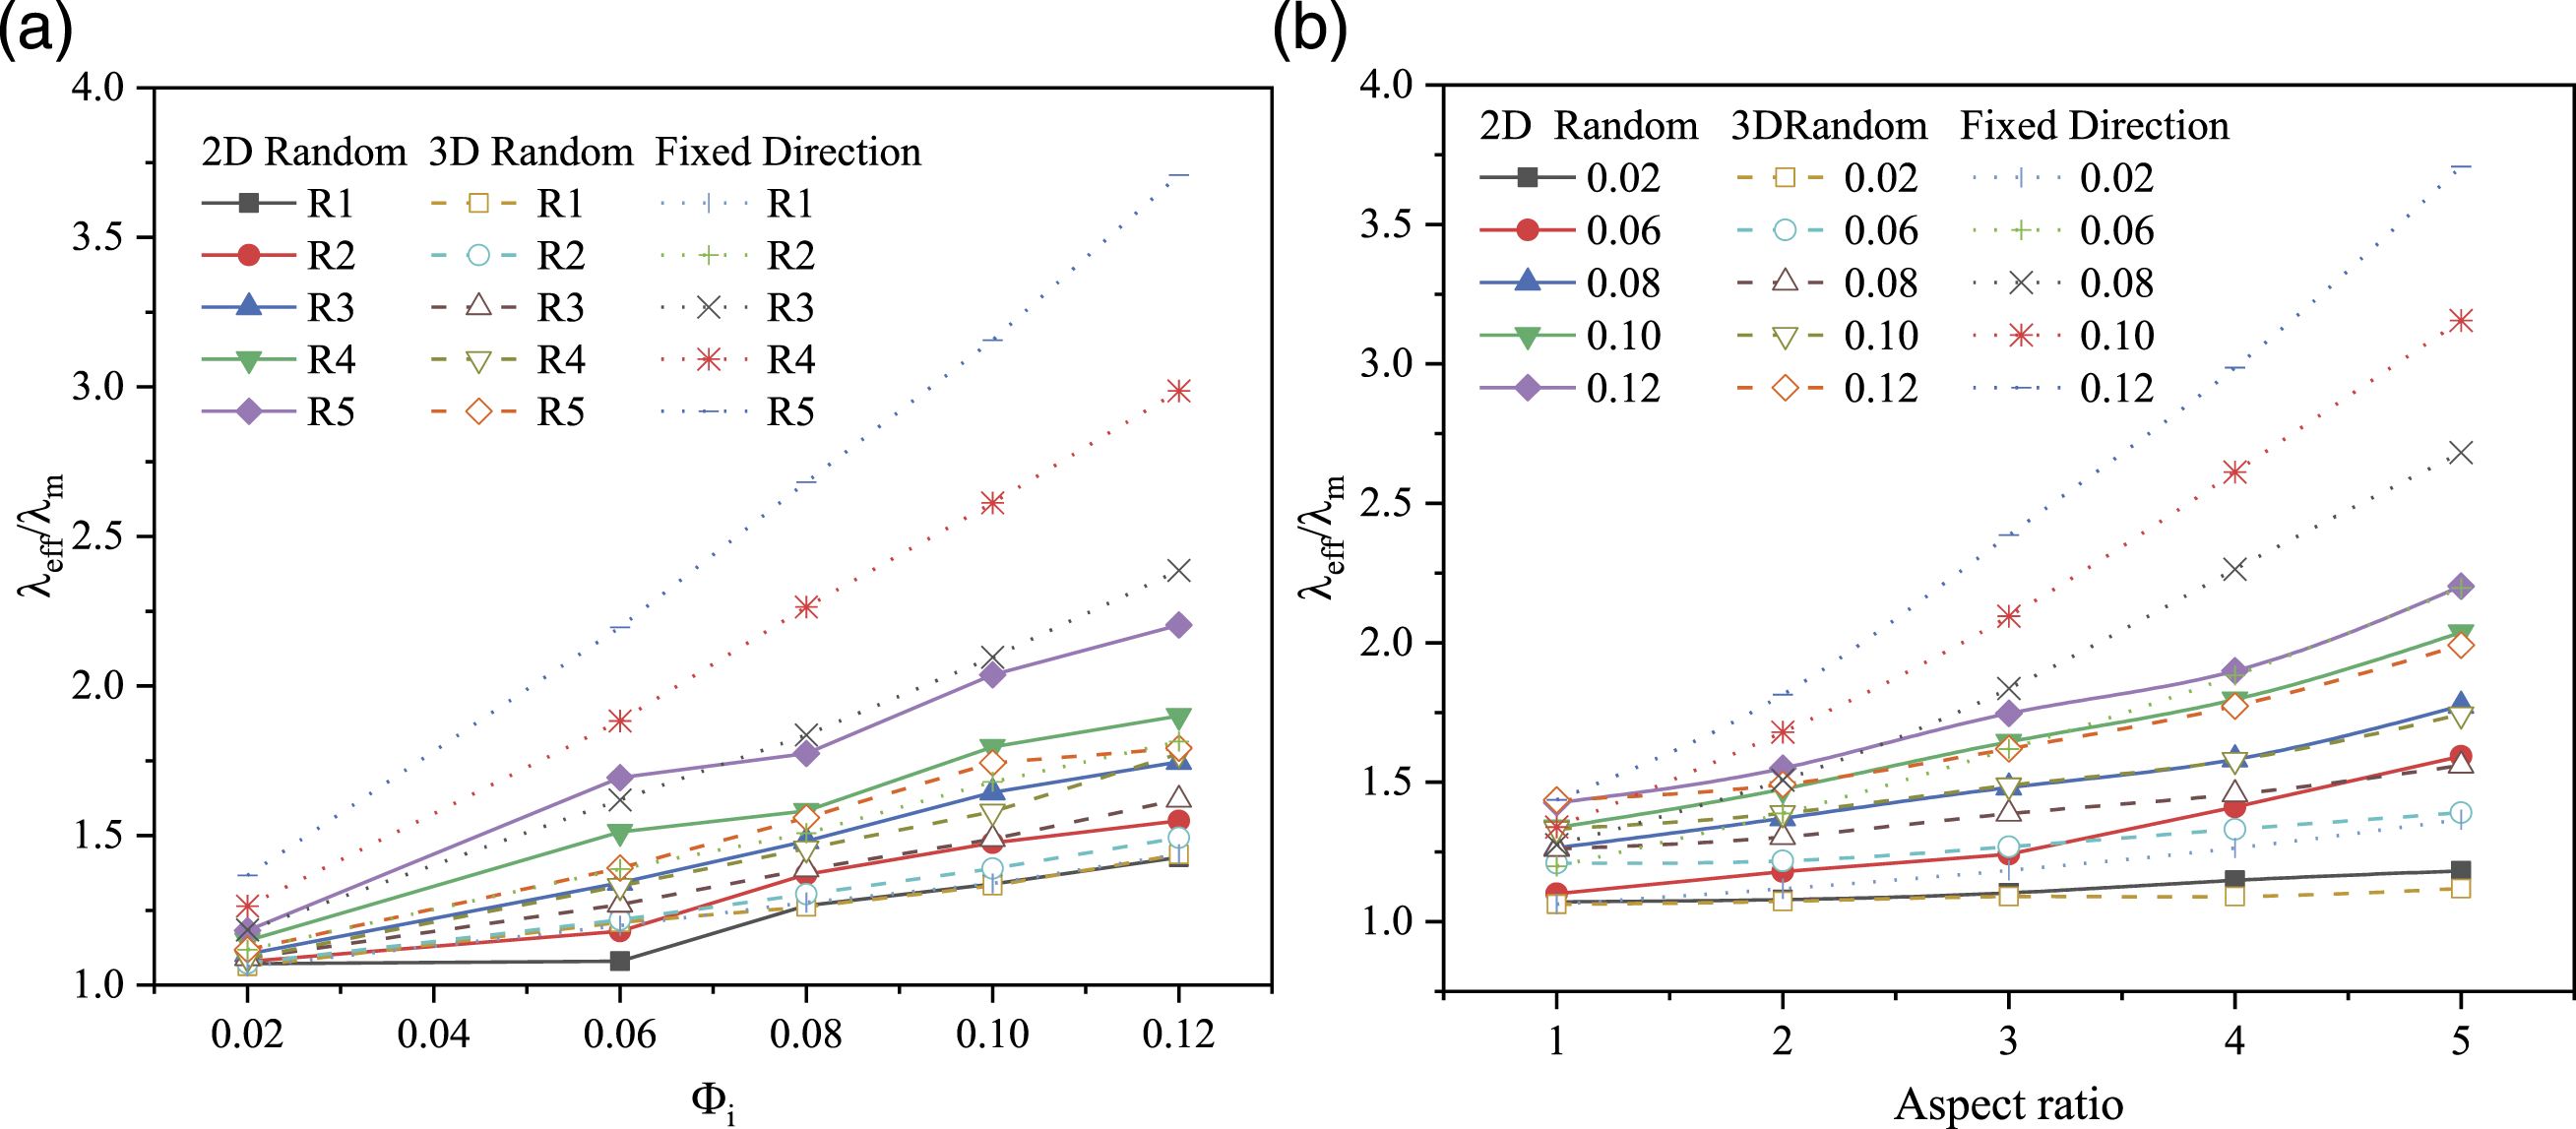
At high filler volume fraction (12%), the normalized ETC of ellipsoidal reinforced composites showed an increasing trend with increasing filler aspect ratio. The normalized ETC for the same ellipsoidal structure varied considerably due to the different distribution patterns inside the constructed composites. The reason for the above phenomenon was that the normalized ETC was the combined representation of the ratio of the conduction heat flux to the temperature gradient at each discrete point (Figure 9(a)) inside the composites. The ellipsoid was randomly distributed in the xoy plane (Figure 9(b)) exhibited a larger range of fluctuations in the integrated temperature gradient at each discrete point compared to the case of random distribution in space (Figure 9(c)), while the overall fluctuations in the conduction heat flux were wider, and thus the composite showed greater normalized ETC. The ellipsoid-reinforced composites distributed along the x-axis (Figure 9(d)) performed smooth integrated fluctuations in temperature gradients at each discrete point, while the heat transfer flux fluctuated more, therefore the integrated embodiment of the normalized ETC of the composites was significantly larger than the previous two distributions. Distribution of temperature gradient (TG) and heat flux (HT) at discrete points inside the ellipsoidal (R5 in aspect ratio and 12% in volume fraction) reinforced composites with different orientation methods. (a) Schematic diagram of particle positions, with discrete points all taken from the vertices of the ellipsoid; (b) ellipsoidal particles randomly distributed in the xoy plane; (c) ellipsoidal particles randomly distributed in space; (c) ellipsoidal particles lengthwise distributed along the x-axis.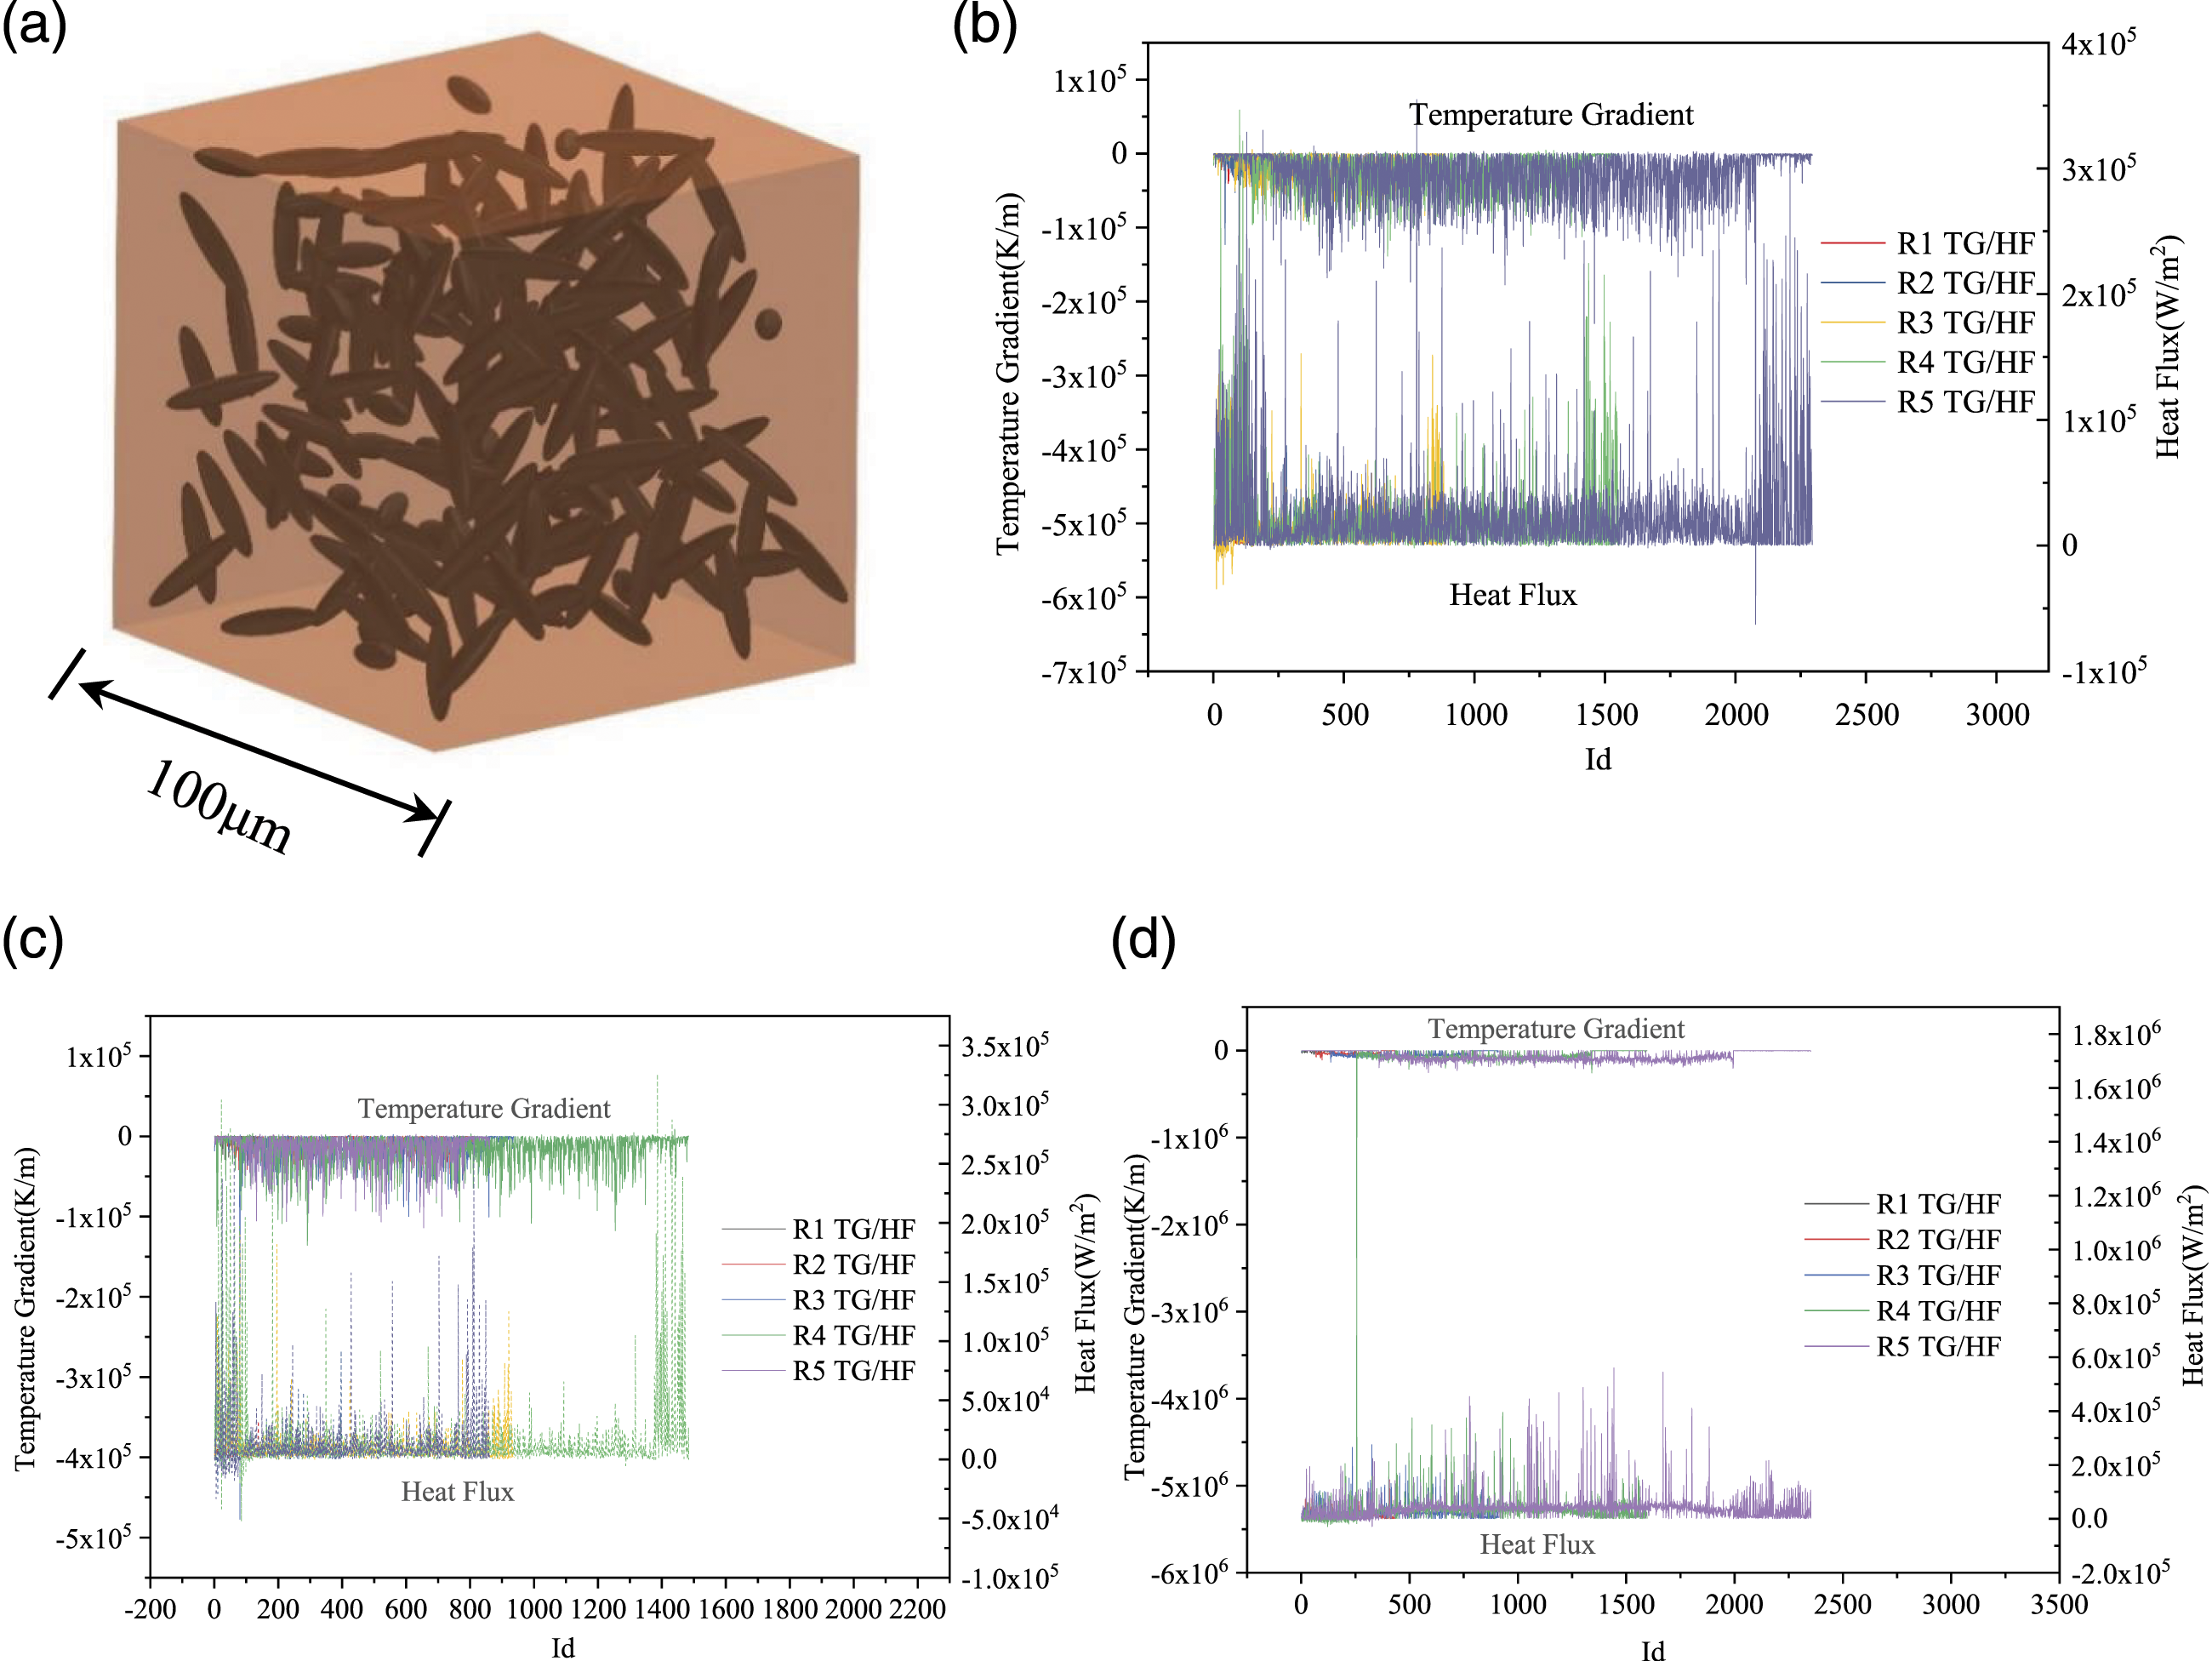
Influence of thermal conductivity ratio
Figure10(a) shows the variation of the normalized ETC with Normalized ETC variation pattern with 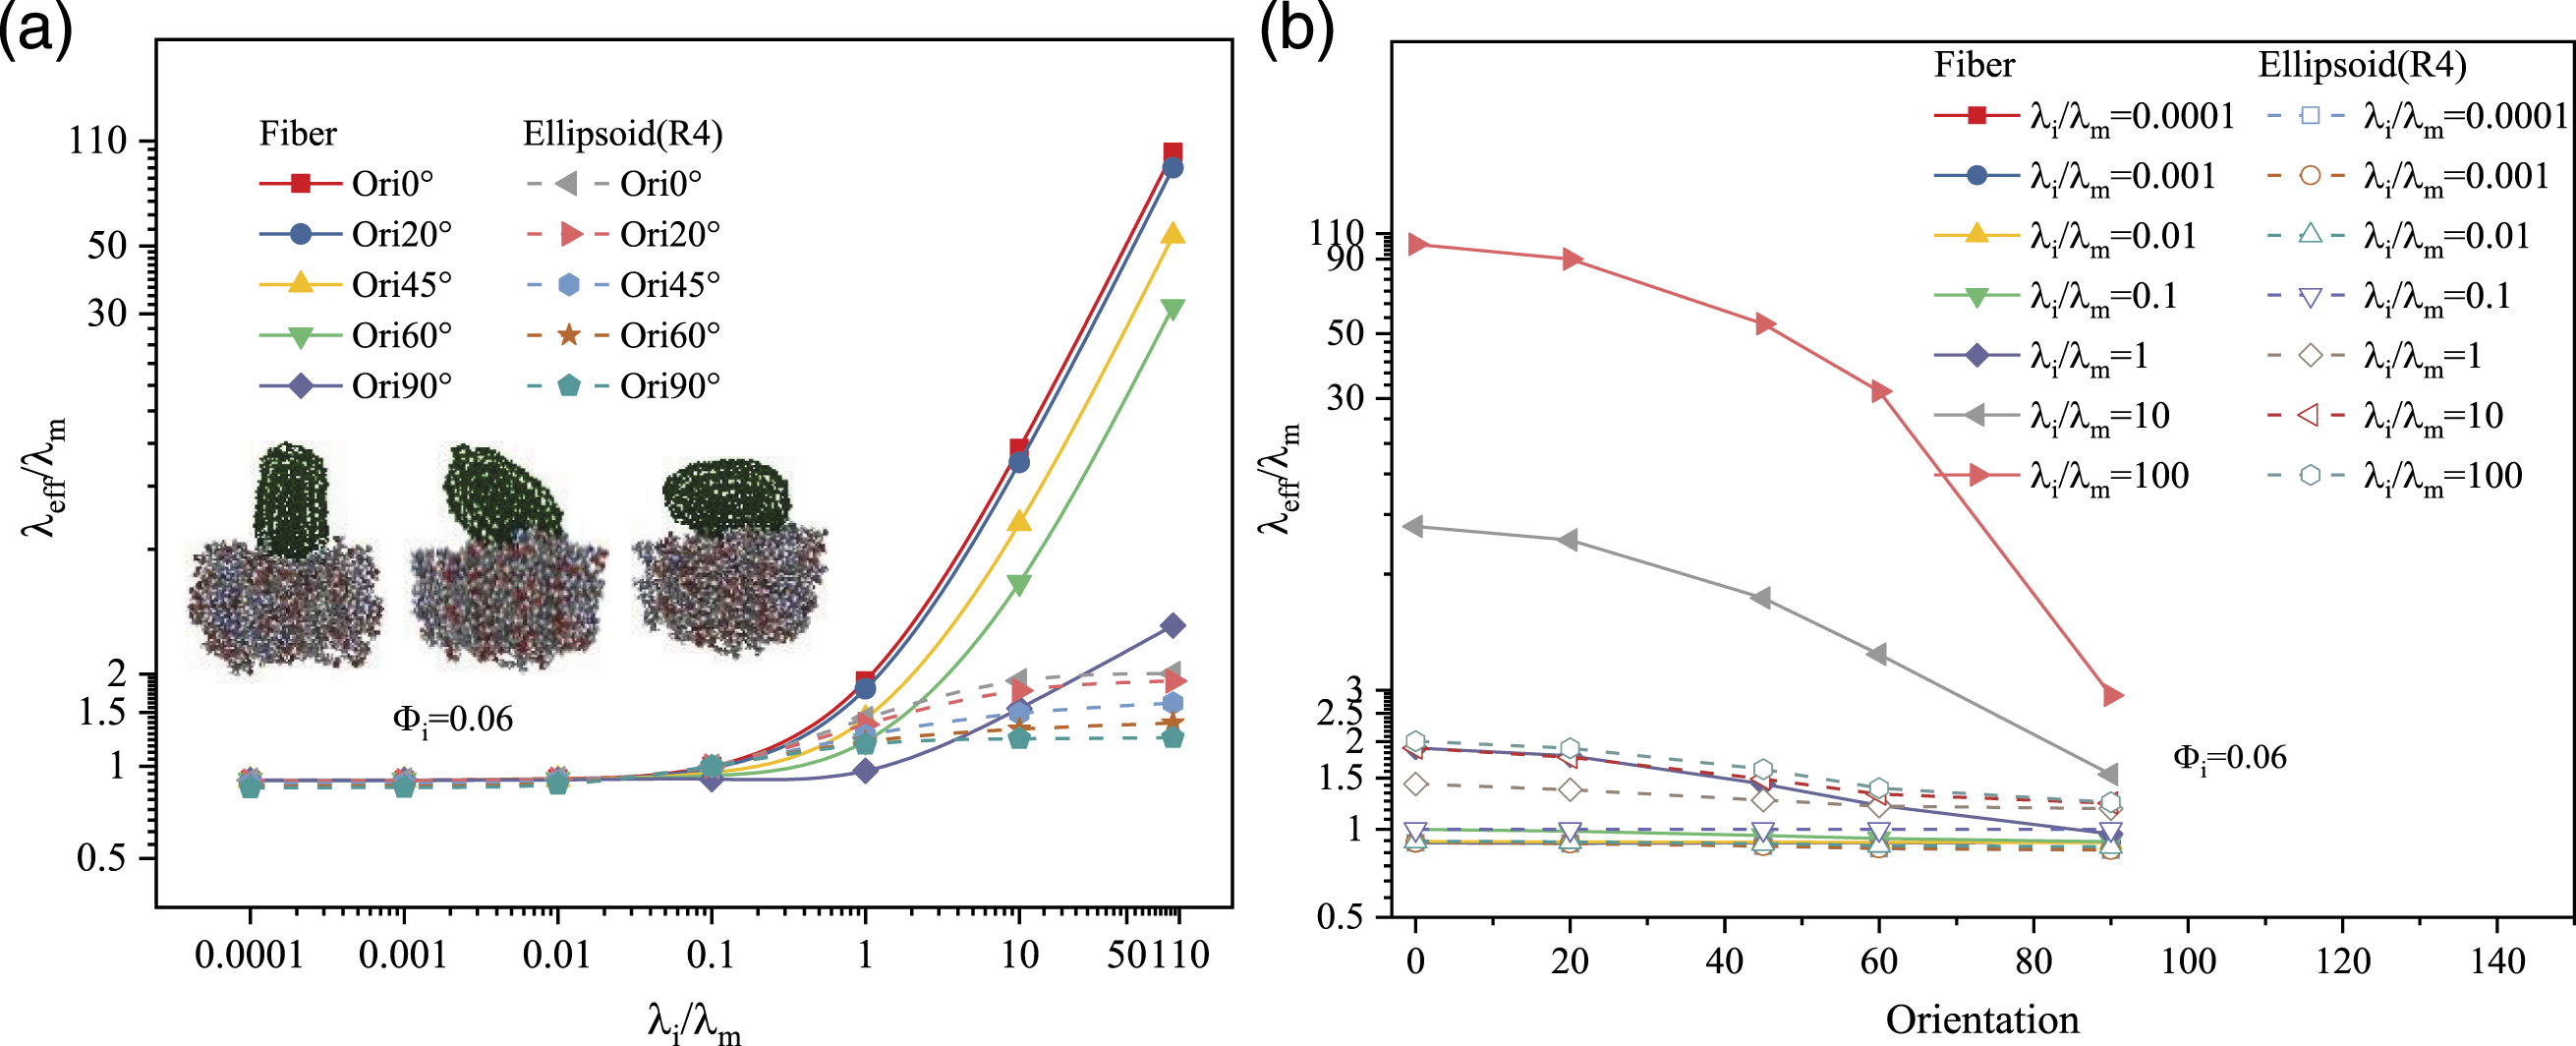
When
The present work tried to regulate the heat transport properties of the composites by controlling the fiber orientation (the angle of fiber deviation from the direction of temperature difference). From Figure 10(b), it could be seen that when
Influence of filler interfusion
The formation of continuous thermal conductivity network within the substrate with fillers could effectively enhance the ETC of the composites. Figure 11 showed that the interfusion among the fillers could effectively increase the normalized ETC of the reinforced composites. The fusion among the fillers produced different results on the composite ETC depending on the distribution method. In this section, ellipsoidal spheres with an aspect ratio of 4 were used as fillers for the study. The increase in normalized ETC of fused filler reinforced composites with increasing volume fraction was more pronounced than that of non-fused filler composites. It can be well demonstrated that the mutual fusion could enhance the heat transport effect of the composite when the ellipsoid planes distributed randomly. The fillers with low volume fractions fused to each other had a slight enhancement effect on the ETC of the reinforced composites when they were randomly distributed in space, and such effect could be neglected. In the case of high volume fraction, it remained almost identical to the normalized ETC of non-fused filler composites. The possible explanation is that when the ellipsoid is randomly distributed in space, the particles have equal probability of distribution in the length direction along the heat flow direction and in the direction toward the surroundings. Therefore, the filling length direction is uniformly distributed in space, and the probability of forming a thermal network dominated in the heat flow direction is equal. Also, because the percentage of mutually fused fillers is smaller in the low volume fraction case, the contribution to the composite ETC becomes small. In the case of high volume fraction, the fillers were spaced shorter in the matrix and the effect embodied by the filler fusion was weakened, eventually maintaining a consistent trend of variation. The mutually fused ellipsoids have greatly increased probability of distribution in the length direction along the heat flow direction when they are randomly distributed in the xoy plane. Therefore, it is easy to form an effective heat transfer network in the heat flow direction and improve the ETC of the reinforced composite. The normalized ETC gradually increased with the volume fraction, and the enhancement was more excellent when the volume fraction increased above 3%. The number of particles increased, the probability of mutual fusion increased and the thermal network formed better. For the case of mutual fusion of fibers, the fusion interface is a continuous rectangular cross-section, which can effectively widen the heat transfer channel and thus more favorable to the heat flow. Influence of interfusion of fibers and ellipsoids with different distribution within the matrix on the normalized ETC of reinforced composites.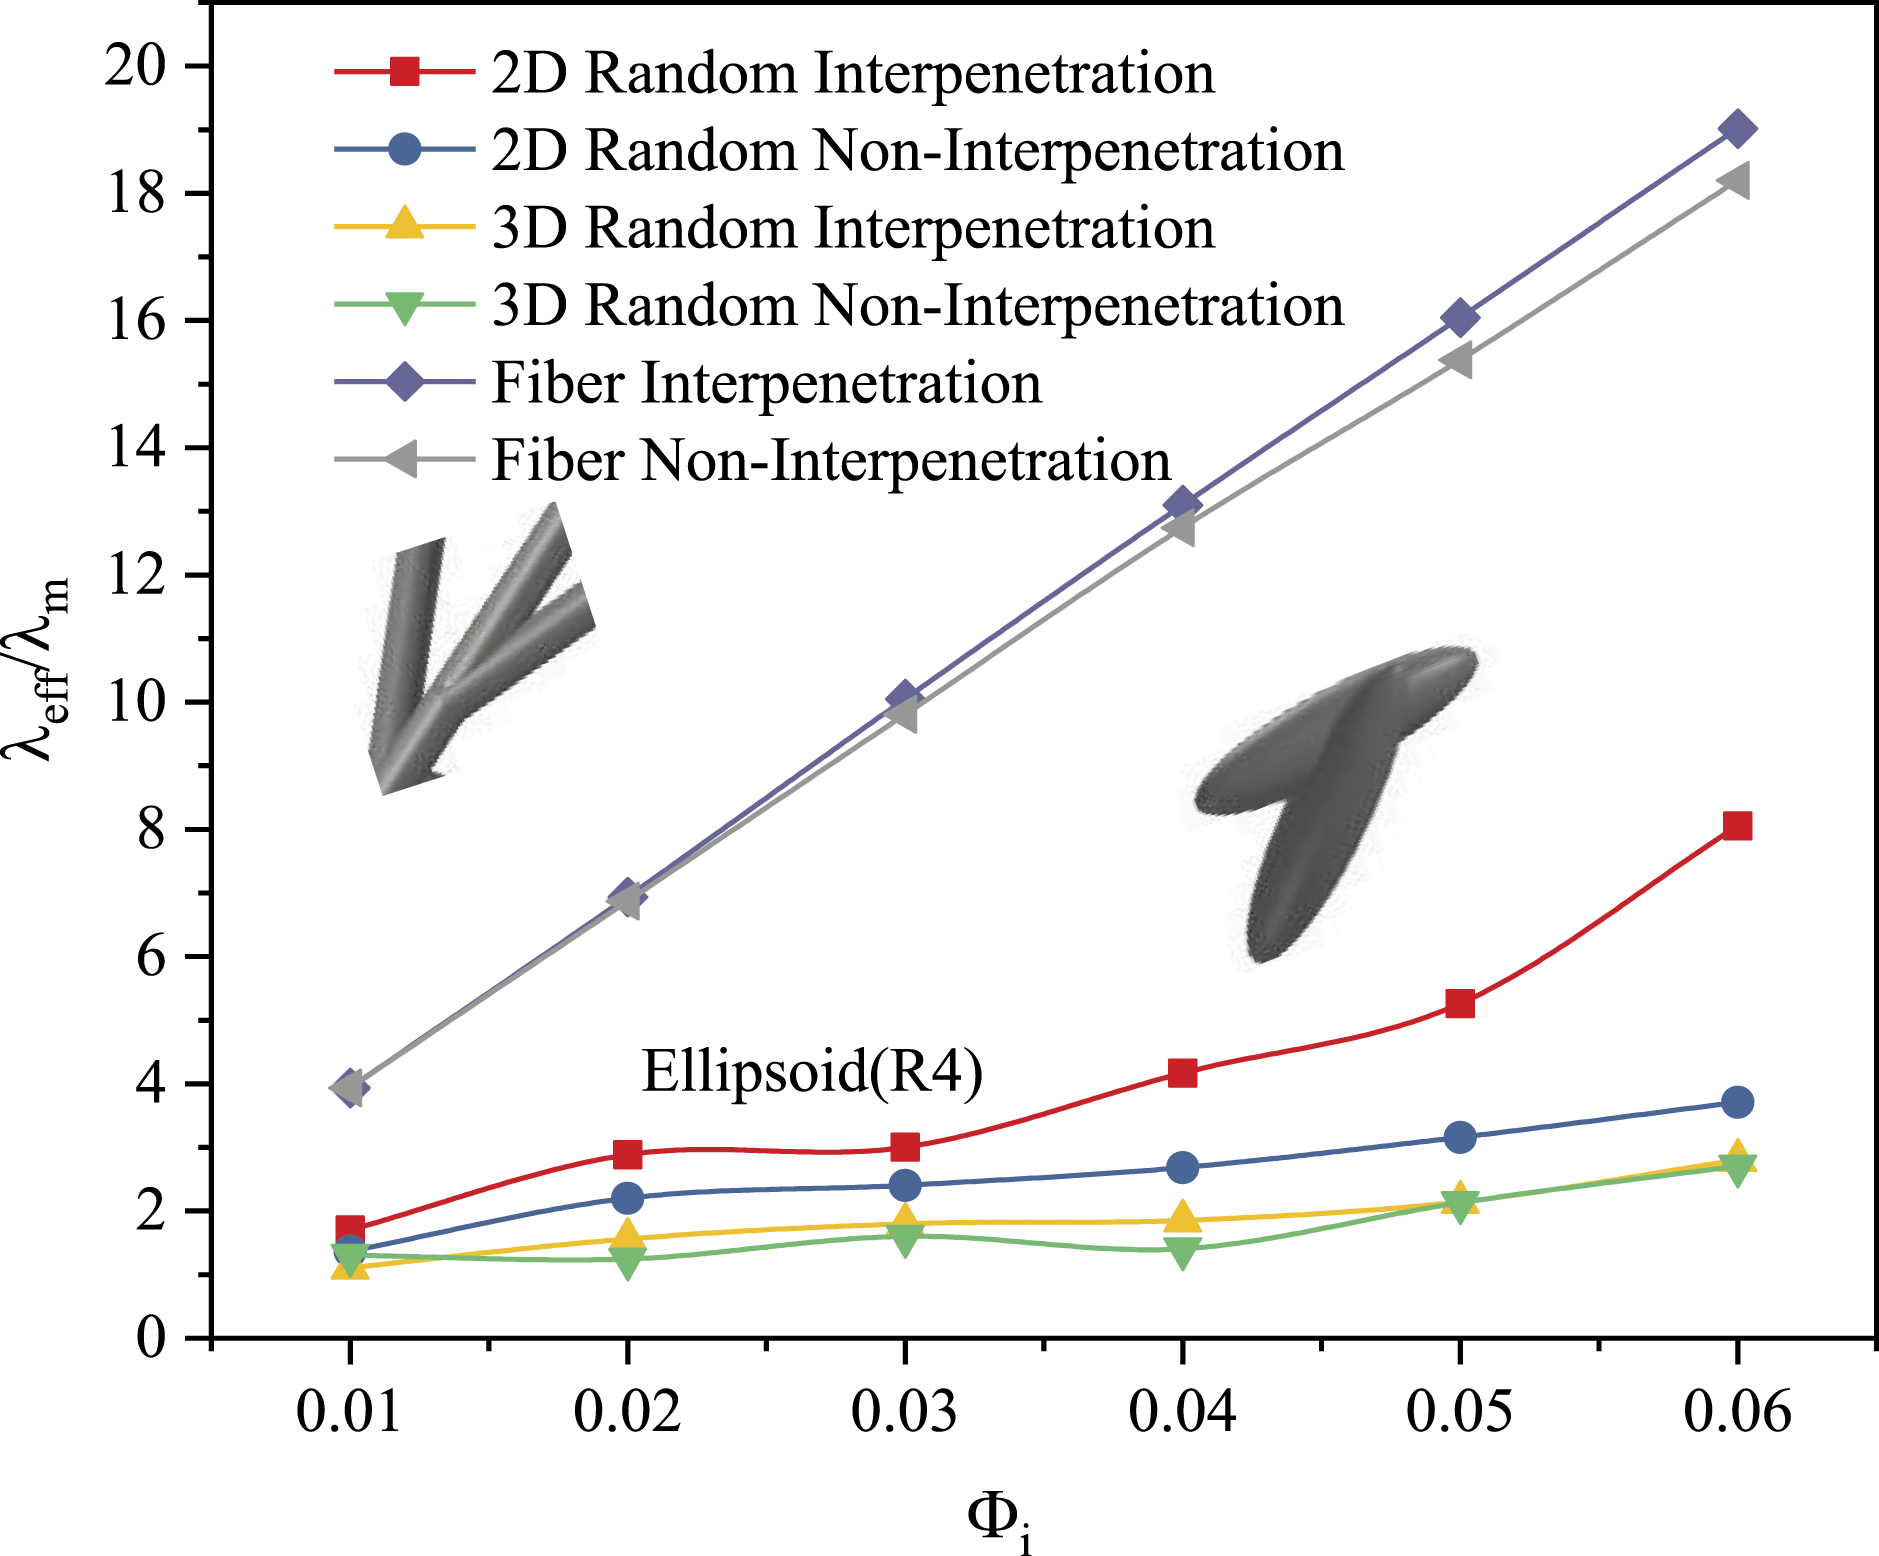
Influence of coating thickness
Commonly applied metallic materials such as pure Al, Cu and Ag have excellent thermal conductivity, however, their higher coefficient of thermal expansion is difficult to match with the matrix. Therefore, it leads to a large thermal mismatch in the operation of the composite material, reducing reliability and even leading directly to failure. In the present work, we proposed to enhance the thermal transport properties of composites by using metal coating overlay, which could solve the problem of thermal transport failure of composites due to high expansion coefficient.
Metal coatings can be selectively applied to particle surfaces using various methods, including chemical vapor deposition and electrostatic techniques. For instance, in the case of graphite/paraffin thermally conductive composites, a micro-cladding method is employed to prepare the materials. 51 This process involves hot pressing graphite coated with graphite onto the graphite surface, enabling the enhancement of thermal conductivity within the composite. The controlled application of the metal coating facilitates efficient heat transfer, meeting the requirements for effective heat dissipation in the composite. In another study, researchers have developed MXene@Ag fillers through an in situ growth process. 52 By growing silver (Ag) nanoparticles directly on the surface of MXene nanosheets, the researchers achieved improved thermal conductivity properties within the composite. This innovative technique enables the integration of Ag nanoparticles, enabling enhanced heat transfer capabilities within the composite material. These examples highlight the utilization of diverse methods to introduce metal coatings on particle surfaces, thereby enhancing the thermal conductivity of composites. Techniques such as chemical vapor deposition and electrostatic methods offer researchers the ability to tailor the properties of composites to meet the increasingly demanding requirements for efficient heat transfer in a variety of applications.
The coating thickness is a controllable process parameter and the volume fraction increases with increasing thickness. Figure 12(a) showed that the ETC of the composite constructed with particles randomly distributed in the plane and space was not affected by the volume fraction of the coating. The normalized ETC of the composites was significantly affected by the volume fraction of the high thermal conductivity coating of the particles when the ellipsoid length direction remained consistent with the temperature difference direction. The high thermal conductivity coating with low volume fraction significantly enhanced the ETC of the composites. The ETC could be basically considered to increase linearly with the increase of volume fraction. The composites considered as a combination of parallel and tandem systems due to the regular arrangement of the coating particles in space. Figure 12(b) showed the angular variation of the way ellipsoidal particles were distributed within the substrate. Increasing the volume fraction from 1% to 5% led to a significant enhancement in thermal conductivity, with an improvement of up to 40%. Notably, at a coating volume fraction of 5%, composites with a regular arrangement of fillers exhibited an ETC that was 350% higher than those with a random distribution of fillers. This finding demonstrates the effectiveness of achieving thermal transport regulation in the high thermal conductivity coating state. The thermal conductivity of the high thermal conductivity coating surpassed that of both the substrate and the particles. However, the particle distribution method had a more pronounced impact on the ETC of the composite. Therefore, it is evident that a judicious combination of the coating volume fraction and the particle distribution method can effectively modulate the ETC of the composite. These results highlight the significance of considering both the coating thickness and the arrangement of fillers when aiming to optimize the thermal conductivity of composite materials. Influence of coating thickness on the normalized ETC of ellipsoid-reinforced composites with different distributions. (a) Shows the reinforced composites with ellipsoidal random distribution in the xoy plane and space were constructed and the particle-reinforced composites with lengthwise distribution along the heat flow direction constructed. Its normalized ETC as a function of volume fraction. (b) Shows the difference between the random distribution of ellipsoids in the xoy plane and in space by the distribution of various orientations of each ellipsoid.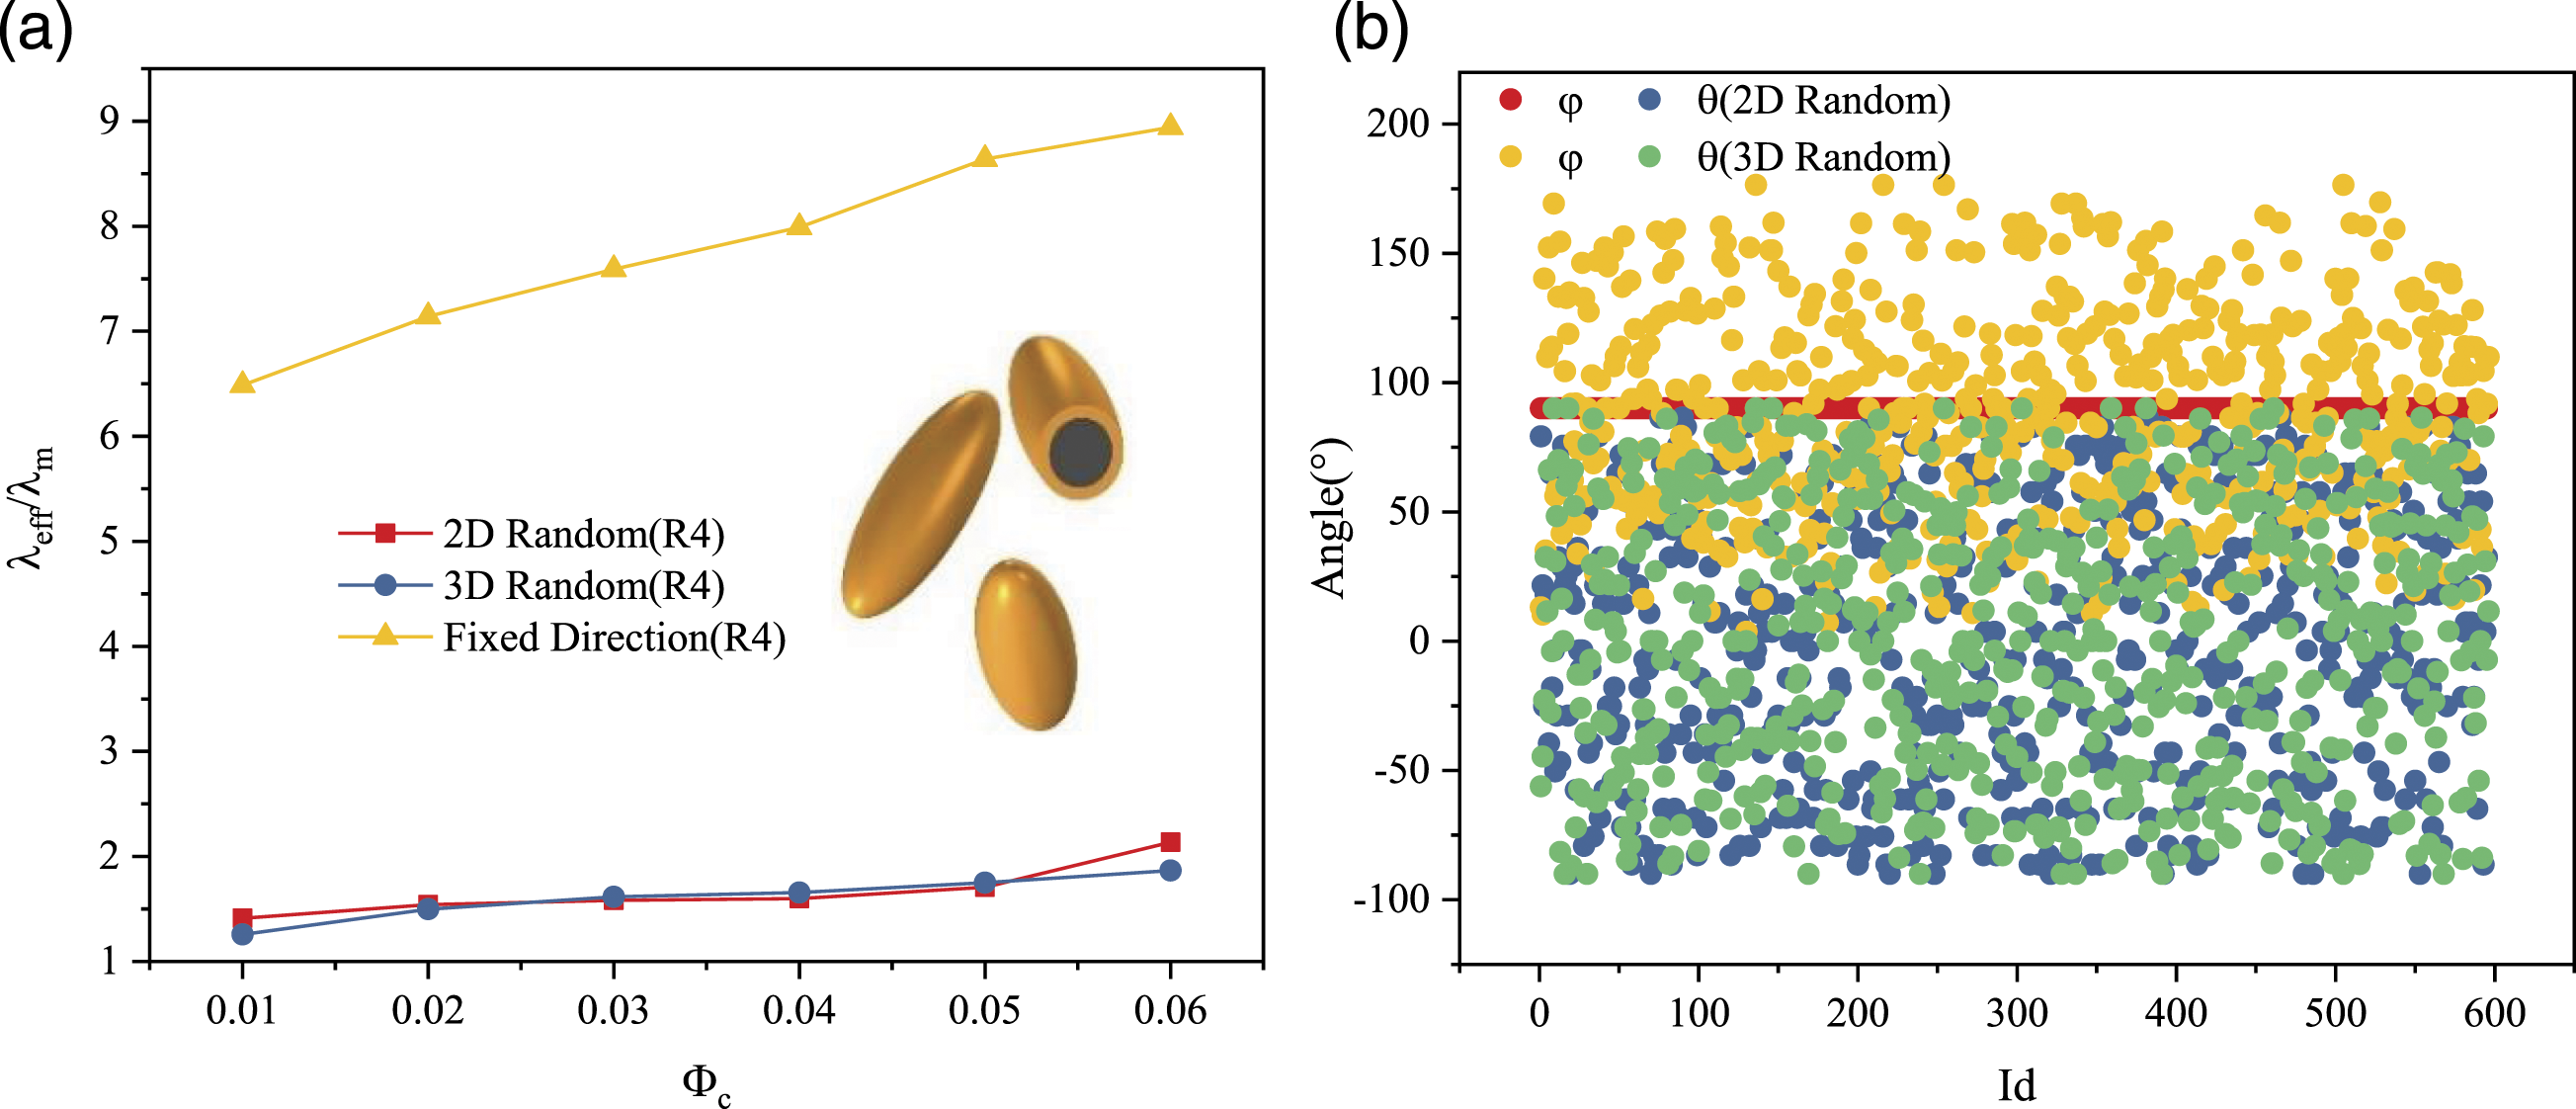
Conclusion
In this study, heat transfer models were combined with reconstructed three-dimensional filler structure-reinforced composites for calculating the normalized ETC of coated/uncoated filler-reinforced composites. (1) The structure of the continuous fiber filler exhibited the greatest influence on the normalized ETC of the composites, and for low volume fractions, effective enhancement of the normalized ETC could be achieved. The structure of the filler was the most important factor in determining the normalized ETC of the particle-reinforced composites, and the degree of influence was comparable to the filling volume fraction of the particles. (2) When (3) The ETC of composites constructed with particles randomly distributed in planes and spaces was not affected by the volume fraction of the coating. When the ellipsoid length direction kept in line with the temperature difference direction, the ETC could be basically considered to increase linearly with the increase of the coating volume fraction. The combination of the coating volume fraction and the particle distribution method could effectively regulate the ETC of the composites. (4) The presence of interfusion among the fillers can effectively enhance the normalized ETC of the reinforced composites. The interfusion of ellipsoids enhanced the heat transport effect of the composites when the ellipsoids distributed randomly in the plane. The random distribution of mutually fused fillers in space had a minor enhancing effect on the ETC of the reinforced composites with low volume fraction, which was negligible.
Footnotes
CRediT authorship contribution statement
Xiangyu Liu: Investigation, Software, Formal analysis, Writing – original draft. Qing Ai: Methodology, Conceptualization, Writing – review & editing. Jiazhe Xu: Validation, Data curation. Yong Shuai: Resources, Writing –review & editing.
Declaration of conflicting interests
The author(s) declared no potential conflicts of interest with respect to the research, authorship, and/or publication of this article.
Funding
The author(s) disclosed receipt of the following financial support for the research, authorship, and/or publication of this article: This work was supported by the The writers gratefully acknowledge support from the National Key Research and Development Program of China (No. 2022YFC2204300) and the National Major Scientific Instruments and Equipments Development Project of National Natural Science Foundation of China (NSFC) (No.52227813).