
Abstract
Carbon fibre (CF) based polymeric composites are being used in automobile and aviation applications due to their lightweight, excellent mechanical and physical properties. In this study, the fused filament fabrication (FFF) technique was used to prepare composite structures of polylactic acid (PLA) sandwiched with CF layers followed by prediction of optimum setting by machine learning (ML). In the first stage, PLA-CF-PLA based composite structures (as per ASTM D638 type IV) were manufactured with deposition of fibre at various angles (0°, 45° and 90°), nozzle temperature (200°C, 205°C and 210°C) and bed temperature (55°C, 60°C and 65°C). Further, the prepared composite structures were subjected to tensile testing (strength at peak and break, strain at peak and break, Young’s modulus and modulus of toughness) followed by fracture analysis through a scanning electron microscope (SEM) energy-dispersive spectroscopy (EDS). The results of the study are supported by X-ray diffraction (XRD), Fourier transforms infrared spectroscopy (FTIR) analysis, and differential scanning calorimetry (DSC). In the second stage, Classification and Regression Trees (CART) of the ML approach were used to model strength at peak and strength at break. The results of the study have highlighted that combination of parameters, 0˚orientation of CF deposition, 205°C nozzle temperature, and 55°C bed temperature are the optimum settings for manufacturing PLA-CF composite structures. The ML CART model is a valuable tool for predicting the strength at peak and strength at break hybrid additive manufacturing of highly sustainable PLA-CF-PLA sandwiched composite structures.
Keywords
Introduction
Additive manufacturing (AM) is a process of fabricating the product by adding material in layer-by-layer form, and this process is commonly known as “3D printing”. AM techniques can manufacture any shape which is complex to machine. 1 AM plays a major role in the research, medical, automotive, and aerospace industries. 2 The materials that can be used in 3D printing are metals, polymers, ceramics and composites etc. The main focus in scientific and industrial fields is metal printing because of the requirement for high-end technological applications. The AM methods are the most mature and polymer-based. These polymers comprise thermoplastics, thermosets, hydrogels, and polymer-based composites. 3 Various AM techniques, such as fused deposition modelling (FDM), stereolithography (SLA), material jetting, powder bed fusion, sheet lamination and binder jetting, etc., are used for manufacturing the 3D printed products of the desired shape. The material suitability and the process for each AM technique are unique based on ASTM standards. 4 With the addition of nanoparticles and nanofiber in the polymer matrix, there is an enhancement in the strength of the printed polymer product or part. 5 The main materials used mostly in 3D printing are PLA and acrylonitrile butadiene styrene (ABS). The materials like metals and alloys are used in the application of the aerospace field because the traditional processes are very difficult and costly. 6 The fibre-reinforced composites are used nowadays to increase the strength of polymer-nano fibre composite parts. 7 With additive loading, the mechanical properties of PLA material get enhanced. The tensile strength and flexural strength of PLA-natural fibre-reinforced composite were increased by 116% and 12% respectively. 8 The incorporation of fibre and nanoparticles in PLA improved the mechanical and physical properties of the composite.9,10 The manufacturing processes and process parameters affect polymer composites’ mechanical properties and other factors. The nozzle temperature, bed temperature, infill density, and line orientations play a major role in the enhancement of the properties of material composite in the FDM process. 11 Due to the addition of 8 wt. % of styrene-ethylene-butylene-styrene (SEBS)-glycol (g)-methacrylate (MA) as compatibilizer in PLA-CF composite, the impact strength and flexural strength of the composite were increased by 29% and 2.4% respectively. 12 Adding modified CF in PLA has increased the tensile and flexural strength by 13.8% and 164% respectively. 13 The PLA/cotton fibre composite improved tensile strength, Young’s modulus and adhesion in fibre and polymer matrix in the presence of lignin. 14 The adhesion between the fibre and matrix was a challenge because voids formed at the time of printing when the continuous CF and polymer were mixed before the deposition of material onto the substrate. Also, the specific strength of ABS-CF composite was higher than that of aluminium. 15 The orientation for the manufacturing of the composite of PLA-CF exhibited an important role in improving the bonding strength, and printing parameters affected the mechanical properties of the composite structure with respected to orientation of the printed part. 16 The incorporation of natural fibre reinforcement in PLA was assured higher mechanical properties than the non-renewable product. The mechanical properties depended on the fibre type used for reinforcement and the homogeneity of fibre to the polymer matrix. 17 The bonding strength was also better in PLA-PLA fibre as compared to PLA. 18 Blending the cellulose and glass fibre with PLA increased the strike-resistant intensity by 34%–60% more than pure PLA and tensile strength by 43%–52%. 19 Adding carbon nanofiber (CNF) in PLA improved the tensile modulus by 42% at 15 wt.% of CNF. The damping was higher at 10 wt% of CNF in PLA. 20 The elastic modulus was improved at 40 wt.% of flax fibre, which decays nearby the glass transition temperature. 21 The reinforcement of carbon fibre was used to develop PLA/CF composites. The interfacial bonding was higher with pre-processed CF fibre than with the original CF. 13 The optimum parameters for manufacturing hybrid CF-PLA/ABS composites are 20 mm/s printing speed, 67.83% infill density, 0.23 mm layer height and 0.25 clad ratio. 22 The interfacial adhesion between the PLA and coir fibre was improved by enzymatic treatment which also removed the fatty acids and roughness of the surface. 23 The tensile strength was observed 112 MPa and the flexural strength was observed 164 MPa with CF addition. These composite structures can be used for industrial applications. 24 There was also an improvement in the foaming ability of PLA due to the addition of glass fibre into the polymer matrix. 25
A framework was used for ML algorithms to proactively and constantly produce knowledge for AM. The suggested program creates predictive models by examining several forms of AM-related data, including design, process control, in-situ monitoring, and ex-situ measurement data. The correlation between process parameters, part structure, and attributes was accomplished using these predictive models. The algorithm generates prescriptive rules based on the prediction models to assist decision-making throughout AM product development. 26 ML methods were used to distinguish between defect-free and faulty metal AM and reported that ML could become a real-time, online, multi-element, and non-destructive defect detection system for AM. 27 A two-step method was used to extract information on the predictability of additive manufacturability from data using CART machine learning. They described an approach in their work that produces information about predictive additive manufacturability and prescriptive design rules, leading to the establishment of valuable and adaptable design criteria for additive manufacturing. 28 The ML was being applied in other manufacturing process. 29 ML methods can forecast future results by looking at historical and experimental data. 30 Findings indicated that the XGBoost model predicted melt pool width and depth with 97% and 96.3% accuracy, respectively. 31 In-depth analyses of ML-enhanced AM technology’s advantages and potential applications are well-described and helpful for a special AM issue. 32 Manufacturing has seen a rise in the usage of decision tree algorithms like CART to forecast various outcomes. 33 The effectiveness of CART was demonstrated in predicting tool wear in milling operations with high accuracy. 34 CART was applied to predict the material removal rate in electrochemical machining and gained insights into the process parameter-material removal rate relationship. 35 CART was found influential in determining optimal cutting parameters and the relationship between cutting parameters and machining outcomes. 36 CART was used to predict surface roughness in turning AISI 1045 steel. 37 Finally, CART was applied to predict the mechanical properties of parts manufactured using FDM technology, providing valuable insights. 38
The literature showed that previous studies were done on the PLA filament with reinforcement of various fibres. The mechanical, thermal, and morphological properties investigations were done on multiple fibres reinforced in PLA. But hitherto, very few studies were done in which the fibre is reinforced at various orientations to prepare composite structures. The mechanical, morphological and fracture properties of PLA-CF-PLA composites were investigated to optimize parameters in which the orientation of CF, nozzle temperatures, and bed temperature.
According to the literature assessment, CART regression is good at forecasting various outcomes in AM and has potential uses in AM. Creating more reliable and precise ML models to manage the AM process’s complexity is necessary. There is a need to explore CART regression that may enhance quality assurance and streamline AM procedures.
Materials and methods
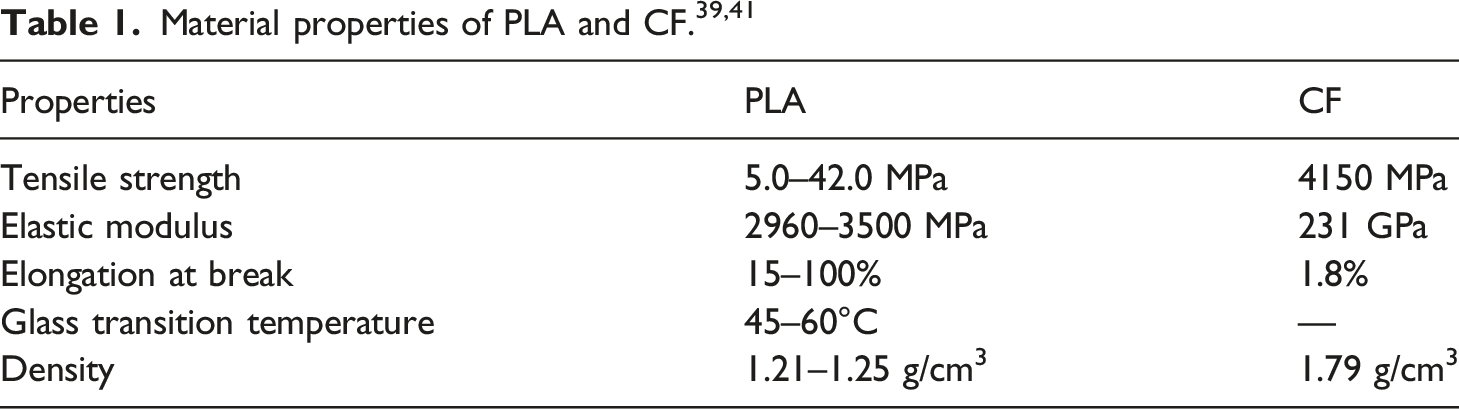
Figure 1 shows the methodology for testing PLA-CF-PLA composite structures. The PLA material is used to print composite, and the CF is sandwiched at the mid position at the time of printing. Further, tensile testing was done, which is supported by SEM analysis for fracture analysis, XRD analysis, FTIR analysis for chemical interaction and intermolecular bonding between the materials, DSC for thermal analysis, and VI and VR for electrical characteristics. Methodology for testing of PLA-CF-PLA composite tensile specimens.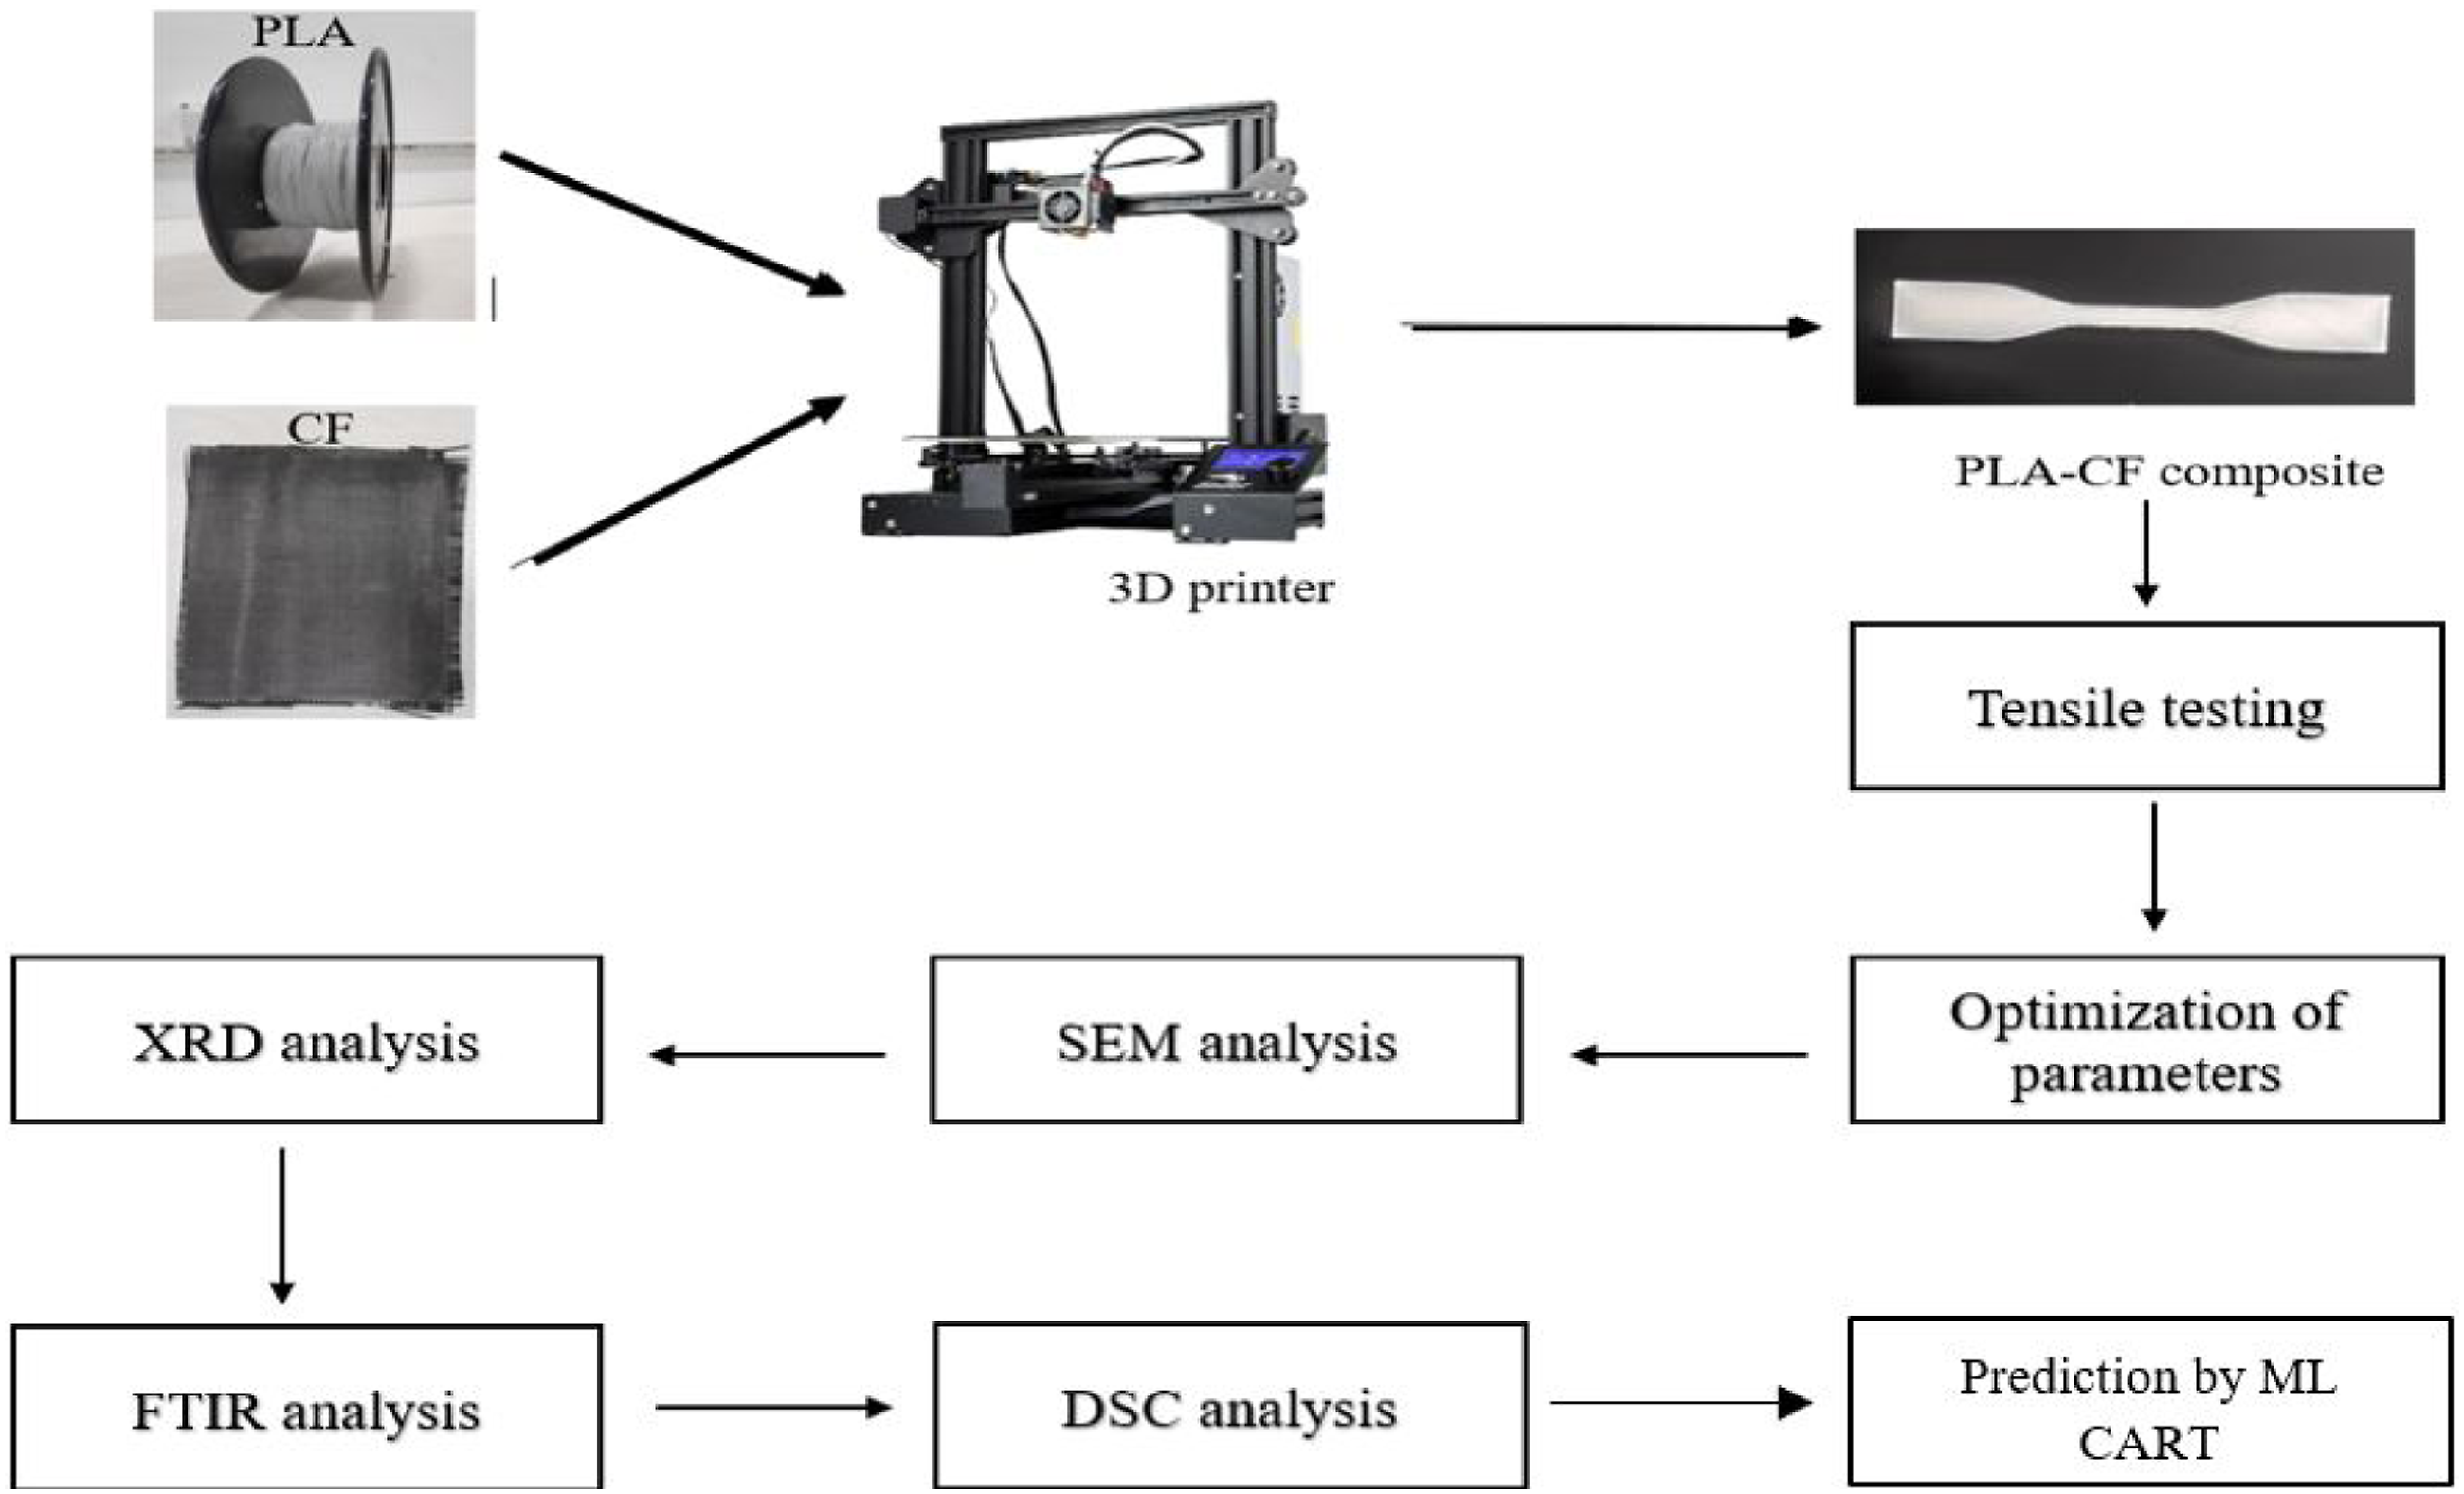
Experimentation
3D printing
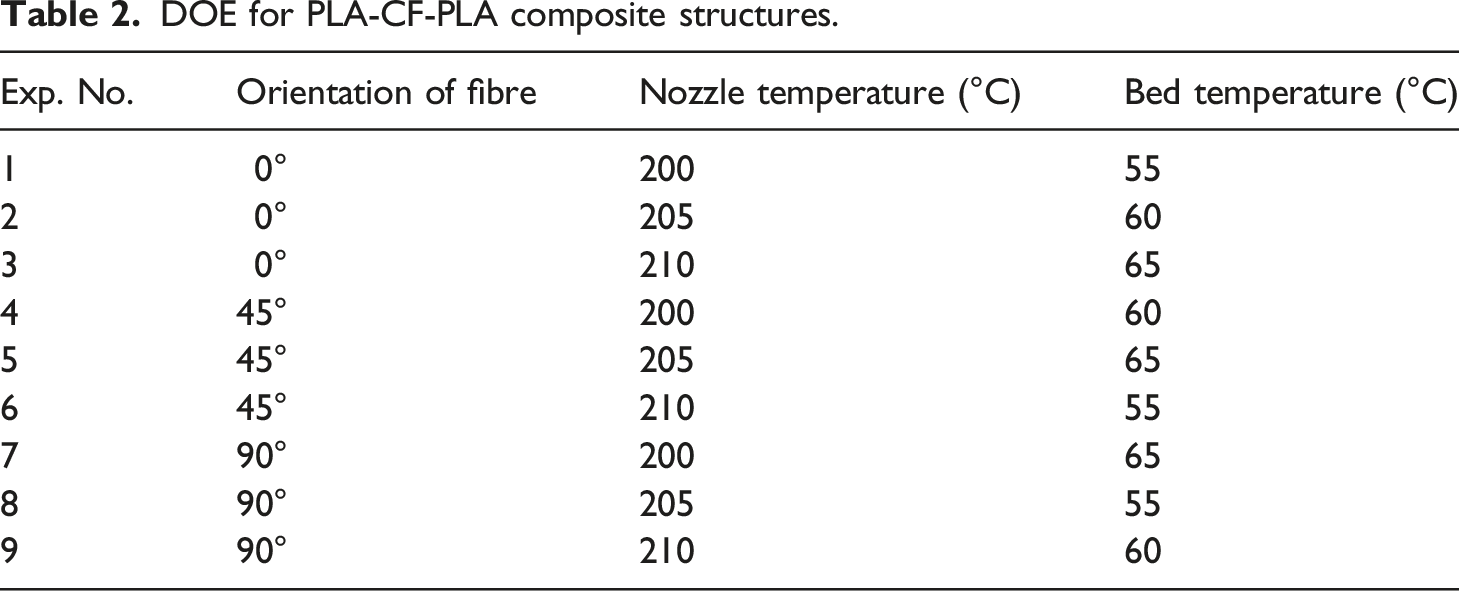
DOE for PLA-CF-PLA composite structures.
The schematic structure of the PLA-CF composite tensile specimen is shown in Figure 2. The CF is incorporated in between the composite structure equal to the gauge length of the tensile specimen manufactured as per ASTM D638 Type IV standards as shown in Figure 2. The gauge length is the length of the fibre over which the tensile strength is measured, and it might alter the statistical strength distribution of the carbon fibre. Generally, shorter gauge lengths can produce higher strength values because there is a greater chance of coming across a stronger piece of the fibre, while longer gauge lengths can produce lower strength values since there are more likely to be weaker sections present.
41
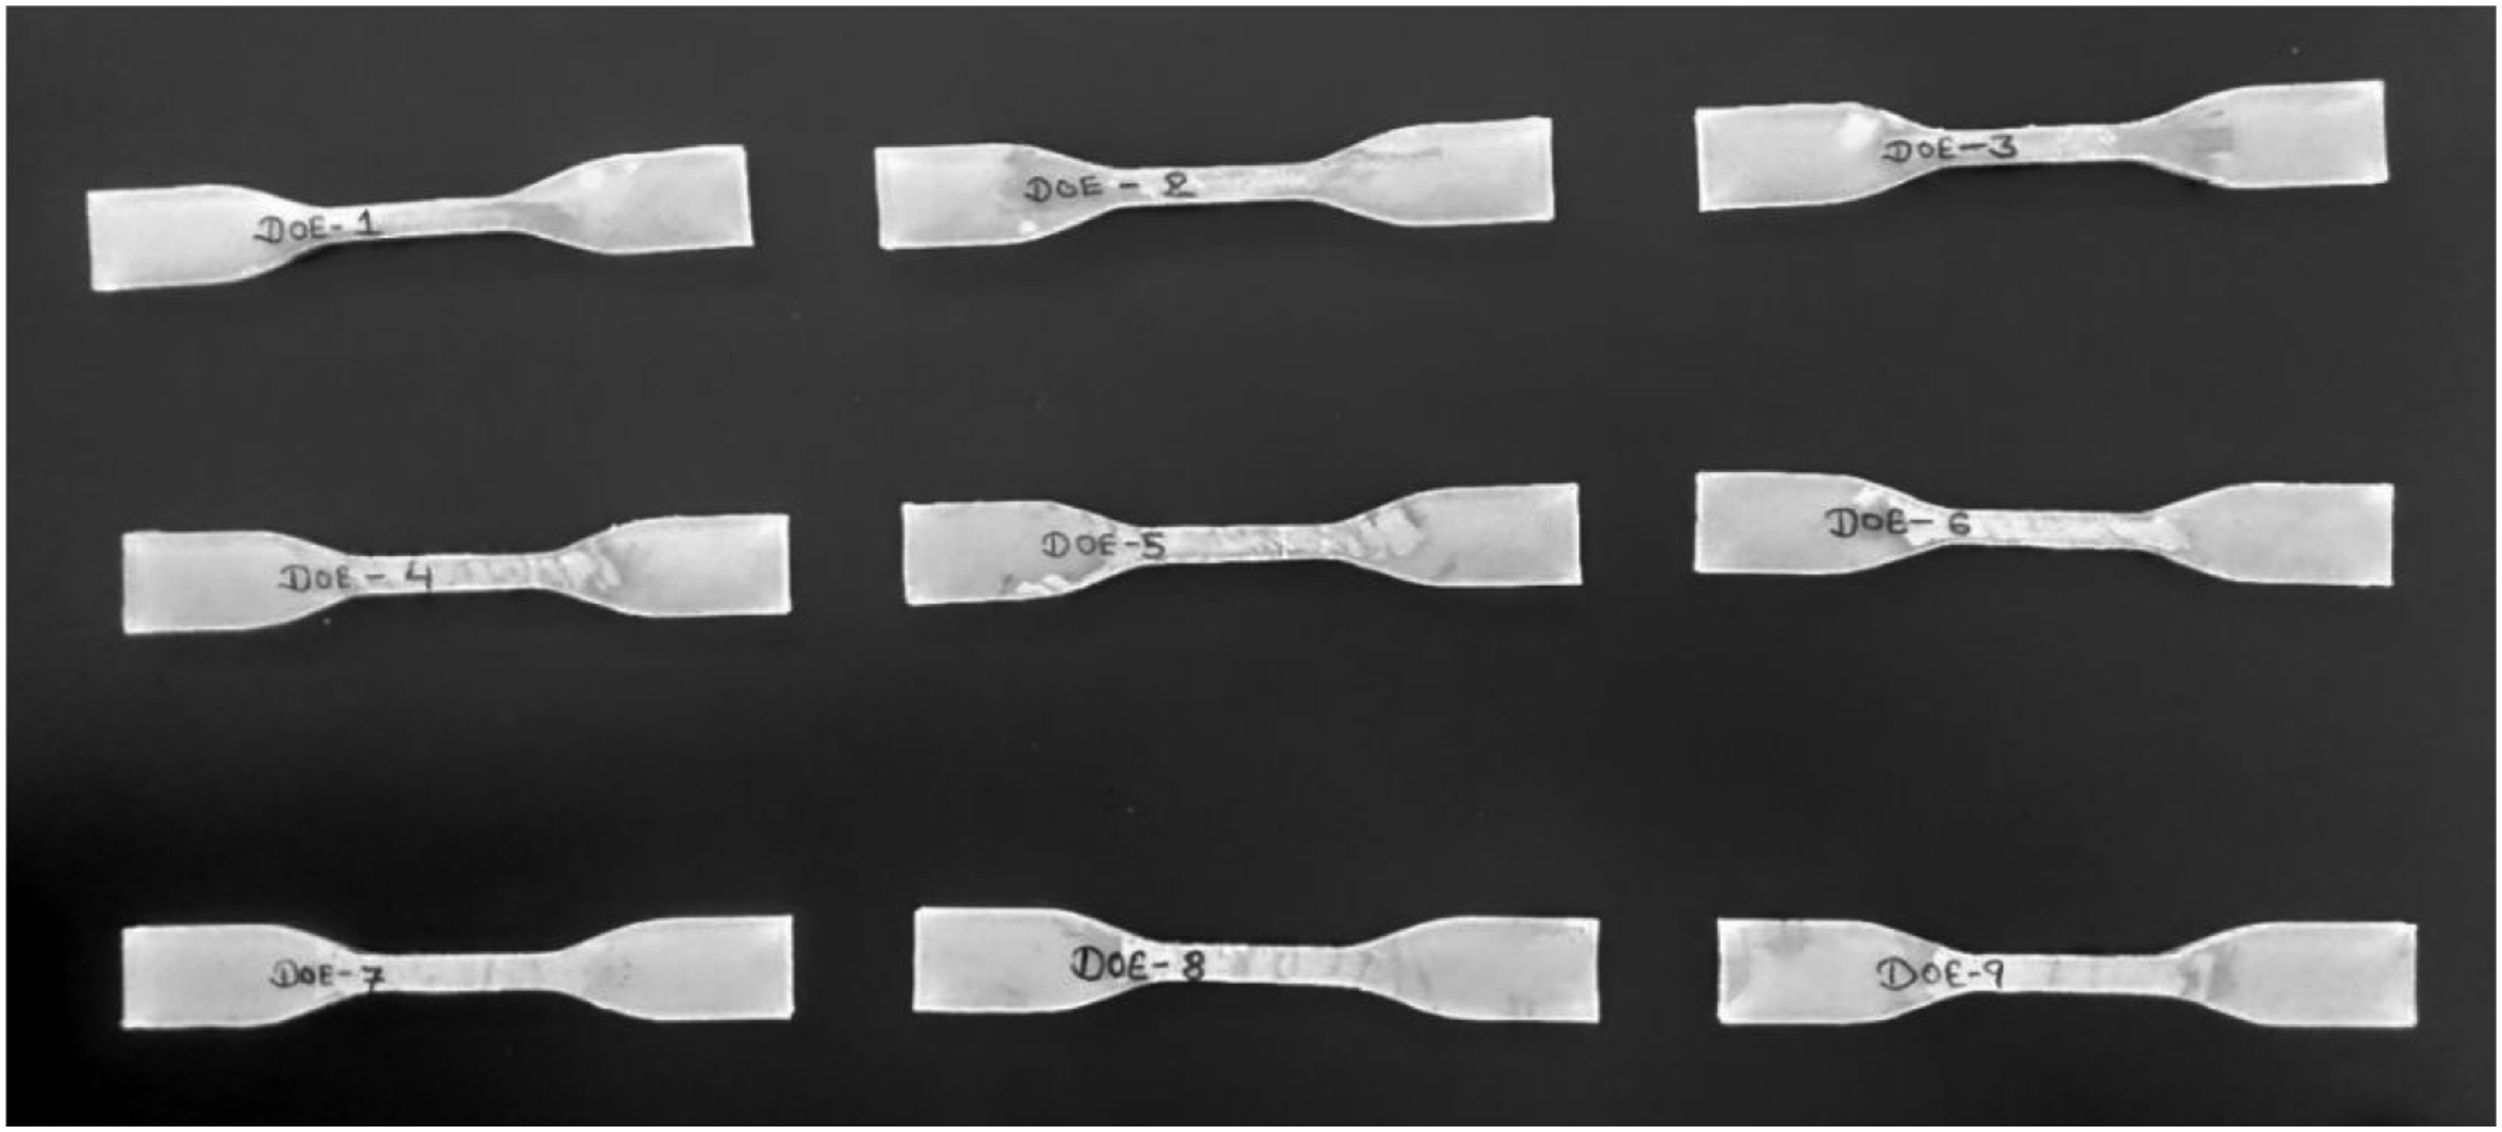
The fibre sizing was done to improve the adhesion properties between the matrix material and the fibre present in the composite structure. The fibre sizing material should be compatible with the composite manufactured, so PLA viscous solution was prepared using a magnetic stirrer. This PLA viscous solution was used as a fibre-sizing material for better adhesion between the PLA matrix and CF. As the fibre sizing of PLA viscous solution was applied above and underneath of CF deposited layer, the adhesion increased between CF and matrix material of the composite. The fibre-sizing of PLA led to enhance mechanical properties of the composite. All the samples are printed with PLA material reinforced with CF at various parameters such as the orientation of reinforced fibre, nozzle temperature and bed temperature. The printed tensile specimens are shown in Figure 3. Schematic diagram of PLA-CF composite. 3D printed PLA-CF-PLA tensile specimens (DOE 1 to DOE 9).
Tensile testing
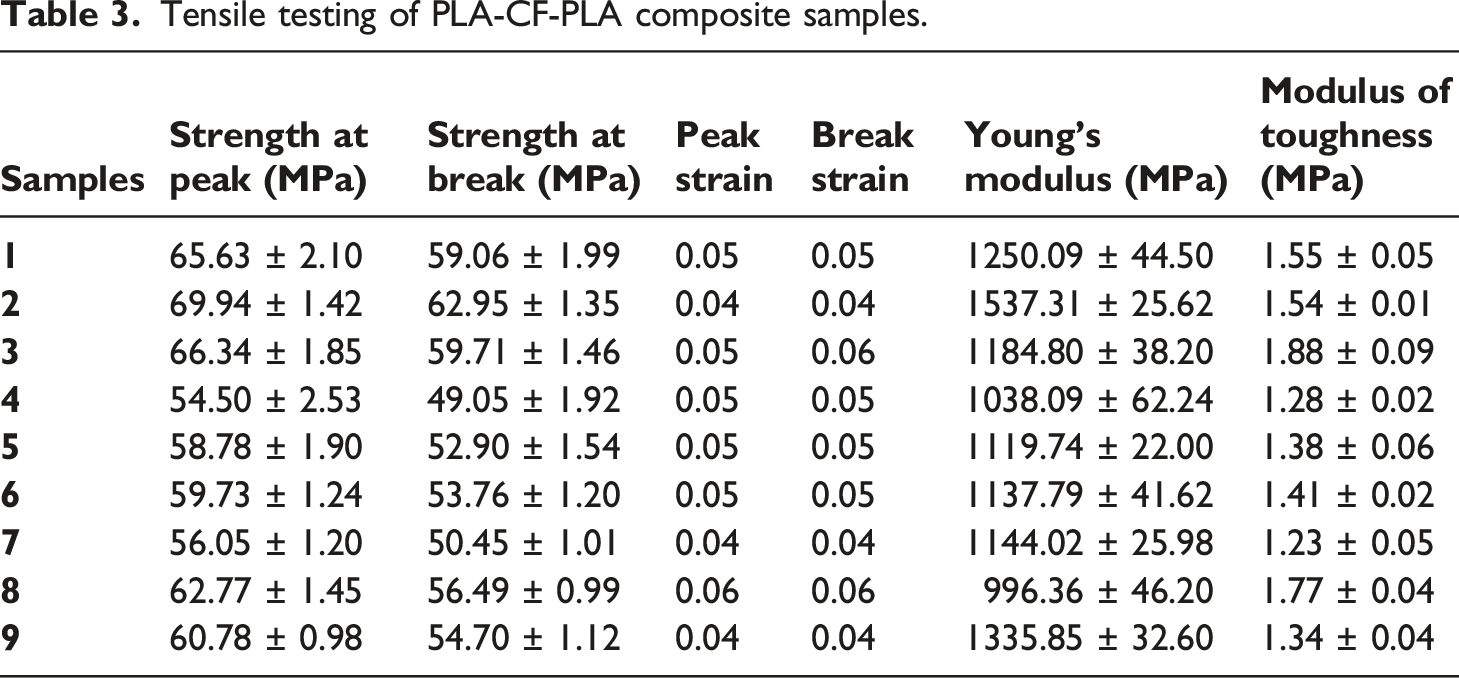
The samples of the tensile specimen were manufactured of PLA reinforced with CF at various parameters. The samples were manufactured using a 3D printer (Creality 3D Ender Pro). The samples were manufactured by following DOE, as shown in Table 1. There are 3 samples for each experiment were repeatedely manufactured via the FFF process at the same process parameters which means a total of 27 samples were manufactured. The average value of the experiment done for 3 samples manufactured at the same process parameters was considered for mechanical properties. The tensile testing of these samples was performed with the universal testing machine (UTM) (Make: Shanta Engineering, maximum capacity: 5000N) at a 20 mm/min strain rate. The tensile testing was performed directly for the nine samples of PLA-CF-PLA composites and it was repeated three times.
Photomicrography
The fractured tensile specimen samples’ morphology was investigated using SEM (Make: Jeol, Model: JSM IT500). The power supply of 15 kV was applied on a high vacuum mode for fracture investigation. In addition, EDS software was used to investigate mass and atomic fractions.
XRD analysis
The crystal structure of the samples (sample 2, sample 8) was measured with Cu-Kα radiation (wavelength, λ = 1.54,060
FTIR
The chemical analysis of PLA-CF-PLA was performed using FTIR (Make: Analytical Technologies, India). FTIR analysis was done to identify the chemical interaction in the PLA-CF-PLA composite structure. The spectrum for FTIR of PLA-CF-PLA samples was observed in the range of 1000–3500 cm−1.
DSC analysis
The thermal investigation was done to test the thermal stability of manufactured samples by DSC analysis (make: Mettler Toledo; maximum operating temperature: 500°C). The manufactured samples were determined through endothermic and exothermic thermal reactions. The temperature range of 30–210°C was used for endothermic thermal reaction with a heating rate of 10°C/min. Similarly, the temperature range of 210-30°C was used for exothermic reactions and a cooling rate of −10°C/min.
Result and discussion
Tensile test results
Tensile testing of PLA-CF-PLA composite samples.
Optimization of the parameters for the extrusion process
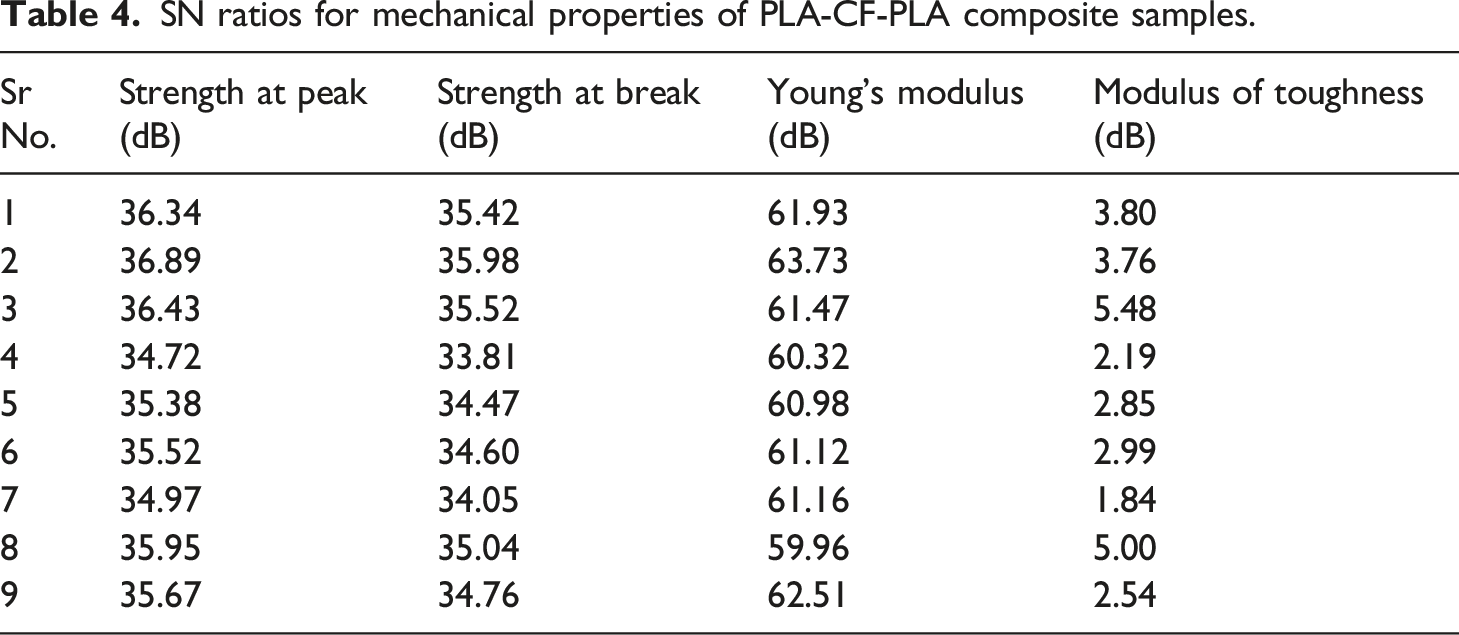
SN ratios for mechanical properties of PLA-CF-PLA composite samples.
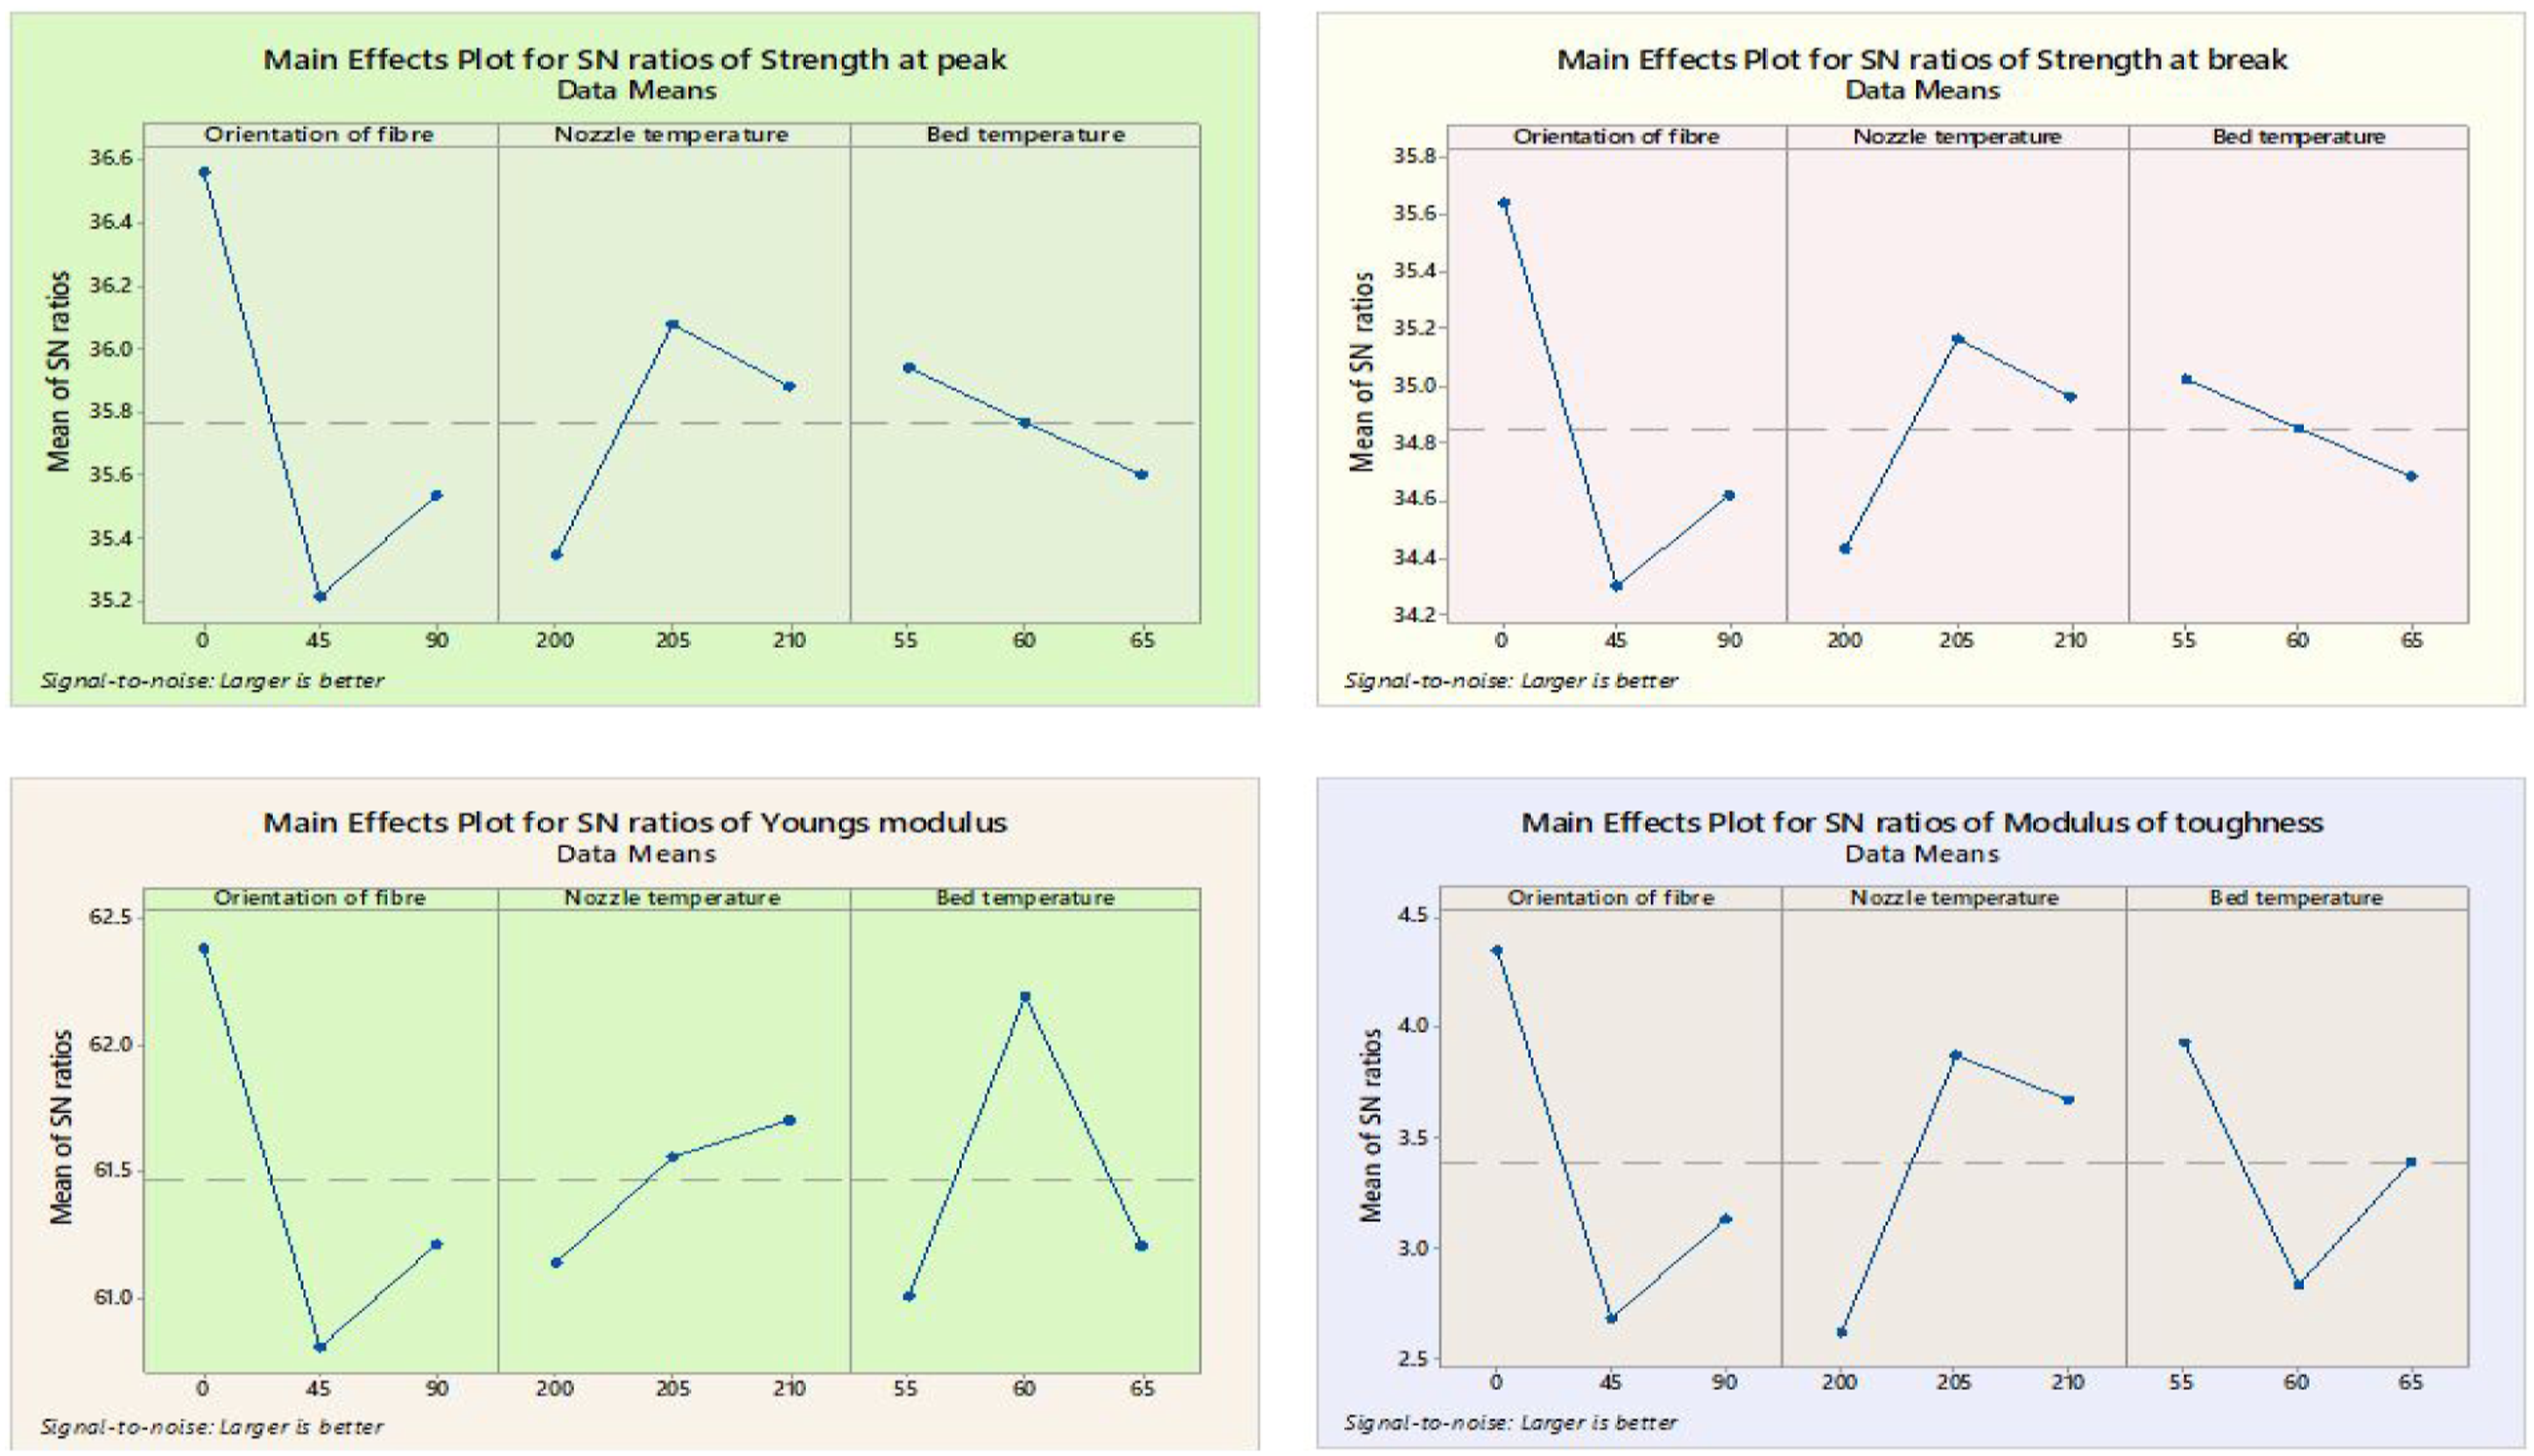
Main effect of SN ratios for tensile properties of PLA-CF-PLA composites.
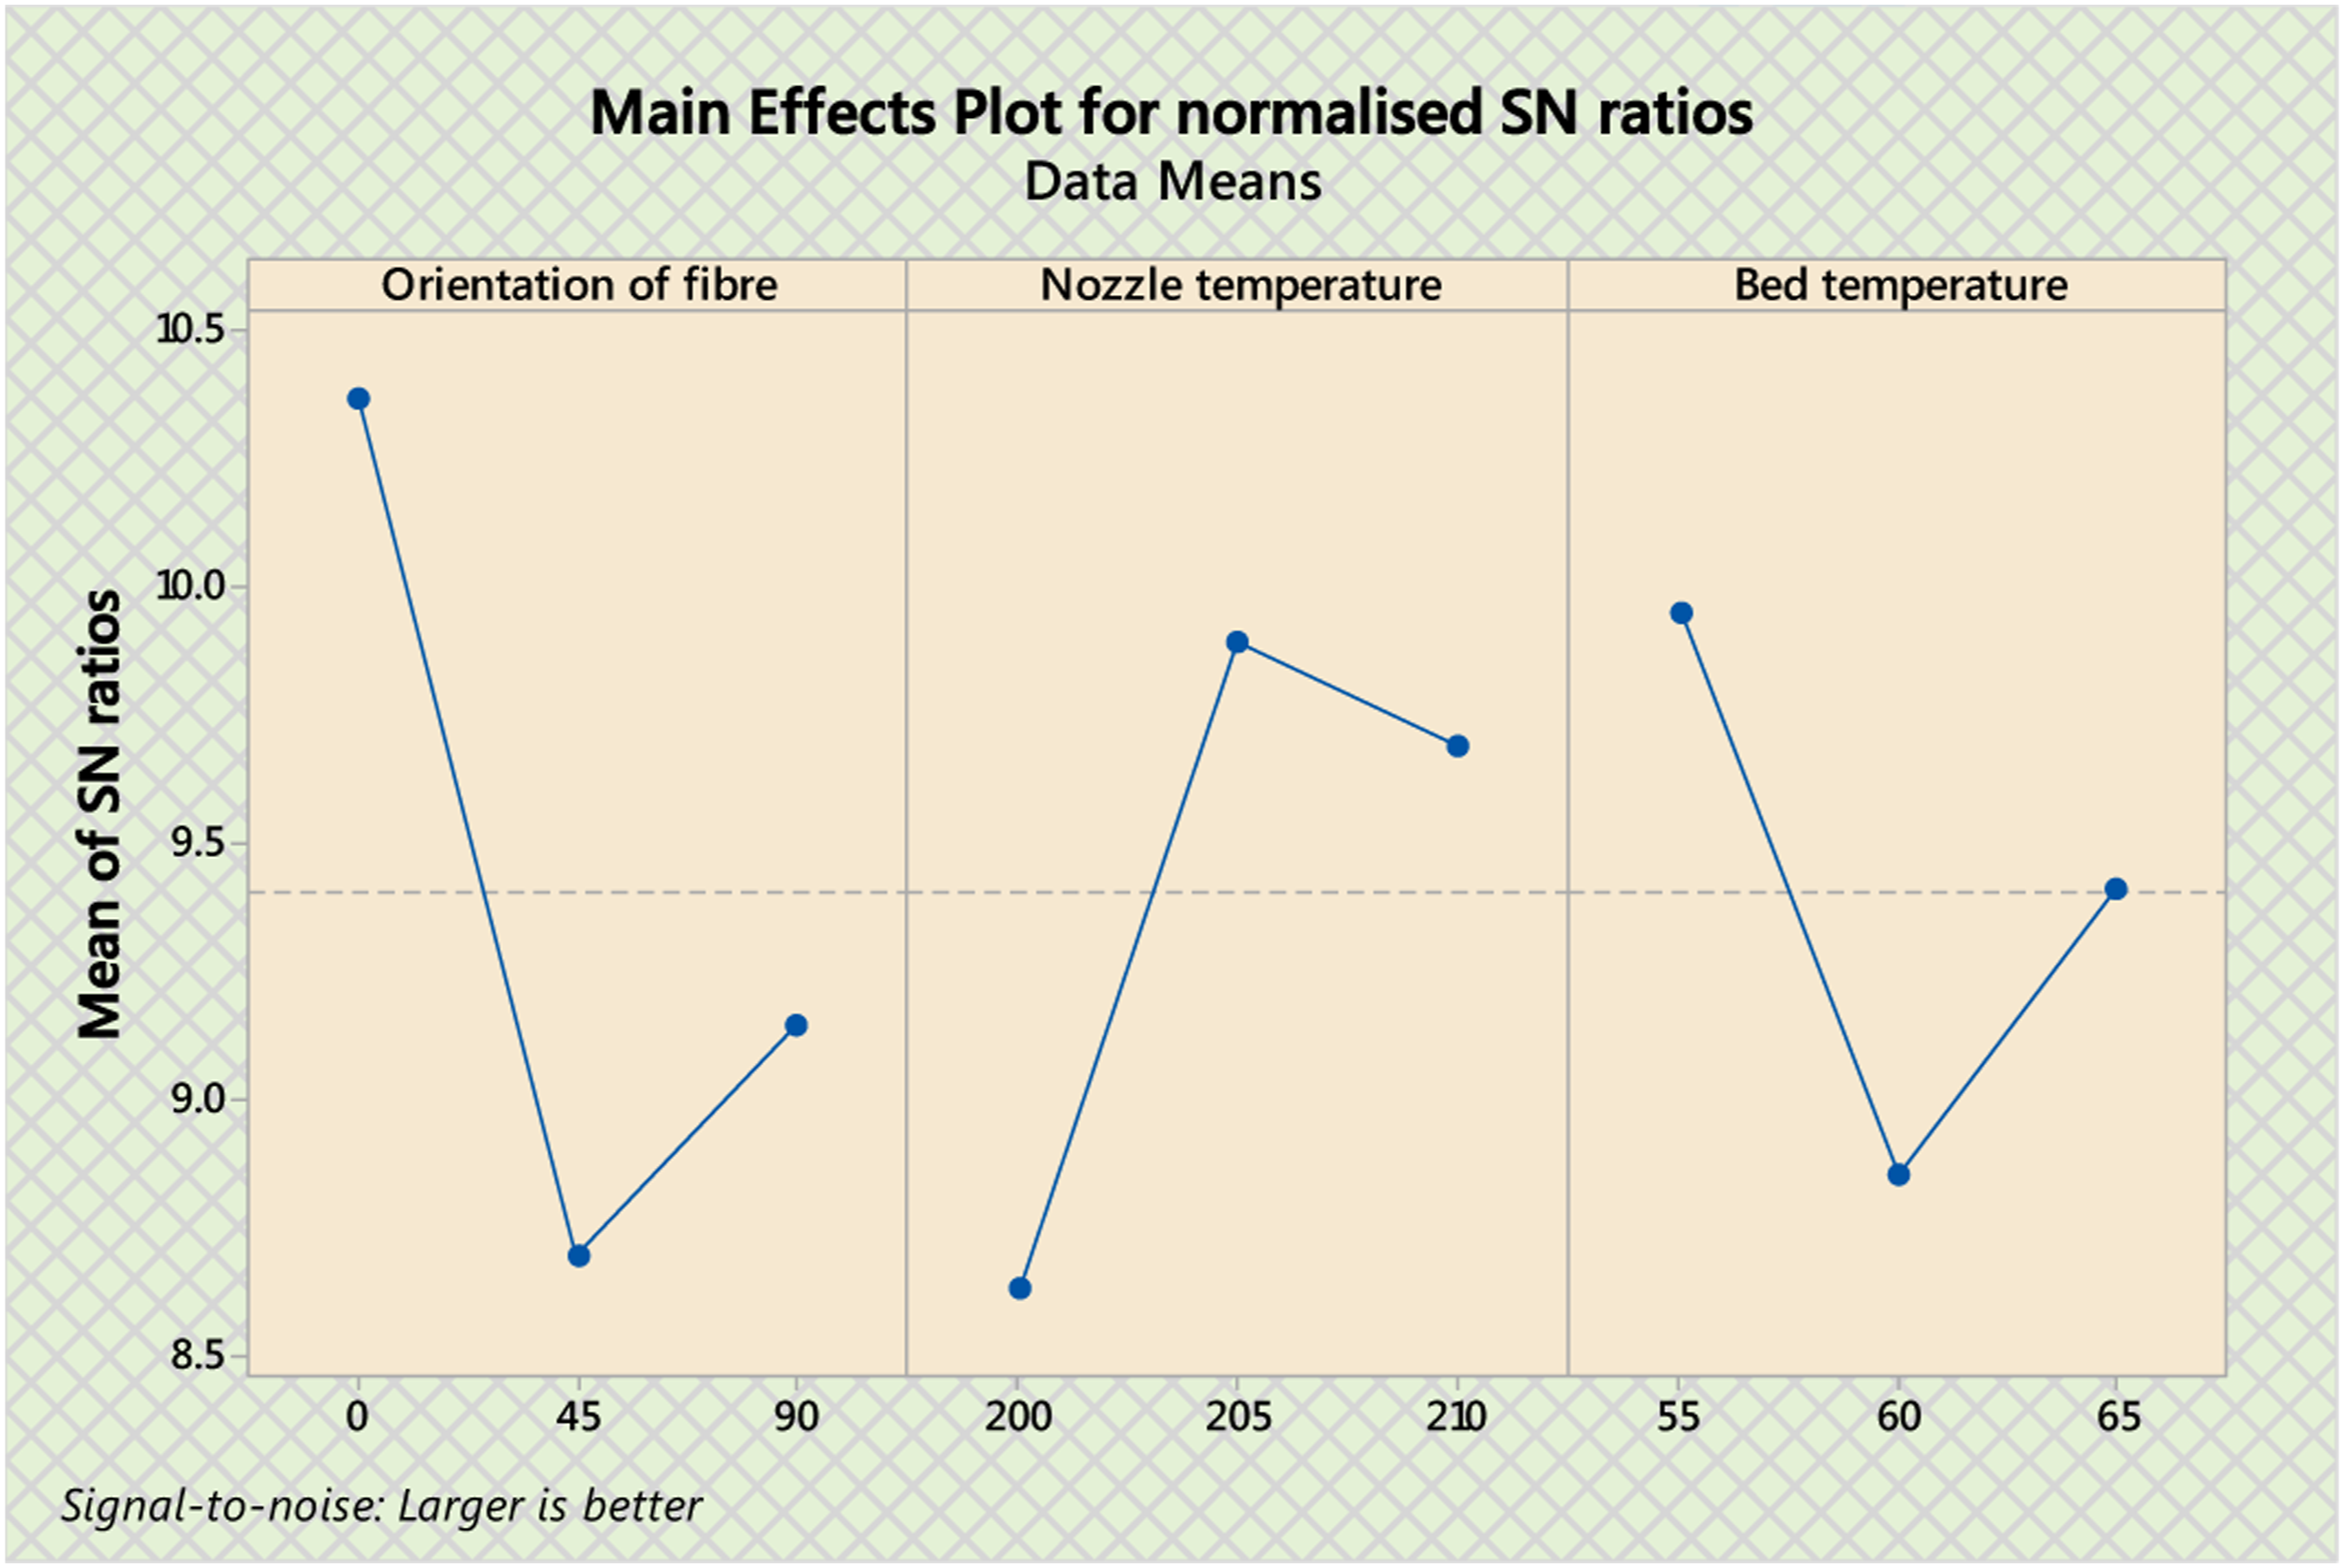
Main effect of normalized SN ratios.
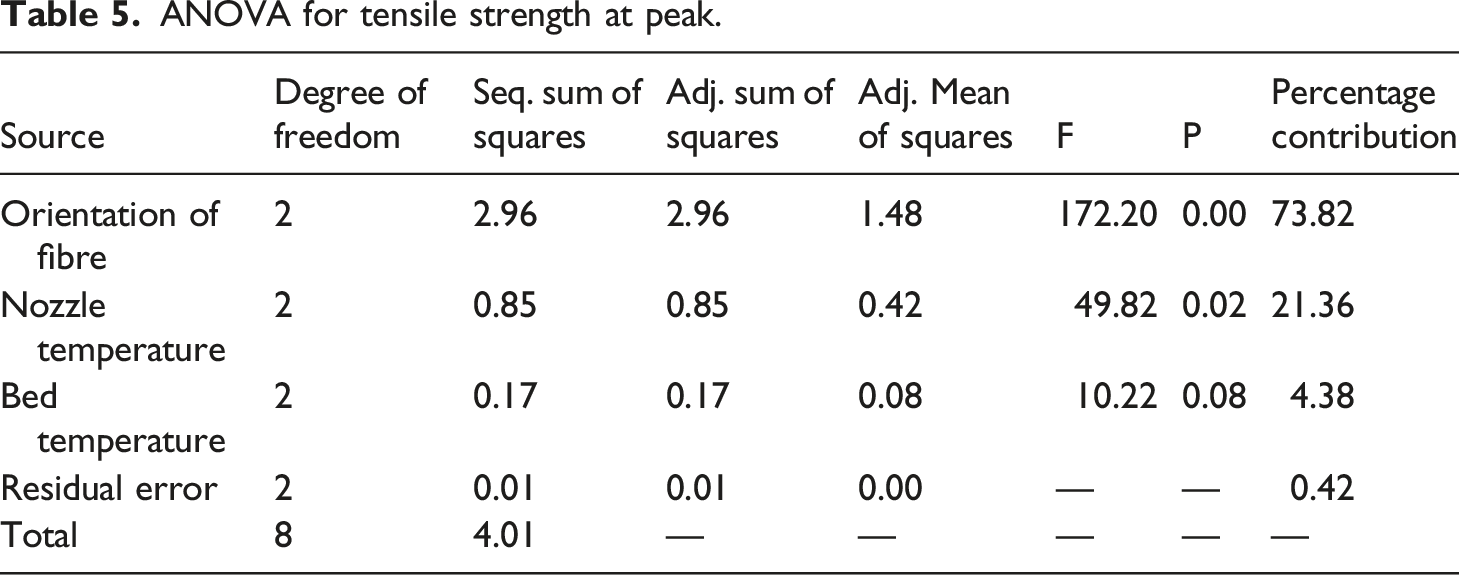
ANOVA for tensile strength at peak.
SN ratios for mechanical properties of PLA-CF-PLA composite samples.
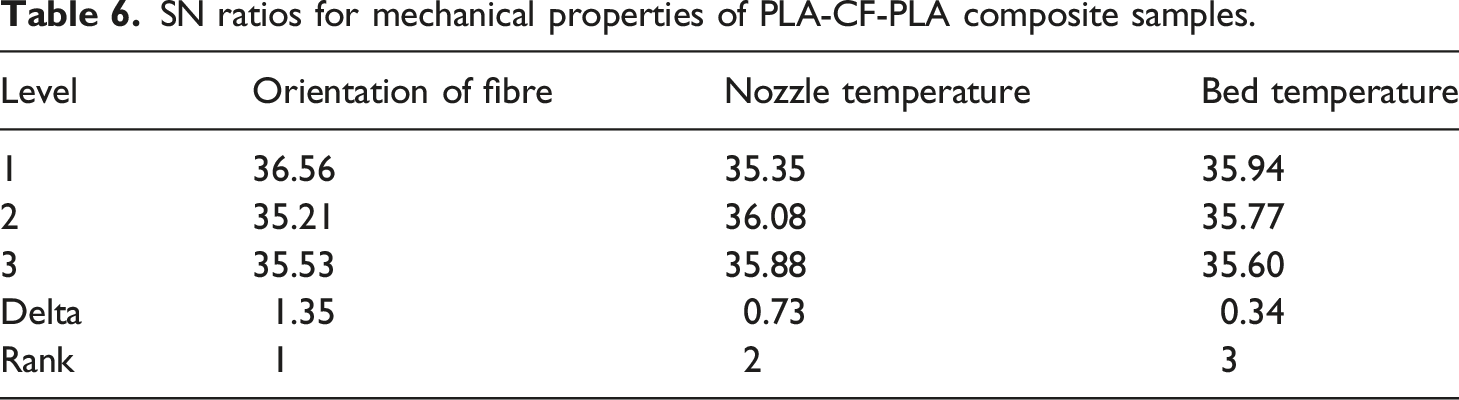
The calculated SN ratio values can be used to find optimal tensile property values. Equation (1) is used for finding the optimum value of the SN ratio as given below K = mean of SN ratio for tensile strength at peak of all samples KA1 = SN ratio for fibre orientation at level 1 KB2 = SN ratio for nozzle temperature at level 2 KC1 = SN ratio for bed temperature at level 1
From the calculations of Table 4 and Table 6;
K = 35.76 dB, KA1 = 36.56 dB, KB2 = 36.08 dB, KC1 = 35.94 dB
αopt = 35.76 + (36.56 – 35.76) + (36.08 – 35.76) + (35.94 – 35.76)
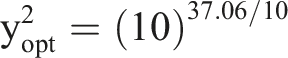
αopt = 37.06 dB
The optimum value of the SN ratio for tensile strength at peak (yopt) can be calculated from equation (2).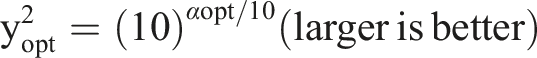

Predicted and confirmatory values of tensile properties.
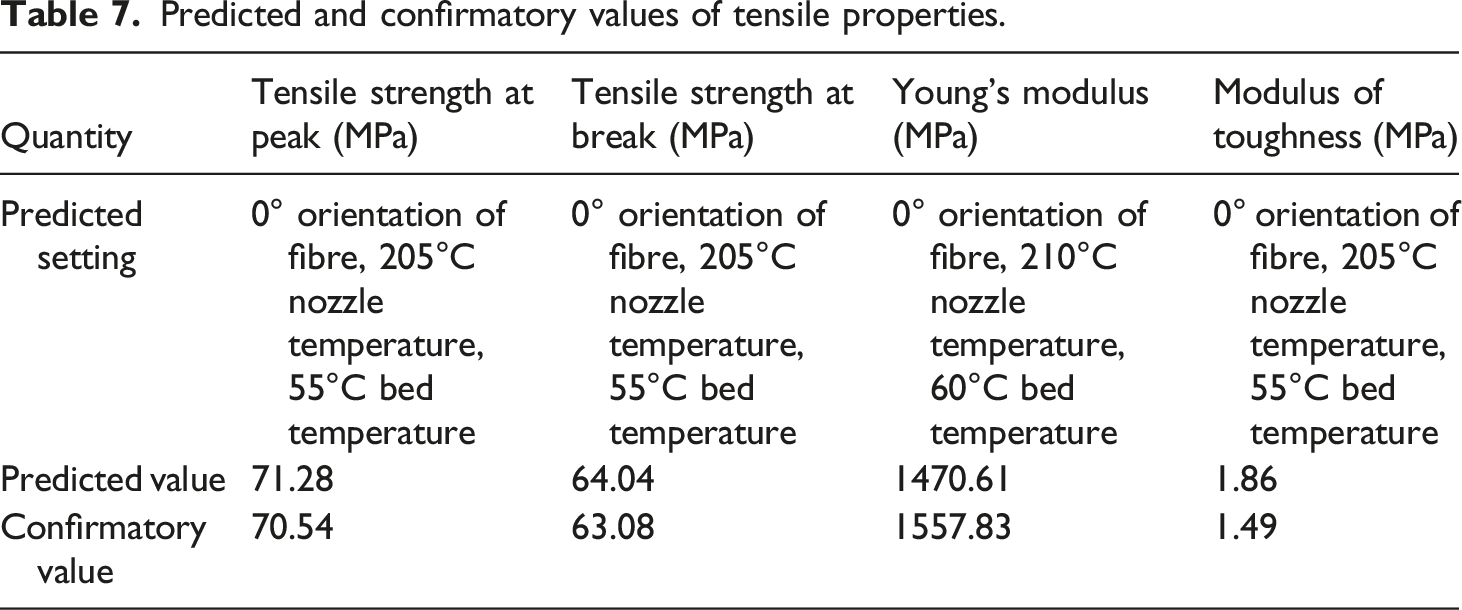
As the predicted values and confirmatory values for tensile strength at peak, and tensile strength at break, Young’s modulus and modulus of toughness are nearby at the optimized parameter conditions. Also, it was observed that the tensile properties values of sample 2 are nearer to predicted and confirmatory values. Sample 2 is considered the best sample. So, for the 3D printing of PLA-CF-PLA composite structures, the optimized setting parameters are 0˚orientation of CF deposition, 205°C nozzle temperature, and 55°C bed temperature.
Modelling of strength at peak and strength at break
CART
Since its creation in 1984, CART has become one of the most used ML algorithms. 44 To work, CART divides the data into several subgroups based on the property that most reduce impurities. Each leaf node of the tree should reflect a section of the feature space that is homogenous concerning the target variable. The target values for the training examples in the area of the model are averaged to provide the forecast for a specific instance. The objective is to find the split with the lowest mean squared error (MSE), the commonly used impurity metric. Interpretability, scalability, and processing of both continuous and categorical information are just a few benefits of CART. 45 Yet, if the tree is developed too deeply, it may be prone to overfitting and sensitive to slight variations in the training set. Implementing a CART regression tree entails the following steps:
Step 1: data pre-processing
The first step is to prepare the dataset for the regression analysis. This includes removing missing values, outliers, and unnecessary variables from the dataset.
Step 2: splitting the data
To split the data into a training set and a testing set. The training set is used to build the regression tree, while the testing set is used to evaluate the model’s performance.
Step 3: building the regression tree
To build a regression tree, find the variable that best splits the data based on the target variable (the variable to predict). This is done by calculating the sum of squared errors (SSE) reduction when a variable is added to the model. Once found the best variable to split on, split the data into two subsets based on the value of that variable. Repeat this process recursively for each subset until a stopping criterion is met (such as reaching a minimum number of samples in a leaf node).
Step 4: pruning the tree
After building the regression tree, prune it to prevent overfitting by removing branches that do not improve the model’s performance on the testing set—setting a minimum number of samples in a leaf node or using cross-validation to find the optimal pruning level.
Step 5: making predictions
Use the regression tree to make predictions on new data. To make a prediction, start at the tree’s root node and follow the branches down to the leaf node corresponding to the input variables’ value. The predicted value is the mean value of the target variable in the leaf node.
Implementation of CART ML
Using a dataset of 27 observations, Minitab was used to create graphical reports summarising descriptive statistics for the strength at peak shown in Figure 6(a) and the strength at break in Figure 6(b). The dataset’s 61.613 MPa arithmetic mean strength at peak and 55.452 MPa strength at break, as well as the findings of the Anderson-Darling normality test, have A-squared values of 0.17 and 0.46, respectively, with p-values of .234 and .237 with 95% confidence. Strength at break has a standard deviation of 4.358 MPa, whereas peak strength has one of 4.847 MPa. Strength at break and peak had variances of 23.494 and 18.993, maximum and minimum values of 69.97 and 62.99, and 54.4 and 49.03, respectively. Before using the ML CART method, these descriptive statistics of strength at peak and strength at break graphical summaries made it easy to comprehend the distribution, relationship, and skewness of a dataset by displaying the median, quartiles, outliers, and probable skewness. Graphical reports to summarize descriptive statistics (a) Strength at Peak, (b) Strength at break.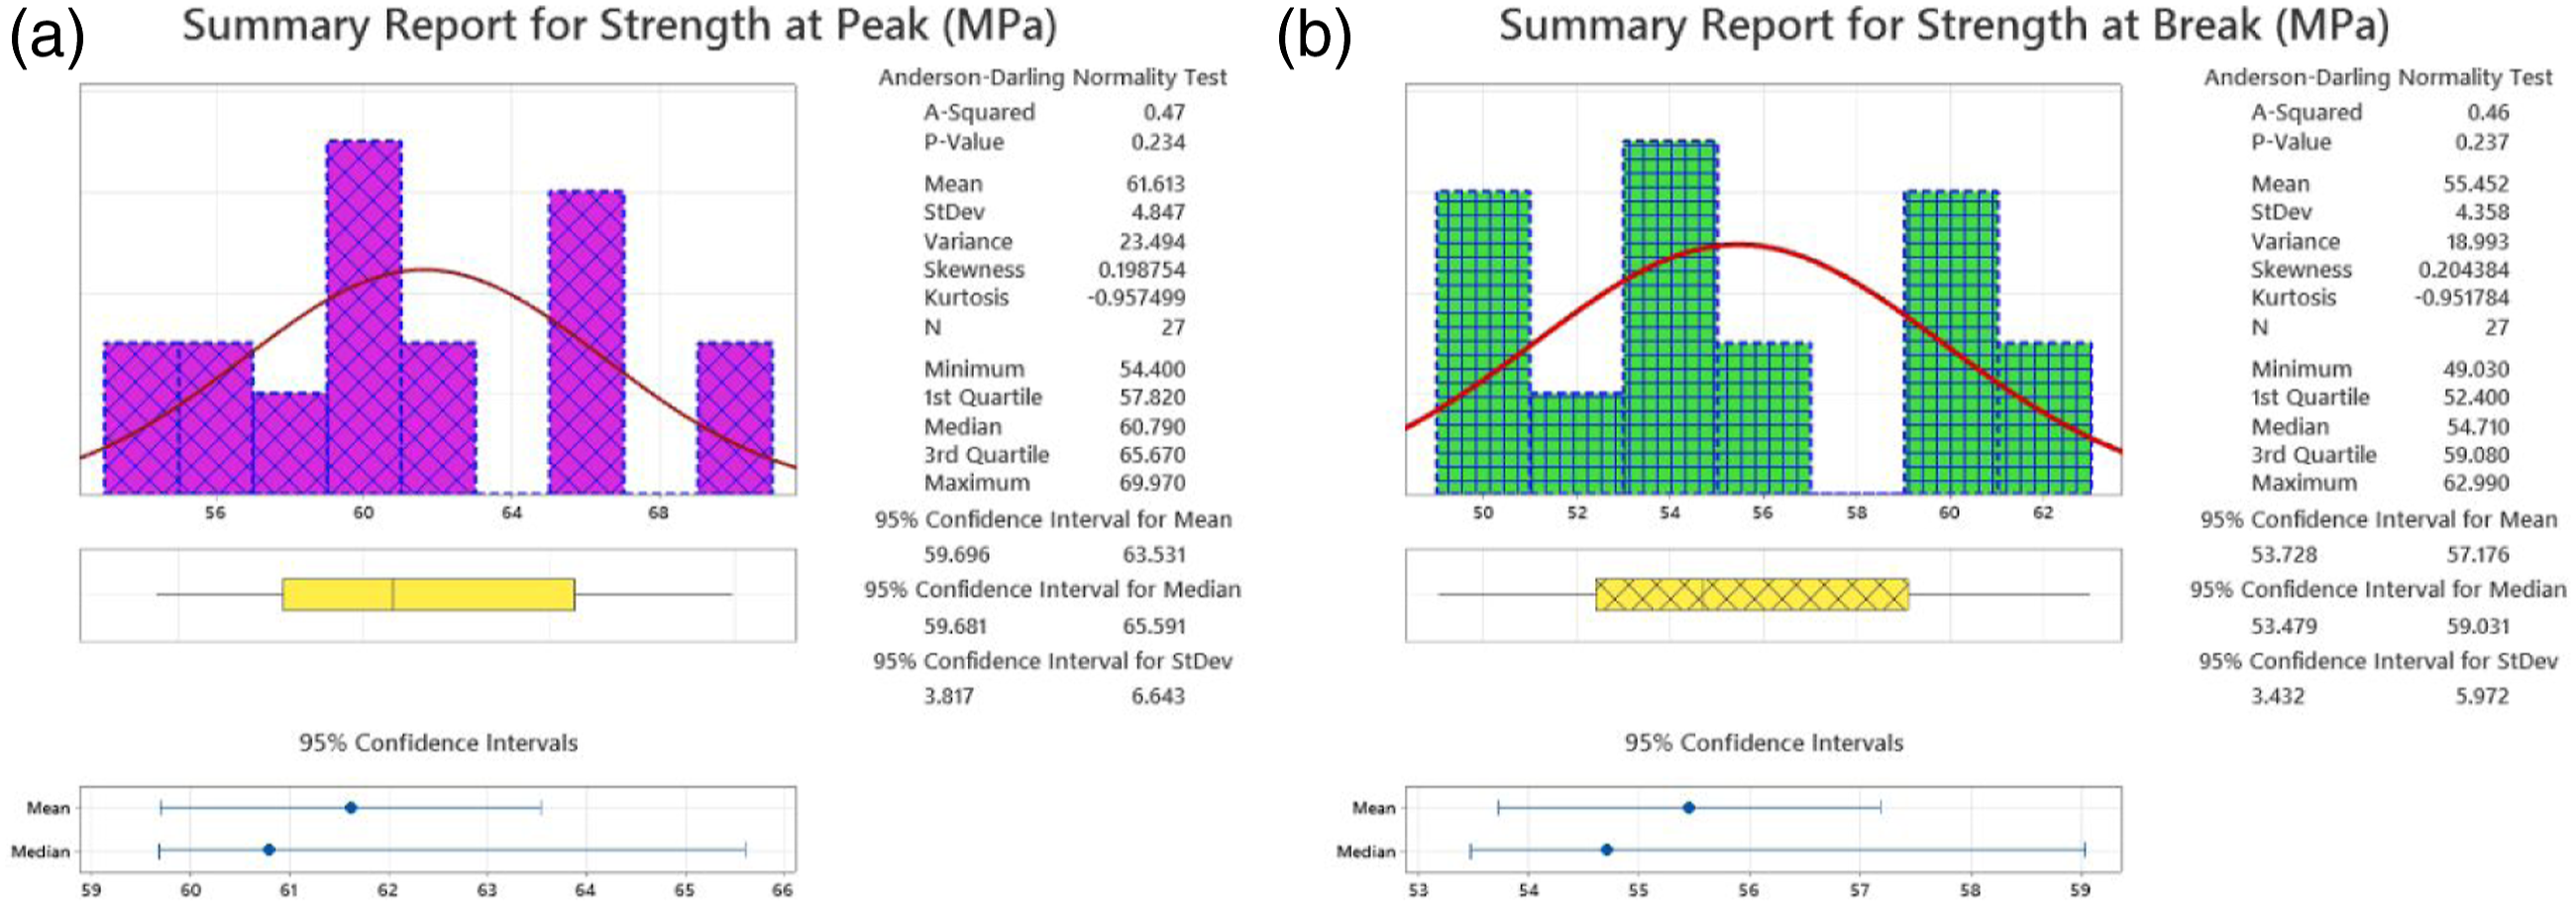
The least squared error node splitting method is used in implementing CART to simulate the peak and break strengths of hybrid additive manufacturing of highly sustainable PLA-CF-PLA sandwiched composite structures. There are 27 rows of 10-fold cross-validation in the model validation (repeated experiments of L9 array). R-squared and the number of terminal nodes in a CART regression have a complicated connection that varies according to the data utilized. A CART regression model with more terminal nodes would often be more detailed, which might result in a better fit of the data and a higher R-squared value. Overfitting is also more likely as a result. Hence, balancing, providing a good fit to the data, and avoiding overfitting are required to determine the appropriate number of terminal nodes in a CART regression model. R-squared is shown against the number of terminal nodes in Figure 7(a) for the strength at peak. R-squared improved as the number of terminal nodes increased and reached an optimal value of 0.9041 at four terminal nodes. At four terminal nodes, the strength at break has a superior value of 0.9068 attained (see Figure 7(b)). R-squared versus the number of terminal nodes (a) Strength at Peak, (b) Strength at break.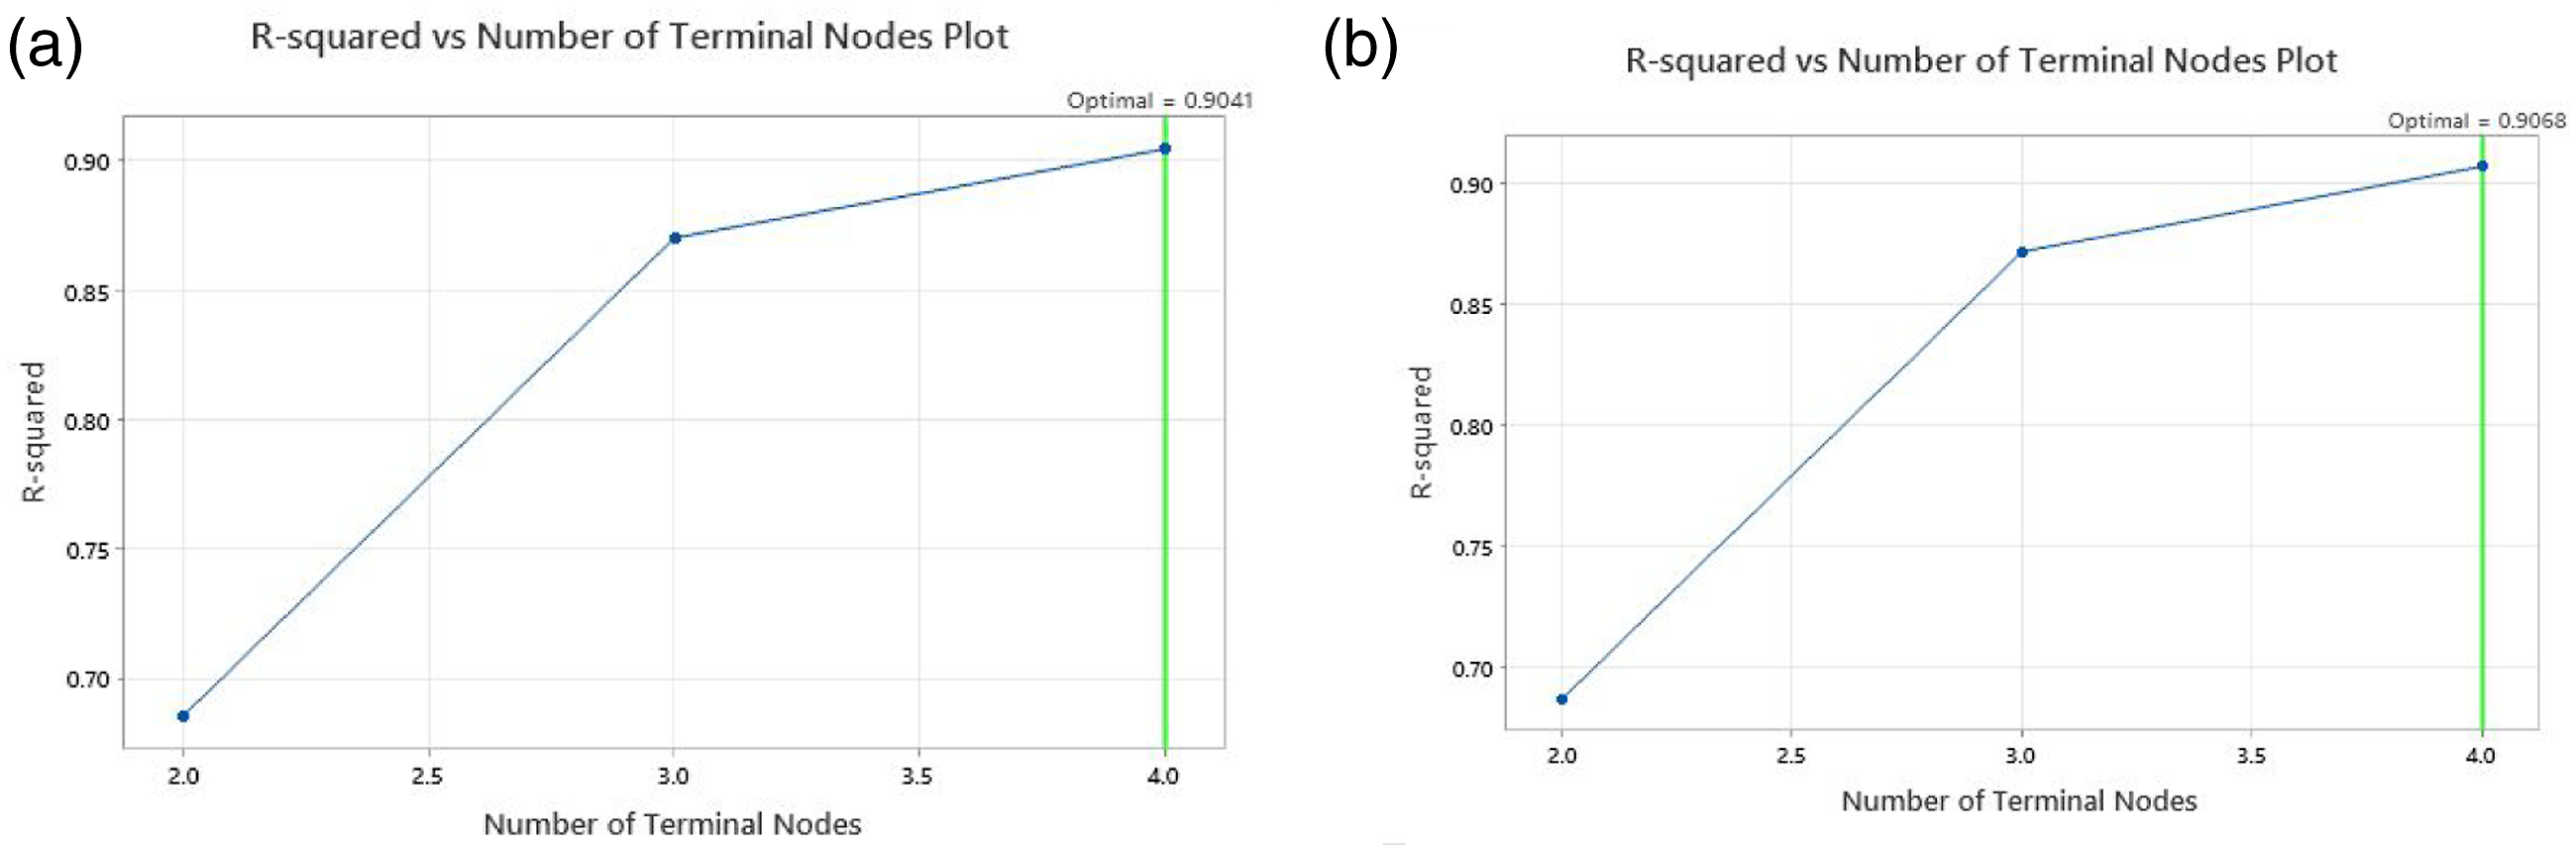
Using predictor factors like fibre orientation, nozzle temperature, and bed temperature, CART aims to construct a tree that can predict the target response’s peak and break strengths. The objective of creating a CART regression tree is to develop a tree structure such that the sum of the residuals of the target variable for the training data points is minimized. The target variable is continuous. Figures 7(a) and (b) represent the achieved optimum tree diagrams for peak and break strengths of hybrid additive manufacturing of highly sustainable PLA-CF-PLA sandwiched composite structures, respectively. A CART regression tree is created by dividing the data into subsets depending on the values of the predictor variables. The root node is chosen based on the predictor variable that significantly reduces the variance of the target variable. Each subset goes through this procedure again until the halting conditions are satisfied. In Figure 7, the tree diagram shows that binary trees are the outcome. The prediction is created by averaging the goal values for the data points that belong to that leaf node.
Figure 8(a) shows the optimal tree involving the regression analysis results using the CART algorithm to predict the strength at peak. The “Terminal Node” shows the four terminal nodes of the decision tree, which represent subgroups of materials with similar characteristics. The “Count” indicates the number of experiments in each subset. The “Fit” represents that subgroup’s predicted strength at peak value, the average of the actual strength at peak values in the subset. The “StDev” represents the standard deviation of that subgroup’s predicted strength at peak values, which measures the variability of the predicted values around the mean. Terminal node 1 has an average predicted strength at peak value of 67.30, with a standard deviation of 1.886. This suggests that the predicted values for materials in this subgroup are relatively consistent and not very spread out. Terminal node 4 has an average predicted strength at peak value of 61.775, with a standard deviation of 0.995. This suggests that the predicted values in this subgroup are more spread out and less consistent than those in terminal node 1. Figure 8(a) provides valuable information about the expected strength at peak values and variability for each subgroup based on their orientation of fibre and nozzle temperature (°C) characteristics. Figure 8(b) optimal tree of CART algorithm to predict the strength at break. Terminal node 1 has an average predicted strength at break value of 60.57, with a standard deviation of 1.701. This suggests that the predicted values in this subgroup are relatively consistent and not very spread out. Terminal node 2 has an average predicted strength at break value of 49.75, with a standard deviation of 0.7001. This suggests that the predicted values in this subgroup are more spread out and less consistent than those in terminal node 1. Figure 8(b) provides useful information about the predicted strength at break values and variability for each subgroup based on their “Orientation of fibre” and “Nozzle temperature (°C)” characteristics. With strength at peak prediction, one can evaluate the effectiveness of the input variables in predicting. Optimal tree diagram (a) Strength at Peak, (b) Strength at Break.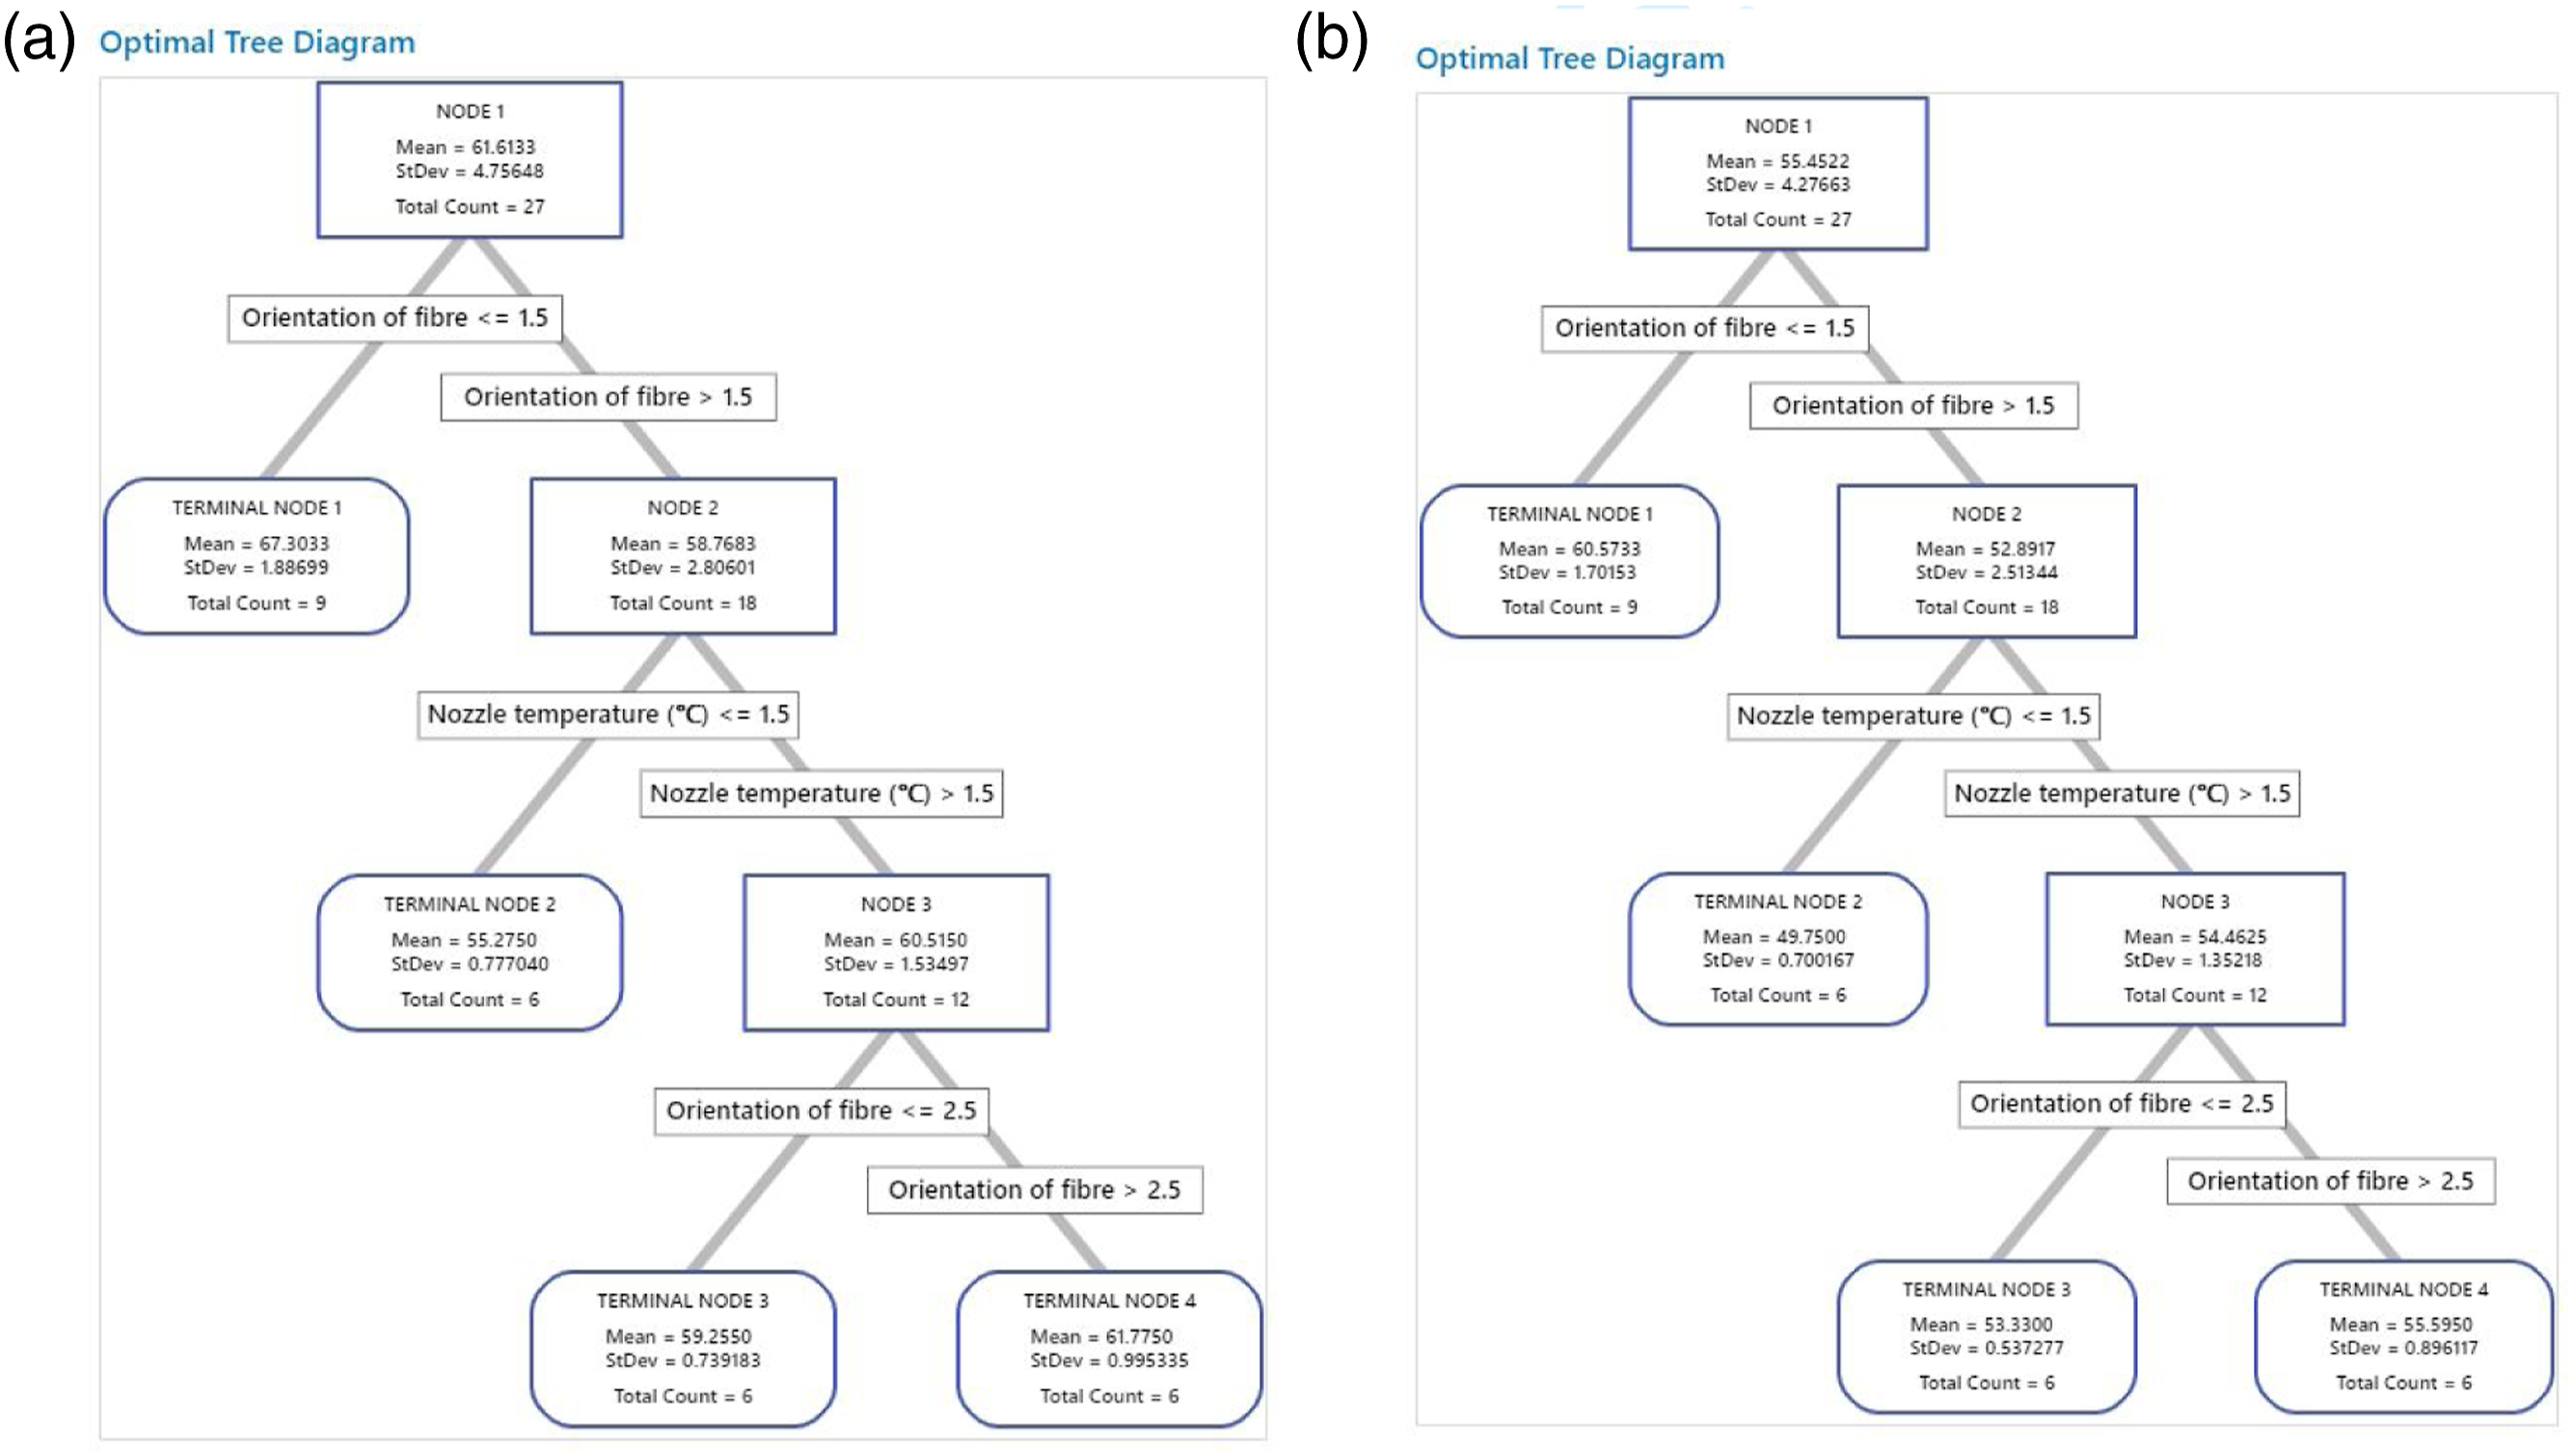
In a CART model for strength peak and break of highly sustainable PLA-CF-PLA sandwiched composite structures, the relative importance of variables was determined by analyzing the impact of each variable orientation of fibre, nozzle, and bed temperature on the structure of the tree. The decline in impurity (such as Gini impurity or entropy) brought on by splits along a variable is typically used to determine the significance of that variable. A variable becomes more crucial the more it influences the reduction in impurity. For instance, a variable is deemed more essential than one used later or not at all if it is utilized as the root node or is chosen as a split node early in the tree construction process. The overall decrease in impurity attained by partitions along that variable or the relevance of a variable in impurity across all splits that employ that variable may also be determined by the average improvement. The relative importance of variables orientation of fibre, nozzle, and bed temperature is shown in Figure 9(a) and Figure 9(b) for strength peak and break, respectively. The variable orientation of fibre has 100% importance, followed by nozzle and bed temperatures. The relative importance of variables (a) Strength at Peak, (b) Strength at break.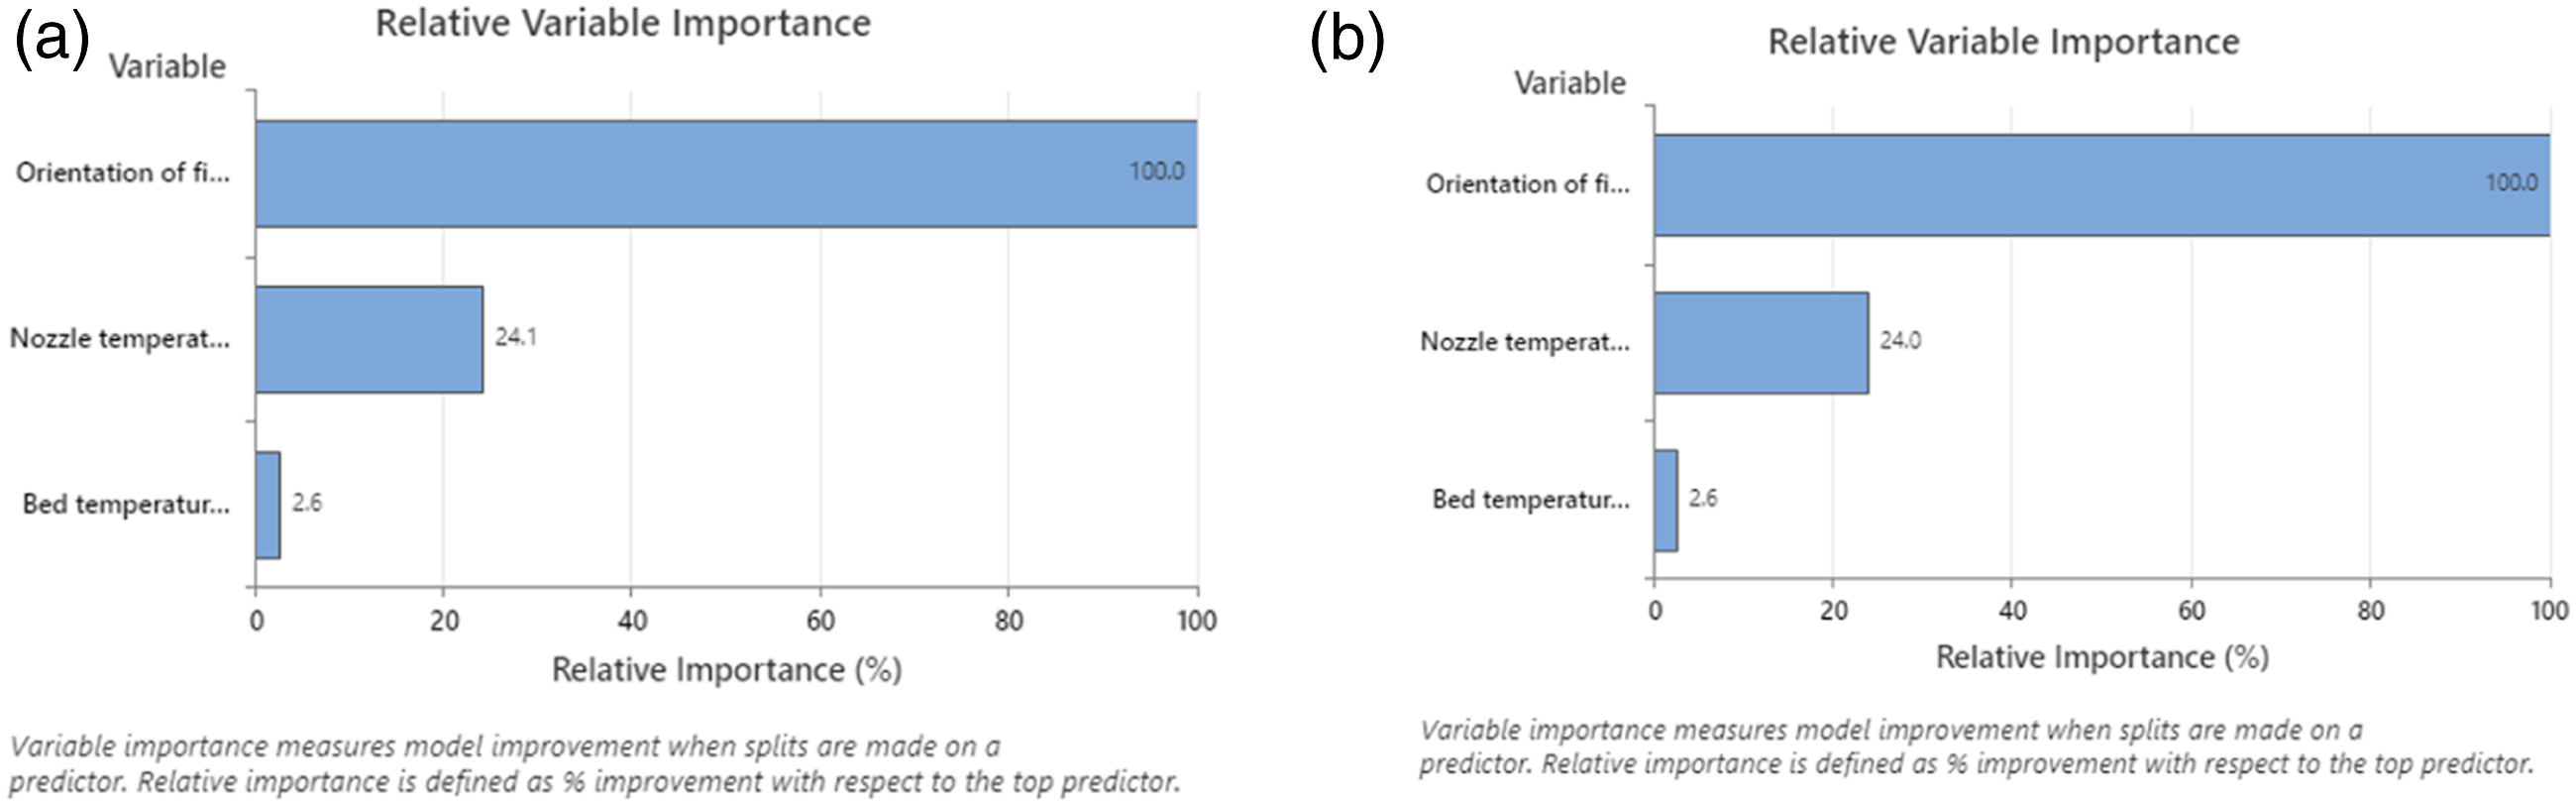
Performance metric of the CART models of strength at peak and break.
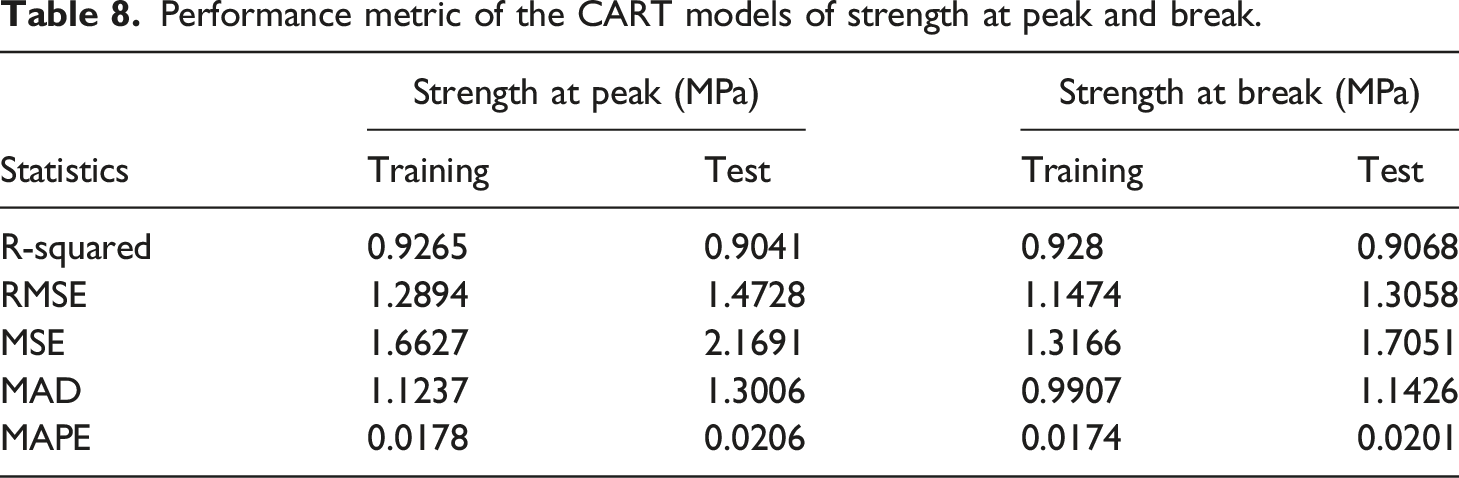
The R-squared shows the coefficient of determination, which represents the proportion of variation in the strength peak and break that is explained by the independent variables. The R-squared values for strength at peak of 0.9265 and 0.9041 and strength at break of 0.928 and 0.9068, respectively, for training and test, are high, indicating that the model explains a large proportion of the variations. The RMSE represents the square root of the average of the squared differences between the predicted and actual strength values, and lower values indicate better predictive accuracy. The RMSE values for strength at peak of 1.2894 and 1.4728 and strength at break of 1.1474 and 1.3058 for training and test are relatively low, indicating good predictive accuracy. The MSE represents the average of the squared differences between the predicted and actual strength values. Lower values of MSE indicate better predictive accuracy. The MSE values for strength at peak 1.6627 and 2.1691 and strength at break of 1.3166 and 1.7051 for training and test are relatively low, indicating good predictive accuracy. The MAD represents the average absolute differences between the predicted and actual strength values, and lower values indicate better predictive accuracy. The MAD values for strength at peak of 1.1237 and 1.3006 and strength at break of 0.9907 and 1.1426 for training and test are relatively low, indicating good predictive accuracy. The MAPE represents the average absolute percentage differences between the predicted and actual strength values, and lower values indicate better predictive accuracy. The MAPE values for strength at peak of 0.0178 and 0.0206 and strength at break of 0.0174 and 0.0201 are relatively low, indicating good predictive accuracy.
These performance metrics suggest that the CART regression model using three predictors orientation of fibre, nozzle, and bed temperature is a good fit for predicting the strength of the highly sustainable PLA-CF-PLA sandwiched composite structures. The model has high explanatory power, good predictive accuracy, and low errors.
A scatterplot of response fits versus actual values is a valuable tool for evaluating the performance of a CART model. The scatterplot in Figure 10 shows the relationship between the predicted values and the peak strength and break strength values. In an ideal situation, the scatterplot should be close to a 45-degree line, indicating that the predicted values are relative to the actual values. The model has high accuracy and looks similar to Figure 10. So, the scatterplot of strength at peak in Figure 10(a) and of strength at break in Figure 10(b) fit versus actual values and proves to be a useful diagnostic tool for evaluating the performance of strength at peak and of strength at break CART models and ensuring that it is a good fit for the data. Scatterplot of Response Fits versus Actual Values (a) Strength at Peak, (b) Strength at break.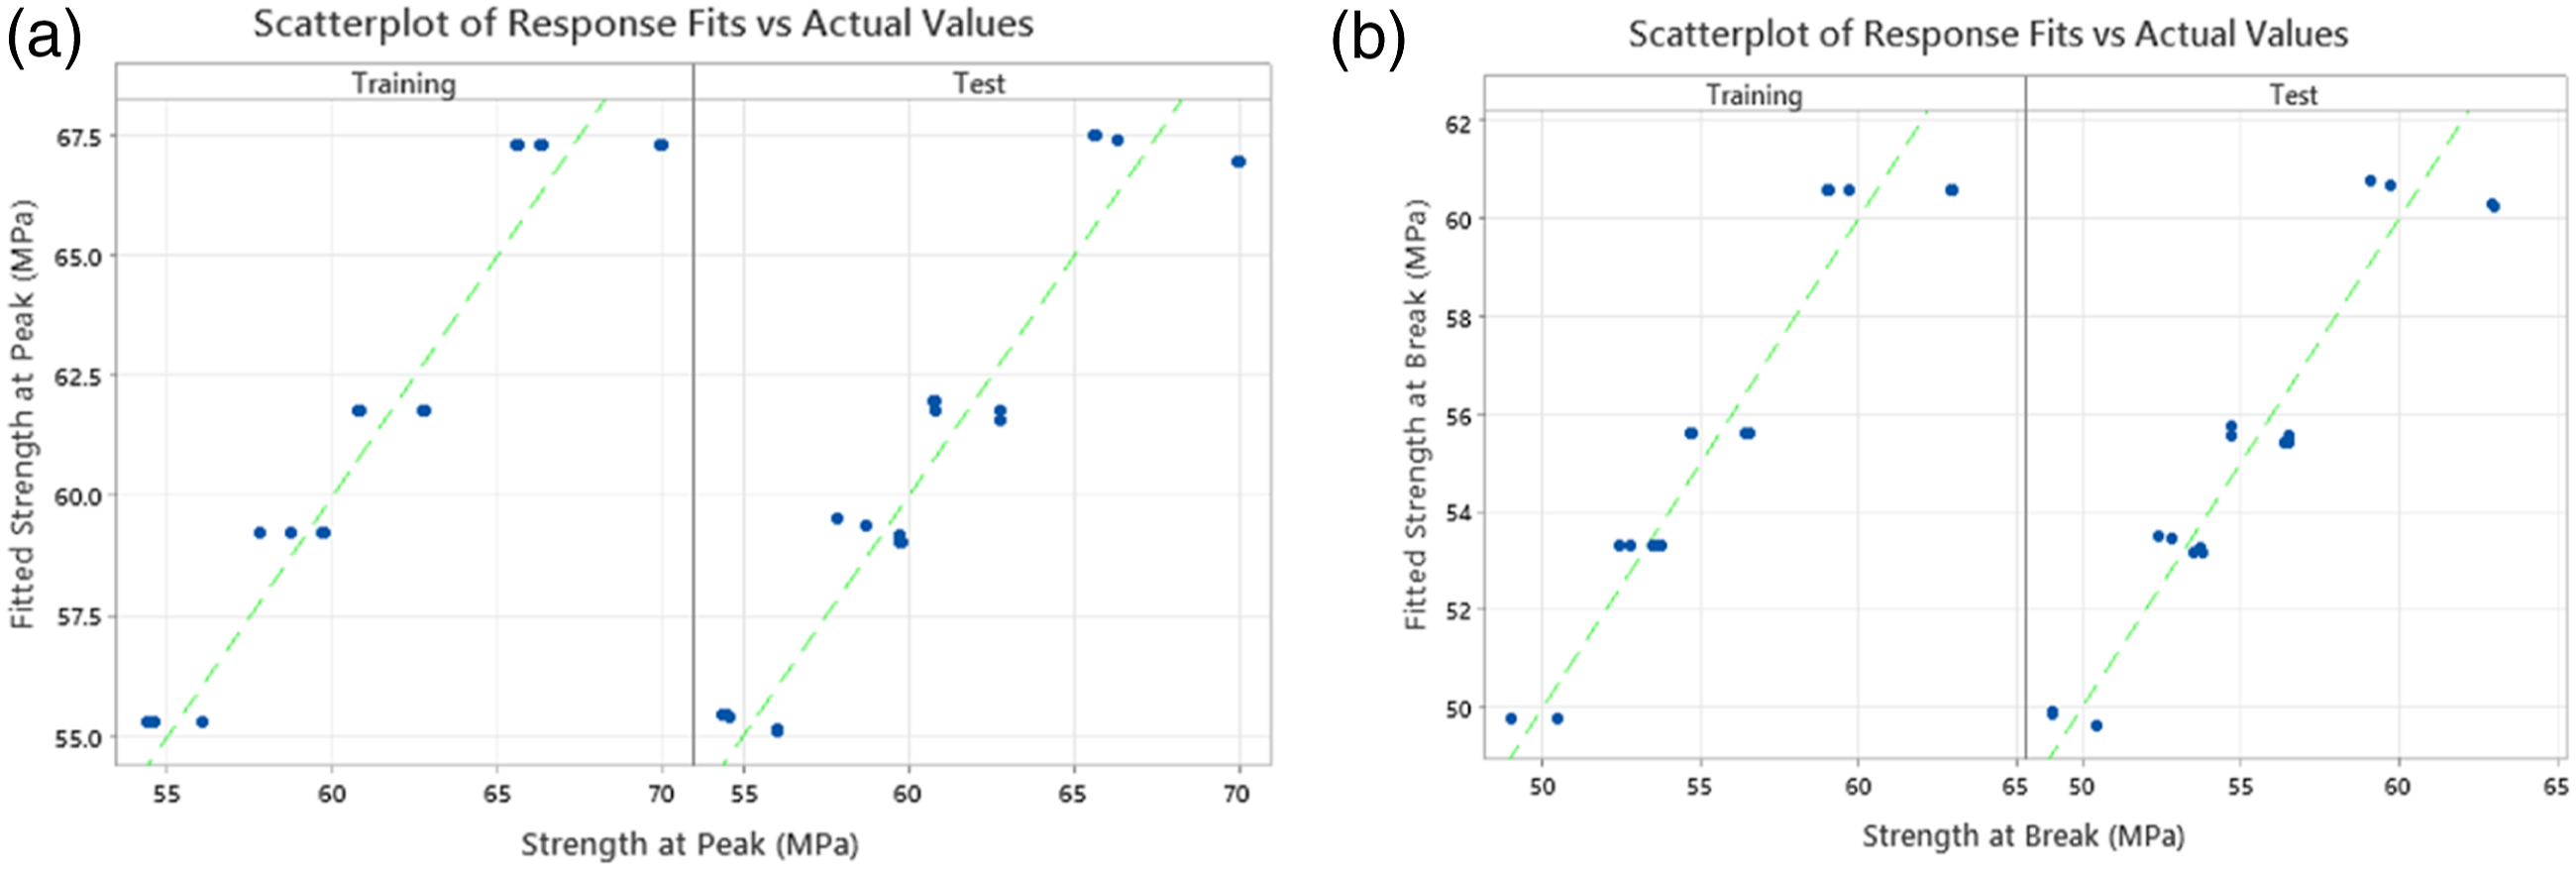
ML models can be used to identify process conditions that predict improved properties, but their effectiveness is typically limited to the conditions they have been trained on. ML models learn patterns and relationships from existing data, so if the model has not been exposed to certain process conditions, it may not accurately predict the outcomes of those conditions.
SEM analysis
The best (sample 2) and worst samples (sample 8) (as per Young; s moduus) of PLA-CF-PLA composites have considered for SEM analysis. From the EDS, it was observed that the carbon% is maximum in sample 2, which means that due to CF reinforcement, the bonding or adhesion between the PLA and CF were much better than in sample 8.
Also, from the SEM images, it was observed that after fracture, the CF gets distorted unevenly in sample 8, but for sample 2, the CF is in a stretched form in a tensile direction which may be responsible for better mechanical properties. Figure 11 shows the SEM analysis of samples 2 and 8. Figure 12 shows the EDS of samples 2 and 8 of the PLA-CF-PLA composites. SEM images of samples 2, and 8. EDS of samples 2 and 8 of PLA-CF-PLA composite.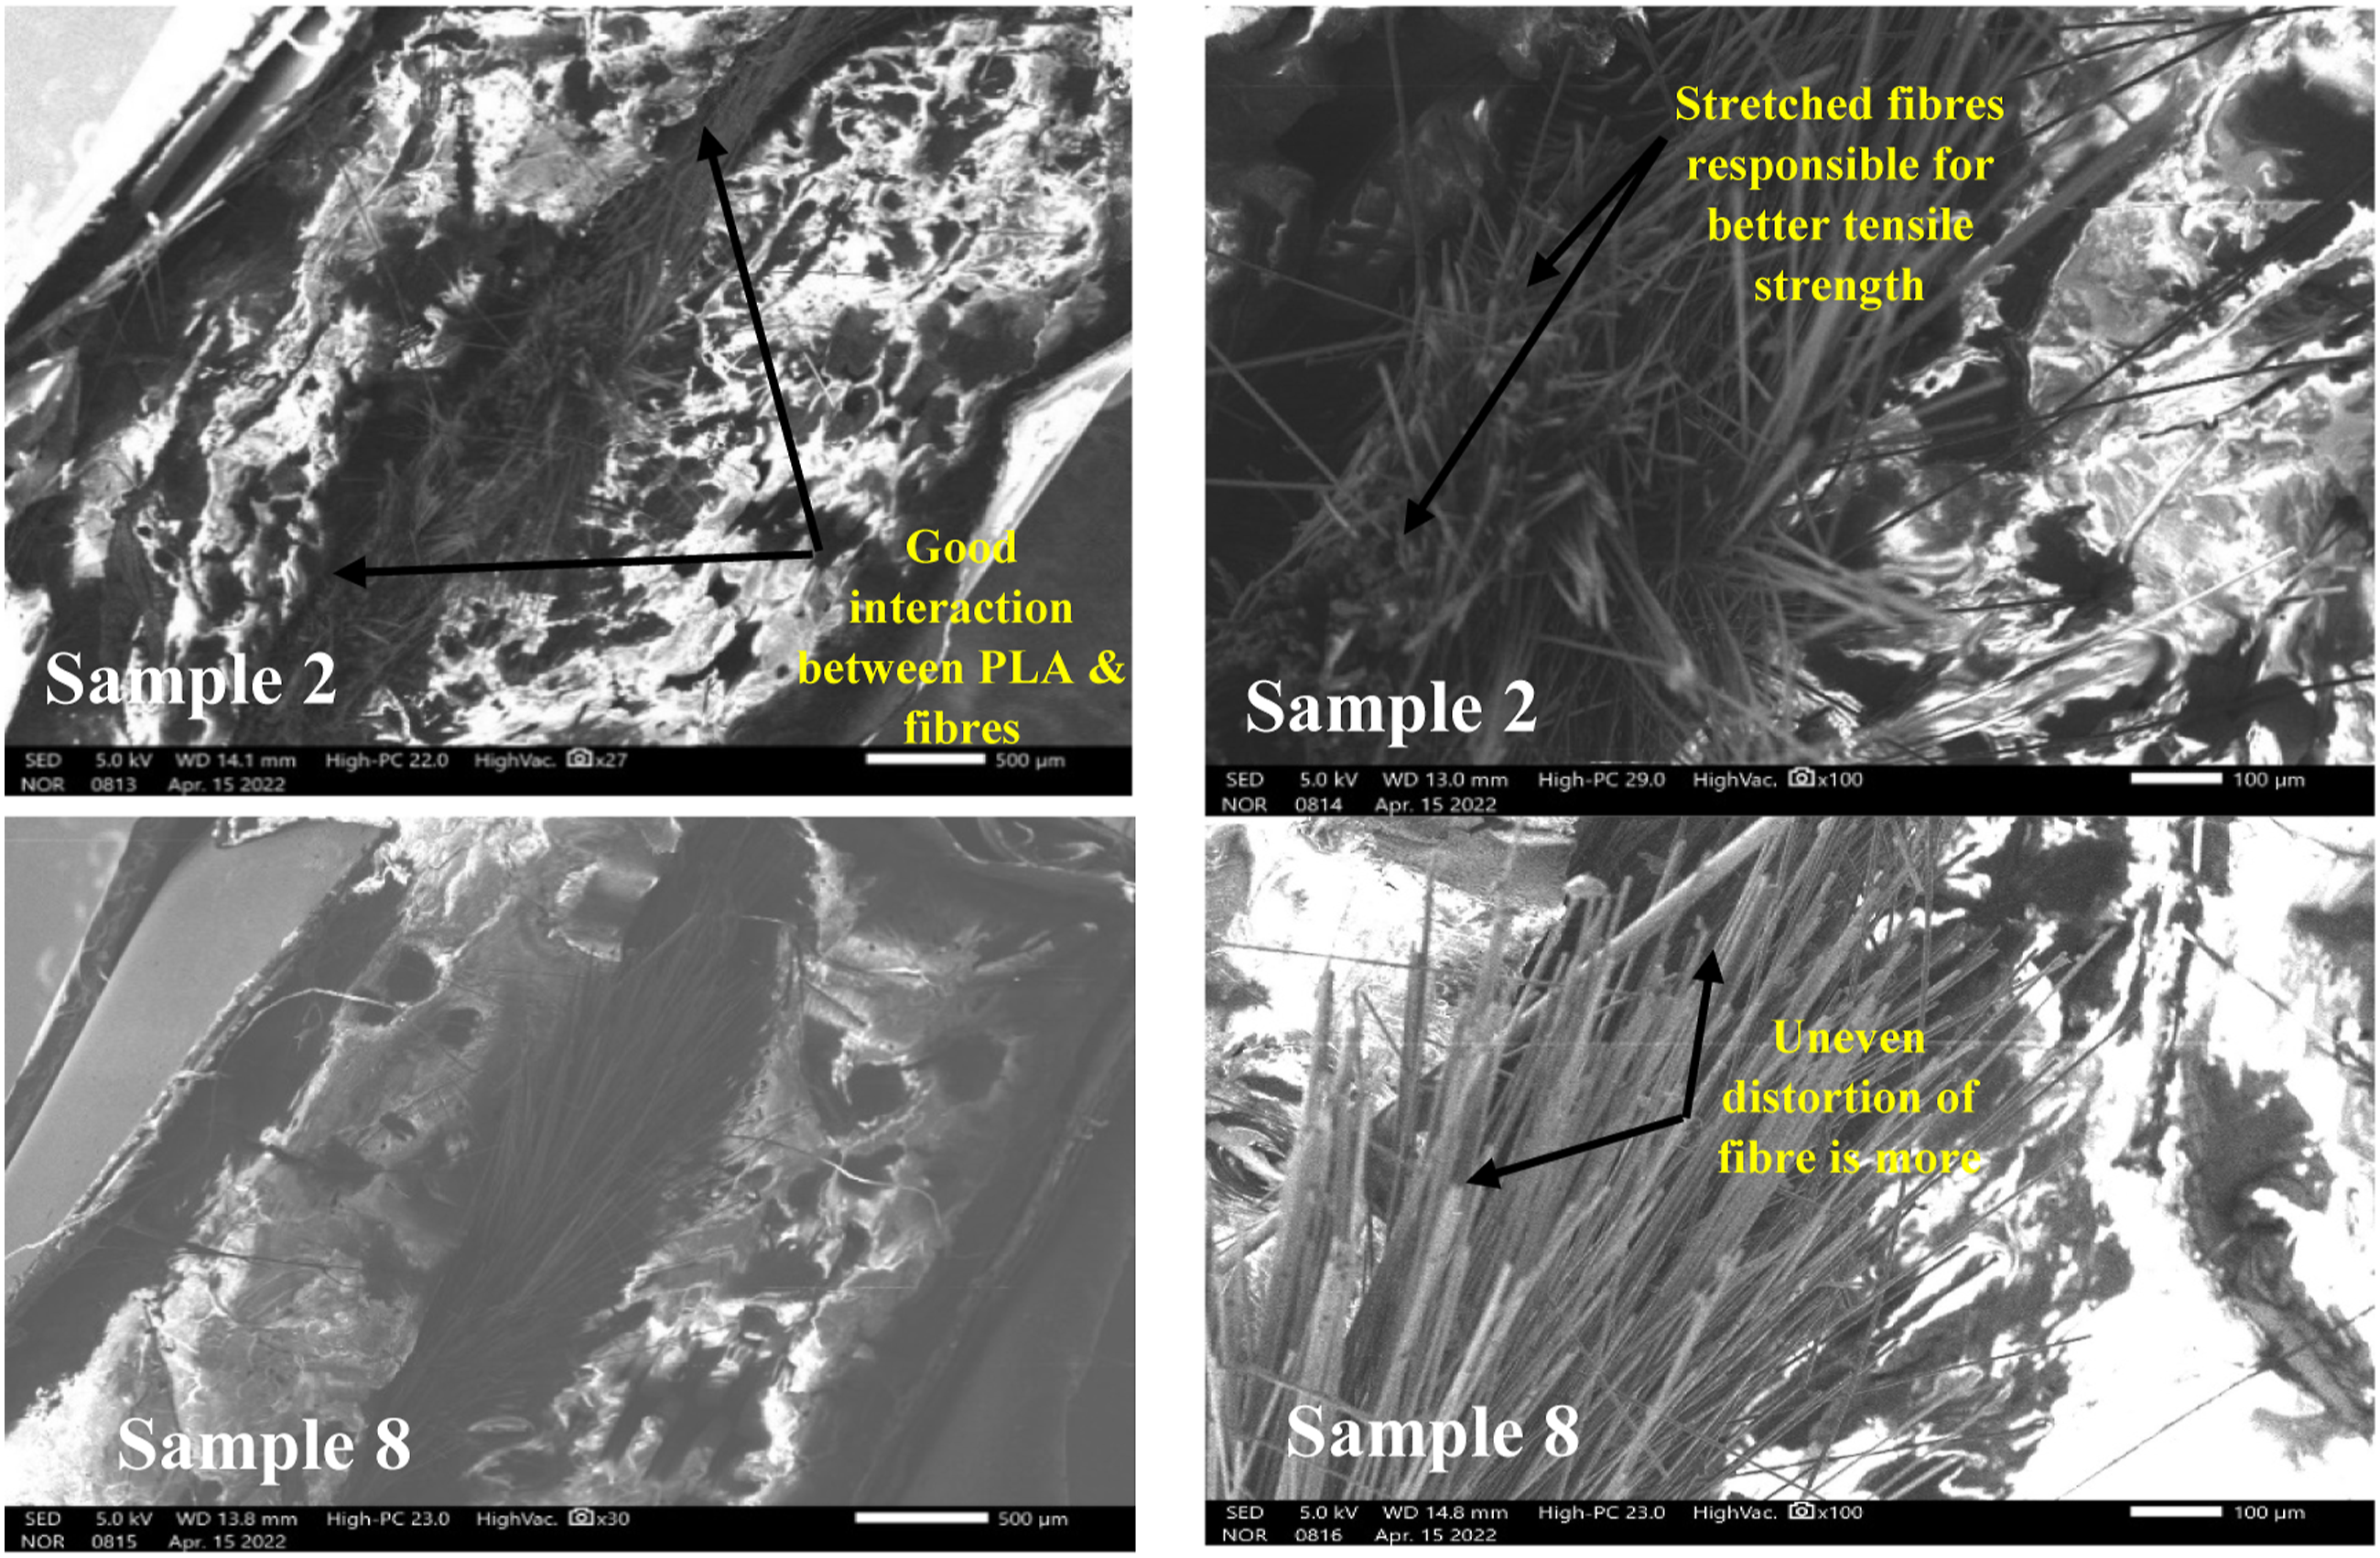
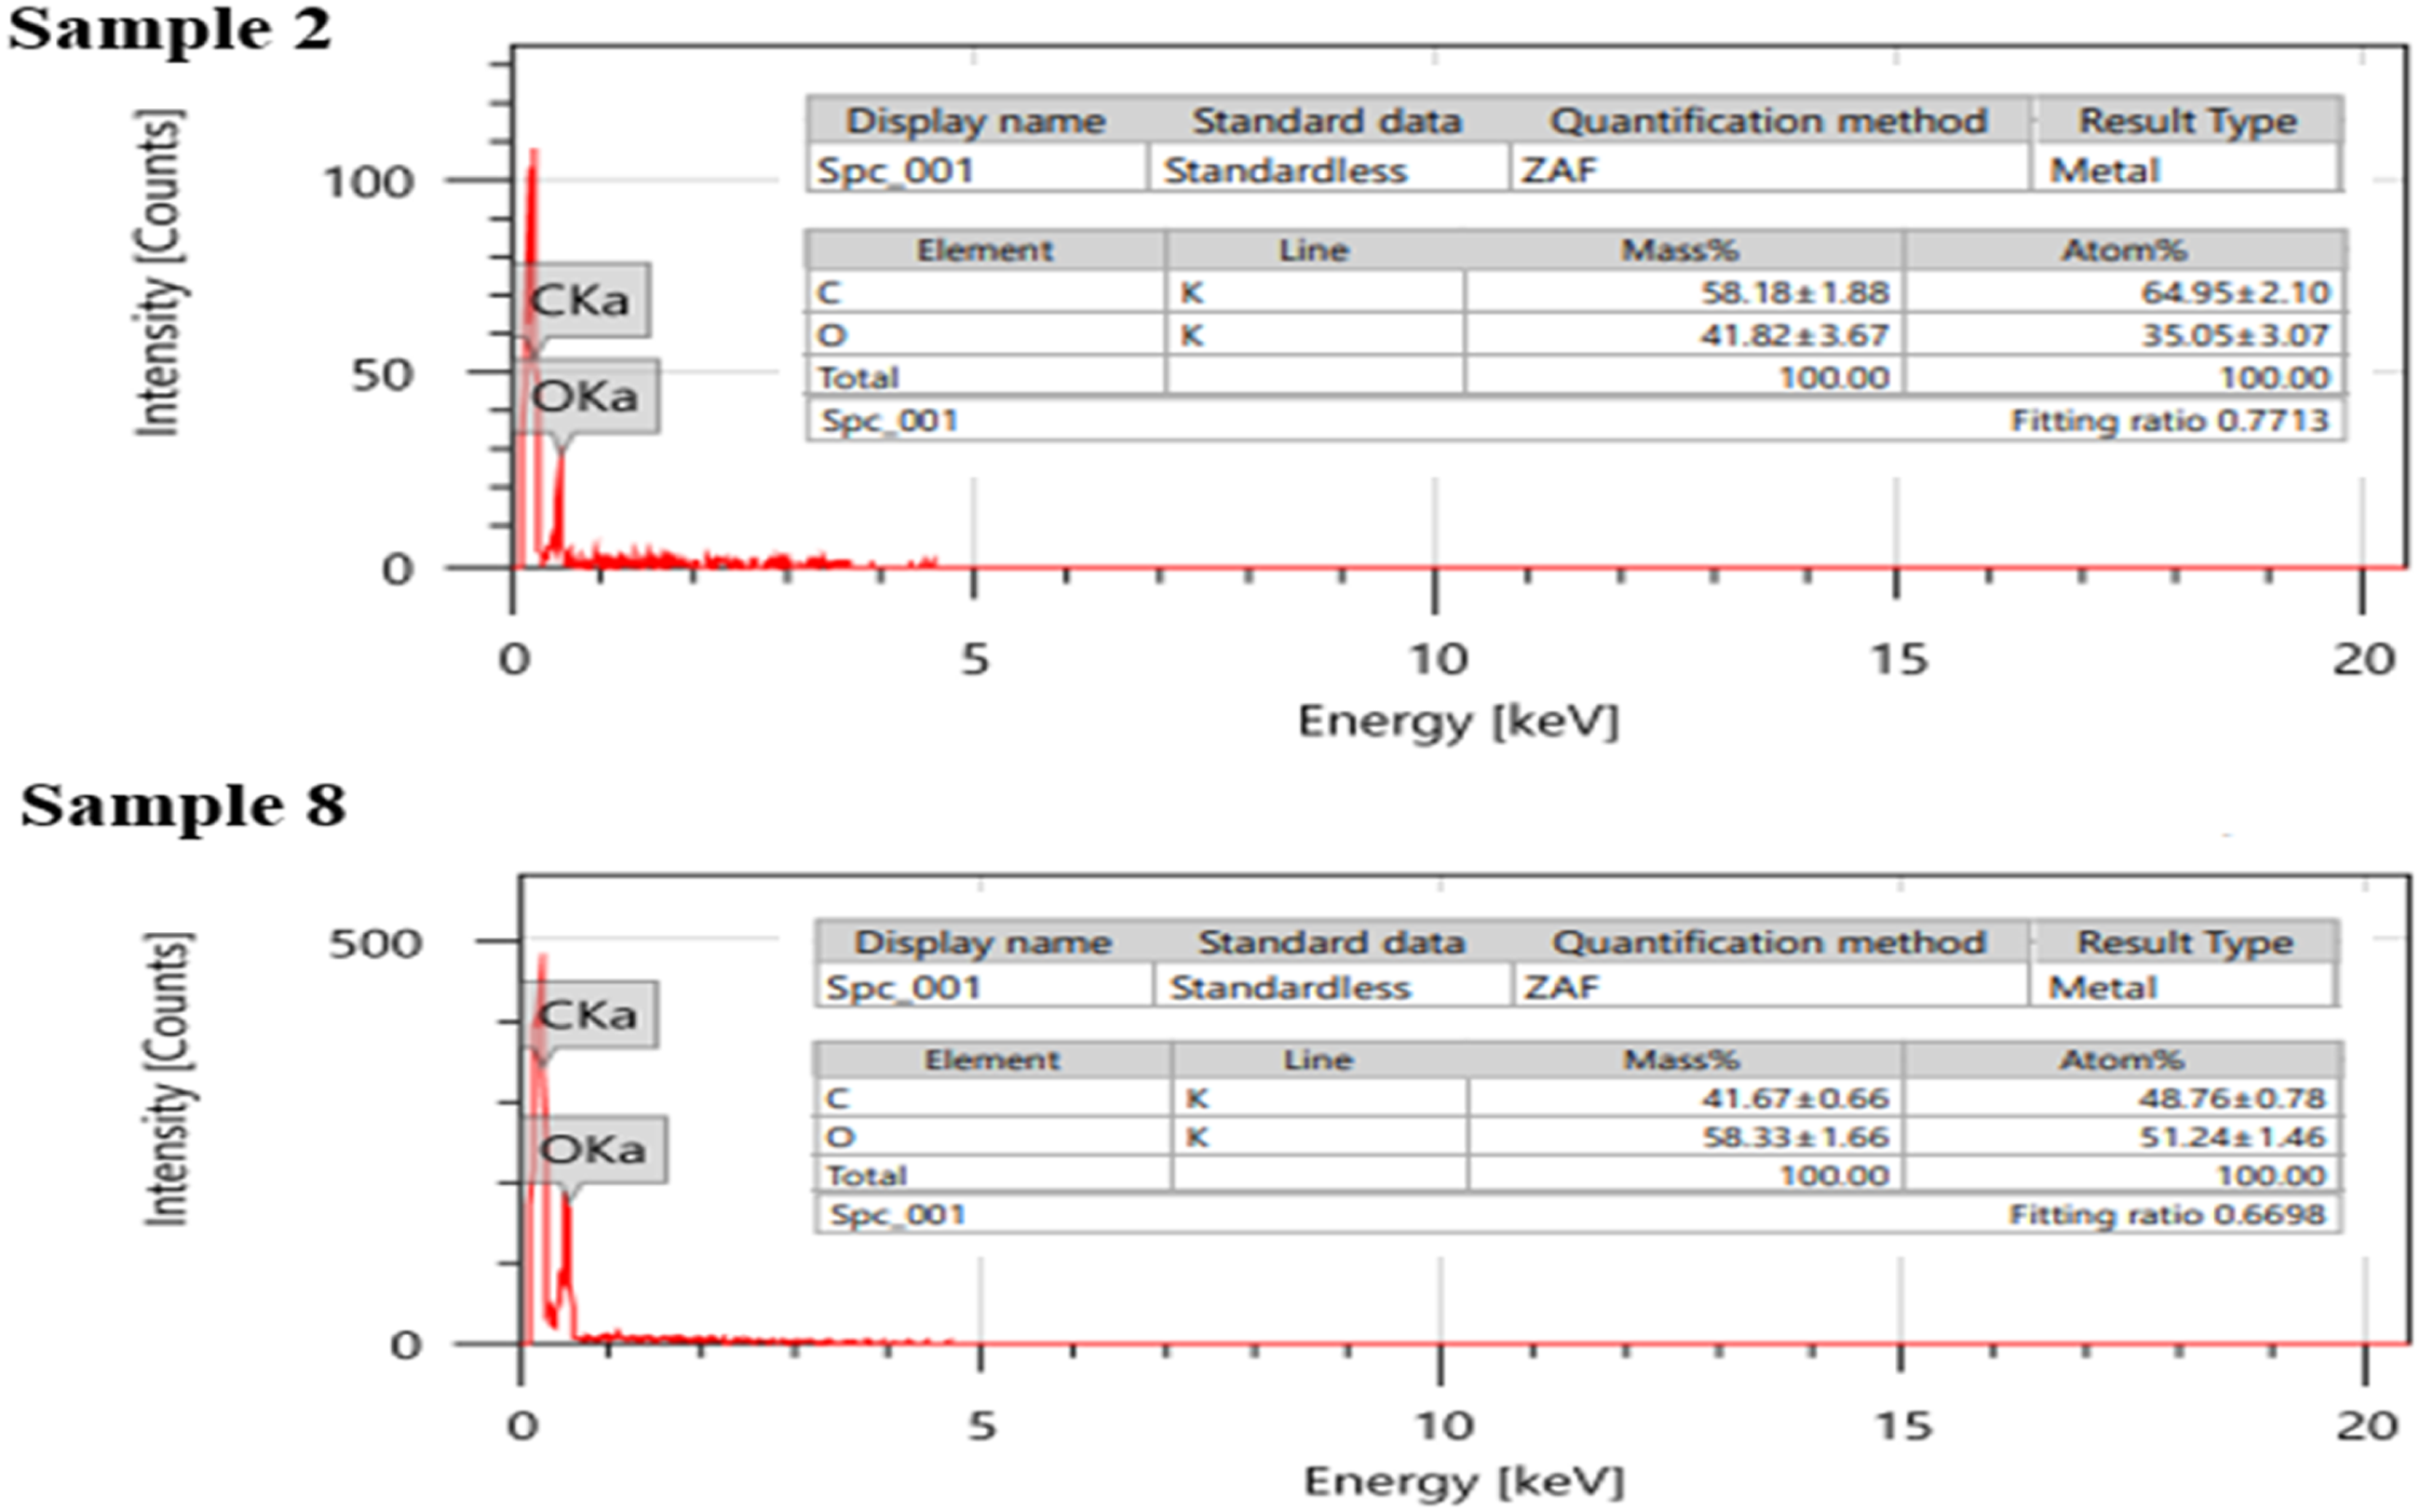
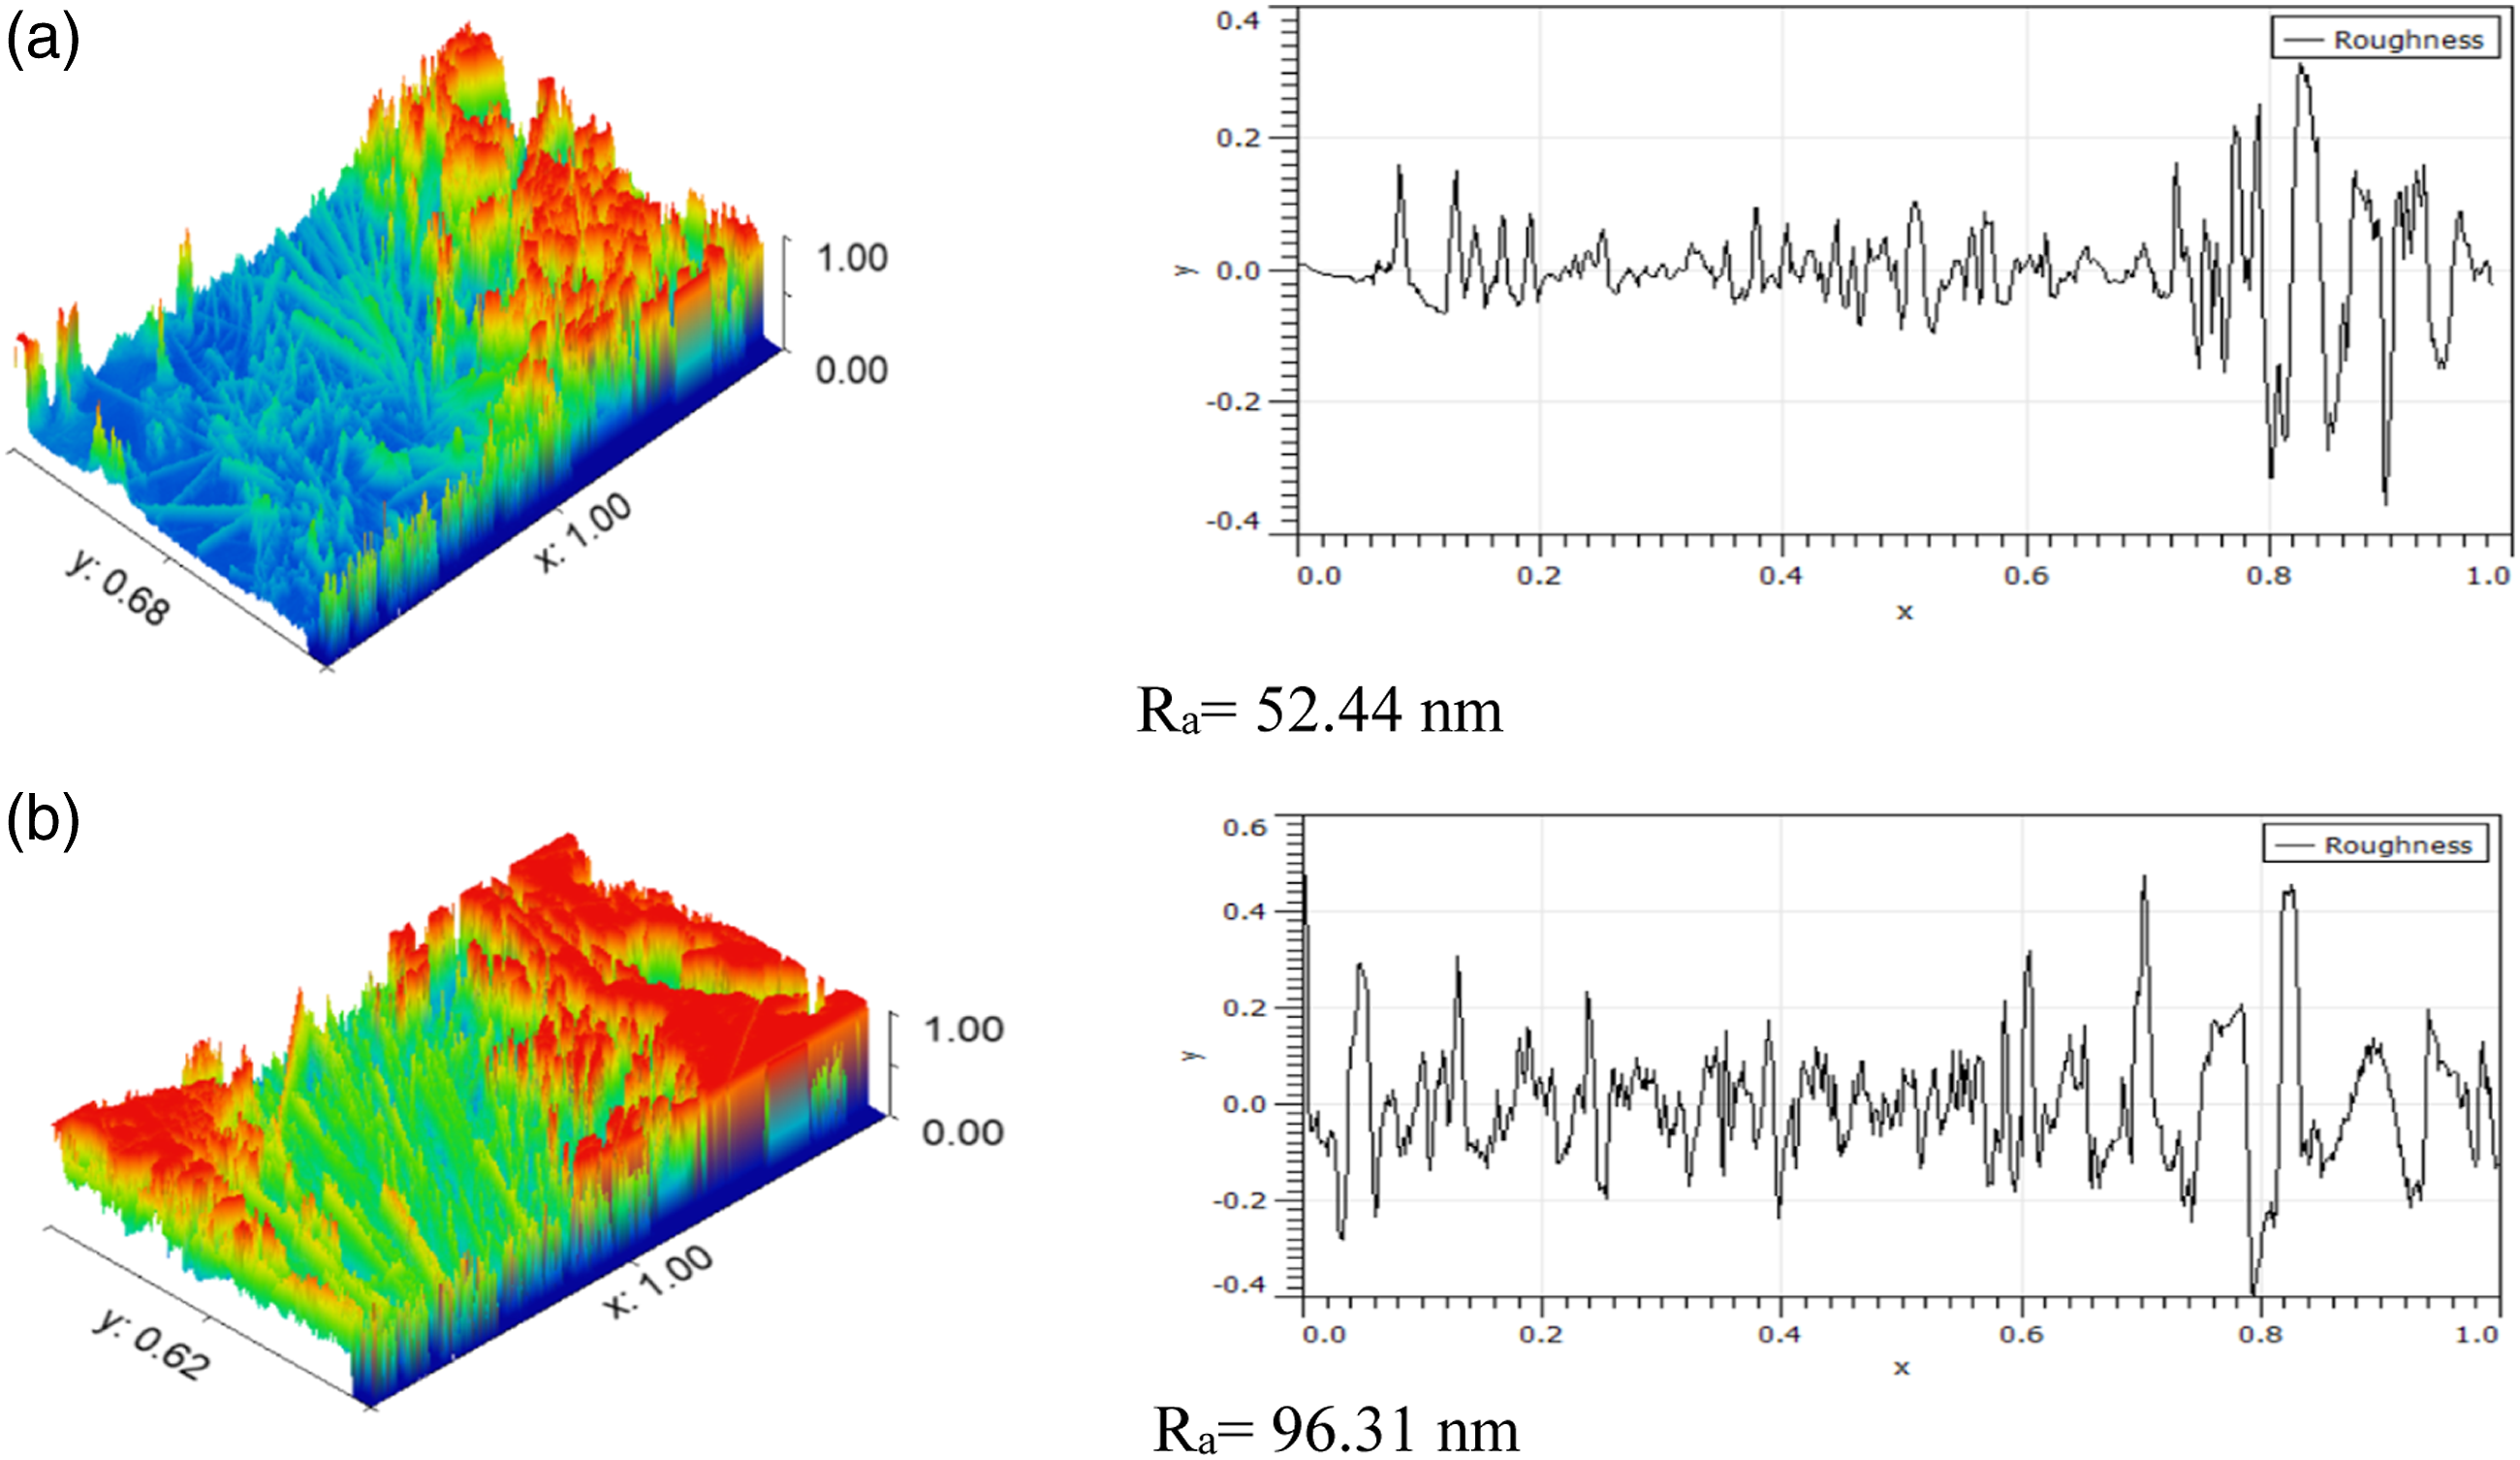
Figure 13 shows the porosity profile of samples 2 and 8. Porosity percentage was observed as a minimum for sample 2 (18.03%) compared to sample 8 (26.47%). With an increment of porosity, the weakening of material takes place, resulting in decreased mechanical properties. The roughness profile of samples 2 and 8 are shown in Figure 14. From the roughness profile. It was observed that sample 2 has a lower average roughness value (Ra) compared to sample 8, which may be the reason for the enhancement in the mechanical properties of sample 2. Porosity profile of (a) Sample 2 and (b) Sample 8. Roughness profile of (a) Sample 2 and (b) Sample 8.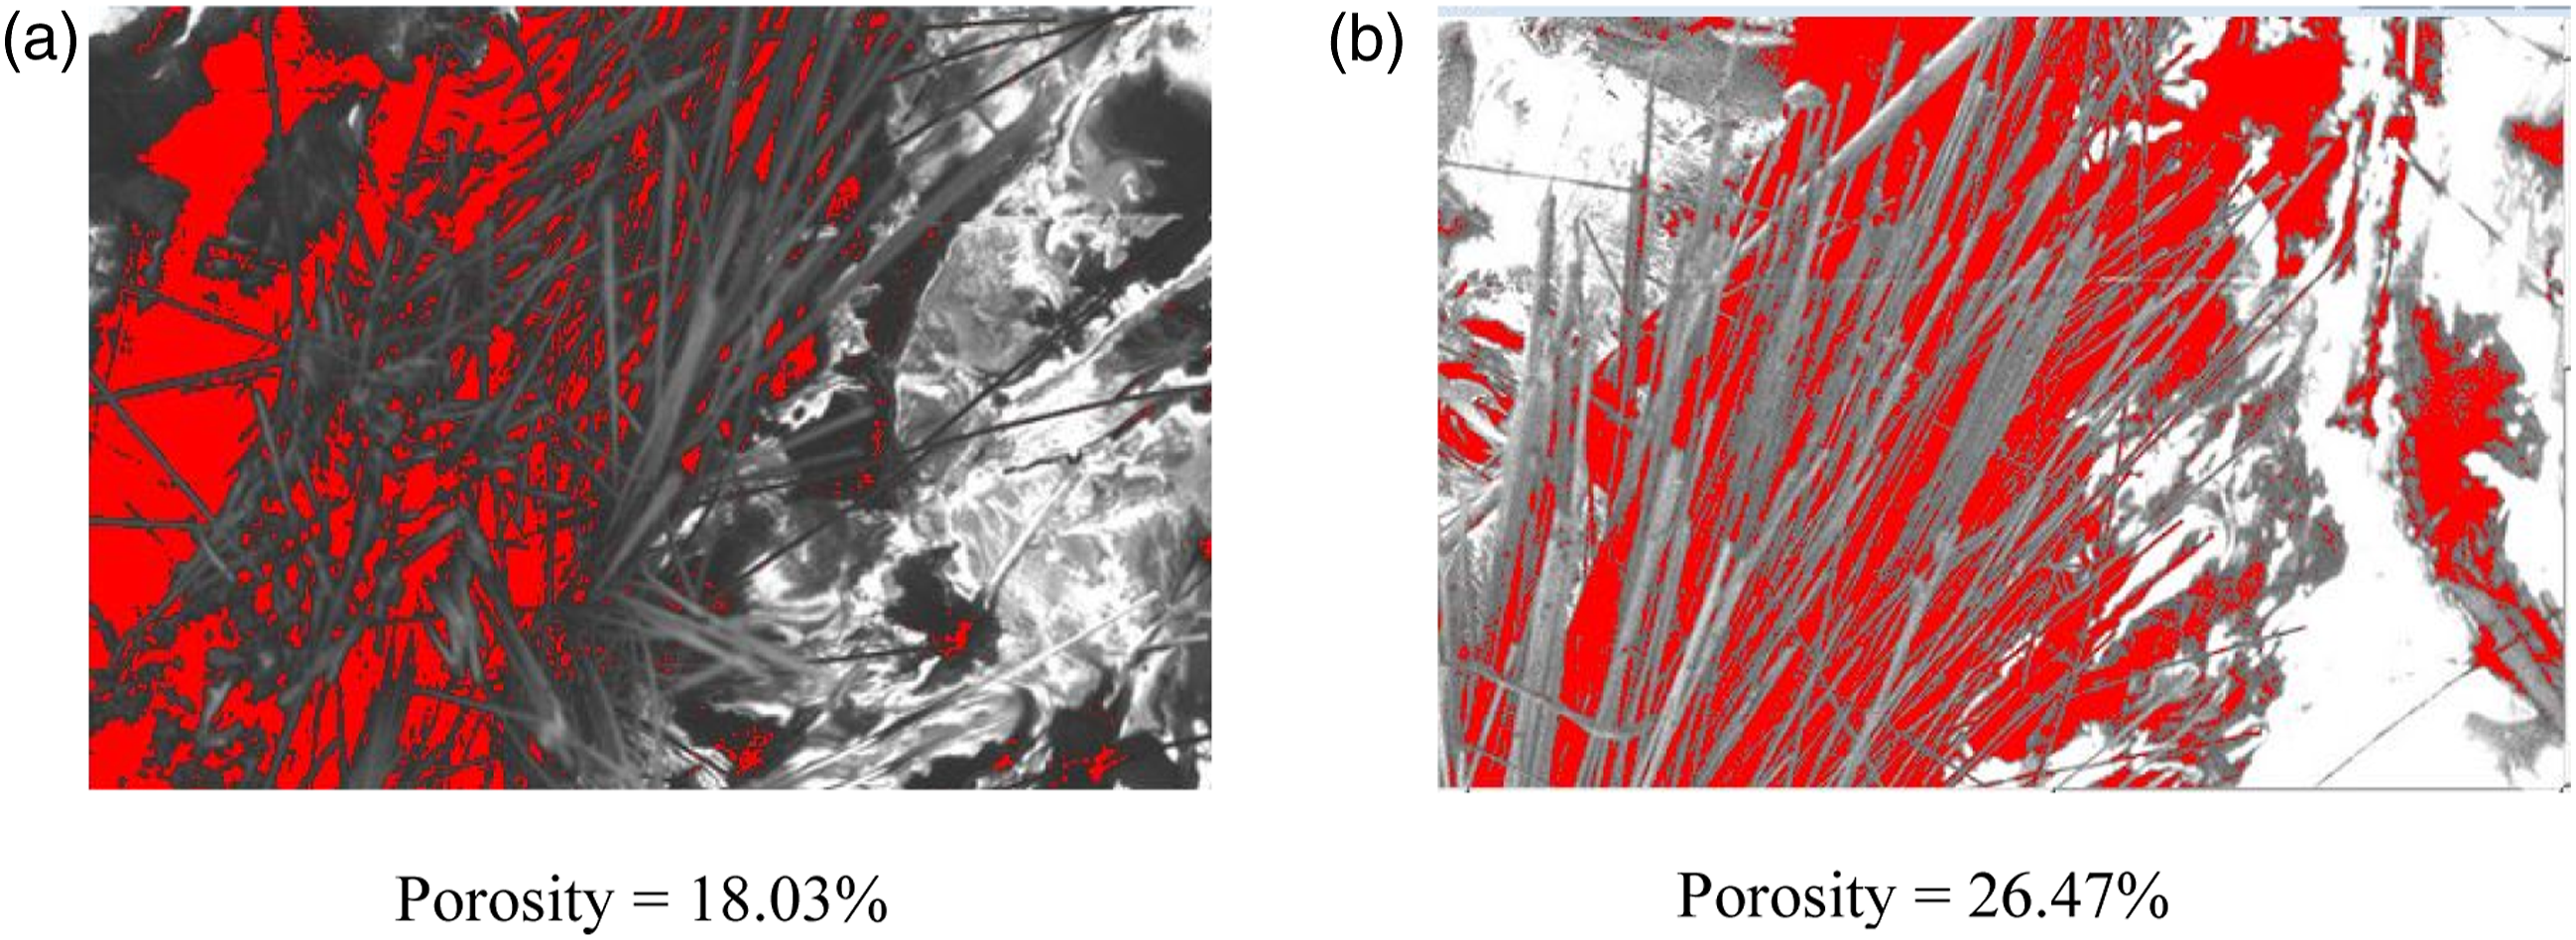
XRD analysis
The peaks were observed for sample 2, exhibiting a maximum of 3 peaks (14.44°, 16.73°, and 17.90°), and sample 8 demonstrating a maximum of 2 peaks (12.12° and 20.27°). Also, the crystallinity for sample 2 was 54.3%, and for sample 8 was 30.8%. Previous studies have reported that Young’s modulus also increases with the increment in the crystallinity value.47,48 In samples 2 and 8, the orientation of fibre at 0° ad 90°, respectively, and the crystallinity increased in sample 2, Young’s modulus and tensile strength also increased. The XRD spectra (intensity or counts vs 2θ) of samples 2 and 8 are shown in Figure 15. The crystallinity value of sample 8 is less as compared to sample 2 which may is responsible to affect the mechanical properties of the composite structures. XRD spectra (intensity or counts vs 2θ) of samples 2, and 8.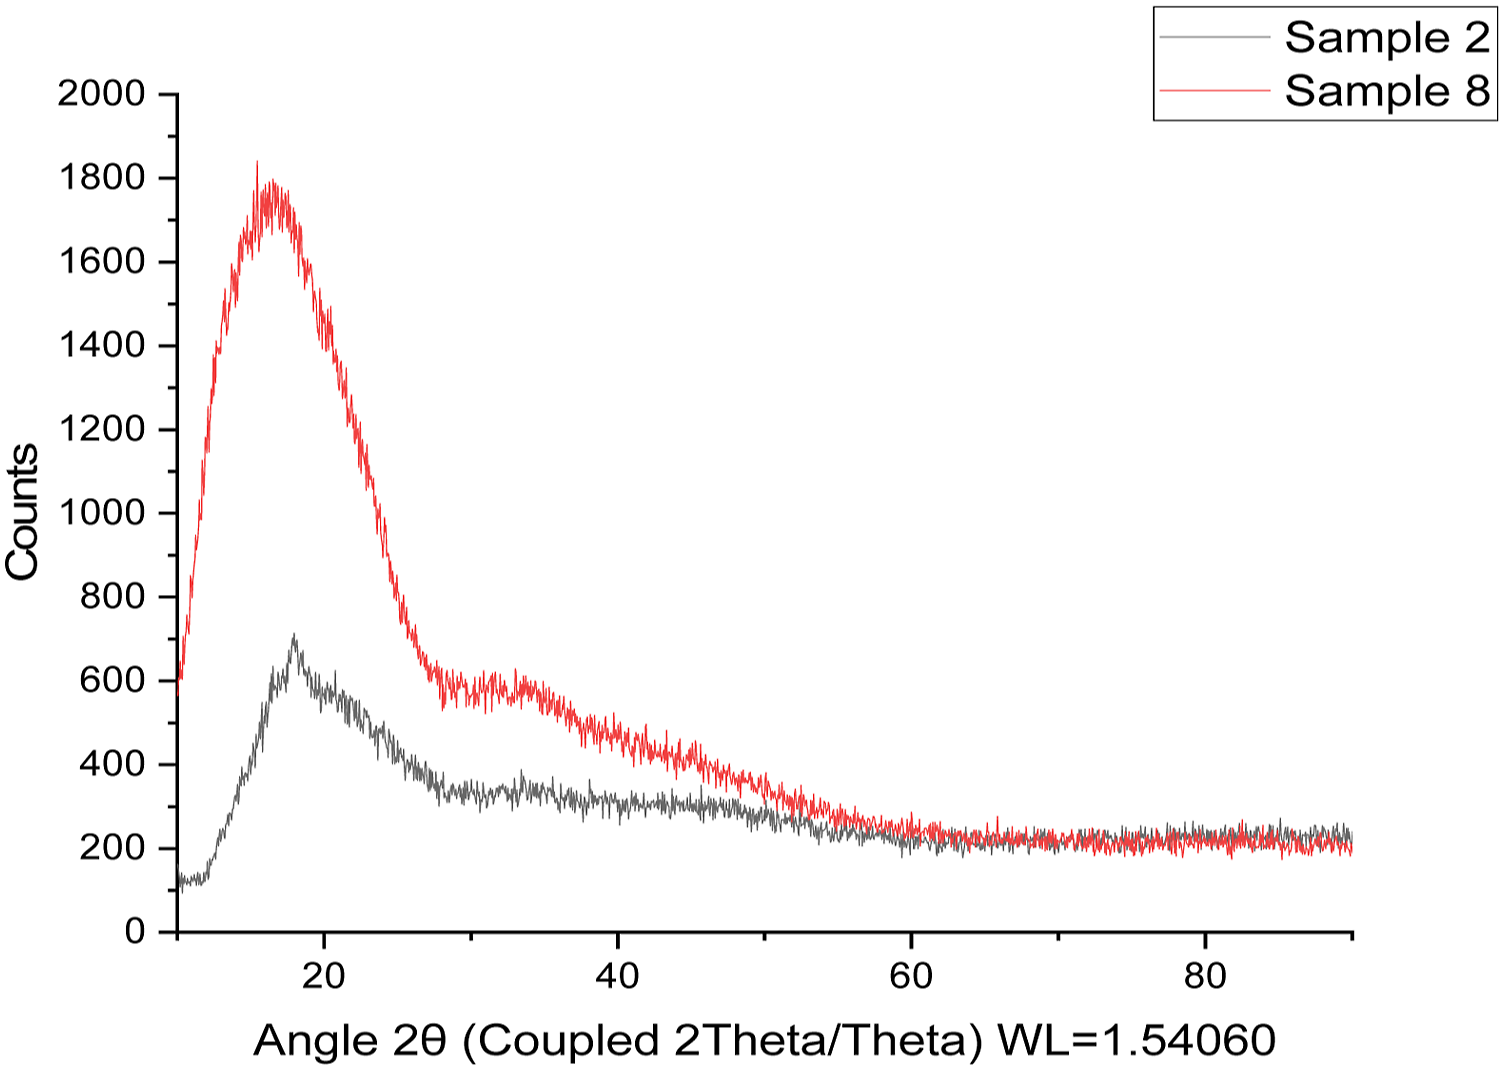
FTIR analysis
The absorbance spectrum obtained for composite samples 2 and 8 are shown in Figure 16. The infrared (IR) rays of wavelength 1000 cm−1 to 3500 cm−1 interpret the presence of various functional groups in the composite samples. The absorbance spectra of PLA-CF-PLA composite samples outlined that the chemical structure of the base matrix was not disturbed by the reinforced fibres as very identical peaks were obtained in PLA-CF-PLA composite samples (Figure 16). The absorbance peaks observed at 3322 cm−1 for C-H bond stretching and 1652 cm−1 correspond to asymmetrical bonding of C = C. Further, symmetrical stretching in O-H bonds was observed at 3178 cm−1 wavenumbers, and C = O stretching was observed at 1716 cm−1. It may be stated that the composite sample 8 corresponds to lesser mechanical strength due to less sharpness in absorbance peaks, and sample 2 corresponds to sharp peaks indicating better bond strength in the functional groups, due to which acceptable mechanical properties were obtained. FTIR of PLA-CF-PLA composite samples.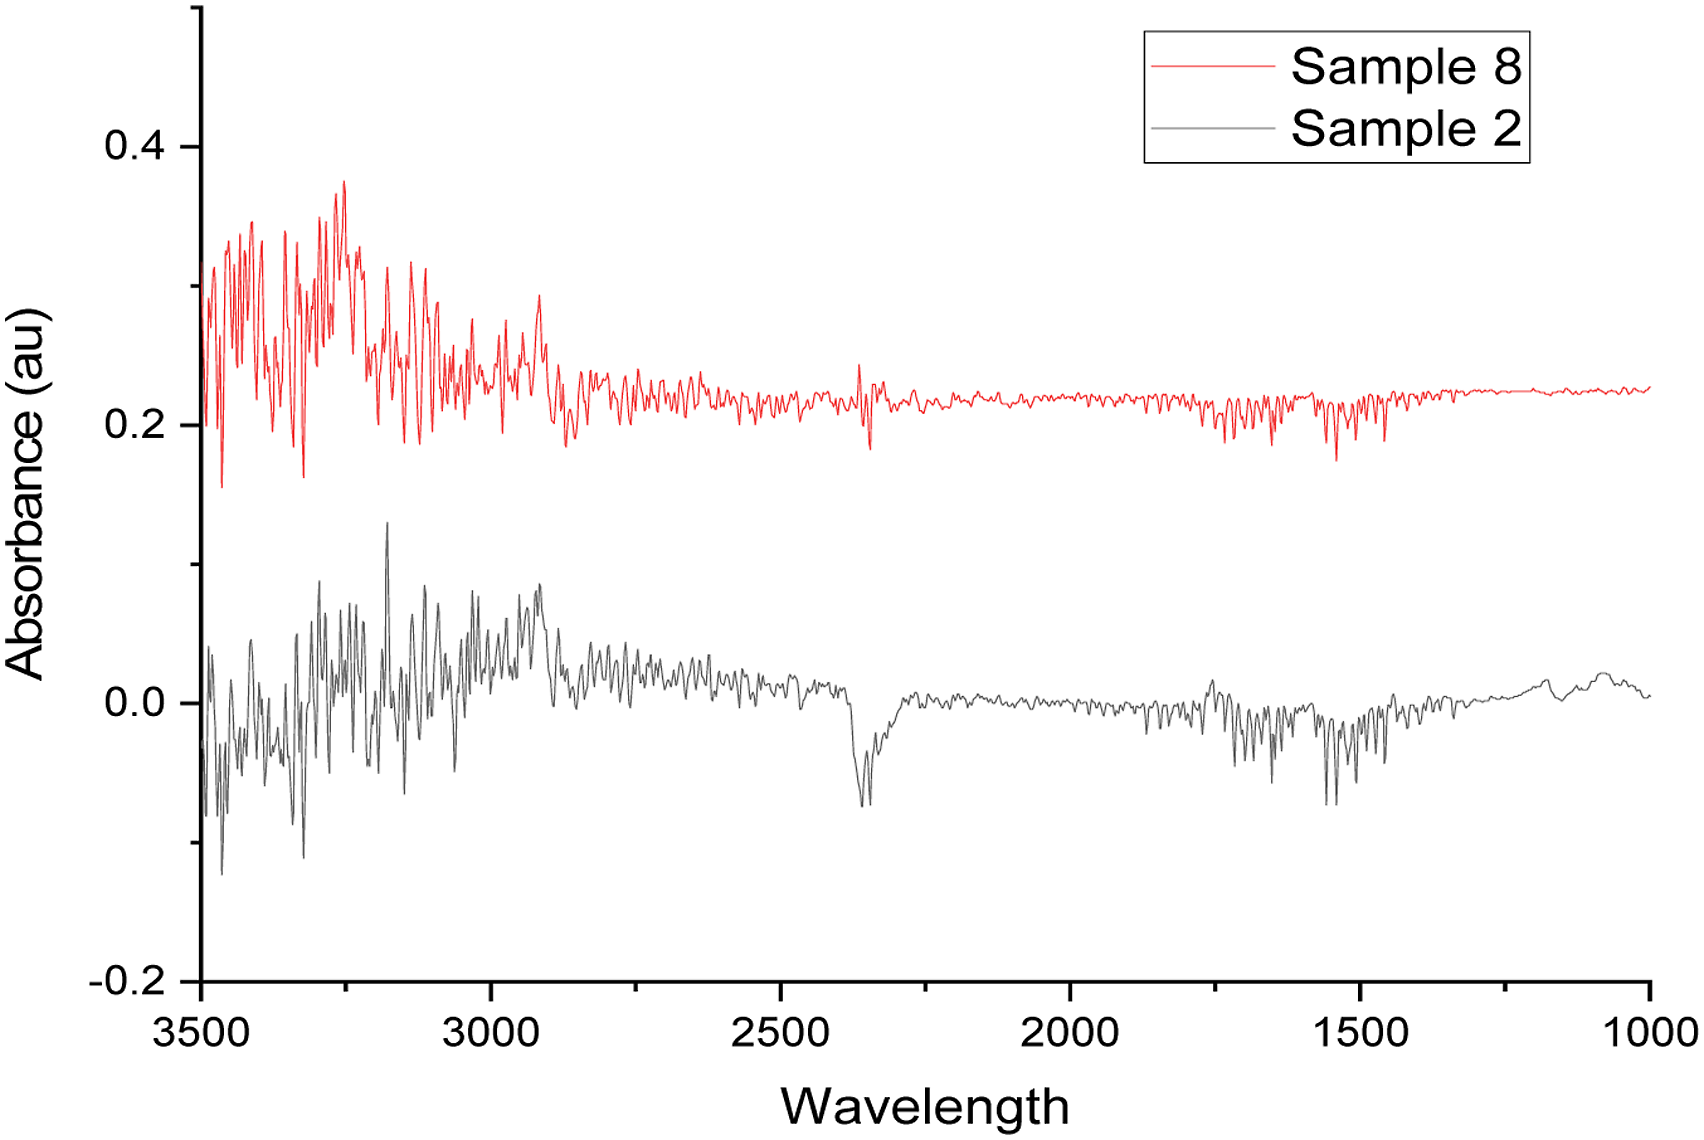
DSC analysis
The DSC analysis of pure PLA-CF-PLA, Sample 2, and Sample 8 was performed to examine the composites’ thermal stability. The DSC graph is shown in Figure 17. The results of crystallinity, peak melting point, and normalized heat capacity were used to determine the thermal stability of the PLA-CF-PLA composite samples. The crystallinity of virgin PLA was observed at 55.17%. Sample 2 was 62.43%, and sample 8 was 51.19% in the first thermal cycle. It means at 0° orientation of fibre; the crystallinity increases may be due to better adhesion and interaction between PLA and CF. In the second thermal cycle, there is an increment in the crystallinity of the PLA-CF-PLA composite samples, and it may be due to the better molecular bonding formed between PLA and CF when it starts processing in an endothermic cycle. The peak melting point was observed for pure PLA-CF-PLA, sample 2 and sample 8 are 167.35°C, 169.56°C and 168.89°C respectively, in the first thermal cycle, which is changed to 167.64°C, 168.22°C and 168.14°C respectively in second thermal cycle. The results of peak melting point show that PLA-CF-PLA composite samples are thermally stable materials. In the first thermal cycle, the normalized heat capacity observed for pure PLA-CF-PLA, sample 2, and sample 8 is −43.62 J/g, −45.44 J/g and −46.28 J/g. DSC analysis for Virgin PLA, Sample 2 and Sample 8.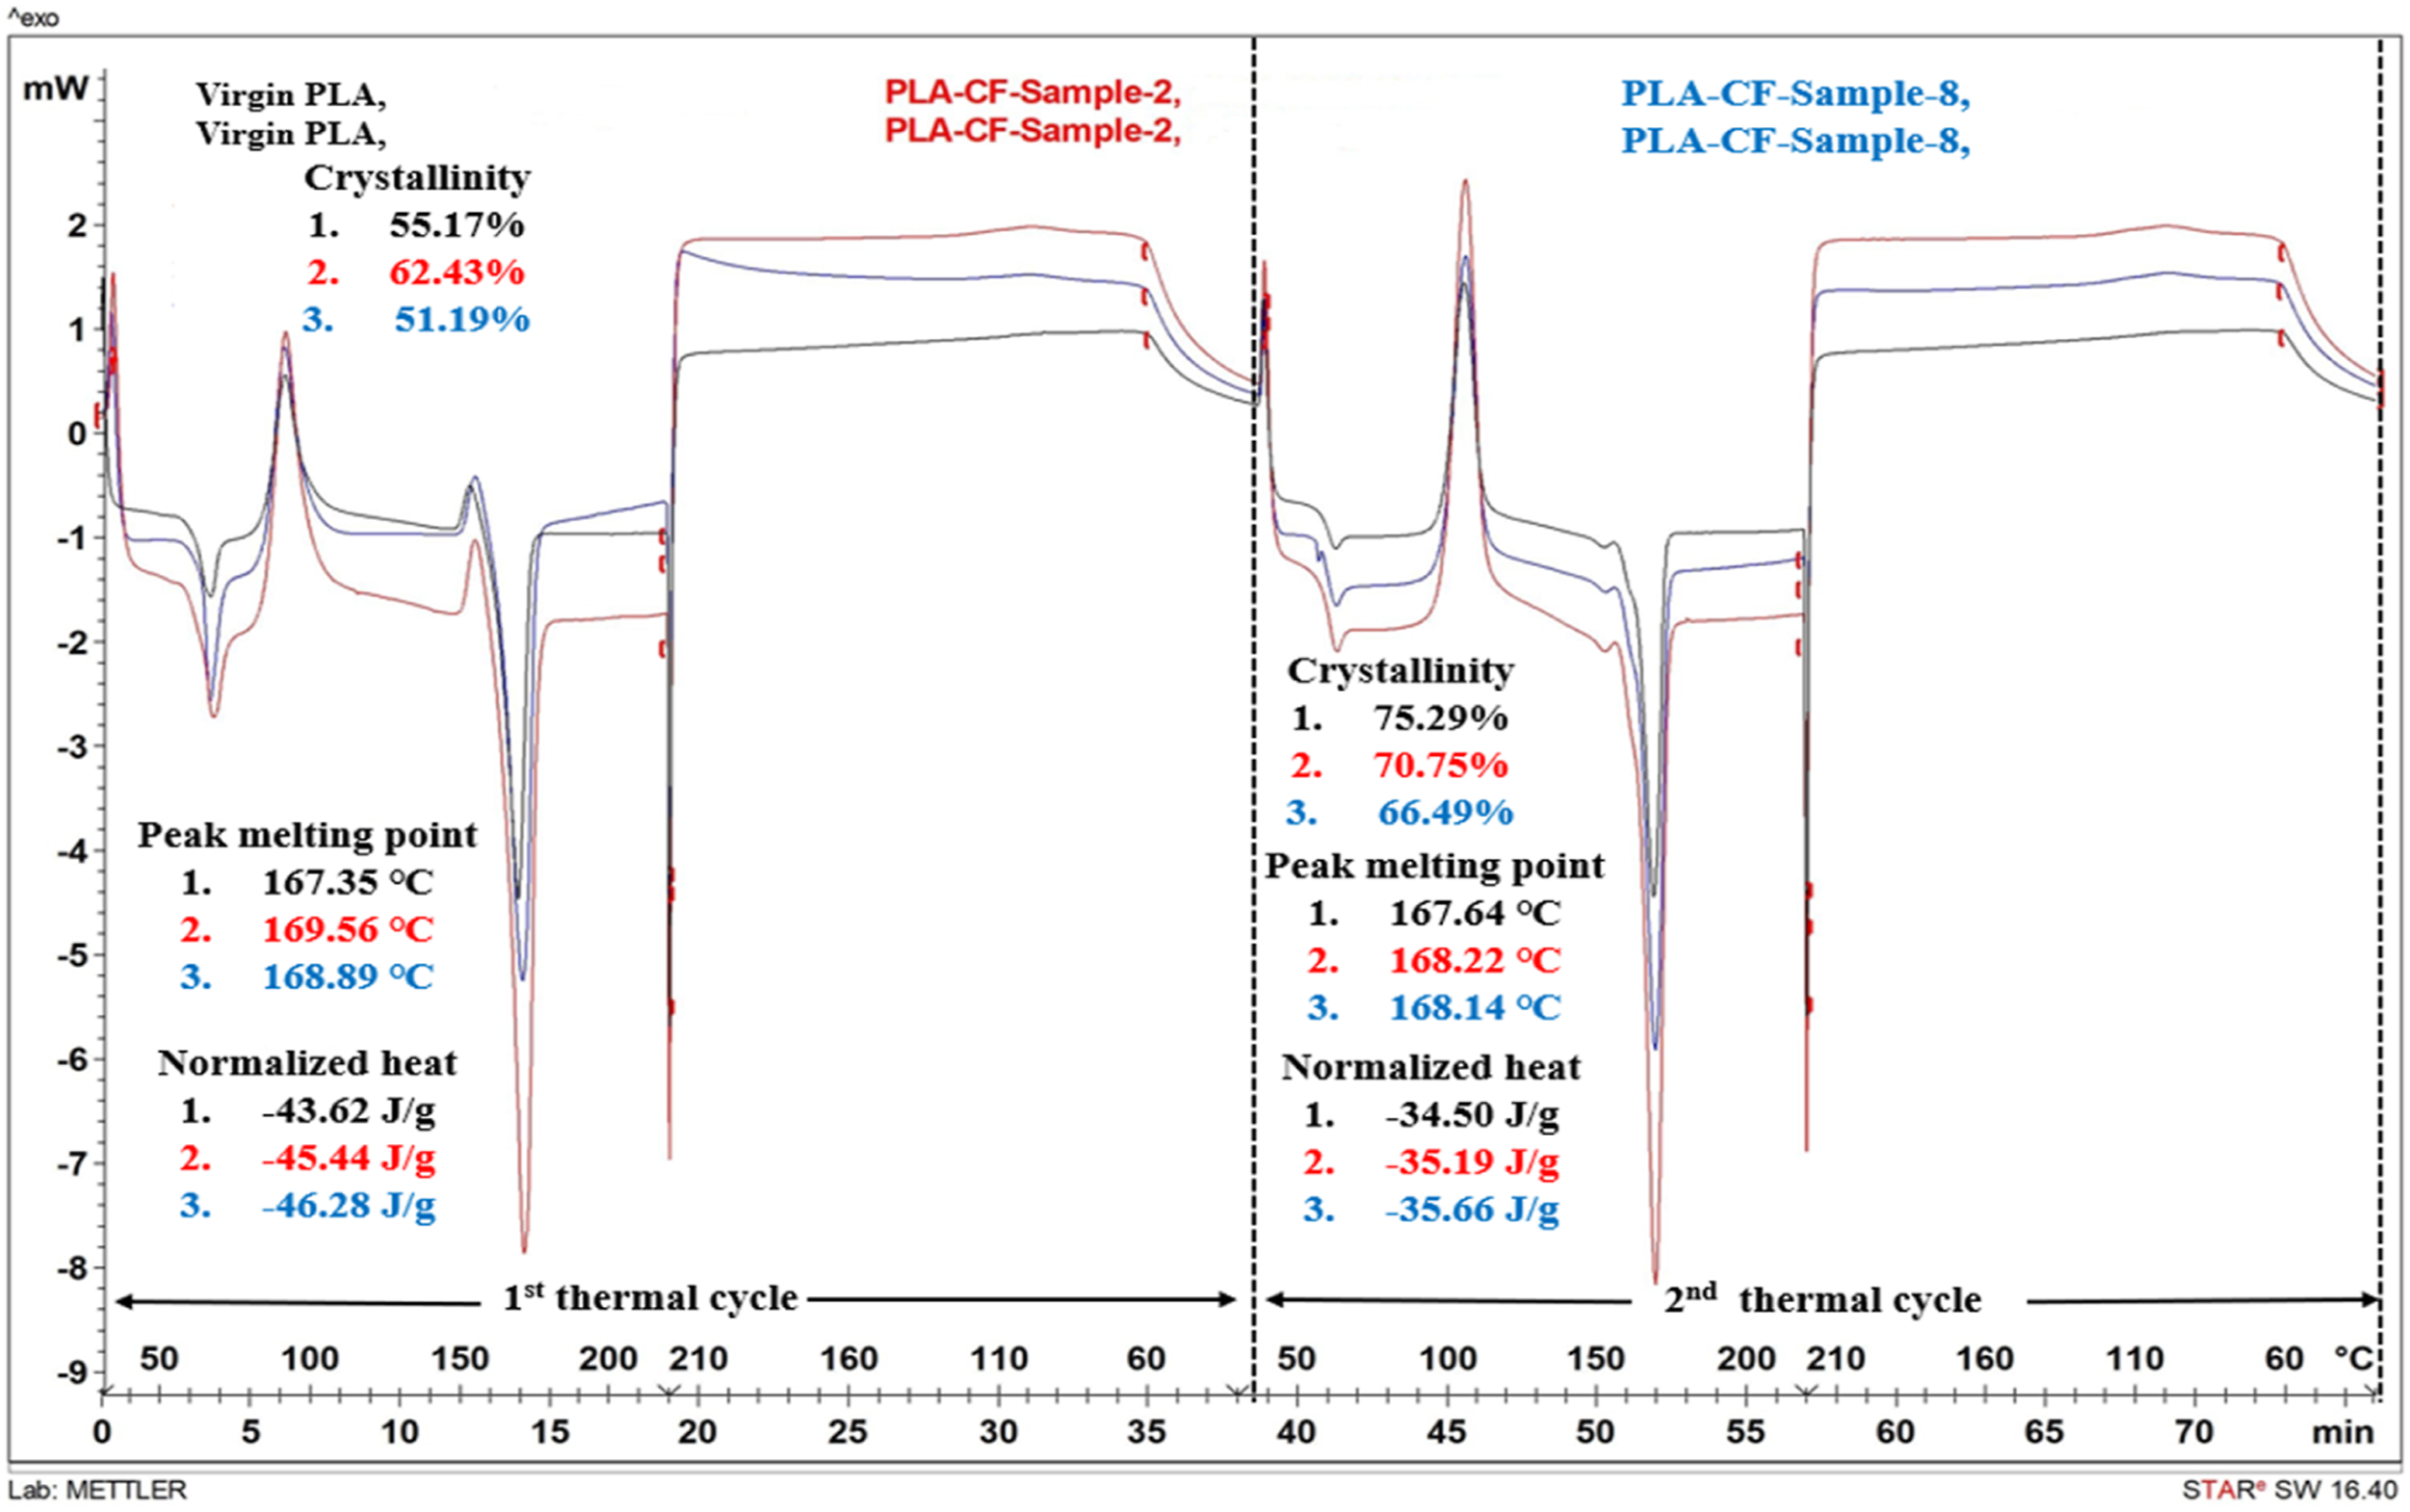
In the second thermal cycle, normalized heat capacity was observed for pure PLA-CF-PLA, sample 2 and sample 8 are −34.50 J/g, −35.19 J/g and −35.66 J/g, respectively means there is a slight decrease in the values of normal heat capacity may be due to increment in heat abstraction. The results have not significantly changed, which supports the produced composites’ thermal stability.
Implications, conclusions, future scope and limitations
Implications of the Study
The implications of this study are significant for the development and optimization of composite materials using FFF technology. The study demonstrates that it is possible to optimize the mechanical properties of the resulting composite structures by varying the deposition angle of carbon fibre, nozzle temperature, and bed temperature during manufacturing. The study’s findings have important implications for using PLA-CF-PLA composite structures in various applications, including aerospace, automotive, and biomedical engineering. Optimizing the manufacturing parameters makes creating composite structures with improved strength, stiffness, and toughness possible, enhancing performance and durability in various applications. Additionally, using XRD, FTIR, and DSC analysis provides valuable information on the chemical and physical properties of the composite structures, which can aid in developing new materials with improved performance characteristics. Overall, the implications of this study suggest that FFF technology can be used to create high-performance composite materials with tailored mechanical properties and that optimizing manufacturing parameters is critical for achieving the desired performance characteristics. The results of the CART regression analysis provide important guidance for optimizing the manufacturing parameters to produce PLA-CF-PLA composite structures with improved mechanical properties. By carefully selecting the CF, nozzle temperature, and bed temperature orientation, it is possible to create composite structures with enhanced strength and durability, critical for various aerospace, automotive, and biomedical engineering applications.
Conclusions
The study has revealed important insights into the factors that affect the mechanical properties of PLA-CF-PLA composite structures produced using FFF technology. The analysis identified three important predictors for both peak and break strength: orientation of the CF, nozzle temperature, and bed temperature. The CART analysis also revealed that the optimal manufacturing parameters for maximizing strength at peak are an orientation of 1.5< orientation of fibre ≤ 2.5, a nozzle temperature greater than 1.5, and for strength at break, an orientation of fibre greater than 2.5, and a nozzle temperature greater than 1.5. • The CART regression model performed well in predicting both peak and break strength for the PLA-CF-PLA composite structures. The R-squared values for both training and testing sets were high, indicating that the model explains a large portion of the variance in the data. • Additionally, RMSE values were relatively low, indicating that the model’s predictions were close to the actual values. The MAD and MAPE values were also low, indicating that the model’s predictions were accurate and had a low bias. These results suggest that the model fits the data well and could be used to predict strength at peak and strength at break for PLA-CF-PLA composite structures. • The process parameters such as the orientation of fibres, nozzle temperature, and bed temperature have greatly influenced the mechanical properties of the manufactured PLA-CF-PLA composite structures. The results obtained for strength at peak confirmed the contribution of 73.82% for orientation of fibres, 21.36% for nozzle temperature, and 4.38% for bed temperature. • From XRD analysis, sample 2 shows better tensile strength. As we know, with the increment in crystallinity of the material, Young’s modulus also gets increased and as the decrement in crystallinity occurs, the tensile strength increases. In comparison to tensile strength and Young’s modulus values in tensile properties, it was found that the results for sample 2 are suitable. • From morphological testing, it was found that sample 2 shows better adhesion between the PLA and CF. Also, the elongation of the CF is better in sample 2. From EDS, it was found that with the reinforcement of CF, the carbon% is also high in sample 2. So, the composites at these optimized parameter settings of sample 2 can be used where elongation properties are required. • From FTIR testing, it may be ascertained that composite sample 8 corresponds to lesser mechanical strength due to less sharpness in absorbance peaks. Sample 2 with sharp peaks indicated better bond strength in the functional groups due to which acceptable mechanical properties were obtained for proposed industrial applications of PLA-CF-PLA composites. • DSC analysis shows that the PLA-CF-PLA composite samples have no significant difference in the normalized heat capacity, peak melting point and crystallinity values, which shows that PLA-CF-PLA composites have better thermal stability.
Potential areas for future research
• The current study has focused on the FFF technique for manufacturing PLA-CF-PLA composite structures. It would be interesting to explore the potential of other additive manufacturing techniques for producing these composites, such as selective laser sintering or stereolithography. Future studies could investigate the effects of additional parameters, such as printing speed, layer thickness, and CF loading, on the properties of the composite structures. It would be interesting to investigate the scalability of these findings to larger production scales and the economic feasibility of producing these composites at scale.
Limitations of the study
• The study has considered only three factors and three levels for each factor, which may not be sufficient to cover the entire design space of FFF process parameters. Including more factors and levels could provide a more comprehensive understanding of the process-structure-property relationships. The study has a relatively small sample size of only 27 composite specimens. A larger sample size could increase the statistical power and reliability of the results. The CART model’s performance may be limited to the specific range of parameters used in the study. Additionally, the model’s accuracy and performance should be validated with additional data sets before it is used in practical applications.
Footnotes
Declaration of conflicting interests
The author(s) declared no potential conflicts of interest with respect to the research, authorship, and/or publication of this article.
Funding
The author(s) received no financial support for the research, authorship, and/or publication of this article.