
Abstract
Thermoplastic-based composites are becoming the preferred material for structural and non-structural components in the composite production industries. One of the most critical elements determining the characteristics and performance of fiber-reinforced composites is the fiber content. The fiber volume fraction (Vf) of carbon/polyamide410 (C-PA410) composite is evaluated using standard acid digestion, the unique two-stage thermogravimetry (TGA) method and 2D image processing method, with Vf values of 24.0%, 23.1%, and 18.3%, respectively. For statistical purposes, a substantial number of samples from each composite batch were tested and analyzed. The two-stage TGA approach used in this study, involves measuring the constituent content of carbon fiber thermoplastic composites in nitrogen first and subsequently in air. The standard acid digestion and the two-stage TGA method used in this study provided comparable results. The 2D image processing method, on the other hand, yields a lower volume fraction of fiber. The two-stage TGA approach has been proven to be more convenient in terms of accuracy, safety, and speed. This technique has been validated by testing a control specimen of a material (Toray Cetex® TC910 PA6) with a known weight fraction.
Keywords
Introduction
Carbon fiber reinforced polymers (CFRP) are the most advanced materials used to make structural and non-structural parts in the composite industry today. In 2012, the global demand for carbon fiber-reinforced polymers was 141,000 metric tons, which is expected to reach 200,000 metric tons by 2023. 1 Even while thermoset-resin composites have been used in industry for decades, thermoplastic polymer composites are becoming the preferred material due to their superior toughness, chemical resistance, performance at elevated temperatures, weldability, and recyclability. 2
The fiber content is among the most important factors influencing the properties of fiber-reinforced composites. Fiber volume fraction and orientation influence stiffness, strength, and heat conductivity, among other properties. As a result, developing a cost-effective, fast, automatable, and precise method for measuring the fiber content of composite materials is a major concern. Even though there are pros and cons to each method, standard methods published by ASTM D3171—Standard Test Methods for Constituent Content of Composite Materials (ASTM Standard D3171-15, 2015), an image processing method that uses 2D microscopic cross-section images, or the TGA approach, have all been used in literature for determining the fiber content of carbon fiber reinforced thermoplastic composites.
Numerous studies have devised TGA-based methods for estimating the constituent composition of thermoset composite materials.3–7 Only a few researchers have studied thermoplastic composite materials2,6,8 used thermo-gravimetric analysis in an air atmosphere to quantify the fiber volume fractions of two distinct PAN-based carbon fiber reinforced composites, which were then validated using microscopic images. Results obtained with CFRP by2,4 using the TGA-based method also confirmed those obtained by the acid digestion method. Several macro TGA measurements of raw materials (fibers and matrix) and their composites were performed by3,8 to assess their degradation in two different purge gases (air and nitrogen).
A two-stage thermogravimetric testing procedure in which specimens are first subjected to decomposition under nitrogen, then after cooling, reheated with a mass-rate-controlled heating program to eliminate remaining char under technical air is used by. 9 Due to the oxidation and thermal degradation of carbon fibers, TGA application for CFRP is more challenging.3,10,11
A reasonable agreement is observed between the actual carbon fiber content and the carbon fiber content measured using the carbonization in nitrogen (CIN) method after the carbon fiber thermoplastic and a thermosetting composite specimen are carbonized in a nitrogen atmosphere along with a neat resin specimen that is used for adjusting the resin carbonization percentage.12,13
Another study 14 used digital image processing (DIP) scanning electron microscopy (SEM) images to perform micrograph analysis, which was then used to calculate fiber volume fractions, and comparable volume fraction values were obtained with the burn-off resin technique.
Even though several researchers employed various techniques to evaluate the constituent content of carbon fiber-reinforced thermoplastic composites, a comprehensive examination of each technique is lacking in the literature. Furthermore, the two-stage TGA approach described above demands a particular kind of TGA machine (a modulated TGA machine) and requires a longer testing period. Therefore, a unique two-stage TGA procedure is used in this work to avoid the stages of cooling and reheating. In addition, this procedure can be implemented in ordinary TGA machines without modulated heating and cooling requirements. The process is also validated using SEM images taken before and after the char-burning stage. To give thorough information on the relative merits of each method, all other constituent content determination techniques have also been evaluated.
Material and experimental methods
The fiber content of the C-PA410 composite is determined using three methods in this research: conventional acid digestion, 2D image processing, and the TGA technique. In each method, a minimum of four tests was analyzed for statistical purposes. The goal of this research is to undertake a thorough examination of fiber content determination methods for C-PA composites and to utilize a unique TGA procedure for a more convenient method of assessing constituent content in carbon fiber-reinforced thermoplastic composites.
Standard acid digestion method
Materials and equipment
Five specimens of C/PA410 unidirectional composite tape from Sioen Industries were used for the experiments. For acid digestion, a Harry Gestigkeit SD 9–230 Electrical Sandbath for controlled heating, a laboratory desiccator with KNF Laboport N 820.3 FT.18 vacuum pump to filter the fibers using sintered glass filter crucibles with a pore size of 1–1.6 µm were used. Digestion Reagents were used according to ASTM3171: Hydrogen Peroxide, H2O2 35% aqueous and Sulfuric Acid, H2SO4 98% aqueous
Procedure description
Volumetric representative C-PA composite specimens placed in five separate 100 mL flasks with 25 mL of sulfuric acid were electrically heated in a sand bath. Then, a 40 mL aqueous solution of hydrogen peroxide is added and cooled in water. The fibers are then filtered through sintered glass crucibles under vacuum, washed, and dried for an hour at 100°C.
2D image processing method
Specimen preparation
Ten specimens of 10 mm width cut from the tape’s edge and middle embedded in epoxy and polished are used for imaging under a light microscope (Figure 1). Embedded specimens of C-PA410 composite and Leica DM ILM inverted Microscope.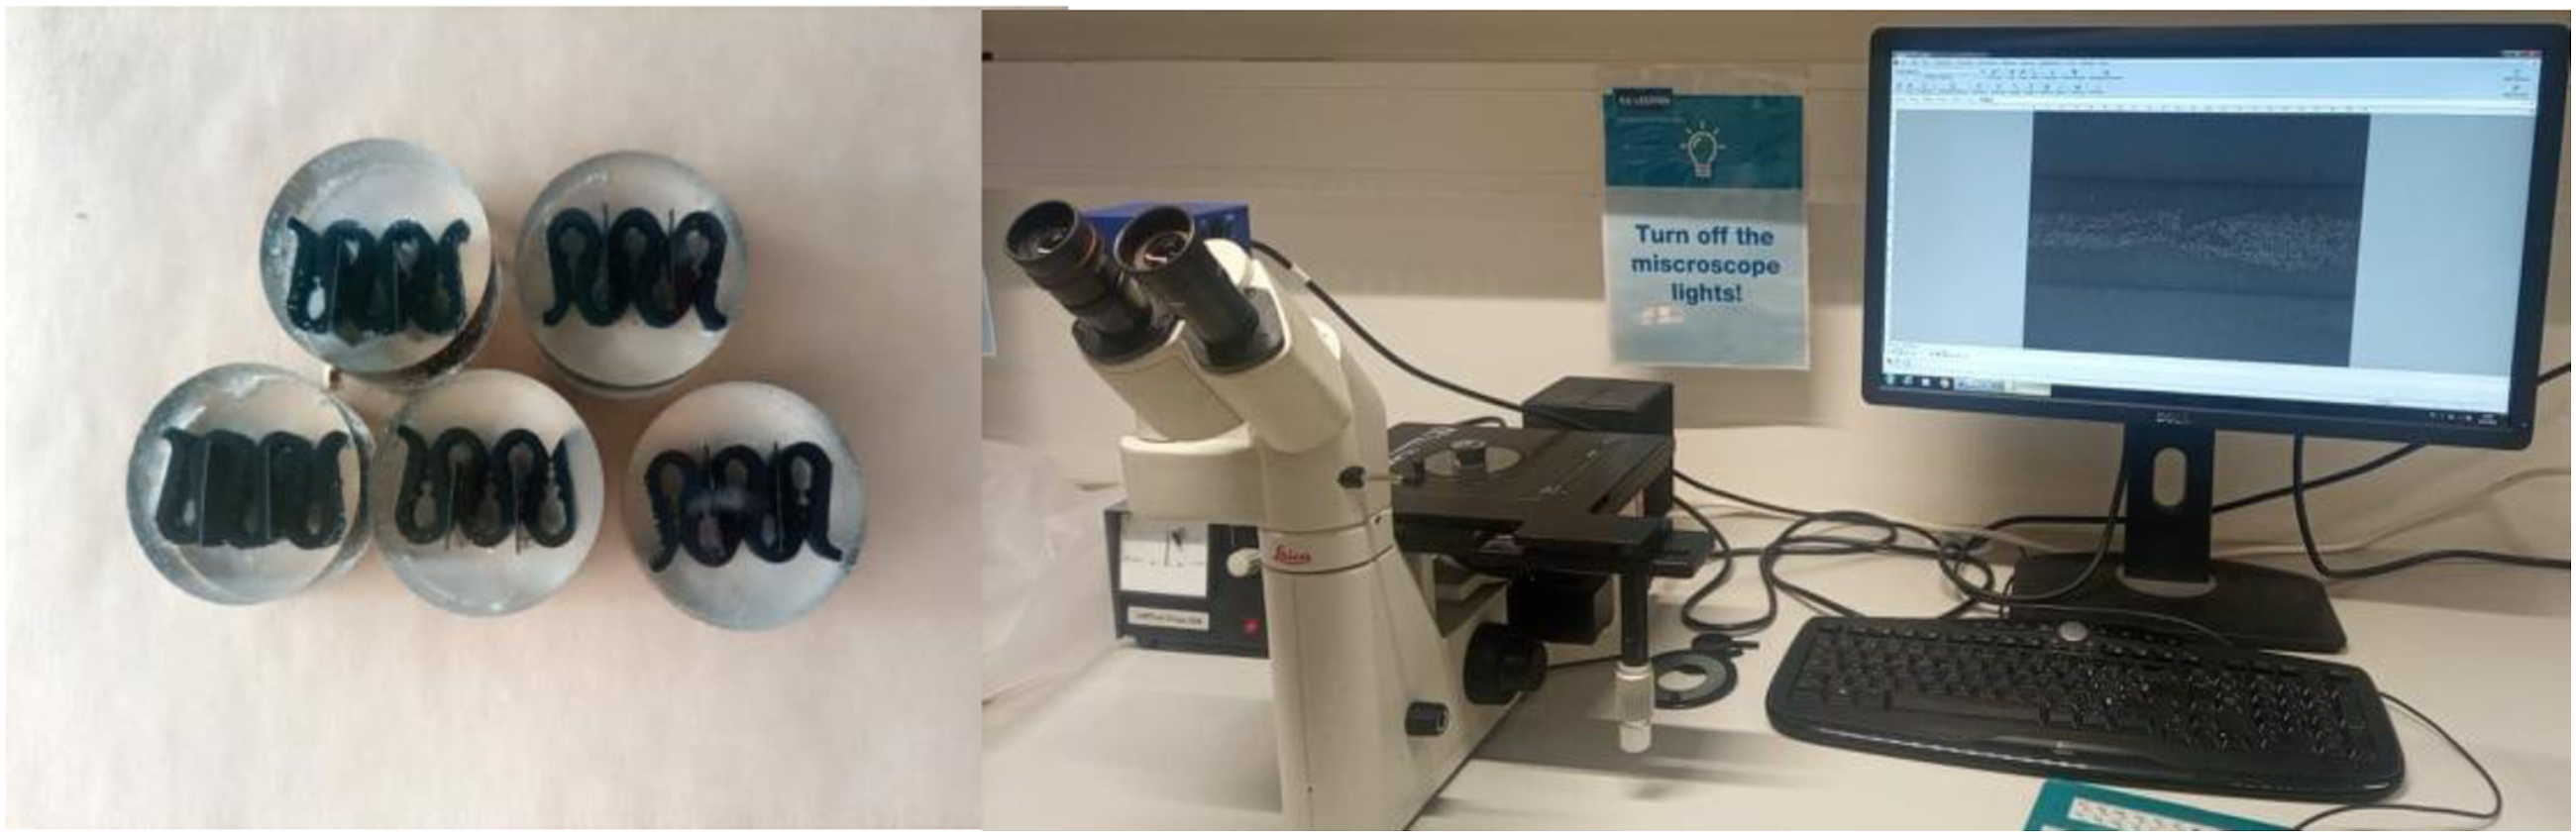
Method and equipment
The raw image has 2560*1920 pixels in the row and column lines, and the magnification was 100, 500, and 1000 times. In the width direction of each specimen, 8–10 pictures were taken and analyzed.
The analysis using ImageJ software entails utilizing the threshold function to calculate the area percentage of fiber and matrix in each image. The fibers appear white in the black and white spectrum in the range of 0–65,536 numbers, whereas the matrix appears grey (Figure 2). The threshold function was then used to determine the corresponding percentages of fiber and matrix using the auto-threshold function, and a slight manual modification on the thresholding limit is made to select the entire fiber area. Finally, the area percentages were summarized using the analyze particle function. Microscopic image of C-PA tape specimen fiber layer (*500 magnification) and binarized image.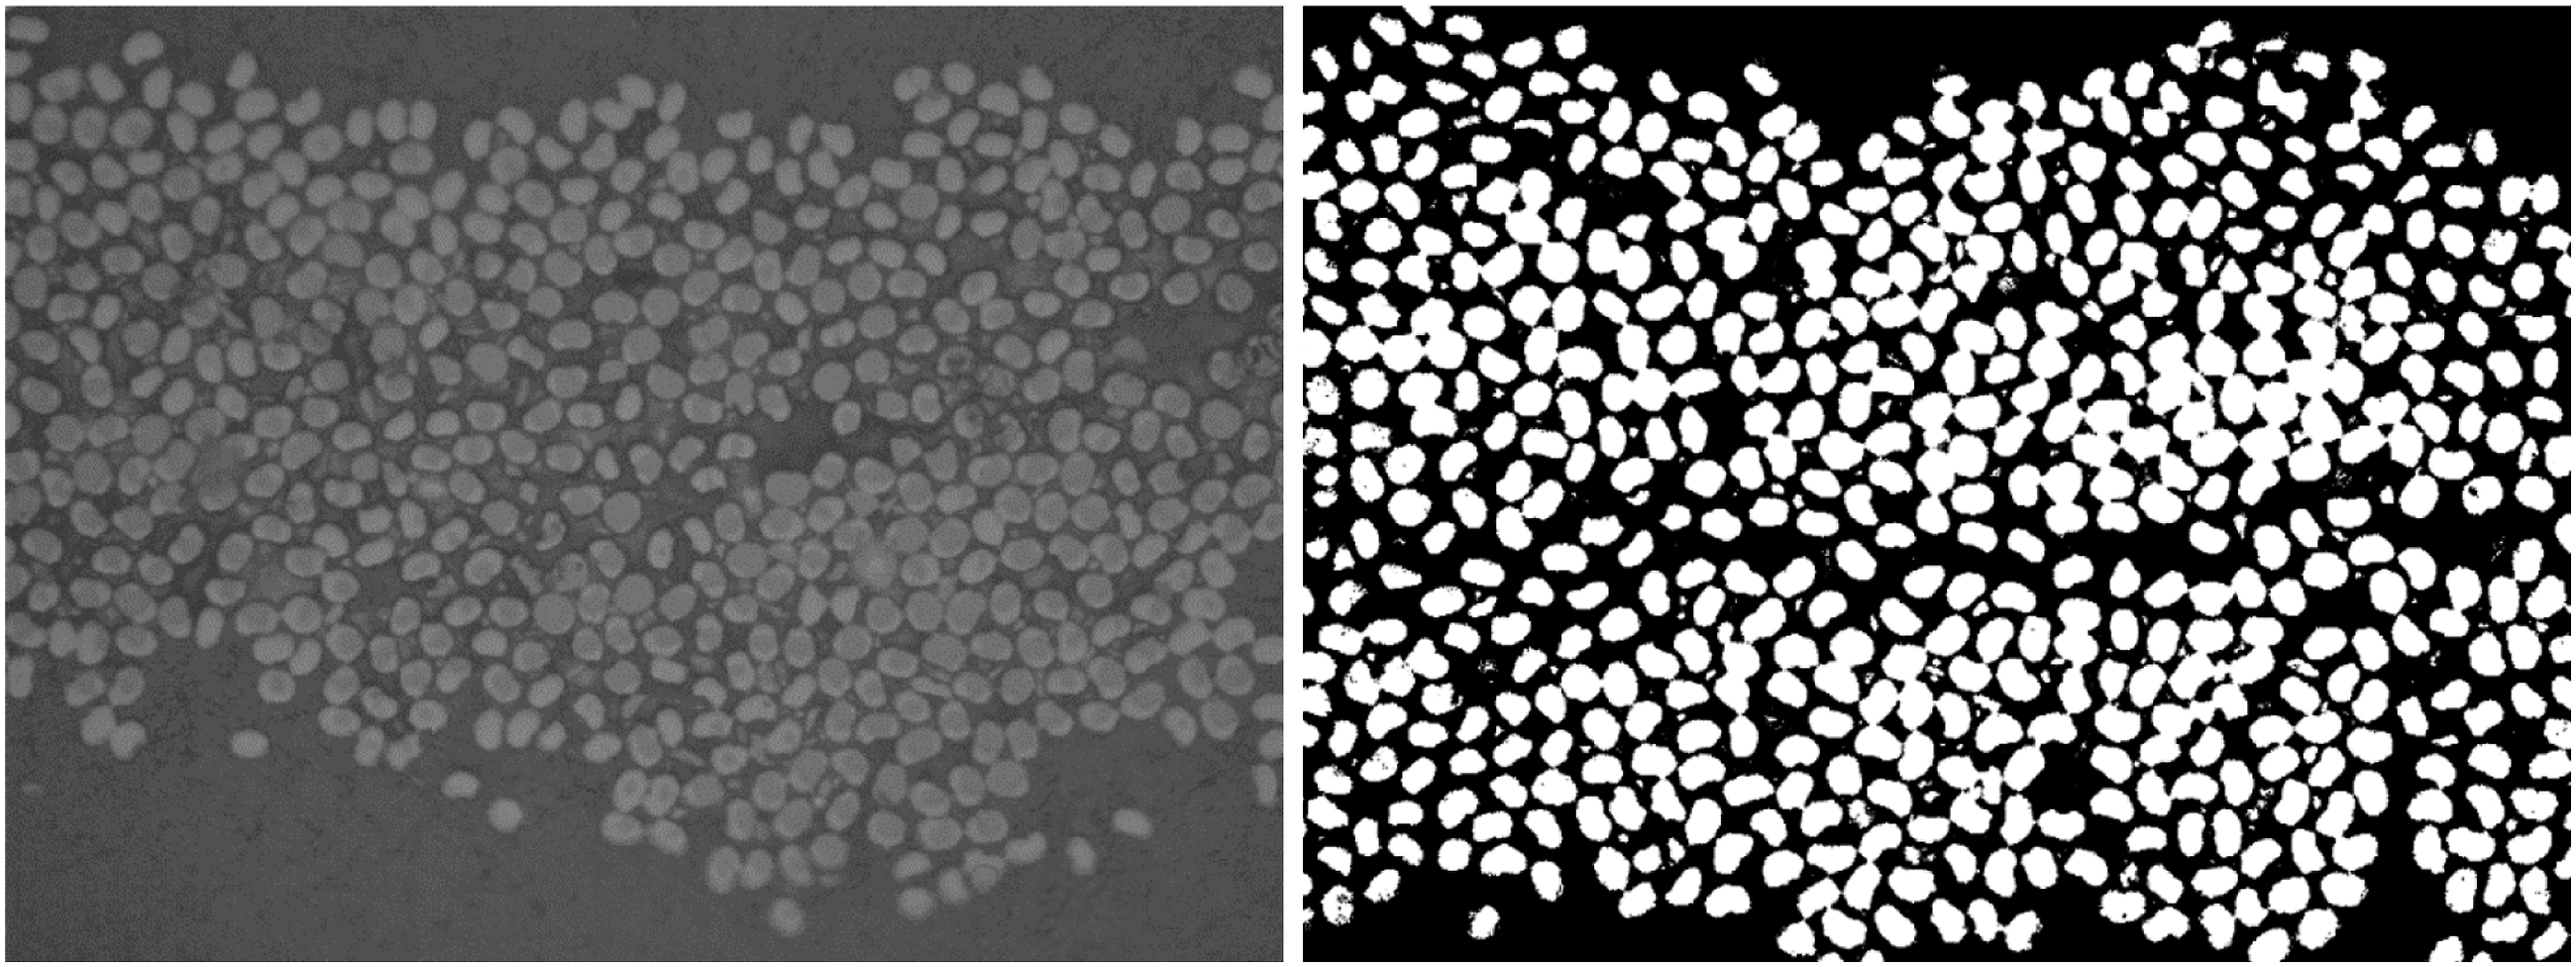
The thermogravimetric analysis (TGA) method
Materials and equipment’s
Thermomechanical measurements using a thermogravimetric analyzer (TGA) were carried out with C/PA410 specimens of mass 16–19 mg. The composite specimens were taken from different areas of the tape. Measurements were performed at various temperatures and atmospheres. Air and nitrogen were utilized as purge gas and the gas flow rate was 100 mL/min for all the experiments. A scanning electron microscope (SEM) (XL30 by Philips) was used to analyze the specimens.
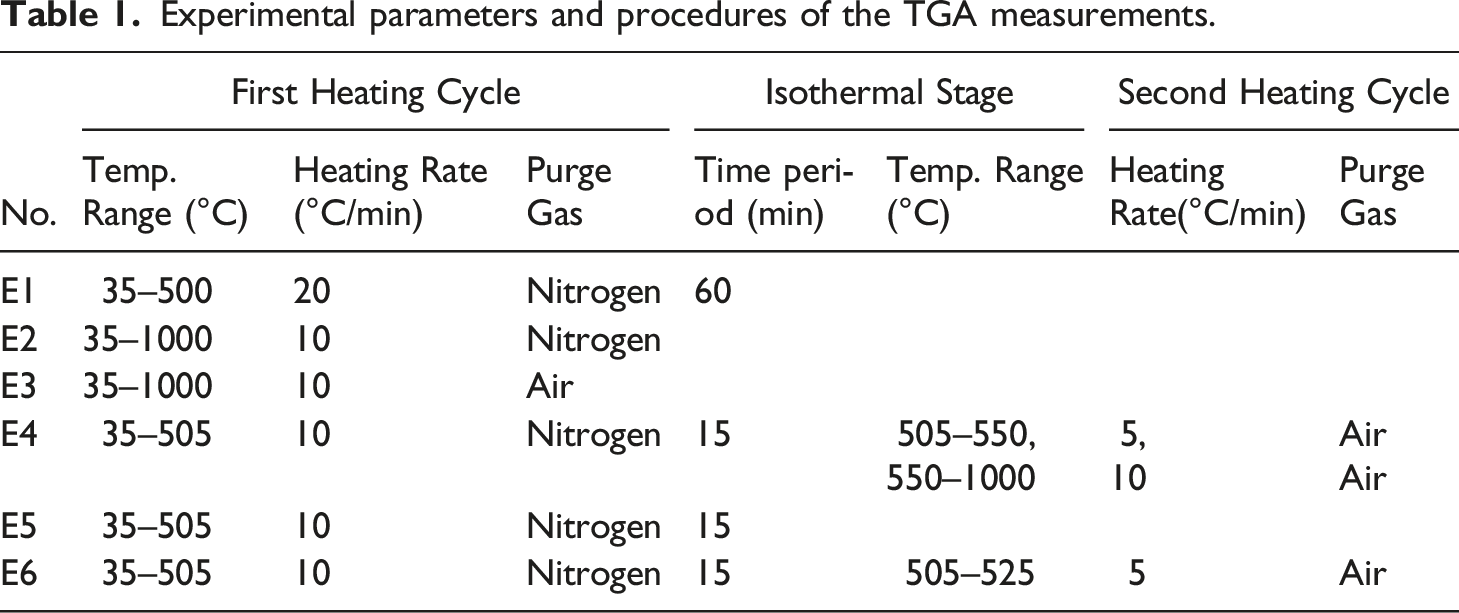
Procedure description
Experimental parameters and procedures of the TGA measurements.
Result and discussion
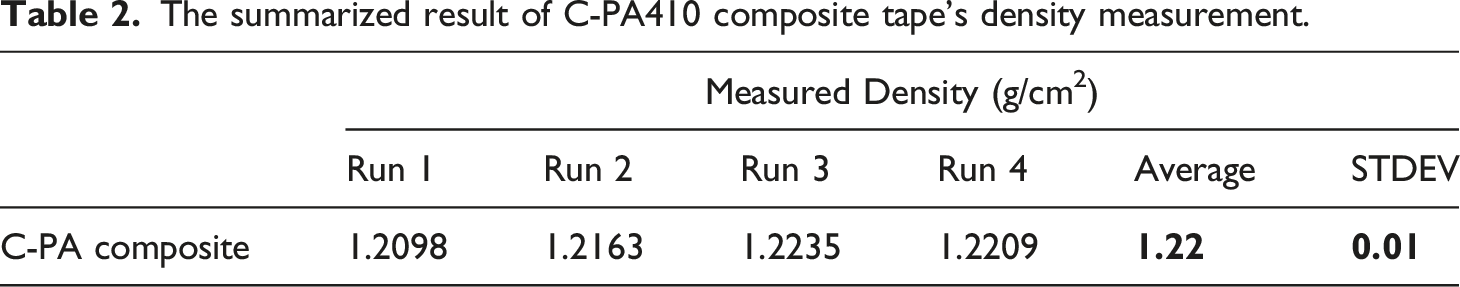
Density measurement
The summarized result of C-PA410 composite tape’s density measurement.
Standard acid digestion method
Summarized results of weight and volume percentage of the reinforcement (fiber) content of C-PA composite specimens.
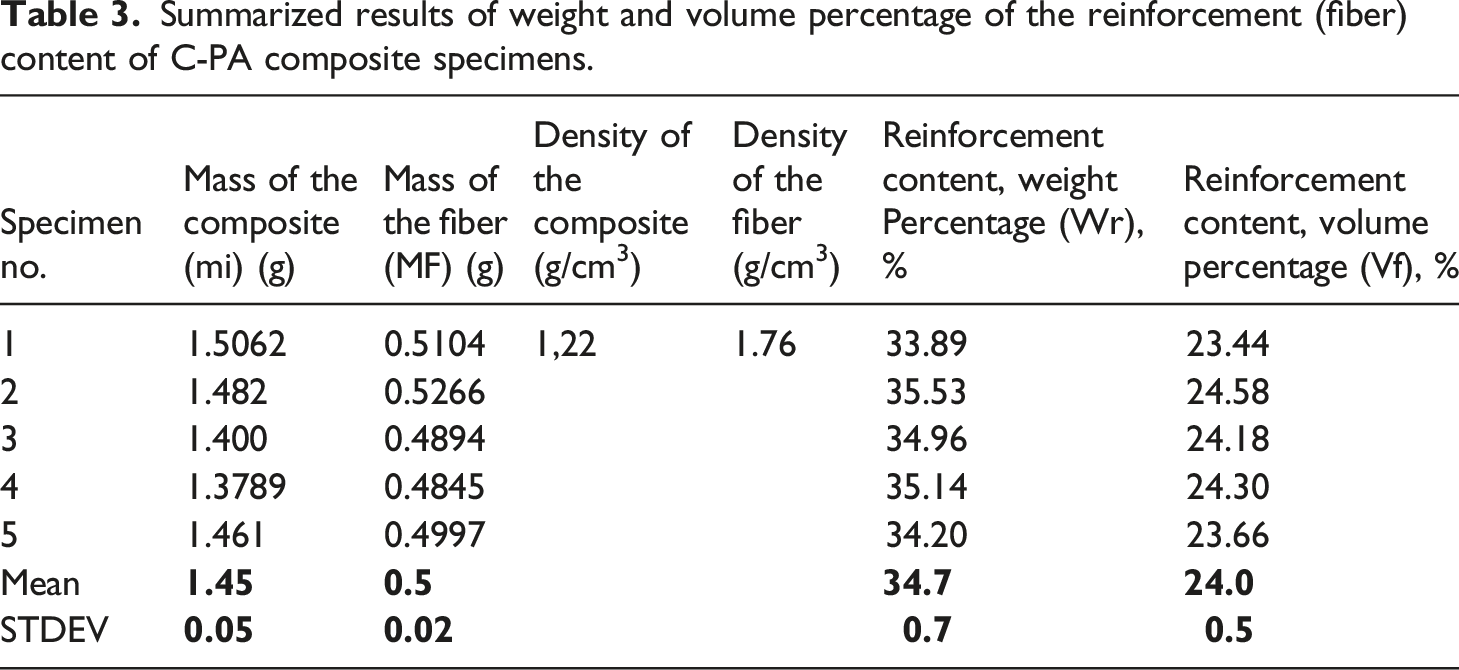
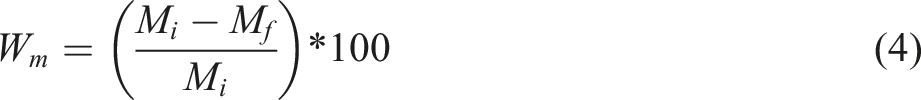
Reinforcement content, weight percent
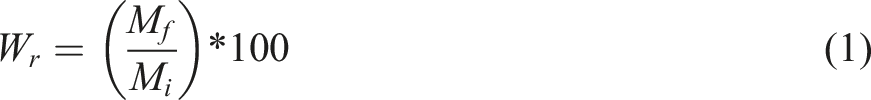

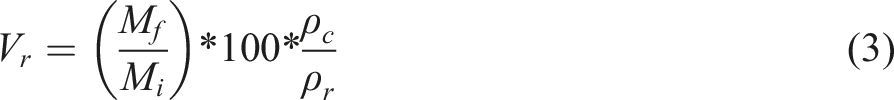
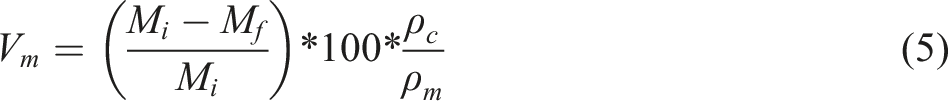
Reinforcement content, volume percentage
The SEM images of fiber residues (Figure 3) after the acid digestion, filtration, washing, and drying processes show that the fibers are unaffected by the chemicals used in the process and that the diameter of the fibers is uniform with a clean surface. Using the known values of mass and density of the composite specimen and residue fiber, a further calculation for weight and volume percent of the matrix and void volume is conducted. Table 4 displays the overview of the results. SEM images (X1000) of fiber residues after the digestion, filtration and oven drying process. Summarized results of weight and volume percentage of the matrix and void content of C-PA composite specimens.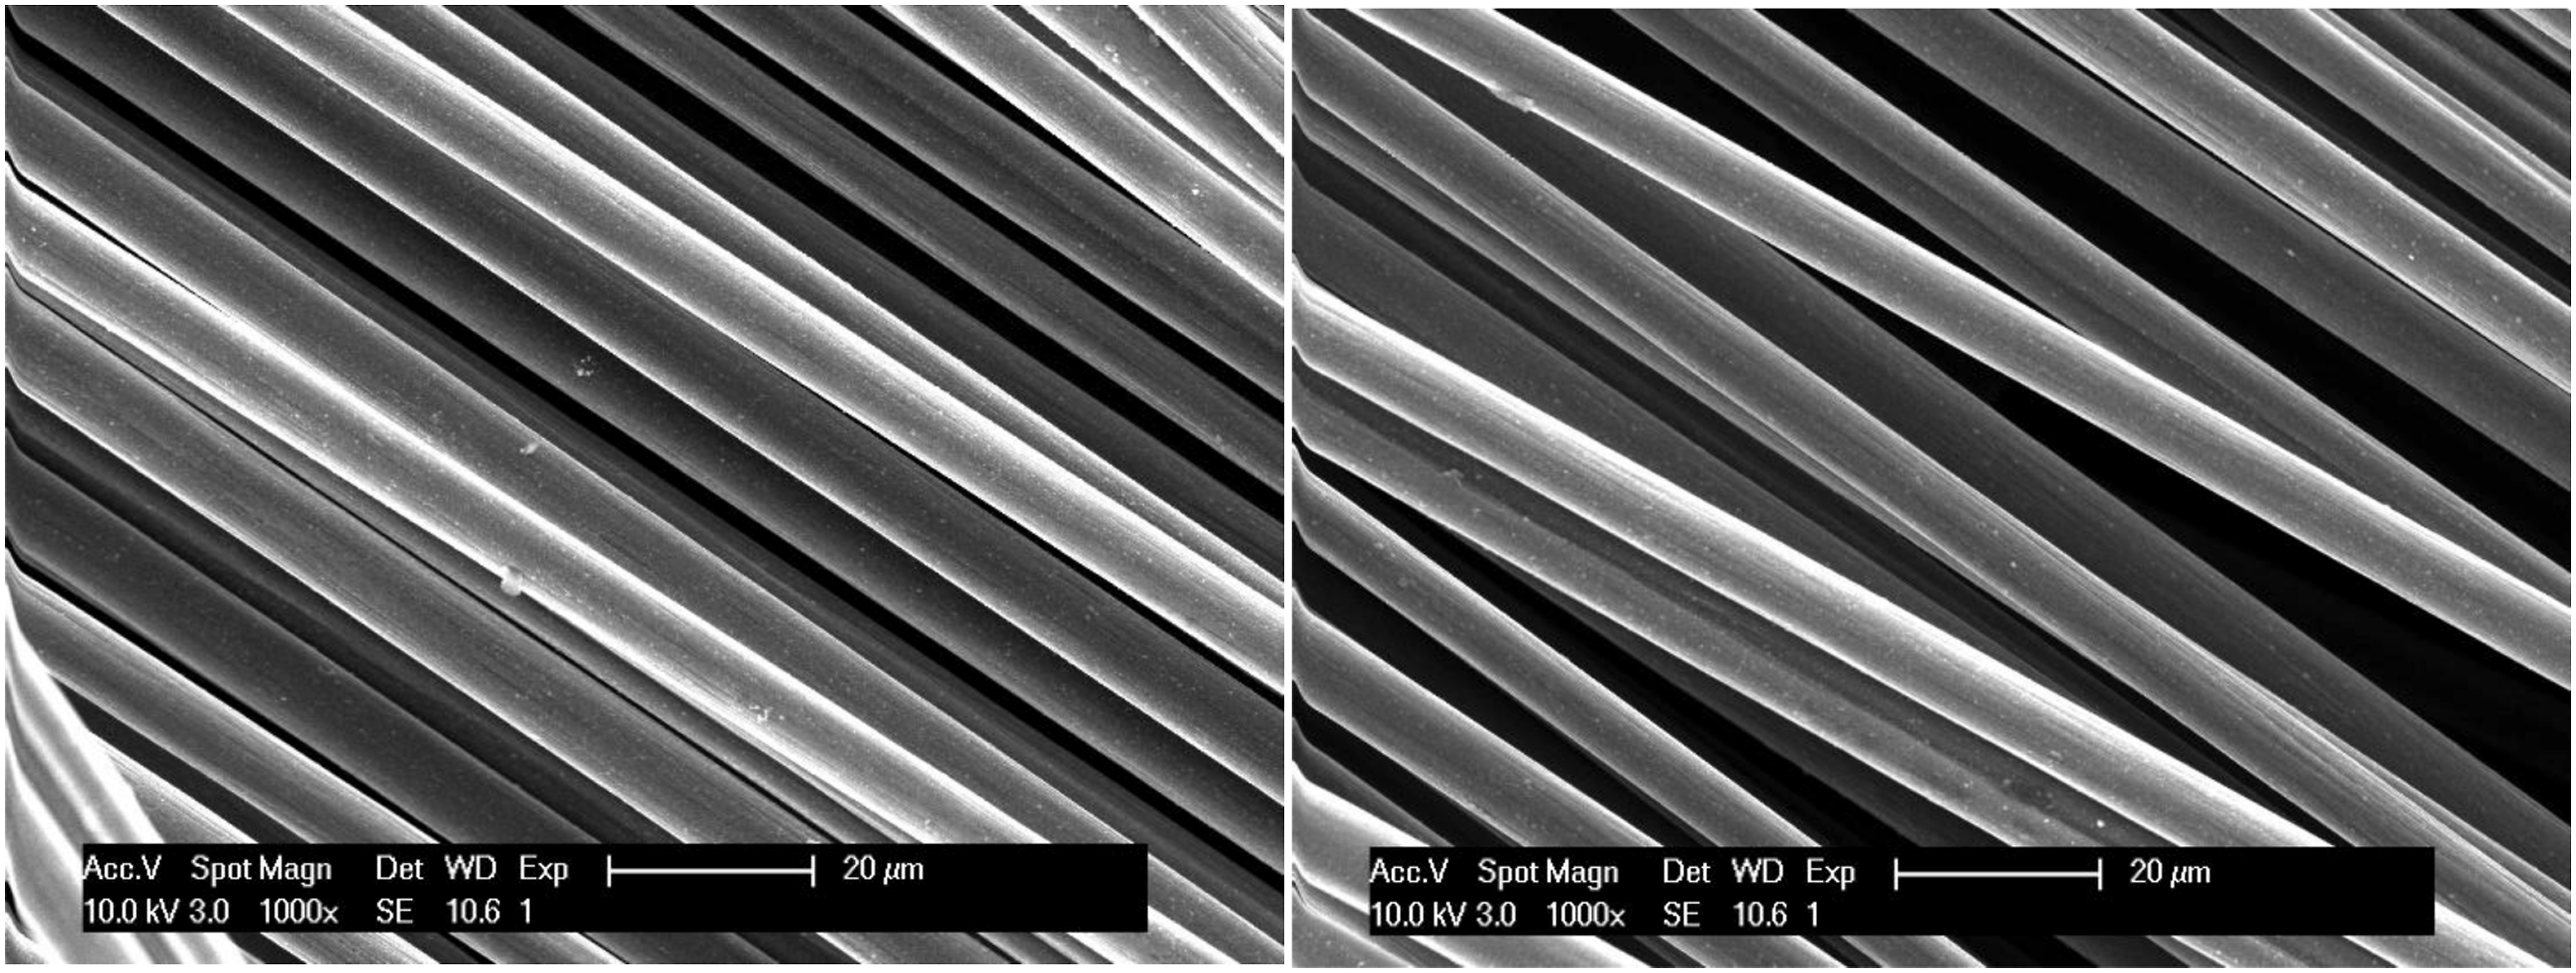
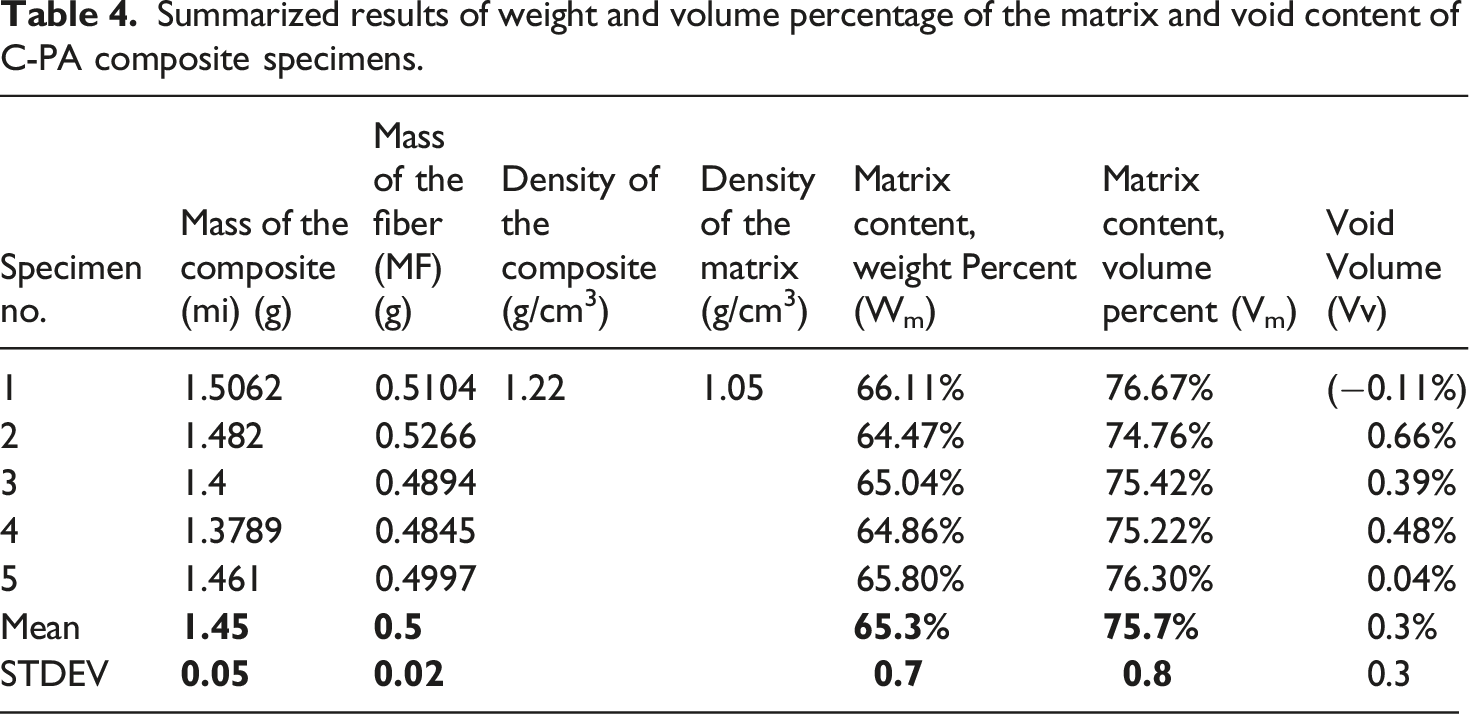
Matrix content, weight percent
Matrix content, volume percent
Void volume

2D Image processing method
Percentage area of fiber and matrix of C-PA410 composite specimens using 2D image processing method.
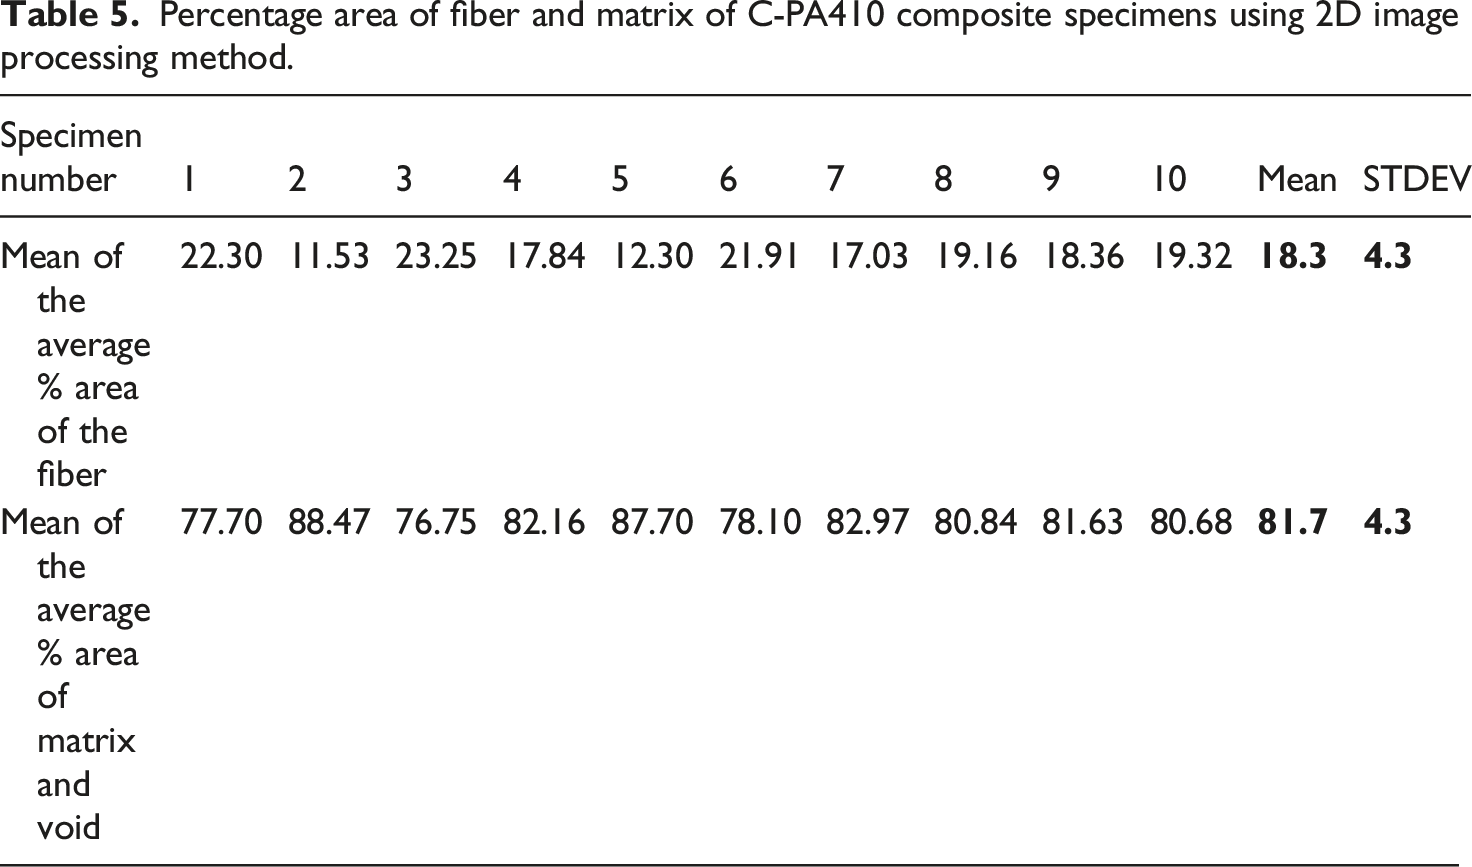
In comparing the 2D image analysis approach to the conventional acid digestion method in this investigation, the volume percent of fiber is much less with the 2D image analysis technique. This is because the method relies on the two-dimensional cross-sections of the composite tape, which makes it challenging to obtain volumetric information and necessitates perfect unidirectional fiber orientations in a composite tape. Additionally, the segmentation of area fractions of fibers using the threshold function is affected by human skill in specimen preparation (grinding and polishing), which impacts the image quality. The image analysis technique, in contrast to other techniques, can offer additional microstructural details such as fiber size, shape, distribution, flaws, and the presence of voids.
The thermogravimetric analysis (TGA) method
Fiber weight content can be determined from TGA (thermogravimetric analysis) curves by analyzing the weight loss of a composite material containing fibers and a matrix material as it is heated. Since most fiber and matrix materials decompose in a different temperature range, we can identify the percentage of each constituent, but the major challenge is the overlap of the decomposition of char with the decomposition of fibers. Figure 4 shows how the composite material decomposes progressively as it is heated according to the four procedures described in Table 1. Weight loss percentage of C/PA410 specimens with increment in temperature (Procedure E1-E4).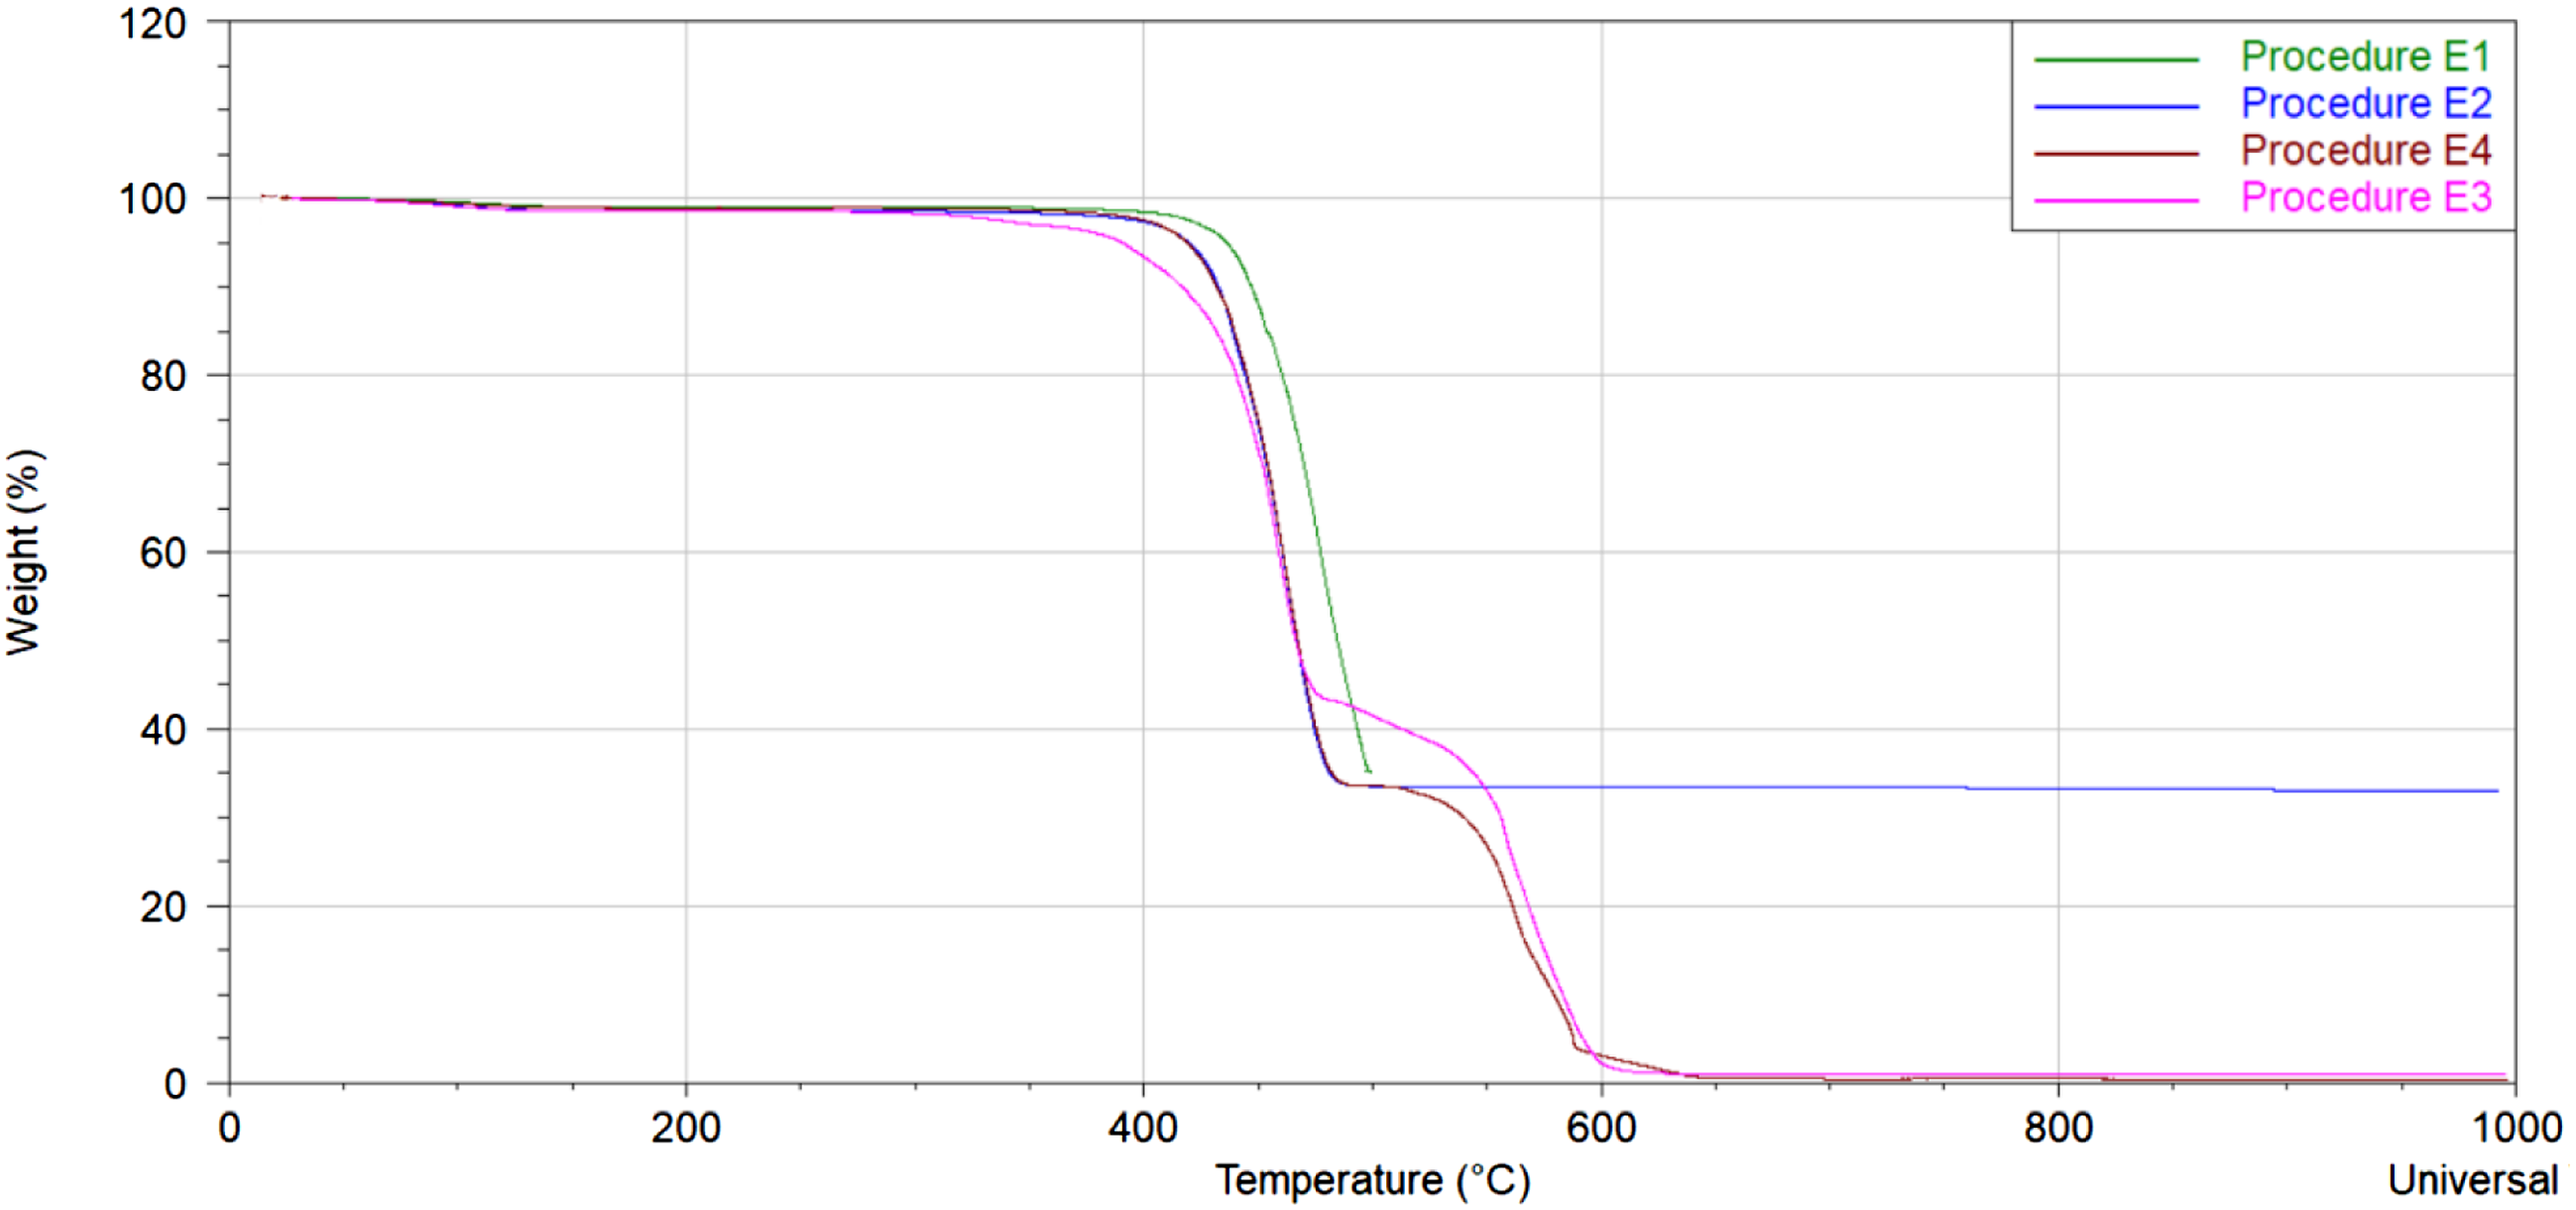
Procedure E1
Weight loss % of dirt and moisture, and polymer in procedure E1 and E2.
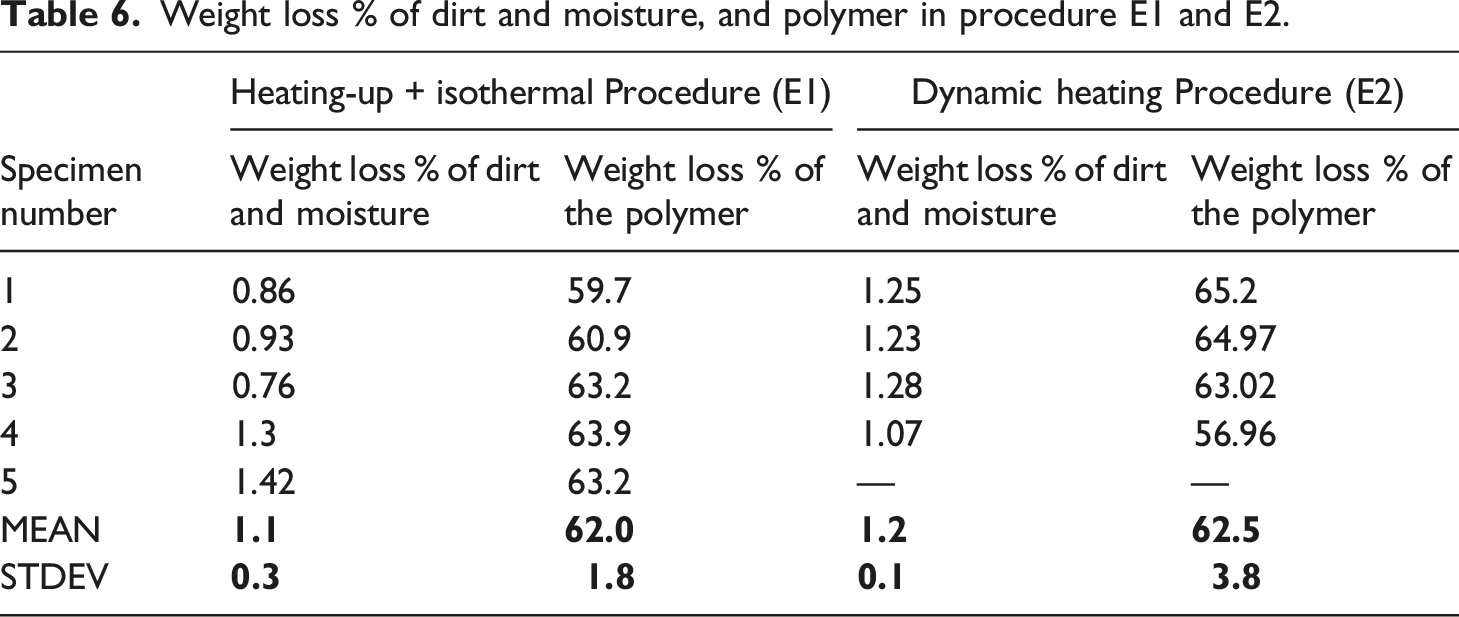
In this TGA technique, a carbon or carbonaceous char residue that cannot be further broken down into smaller volatile particles in a nitrogen atmosphere is left over as a consequence of the aromatic rings present in polyamide. Due to this, it is difficult to quantify the amount of remaining fibers, and the mass percentage of retained char must be determined.
Procedure E2
In this dynamic heating method, the specimen is heated at a constant rate from 35°C to 1000°C in a nitrogen atmosphere. Similar to procedure E1, the removal of dirt and moisture (1.07%–1.28%) happened in all specimens at the beginning of the temperature ramp, followed by a mass decomposition of polymer (56.96%–65.2%), which subsequently tends to stabilize after the temperature reaches 500°C.
Very minimal mass loss has been noticed in the 500°C–1000°C temperature range. Three specimens' mass degradation converged in a weight loss range of 63–65%. The results for the other two specimens showed outlier mass loss percentages. According to this investigation, the composite decomposed in a nitrogen atmosphere with almost negligible fiber mass loss, and the char produced by the PA’s decomposition did not degrade further.
Procedure E3
In this procedure, the specimen is heated constantly in an air atmosphere from 35°C to 1000°C and reveals two key stages of degradation, as shown in Figure 5. The first stage (33–490°C) was similar to the initial observation made under nitrogen. The degradation of the polymer matrix and the char that had already formed overlapped in the 490–525°C range. Because these two processes overlap in this temperature range, determining fiber volume fraction accurately becomes problematic. Weight loss (green) and weight loss rate (blue) vs time plot of C-PA410 specimens from 33-1000°C in air atmosphere.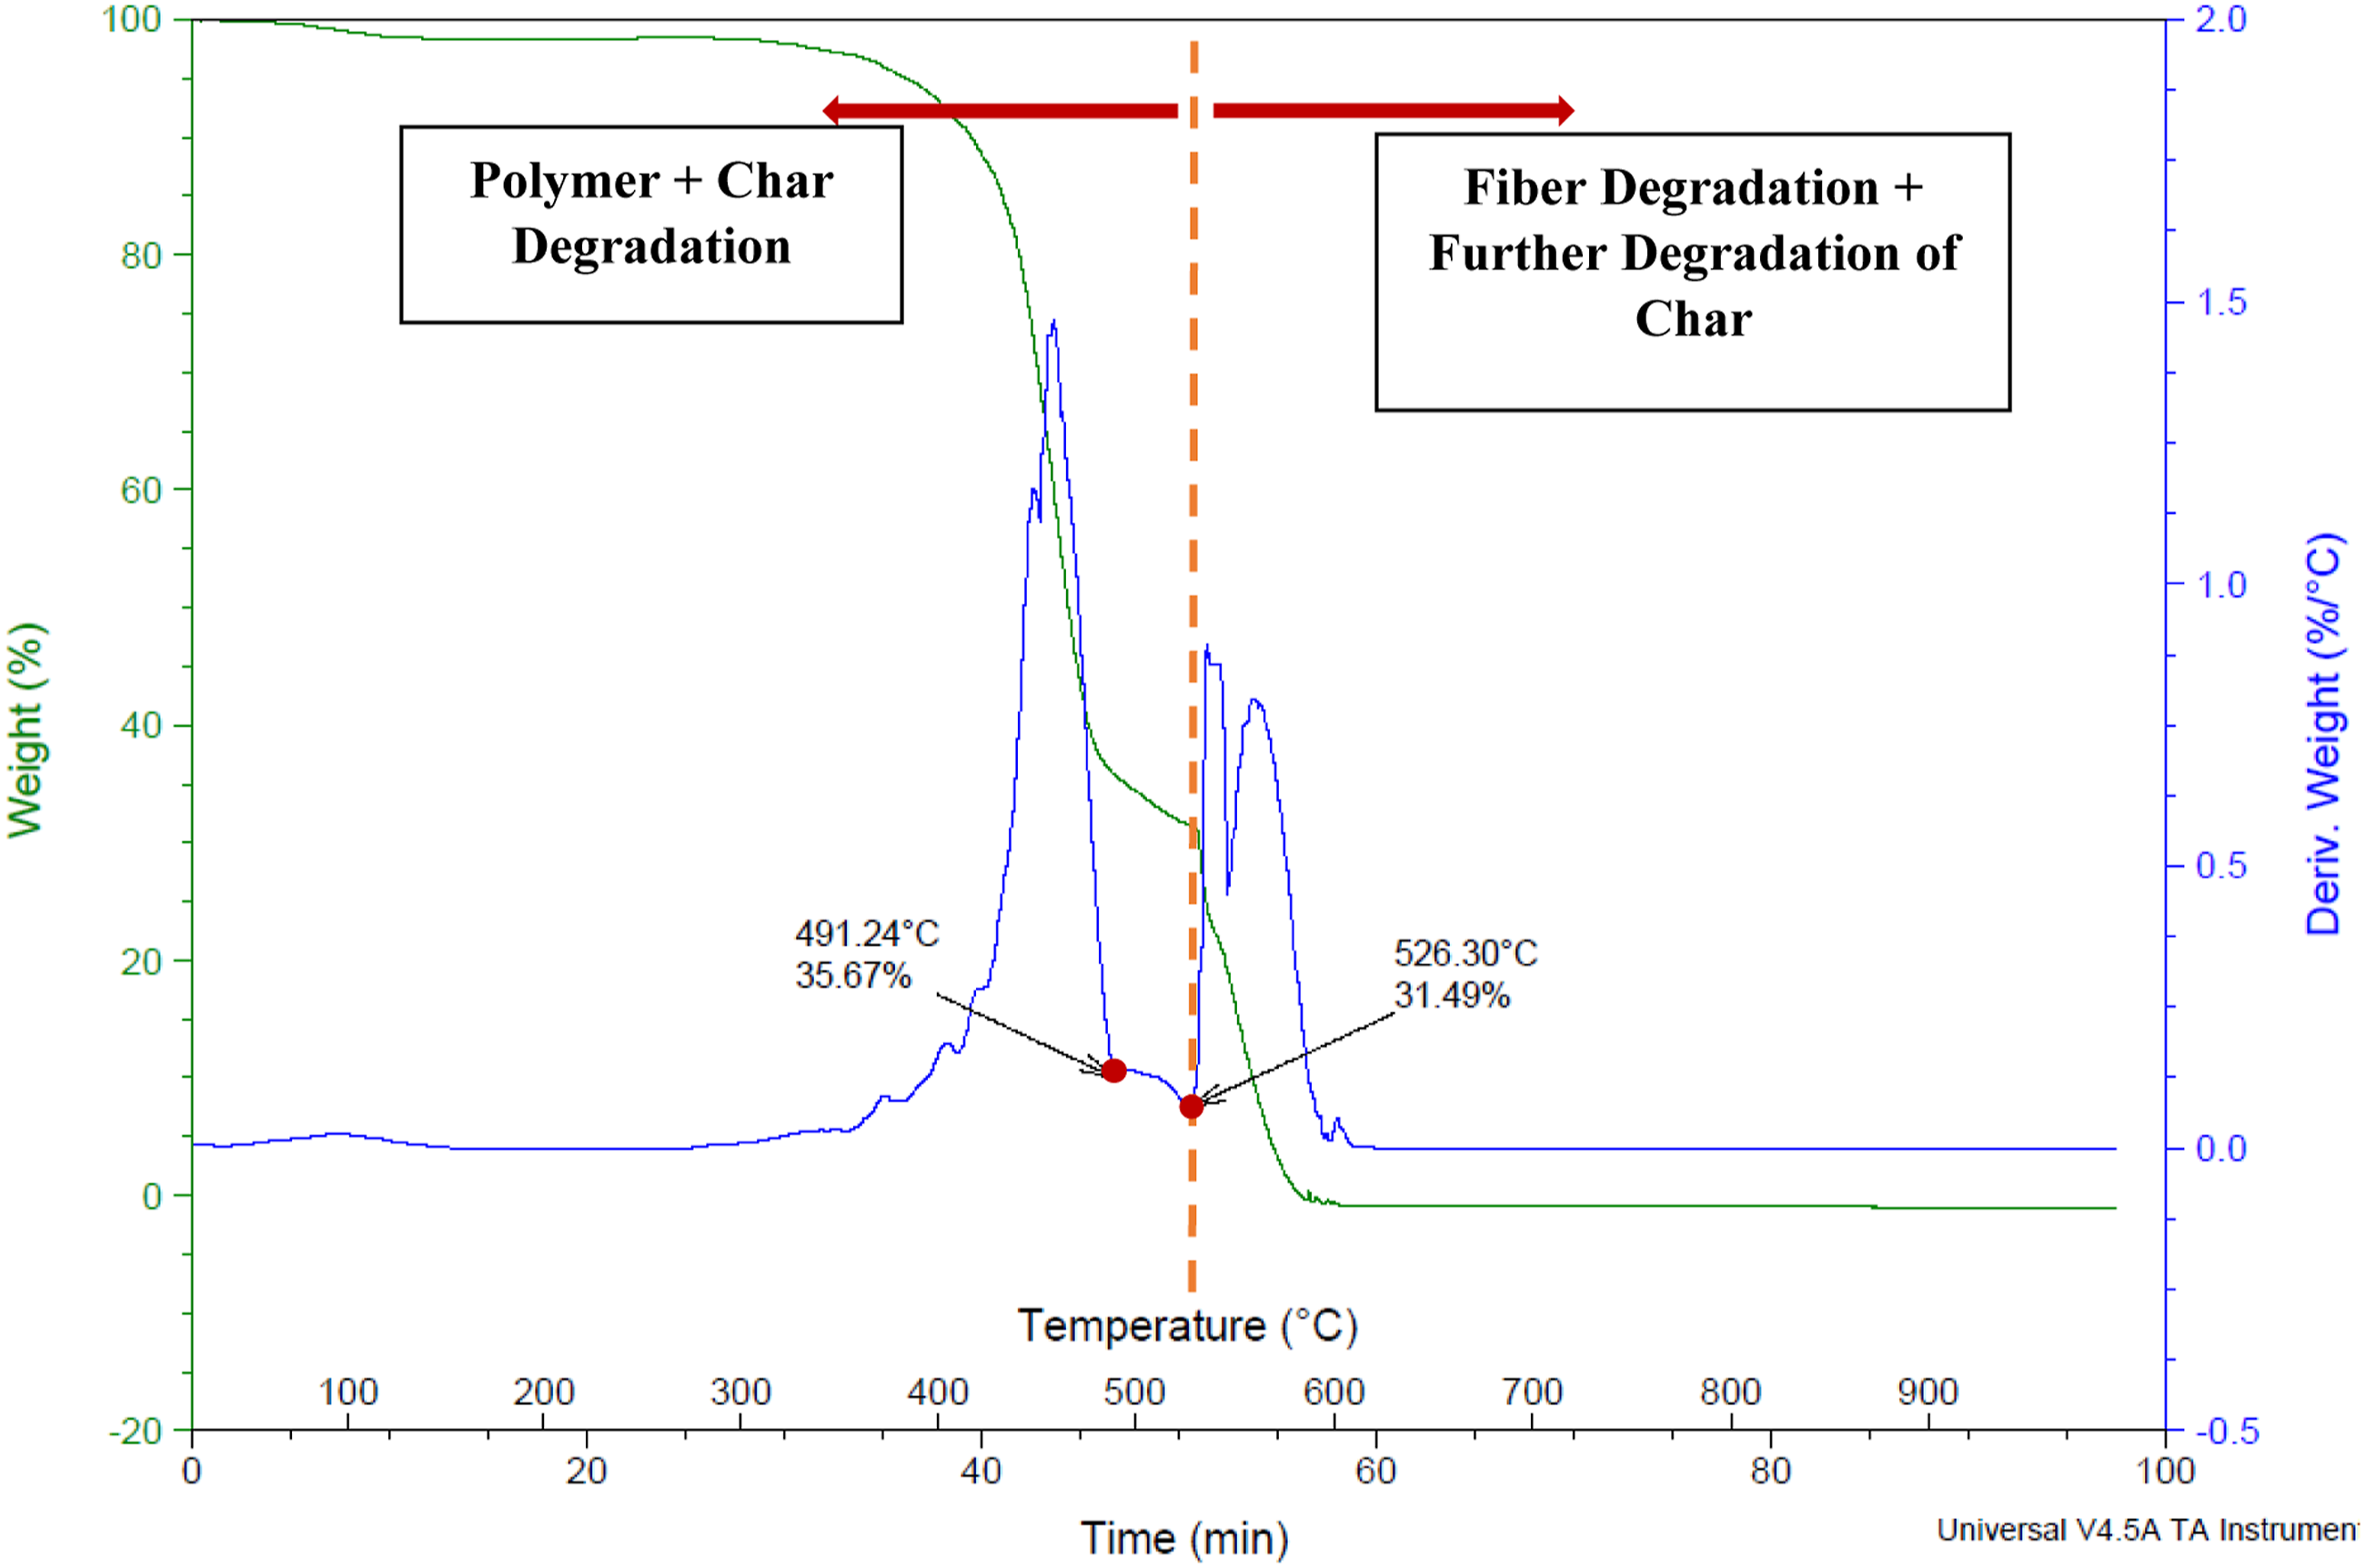
Calculated fiber volume fraction of C/PA410 using Procedure E1,E2 and E3.
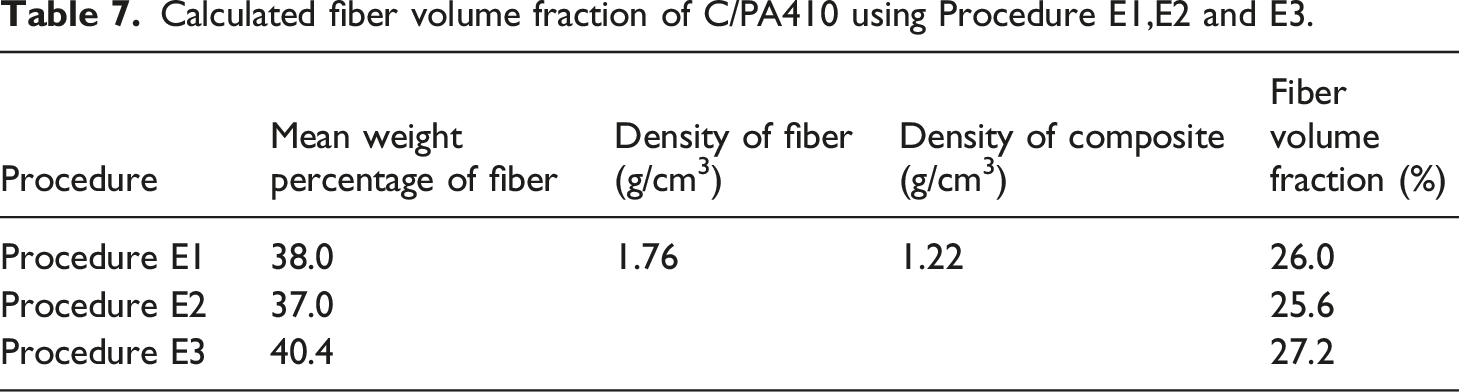
Assuming no voids, the volume percentage of fiber can be calculated by: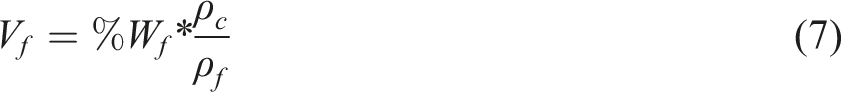
Procedure E4
When nitrogen was used as an inert atmosphere in procedures E1 and E2, the matrix decomposed without causing any thermal impact on the carbon fibers but left a char residue. The amount of polymer matrix and the residual amount of char must be known accurately to determine fiber volume fraction. As a result, procedure E4 combines the first step of heating under nitrogen to degrade the polymer matrix solely, followed by the second stage of heating under technical air to decompose the char and fiber in sequence.
The decomposition pattern and stages obtained using the two-stage approach are shown in the rate of weight loss percentage plot (blue) of Figure 6. The first stage, which is dynamic heating in a nitrogen atmosphere followed by isothermal stay, caused the polymer matrix to degrade, leaving a small quantity of char behind with carbon fibers. The second stage, which is heating in the air atmosphere, resulted in two degradation steps, the first of which occurred between 505 and 525°C. This is a short transition phase of char degradation. Second, above this point, fiber degradation occurs at the maximum weight-loss rate with two decomposition peaks seen due to an increase in the heating rate from 5 °C/min to 10 °C/min to save operation time. Two stage weight loss (green) and weight loss rate (blue) vs time plot of C-PA410 specimens.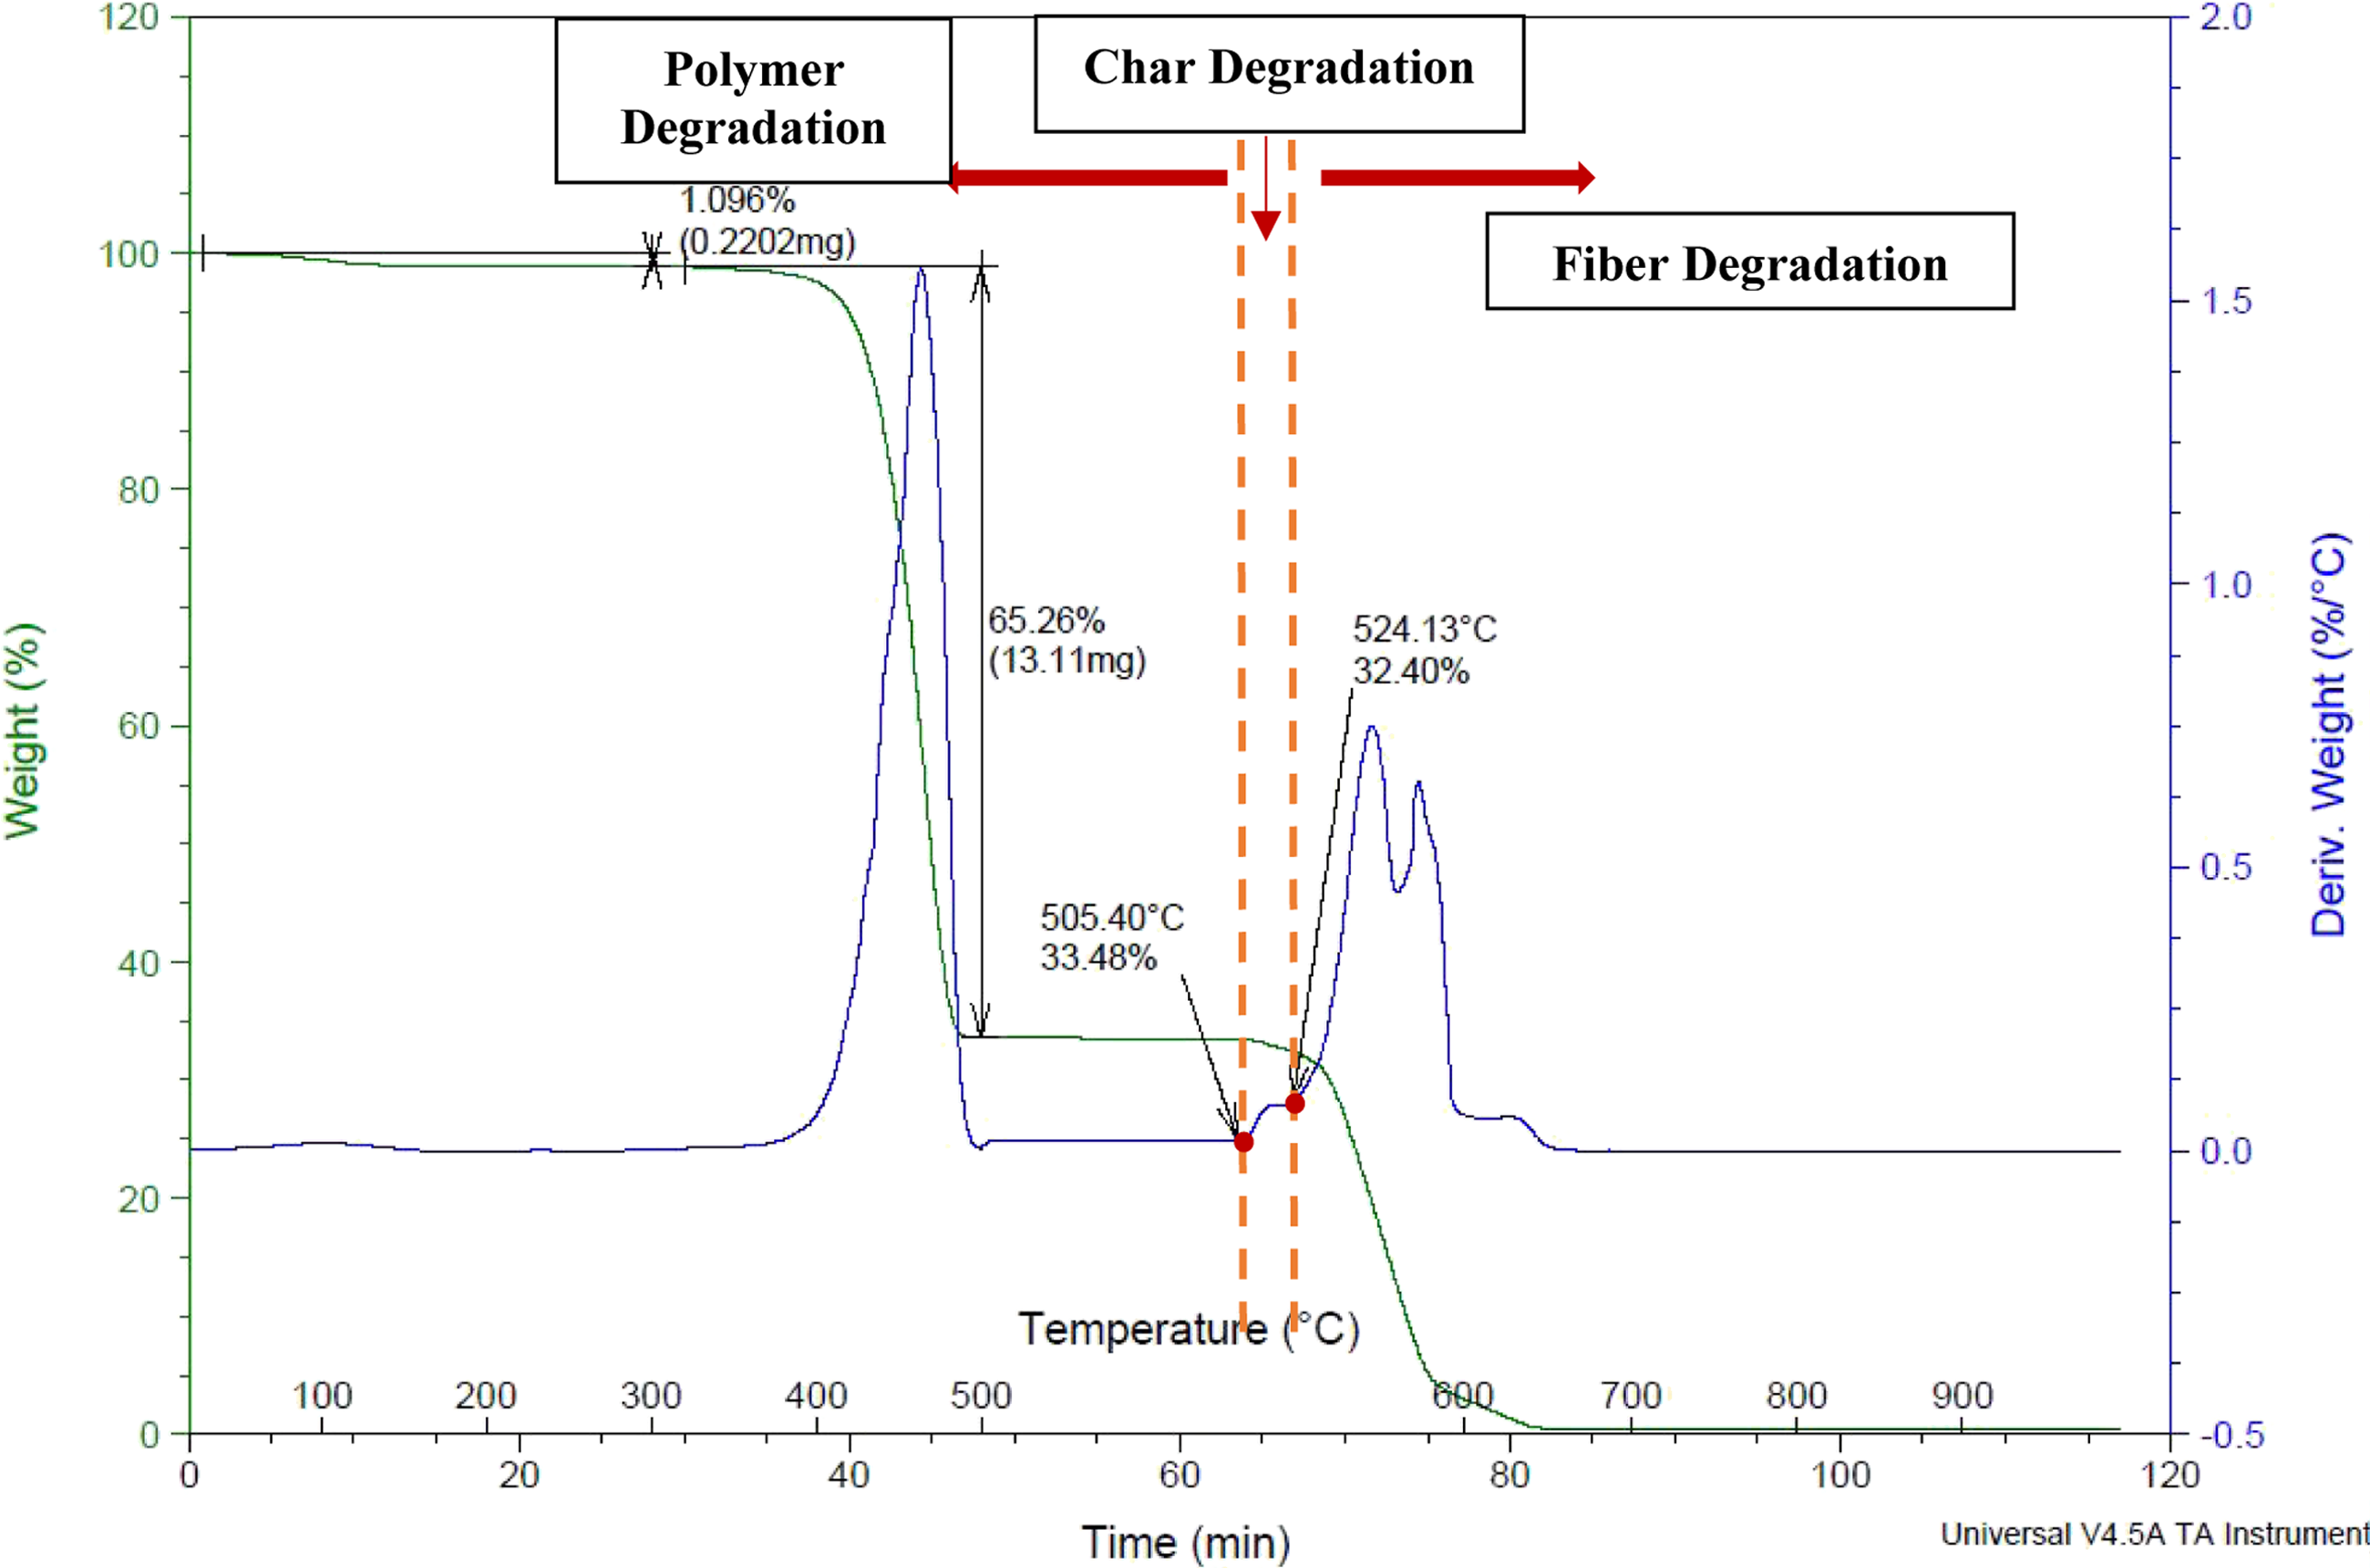
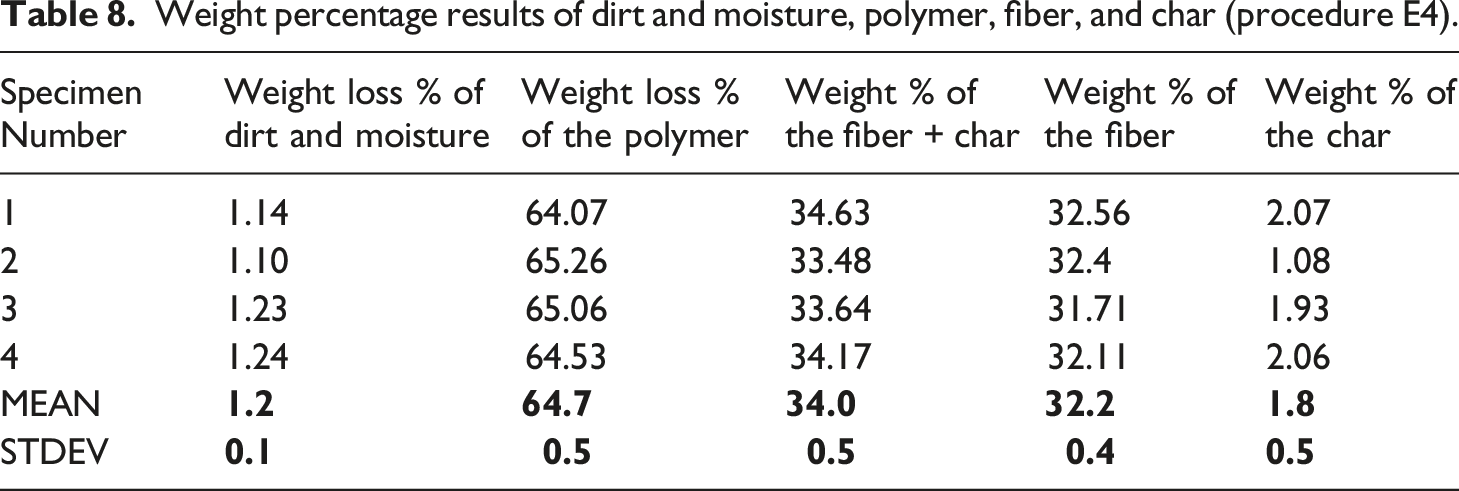
Weight percentage results of dirt and moisture, polymer, fiber, and char (procedure E4).
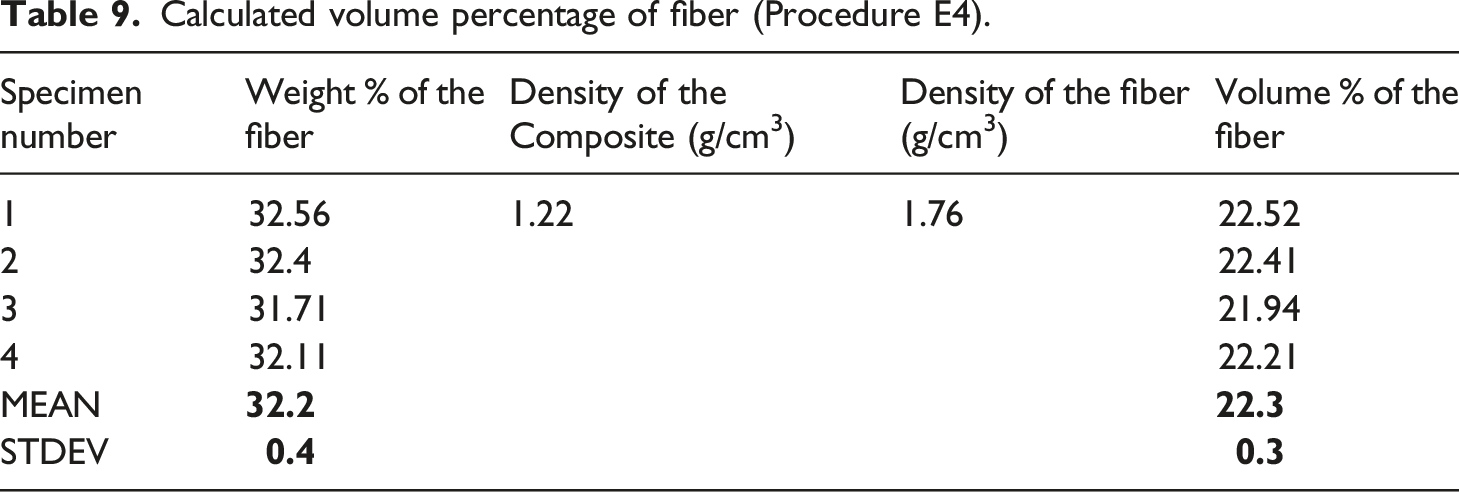
Calculated volume percentage of fiber (Procedure E4).
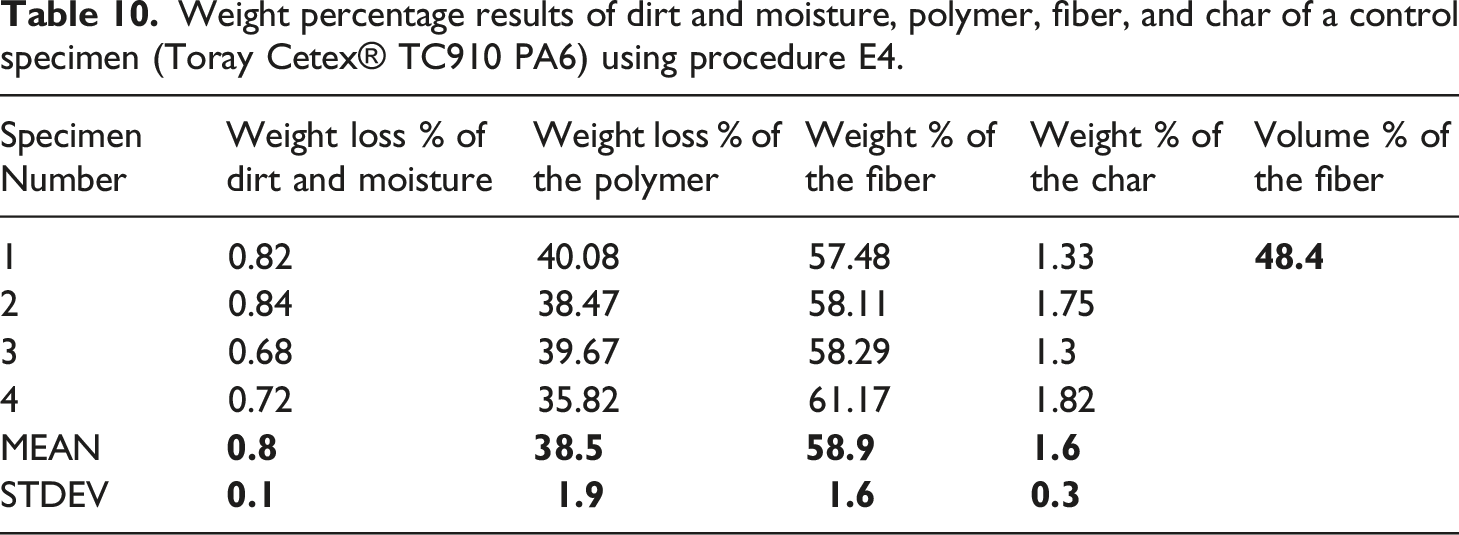
Procedure E4 on a control specimen
Weight percentage results of dirt and moisture, polymer, fiber, and char of a control specimen (Toray Cetex® TC910 PA6) using procedure E4.
Procedure E5 and E6
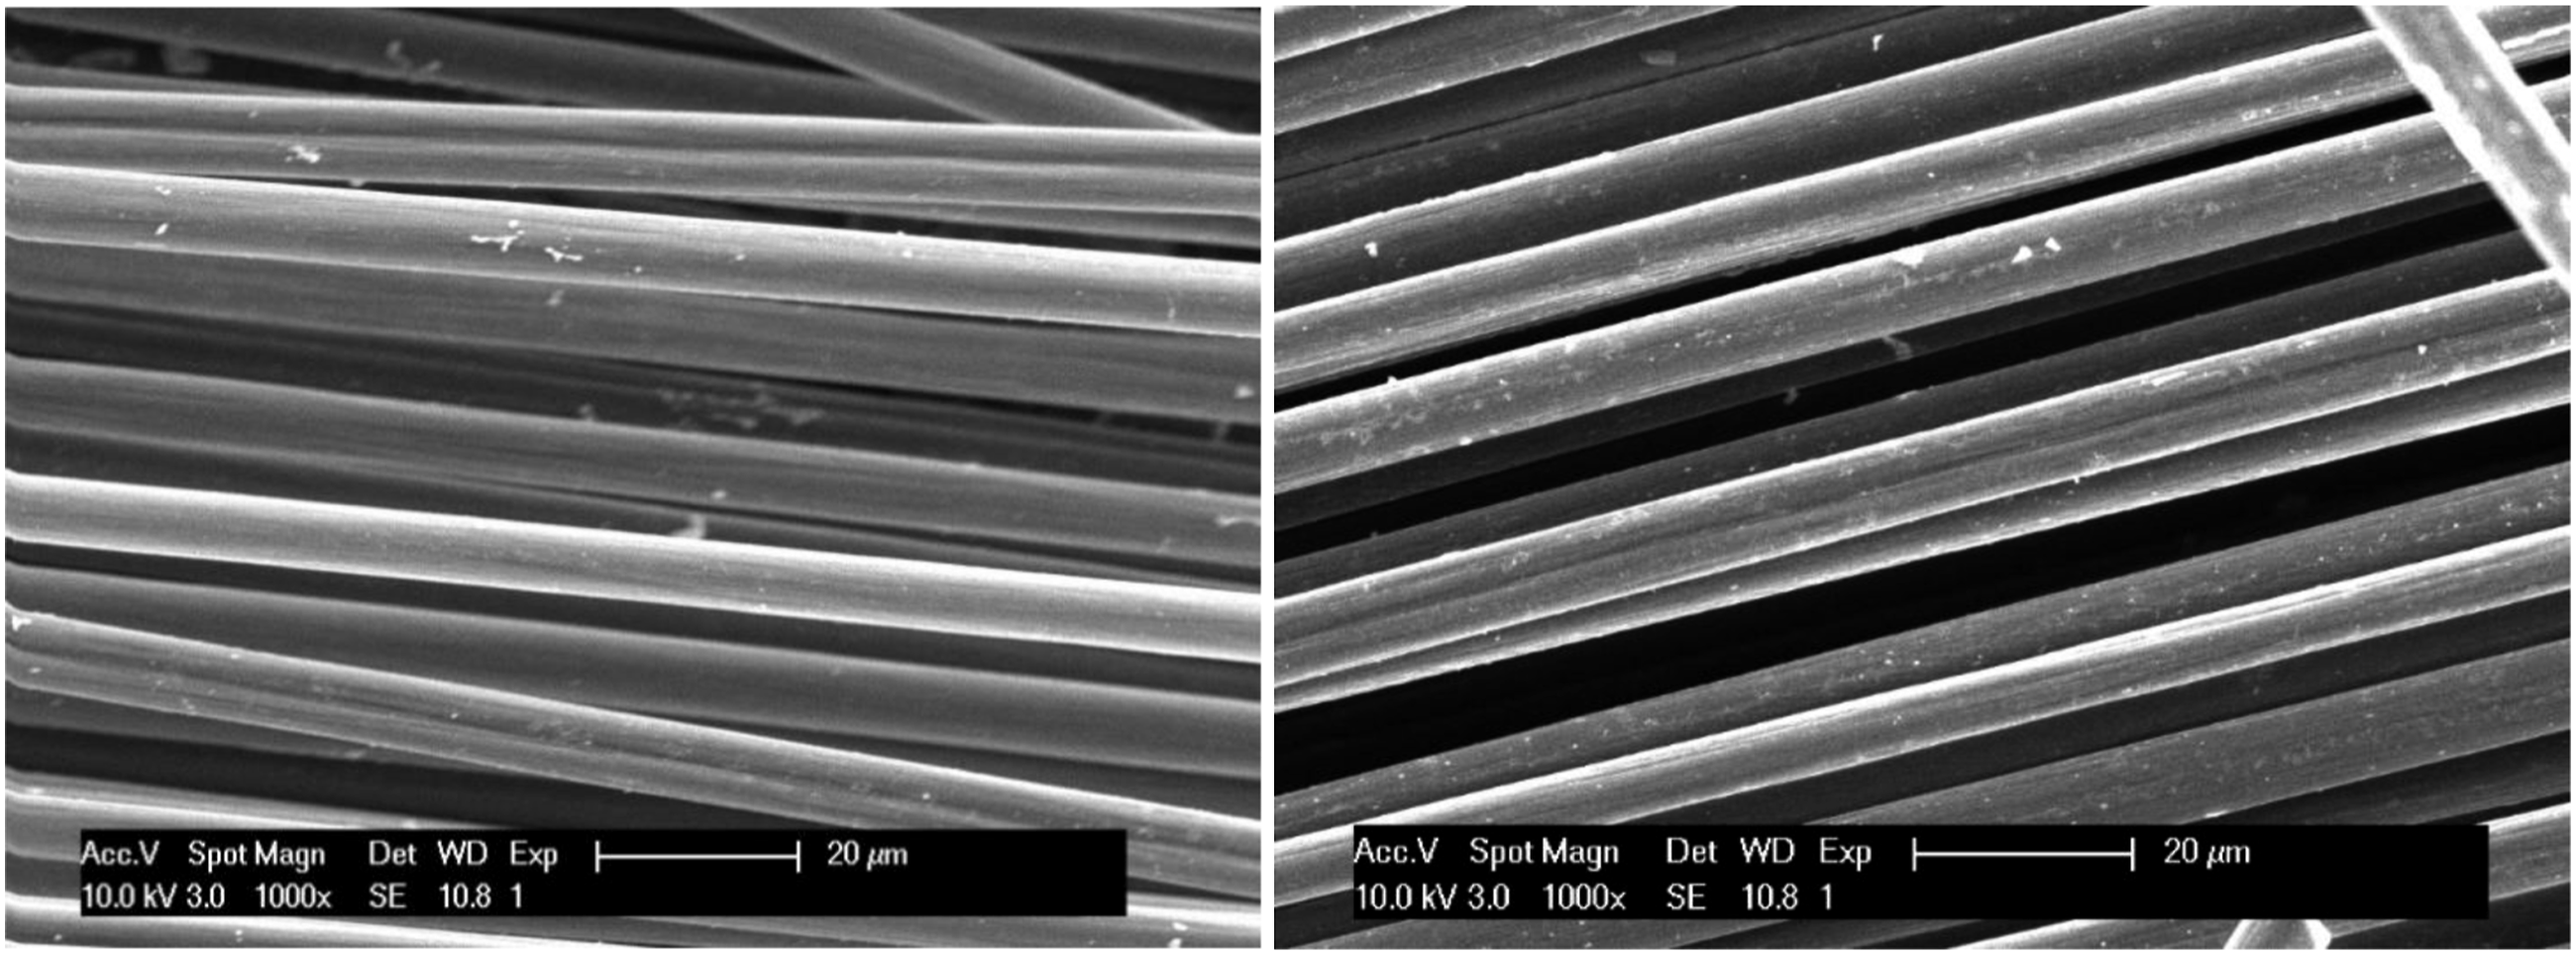
The residue of the specimens was collected after heating up to 505°C and an isothermal stay of 15 min in a nitrogen atmosphere for procedure E5 and after an additional step of heating up to 525°C in an air atmosphere for procedure E6. SEM imaging was performed on these specimens that had been heated to the red-marked interruption point on the curve (Figure 6). Images of specimens taken in procedure five show char residue scattered over carbon fibers (Figure 7). The specimen had a form of loosely attached fibers after heating to 525°C in an air atmosphere according to procedure 6, and the SEM images indicate bundles of fibers with nearly no apparent char remaining (Figure 8). SEM images of specimen after heating up to 505°C and isothermal period of 15 min in nitrogen atmosphere (Procedure E5). SEM images of specimen after heating up to 505°C, isothermal period of 15 min in nitrogen atmosphere, and heating up to 525°C in air atmosphere (Procedure E6).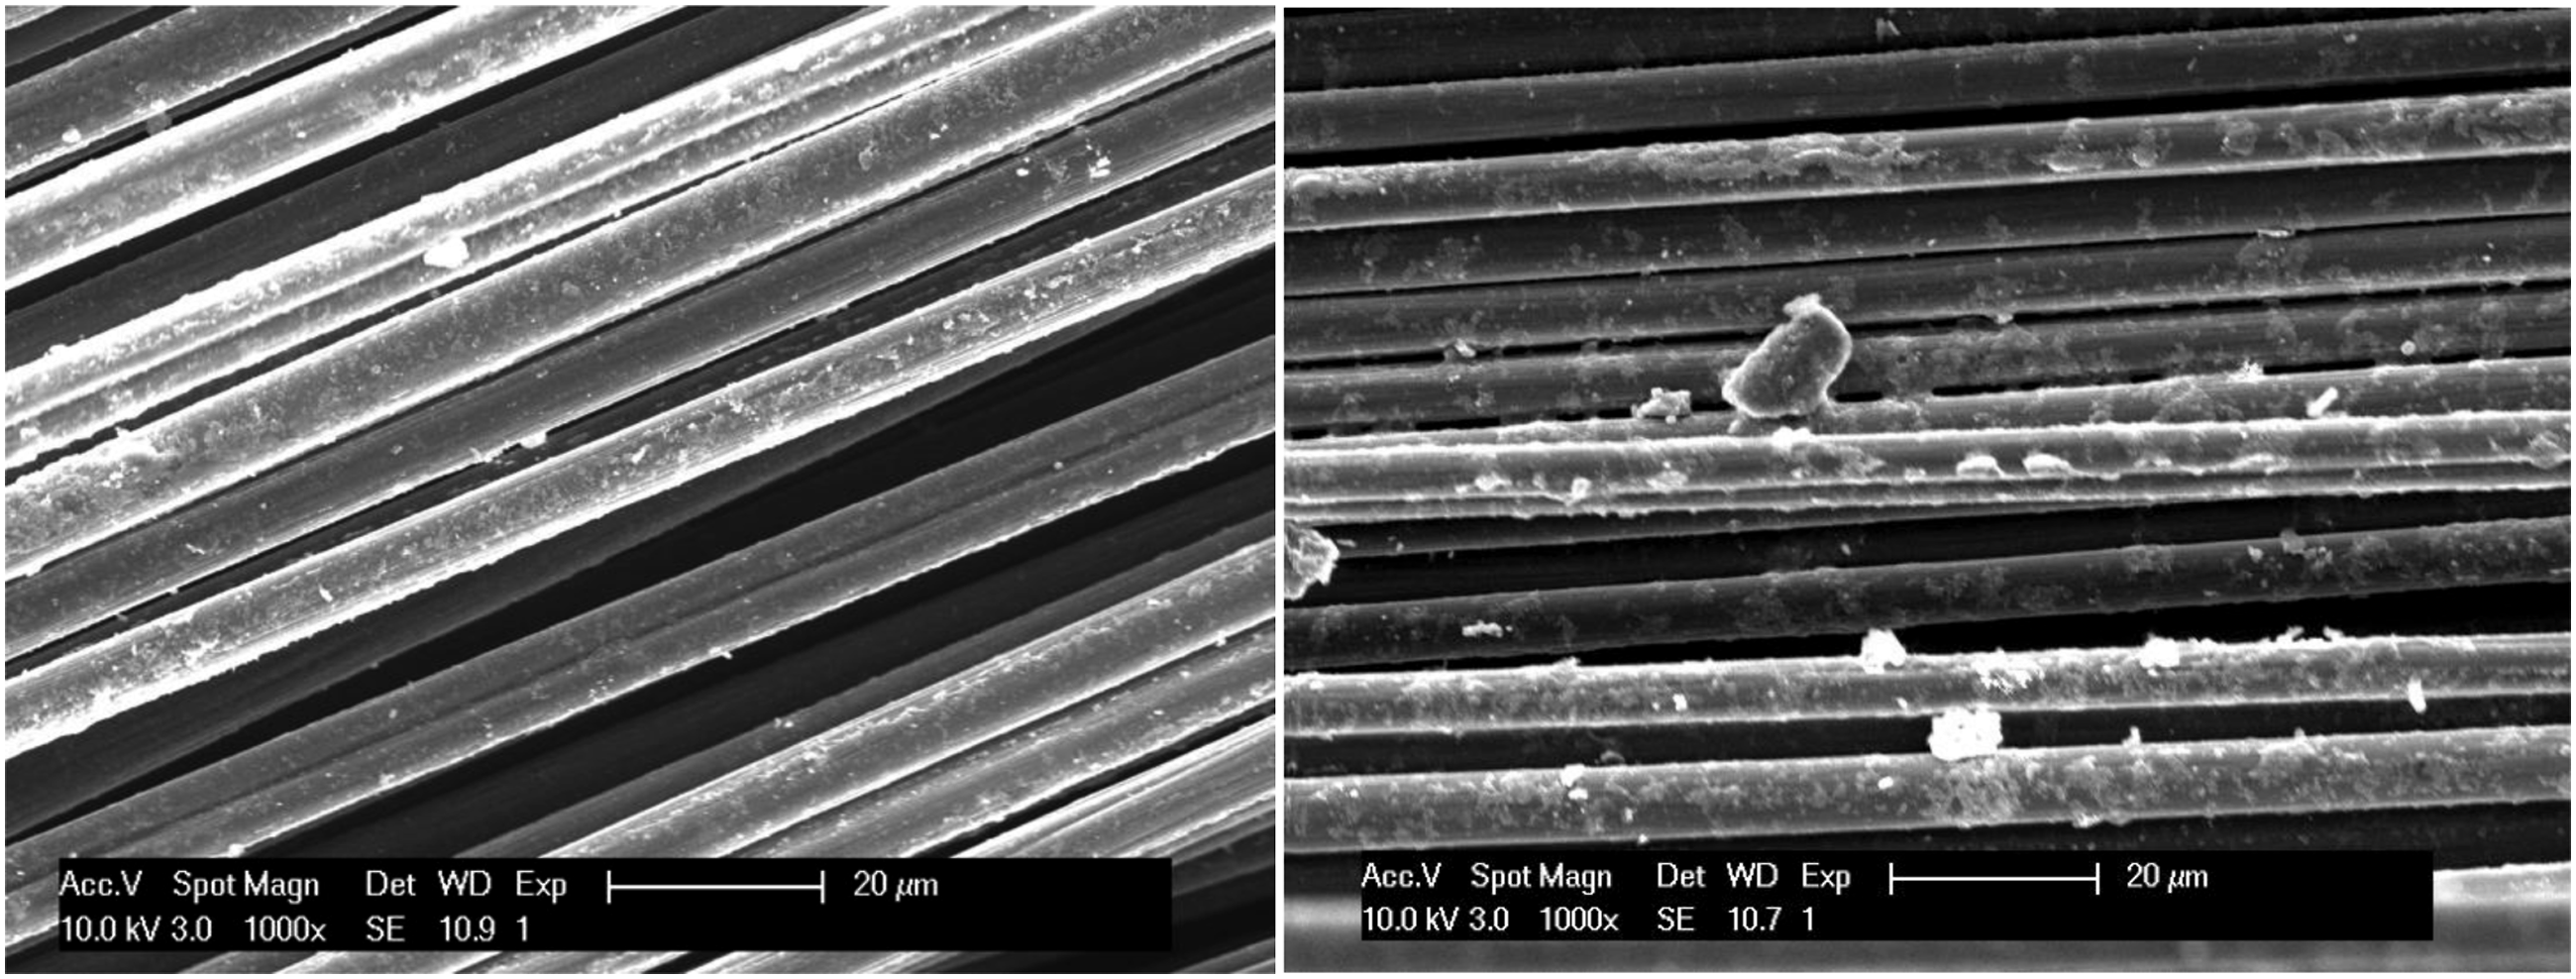
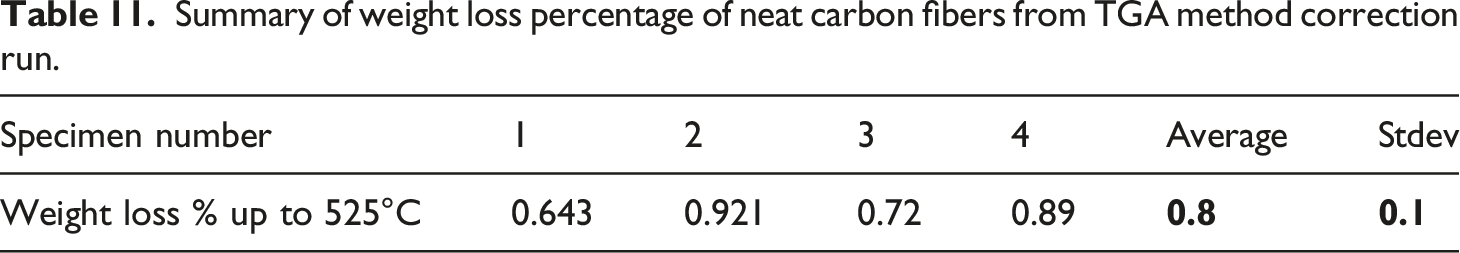
Correction of the TGA method
The fiber volume fraction value obtained by the TGA method described in procedure E4 is comparable to that obtained by the standard acid digestion method. However, the degradation of carbon fibers without sizing during the first stage of pyrolysis and the char-burning stage should be taken into consideration. To accomplish this, neat carbon fiber (T300) specimens are heated in nitrogen up to 505°C, isothermal for 15 min, followed by heating under air atmosphere up to 525°C with a similar heating rate used in procedure E4 (Figure 9). Then the degradation of carbon fibers during these stages is used to calibrate the two-stage TGA method. The results are summarized in Table 11. TGA correction run with procedure E4 on neat carbon fiber. Summary of weight loss percentage of neat carbon fibers from TGA method correction run.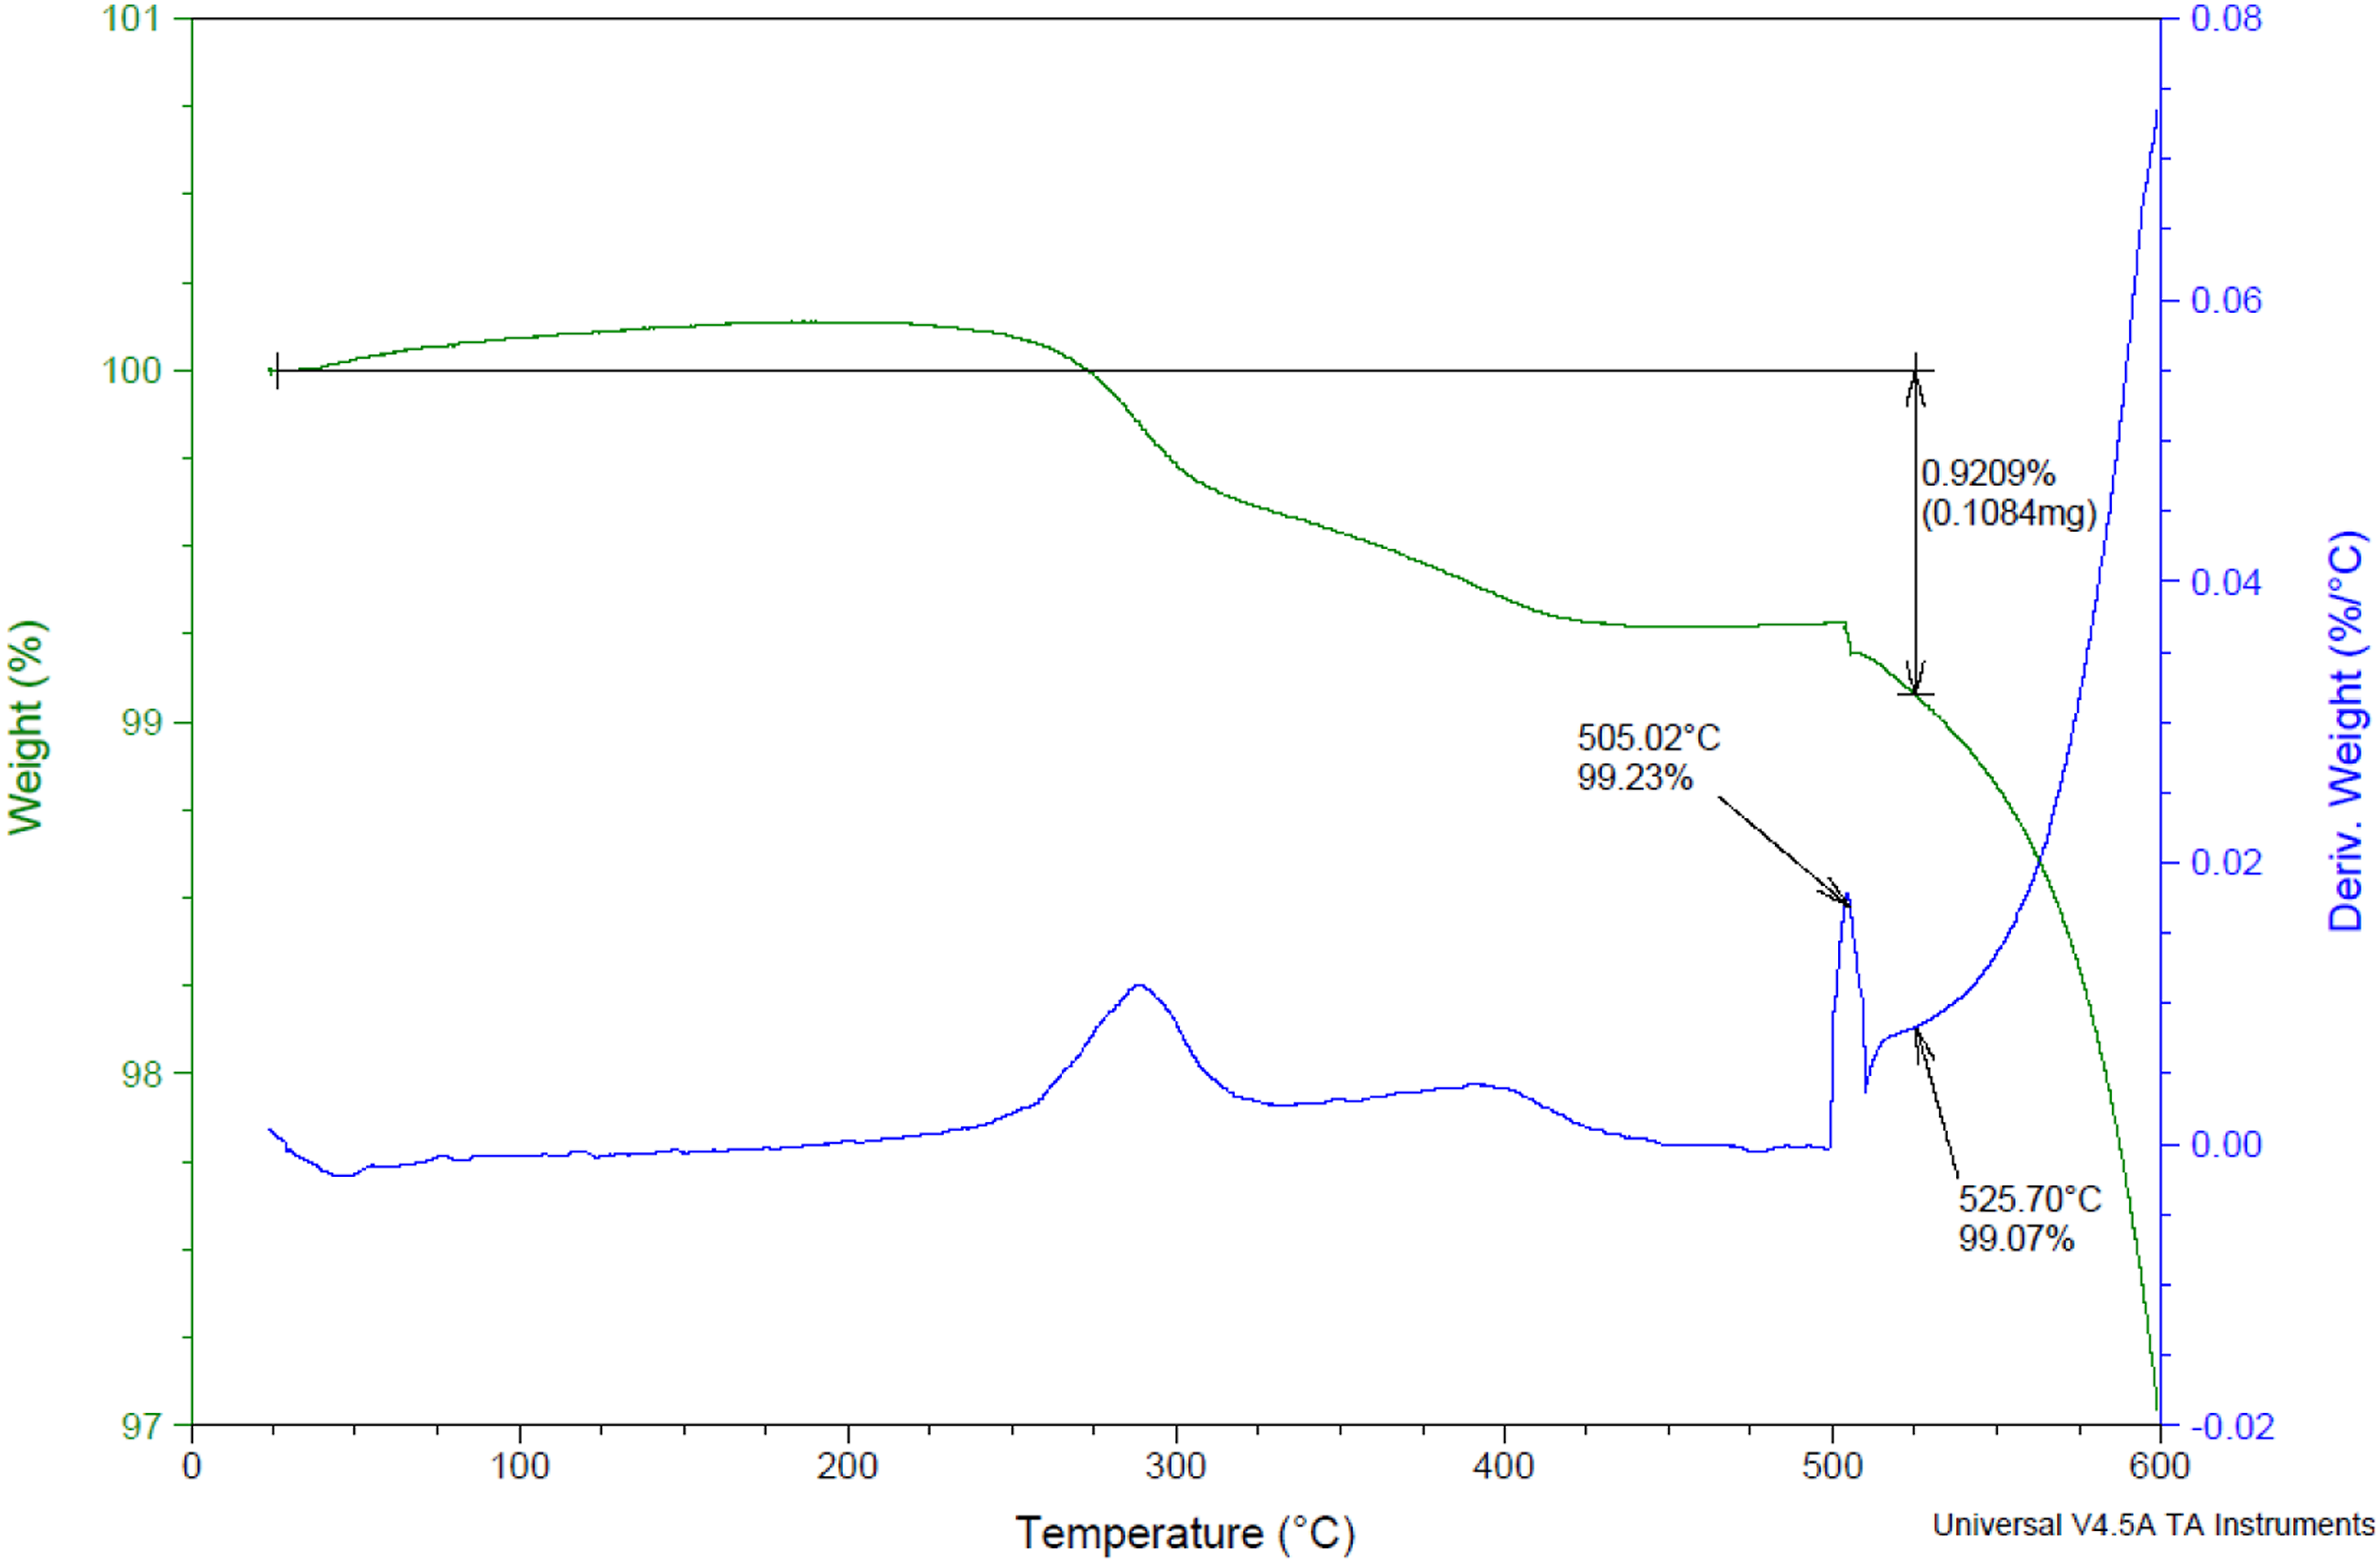
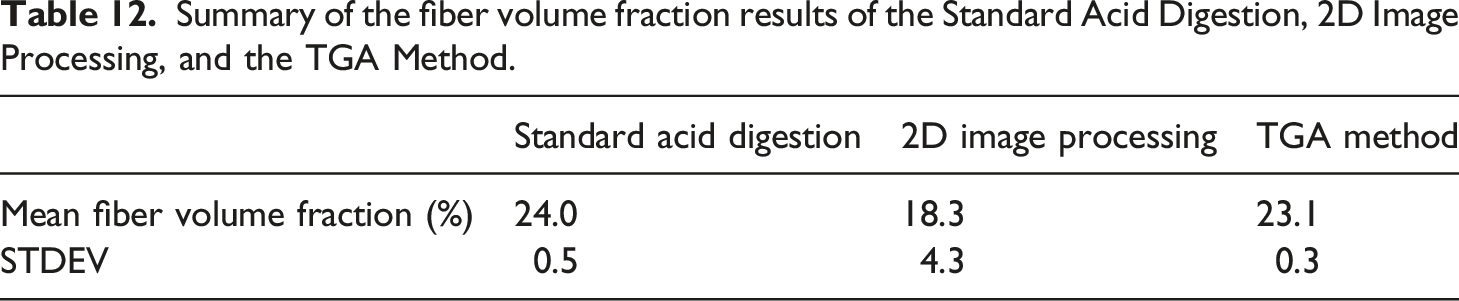
Summary of the fiber volume fraction results of the Standard Acid Digestion, 2D Image Processing, and the TGA Method.
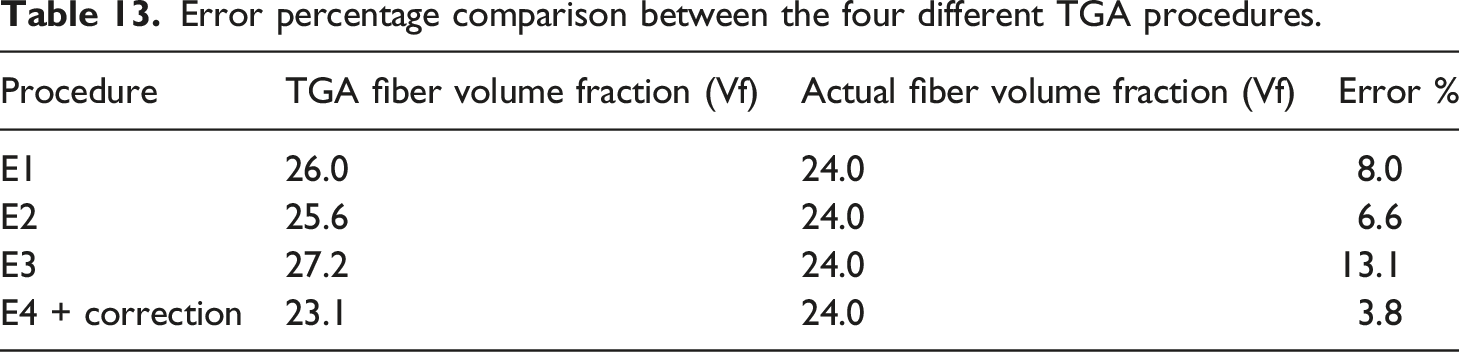
Error percentage comparison between the four different TGA procedures.
Conclusion
In this experimental study, the fiber content of a C-PA composite was assessed using three methods: standard acid digestion, 2D image processing, and the TGA method. Each method’s outcomes have been properly examined. Standard acid digestion, 2D image processing, and TGA were used to evaluate the Vf values of unidirectional C-PA410 specimens, yielding Vf values of 24.0%, 23.1%, and 18.3%, respectively. By using a unique two-stage TGA approach (in nitrogen and air atmosphere), comparable values between standard acid digestion and the TGA technique were obtained. Unlike the two-stage TGA methods described in the literature, this method excludes the cooling and reheating stages after the first stage, and it also doesn’t necessitate a special TGA machine with a mass-controlled heating program. The 2D image processing method provides a significantly lower volume fraction of fiber when compared to the standard acid digestion method. This is because the segmentation of area fractions of fibers using the threshold function is influenced by human skill in specimen preparation (grinding and polishing), which affects the image quality. Additionally, the method is based on the two-dimensional cross sections of the composite tape, which makes volumetric information difficult to get and requires ideal unidirectional fiber orientations in a composite tape. The 2D image processing method, unlike others, can provide extra microstructural information such as fiber size, shape, distribution, defects, and void existence.
Furthermore, a larger specimen size is used for determining the FVF of C/PA410 composites using the acid digestion method in accordance with the ASTM D3039 standard. This provides a representative measure of global FVF. However, this method is not capable of determining FVF variations at smaller scales of fiber/matrix level. In contrast, the 2D image processing method used smaller scale specimen sizes to determine the FVF, and it revealed FVF variations at smaller scales of fiber/matrix level. However, the results showed that even if we collected several images of the cross-section of the composite tape, the RVE size is quite large to get a representative measure of the global FVF of the composite material. Moreover, despite the fact that the sensitivity and accuracy of the TGA measurements can be impacted by the specimen size, utilizing 18–20 mg of a representative volume of the composite material showed that the two-stage TGA approach can be used to accurately measure global FVF.
The standard acid digestion method involves the use of strong acids, such as concentrated sulfuric acid, and subsequent boiling of the acid, which is both hazardous to laboratory personnel and harmful to the environment. The two-stage TGA approach used in this study involves two stages of decomposition, first in nitrogen and then in air. Because char formed by polymer decomposition cannot be removed in nitrogen and carbon fibers may begin to degrade in air, an optimized temperature for switching from nitrogen to air, as well as the temperature range spent in the air atmosphere to remove the char, must be carefully specified for the specific composite material with the exception of higher char temperature matrix materials. A TGA run on neat carbon fibers was performed to correct the degradation of carbon fibers without sizing during the first stage of pyrolysis and the char burning stage, and a correction value of 0.79% was introduced. The SEM images of specimens collected before and after heating in the air atmosphere are used to validate the two-stage TGA method. The two-stage TGA approach was used to determine the Vf of a material (Toray Cetex® TC910PA6) of known weight fraction and has proven to be more convenient in terms of accuracy, safety, and speed.
The two-stage TGA is a versatile technique that can be used to measure the fiber volume fraction of a variety of carbon fiber/thermoplastic composites, though it should be noted that the accuracy of the measurement may be affected by a number of factors, including the quality and homogeneity of the composite specimen, the heating rate and specific temperature range, environment, and dwell time used in the analysis.
Footnotes
Declaration of conflicting interests
The author(s) declared no potential conflicts of interest with respect to the research, authorship, and/or publication of this article.
Funding
The author(s) disclosed receipt of the following financial support for the research, authorship, and/or publication of this article: This research work was carried out in the frame of the HGPP project (International University Partnership Services for the Establishment of Postgraduate Programmes in Ethiopia) funded through GIZ GmbH and the International University Partnership for the Establishment of PhD Programmes in Ethiopia funded by the Ethiopian Ministry of Science and Higher Education.