
Abstract
Additive manufacturing is becoming more and more significant for the production of engineering products. The global community of designers and manufacturers will undoubtedly benefit from identifying the process factors that could lead to superior mechanical behaviour. The incorporation of fibres and nanoparticles in polymer matrix is one of the most significant advancements in polymer fabrication. This study intends to investigate how the flexural behaviour of dissimilar polymer composites viz carbon fibre reinforced poly lactic acid (CF-PLA), carbon fibre reinforced poly ethylene terephthalate glycol (CF-PETG) and multi walled carbon nano tubes reinforced PLA (MWCNTs-PLA) are affected by process parameters viz nozzle diameter (0.2 mm, 0.4 mm, 0.6 mm), and infill pattern (triangular, honeycomb, rectilinear) through fused filament fabrication (FFF). Flexural testing was carried out on the fabricated specimens, and post to the testing, fractography has been carried out and statistical analysis of the observations is performed utilizing analysis of variance and Taguchi method. According to the observations, flexural strength of the polymer composite specimen increases with increase in nozzle diameter (ND). The flexural behaviour is also directly impacted with the variation of infill pattern (IP). Process parameter variations affect target factors differently depending on the fabricating material. For flexural behaviour, IP contributes 68.27% to CF-PLA, while ND contributes 88.96% to CF-PETG and 77.59% to MWCNTs-PLA. Overall, the highest flexural strength, 70.372 MPa, is exhibited by the specimen with ND 0.6 mm and rectilinear IP for MWCNTs-PLA as fabricating filament material. This study will aid researchers and designers in developing FFF-fabricated electrochemical energy storage devices with improved flexural behaviour of functional parts for a wide range of applications.
Introduction
The cutting-edge technology known as additive manufacturing (AM) has revolutionized the manufacturing systems which paved the way for their domination in almost all type of industrial sectors. Contrary to subtractive manufacturing, Fused Filament Fabrication (FFF) is an AM process that uses minimal to no wasted material.1–5 Additionally, it reduced the complexity of producing challenging component geometries. Not always the strongest combinations of strength attributes are available when transforming virtual models to goods. Products made with additives in particular are prone to faults caused by the manufacturing process, such as porosity, surface roughness, and geometric deviations from the intended dimensions. 6 Another benefit of FFF process is that it has low maintenance costs, operates without supervision, allows for easy material swaps, and has interface-friendly temperatures. With FFF, a wide range of variables can be adjusted to affect the eventual characteristics of the finished object.1,3,7,8 Layer thickness, build orientation, nozzle temperature, bed temperature raster angle, raster thickness, air void, nozzle diameter, infill density, and infill pattern are some of these variables which affect the mechanical characteristics of fabricated parts.1,9–14
Several thermoplastic polymers, including poly lactic acid (PLA), acrylonitrile butadiene styrene (ABS), and polycarbonate (PC), are frequently utilized in FFF-process. The most popular material is PLA since it is readily available, biodegradable, and has very stable fabricating features that only need a few settings to be adjusted.15–17 High mechanical strength, thermo-plasticity, and fabricability are only a few of PLA’s physical qualities that demonstrate its good biocompatibility.16–19 However, their applicability in many applications is limited by their very stiff, brittle, slow crystallisation, and hydrolysis characteristics. 20 In order to make poly ethylene terephthalate glycol (PETG), a copolymer based on poly ethylene terephthalate (PET), secondary glycols are substituted for some of the ethylene glycol and joined along the copolymerizing agent’s backbone, resulting in an amorphous co-polyester with low levels of crystallinity. 21 The incorporation of fibres and nanoparticles in polymer matrix is one of the most significant advancements in polymer fabrication.22,23 PETG and PLA filament can be reinforced with materials including glass fibre, single walled carbon nanotubes, multi walled carbon nanotubes (MWCNTs), and carbon fibre (CF), to improve its mechanical, conductive and thermal behaviour.16,17,22,24–27 FFF-fabricated products' physical and mechanical qualities are greatly improved by carbonaceous reinforced polymer composites.17,22,24,28,29
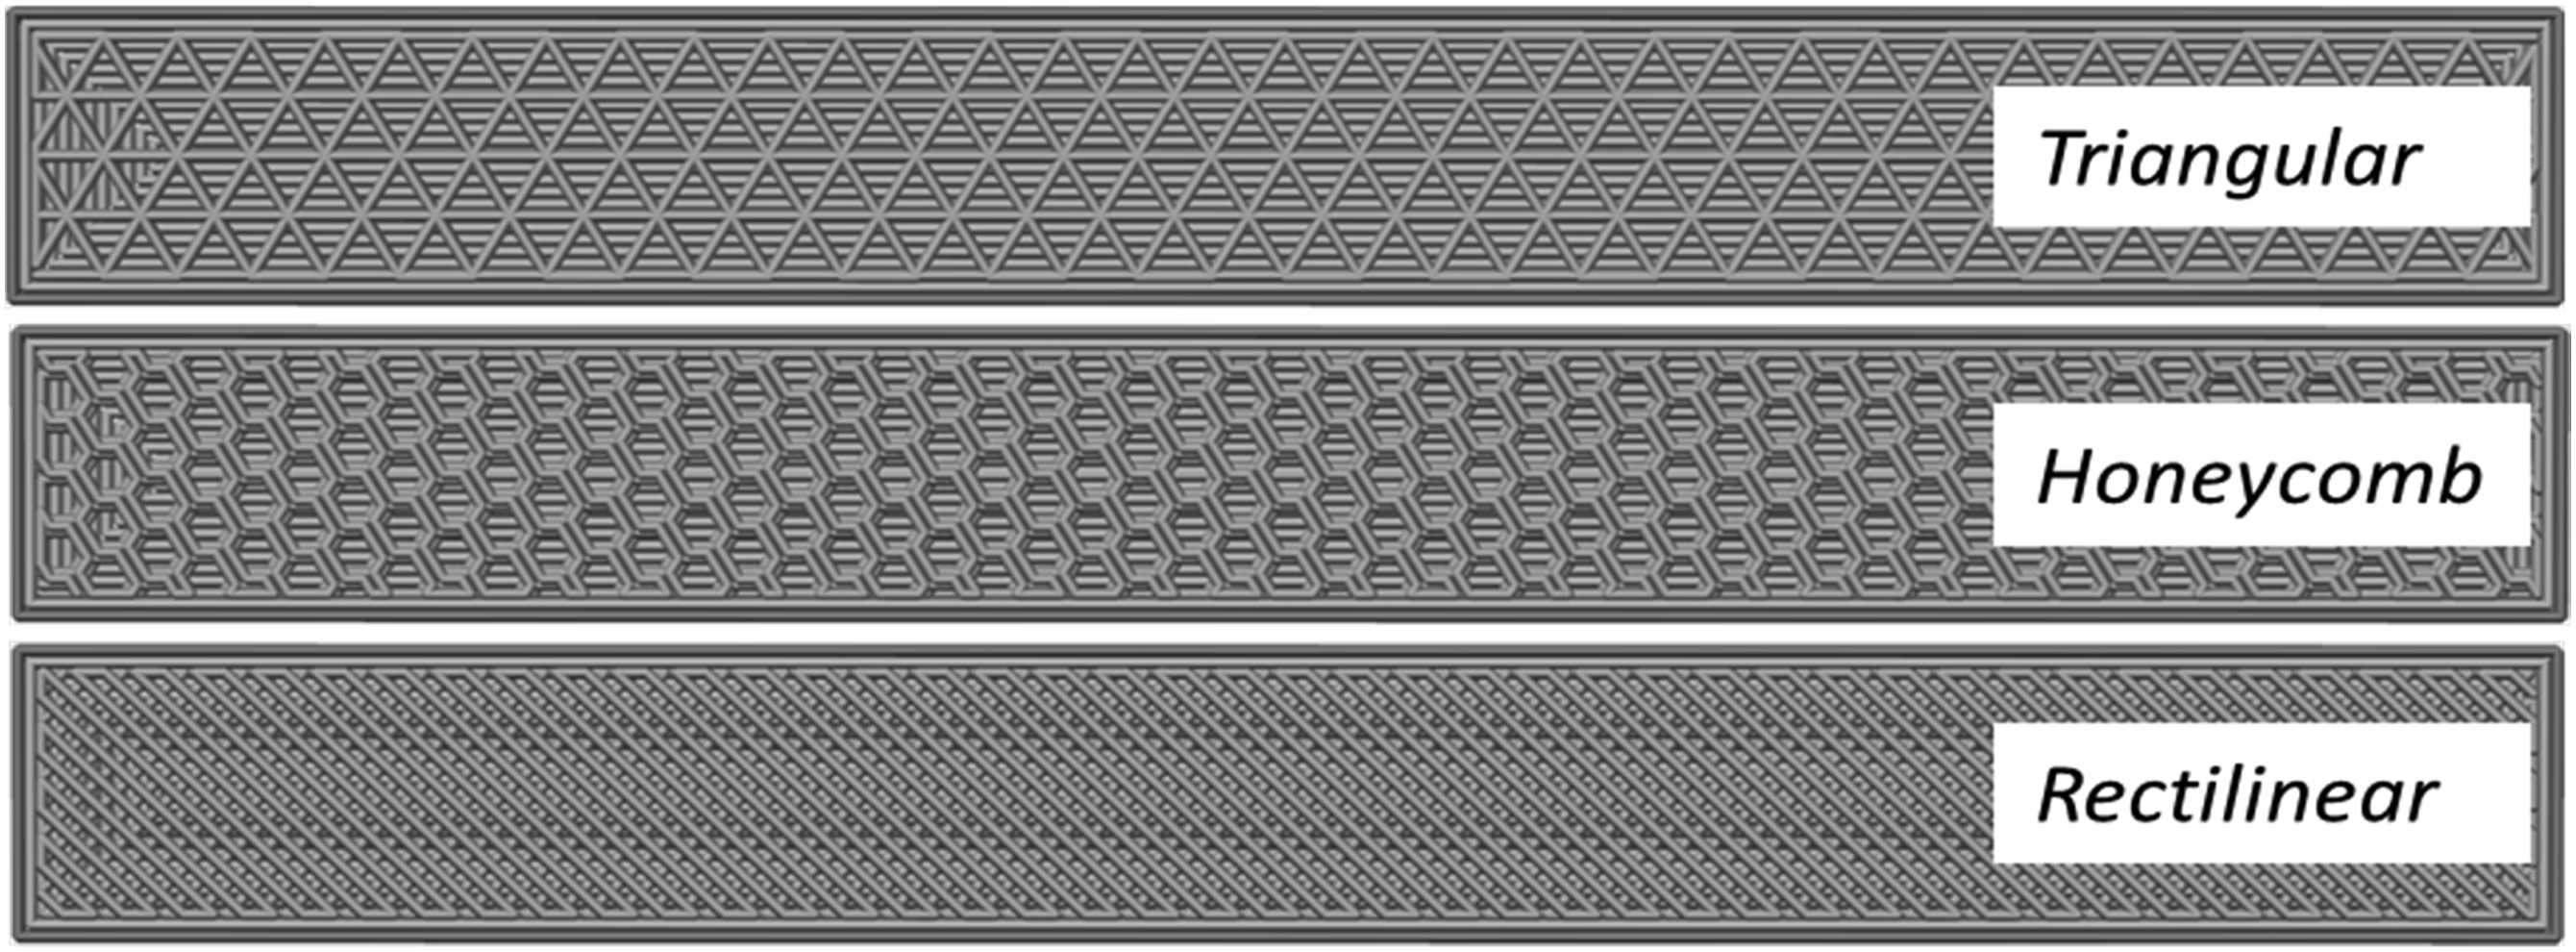
The infill pattern (IP) is one of the crucial factors in FFF process that determines how sturdy and long-lasting a construction will be. 30 The internal lattice or structure of FFF-fabricated items, known as the IP, is created based on the direction and pace of the filament deposition process. There are different kinds of infill patterns, including Hilbert curve, rectilinear, Archimedean chord, honeycomb, octagram spiral, and triangular. 10 The strength of FFF-fabricated parts will vary depending on the infill pattern used. The raster layout and direction that influence the heat transmission between bonded layers are affected by infill patterns.11,31 The choice of infill patterns will impact not just strength but also material utilisation and fabrication time. With the exception of small objects, the infill takes up more volume than the exterior shell and so becomes the predominant factor. Other key elements in FFF process that defines how extrusion and layer deposition will take place is the Nozzle Diameter (ND). 32 It affects the layer height and rate of the filament deposition, which have a direct impact on the mechanical characteristics of FFF-fabricated structures. The mechanical strength of the final manufactured components increases with the efficiency of molecular fusion at bonded interlayers. 33 Since FFF-fabricated parts are typically created for prototyping, one of the main challenges is their endurance under repeated flexural load.31,33 Numerous studies have been carried out to look at how the flexural characteristics are affected by the FFF process variables.11,29,34
Kesavarma et al. 7 reported that the infill pattern and infill percentage have a substantial influence on the flexural behaviour of the parts. Khan et al. 10 demonstrated that, when compared to Hilbert curve, concentric and honeycomb patterns, the rectilinear infill pattern has the highest flexural performance. Lower layer height and 45° raster angle might increase flexural strength, according to Aworinde et al., 1 fabrication at 0° raster angle is advised for wider raster width. The impact of nozzle temperature and fabricating speed on the mechanical characteristics of FFF-fabricated parts were thoroughly examined by Li et al. 2 Christiyan et al. 9 found that as fabricating speed increases, component flexural strength falls as a result of the deboning of each layer. According to Saniman et al., 35 the greatest flexural strain was produced by the honeycomb IP, whereas the best flexural strength was produced by the concentric IP. Ma et al. 31 observed that the mechanical properties of a cubic structure produced through FFF process are significantly influenced by the material type, infill pattern, and density. According to Zandi et al., 36 no interaction between the factors appears to be significant in determining the mechanical behaviour of the resulting specimens, with the layer height proving to be the most significant factor, followed by the nozzle diameter. This research shows that a higher nozzle diameter and a lower layer height produce a stronger bond between the layers, increasing the resistance of the additively made objects. 36
The Design of Experiments is a methodical action for analysing the influence of varying input parameters on a variety of response measures for the purpose of optimising those inputs.12,37–41 By controlling characteristics and aspects related to a product’s design and development, scientists can utilise optimization to reduce the amount of change in a given product.12,37,40,42,43 The input parameters picked unquestionably have a big impact on how well a product performs in the end. Scientists frequently employ a variety of techniques to set up their experiments, including the Orthogonal Array of Taguchi.44–46 To determine the supreme parameters, the experimental data is analysed. Additionally, the significant variables that have the significant impact on the study’s final outcome. It is also important to understand and compare how different carbonaceous polymer composites will respond to alteration in both ND and IP.
This study, therefore, compare the flexural properties of CF-PLA, CF-PETG, and MWCNTs-PLA composites, based on critical variables ND, and IP. The fracture surfaces are then examined using high-resolution microscopy to better understand failure causes. In order to investigate the relationship between the flexural strength and variation of process factors, The results of flexural tests are analysed with analysis of variance (ANOVA) and Taguchi method.
Material and methods
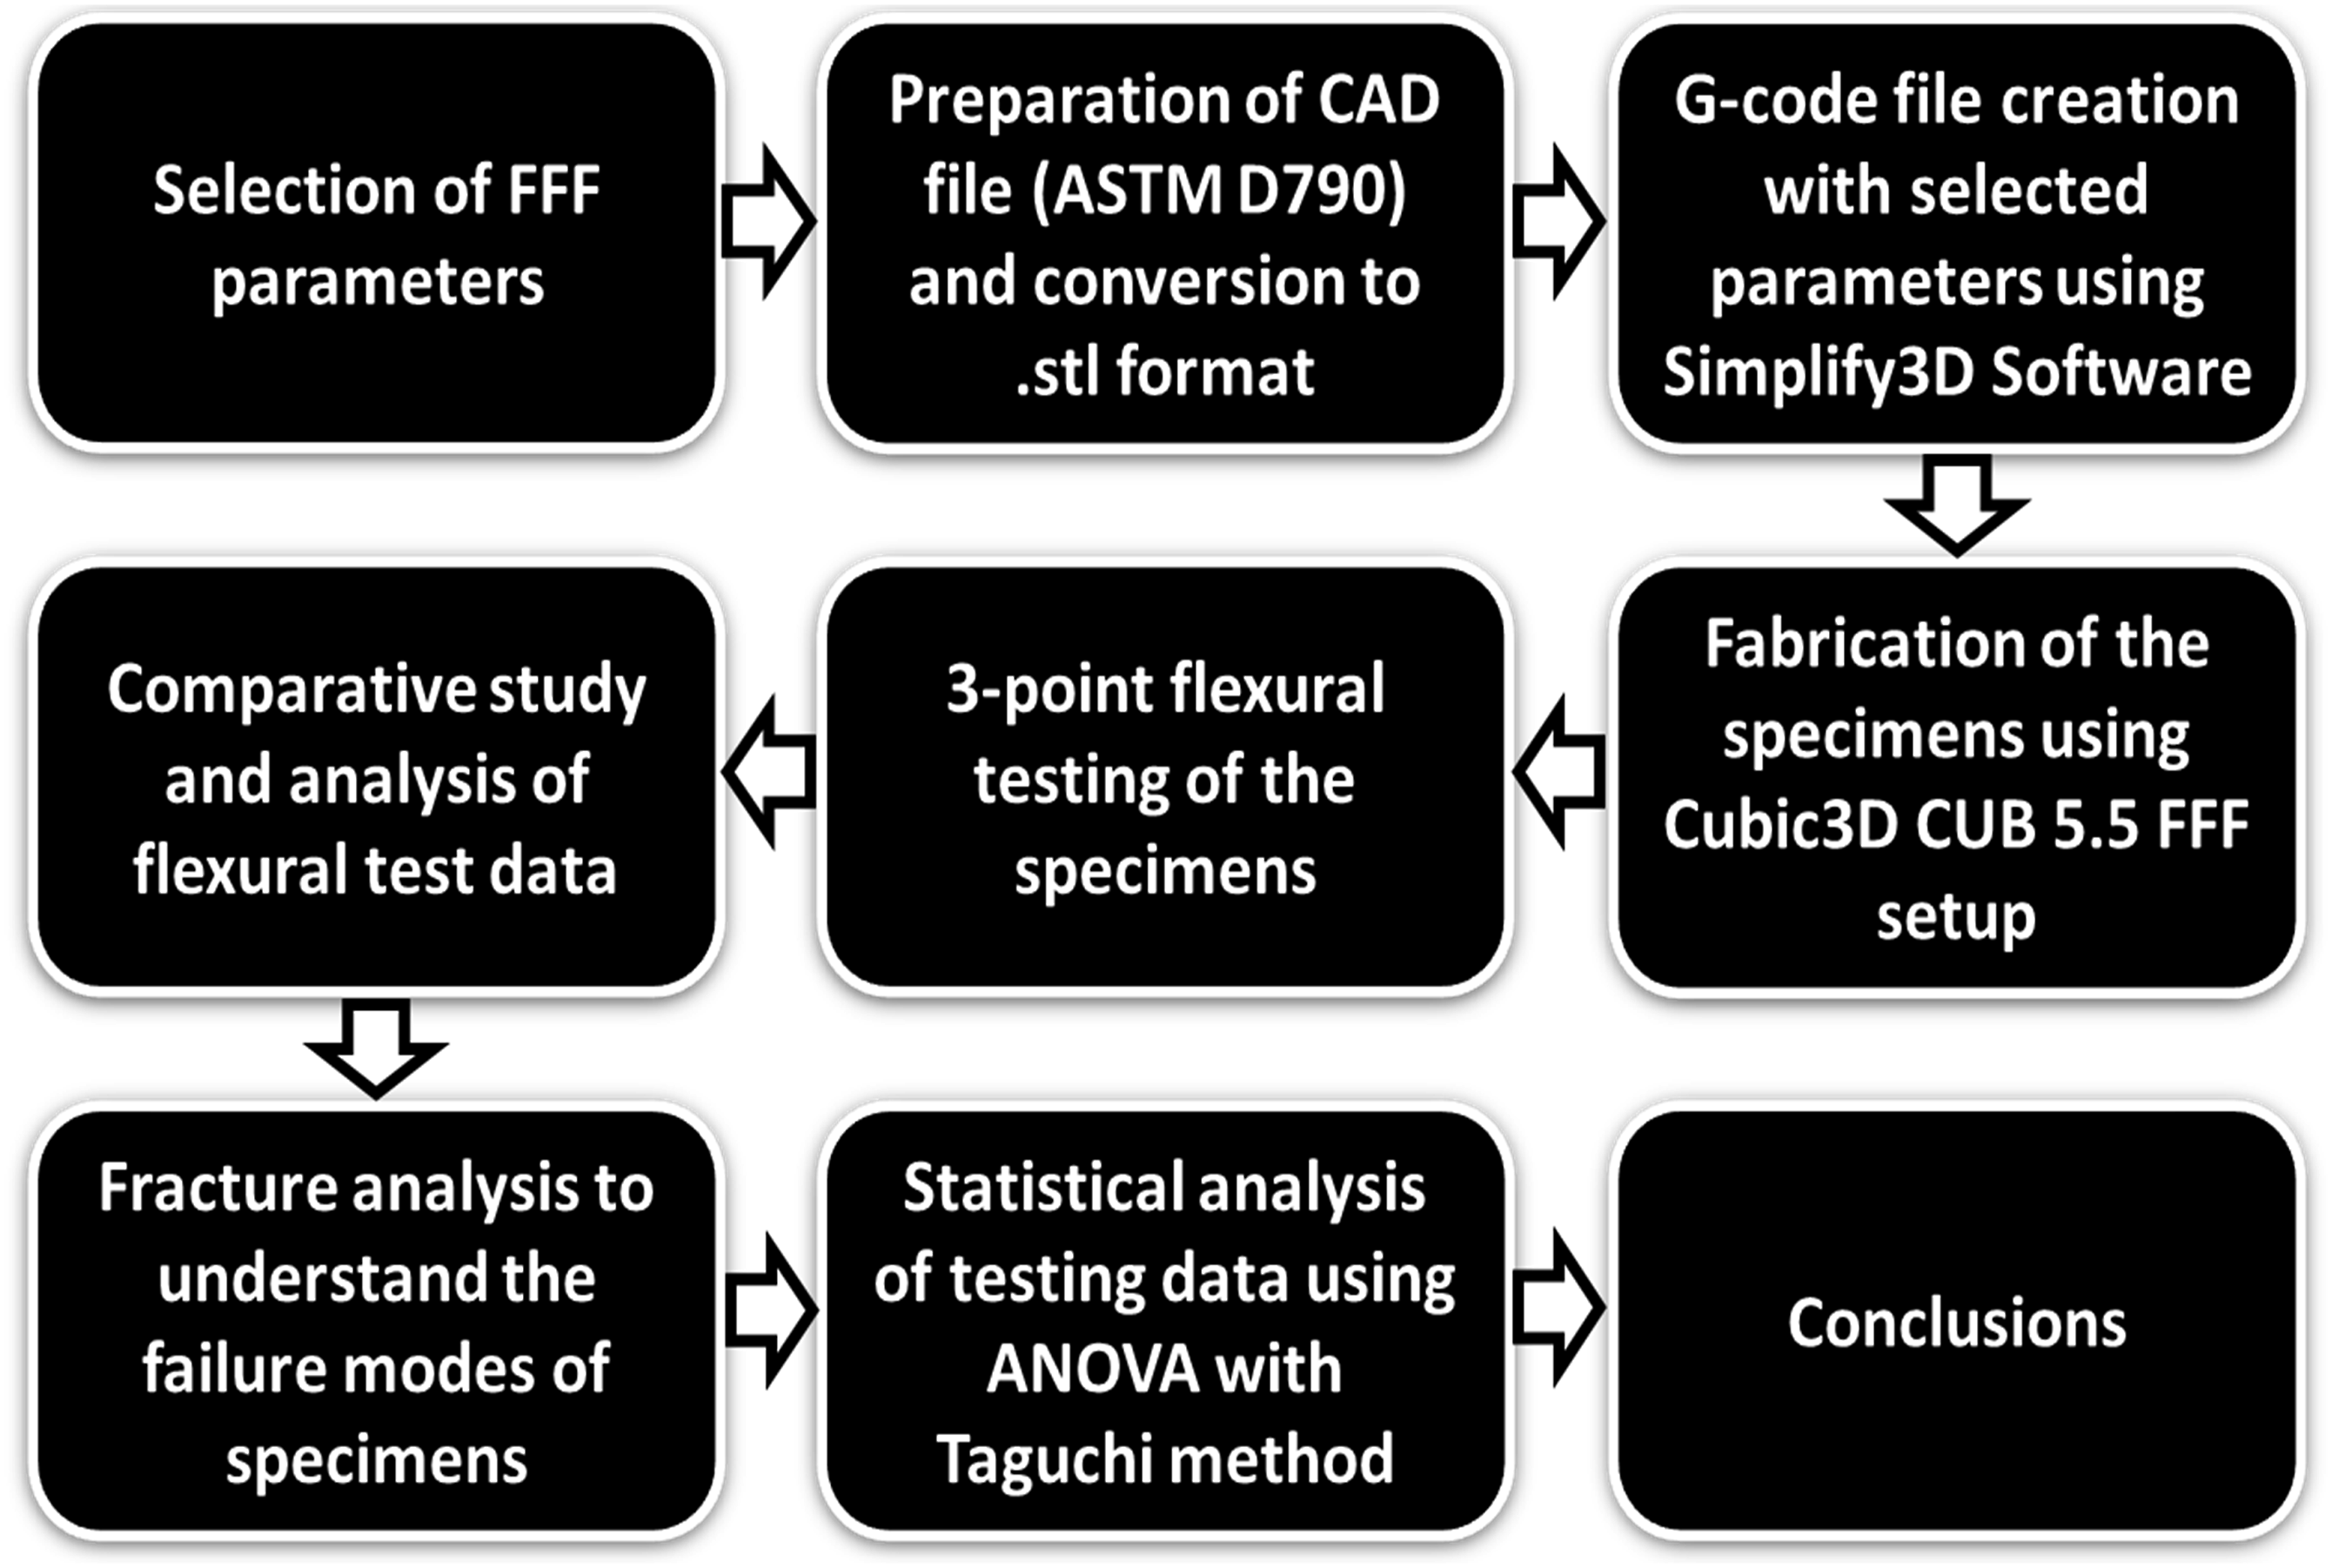
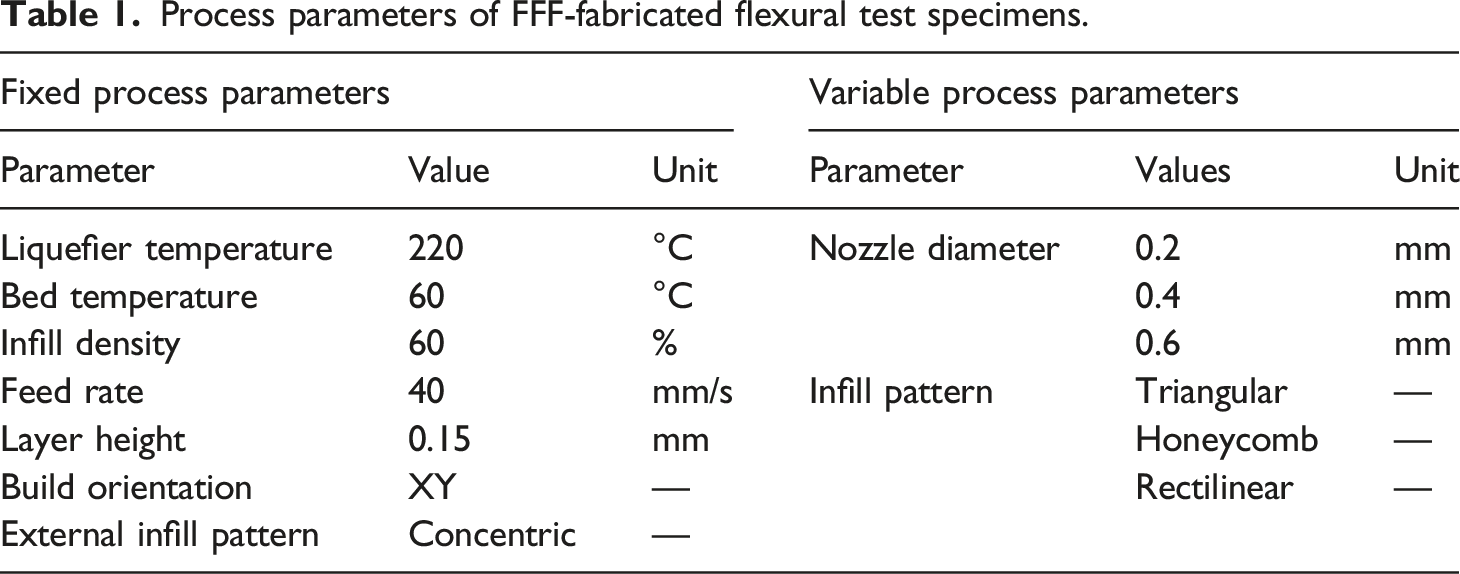
In FFF process, the nozzle extruded the fused filament material and could move parallel with respect to the horizontal build platform. The build platform offers the downward movement while placing a layer and the ability to traverse on to the succeeding layer once that layer is complete. Typical diameter for CFs employed in the creation of polymer composites are 6 μm and 210 μm in length, with an elastic modulus of around 232 GPa and a tensile strength of about 4.5 GPa. The 1.75 mm diameter filaments used in this experiment are CF-PLA (CF 20% by weight), CF-PETG (CF 20% by weight), and MWCNTs-PLA (MWCNTs 20% by weight). The results will improve our understanding of the material, which will be useful for future electrochemical energy storage systems. The Cubic3D CUB 5.5 FFF setup is utilised to shape the specimen. Software such as SOLIDWORKS 2019 and Simplify3D are employed to produce the ASTM D790 specimen (80 mm × 10 mm × 4 mm), Figure 1, with required FFF process parameters. For three-point flexural test, the 27 specimens are created utilising CF-PLA, CF-PETG, and MWCNTs-PLA with variations in the process parameters wiz ND (0.2 mm, 0.4 mm, and 0.6 mm) and IP (Triangular, Honeycomb, Rectilinear). Figure 2 illustrates the complete methodology of the present investigation. The selected infill patterns for experimental work are mentioned in Figure 3. ASTM D790 specimen (a) CAD Model (b) Fabricated specimen (c) Tested specimen. Methodology adopted for the current investigation. Selected infill patterns for experimental work.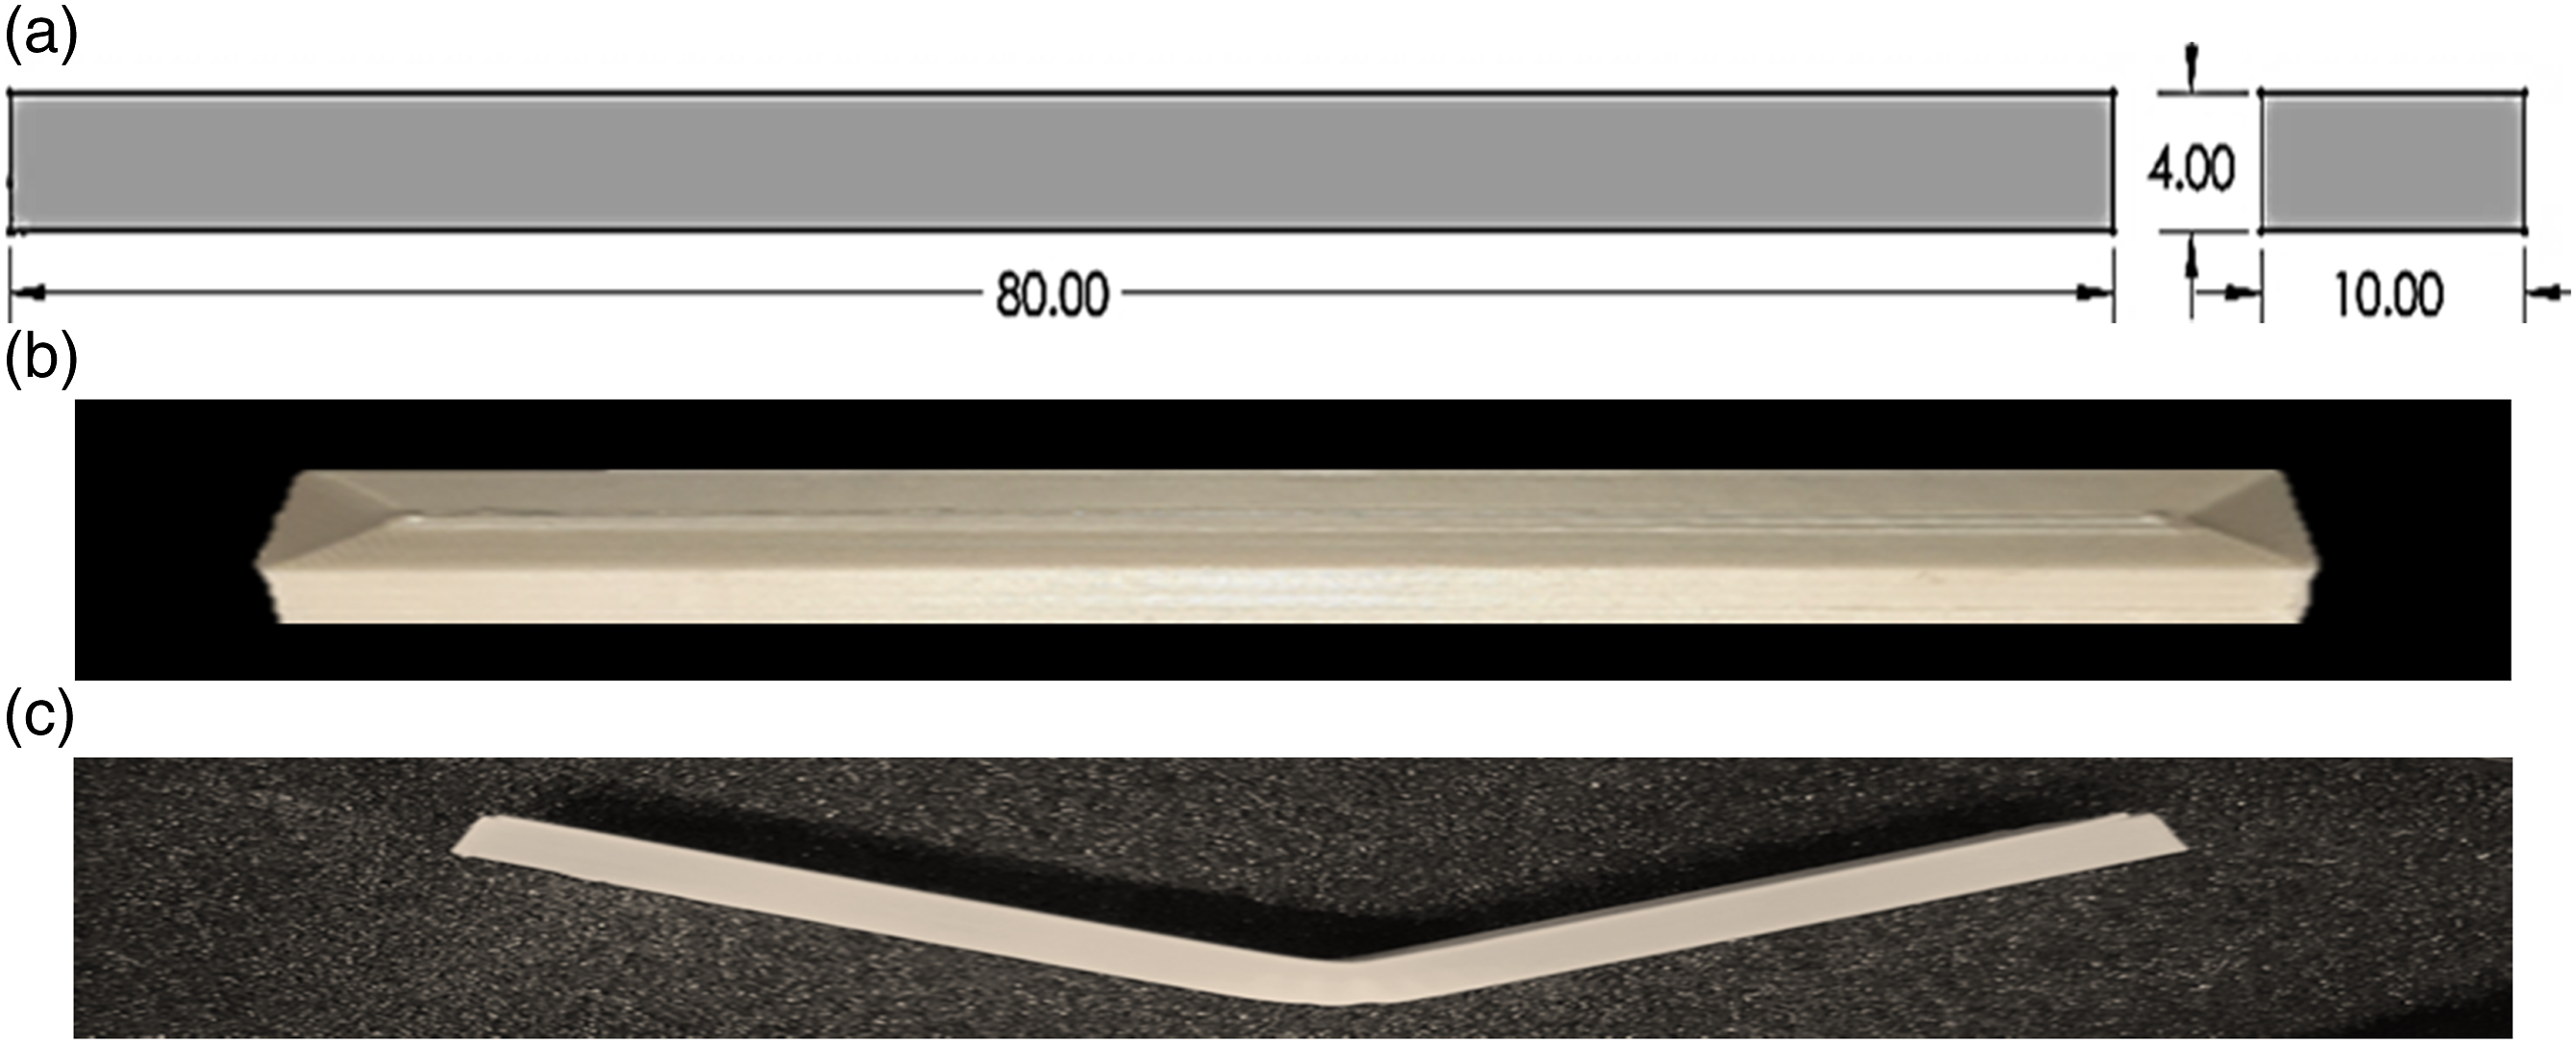
Process parameters of FFF-fabricated flexural test specimens.
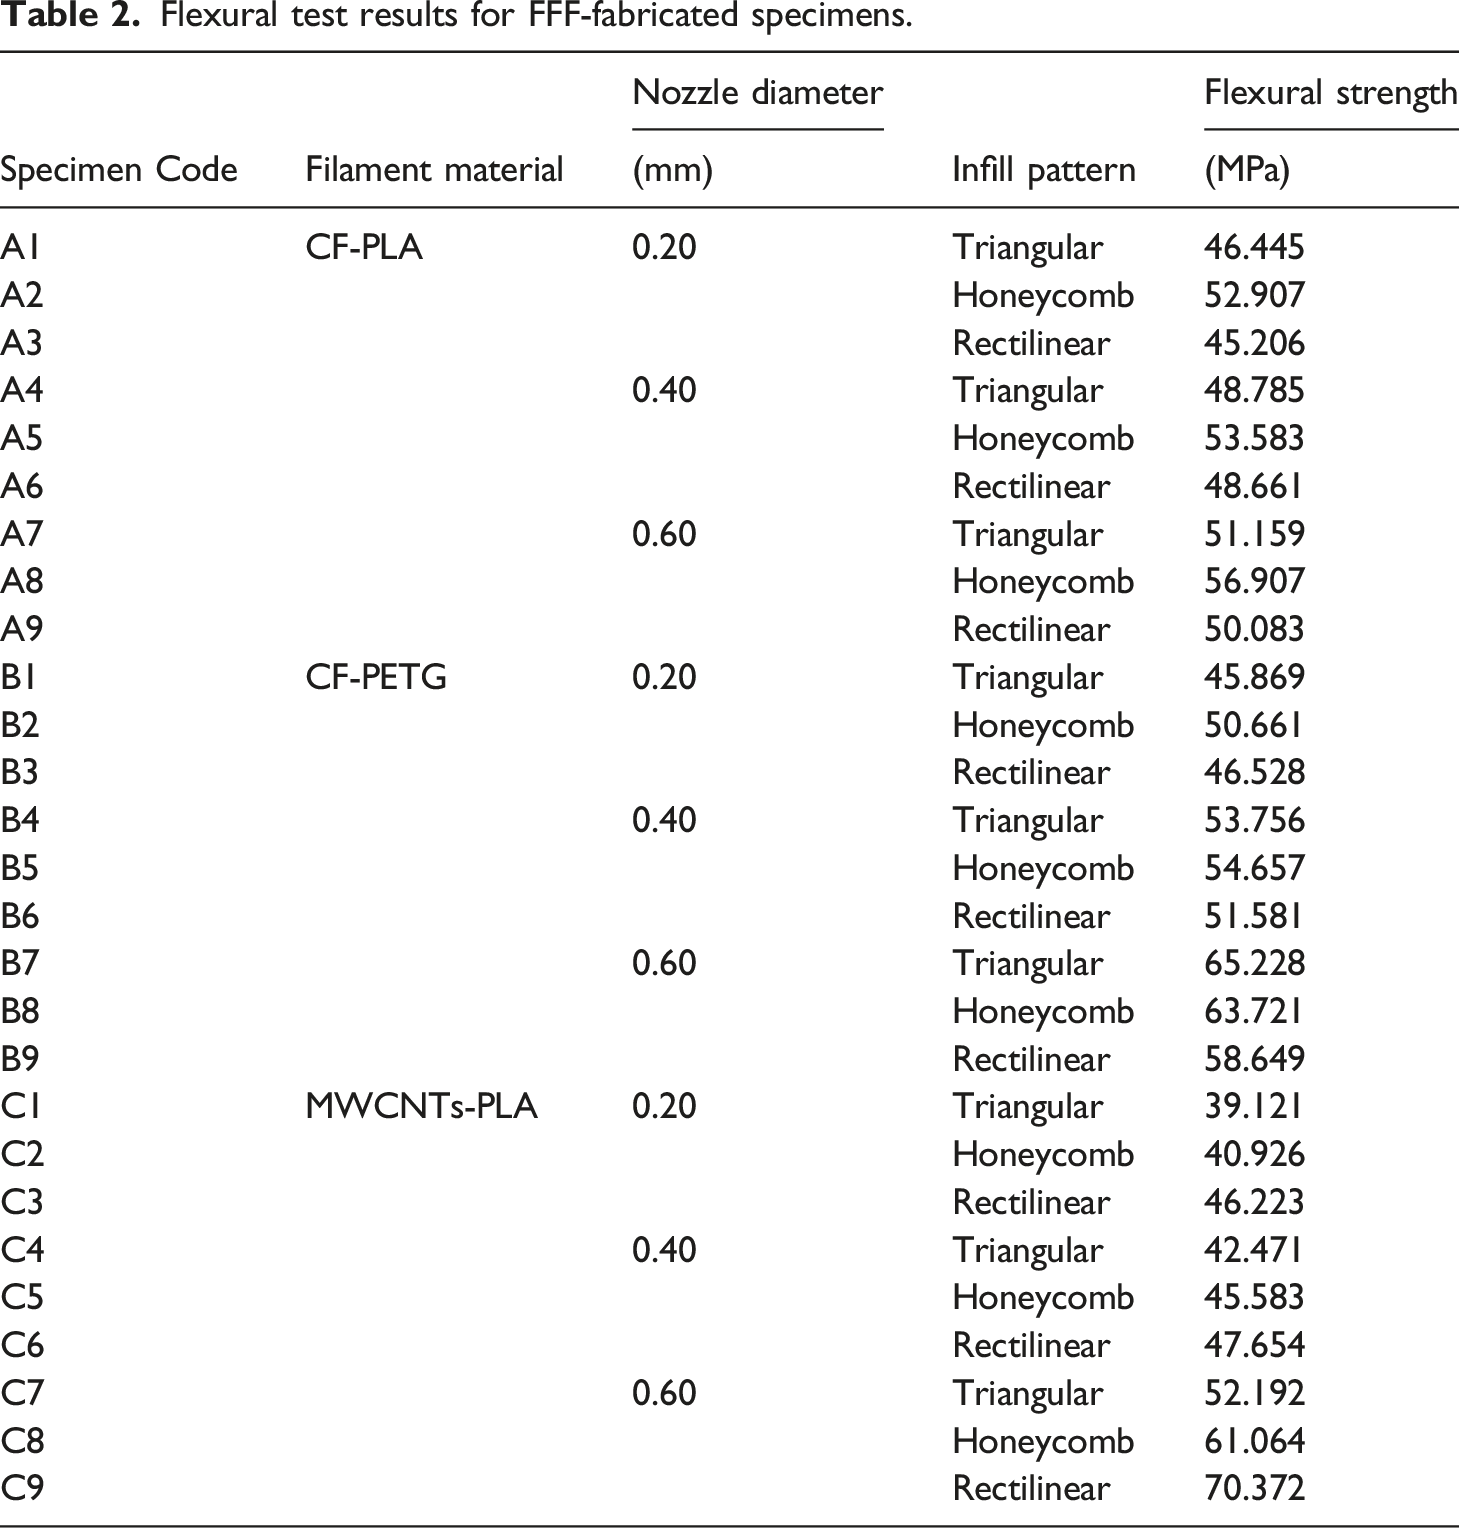
An Instron 1195 with a 100 kN maximum capacity was used for the flexural testing with support span of 64 mm. It is a screw-driven machine. The schematic diagram of three-point flexural test is shown in Figure 4. The flexural test data for CF-PLA, CF-PETG, and MWCNTs-PLA specimens are shown in Table 2 along with variations in the process parameters. Analyses and comparisons are made regarding the impact of process parameters and fabrication materials. To analyse the failure morphology of the specimens for a particular filament material, specimens with maximum and minimum flexural strength are examined. In order to investigate the relationship between mechanical characteristics and altering process variables, the flexural test data is analysed using Taguchi method with ANOVA. Schematic diagram of three-point flexural test. Flexural test results for FFF-fabricated specimens.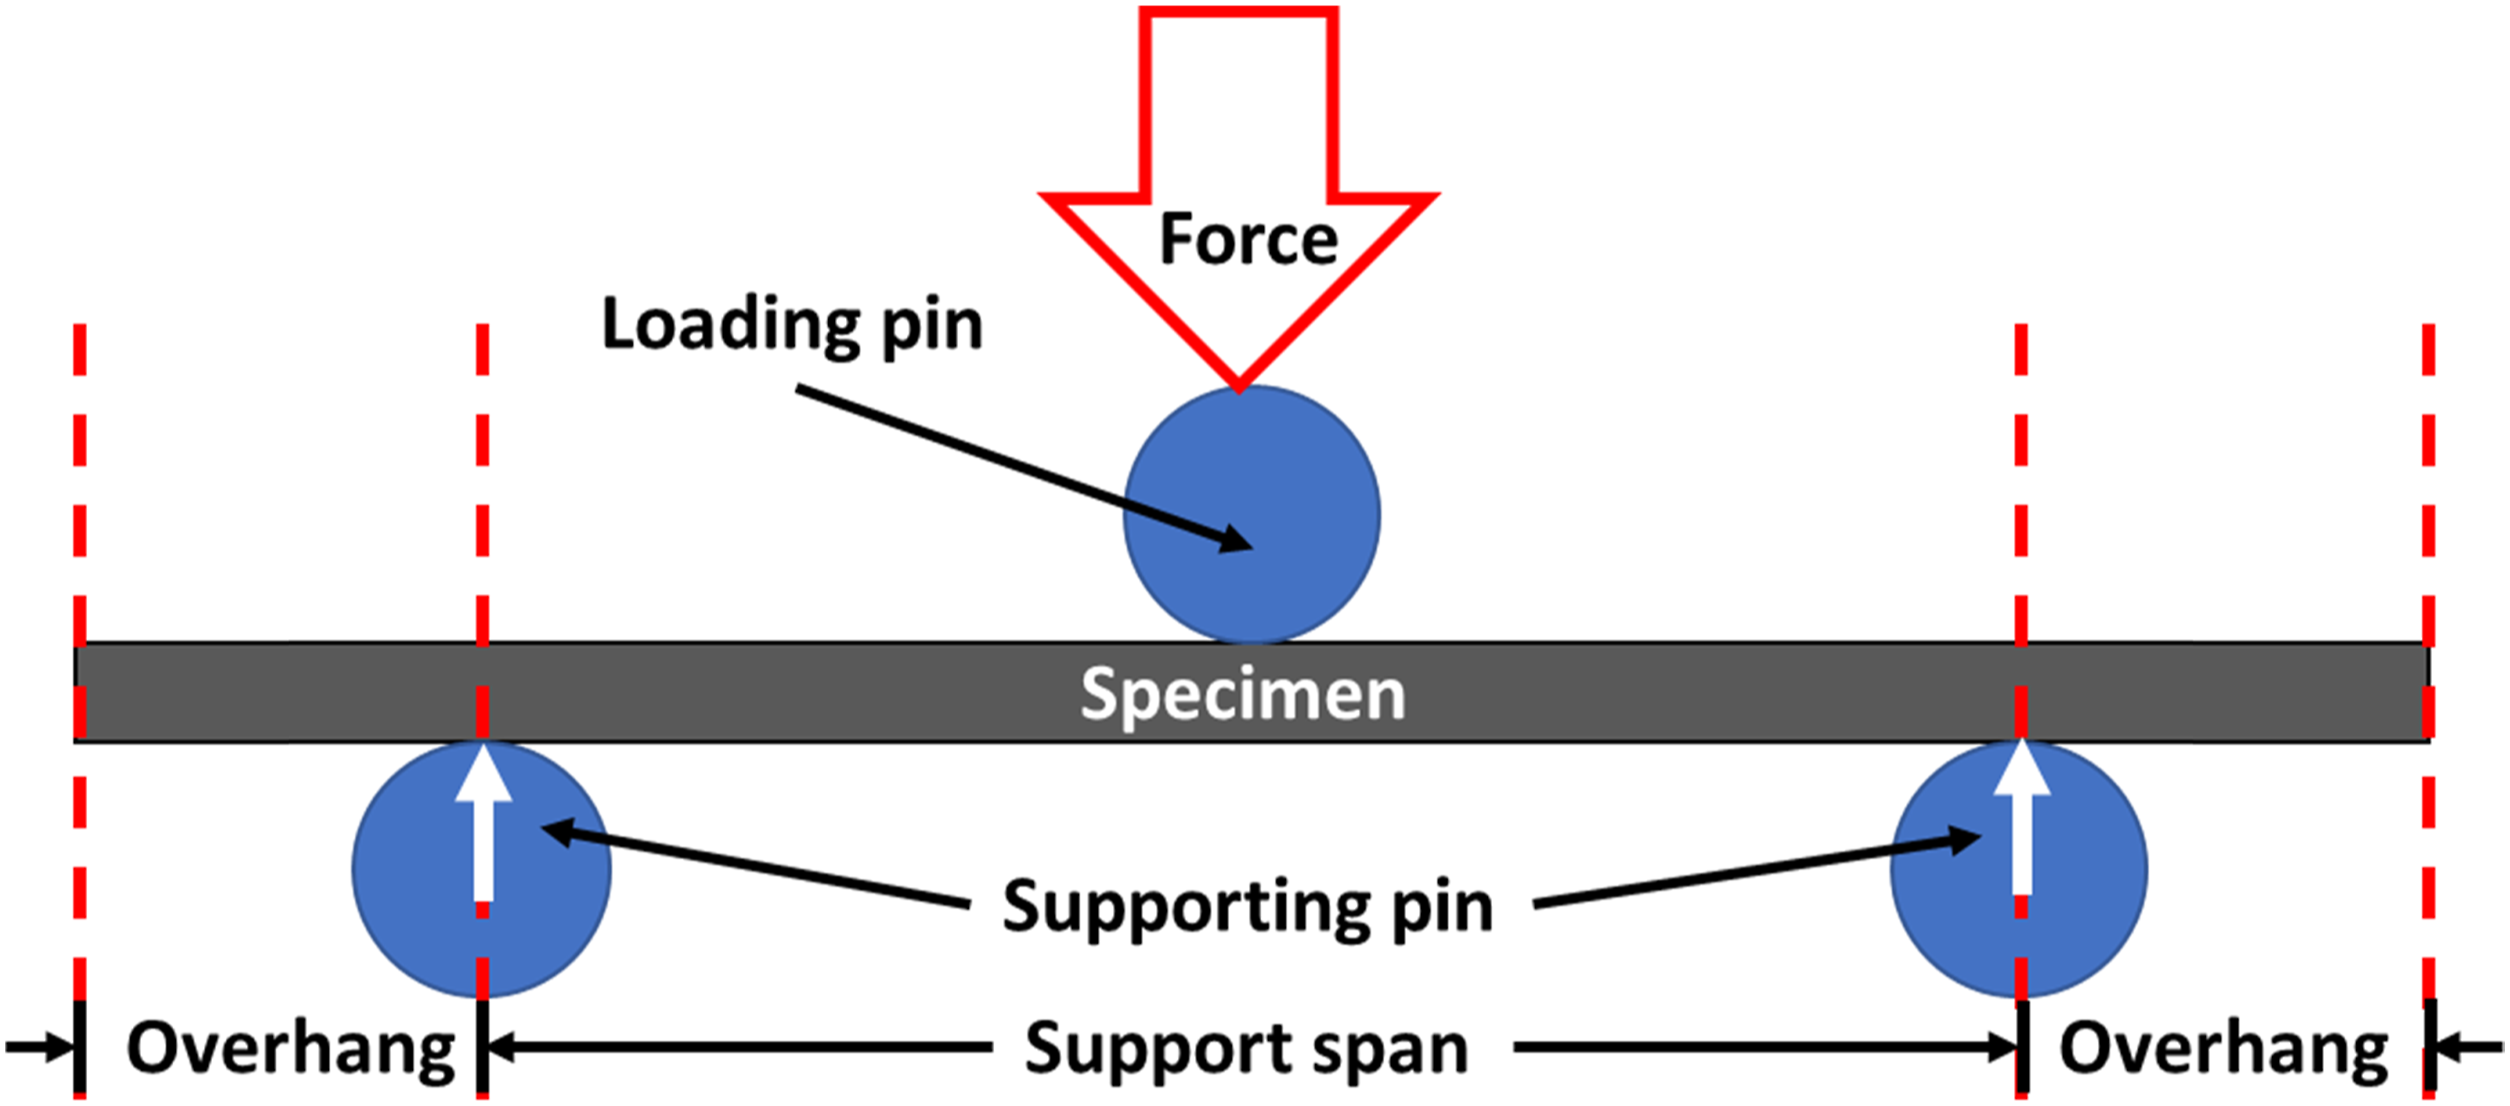
Result and discussion
A total of 27 specimens are examined, each representing a unique combination of the given process factors viz ND (0.2 mm, 0.4 mm, 0.6 mm) and IP (Triangular, Honeycomb, Rectilinear) using the CF-PLA, CF-PETG and MWCNTs-PLA as fabricating filament material, Table 2.
Effect of nozzle diameter
In this experiment three values of ND are utilized viz 0.2 mm, 0.4 mm and 0.6 mm. The potential layer height and, in turn, indirectly the fabricating speed are both determined by ND. In essence, it concerns how quickly and how much filament material can be extruded. In the below section, the comparison of flexural strength takes place at different NDs for a particular IP.
CF-PLA
Figure 5 depicts the stress versus strain curves for CF-PLA flexural test specimens at various IP. For triangular IP, the flexural strength achieved for specimen A1 is 46.445 MPa at ND 0.2 mm which is enhanced by 5.04% and 10.15% on increasing the ND to 0.4 mm (48.785 MPa, A4) and 0.6 mm (51.159 MPa, A7), respectively, Figure 5(a). For honeycomb IP, the flexural strength achieved for specimen A2 is 52.907 MPa at ND 0.2 mm which is increased by 1.28% and 7.56% on increasing the ND to 0.4 mm (53.583 MPa, A5) and 0.6 mm (56.907 MPa, A8), respectively, Figure 5(b). For rectilinear IP, the flexural strength achieved for specimen A3 is 45.206 MPa at ND 0.2 mm which is enhanced by 7.64% and 10.79% on increasing the ND to 0.4 mm (48.661 MPa, A6) and 0.6 mm (50.083 MPa, A9), respectively, Figure 5(c). The flexural behaviour of the CF-PLA specimens is enhanced on increasing the ND because it increases the bonding area between the adjacent rasters while other process parameters are maintained at constant value. Also, these strength values depend on delamination and separation of rasters during failure. Stress strain curves for CF-PLA specimens at different IP (a) Triangular (b) Honeycomb (c) Rectilinear.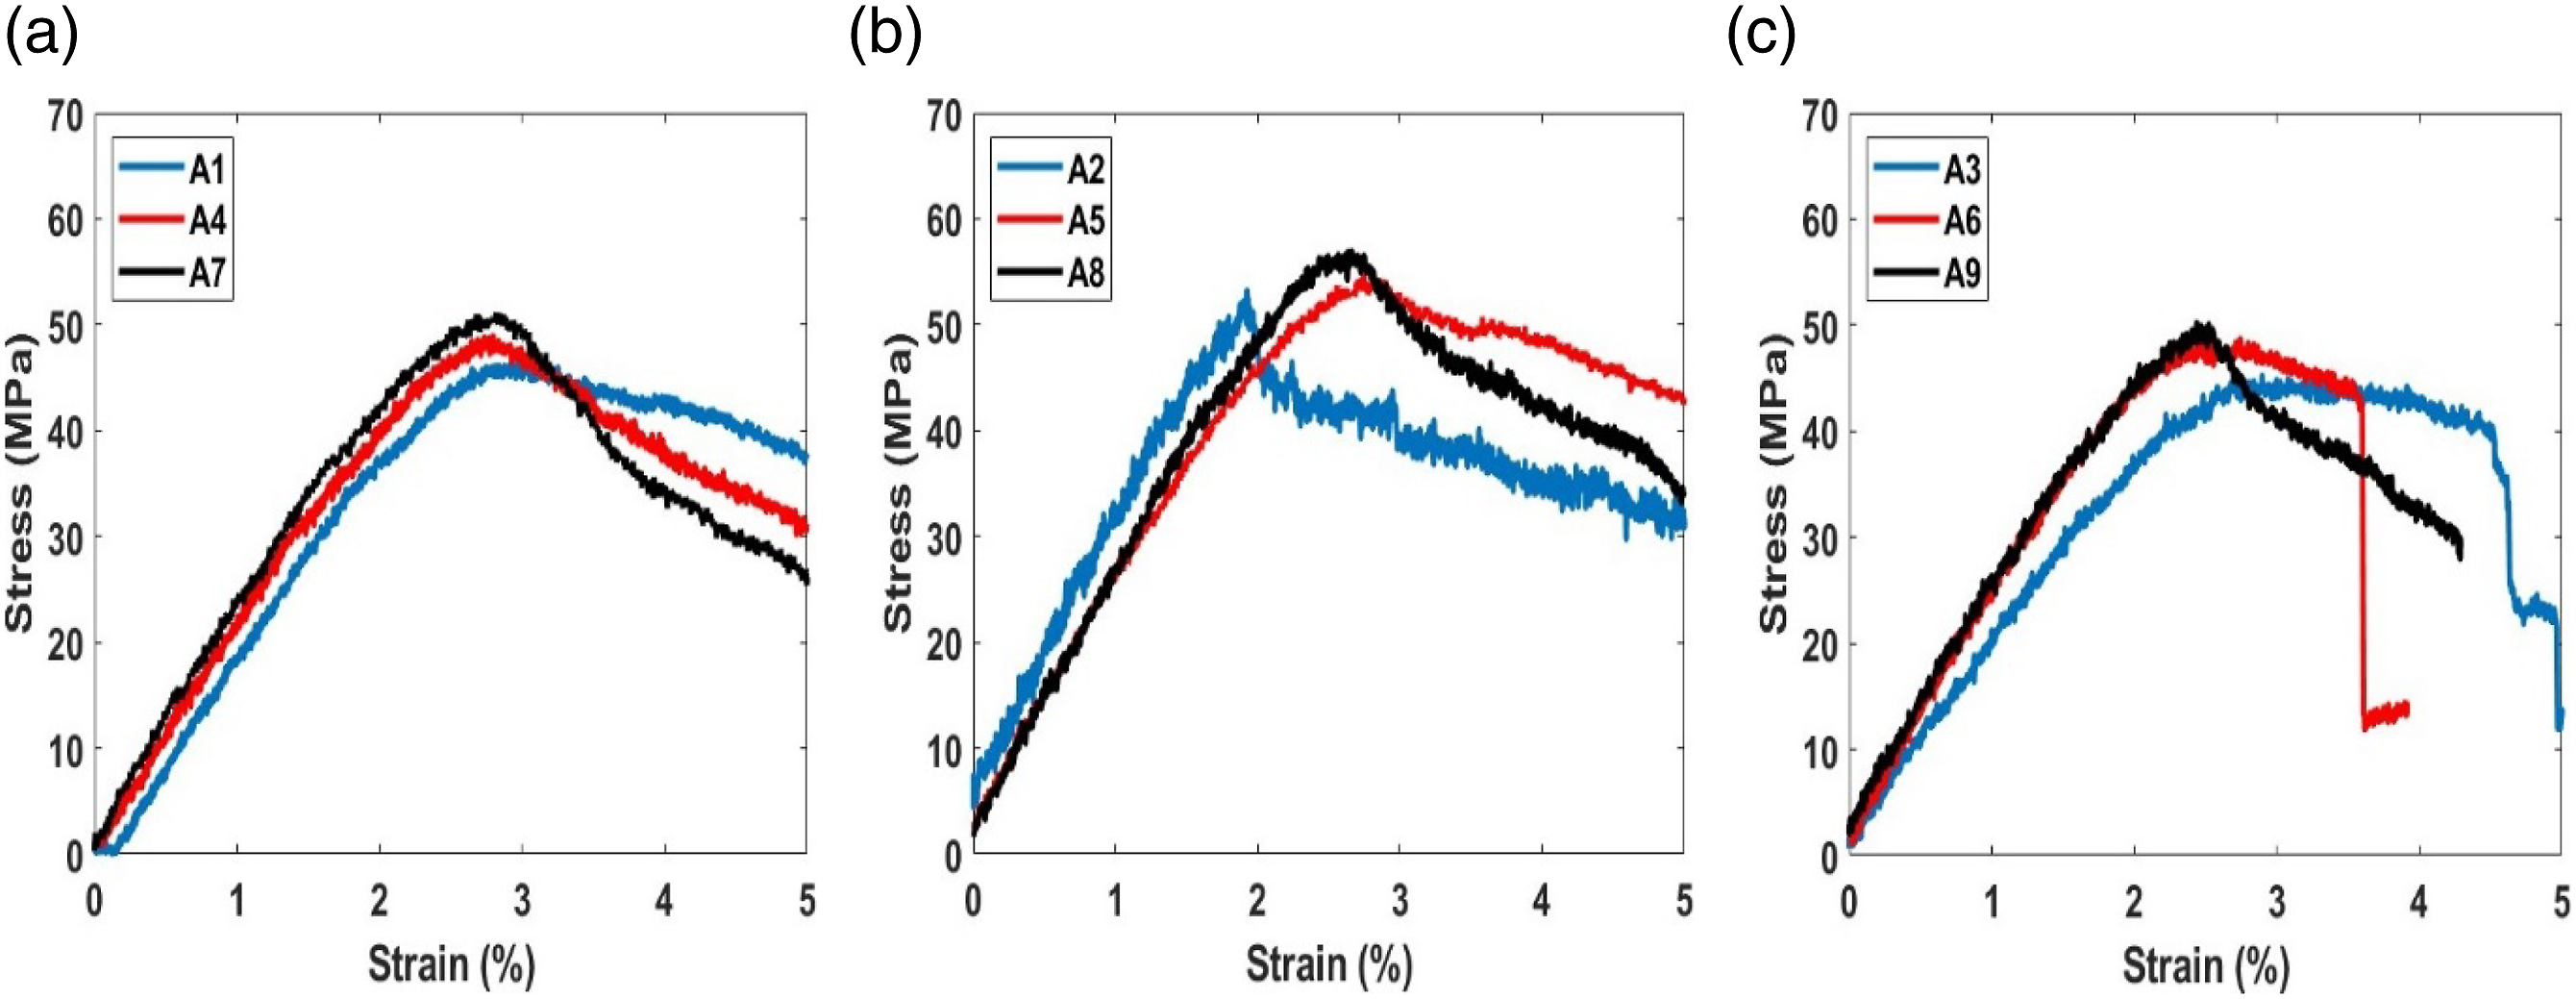
CF-PETG
The stress strain curves for CF-PETG flexural test specimens at various IP are shown in Figure 6. The flexural strength for honeycomb IP is 50.661 MPa for specimen B2 at ND 0.2 mm, and it improved by 7.89% and 25.78% when the ND increased to 0.4 mm (54.657 MPa, B5) and 0.6 mm (63.721 MPa, B8), respectively, Figure 6(b). The flexural strength for rectilinear IP is 46.528 MPa for specimen B3 at ND 0.2 mm, and it enhanced by 10.86% and 26.05% when the ND increased to 0.4 mm (51.581 MPa, B6) and 0.6 mm (58.649 MPa, B9), respectively, Figure 6(c). Due to the poor raster-to-raster bonding, the flexural strength for triangular IP is less than honeycomb and rectilinear, 45.869 MPa for specimen B1 at ND 0.2 mm and it improved by 17.19% and 42.20% when the ND increased to 0.4 mm (53.756 MPa, B4) and 0.6 mm (65.228 MPa, B7), respectively, Figure 6(a). The increase in ND improves the CF-PETG specimens’ flexural strength because of high degree of fusion, with only a few well-distributed voids. Stress strain curves for CF-PETG specimens at different IP. (a) Triangular (b) Honeycomb (c) Rectilinear.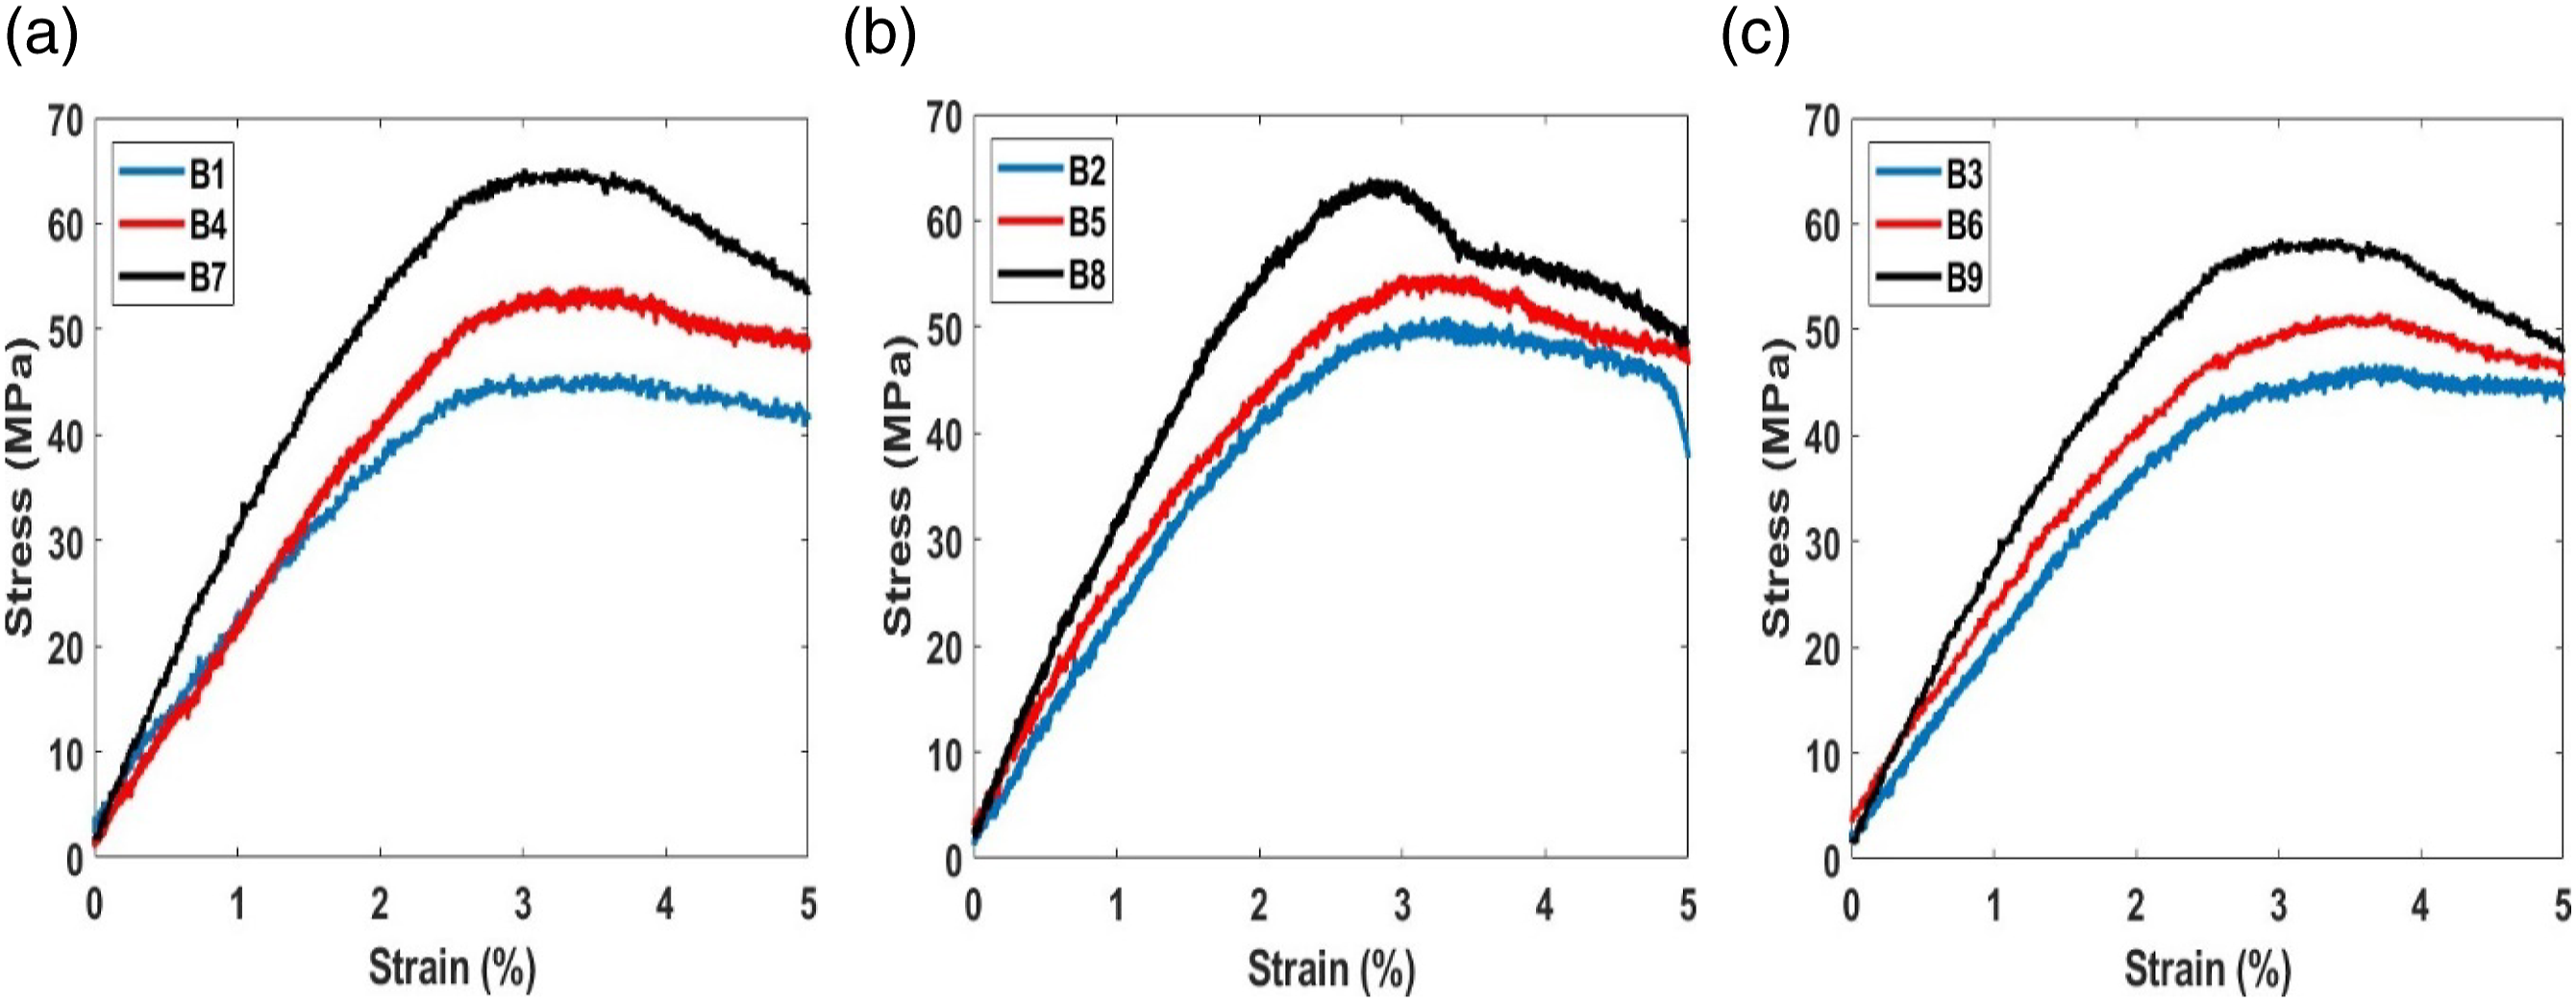
MWCNTs-PLA
The flexural strength achieved for specimen C3 is 46.223 MPa at ND 0.2 mm, and it improved by 3.10% and 52.24% on increasing the ND to 0.4 mm (47.654 MPa, C6) and 0.6 mm (70.372 MPa, C9), respectively for rectilinear IP, Figure 7(c). For triangular IP, due to weak connection between adjacent rasters, the flexural strength achieved for specimen C1 is 39.121 MPa at ND 0.2 mm, and it enhanced by 8.56% and 33.41% on increasing the ND to 0.4 mm (42.471 MPa, C4) and 0.6 mm (52.192 MPa, C7), respectively, Figure 7(a). The flexural strength achieved for specimen C2 is 40.926 MPa at ND 0.2 mm, and it improved by 11.38% and 49.21% on increasing the ND to 0.4 mm (45.853 MPa, C5) and 0.6 mm (61.064 MPa, C8), respectively for honeycomb IP, Figure 7(b). Since, it increases specific gravity of fabricated specimens with the increment in the ND while maintaining the other process variables constant, an increase in ND increases the flexural strength of the MWCNTs-PLA specimens. Figure 7 illustrates the stress-strain curves for MWCNTs-PLA flexural test specimens at various IP. Stress strain curves for MWCNTs-PLA specimens at different IP. (a) Triangular (b) Honeycomb (c) Rectilinear.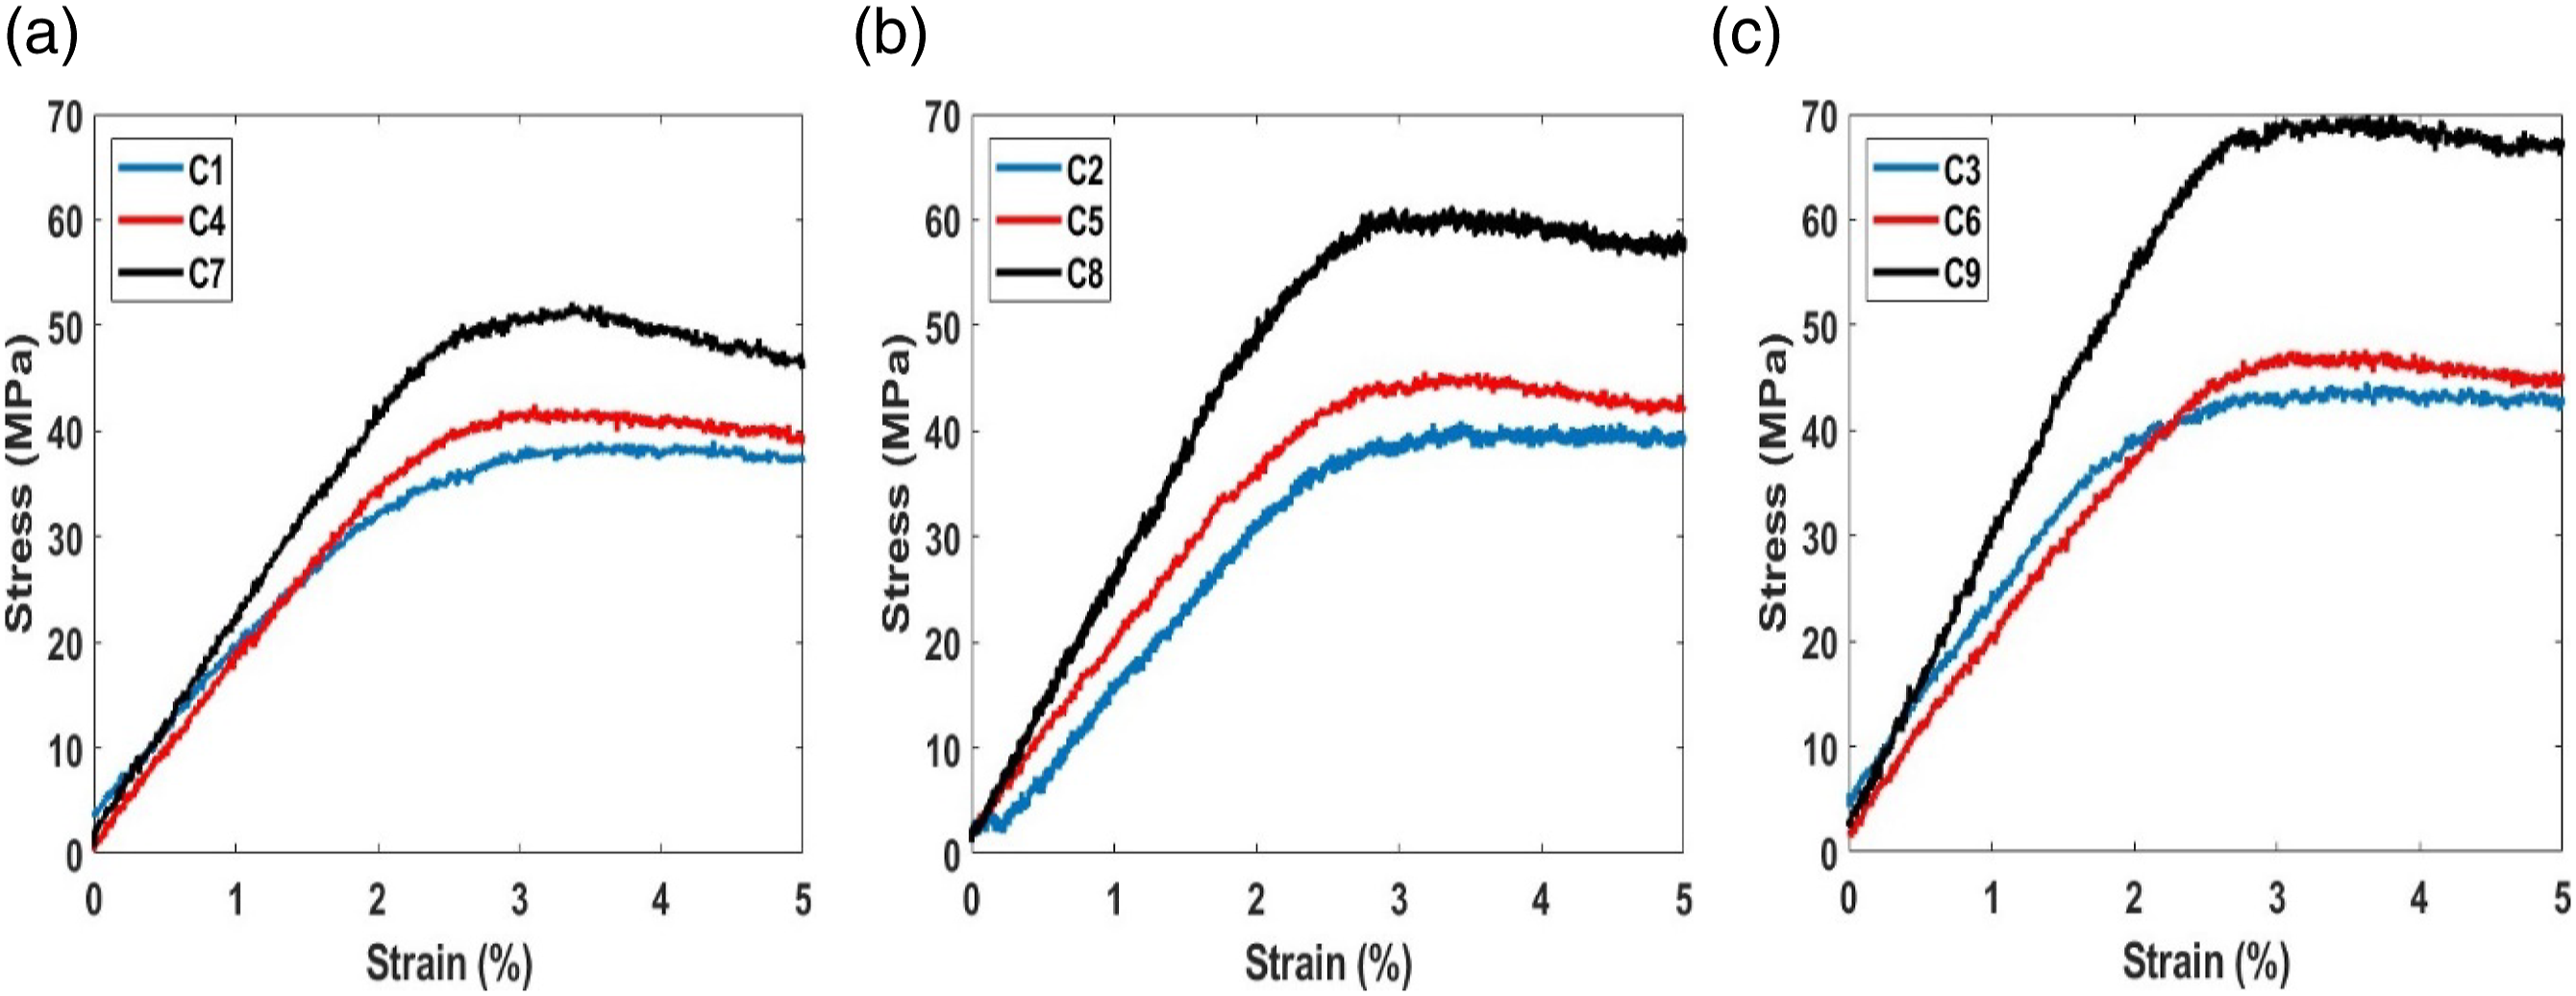
For a same value of the other process parameters, increasing the ND enhances the specimens' flexural strength. Weak horizontal linkages are created because of the narrow nozzle hole, which allows for the production of in-plane adjacent infill that barely touches. An increase in ND improves interlayer bonding by increasing pressure for a given height, leading to greater material deposition and narrower interlayer gaps and, in turn, greater specimen flexural strength. The findings demonstrate that, despite the lack of a linear association, larger nozzle hole diameters improved the flexural strength of the specimen.
Effect of infill pattern
The IP can be produced using a variety of geometries. IP is a noteworthy process variable in the FFF process. In the present work, three IPs viz triangular, honeycomb and rectilinear are employed. The comparison of flexural strength for a specific ND is done in the section below for various IPs.
CF-PLA
Since there is weak bonding of rasters, the flexural strength achieved for specimen A3 is 45.206 MPa for rectilinear IP and it improved by 17.04% and 2.74% on changing the IP to honeycomb (52.907 MPa, A2) and triangular (46.445 MPa, A1), respectively at ND 0.2 mm, Figure 8(a). Figure 8 depicts the stress strain curves for CF-PLA flexural test specimens for different ND. The specimen A6 exhibited the flexural strength of 48.661 MPa for rectilinear IP, and it enhanced by 0.25% and 10.11% on changing the IP to triangular (48.785 MPa, A4) and honeycomb (53.583 MPa, A5), respectively at ND 0.4 mm, Figure 8(b). The specimen A9 unveiled the flexural strength of 50.083 MPa for rectilinear IP, and it enhanced by 2.15% and 13.63% on changing the IP to triangular (51.159 MPa, A7) and honeycomb (56.907 MPa, A8), respectively at ND 0.6 mm, Figure 8(c). For CF-PLA specimens, the maximum flexural strength 56.907 MPa (A8) is achieved for honeycomb IP at ND 0.6 mm due to strong bonding between adjacent rasters and honeycomb IP’s hexagonal tiling offers comparatively higher flexural characteristics because its force distribution allows it to flow more fluently and less concentrate in the linkage chain. The minimum flexural strength 45.206 MPa (A3) is accomplished for rectilinear IP at ND 0.2 mm. Stress strain curves for CF-PLA specimens at different ND (a) 0.2 mm (b) 0.4 mm (c) 0.6 mm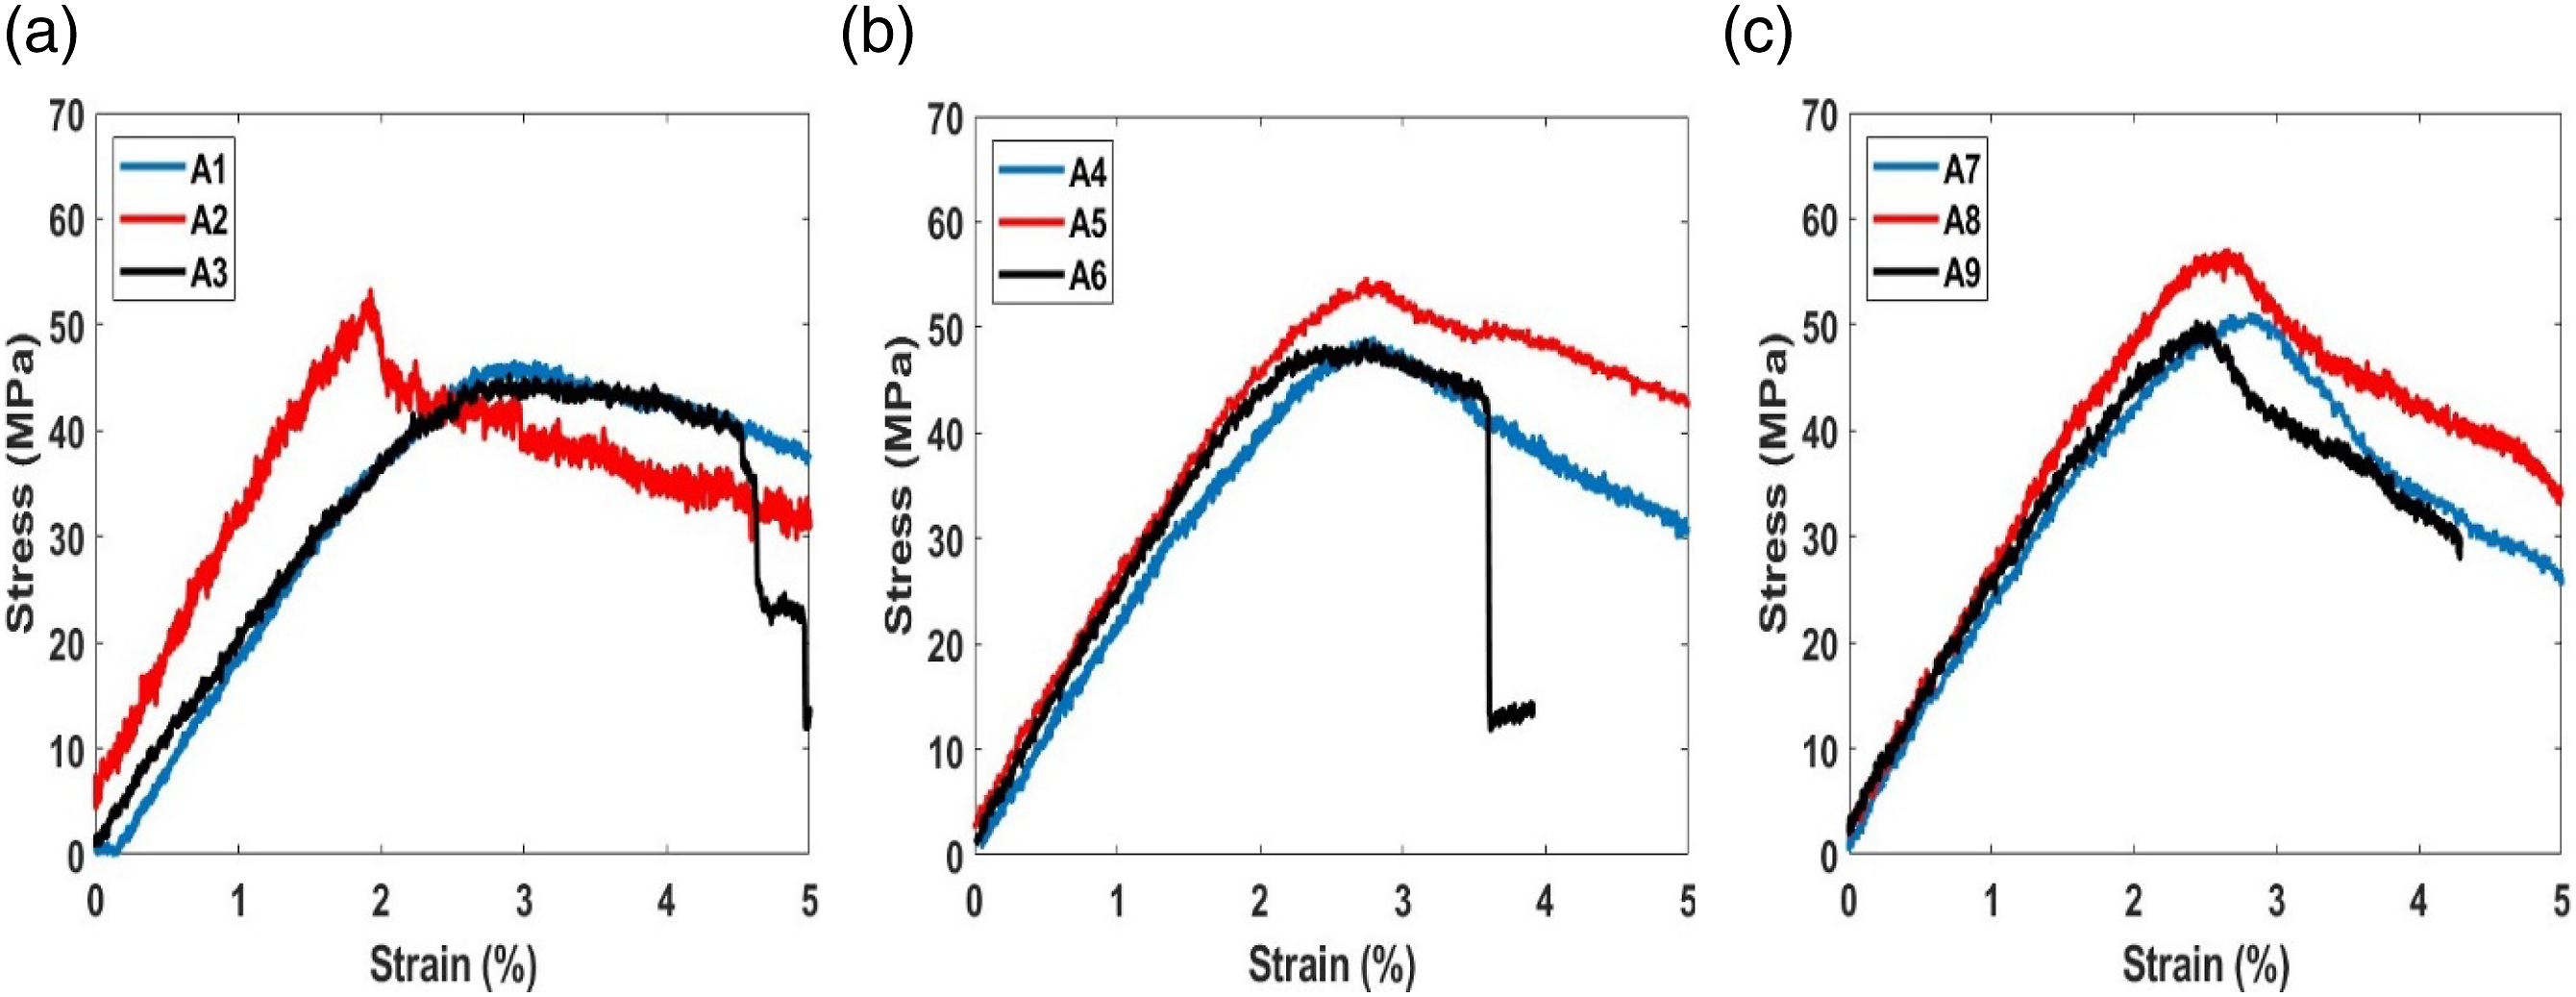
CF-PETG
At ND 0.4 mm, the flexural strength achieved for specimen B6 is 51.581 MPa for rectilinear IP is enhanced by 5.96% and 4.22% on altering the IP to honeycomb (54.657 MPa, B5) and triangular (53.756 MPa, B4), respectively, Figure 9(b). At ND 0.6 mm, the flexural strength attained by specimen B9 is 58.649 MPa for rectilinear IP is enhanced by 11.22% and 8.65% on varying the IP to triangular (65.228 MPa, B7) and honeycomb (63.721 MPa, B8), respectively, Figure 9(c). For CF-PETG specimens, the lowest flexural strength 46.528 MPa (B3) achieved is for rectilinear IP at ND 0.2 mm and the highest flexural strength 65.228 MPa (B7) accomplished is for triangular IP at ND 0.6 mm. The stress strain curves for CF-PETG flexural test specimens at various ND are depicts in Figure 9. At ND 0.2 mm, the flexural strength of specimen B1 is 45.869 MPa for triangular IP with breaking and pullout of CFs, is heightened by 10.45% and 1.44% on altering the IP to honeycomb (50.661 MPa, B2) and rectilinear (46.528 MPa, B3), respectively, Figure 9(c). Stress strain curves for CF-PETG specimens at different ND. (a) 0.2 mm (b) 0.4 mm (c) 0.6 mm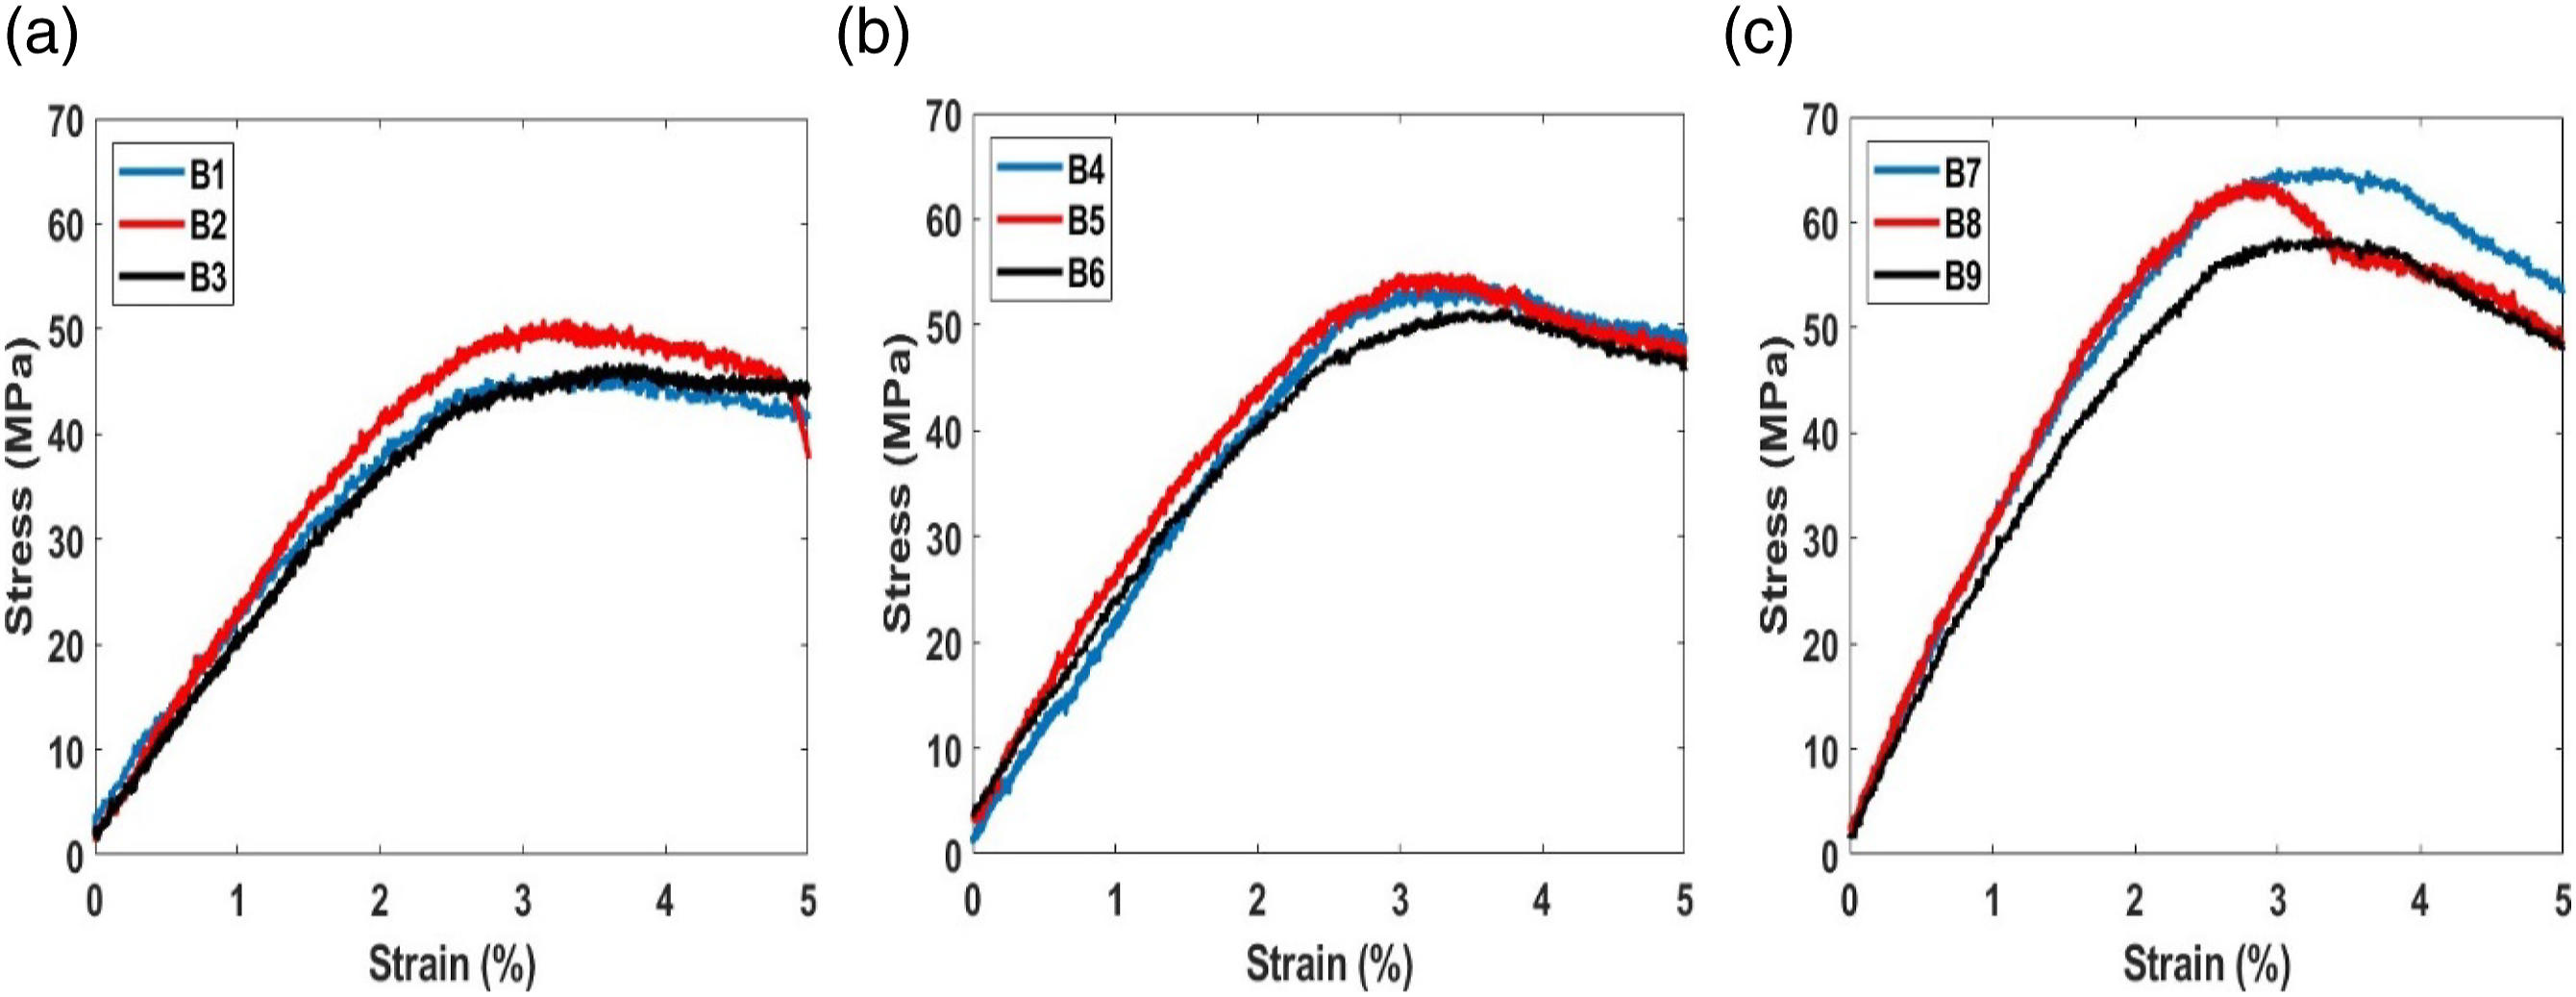
MWCNTs-PLA
For MWCNTs-PLA specimens, the maximum flexural strength 70.372 MPa (C9) is accomplished for rectilinear IP at ND 0.6 mm and minimum flexural strength 45.206 MPa (C1) is attained for triangular IP at ND 0.2 mm. Figure 10 illustrates the stress-strain curves for MWCNTs-PLA flexural test specimens at various ND. The flexural strength for specimen C7 is 52.192 MPa with triangular IP and it improved by 17.00% and 34.83% when the IP modified to rectilinear (70.372 MPa, C9) and honeycomb (61.064 MPa, C8), respectively, at ND 0.6 mm, Figure 10(c). The flexural strength for specimen C1 is 39.121 MPa with triangular IP because of the ductile failure of the specimen and it enhanced by 4.61% and 18.15% when the IP modified to honeycomb (40.926 MPa, C2) and rectilinear (46.223 MPa, C3), respectively, at ND 0.2 mm, Figure 10(a). The flexural strength for specimen C4 is 42.471 MPa with triangular IP and it upgraded by 12.00% and 7.33% when the IP altered to rectilinear (47.654 MPa, C6) and honeycomb (45.583 MPa, C5), respectively, at ND 0.4 mm, Figure 10(b). Stress strain curves for MWCNTs-PLA specimens at different ND. (a) 0.2 mm (b) 0.4 mm (c) 0.6 mm.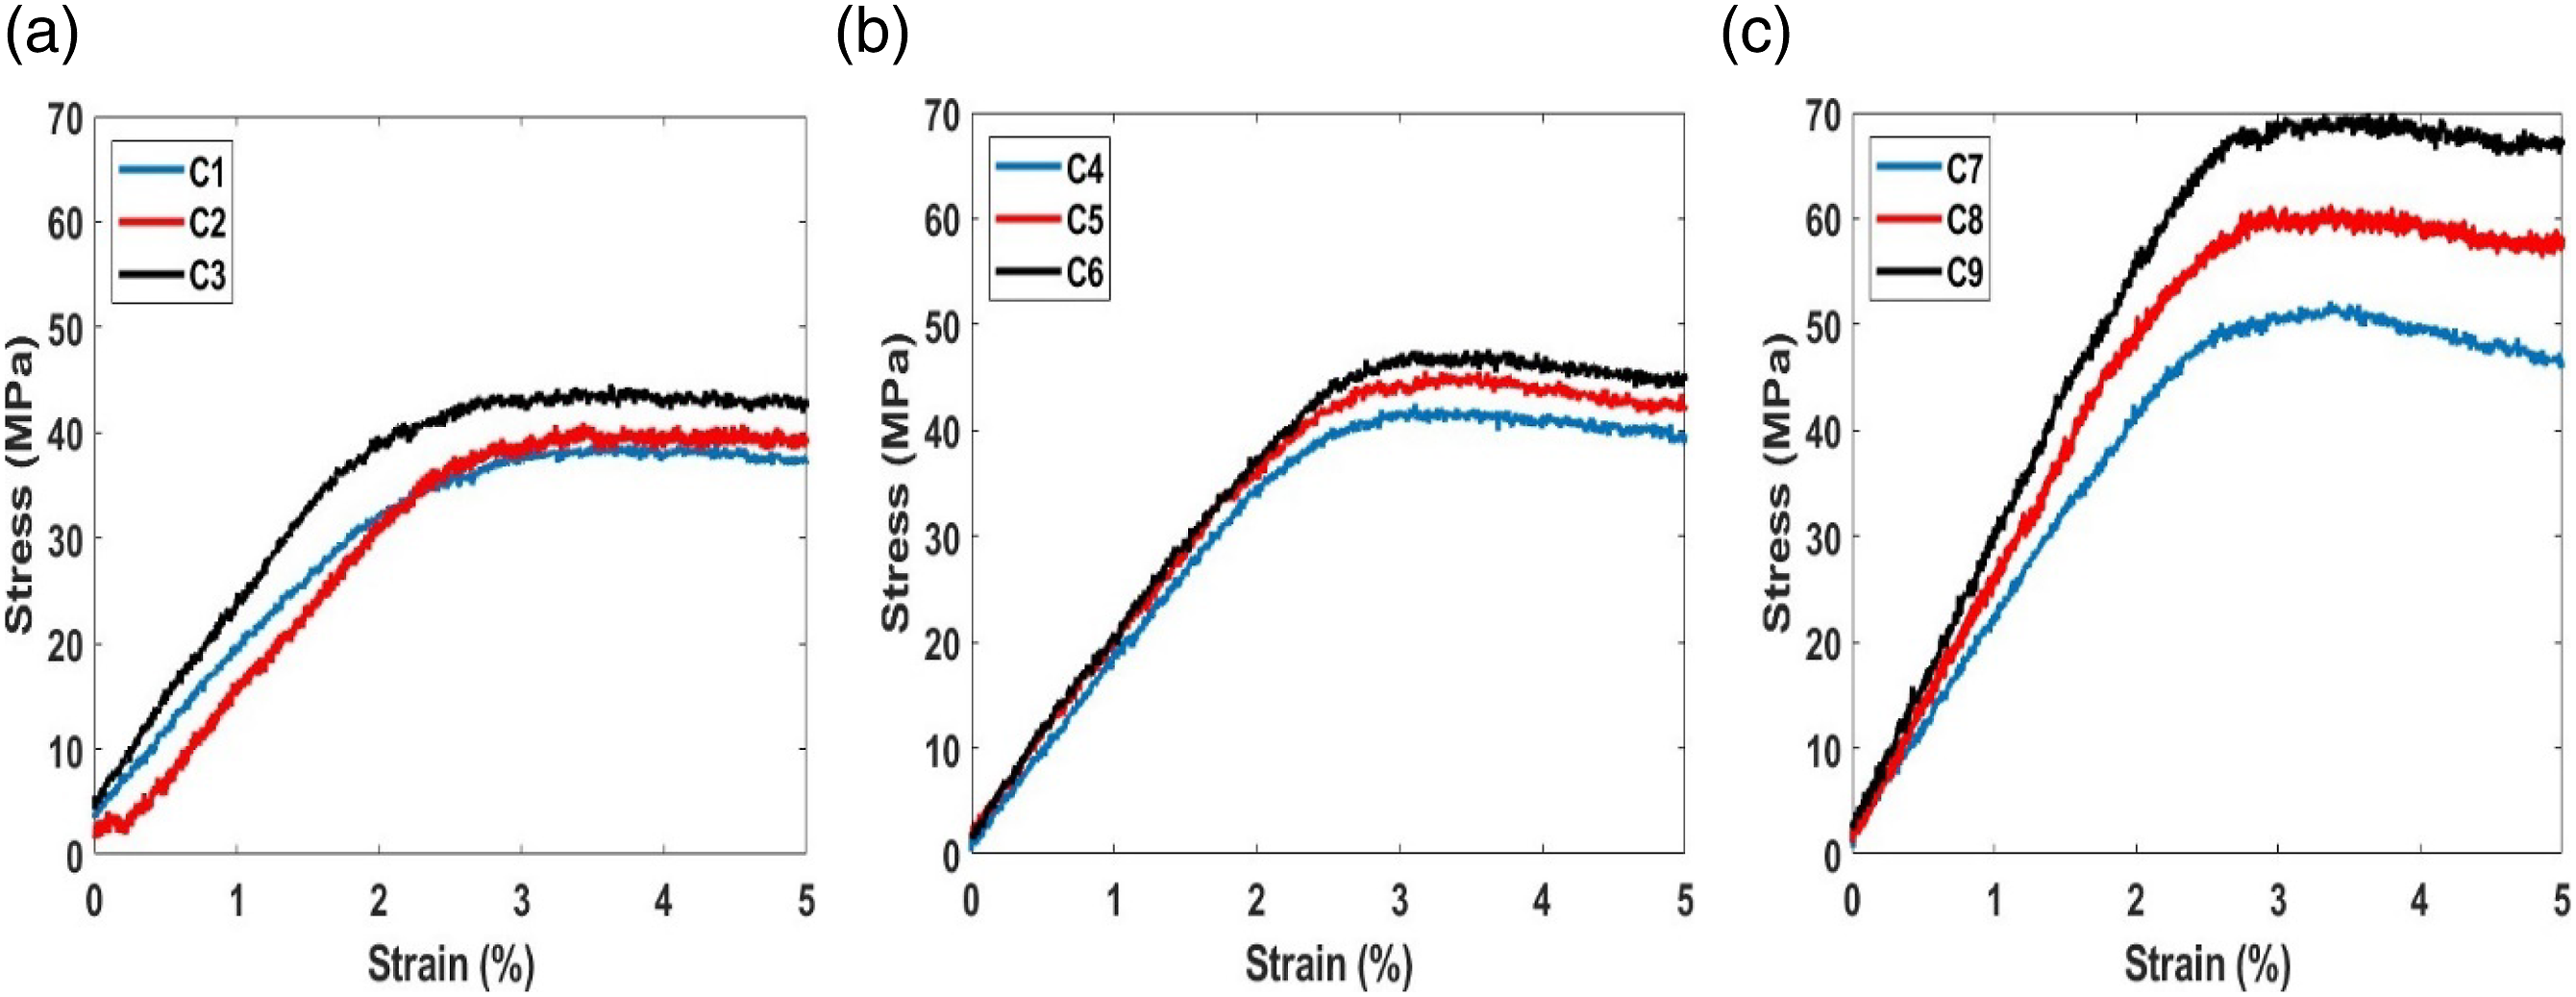
For same value of the other process variables, the flexural behaviour of the specimens depicts variation with the alteration of the IP. These patterns have a direct effect on the flexural properties of the FFF-fabricated parts because there are differences in the deformation among IPs, presenting diverse responses associated with the different internal geometric structure of the patterns.
Failure morphology
Fractography is carried out to determine the failure cause using micrography of the deformed surface of the tested flexural specimen.
CF-PLA
Figure 11 illustrates the fracture surfaces of CF-PLA specimen with minimum (A3) and maximum (A8) flexural strength. For specimen A3, the deformation is due to weak raster bonding as well as delamination and separation of rasters resulting in minimum flexural strength for the CF-PLA specimens, Figure 11(a). It depicts the ductile failure of the specimen with the flexural strength of 45.206 MPa at ND 0.2 mm and rectilinear IP. But the specimen A8 exhibits the maximum flexural strength of 56.907 MPa at ND 0.6 mm and honeycomb IP. Specimen A8 depicts the strong raster to raster bonding but individual raster rupture is main cause for the distortion, Figure 11(b). It also exemplifies the ductile failure of the specimen during the flexural loading. Deformed surface for the CF-PLA specimens with minimum and maximum flexural strength (a) Specimen A3, (b) Specimen A8.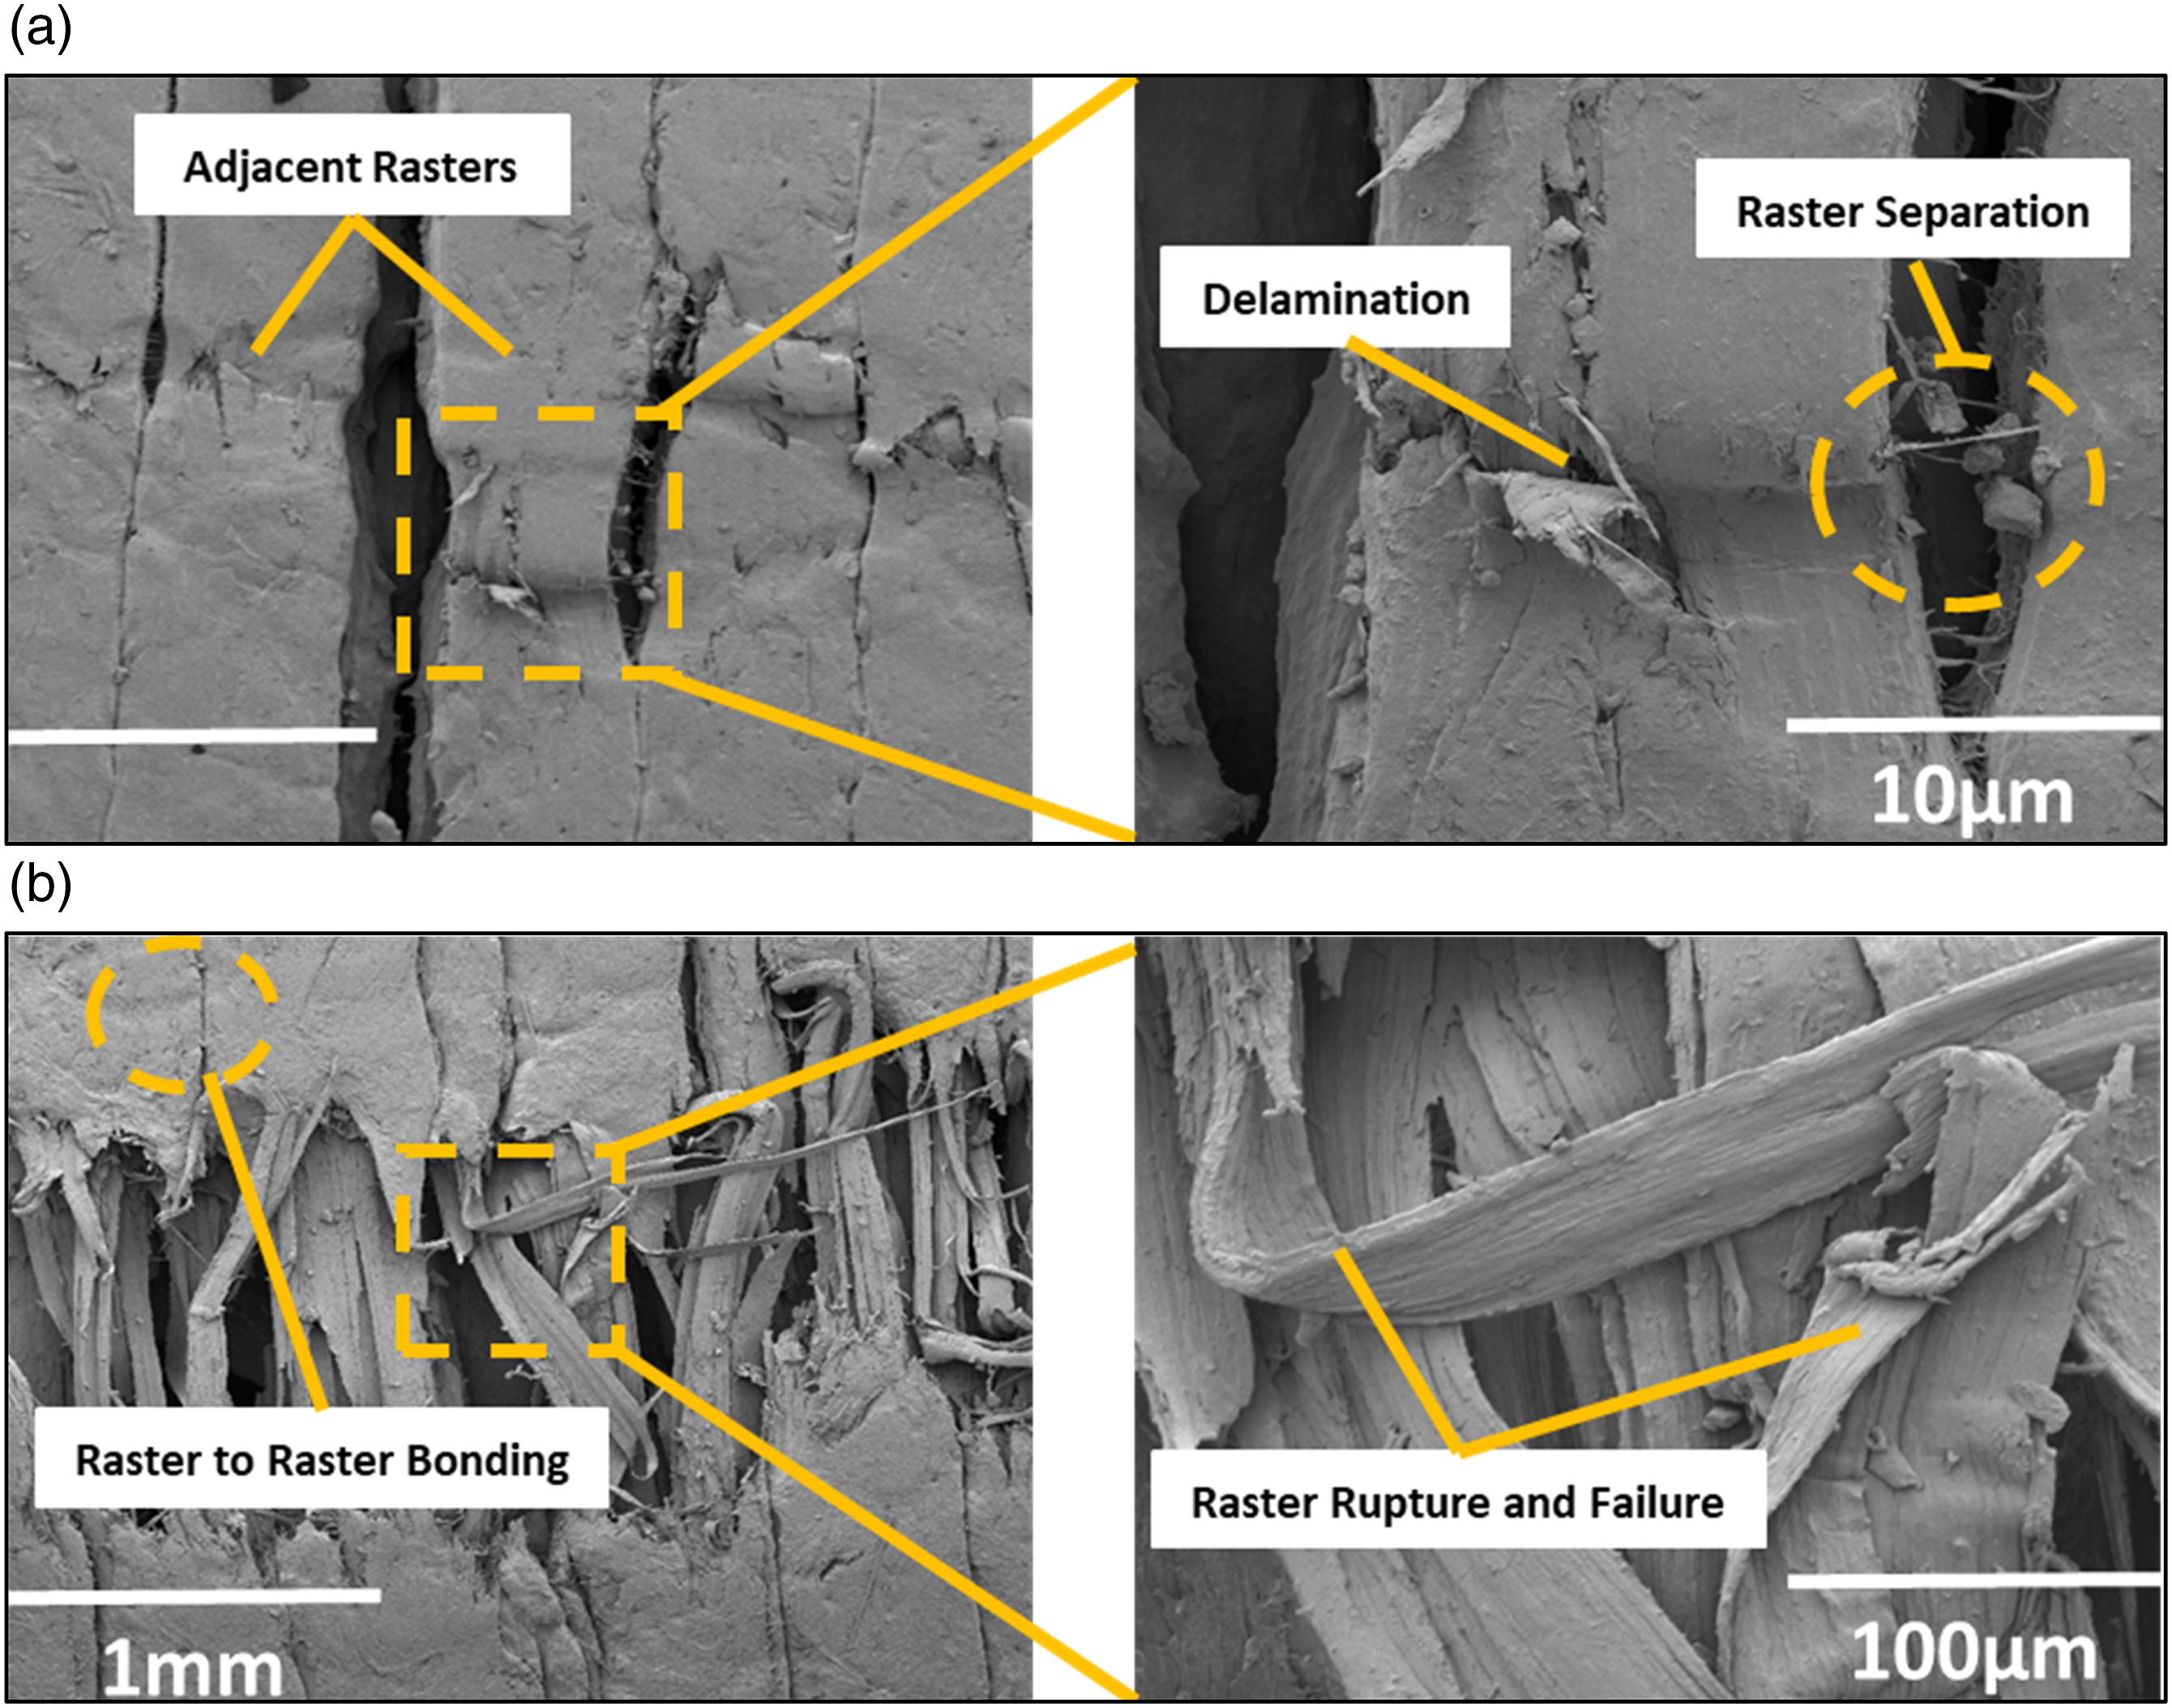
CF-PETG
The fracture surfaces of CF-PETG specimens with lowest (B1) and highest (B7) flexural strength are displayed in Figure 12. Specimen B1 depicts a flexural strength of 45.869 MPa at ND 0.2 mm and triangular IP. The weak raster-to-raster bonding, breaking of CFs, and CFs pullout is root for the brittle deformation of the specimen resulting in the lowest flexural strength for the CF-PETG specimens, Figure 12(a). However, the specimen B7 serves as an example of the CF-PETG specimen’s brittle failure with the highest flexural strength of 65.228 MPa at ND 0.6 mm and triangular IP. Strong raster-to-raster bonding, breaking of CFs, and CFs pullout is observed for Specimen B7 under flexural loading, Figure 12(b). Deformed surface for the CF-PETG specimens with minimum and maximum flexural strength (a) Specimen B1, (b) Specimen B7.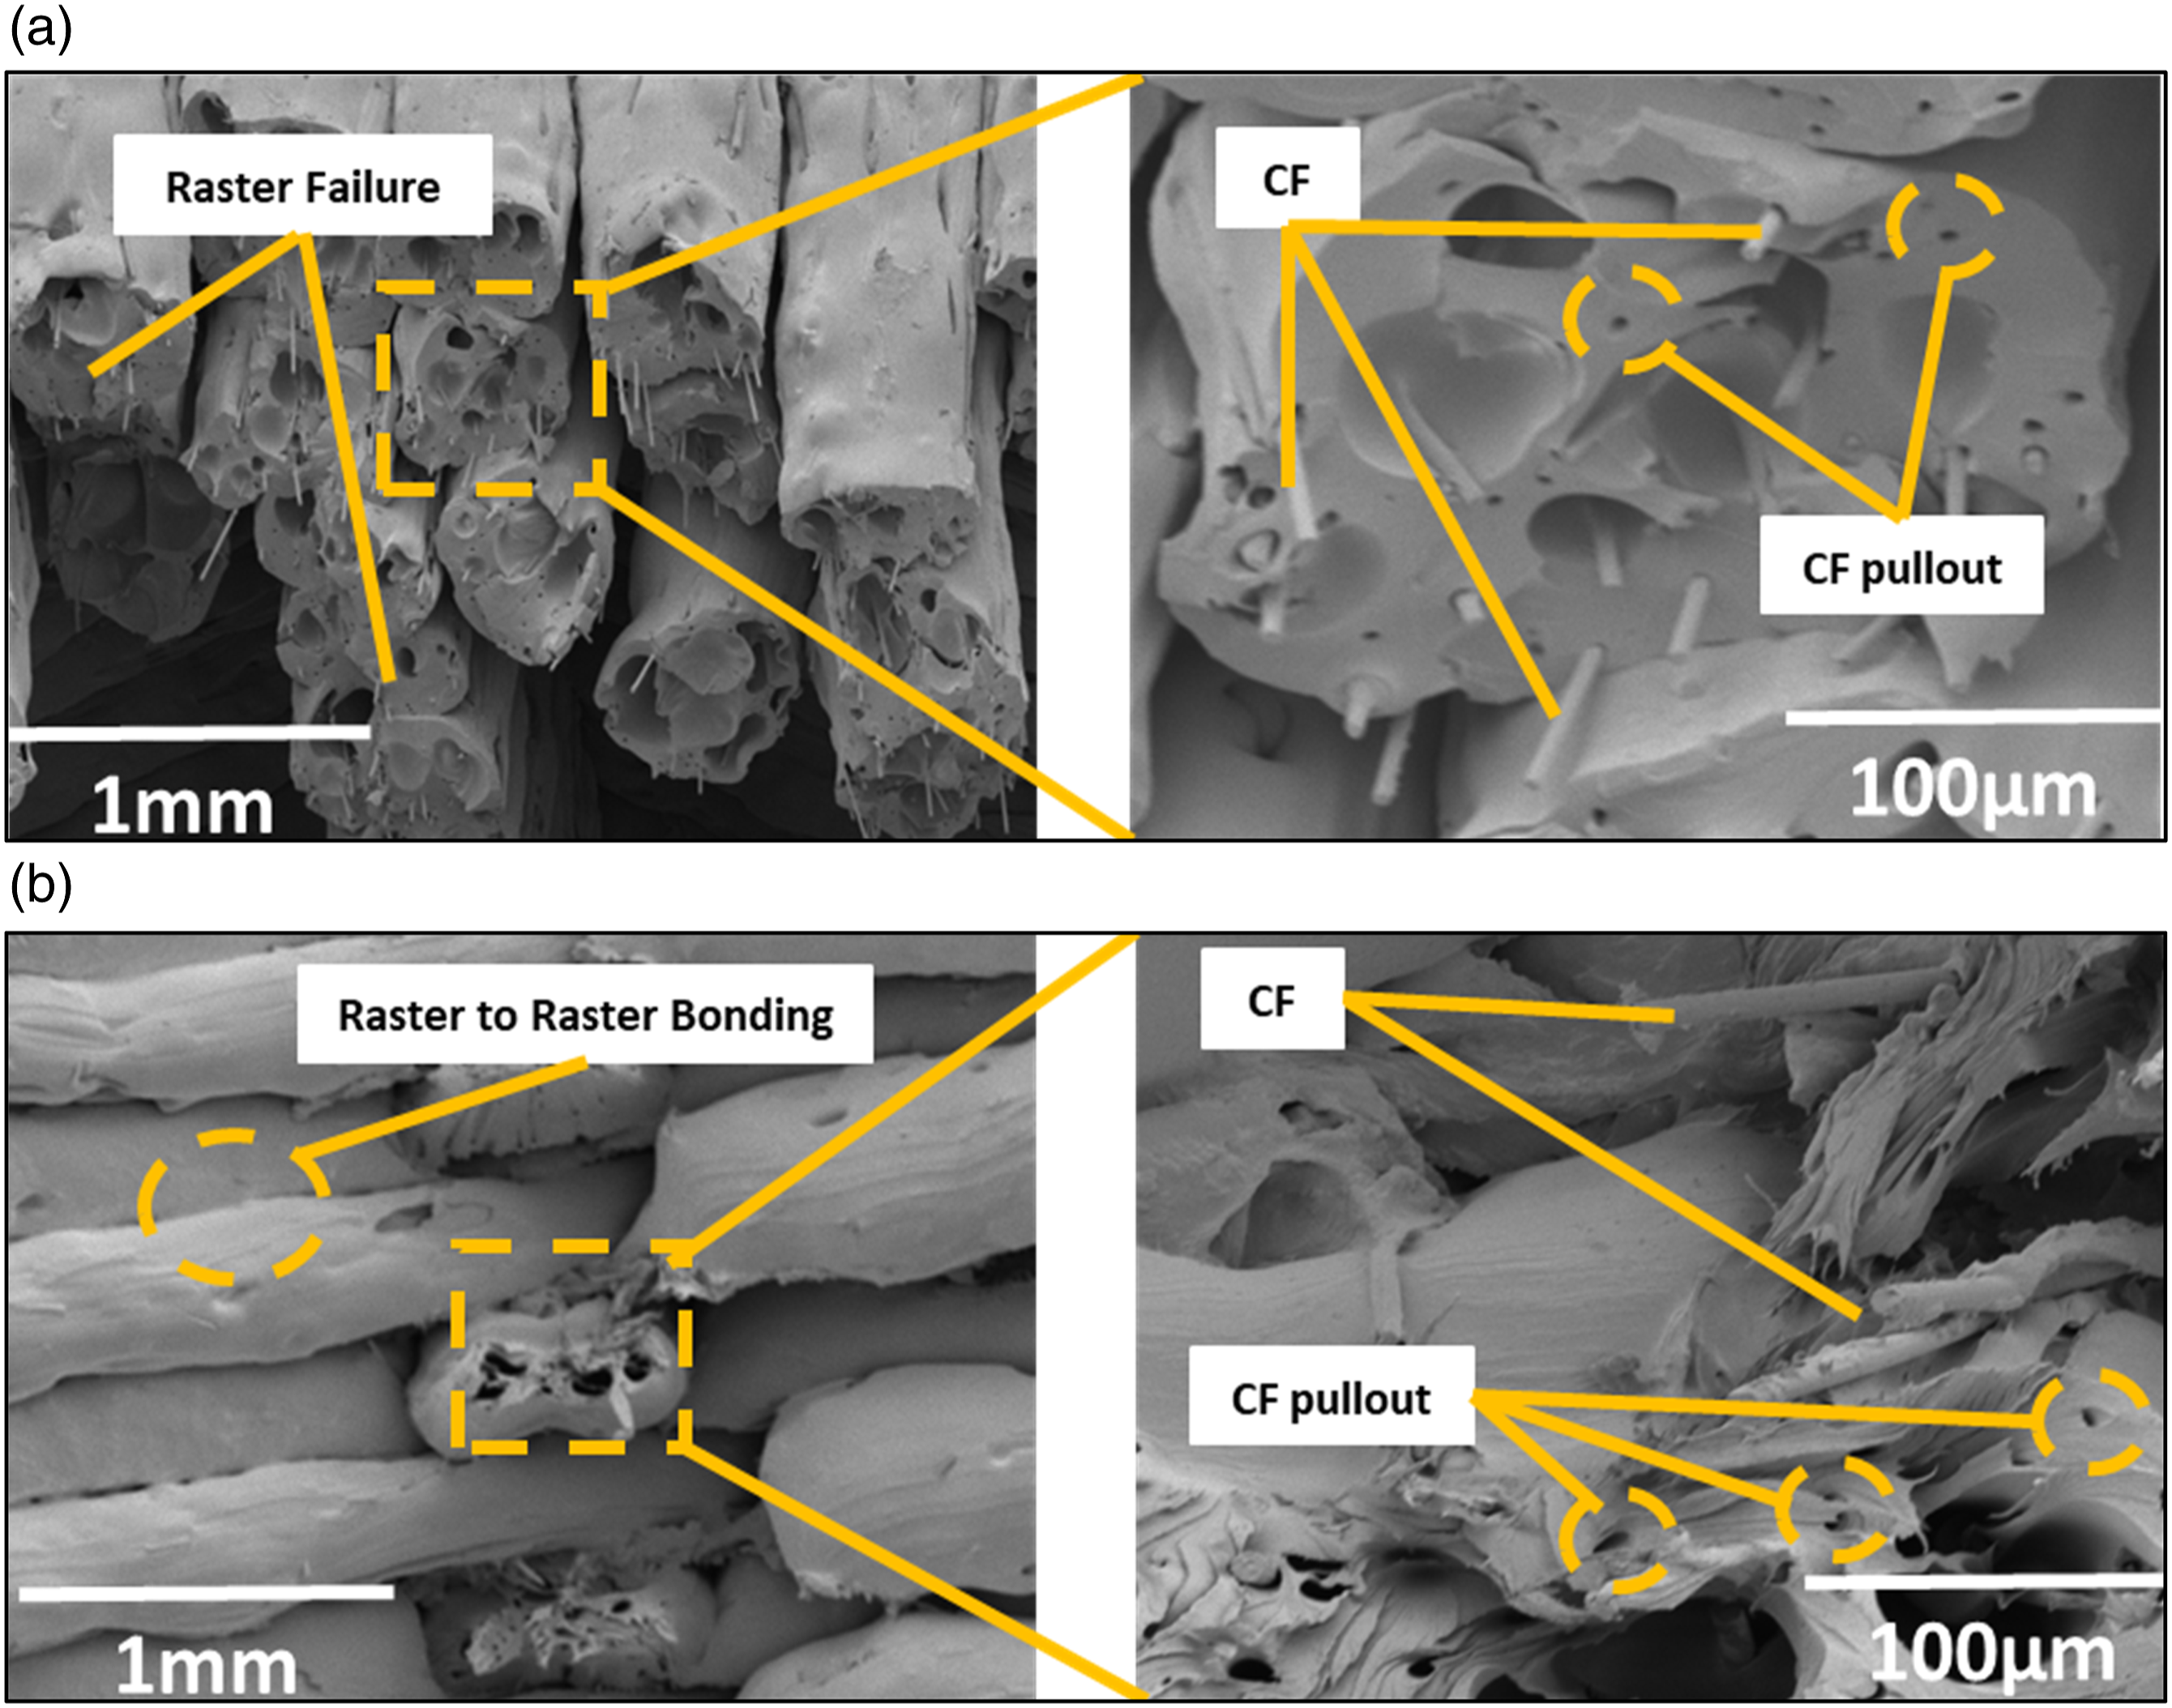
MWCNTs-PLA
The deformed surface of specimen C9 depicts the failure of individual rasters with breaking and pullout of MWCNTs, Figure 13(b). It also exhibits the ductile failure of the specimen during the flexural loading and also, exhibits the maximum flexural strength of 70.372 MPa at ND 0.6 mm and rectilinear IP. For specimen C1, the deformation is due to the weak raster bonding without individual raster failure resulting in minimum flexural strength for the CF-PLA specimens, Figure 13(a). It depicts the ductile failure of the specimen with the flexural strength of 39.121 MPa at ND 0.2 mm and triangular IP. Figure 13 illustrates the fracture surfaces of CF-PLA specimen with minimum (C1) and maximum (C9) flexural strength. Deformed surface for the MWCNTs-PLA specimens with minimum and maximum flexural strength (a) Specimen C1, (b) Specimen C9.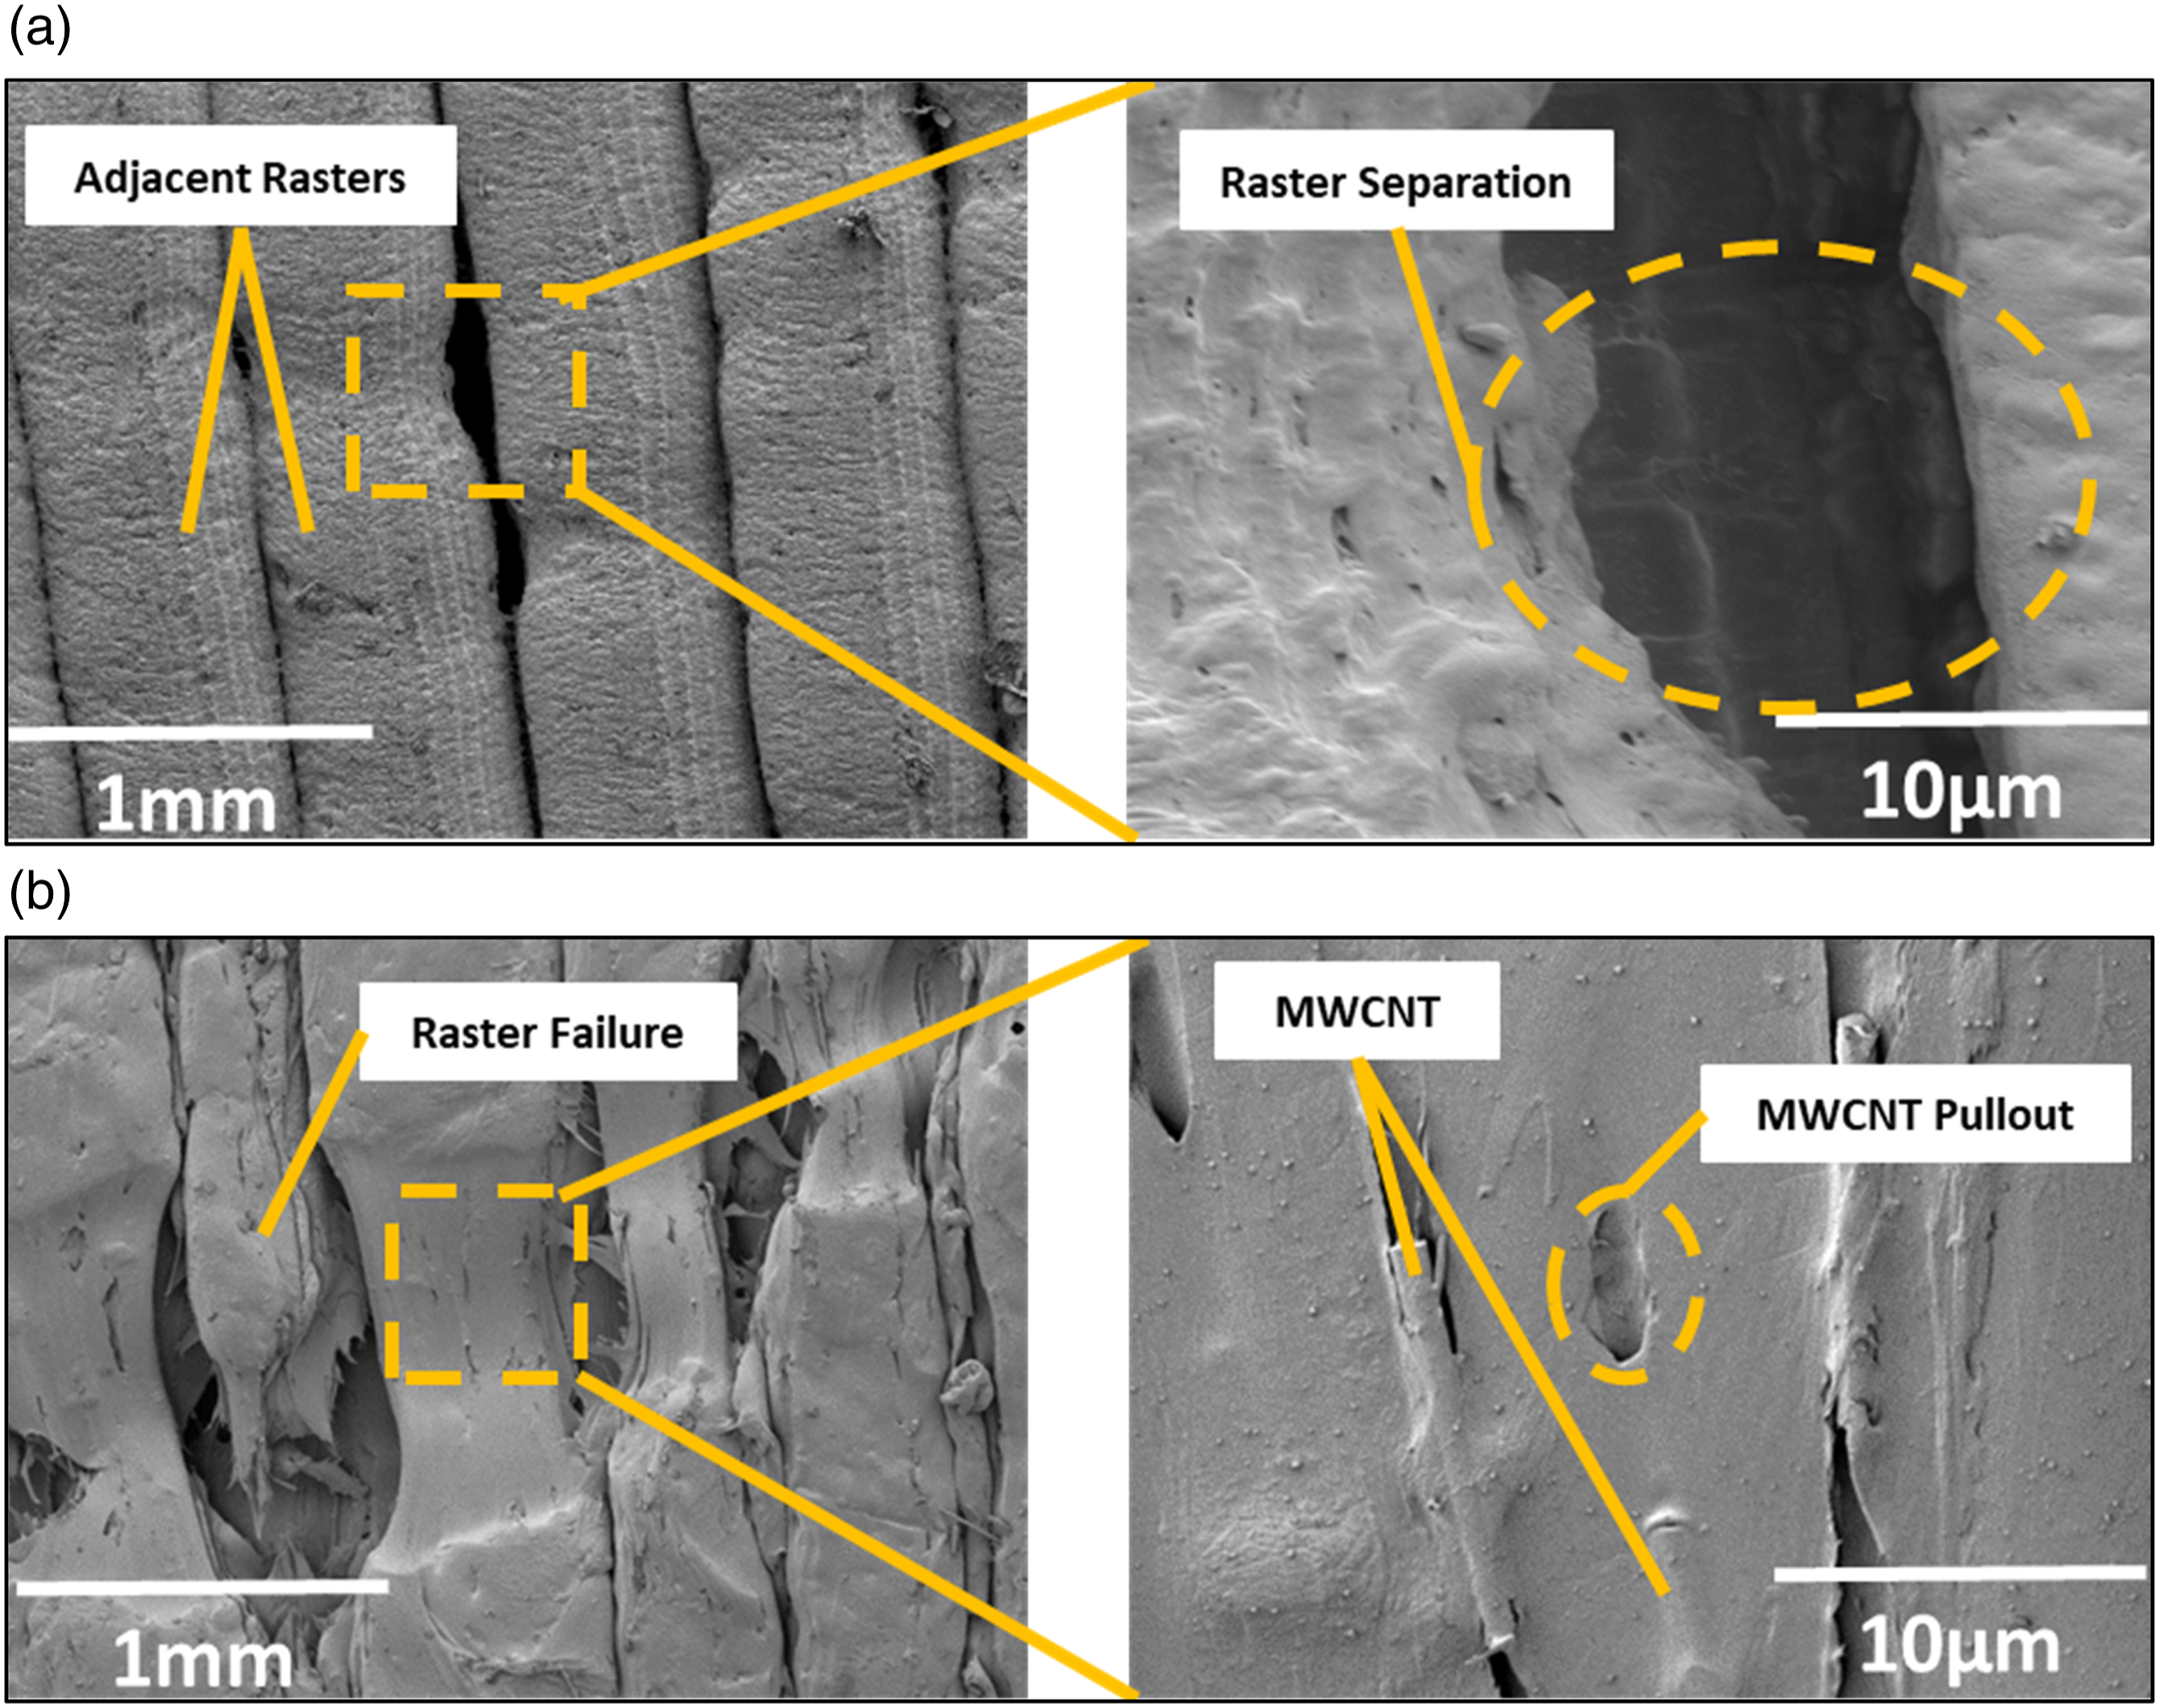
Figure 14 depicts the various voids exhibited by FFF-fabricated components. Inter-voids occur periodically as a result of raster spreading but the interfacial voids develop due to weak between neighbouring rasters.47,48 The flexural behaviour of the fabricated specimens is affected by the presence of these voids, which can be reduced by adjusting the FFF process parameters appropriately. The size of voids is affected by several FFF parameters, such as infill pattern, layer thickness, nozzle diameter, air gap, build direction, infill percentage, and so on, and has an impact on the failure mechanism. Various kind of voids spotted in FFF-fabricated parts (a) Schematic diagram, (b) SEM image.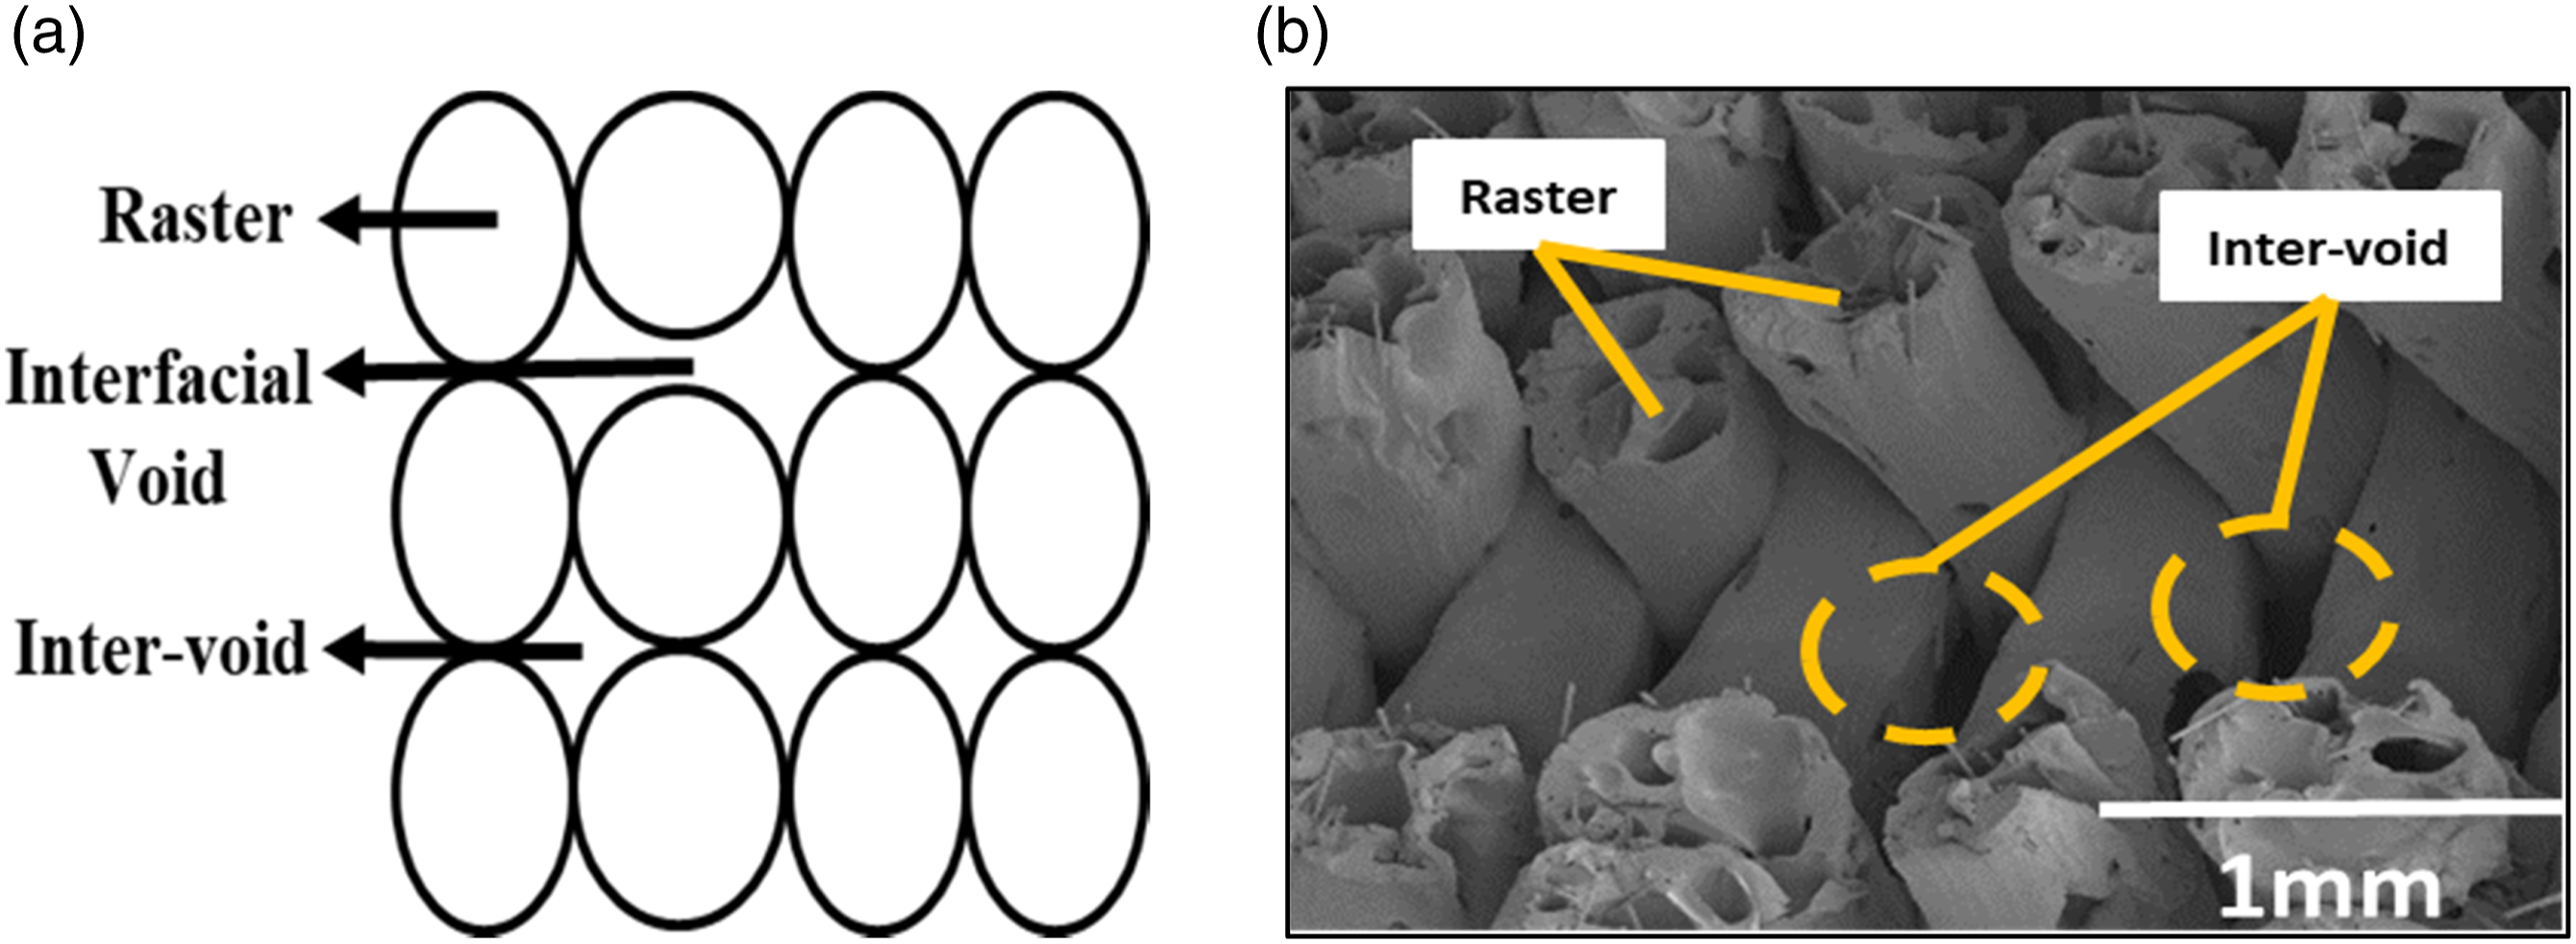
Figure 15 illustrates the dissimilar raster formation at different NDs. Due to change in ND, the raster width varied. At higher ND, the raster width is high resulting in higher tensile strength with a smaller number of voids and better raster to raster bonding, Figure 15(c). While, at lower ND, the raster width is lower resulting in low flexural strength due to more voids with separation and failure of individual rasters, Figure 15(a). Dissimilar raster formation at different NDs. (a) 0.2 mm (b) 0.4 mm, (c) 0.6 mm.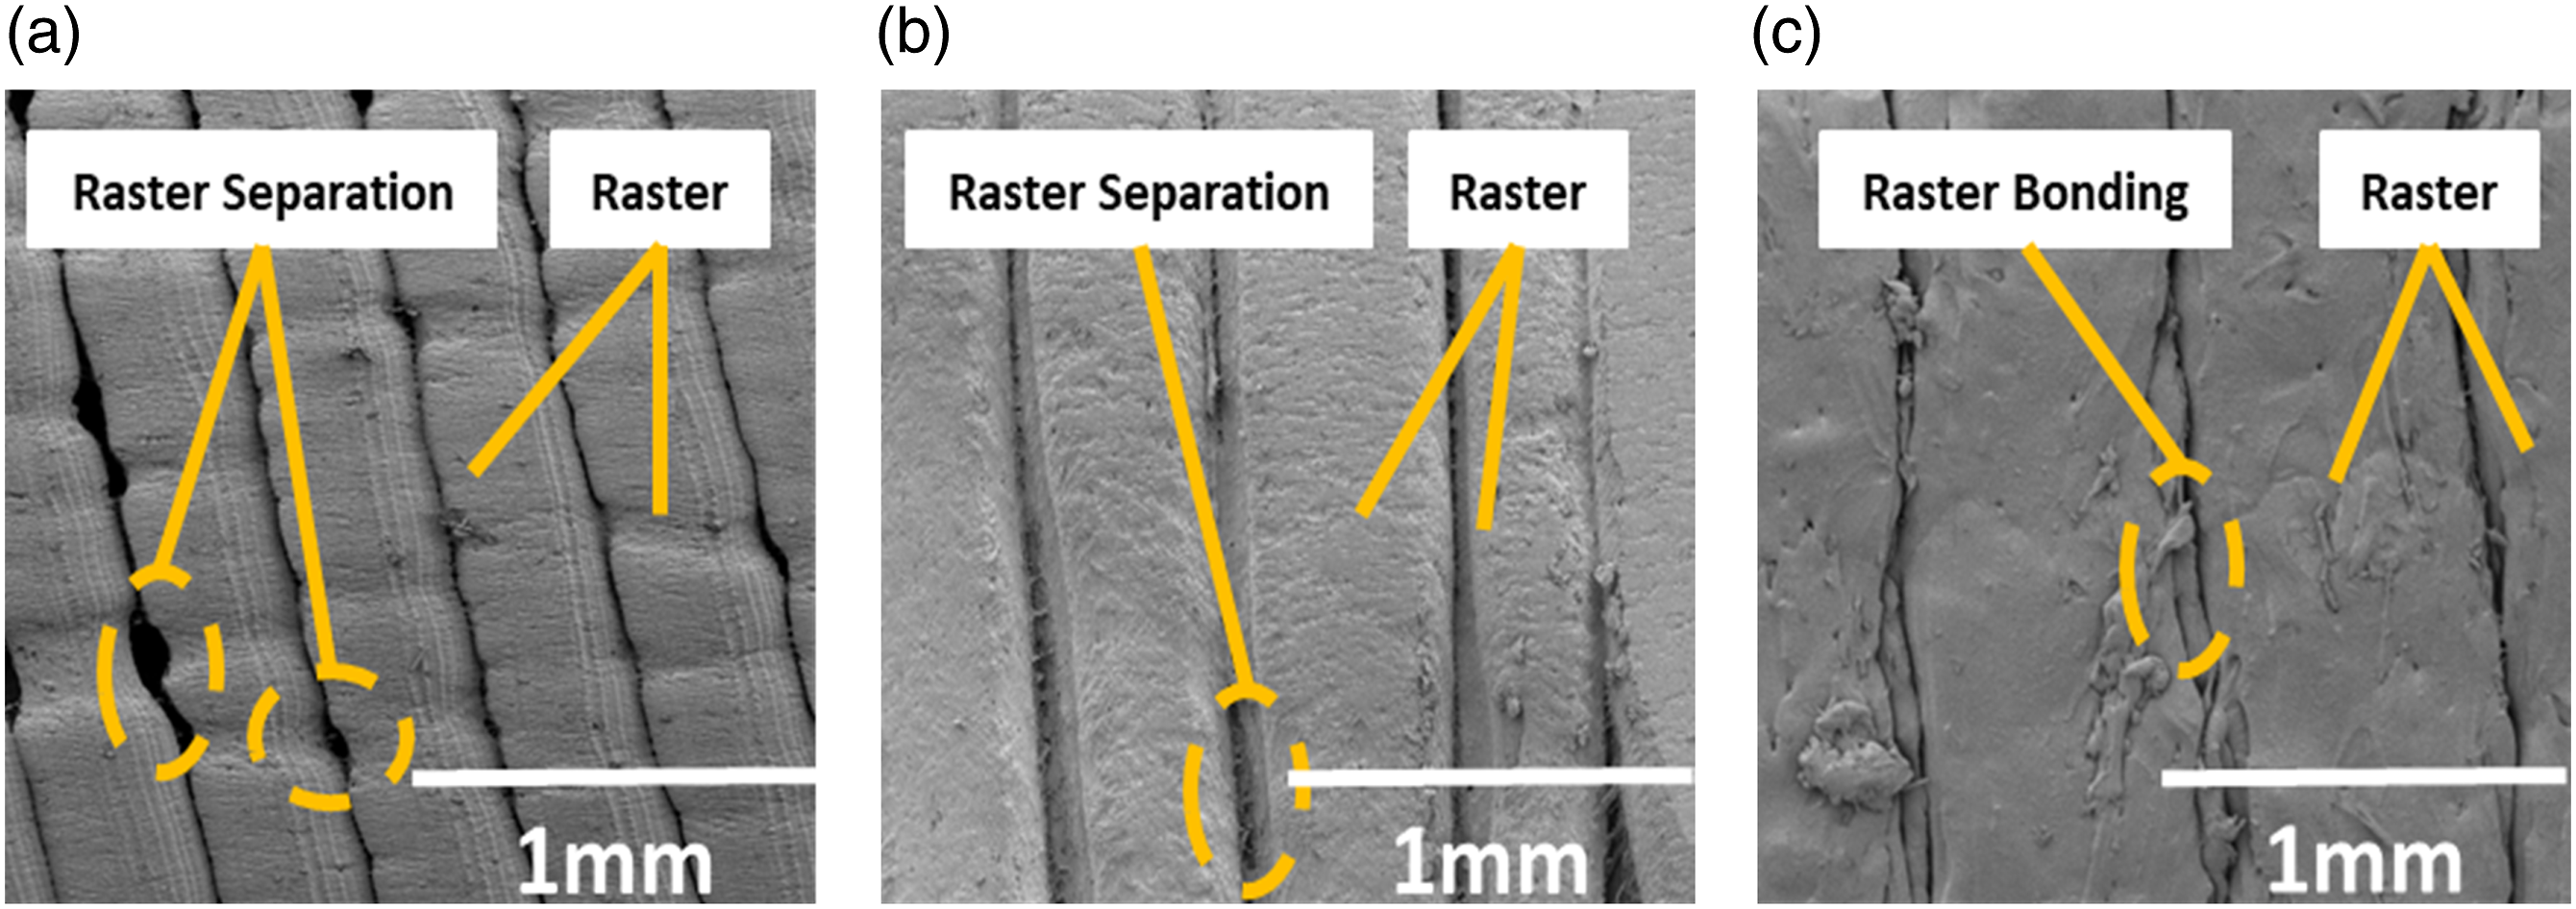
Analysis of variance
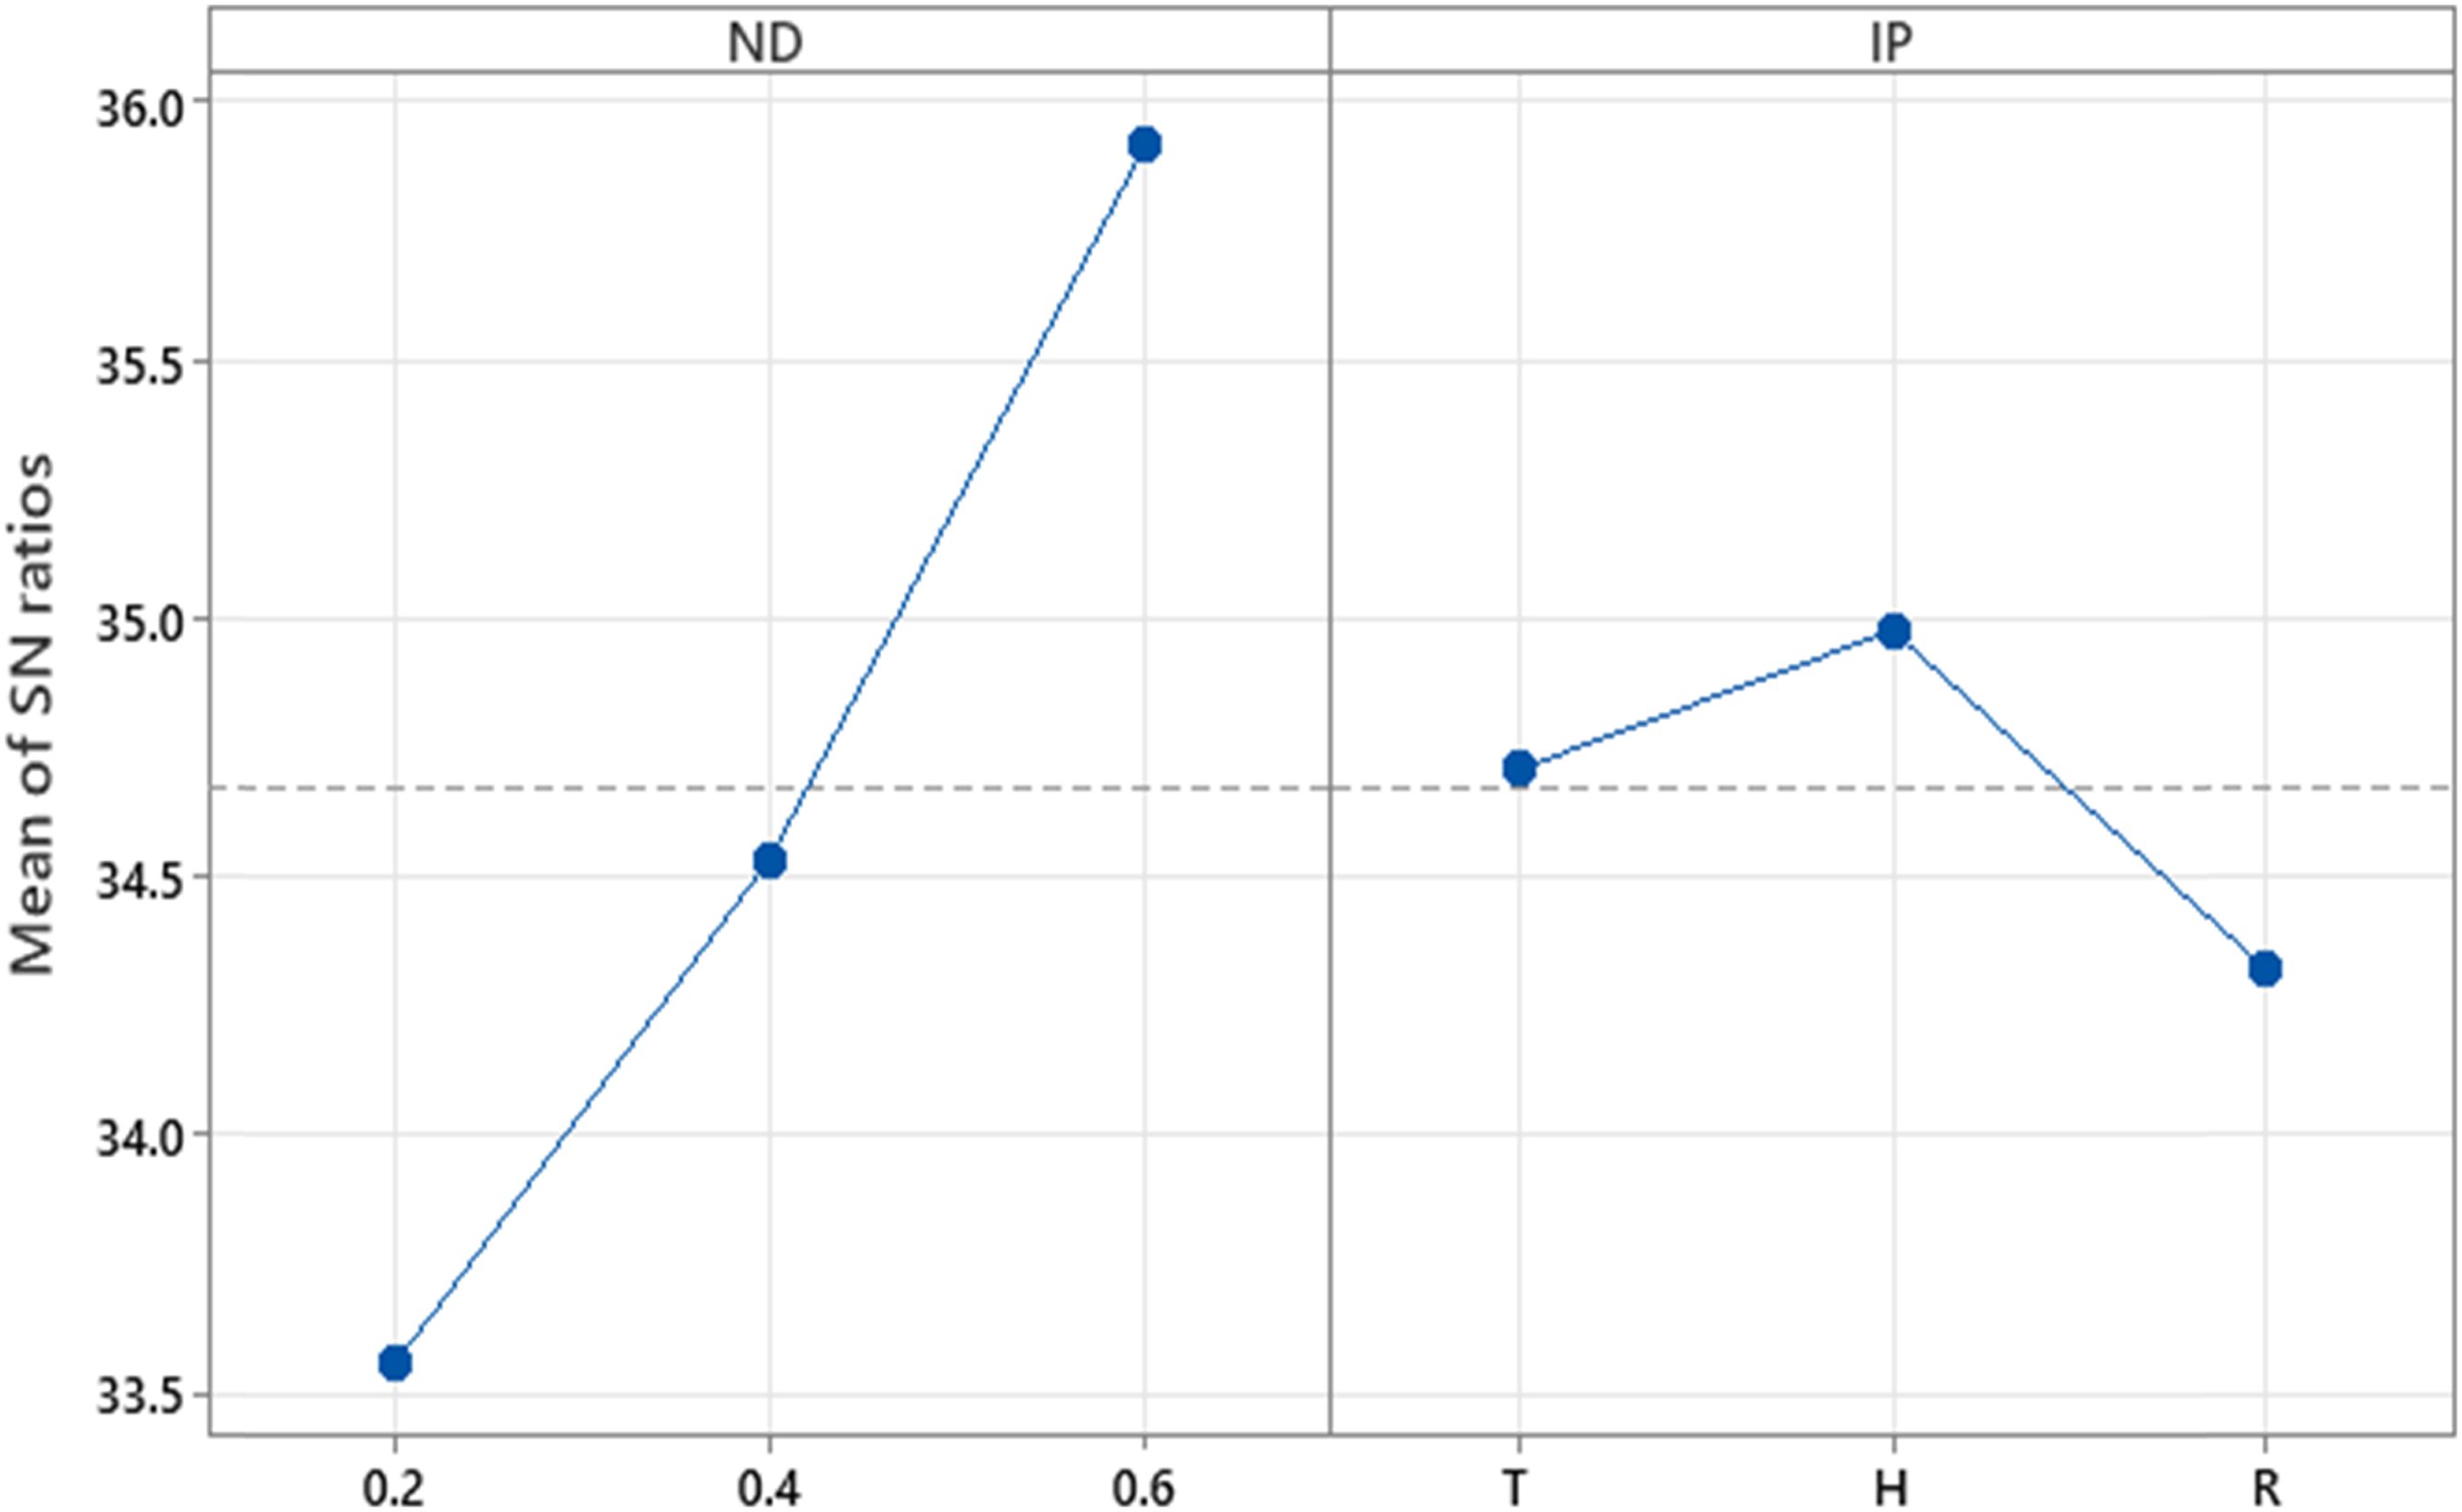
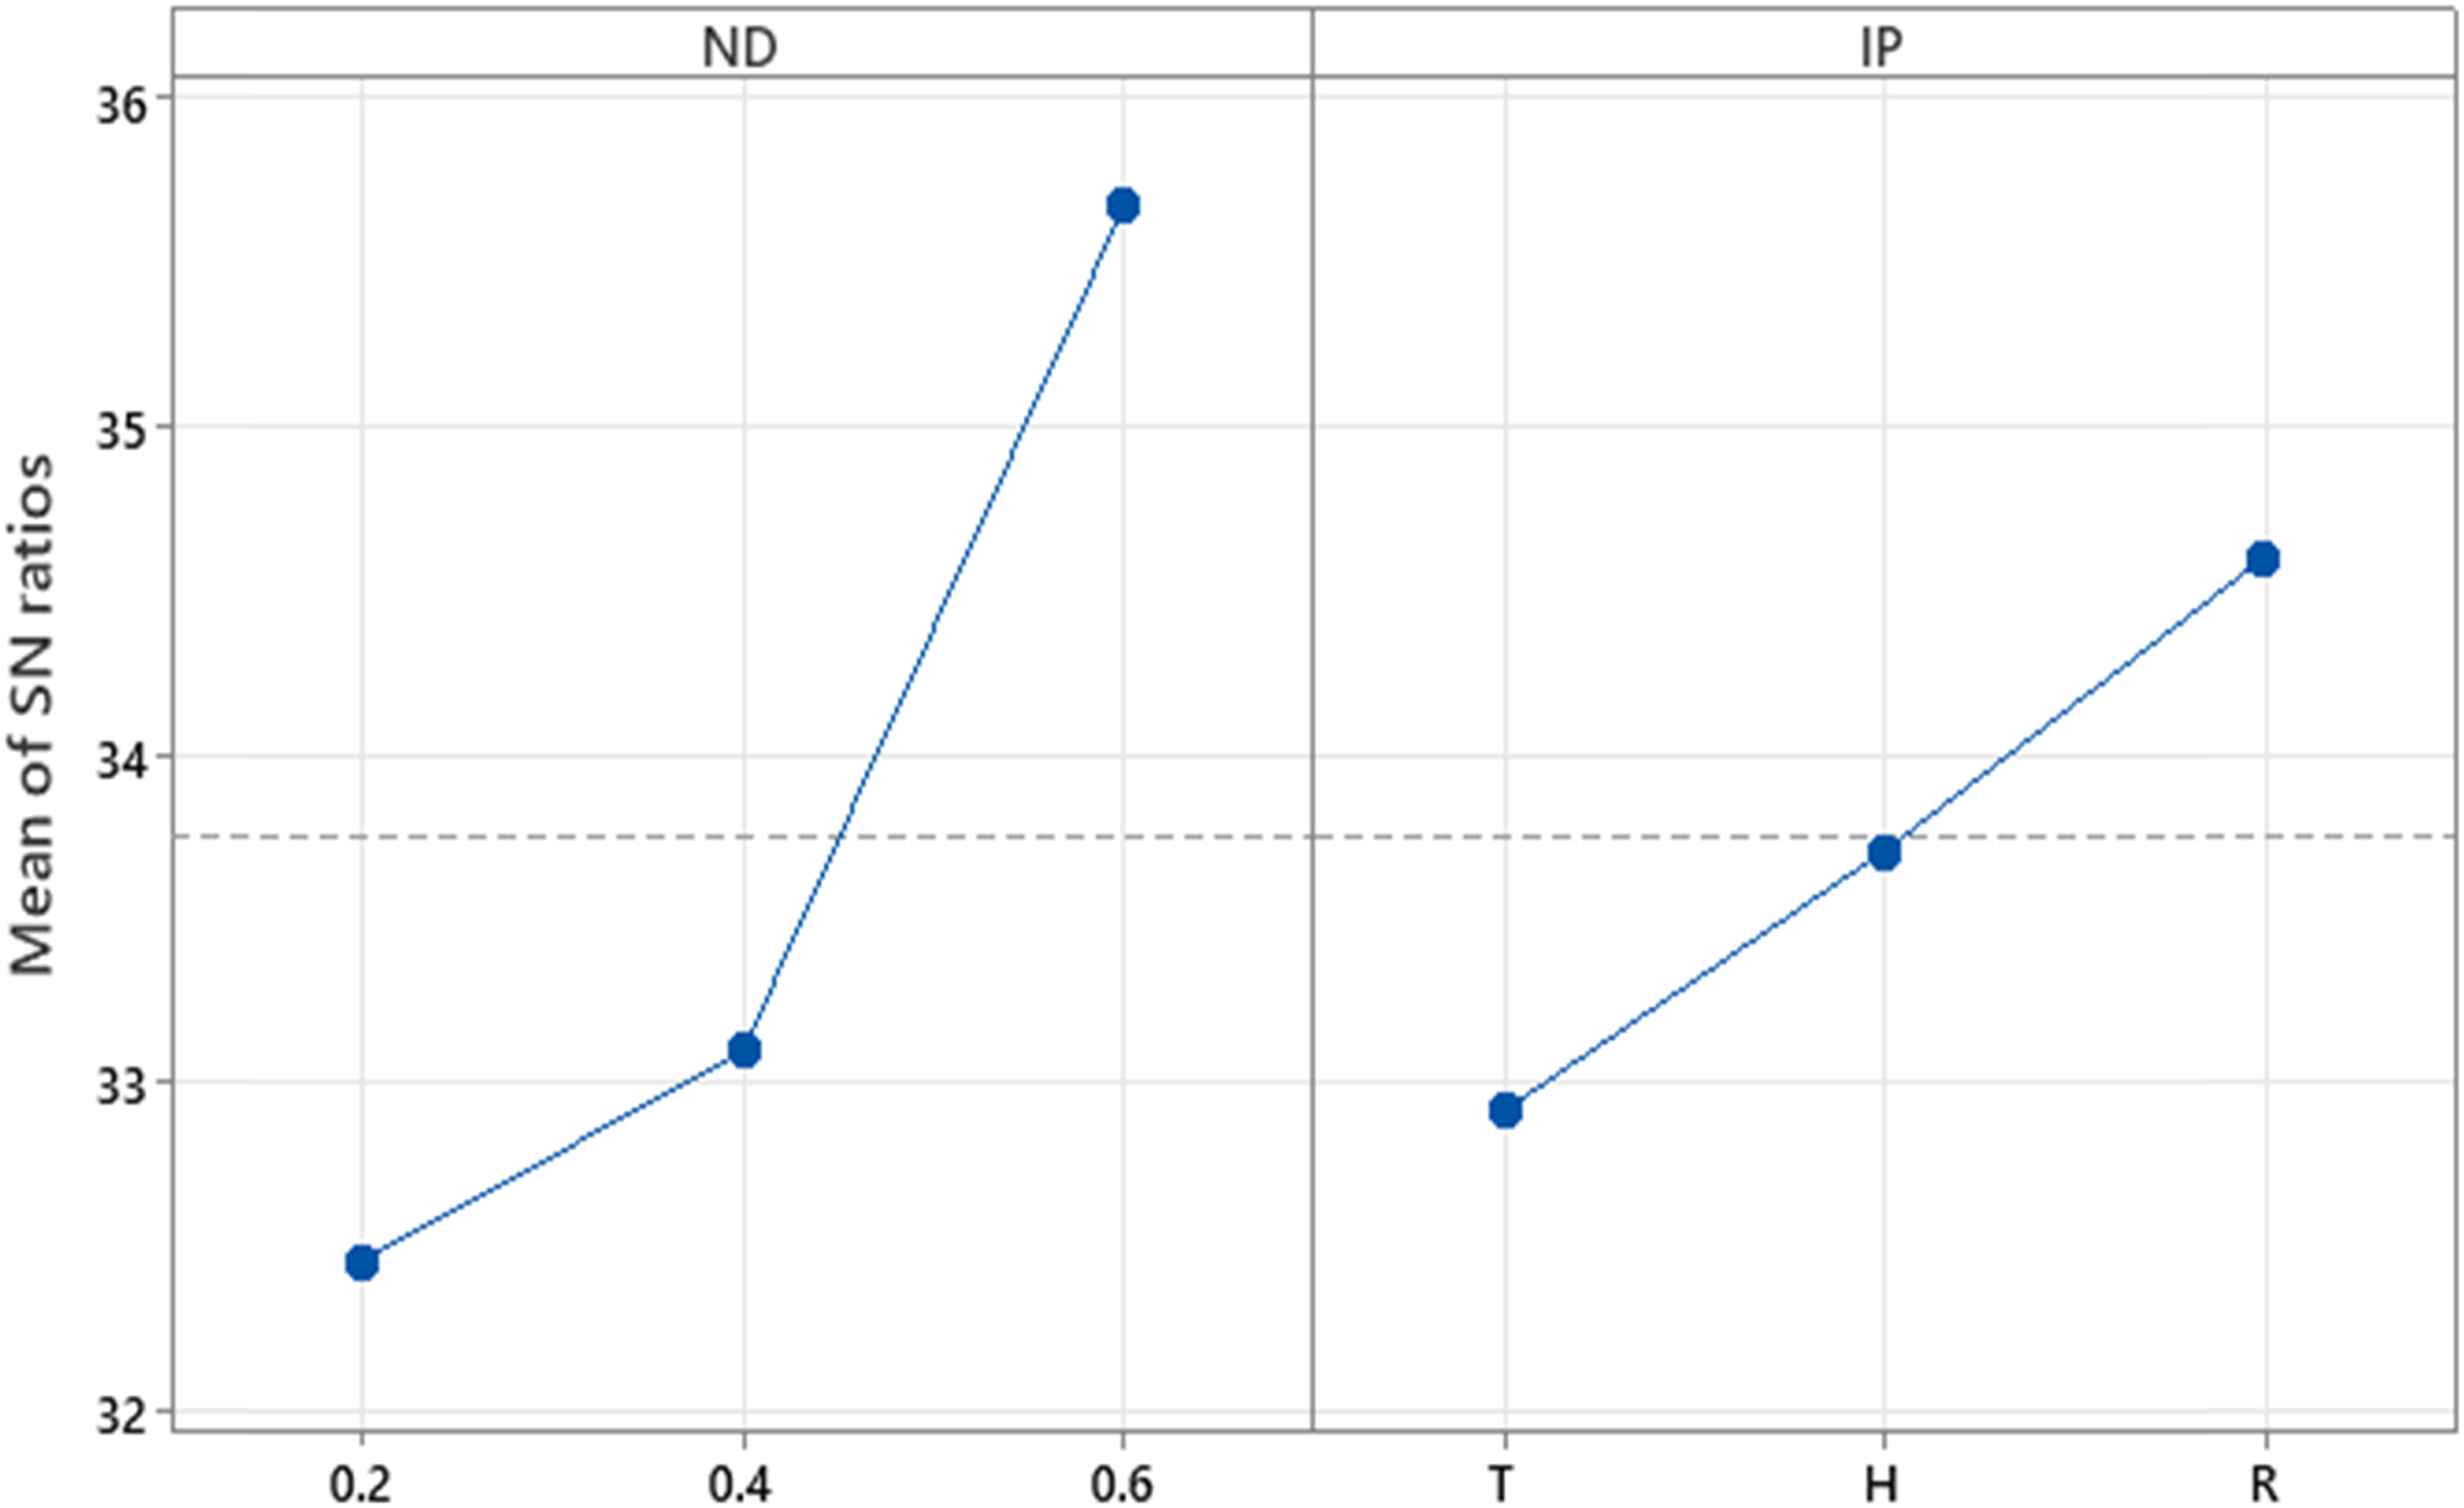
Using Taguchi’s L9 array DOE, Greater is better main effects plots for signal to noise ratios (SNRA) are produced by an ANOVA study of the process parameters with three levels each, namely IP which includes triangular (T), hexagonal (H) and rectilinear (R) pattern with the variation in ND viz 0.2 mm, 0.4 mm, and 0.6 mm over the target factor viz flexural strength of CF-PLA, CF-PETG, and MWCNTs-PLA specimens. The plots are illustrated in Figures 16, 17 and 18 for CF-PLA, CF-PETG, and MWCNTs-PLA, respectively. The MINITAB 21 programme is employed to analyse the experimental results. SNRA plots of the main effects of the process parameters on the flexural strength for CF-PLA. SNRA plots of the main effects of the process parameters on the flexural strength for CF-PETG. SNRA plots of the main effects of the process parameters on the flexural strength for MWCNTs- PLA.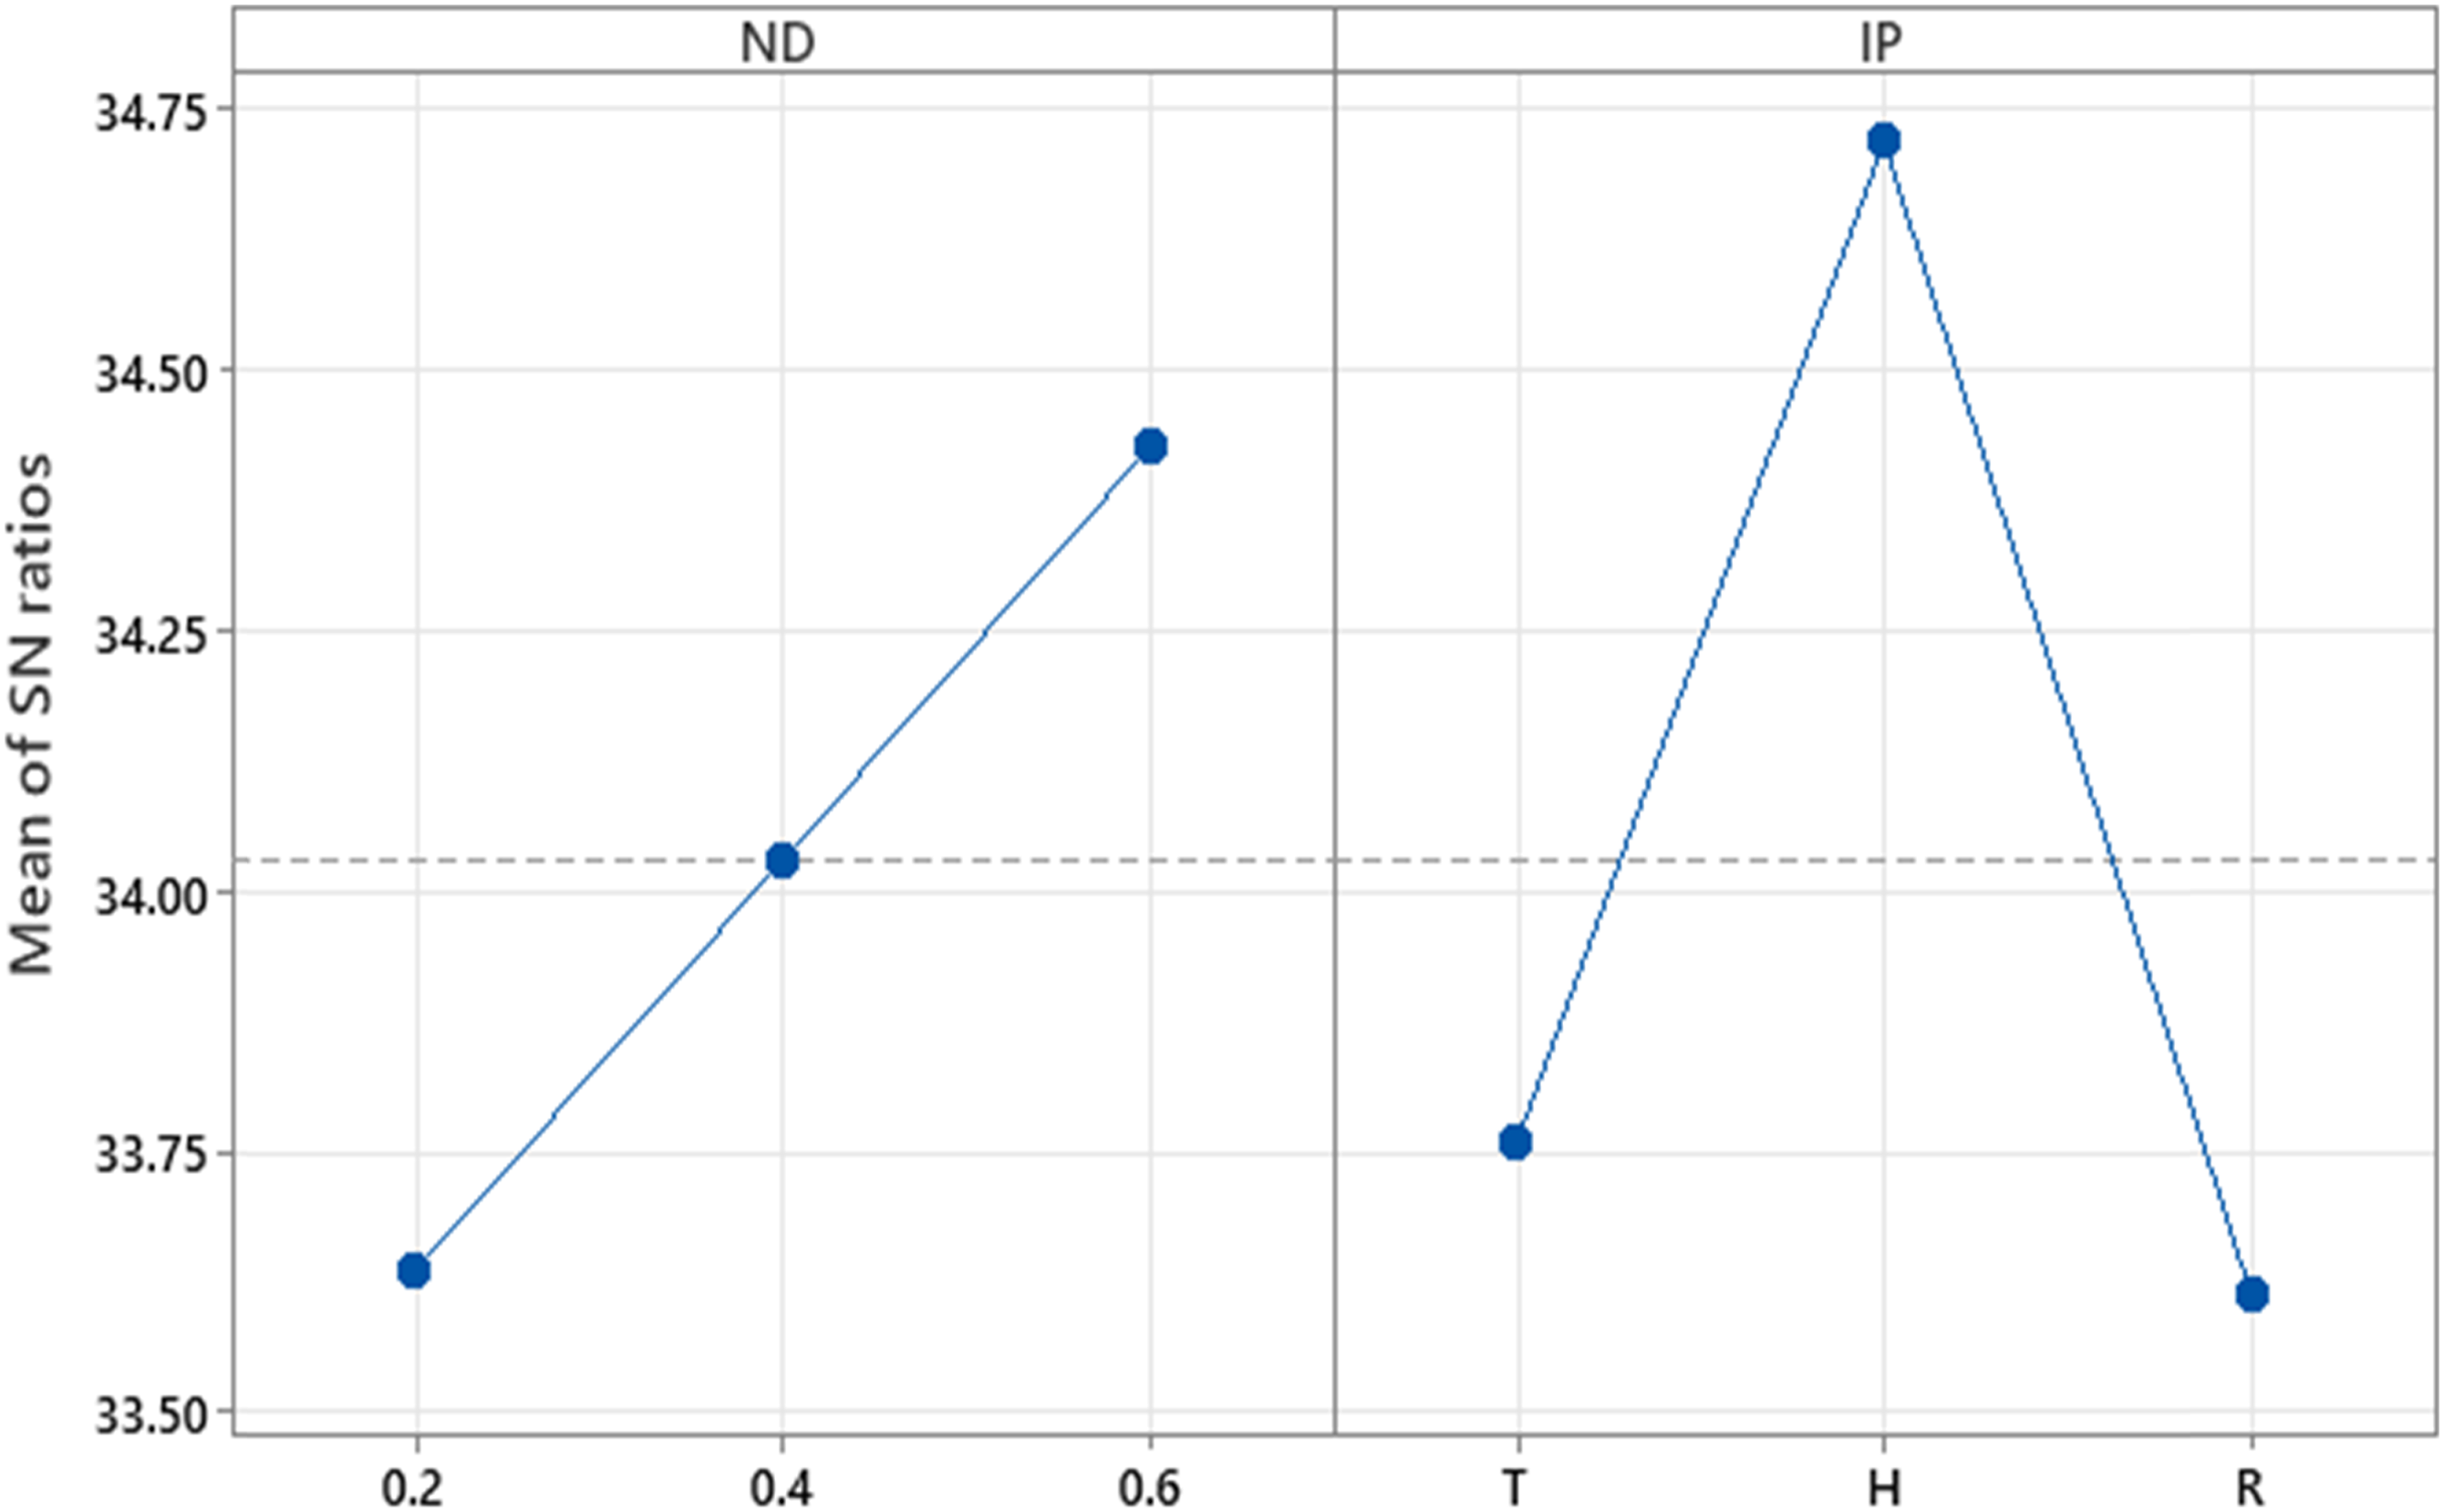
CF-PLA
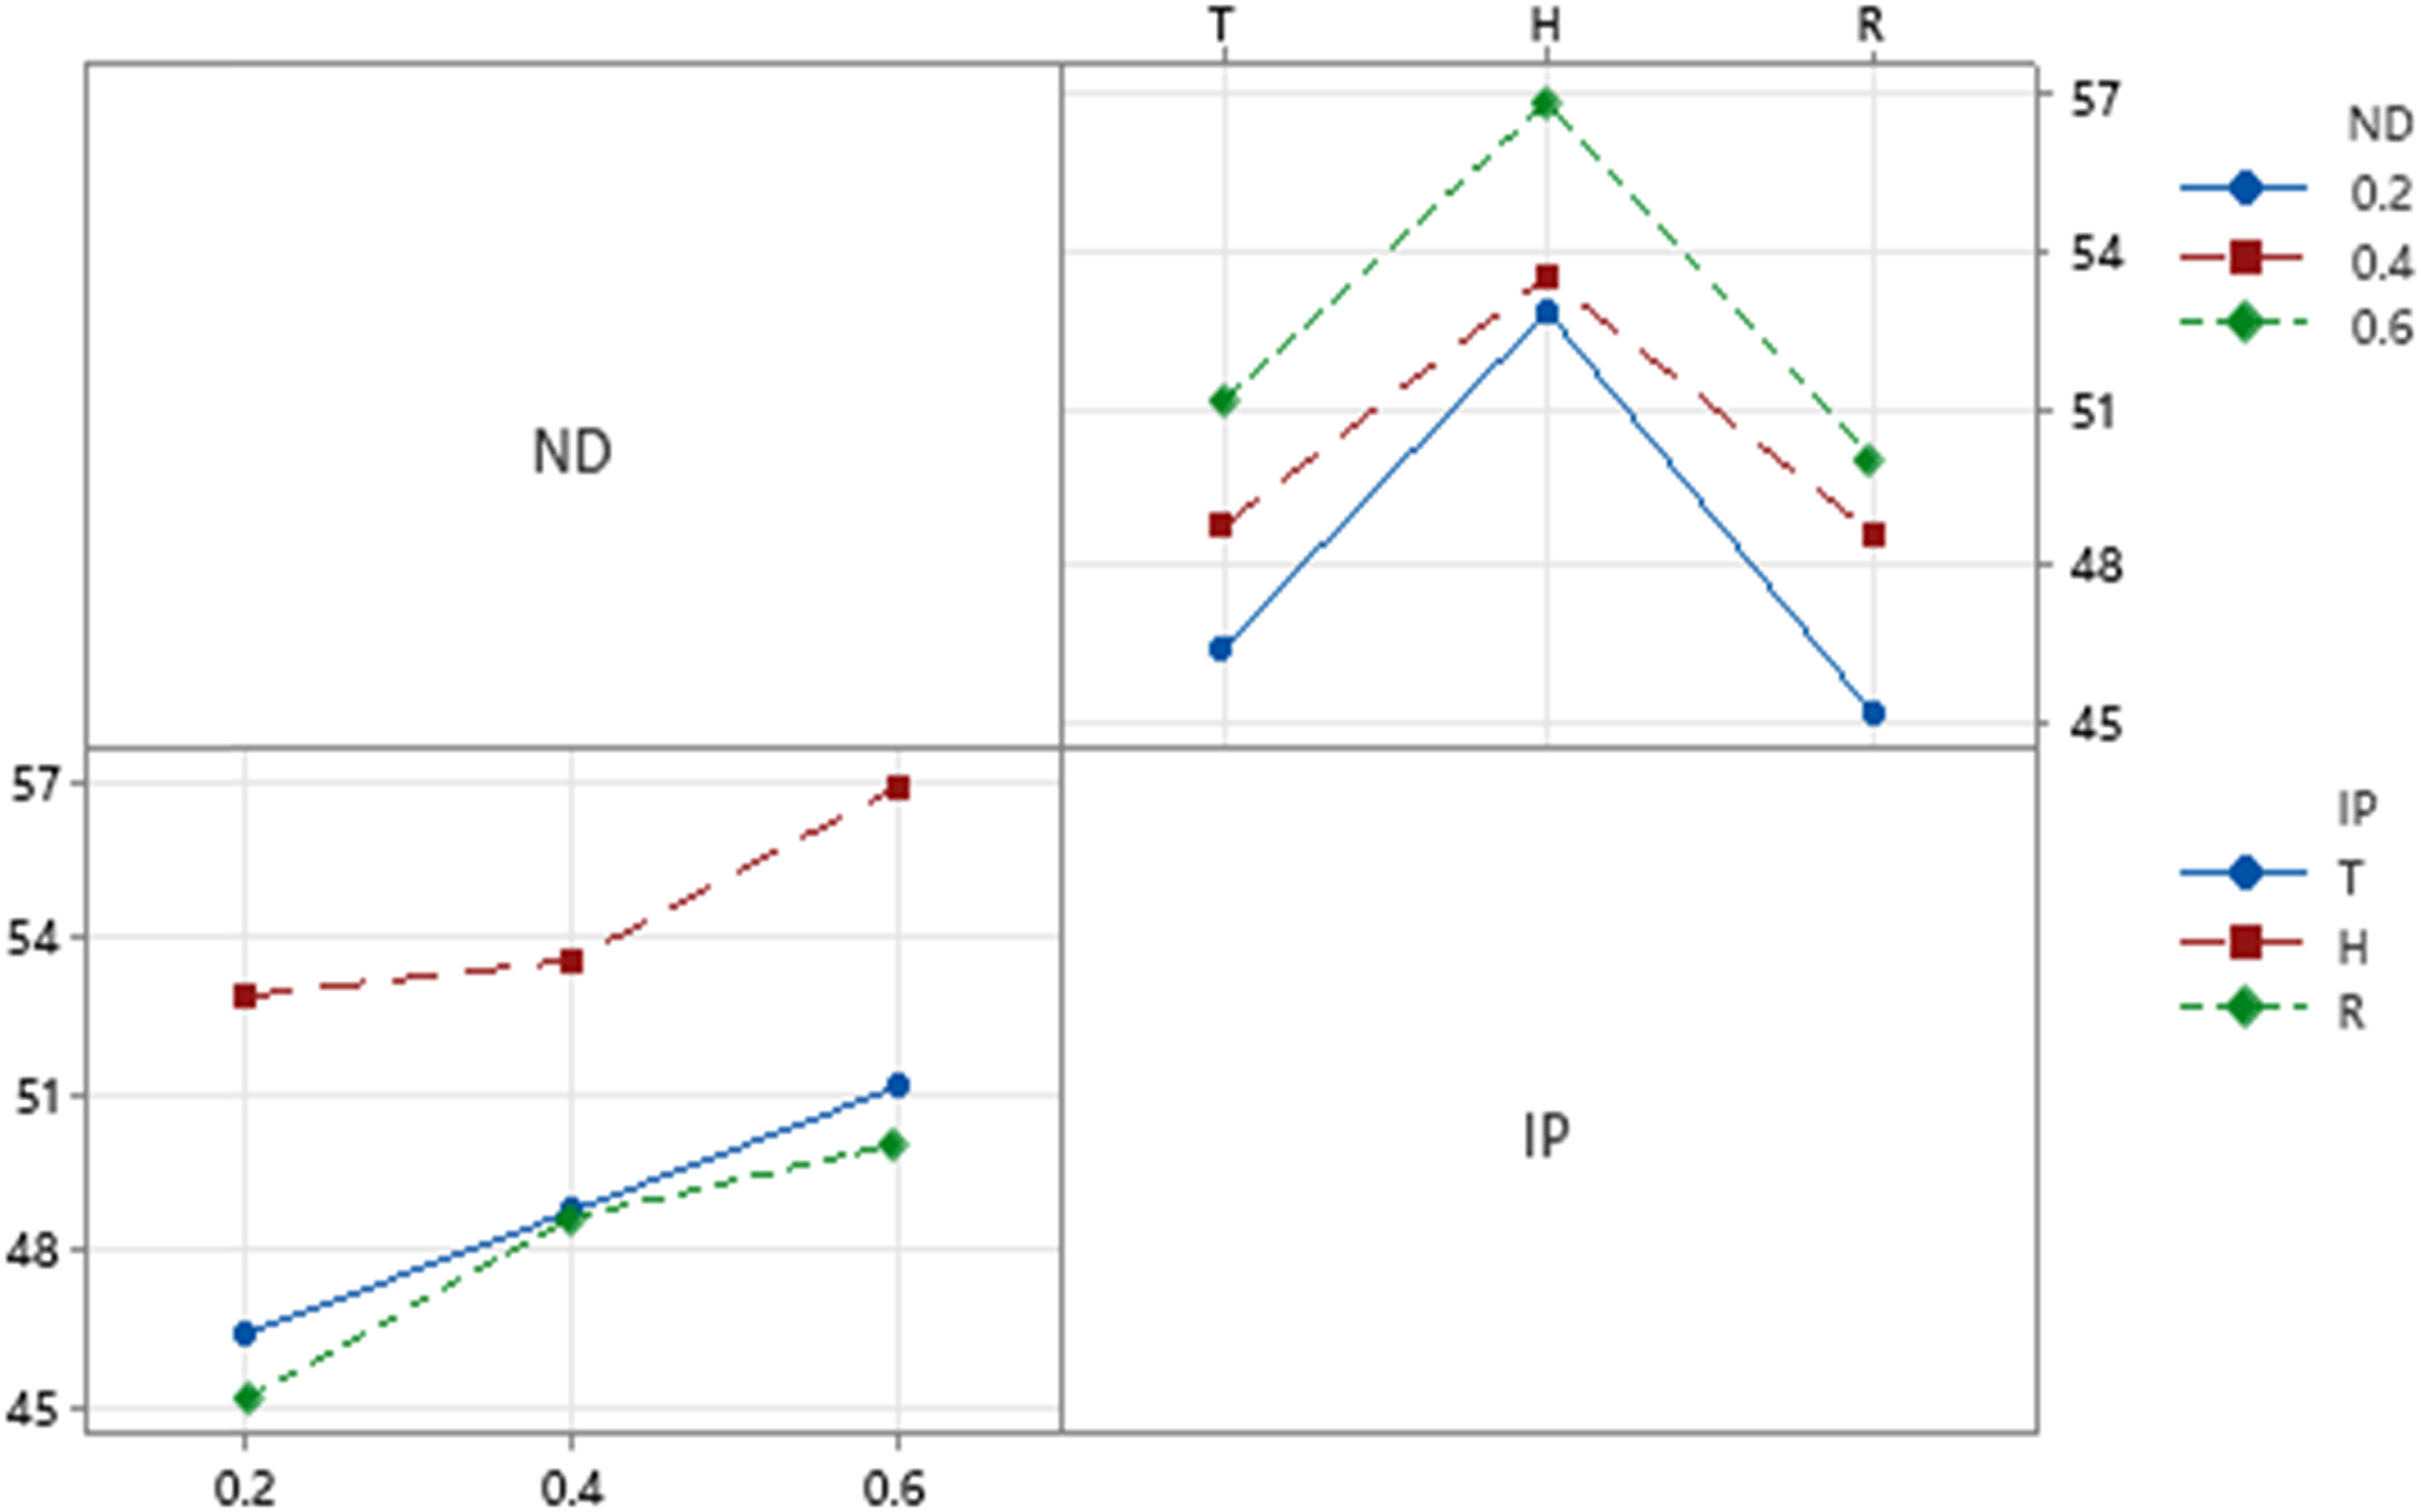
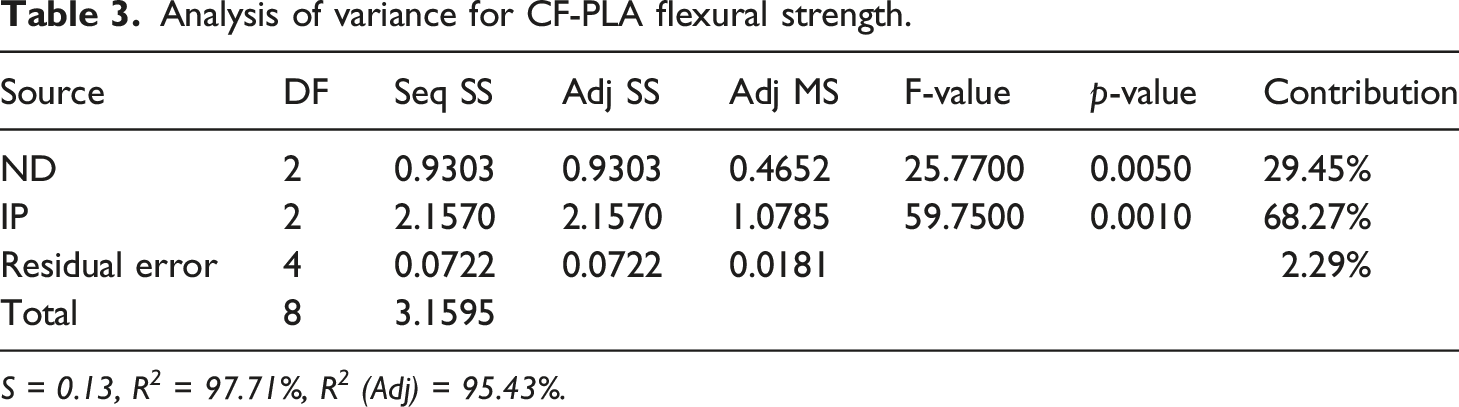
On the basis of the aforesaid rating, process elements that significantly affect the objective function may be found, and appropriate control actions may be taken. Figure 19 depicts the interaction plot to describe the behaviour of ND and IP for the flexural strength for CF-PLA specimens. Table 3 shows the % contributions of all two process parameters based on ANOVA. The p-value indicates that IP has the biggest influence on the flexural strength followed by ND for CF-PLA specimens. Flexural strength’s coefficient of determination (R2), which measures how much of the response’s overall variation is represented by the model’s components, is 97.71%. Interaction plots for the flexural strength for CF-PLA. Analysis of variance for CF-PLA flexural strength.
S = 0.13, R
2
= 97.71%, R
2
(Adj) = 95.43%.
CF-PETG
Analysis of variance for CF-PETG flexural strength.
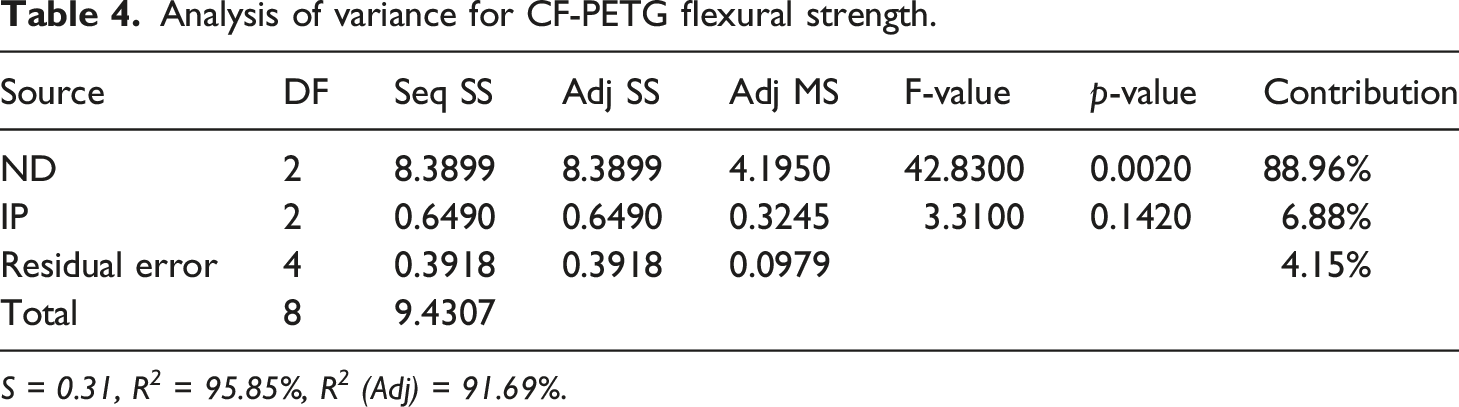
S = 0.31, R 2 = 95.85%, R 2 (Adj) = 91.69%.
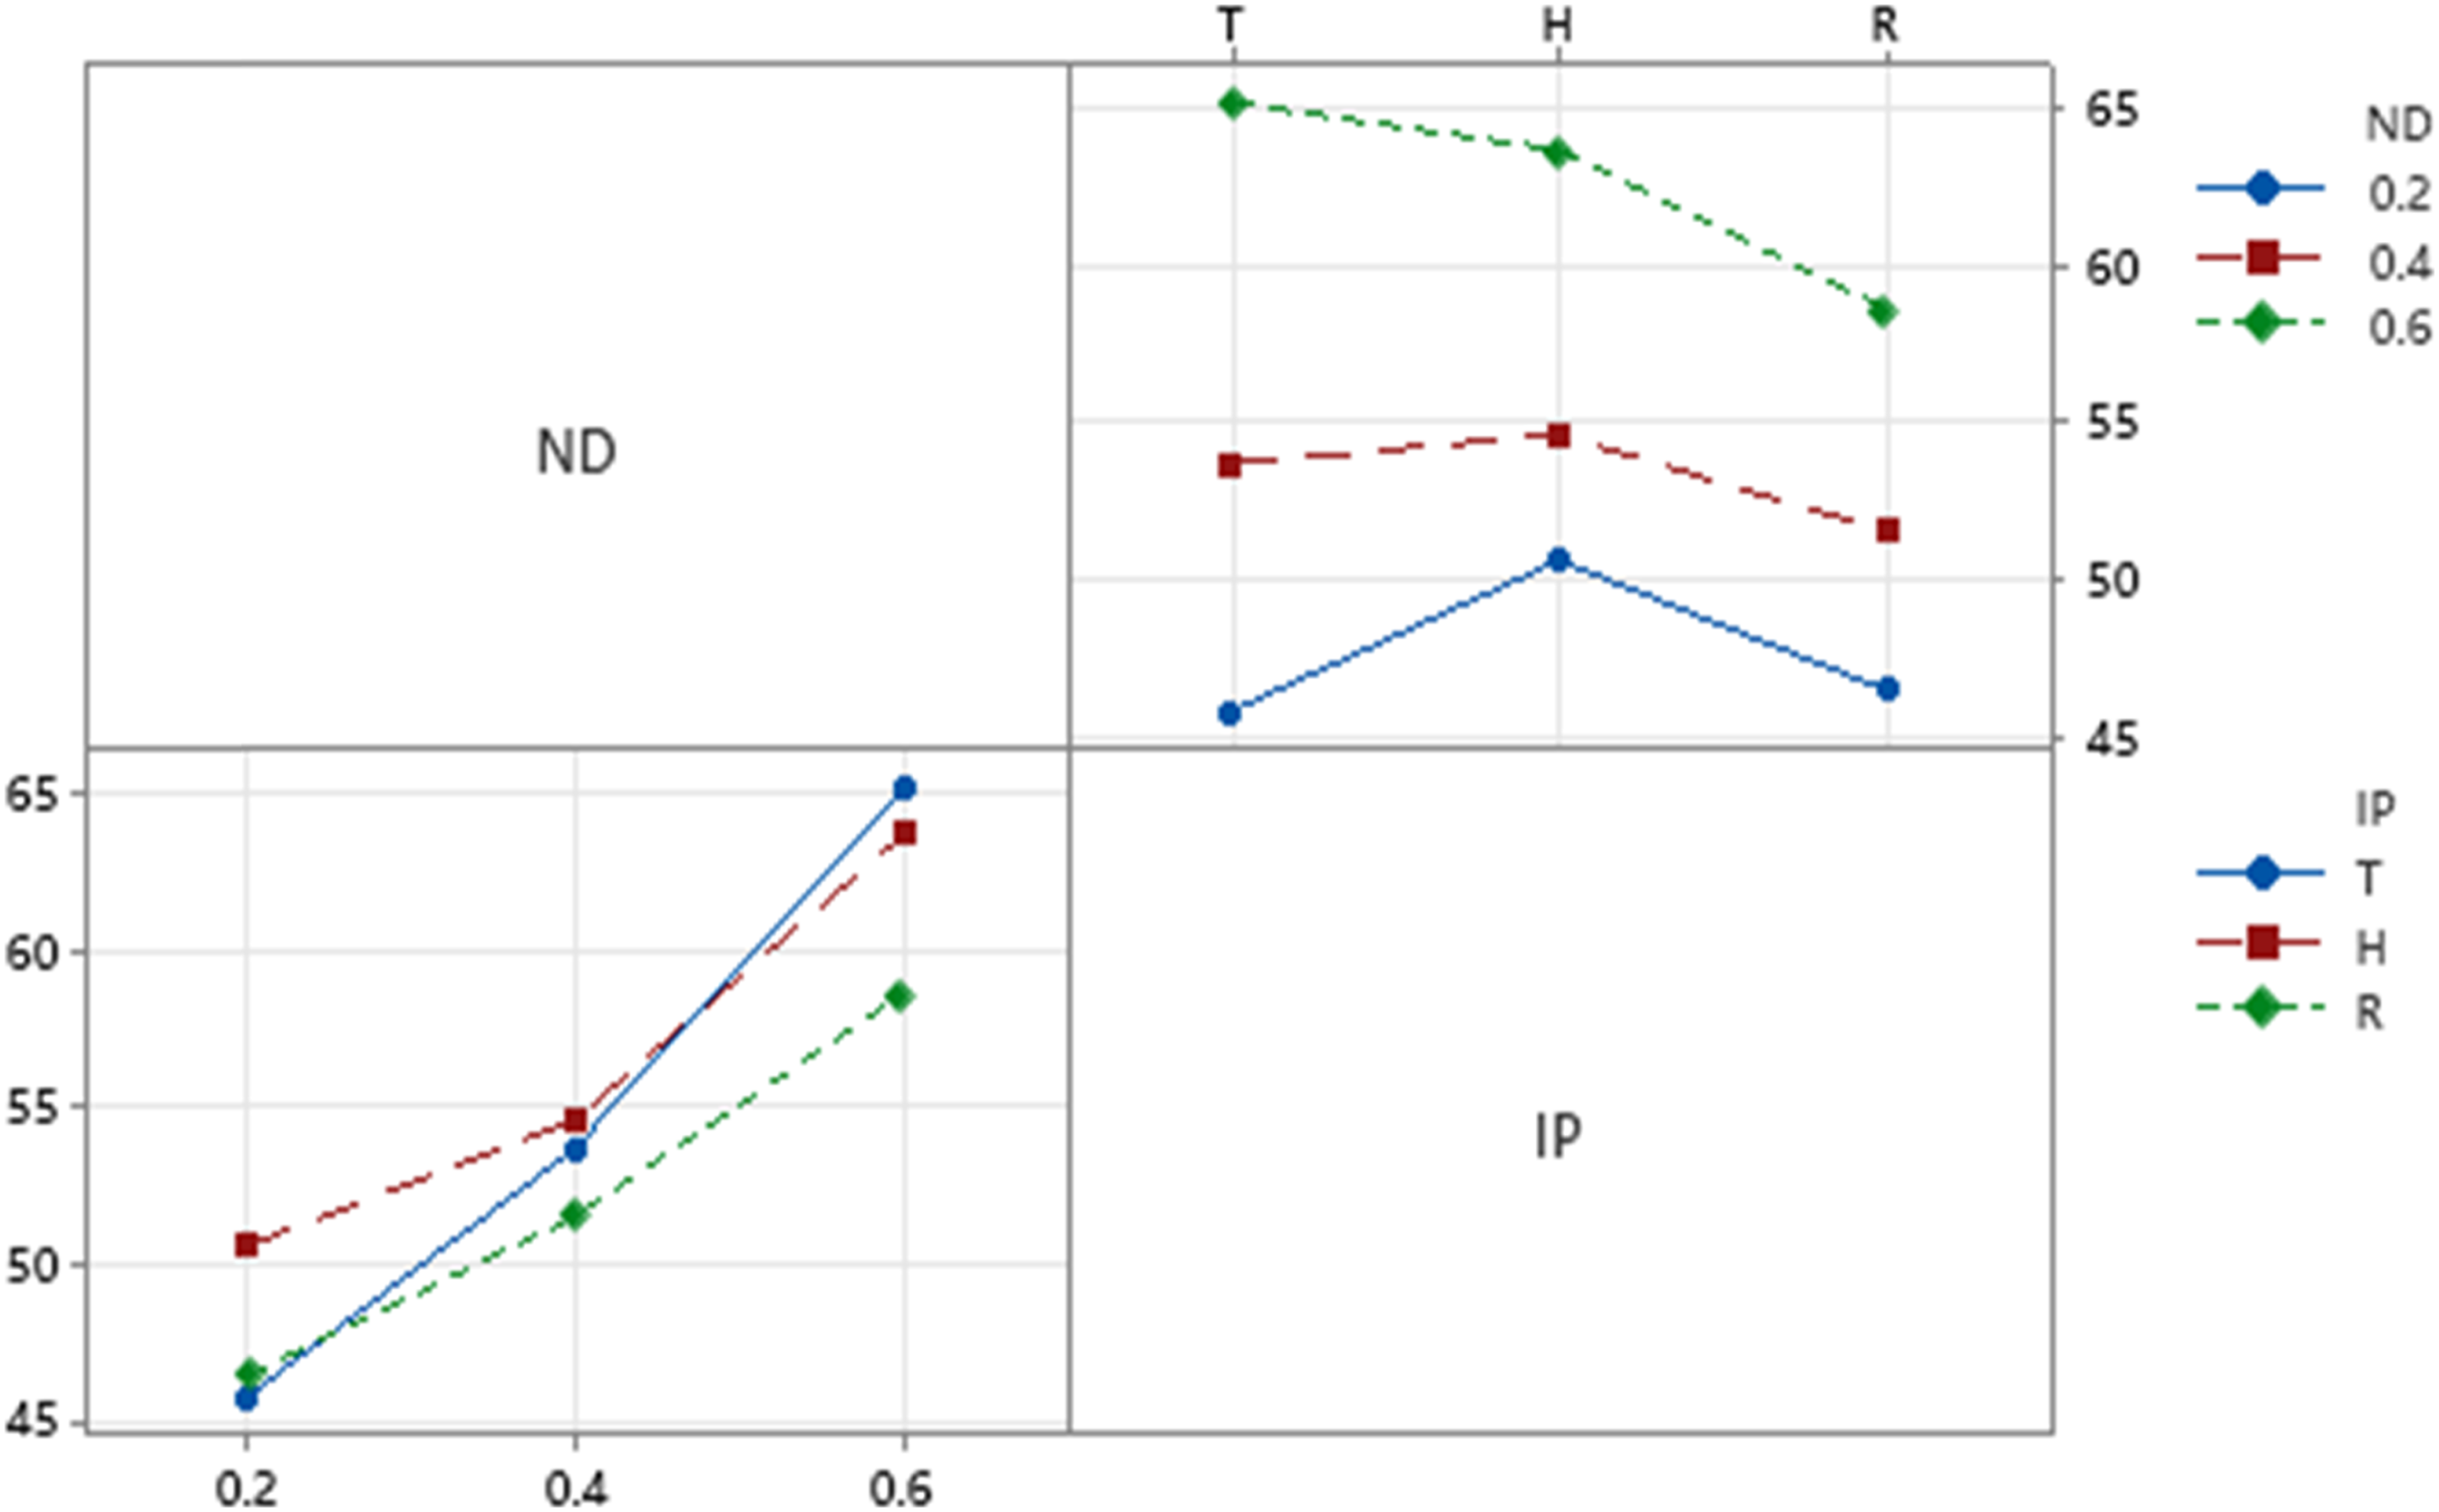
Interaction plots for the flexural strength for CF-PETG.
MWCNTs-PLA
The aforementioned rating can be used to determine process components that have a substantial influence on the target factor and identify the best course of action for control. Figure 21 illustrates the interaction plot to explain how ND and IP behaved in terms of flexural strength for MWCNTs-PLA specimens. Based on an ANOVA, Table 5 displays the % contributions of each of the two process parameters. For CF-PLA specimens, the p-value demonstrates that ND has the biggest influence on flexural strength, followed by IP. Flexural strength has a coefficient of determination (R2) of 96.61%, which specifies how much of the total variation in the response is represented by the model’s elements. Interaction plots for the flexural strength for MWCNTs-PLA. Analysis of variance for MWCNTs-PLA flexural strength. S = 0.44, R
2
= 96.61%, R
2
(Adj) = 93.22%.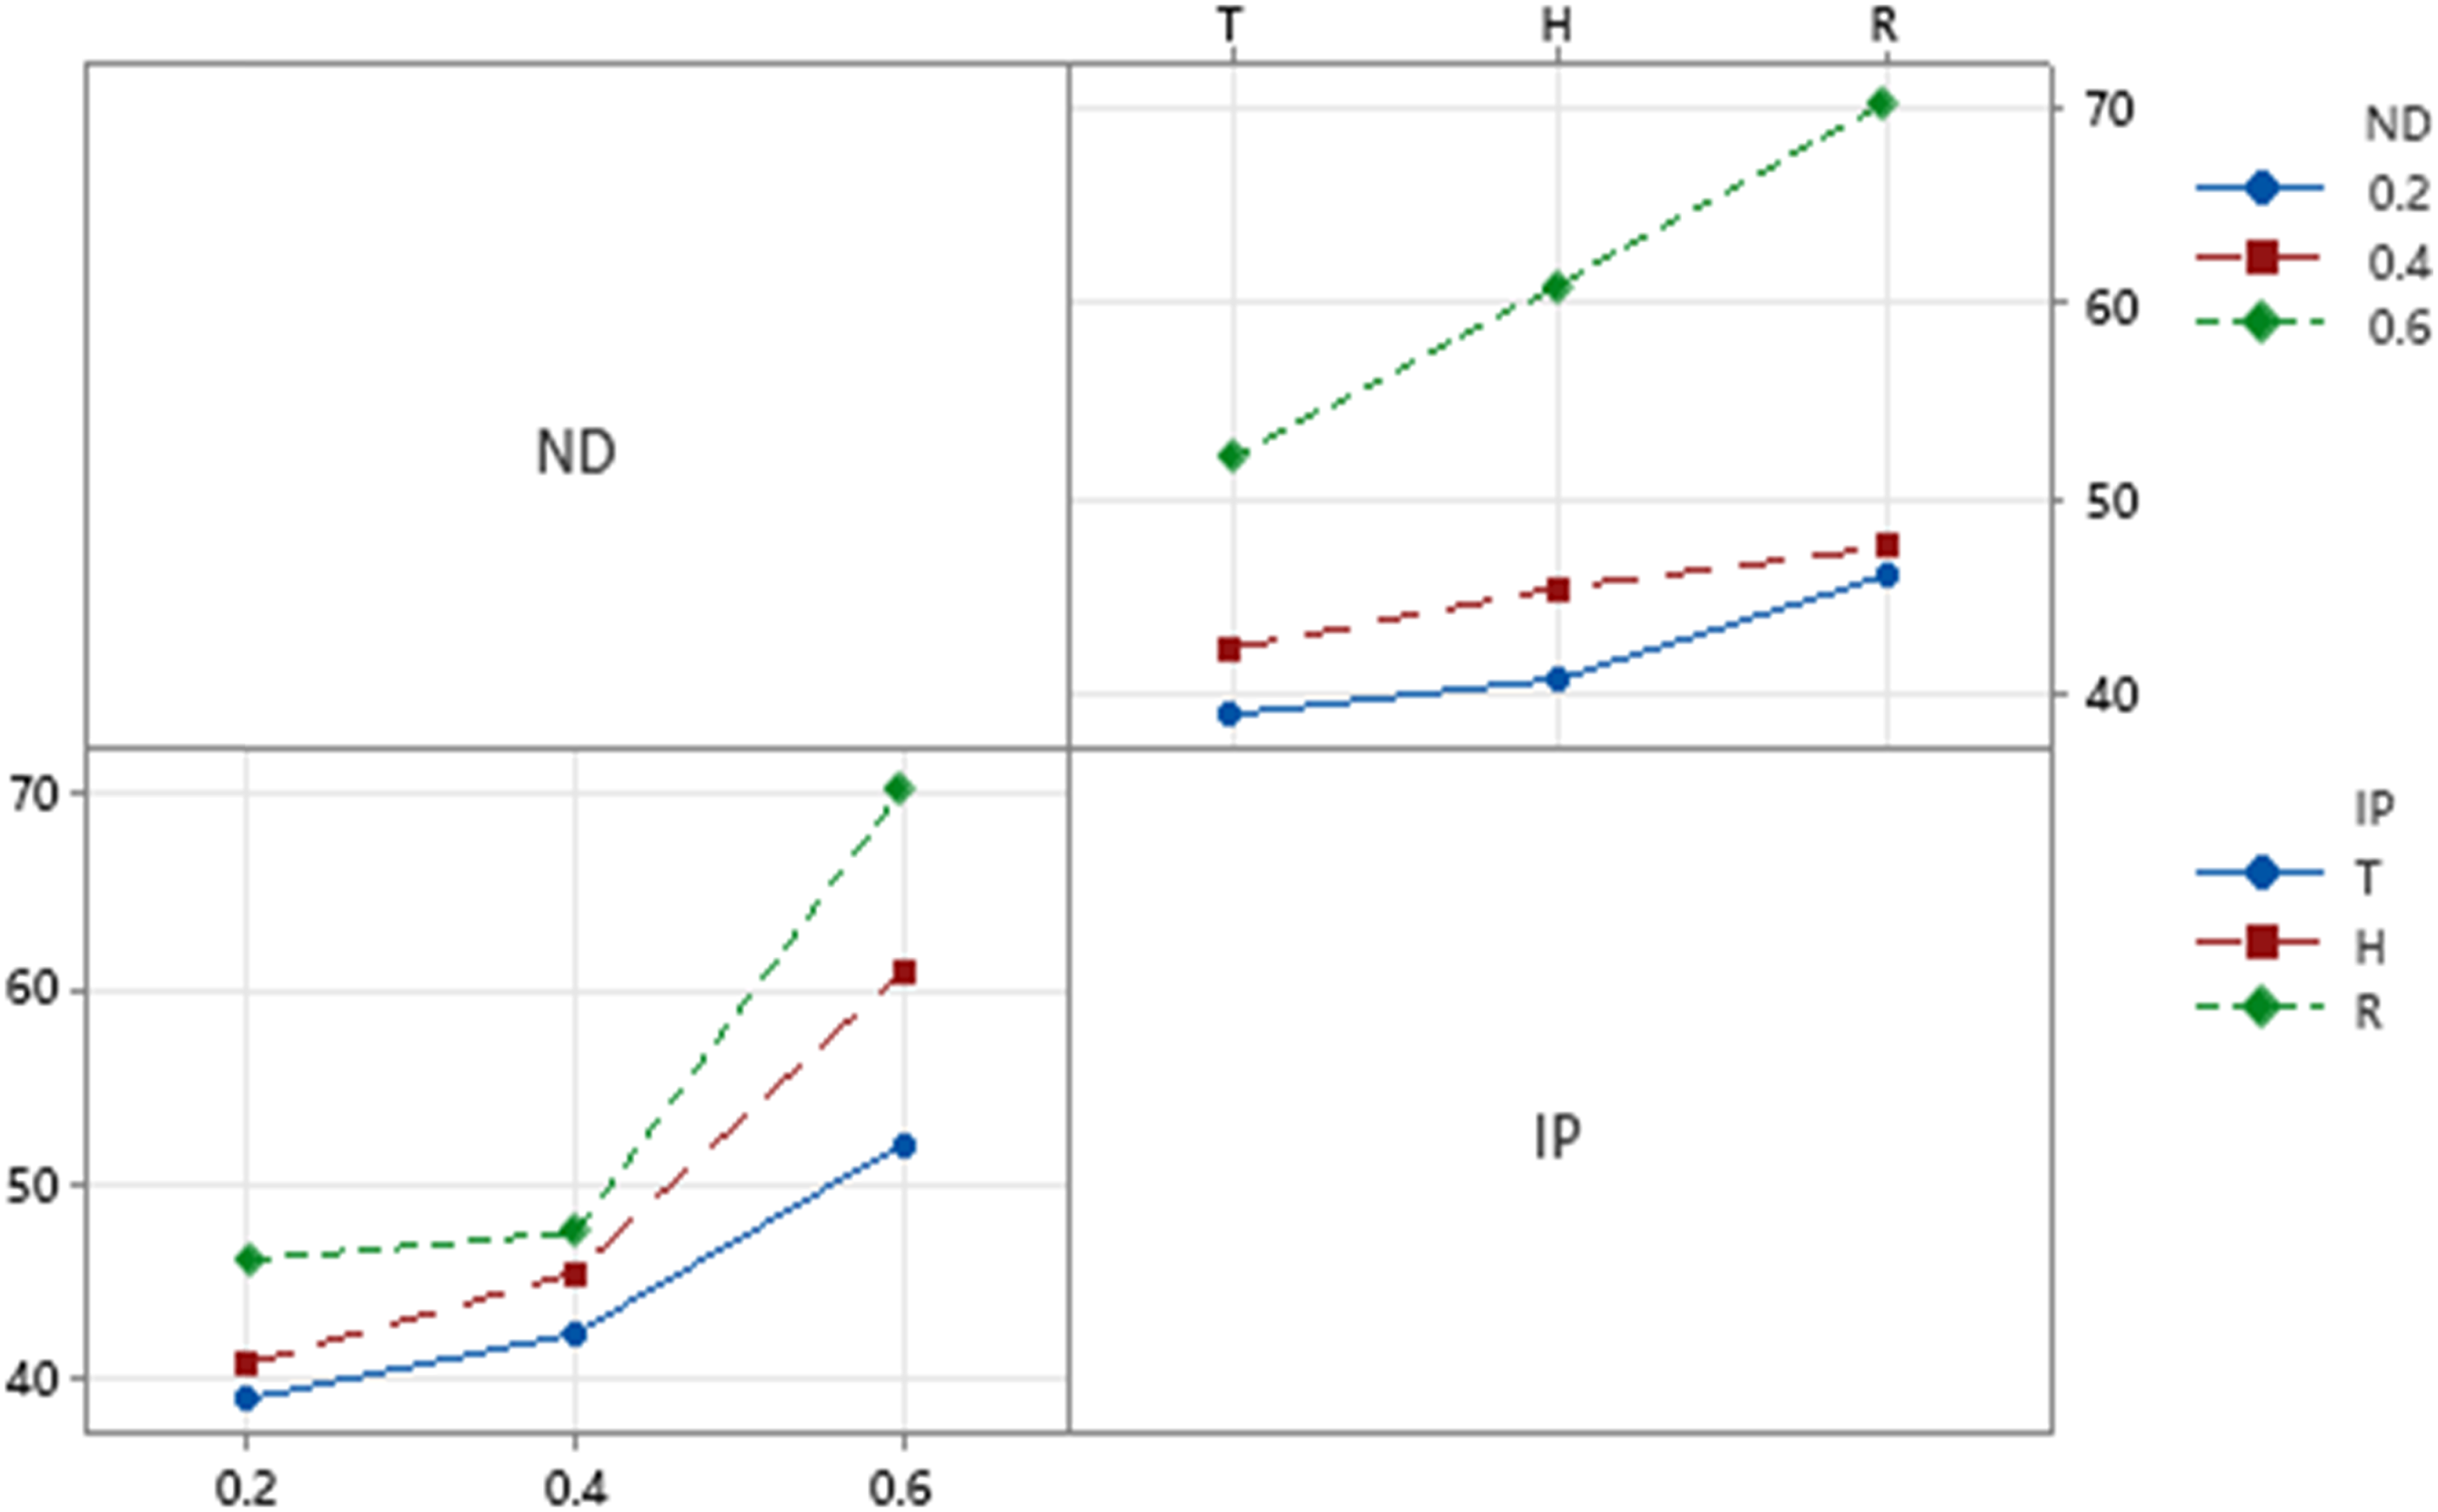
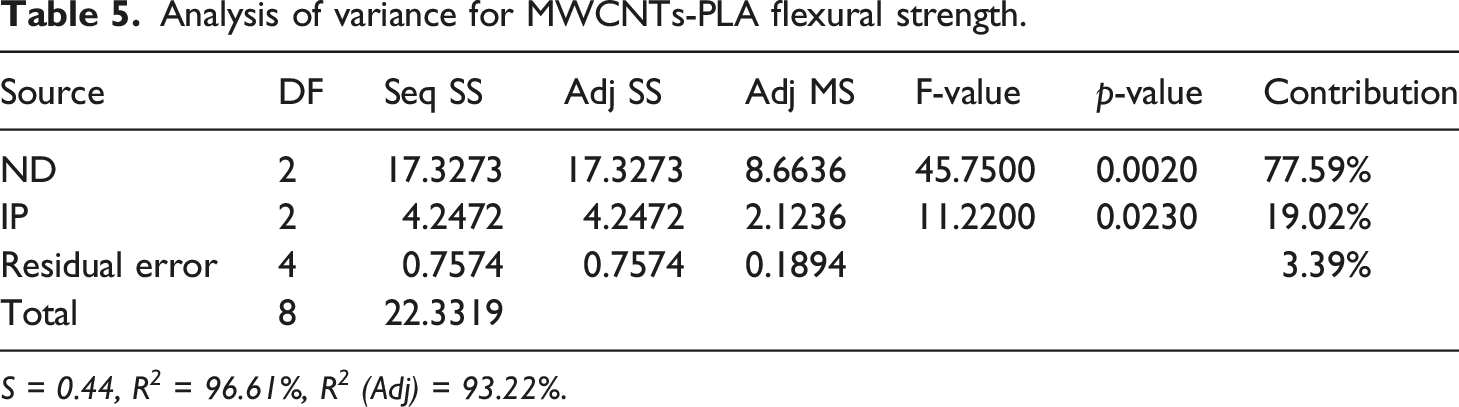
The effect of variation in the process parameters, IP and ND, on the selected target factor, flexural strength, varies for each fabricating material. On analysing the effect of process factors on flexural strength, IP contributes 68.27% followed by ND for CF-PLA specimens, but for CF-PETG and MWCNTs-PLA specimens, the contribution of ND is 88.96% and 77.59%, respectively, trailed by IP. Therefore, the contribution of various factors differs from one filament material to the next; this may be because of the different types and distributions of reinforcing material in the polymer matrix.
Conclusion
The objective of this investigation was to comprehend and examine the flexural features of FFF-fabricated polymer composite materials CF-PLA, CF-PETG, and MWCNTs-PLA specimens in relation to variations in the selected process parameters - ND and IP. This study presents the appropriate material-parameter for higher flexural strength of the polymer composite specimens.
The results indicate that with the increment in ND, the specimens flexural strength increases. On augmenting ND from 0.2 mm to 0.6 mm, the maximum flexural strength enhancement achieved by CF-PETG specimens is 42.20% at triangular IP. For CF-PLA and MWCNTs-PLA specimens, the largest flexural strength improvement detected is 10.79% and 52.24%, respectively on increasing the ND from 0.2 mm to 0.6 mm at rectilinear IP.
The flexural properties of the parts fabricated through FFF process are directly impacted by IPs. For CF-PLA specimens, the highest flexural strength elevation observed is 17.04% on changing the IP from rectilinear to honeycomb at ND 0.2 mm. At ND 0.6 mm, for CF-PETG specimens, the greatest flexural strength improvement noticed is 11.22% on varying the IP from rectilinear to triangular, but for MWCNTs-PLA specimens, it upgraded by 34.83% when the IP modified from triangular to rectilinear.
Overall, the specimen with ND 0.6 mm and rectilinear IP for MWCNTs-PLA as the fabricating filament material exhibited the maximum flexural strength of 70.372 MPa due to the failure of individual rasters without separation including breaking and pullout of MWCNTs. Depending on the fabricating material, an alteration in a process parameter has diverse impact on the target factor. With all coefficients of determination values more than 95%, IP has the highest contribution of 68.27% for CF-PLA, but ND has the main contributions of 88.96% and 77.59% for CF-PETG and MWCNTs-PLA, respectively. In future, this research will assist the researcher and designers for creating the FFF-fabricated parts with better flexural behaviour of the functional parts for various applications.
Footnotes
Acknowledgements
The authors acknowledge the help from ACMS, IIT Kanpur, India for allowing to perform flexural testing. Support from FESEM lab, Department of Chemistry, DEI is highly appreciated for fractography analysis. We are also thankful to the grant received from AICTE (file no. 8-88/FDC/RPS (POLICY-1)/2019-20).
Declaration of conflicting interests
The author(s) declared no potential conflicts of interest with respect to the research, authorship, and/or publication of this article.
Funding
The author(s) received no financial support for the research, authorship, and/or publication of this article.