
Abstract
Silicone rubber (SR) is a highly adaptable material that is attractive for a variety of applications, including electronics, construction, and aerospace. In general, adding Cu-Al-Zn alloy to the SR matrix improved the mechanical properties of rubber composites and noise attenuation. The mechanical, magnetic, ultrasonic, and acoustic characteristics of the resulting SR-composites were characterized. According to variations in treated Cu-alloy loading, ultrasonic measurements were performed as the ultrasonic velocities, Poisson’s ratio, Young’s modulus, acoustic impedance, ultrasonic attenuation coefficient, and micro-hardness. Results indicated that adding treated Cu-alloy to SR-composites improves them significantly. They showed that curing time decreases gradually, tensile strength increases constantly and elongation at break of SR-composites has maximum value at 15% treated Cu-alloy. The coupling agent 3-(Trimethoxysilyl) propyl methacrylate (TMSPM) improves the mechanical properties of the composites by forming a network structure in the SR matrix and enhancing the interfacial interaction between the Cu-alloy and the SR matrix. The acoustic sound absorption coefficient, reflection coefficient, and damping factor calculations were studied in addition to the decibel drop ranging from 0.4–4.9 dB. The composite sample SR-4 is considered to have the optimal percentage of the selected acoustic properties studied. Thus, the shielding efficiency of SR-composite increased with increasing content of Cu-alloy which makes it applicable in ear plugs and electronic applications.
Introduction
Acoustic and electromagnetic pollution is a growing problem in a variety of industries, including aerospace, transformer substations, cellphones, and engines. Electromagnetic wave radiation and acoustic noise not only obstruct gadget performance, but they also endanger human health. As a result, multi-functional structures with good electromagnetic and acoustic wave attenuation and shielding are needed. Furthermore, a concerted effort has been undertaken to limit acoustic noise pollution, which has a negative impact on human psychological and physiological health. 1 Sound attenuation, in particular, remains a concern due to its great penetrating power, which makes it a harmful kind of environmental pollution. 2 To accomplish sound attenuation corresponding to the mass density law, traditional sound insulation materials require a lot of weight and thickness, which limits their uses where space and/or weight are constrained. Electromagnetic and noise shielding materials that are both light and efficient are desperately needed.3–5 Rubber possesses unique properties in terms of high elasticity, durability over multiple deformations, chemical and physical stability as well as relative ease of manufacturing, which renders it as recommended and irreplaceable material in a wide range of applications. Meanwhile, it has undesirable properties like low tensile strength (TS) and more plastic and sticky properties on heating in organic solvent. 6
Silicone rubber (SR), which is chemically and thermally stable, is widely used in a variety of industries, including the medical field, advanced national defence technology, aerospace manufacturing, and the fine chemical industry; however, because of its very low mechanical strength, it is challenging to meet the demands of industrial use. 7 SR has many difficult properties; it is an acoustical sealant that reduces and isolates sound. 8 The density and mechanical properties of SR determine how effective they are at blocking sound. As a result, several additives are added to the SR to ameliorate the density or mechanical properties and improve the silicon’s isolation ability. 9 SR is commonly utilized as a composite matrix because it is easily made and has excellent mechanical and dielectric properties. Silicone elastomers provide a number of benefits, including resistance to temperature changes, environmental factors, and chemicals, as well as the absence of any harmful effects on human cells. It has long been a significant industrial effort to add fillers like CBs, SiO2, clays, and talc to rubber materials in order to increase their performance. The type of filler, shape, and particle size, the filler’s percentage, and the interaction between the filler and rubber matrix are only a few of the variables that affect how much these fillers increase. 10
Selecting the proper filler can improve mechanical strength and can reduce the abrasion. 11 In consequence; improved mechanical properties make it possible to use such materials in innovative, modern and unique solutions. 12 Shape memory alloys (SMAs) are a class of smart materials that exhibit a property known as the shape memory effect (SME). Among the most common SMAs (Cu-Al-Zn SMAs) which are promising smart and intelligent engineering materials. Cu-based SMAs have attracted a great attention because of their good shape memory capacity, simple fabrication process, cost-effective raw materials, higher transformation temperatures and better electrical and thermal conductivity. When metal alloy powder is introduced to a rubber matrix, it can speed up or slow down the crystallization of rubber composites, alter their mechanical characteristics, and improve noise absorption.13,14 The objective of the acoustics section is to have a better understanding of what characterizes the acoustical performance of a material for specific applications. The determination of velocity and attenuation is one method for achieving acoustic characterization, among other methods such as impedance measurement. The first form of measurement is more easily accomplished in the ultrasonic range, while the second is more easily accomplished in the audible range, for technological reasons. Our experimental setup and signal processing techniques were created with the goal of determining ultrasonic parameters. The ultrasonic method is a nondestructive test used to detect discontinuities such as voids, cracks, and inclusions. Researches demonstrated the efficiency of ultrasonic to detect defects in silicon rubber. 15 In addition, ultrasonic can be used to analyze a material’s qualities, such as its porosity, microstructure, grain size, etc. For such purposes, ultrasonic velocity and ultrasonic attenuation coefficient are employed. The ultrasonic velocity and the ultrasonic attenuation coefficient are used for such purposes.16,17 As a result, changes in the material structure caused by chemical or physical changes can be observed directly. The density and the ultrasonic velocity can be used to calculate elastic modulus such as Young’s, bulk, shear, and longitudinal modulus. 18 Using ultrasonic measurements, Poisson’s ratio, acoustic impedance, Lame’s constants, and micro-hardness can be obtained. 19
The objectives of this study are to develop and propose an acoustic shielding material (SR-composites) for earplugs and electrical applications. Treated Cu-alloy was incorporated into the elastomer matrix based on silicon rubber, and a standard sulfur-based curing system was used for the cross-linking of rubber composites to modify the physico-mechanical properties of composites. The effects of loading levels of treated Cu-alloy on ultrasonic and acoustic measurements of the obtained SR-composites are analyzed and treated Cu-alloy is used as a reinforcing filler. Moreover, scanning electron microscopy (SEM) and atomic force microscopy (AFM) will be used to analyze the dispersion phenomenon in the tested composites.
Materials and experimental methodology
Materials
SR was supplied by SONAX (Neuburg, Germany). While lead monoxide of minimum assay (98%) was supplied by Oxford Laboratory (Mumbai, India). The fillers used to reinforce the SR matrix were a Cu-based alloy (Cu-Al-Zn alloy) DEVARD`s Alloy Extra pure, LOBA CHEMIE PVT.LTD N-Cyclohexyl-2-benzothiazole sulphenamide (CBS) under the trade name Rhenogran® CBS-80 and Vulkacit® CZ was purchased from Rheinehemie Germany. CBS was used as an accelerator. Zinc oxide (ZnO) and stearic acid (St Ac) (used as activators) had specific gravities of 5.55–5.61 and 0.9–0.97, respectively, at 15°C. They were supplied by the Aldrich Company in Germany. Peroxide is used as a vulcanizing agent, and polymerized 2,2,4-trimethyl-1,2-dihydroquinoline (TMQ) (used as an antioxidant) is a commercial-grade product.
Preparation of SR composites
Formulations and rheological characteristics of silicon rubber loaded with different content of Cu-alloy.
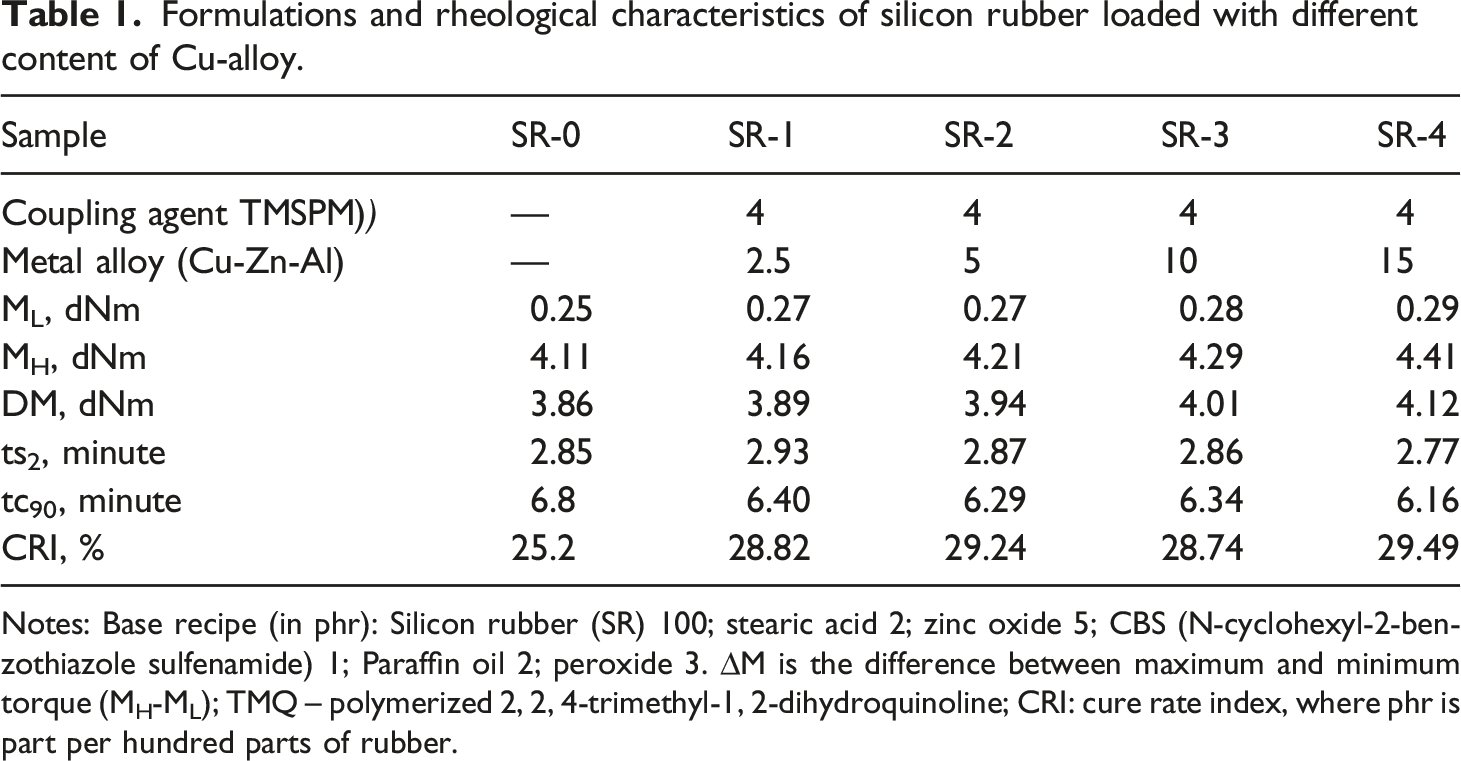
Notes: Base recipe (in phr): Silicon rubber (SR) 100; stearic acid 2; zinc oxide 5; CBS (N-cyclohexyl-2-benzothiazole sulfenamide) 1; Paraffin oil 2; peroxide 3. ∆M is the difference between maximum and minimum torque (MH-ML); TMQ – polymerized 2, 2, 4-trimethyl-1, 2-dihydroquinoline; CRI: cure rate index, where phr is part per hundred parts of rubber.
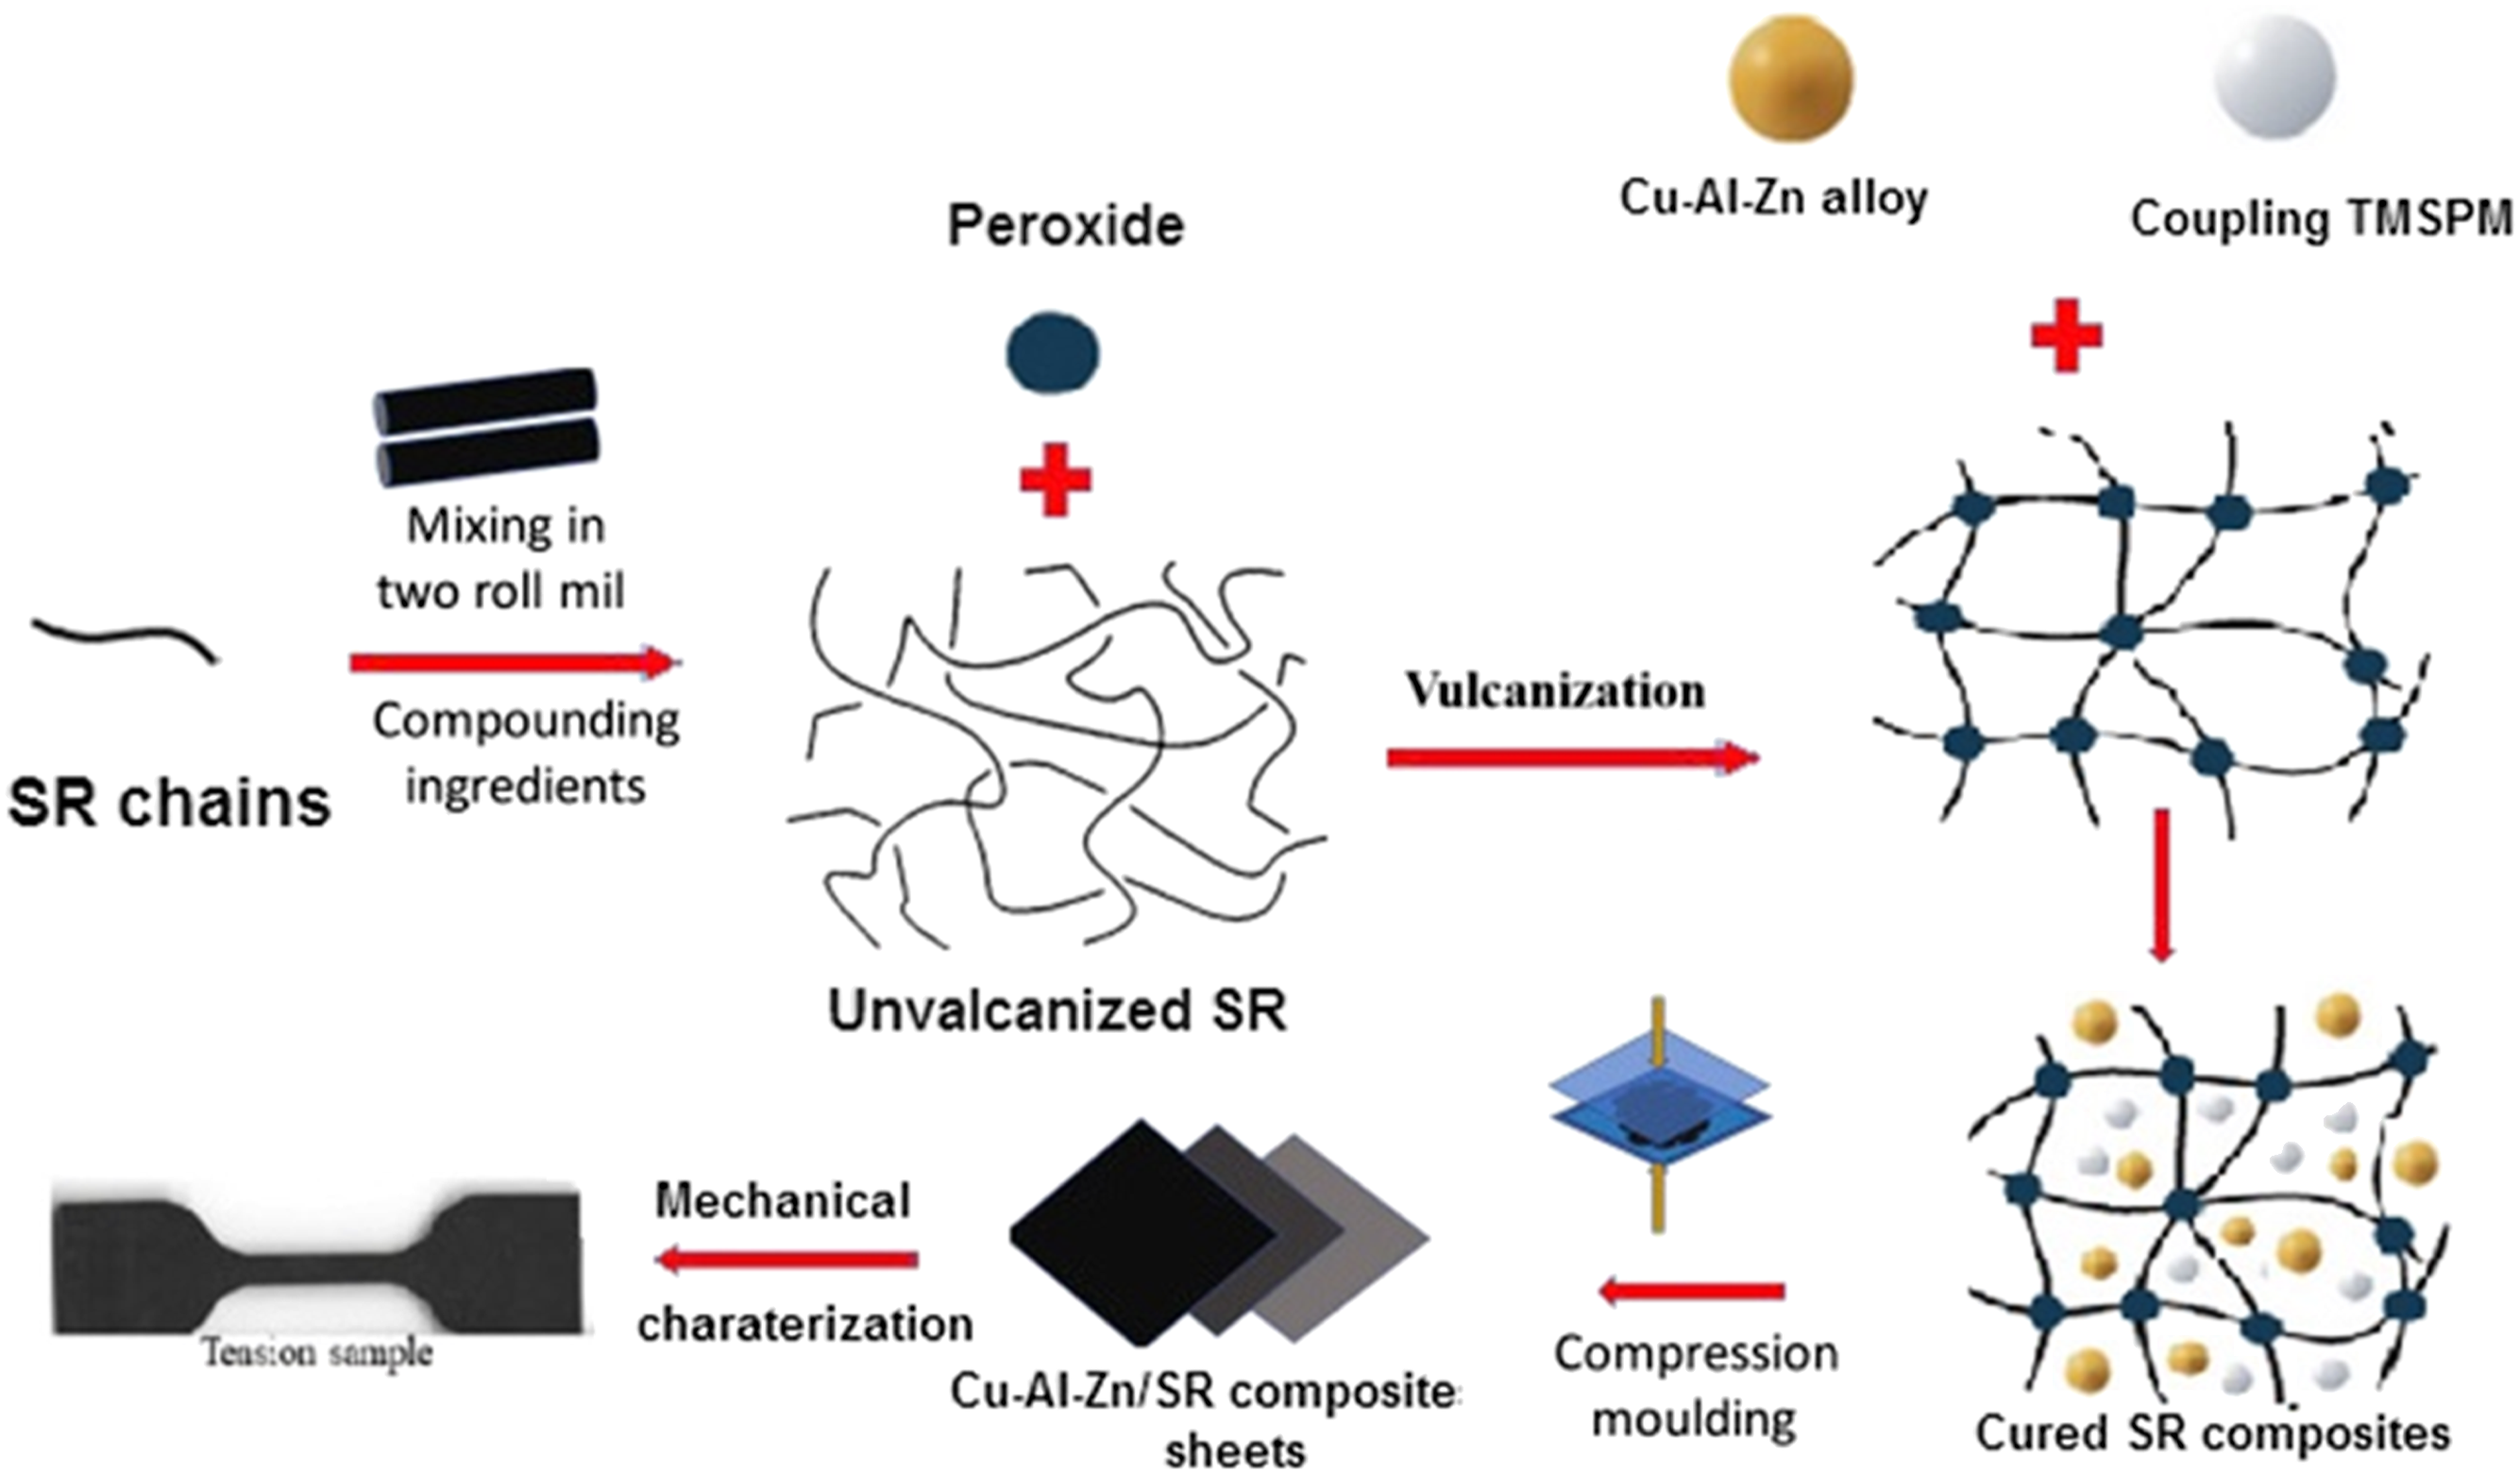
A schematic illustration of the preparation of SR-based composites.
Characterization
SEM analysis
SR-composite morphologies were estimated by SEM analysis (SEM) (JEOL JX 840) micro-analyzer electron probe (Japan).
Atomic force microscopy
The topography was measured using AFM in AC mode. The AFM is coupled with WiTec Raman microscope 300 R, Germany.
XRD analysis
XRD measurements of SR-composites were performed on the wide-angle goniometer of Empyrean diffractometer operated at 45 kV and 30 mA. The X-ray wavelength is Ni filtered Cu Kα (1.54056 Å). The obtained diffractogram at ambient condition in the 2θ range (4–80) with step size 0.02 2theta and step time 20 S/step. Instrumental broadening was corrected using a quartz standard sample.
Magnetic measurement
The magnetic characteristics of SR-composites were obtained at room temperature using a Vaibrating Sample Magnetameter (VSM) lake shore [model 7410] USA.
Rheometric characteristics
An oscillating disc rheometer (R-100) was used to test the rheometric properties of SR composites containing varying amounts of Cu-Al-Zn in the presence of coupling TMSPM agents (MDR one Moving Die Rheometer, TA Instruments, New Castle, DE, USA) at 152 ± 1°C according to ASTMD2084-11 (2011).
Mechanical properties
TS, which was performed in accordance with ASTM D412-06a (2013), elongation at break, and stress at 100% and 200% strains were measured using a Zwick Roell Z010 tensile testing machine (Ulm, Germany). Three measurements were measured for each sample, and the average value for each sample was then calculated.
Ultrasonic measurements
The transmission technique was used as an ultrasonic mode of operation, following the ASTM standard (ASTM E114-15, 2015) 21 by direct contact pulser receiver transducers. Longitudinal normal beam ultrasonic transducers of 4 MHz (S12HB4, Karl Deutsch) and 2 MHz (S24HB4, Karl Deutsch), in addition to a shear ultrasonic transducer of 2 MHz (S12Y2, Karl Deutsch) were used. The ultrasonic flaw detector (USN60, GE inspection technologies) has an A-scan display and gave distance/amplitude information, and the oscilloscope (LeCroy W, wave Jet 354A) displayed time/amplitude of the echoes. Standards blocks (VI and VII) were used as reference test blocks to calibrate thickness measurements. The measurements were carried out in ambient room temperature 25 ± 10°C and relative humidity 45 ± 5%.
Acoustic measurements
The SR composites’ sound absorption was tested using impedance tube (Brűel and Kjaer-4206, Denmark) as stated in ASTM E1050, ISO10534-2, where cylindrical shape samples were cut with diameter of 29 mm. In the impedance tube, the loudspeaker position is in the front side of the tube, and the composite samples are placed on the other side. A sine generator is used to adjust and generate the sound frequencies. The sound waves are transmitted within the tube and then strike the sample. The two microphones are placed in between the speaker and the measured samples. A software program is used to calculate the sound absorption and reflection coefficients. The high-frequency sound waves were examined between 1600 and 6300 Hz at 25°C. To produce consistent and representative findings, each of the tests for one sample was repeated at least four times. The thickness values of the samples were in the order of 4 mm.
Results
SEM measurements
The SEM micrographs in Figure 1 showed the effect of Cu-Al-Zn alloy loading in the presence of TMSPM (a coupling agent) on the SR composites’ morphology. The bright phase represents the Cu-Al-Zn alloy particles, and the dark phase corresponds to the SR matrix. Figure 2(a) shows the SEM image of the tensile fracture surface for the SR rubber matrix without investigating the alloy. It can be observed that the surface is smooth and compact due to the crosslinking of SR. Figure 2(b) illustrates a SEM image of the tensile fracture surface for Cu-alloy/SR composites containing 2.5 phr-treated Cu-Al-Zn alloy; it can be seen that the alloy somewhat adhered to the SR rubber matrix; no holes were present in the rubber matrix; and the SR rubber surface became somewhat rough. All these observations indicated that the alloy adhered well to the SR rubber matrix. The SR rubber matrix has a smooth surface, while the white spots represent the cutting surfaces of the treated Cu-Al-Zn alloy and confirm the good adhesion between the Cu-alloy treated by TMSPM and the SR rubber matrix in the presence of a coupling agent (Figure 1(d)). The density of agglomerates in SR-composites increased at high content of treated alloy in the composites which imposes an extra resistance to flow.
22
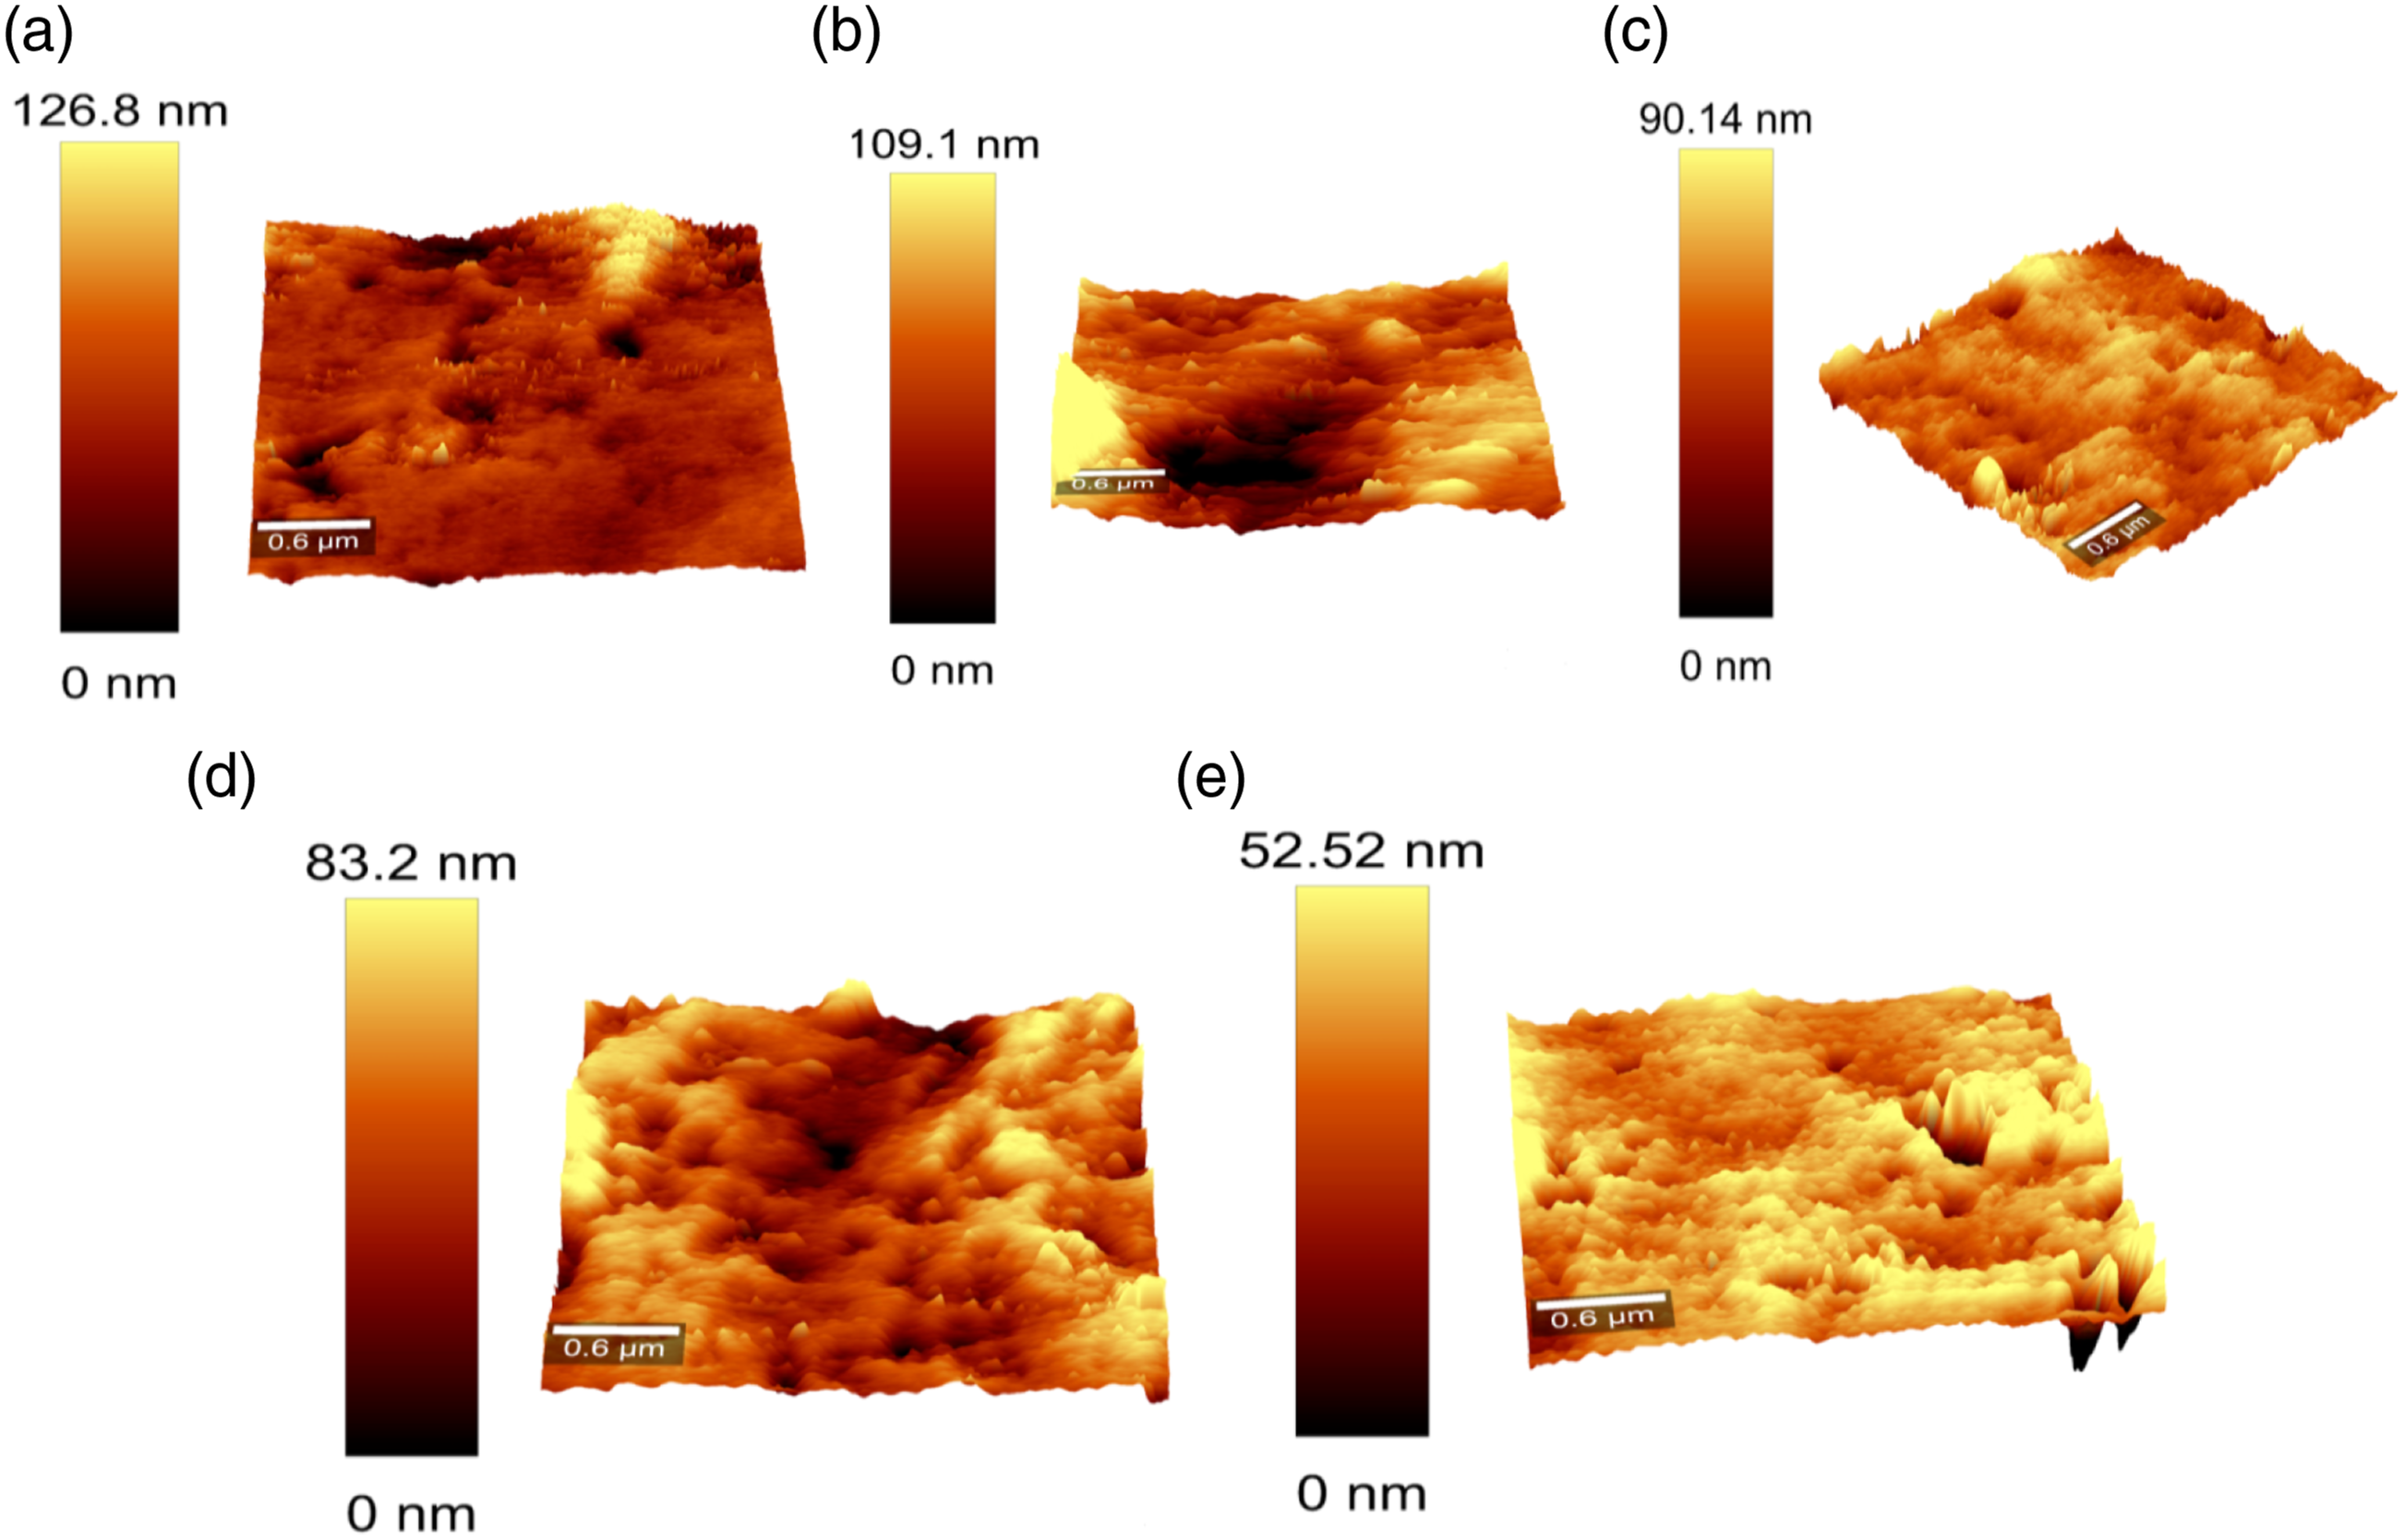
This will lead to more resistance to the mobility of the chain during deformation and increase their viscosity, which relates to the minimum and maximum torque values (there is a slightly increase the value of ML and MH) (as shown in Table 1). From SEM micrographs, it was observed that the existence of a coupling agent (TMSPM) impacts the size and shape of the dispersed particles. The TMSPM promotes the filler-matrix interaction between the Cu-alloy particles and SR matrix. SEM pictures of silicon alloy specimens of different alloy content. AFM 3D image of (a) SR-0, (b) SR-1, (c) SR-2, (d) SR-3 and (e) SR-4.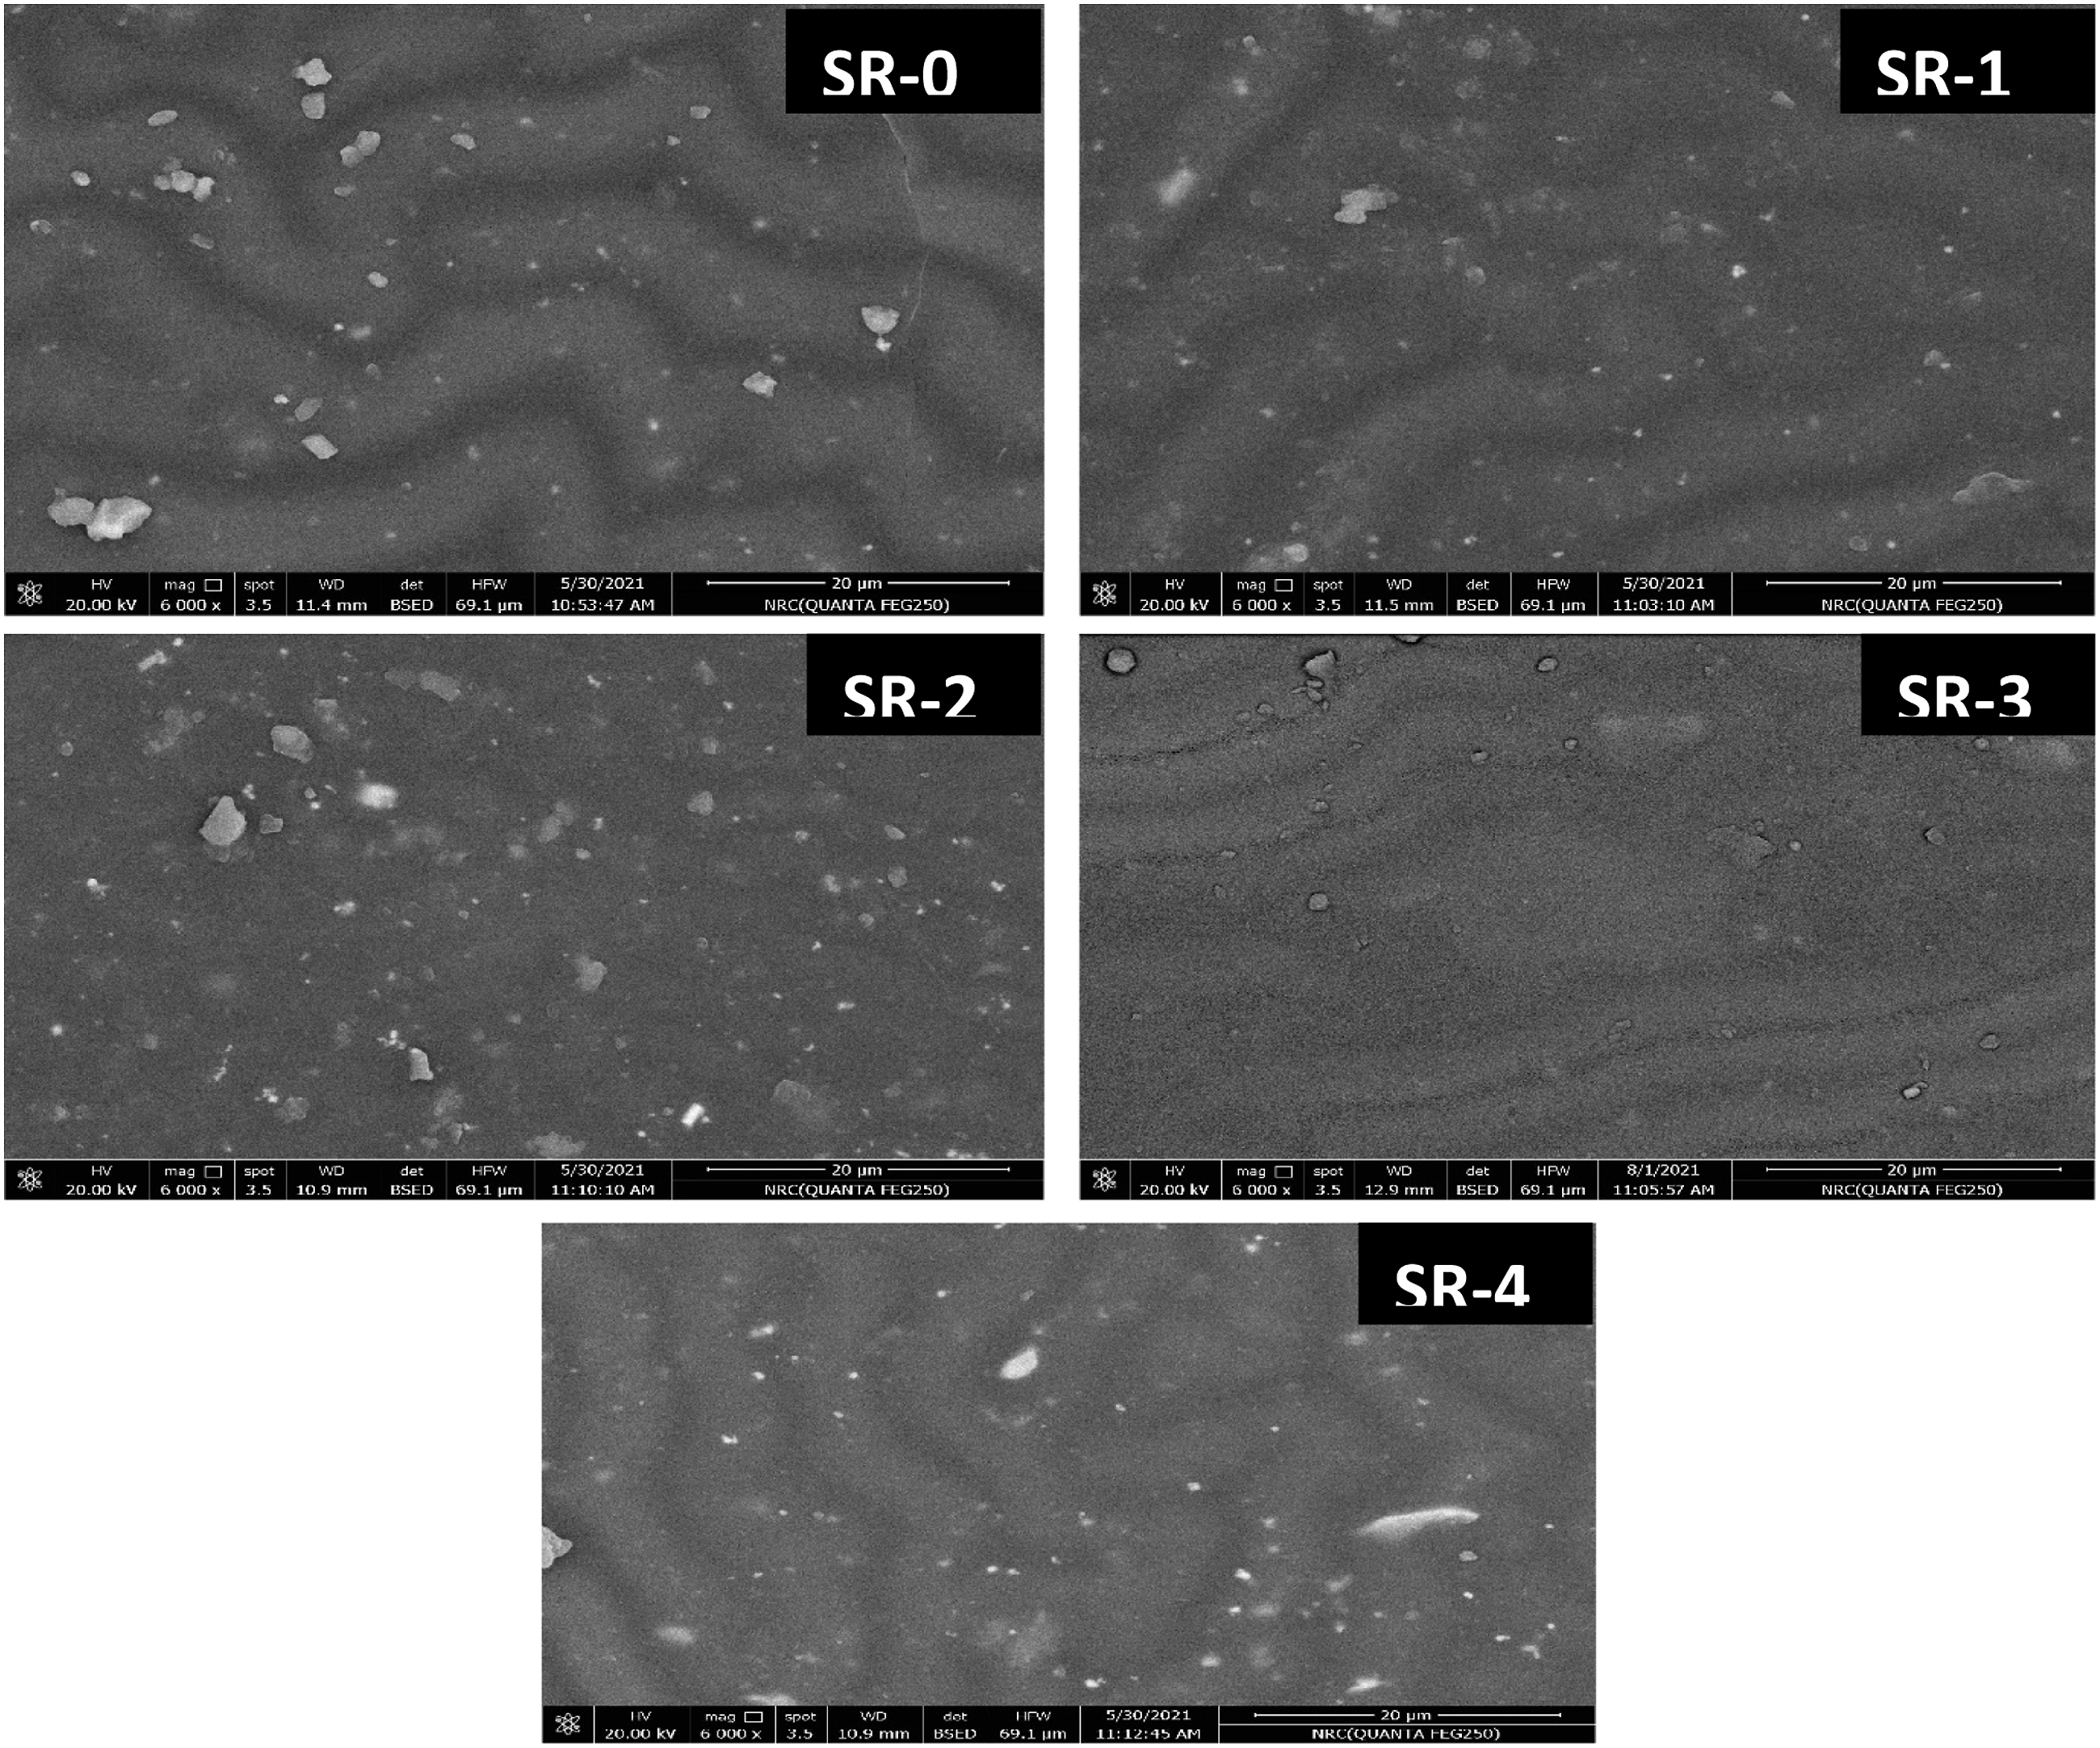
AFM studies
Figure 2 depicts typical 3D AFM images of silicon rubber surfaces before and after treatment with Cu-alloy. The different colors in the photographs can be used to examine the morphology; depending on the formulation, 2 or 3 color scales were identified (the samples are generally composed of silicon rubber and filler).23,24 The RMS roughness obtained from AFM analysis gives only primary information about the fine-scale fluctuations in the effective surface height. As the treated Cu-alloy was present, it was determined that the lighter parts correspond to the filler, and the areas with intermediate shades correspond to SR. The silicon rubber surface exhibits a uniformly smooth surface with rounded peak shapes and an RMS roughness value of 126.8 nm. The SR-1 surface displays smaller, sharper peaks, with the RMS roughness being about 109.1 nm comparable. Additionally, the presence of a few sharp peaks on the silicon rubber surface was observed, which can be associated with increasing the content of treated Cu-alloy. As illustrated in Figure 2(e), sample SR-4, which contains 15 phr of treated alloy, is more homogeneous and slightly smoother than other composites.
X-ray diffraction
XRD diffraction pattern of the metal alloy, blank silicon rubber as well as the blend of silicon rubber loaded with different percentages of the metal alloy shown in Figure 3. To identify the collected pattern, the peak positions and relative intensities were extracted using the Highscore Plus software. The metal alloy could be indexed as bi-phasic sample Figure 3(a) within a wide 2θ range. The major phase reflection at 2θ = 20.76°, 29.44°, 36.95°, 37.94°, 42.11°, 42.63°, 47.34°, 47.84°, 57.17°, 61.47°, 67.09°, 69.22°, 77.54°, congruous to the reflections 110, 020, 002, 121, 220, 112, 130, 022, 222, 332, 123, 240, 332 of the tetragonal aluminum copper theta Al2Cu-θ phase, with space group I4/mcm specific with the ICSD no. 98-015-1372. Peaks at 2θ = 44.02°,44.19°, 64.3° congruous to the reflections 2 −1 0, 1 0 10, 0 2 10, of the minor hexagonal phase aluminum copper zinc Al4.2Cu3.2Zn0.7, space group R-3 specific with the ICSD no 98–005-7730. X-Ray diffraction pattern of the Cu-alloy.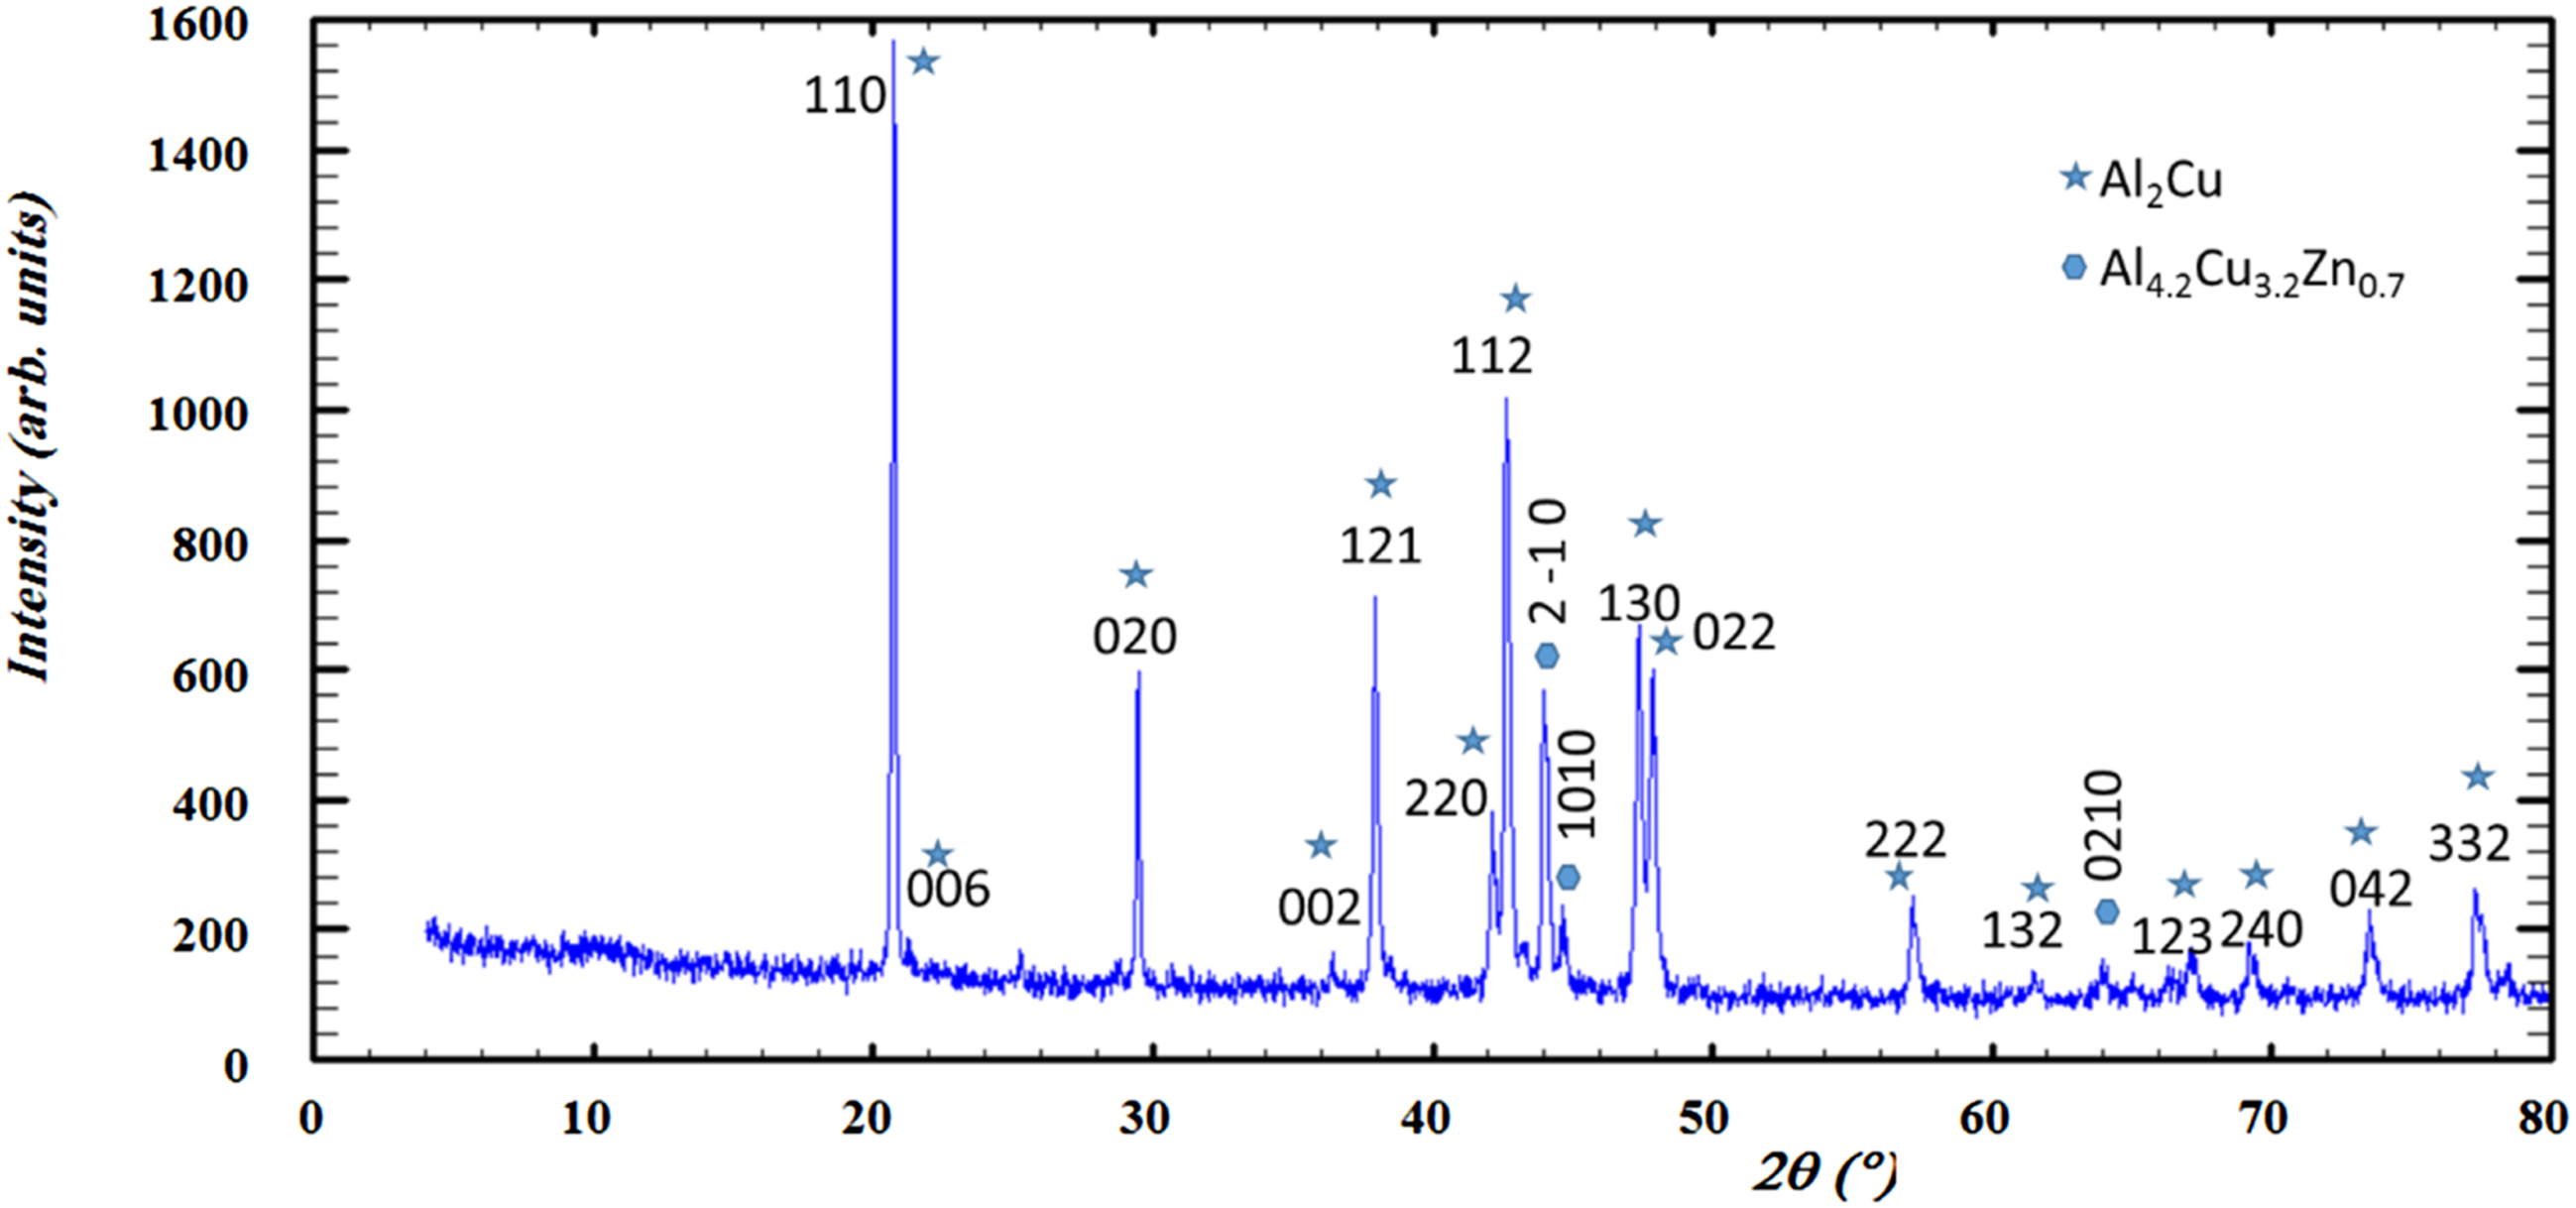
To understand the effect of metal alloy filler on SR samples and to gain insight about the change in the crystalline structure of the polymeric material, XRD analysis was carried out. The diffraction pattern of the silicon rubber (SR) blank sample shown in Figure 1(b), the broad peak centered at 2θ = 11.81° related to both of silicon rubber as well as SiO2, while the broad hallo from 20–25 confirming the presence of some amorphous SiO2 and peaks at 2θ = 27.34°, 29.48°, 31.87°,33.63°, 36.26°, 47.67°, 53.45°, 56.7° related to the crystalline silicon dioxide and matched with the ICSD card no. 98–17-3141. The peaks at 2θ = 31.78°, 34.36°, 36.26°, 47°, 56.6°, 62.86°, 67.7°, 69.24° related to ZnO zincite ICSD 98-16-4209, there are convolution between the diffraction peaks of SiO2 and ZnO at lower theta values up to 60 degree and no new peaks appeared related to any other materials in the formulism. Figure 4(c) represents the diffraction pattern of the SR with coupling agent and loaded with 2.5 phr of the metal alloy, by comparing the diffraction pattern of both of blank sample with that loaded with 2.5 phr, the position of the peaks does not change which implies that there is no intercalated structure in the SR and a novel peaks appeared at 2θ = 20.7°, 38°, 42.7°, 47.4°, 47.8° are due to the major peaks of the metal alloy AlCu2 ICSD no. 98–015-1372 in addition to the intensity of the peak at 2θ = 29.48° was enhanced due to the overlapping of the peak of the SiO2 with that of the metal alloy. However, the intensity of the main SR peak at 2θ = 11.8° decreases and become boarder, this may be due to the addition of both of the coupling agent and the Cu-alloy. (a–f): Wide angle X-ray diffraction pattern of the proposed samples, a-metal alloy, b- SR, C-F SR loaded with TMSPM and 2.5, 5, 10, and 15% phr of Cu-alloy.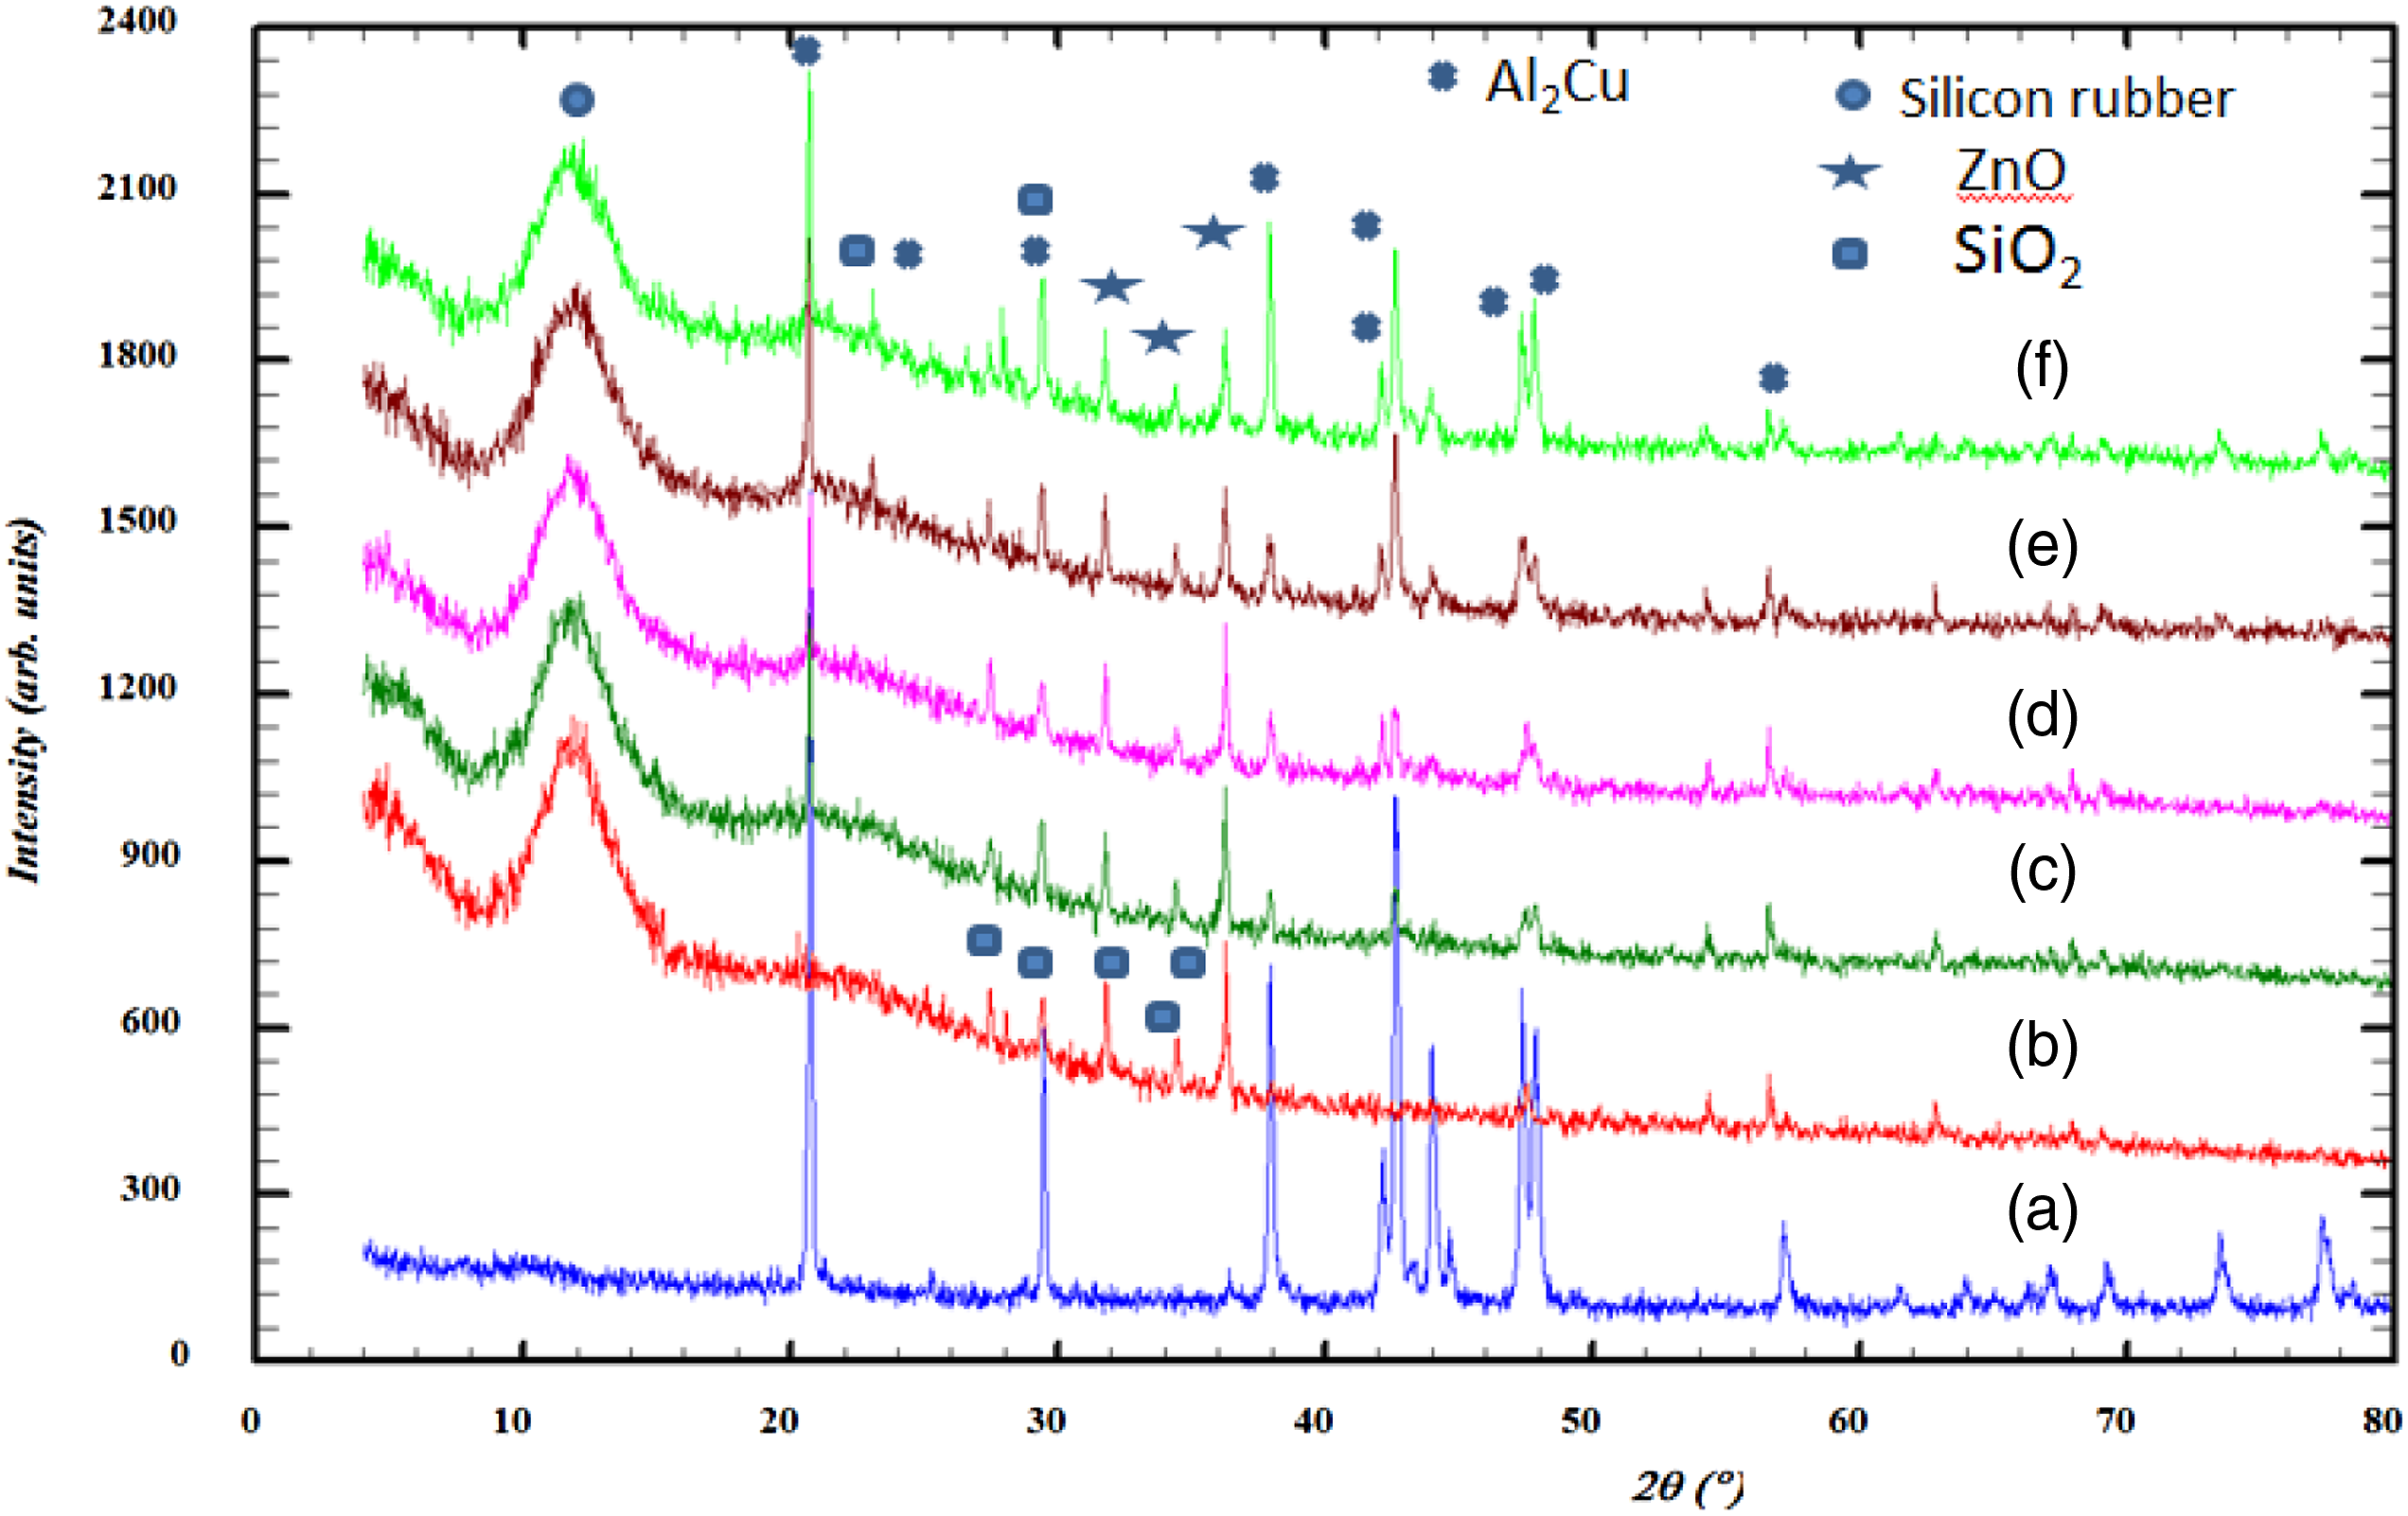


The crystallinity index of the prepared SR-composites.
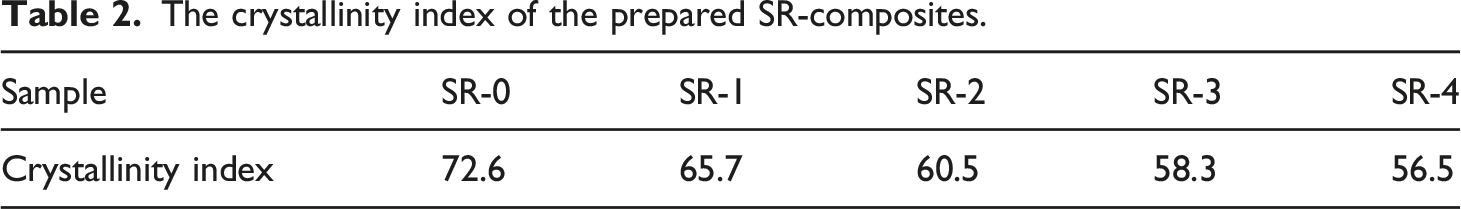
The values of the crystallinity index tabulated in Table 2 pointed out that it declined with an increment of metal alloy. The decrease in the crystallinity is due to increasing disorder in the silicon rubber matrix.
Magnetic properties of SR-composites
It is known that SR is intrinsically nonmagnetic. The impregnation of magnetic filler in rubber matrix transmits magnetic properties, and considerably modifies the physical properties of the matrix as well. The merits of rubber banded magnets (RBMs) over their metallic and ceramic matches include low weight, resistance to abrasion, ease of machining and forming process and capability for high production rates. In the past few years, magnetic polymer composite was first fabricated by Baermann through mixing alnico magnets with phenolic resins. Since then, some types of composites have been successfully fabricated and implemented in order to combine the excellent mechanical properties of polymers with the unique properties of the magnetic materials.
25
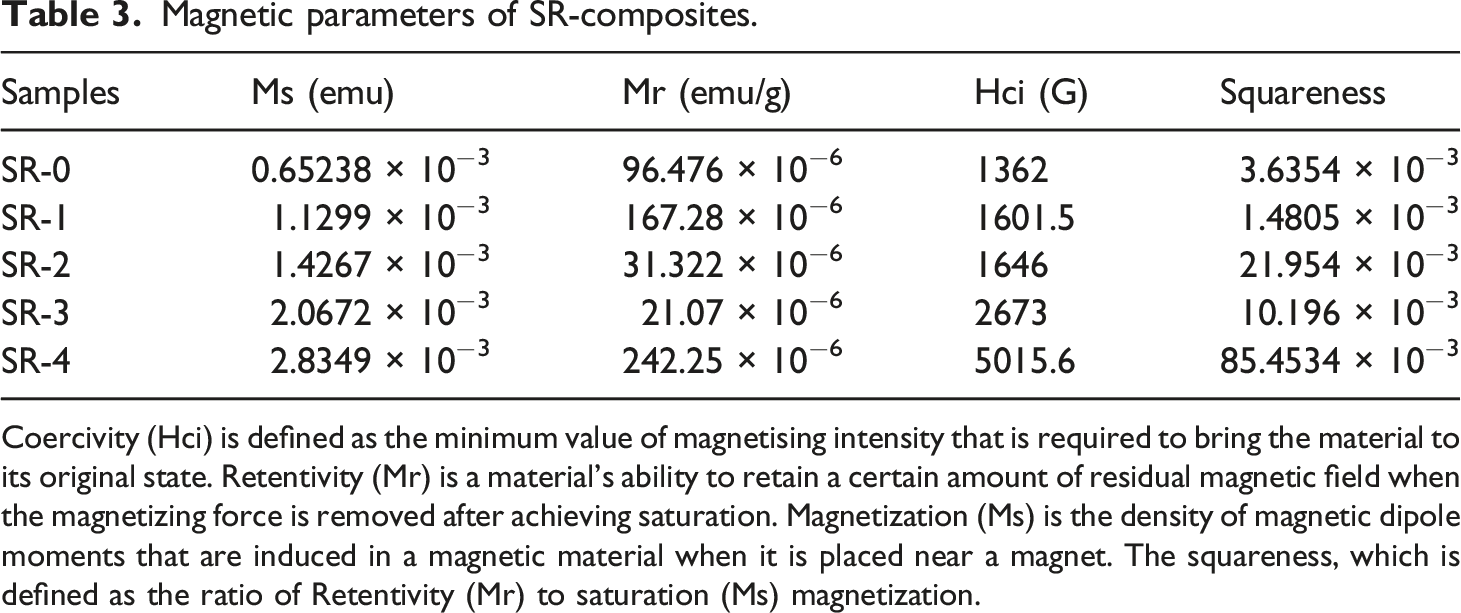
The hysteresis loops obtained at room temperature are shown in Figure 5. From Table 3 the magnetic parameters such as saturation magnetization (Ms), remanence (Mr) and coercivity (HC) are determined. The Ms, M(emu/g) as a function of the applied magnetic field (G) of treated Cu-alloy/SR composites at different content of alloy (2.5 phr–15 phr) is shown in Figure 5. It is expected that the saturation Ms will be slightly higher at a higher magnetic field. The magnetic Hc of SR-composites containing 15 phr treated Cu-alloy is 5015.6 Oe. It is expected that the total Ms of the SR-composite is only due to the Cu-alloy filler, as SR is non-magnetic. The squareness, which is defined as the ratio of the remanent (Mr) to saturation (Ms) Ms, is around ×85.452 10−3. Therefore, we concluded that there is a remarkable enhancement of the magnetic properties in Cu-alloy particles, when embedded in the SR-composites. As a consequence, treated Cu-alloy/SR composites composite provide promising potential for permanent magnets. Hysteresis loop performed at room temperature for SR-composites with different loading of treated Cu-alloy. Magnetic parameters of SR-composites. Coercivity (Hci) is defined as the minimum value of magnetising intensity that is required to bring the material to its original state. Retentivity (Mr) is a material’s ability to retain a certain amount of residual magnetic field when the magnetizing force is removed after achieving saturation. Magnetization (Ms) is the density of magnetic dipole moments that are induced in a magnetic material when it is placed near a magnet. The squareness, which is defined as the ratio of Retentivity (Mr) to saturation (Ms) magnetization.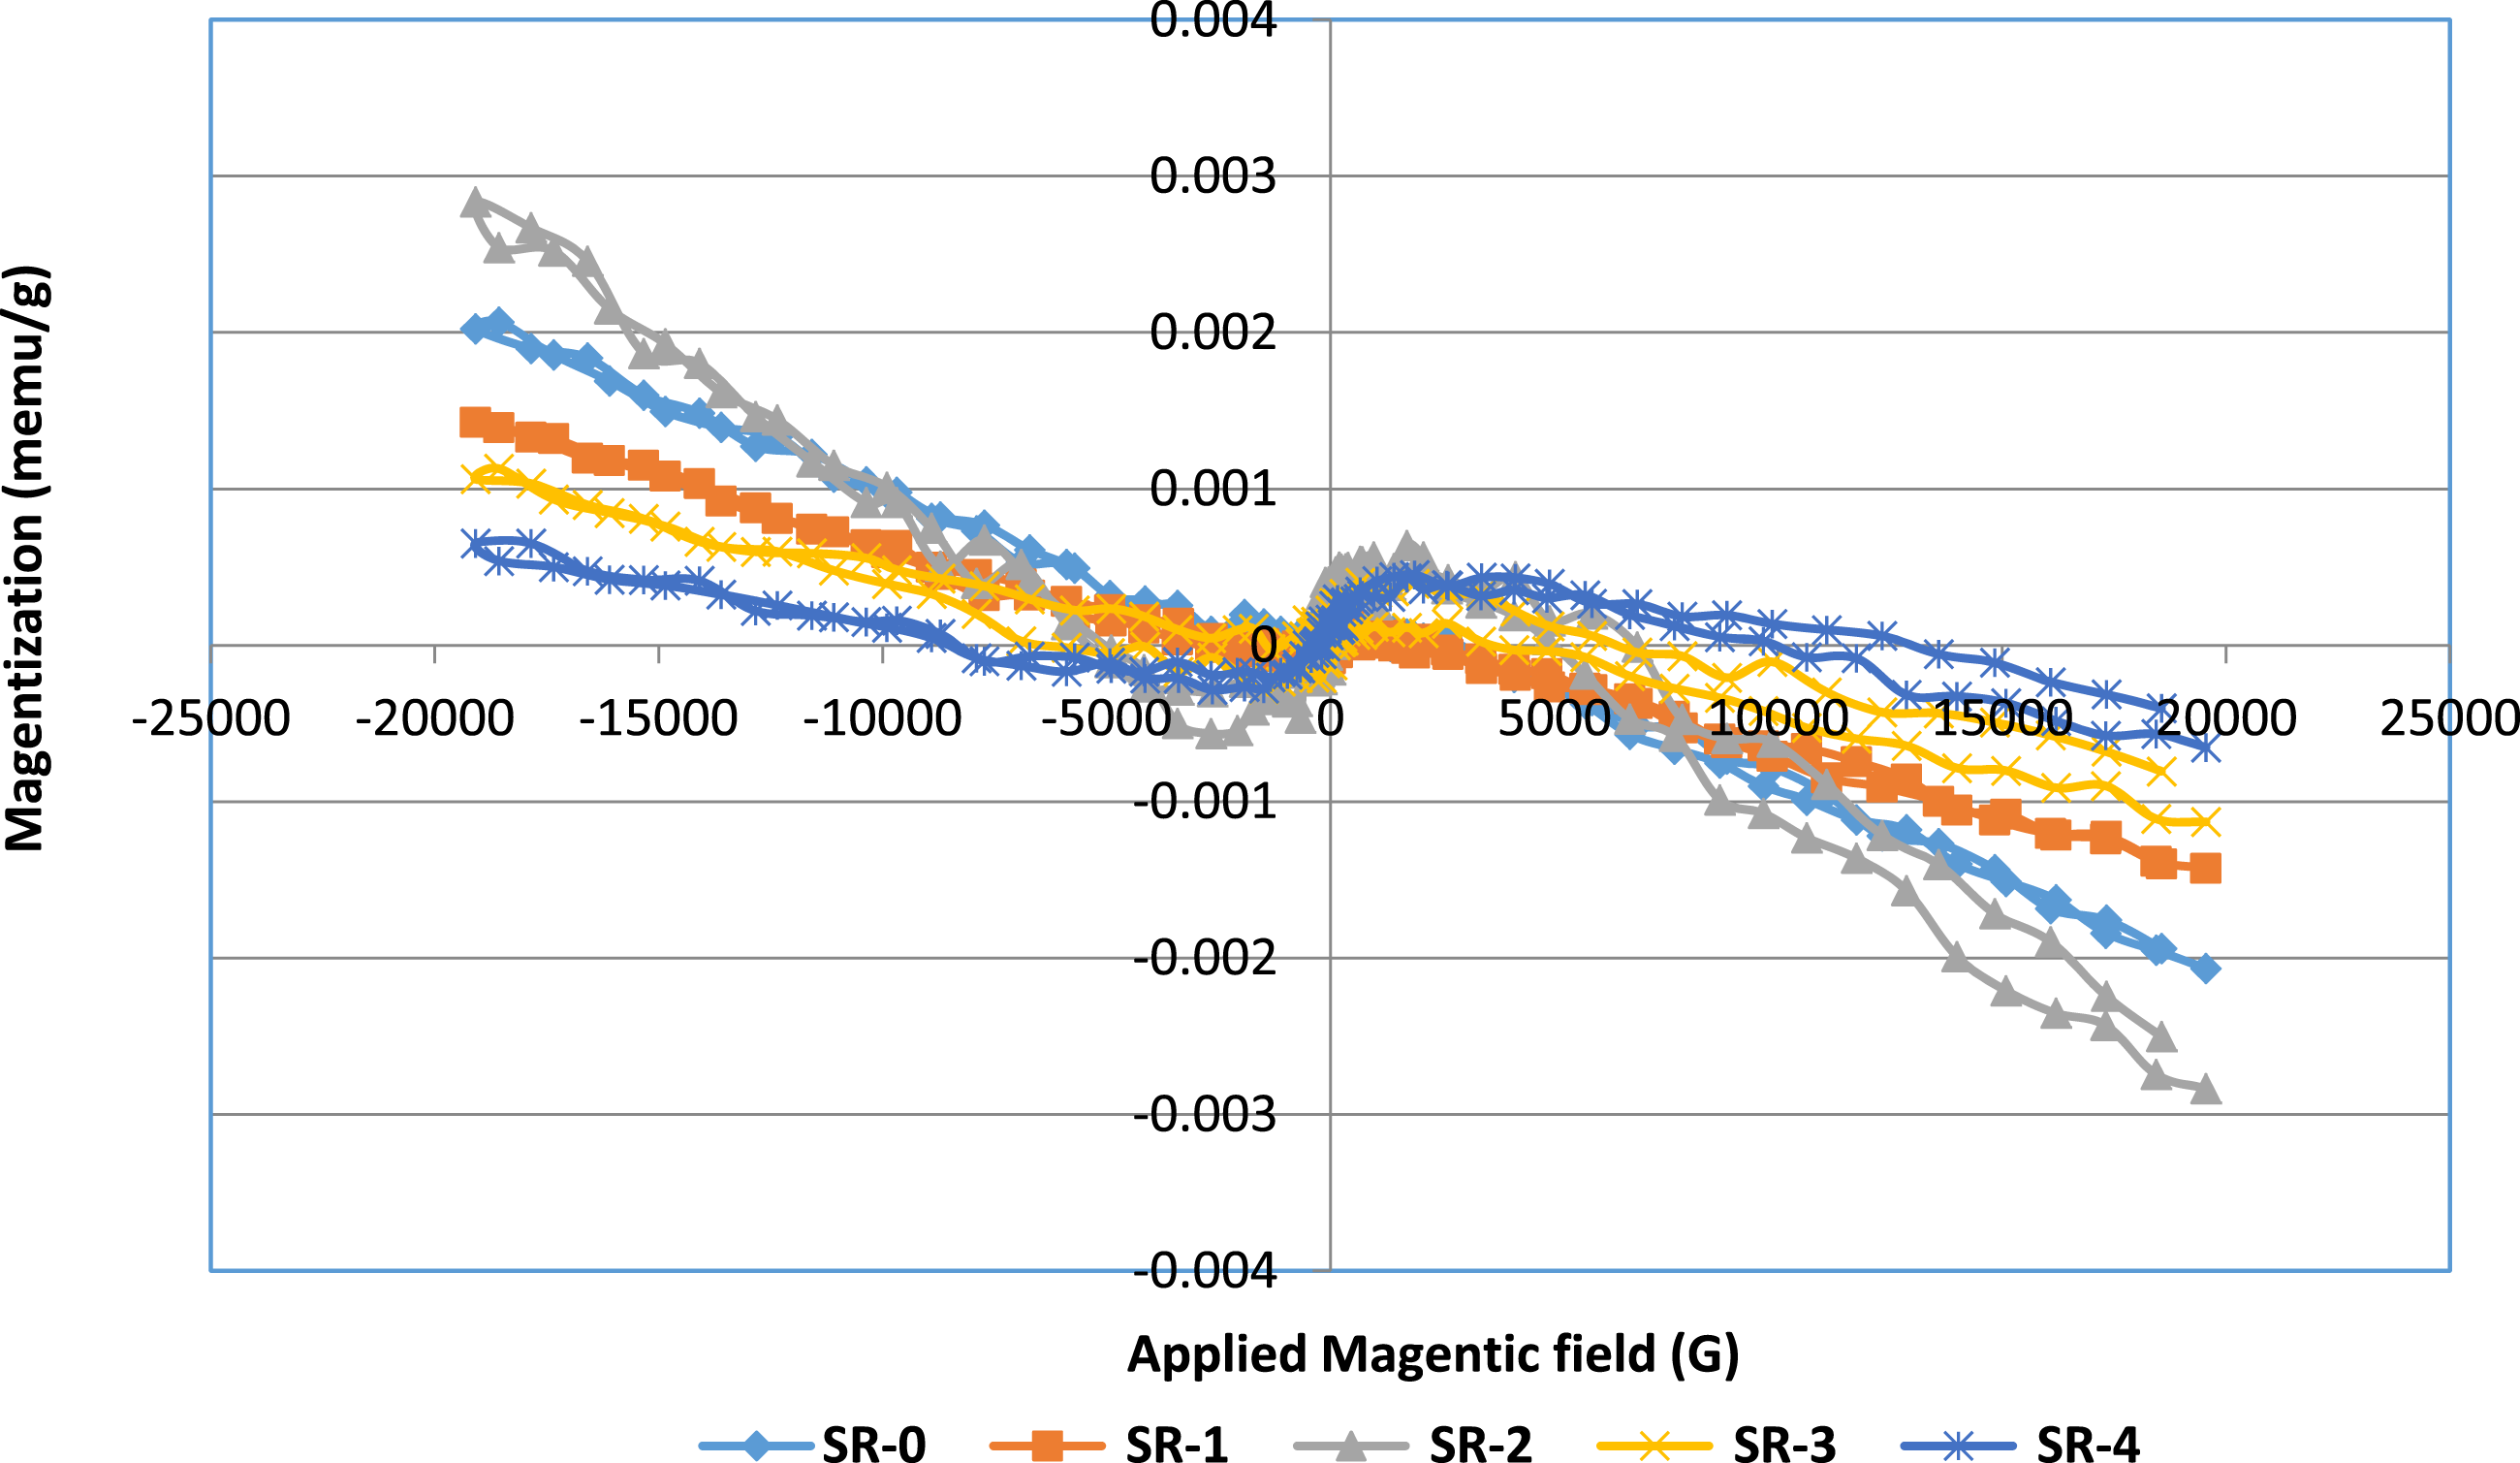
Rheometric characteristics
The formulations and their ingredients as well as results of rheometric characteristics were illustrated in Table 1. The influence of treated Cu-Al-Zn alloy on the vulcanization properties of SR-composites is shown in Table 1. The intensity of the material arises from the maximum crosslinks produced inside the SR matrix, and it is illustrated in terms of the maximum torque value (MH). A high value of MH is shown for the composite with 15 phr Cu-based alloy loading, which indicates the higher cross-linking of the composite resulting from the large interfacial interaction between the Cu-alloy with SR in the presence of the coupling agent (TMSPM). In the unfilled sample (SR-0), the SR segments are free to move and therefore least rigid, as indicated by the low value of minimum torque (ML). It was also noticed that the torque difference (∆M) is characteristically related to the cross-link density of SR composites and increased with the addition of treated Cu-Al-Zn alloy owing to the increase in the overall rigidity of SR composites, which was not permitted to decrease the cross-link density of SR rubber in composites because of the absence of linkages between Cu-Al-Zn alloy particles and SR molecules in the absence of coupling agent TMSPM, as observed in sample SR-0. As well, the value of ∆M of composites in the presence of prepared TMSPM is higher than in the absence of SR-0. 20 This means that the adhesion between SR rubber and treated Cu-alloy was improved by making a stronger network within the resulting SR composites, and consequently more cross-links were produced in the presence of the coupling agent TMSPM.
Variation of optimum cure time (tc90) is very important as it explains the change in the processability of the rubber composite. It is evident from this table that the 15 phr of treated Cu-alloy accelerates the vulcanization time of the prepared composite. This means that the addition of 15 phr of treated Cu-alloy produces a reduction in the optimum vulcanization time, which is the most important for reducing the cost of the fabrication of SR rubber goods in the industrial area. The 15 phr of treated Cu-Al-Zn alloy can have the ability to form a conducting network in the SR, which readily conducts heat through the SR matrix, causing an increased rate of cure and thereby reducing the cure time. Another important factor is the scorch time, which indicates the extent of cure in the respective samples. In the present study, it is observed that the scorch time of SR composites decreases with the addition of 15 phr of treated Cu-Al-Zn alloy, which explains the efficiency of filler-polymer interaction in the rubber composites. On the other hand, this decrease might be due to the co-occurrence of a Cu-based alloy with the coupling agent TMSPM, which led to improved adhesion between the SR matrix and alloy by forming a higher degree of crosslinks. Therefore, the viscosity of SR increased and, hence, created more heat due to additional friction. i.e., Tc90 and Ts2 were reduced at this ratio, and the cure rate index increased. 26
Tensile mechanical properties
The mechanical properties of all tested composites are shown in Figure 6. The TS for all added treated filler in SR-based composites was characterized by a slight increase over the TS of pure SR as the control sample. This observation can be explained by the uniform filler distribution of treated Cu-Al-Zn grains in the SR matrix, as shown by SEM. In addition, the prepared coupling agent TMSPM can change the surface properties of Cu-alloy (an inorganic filler) and then improve the mechanical strength of the SR-composites, which has been proven in many publications.
27
The treatment of the Cu-alloy did not improve the elongation at break of all SR composites. Mechanical properties of SR-composites with different loading treated Cu-alloy.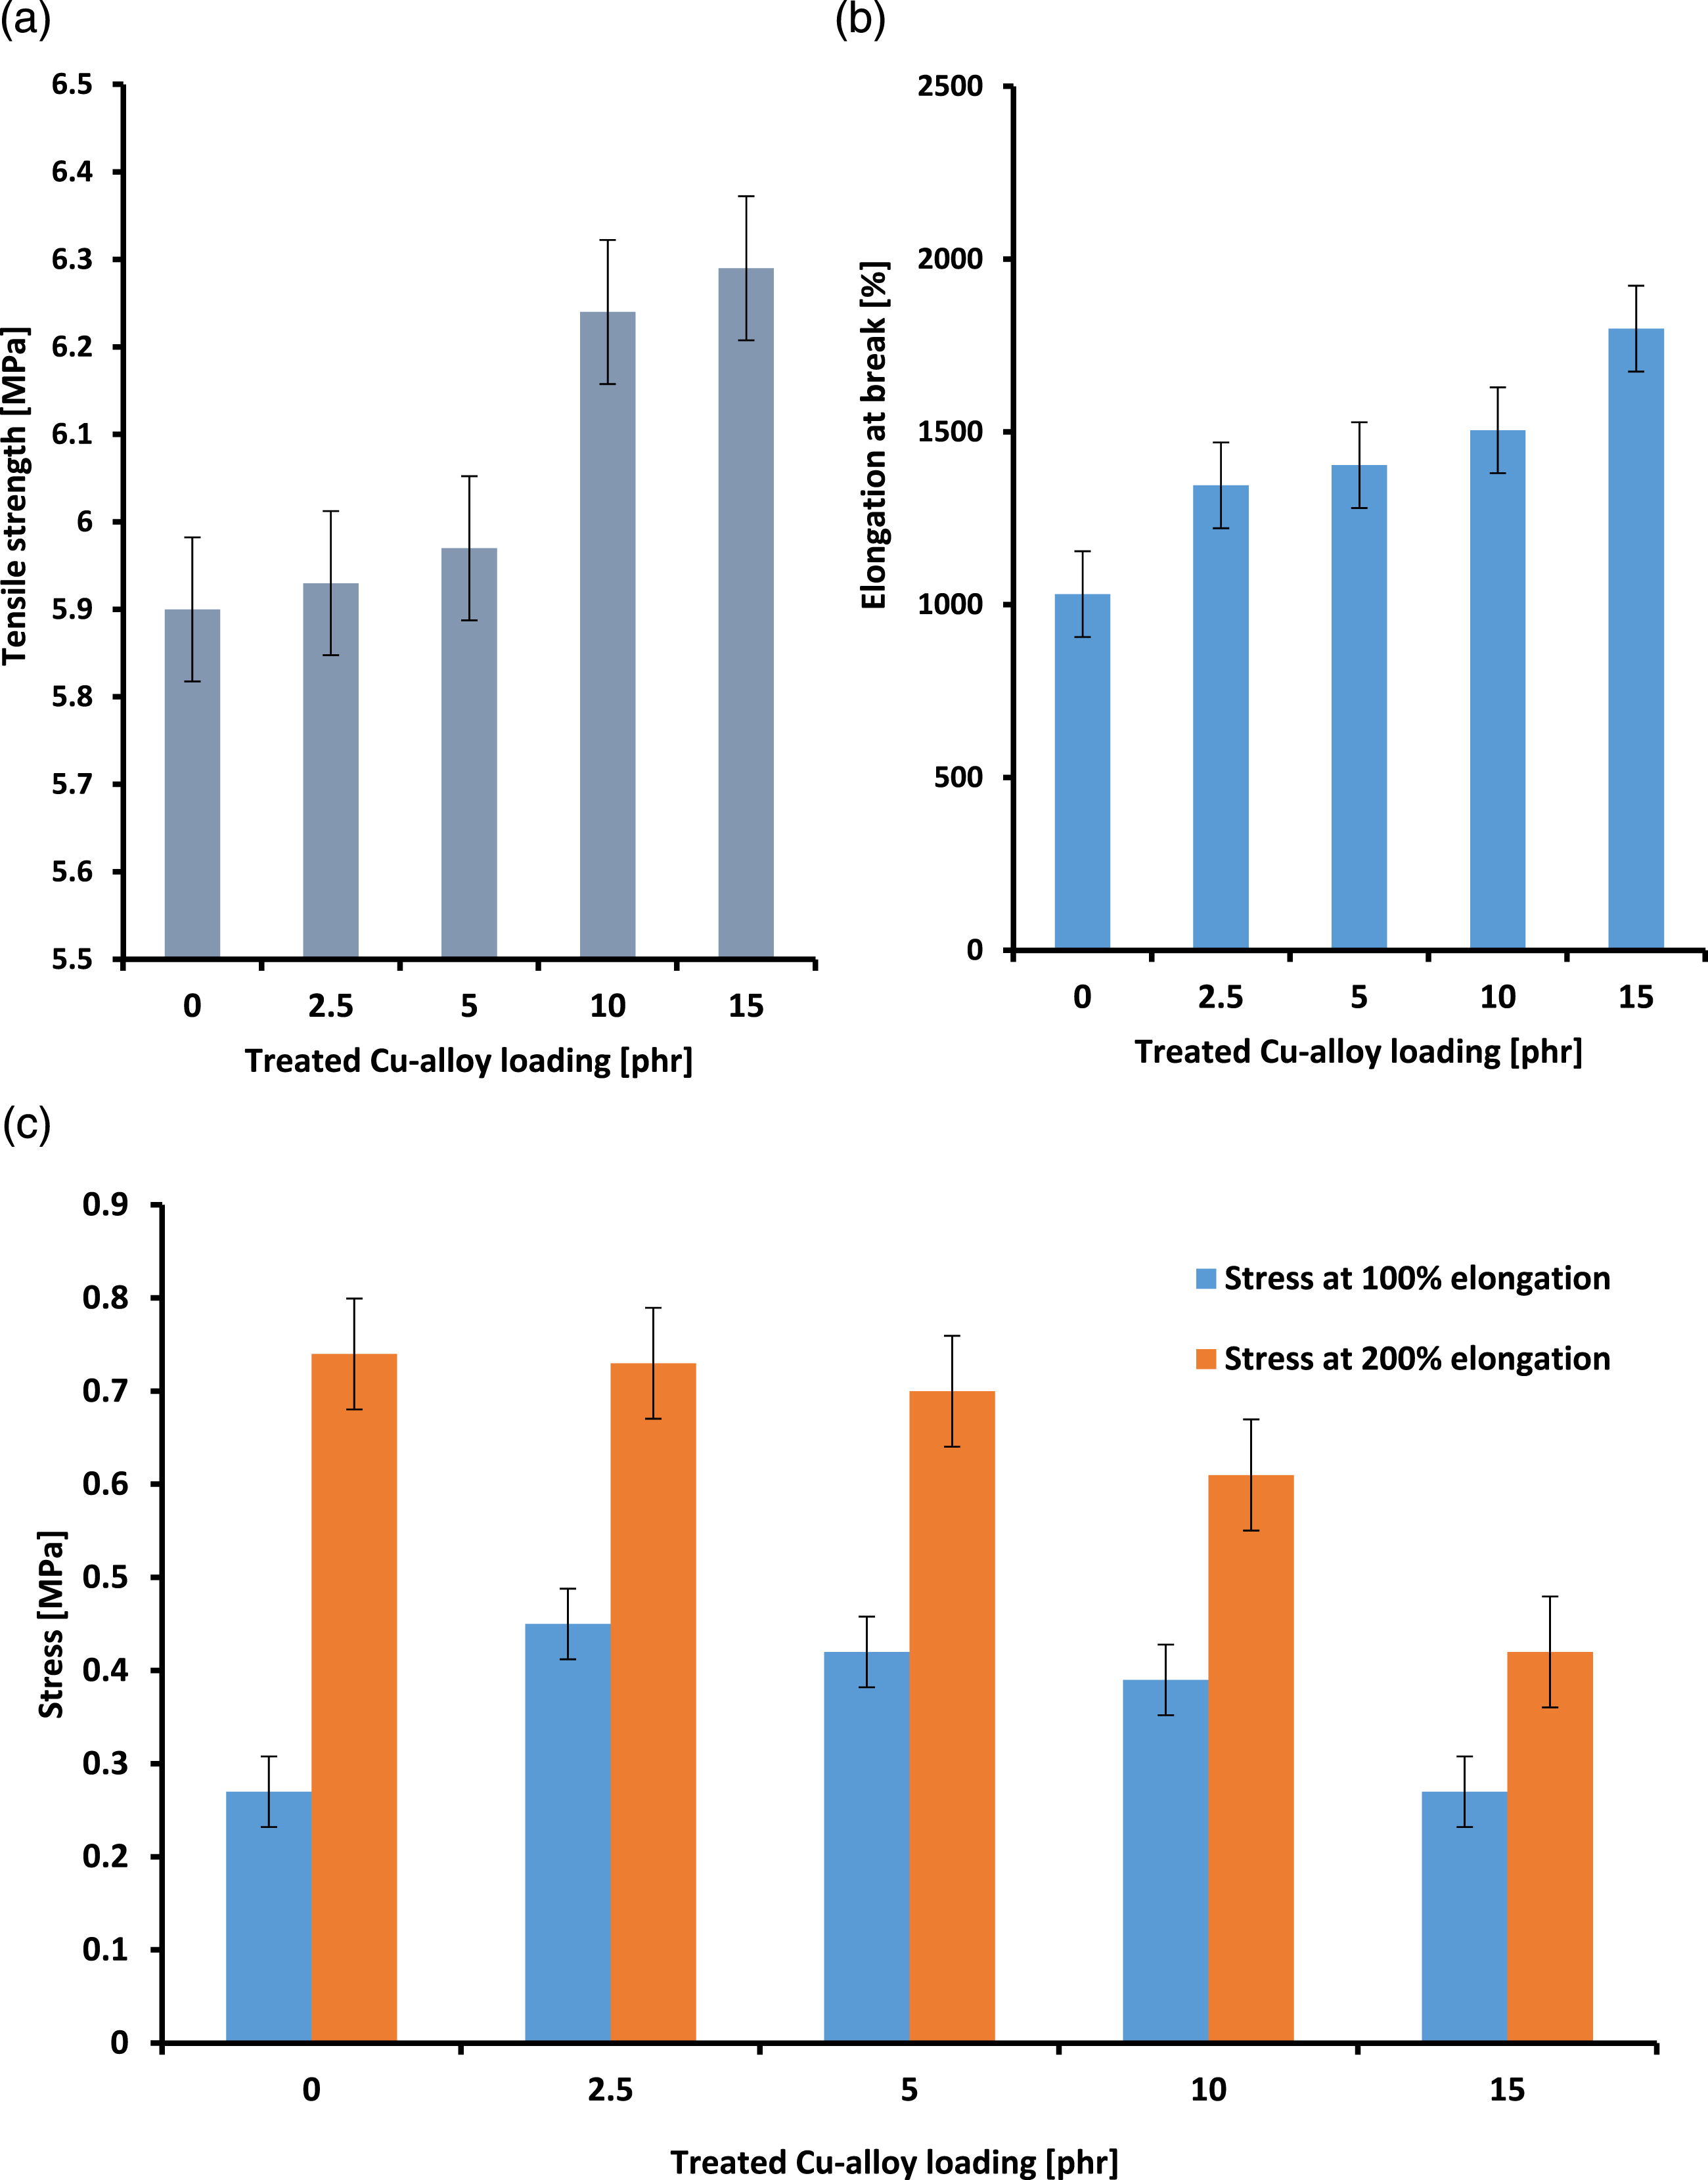
Also, it can be seen that, compared with SR-0 composite, composites filled with treated Cu-Al-Zn alloy exhibit a great increase in elongation at break. This observation can be attributed to the non-adherence of the treated Cu-based alloy to the rubber matrix, leading to the softening of the rubber chain and hence allowing stretching when the strain is applied. Therefore, a higher elongation at break of SR composites is achieved with increasing treated Cu alloy content. 18 SR is a highly versatile material, appropriate for several industrial applications, owing to its high elasticity, easy processability, biocompatibility, and chemical inertness. Figure 6 shows the influence of treated Cu-alloy loading on stress at 100% (M100) and 200% (M200) elongations of SR-composites. It is obviously seen that by increasing the treated Cu-alloy content in the composites, the modulus was markedly increased. The enhancement of the stress may be attributed to the reinforcing effect of treated Cu-alloy domains in the SR matrix and its strong interaction, which successfully inhibited the motion of polymer chains. 28 (Figure 6)
Ultrasonic measurements
Ultrasonic velocities (C)
The characteristics of the produced Cu-alloy/SR composite were determined using ultrasonic velocity measurements. Ultrasonic velocities (longitudinal, CL and shear, Cs) were determined using ASTM E114-15. As illustrated in Figure 7. Ultrasonic velocities (CL and Cs) of treated Cu-alloy/SR-specimens.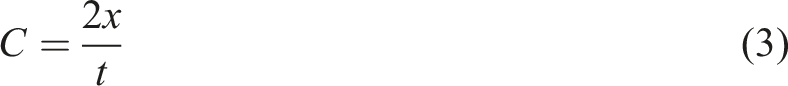
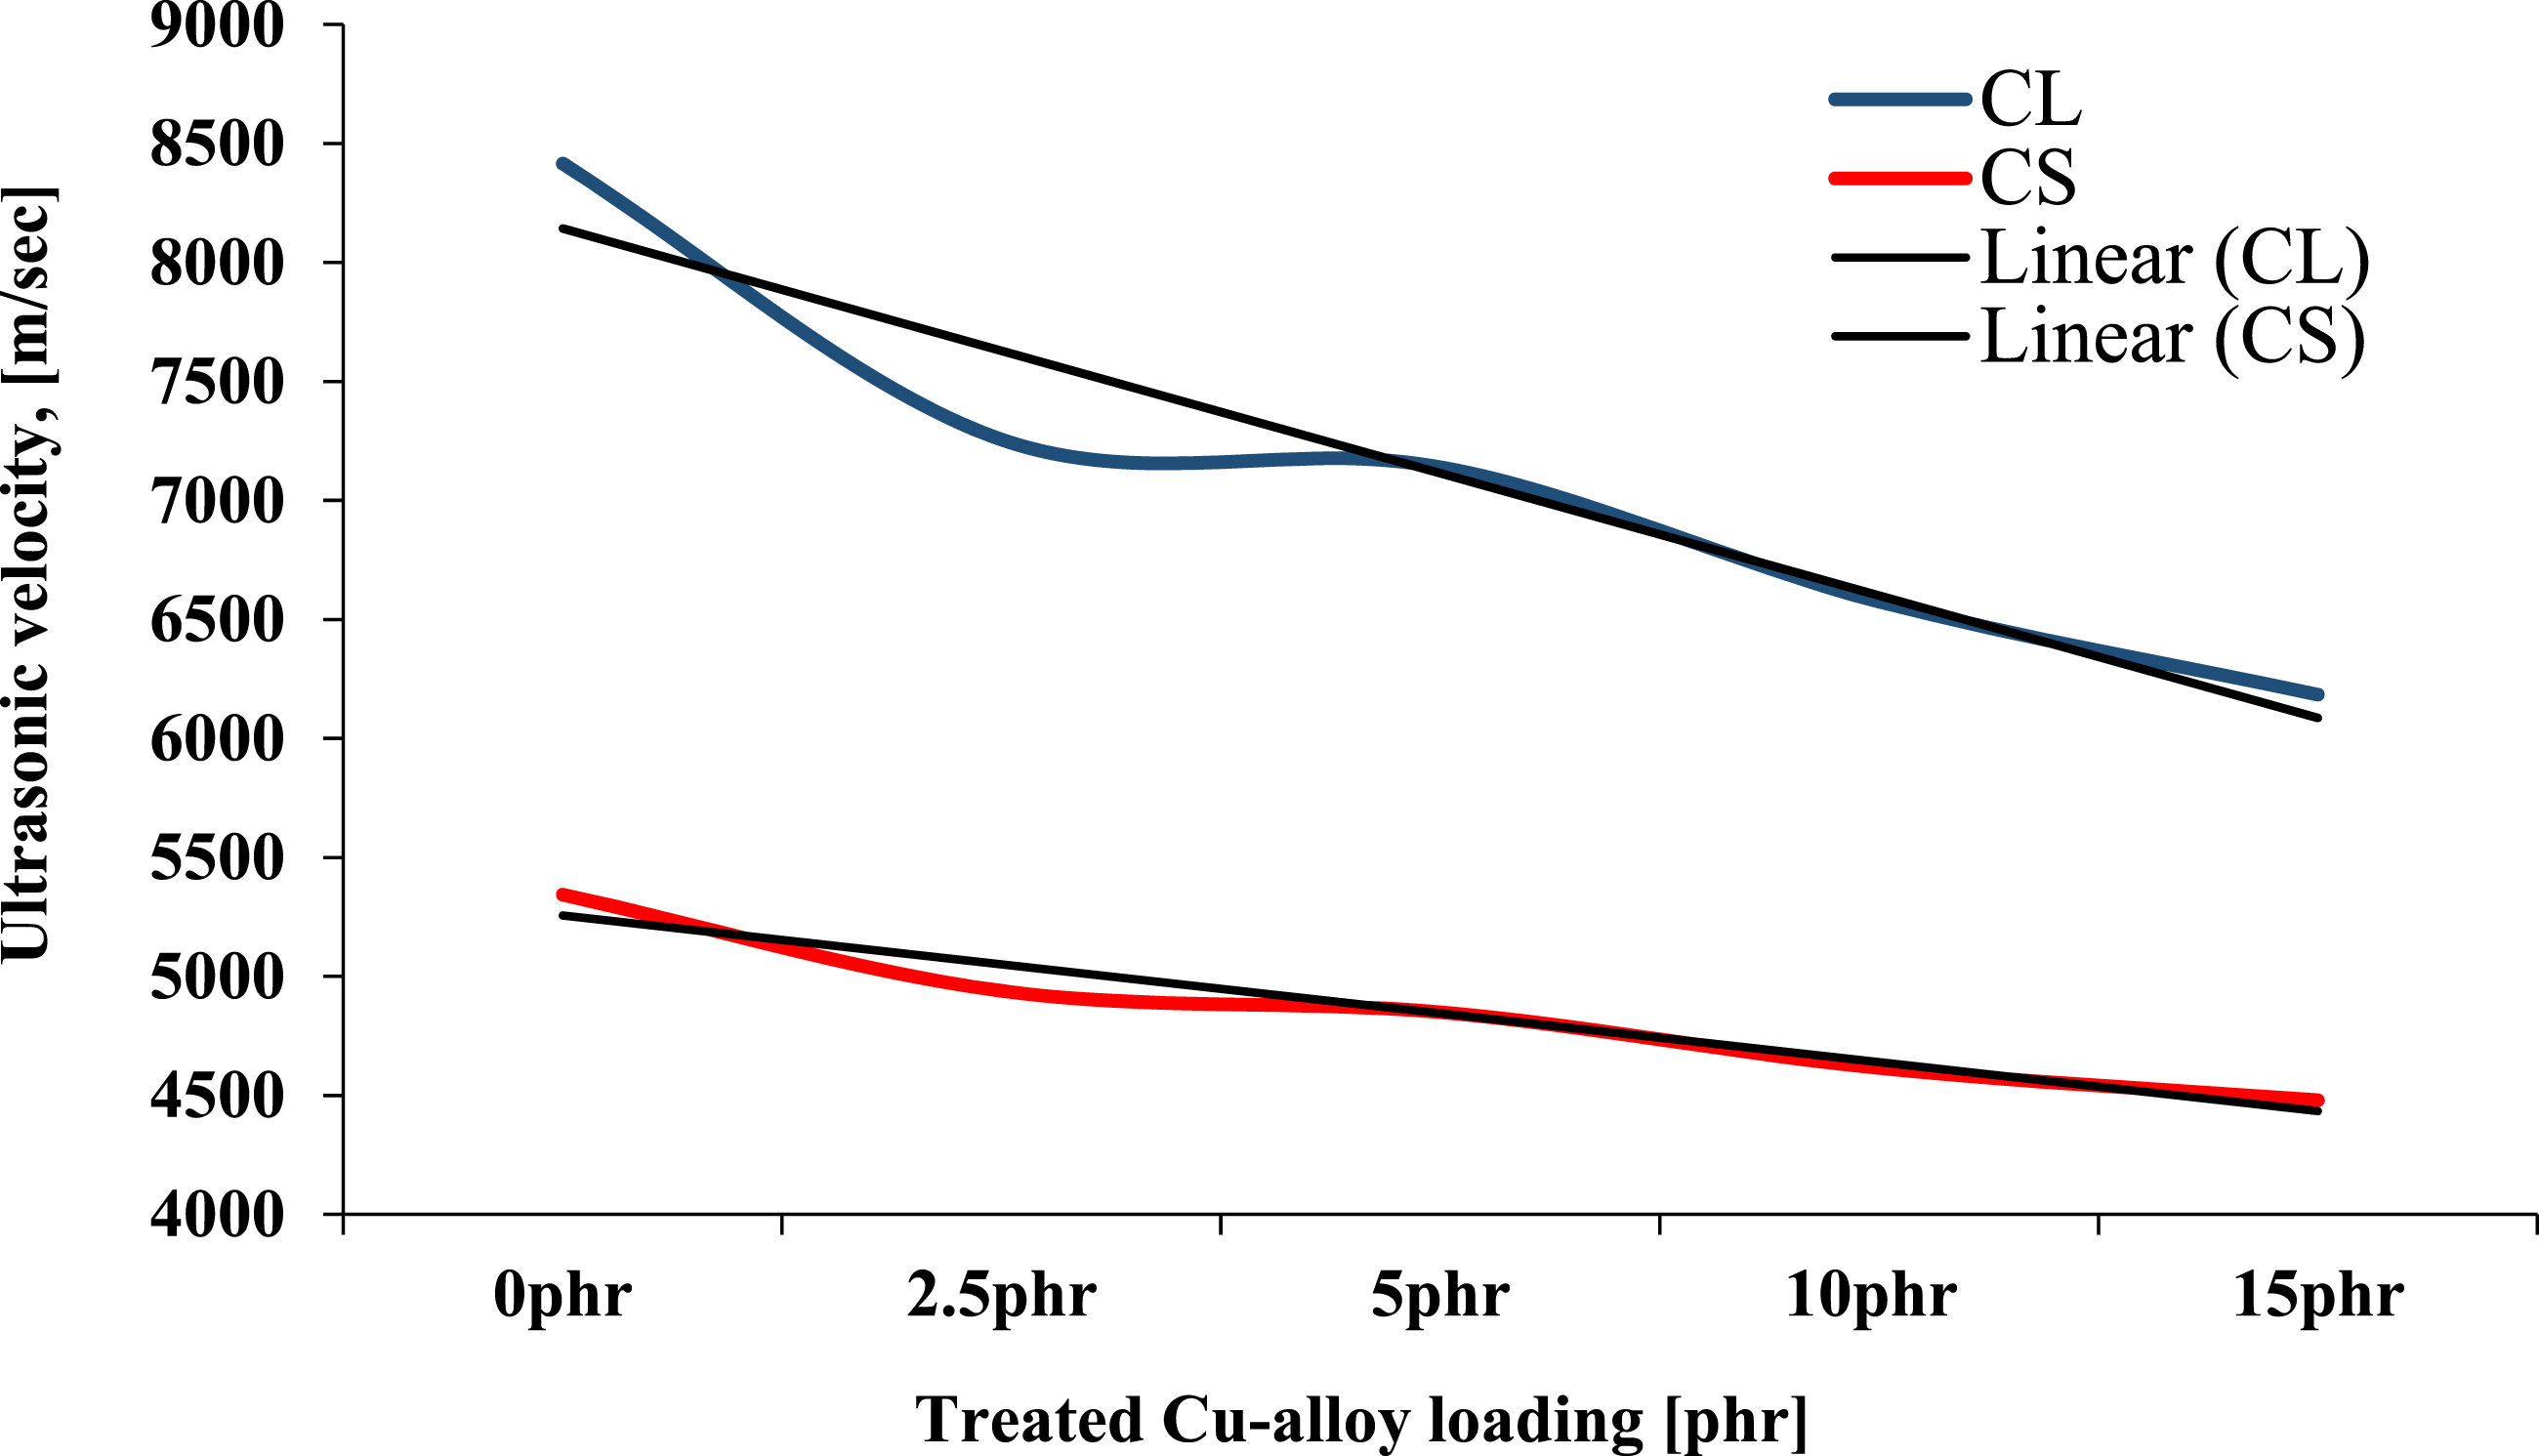
C is the velocity of ultrasonic waves, the thickness of the specimen is (x), and the duration taken by the echoes is (t). As shown in Figure 7, the ultrasonic velocities (longitudinal and shear) exhibited the same trend, as it* (velocity) decreases from 0 phr specimens to 15 phr. The higher content of treated Cu-Al-Zn alloy in the SR matrix caused strong network interaction within the resulting composites. In addition, the coupling agent TMSPM may increase the crosslinking ability. Thus, the time traveled by the ultrasonic wave may increase, leading to a decrease in the ultrasonic velocity, which may be due to strong interaction (crosslinking).29,30
Acoustic impedance (Z)
The acoustic impedance (Z) is a function of both the material’s density (ρ) and the material’s ultrasonic velocity (C) as shown in following equation.
The acoustic impedance reflects the material structure’s characteristics. As shown in Figure 8, the acoustic impedance increased with increasing alloy content in the SR matrix until reaching the maximum at 5 phr specimen, and then there was a slight decrement at both the 10 phr and 15 phr specimens. The acoustic impedance has high values, ranging from about 16.5 to about 17.7MRayl. From the acoustic impedance (Z) one could describe how much resistance an ultrasonic beam encounters as it passes through a given material, i.e., it reflects the action of the material on waves as a result of the material’s structure.
31
As per treated Cu-alloy content increased, the cross-links in the SR matrix increased, making it much stronger. Therefore, we can note that the resistance to the wave flow in the Cu-alloy/silicon specimens increased as the alloy percentage increased (i.e., the acoustic impedance increased). Acoustic impedance (Z) of treated Cu-alloy/SR specimens.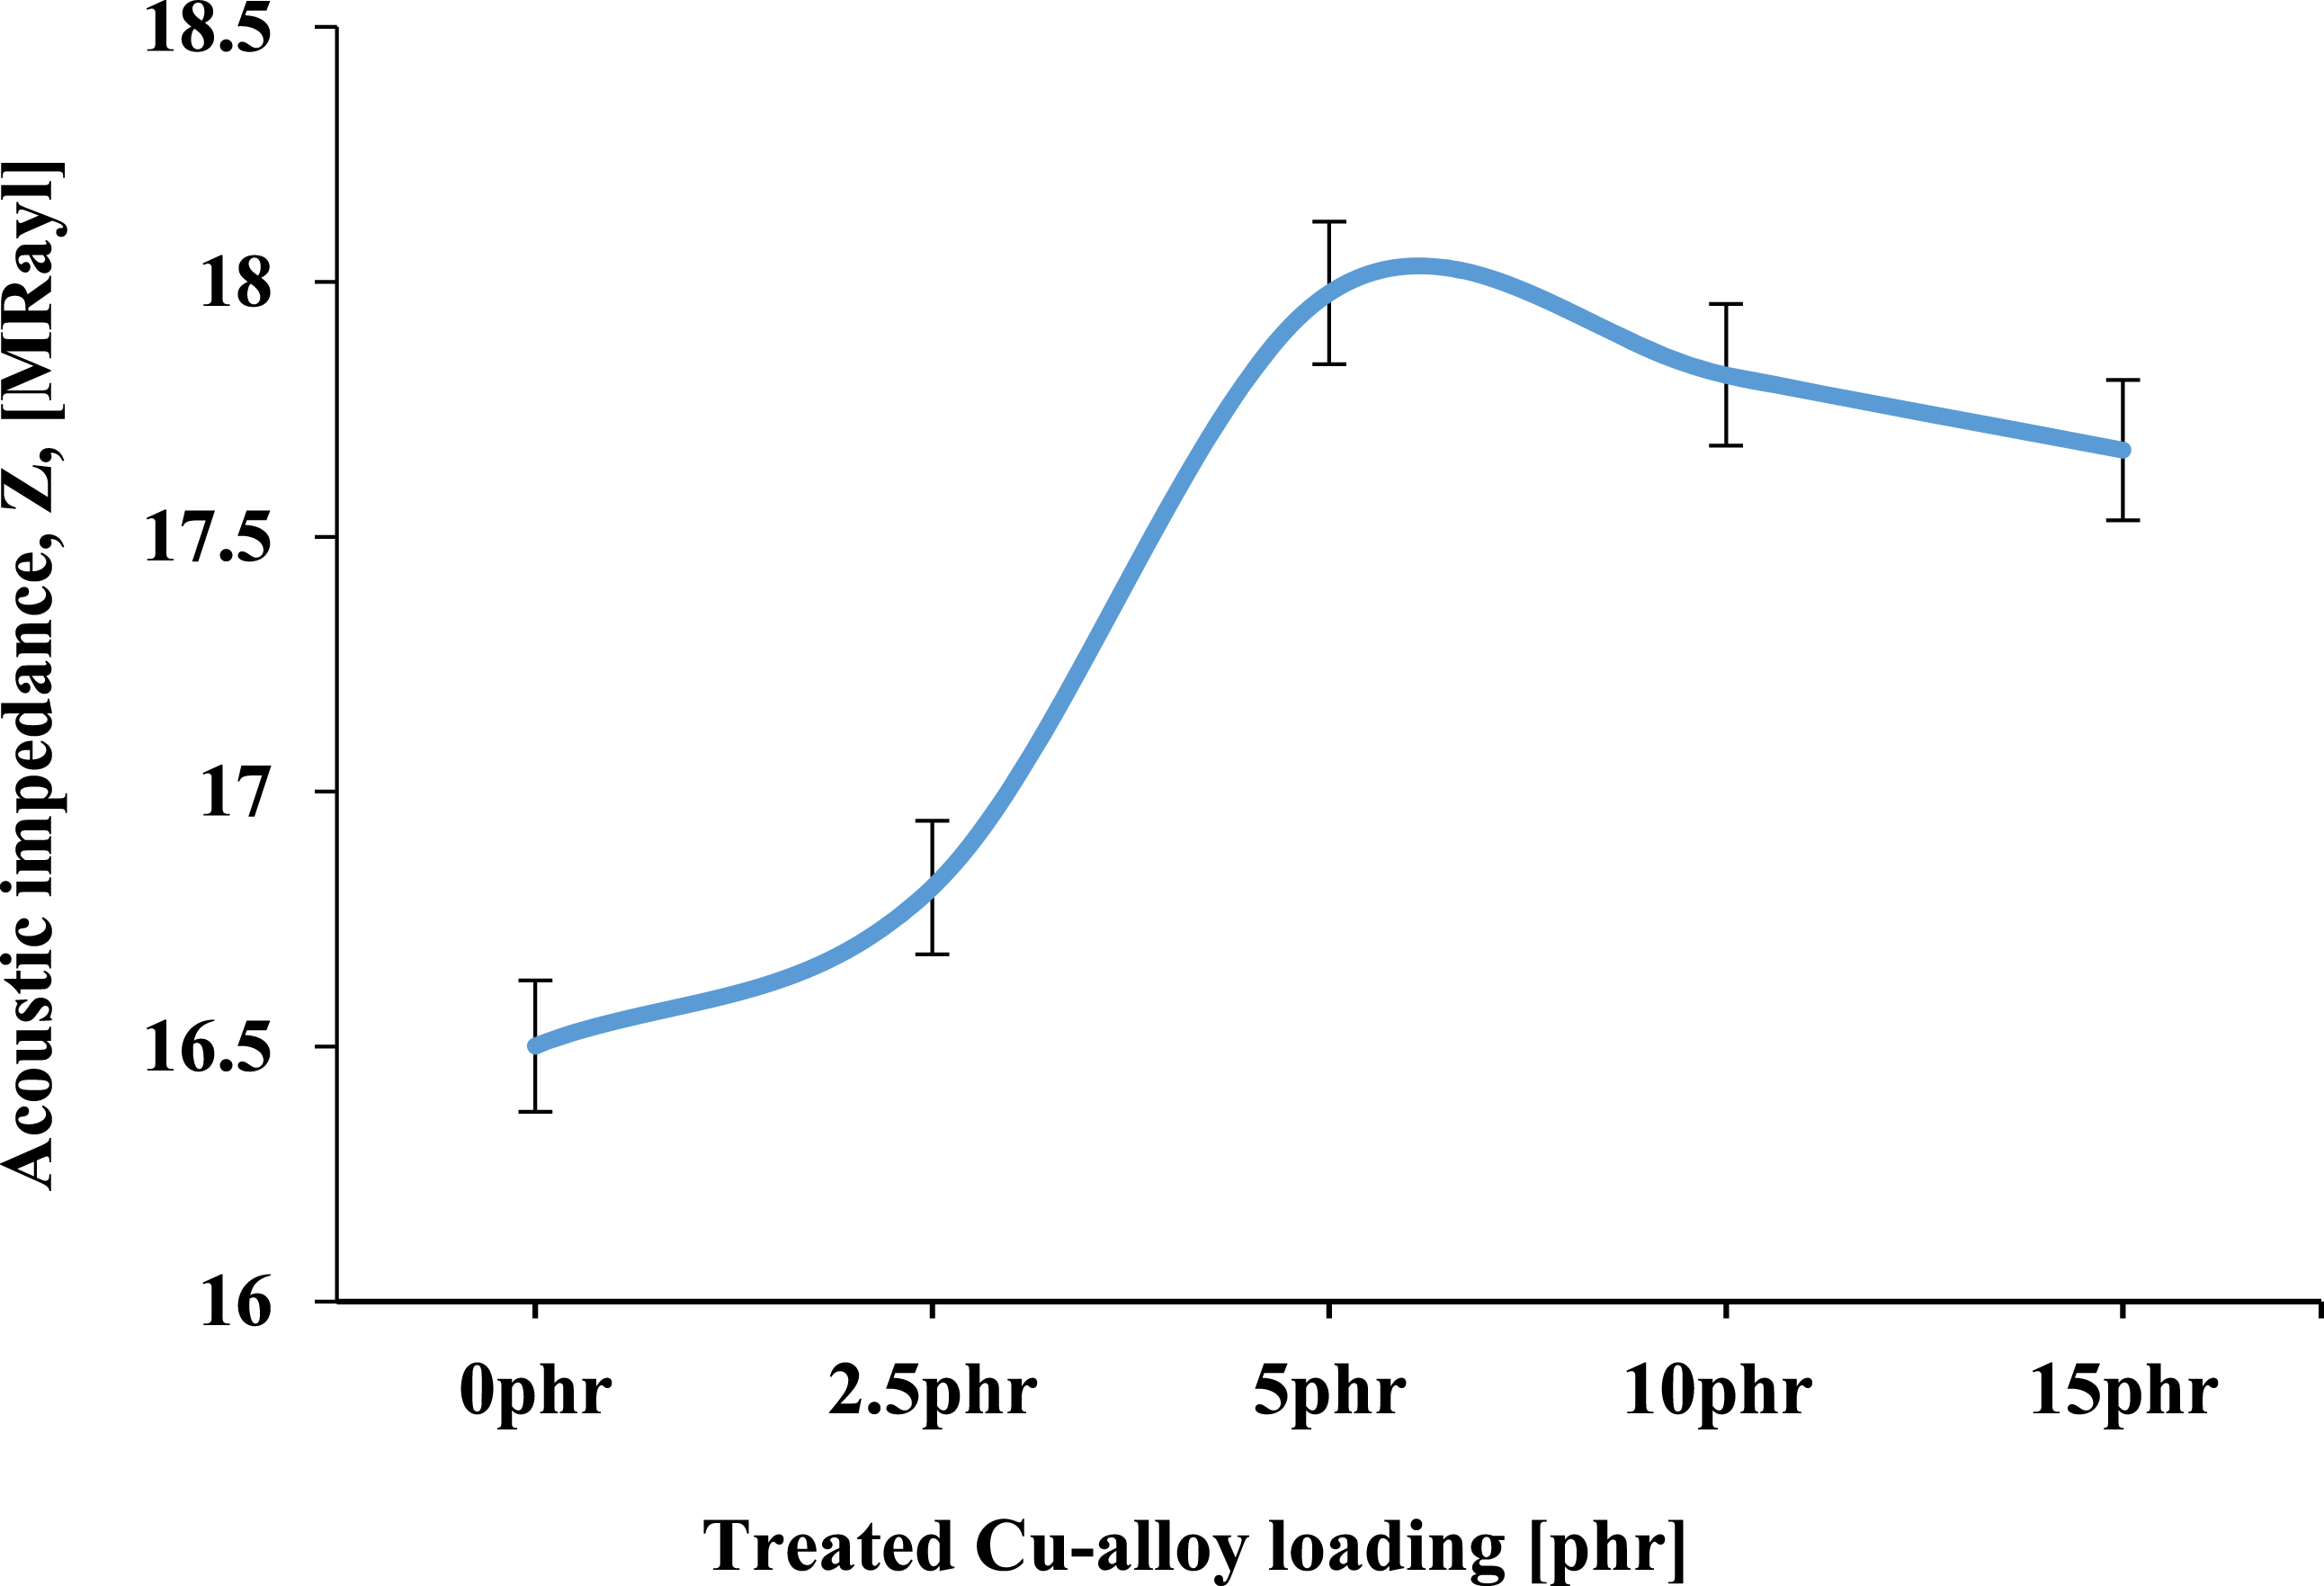
Ultrasonic attenuation coefficient (α)
The ultrasonic attenuation coefficient (α) was estimated in dB/cm based on two consecutive echoes height measurements, Figure 9. Ultrasonic attenuation coefficient (α) of Cu-alloy/SR specimens.
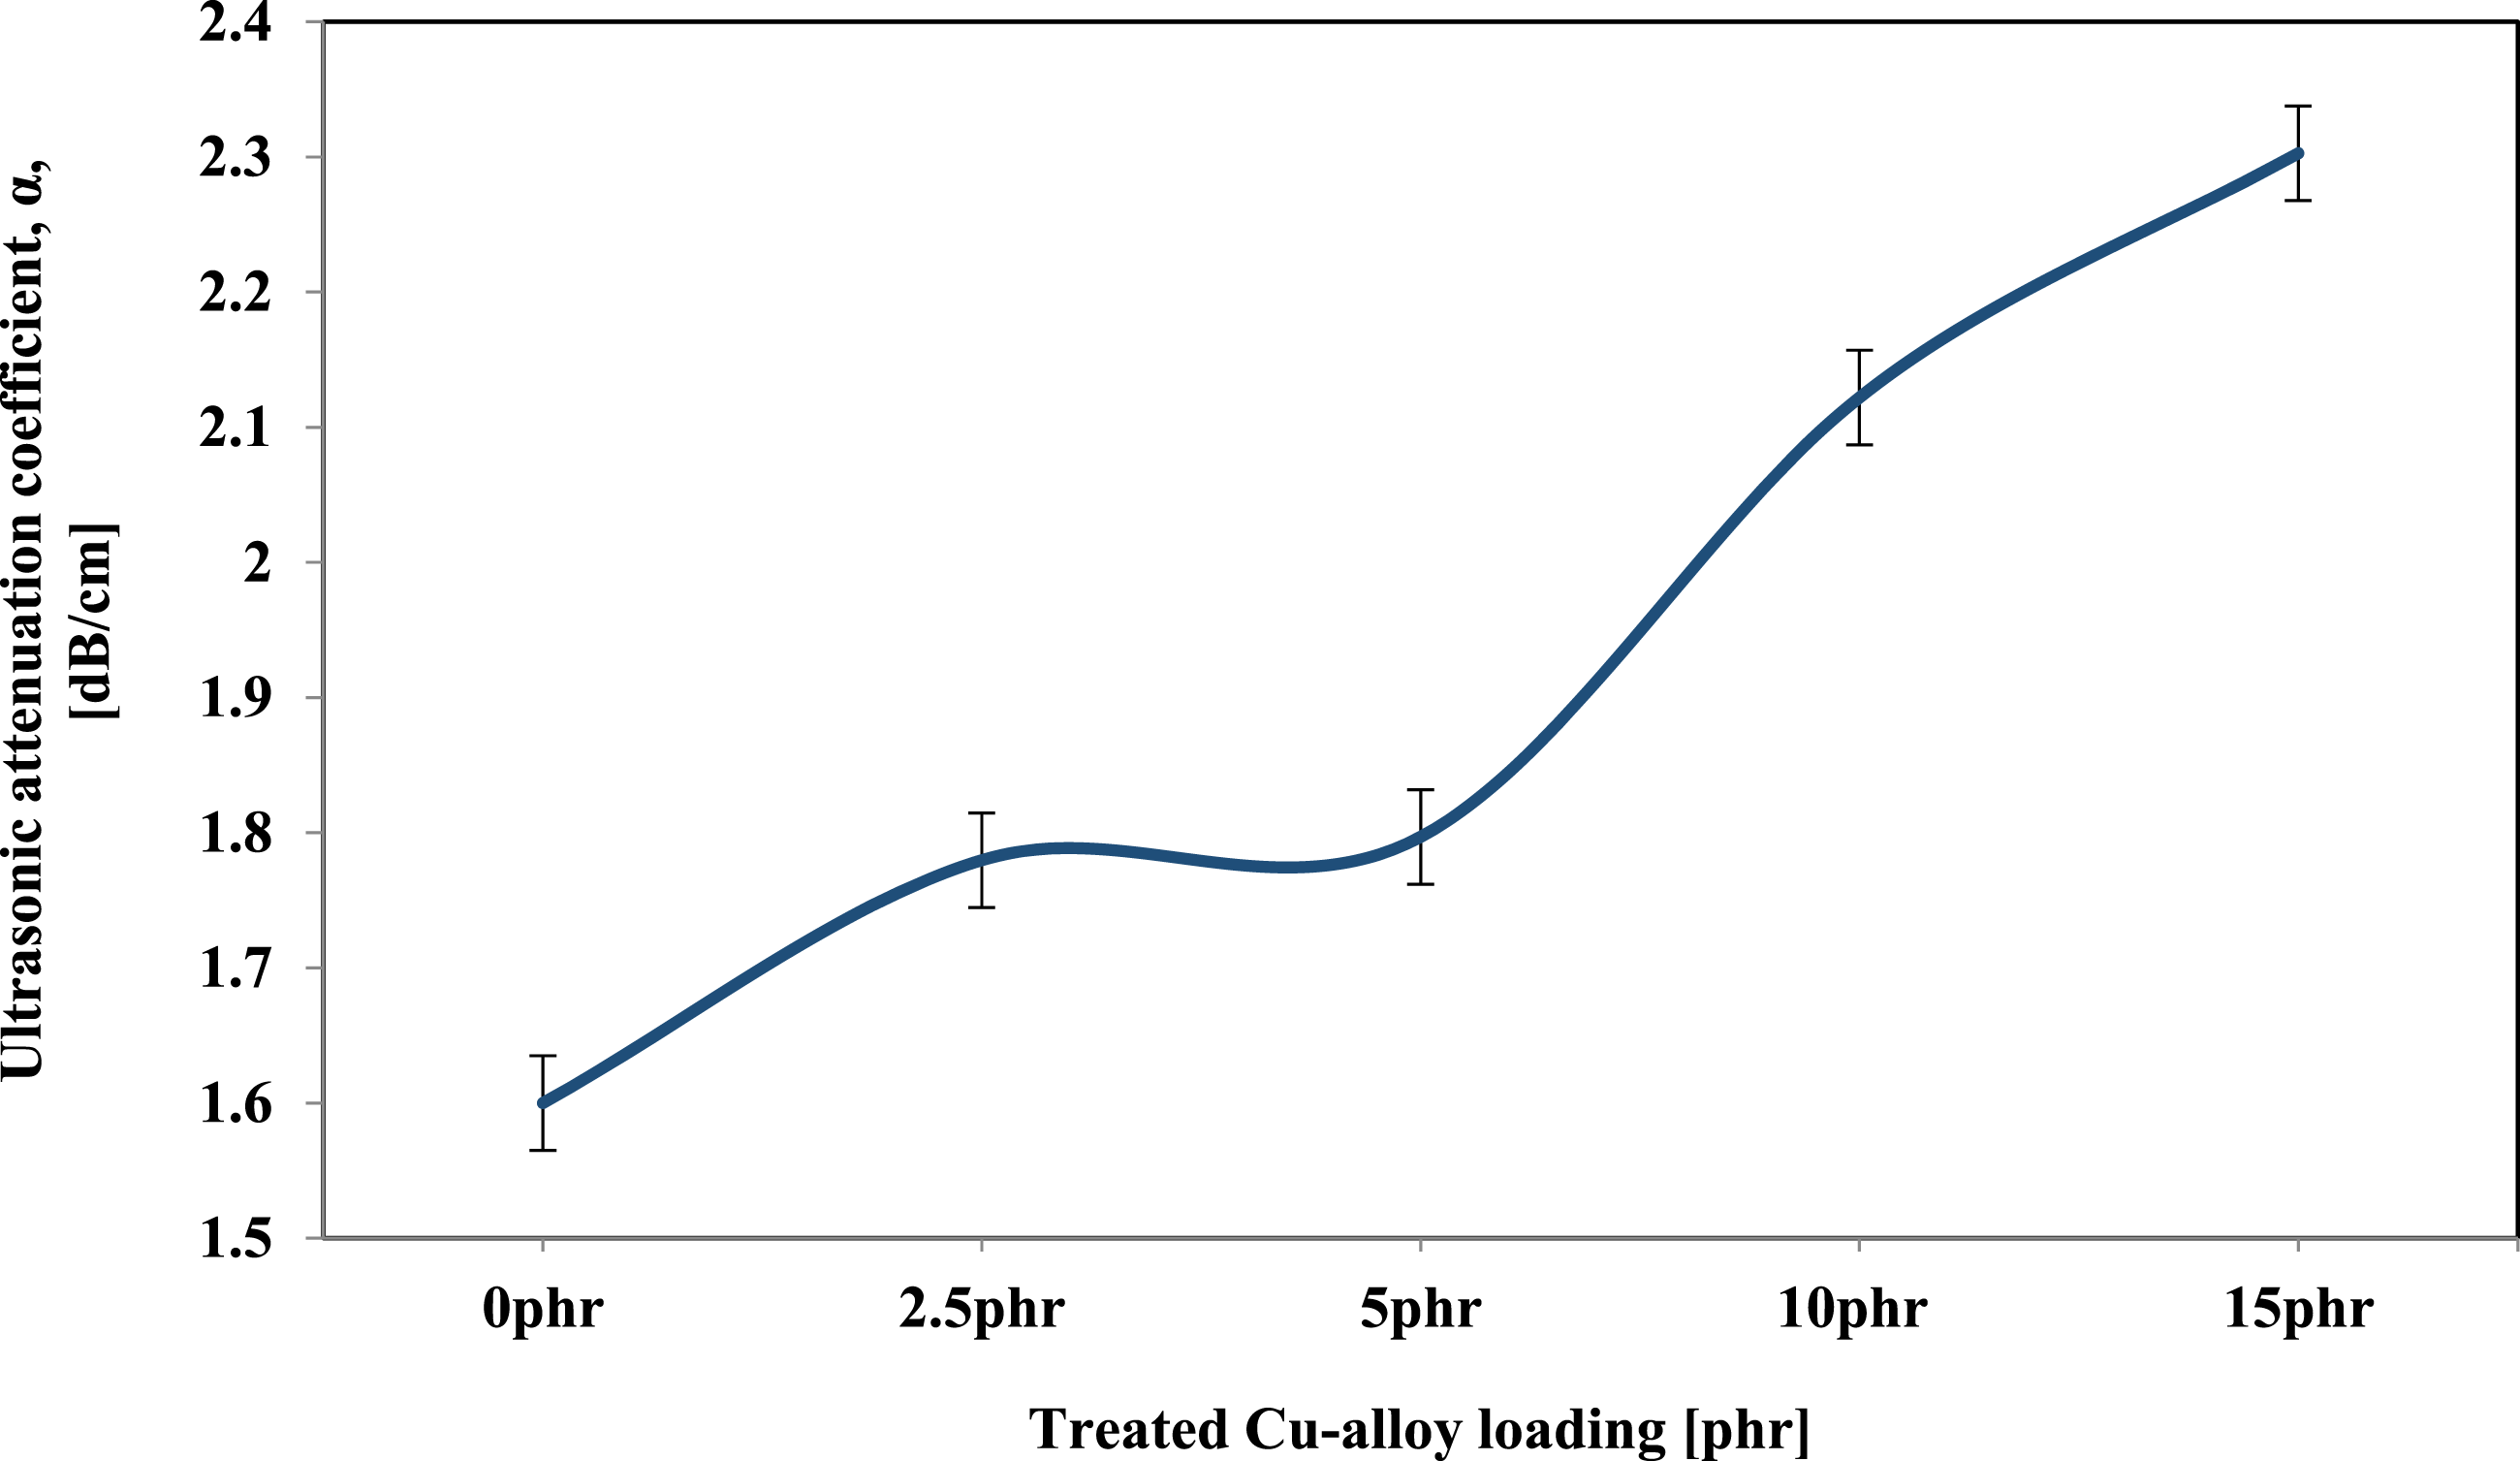
The ultrasonic attenuation coefficient for specimens increases from 0 phr to 15 phr as shown in Figure 5. Despite the fact that specimen 5 phr moves in the opposite direction of the others, Thus, the ultrasonic attenuation coefficient increased with increasing alloy content due to higher crosslinking, except for sample 5 phr, which may have agglomeration on the surface. 32 Thus, at 5 phr treated composite, there is uniform filler distribution of treated Cu-Al-Zn grains in the SR matrix, and the wave flow is less attenuated.
Young’s modulus (E)
The elastic properties of the produced SR specimens can be characterized using ultrasonic tests. Therefore, to demonstrate some characteristic properties of the prepared SR loaded with treated Cu-alloy and their influence by the alloy content; Young’s modulus was calculated as follow.
33
Some properties of Cu-alloy/SR specimens [(a) micro-hardness, (b) Young’s modulus].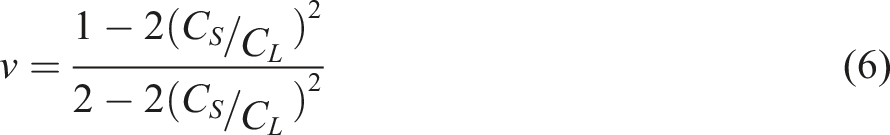

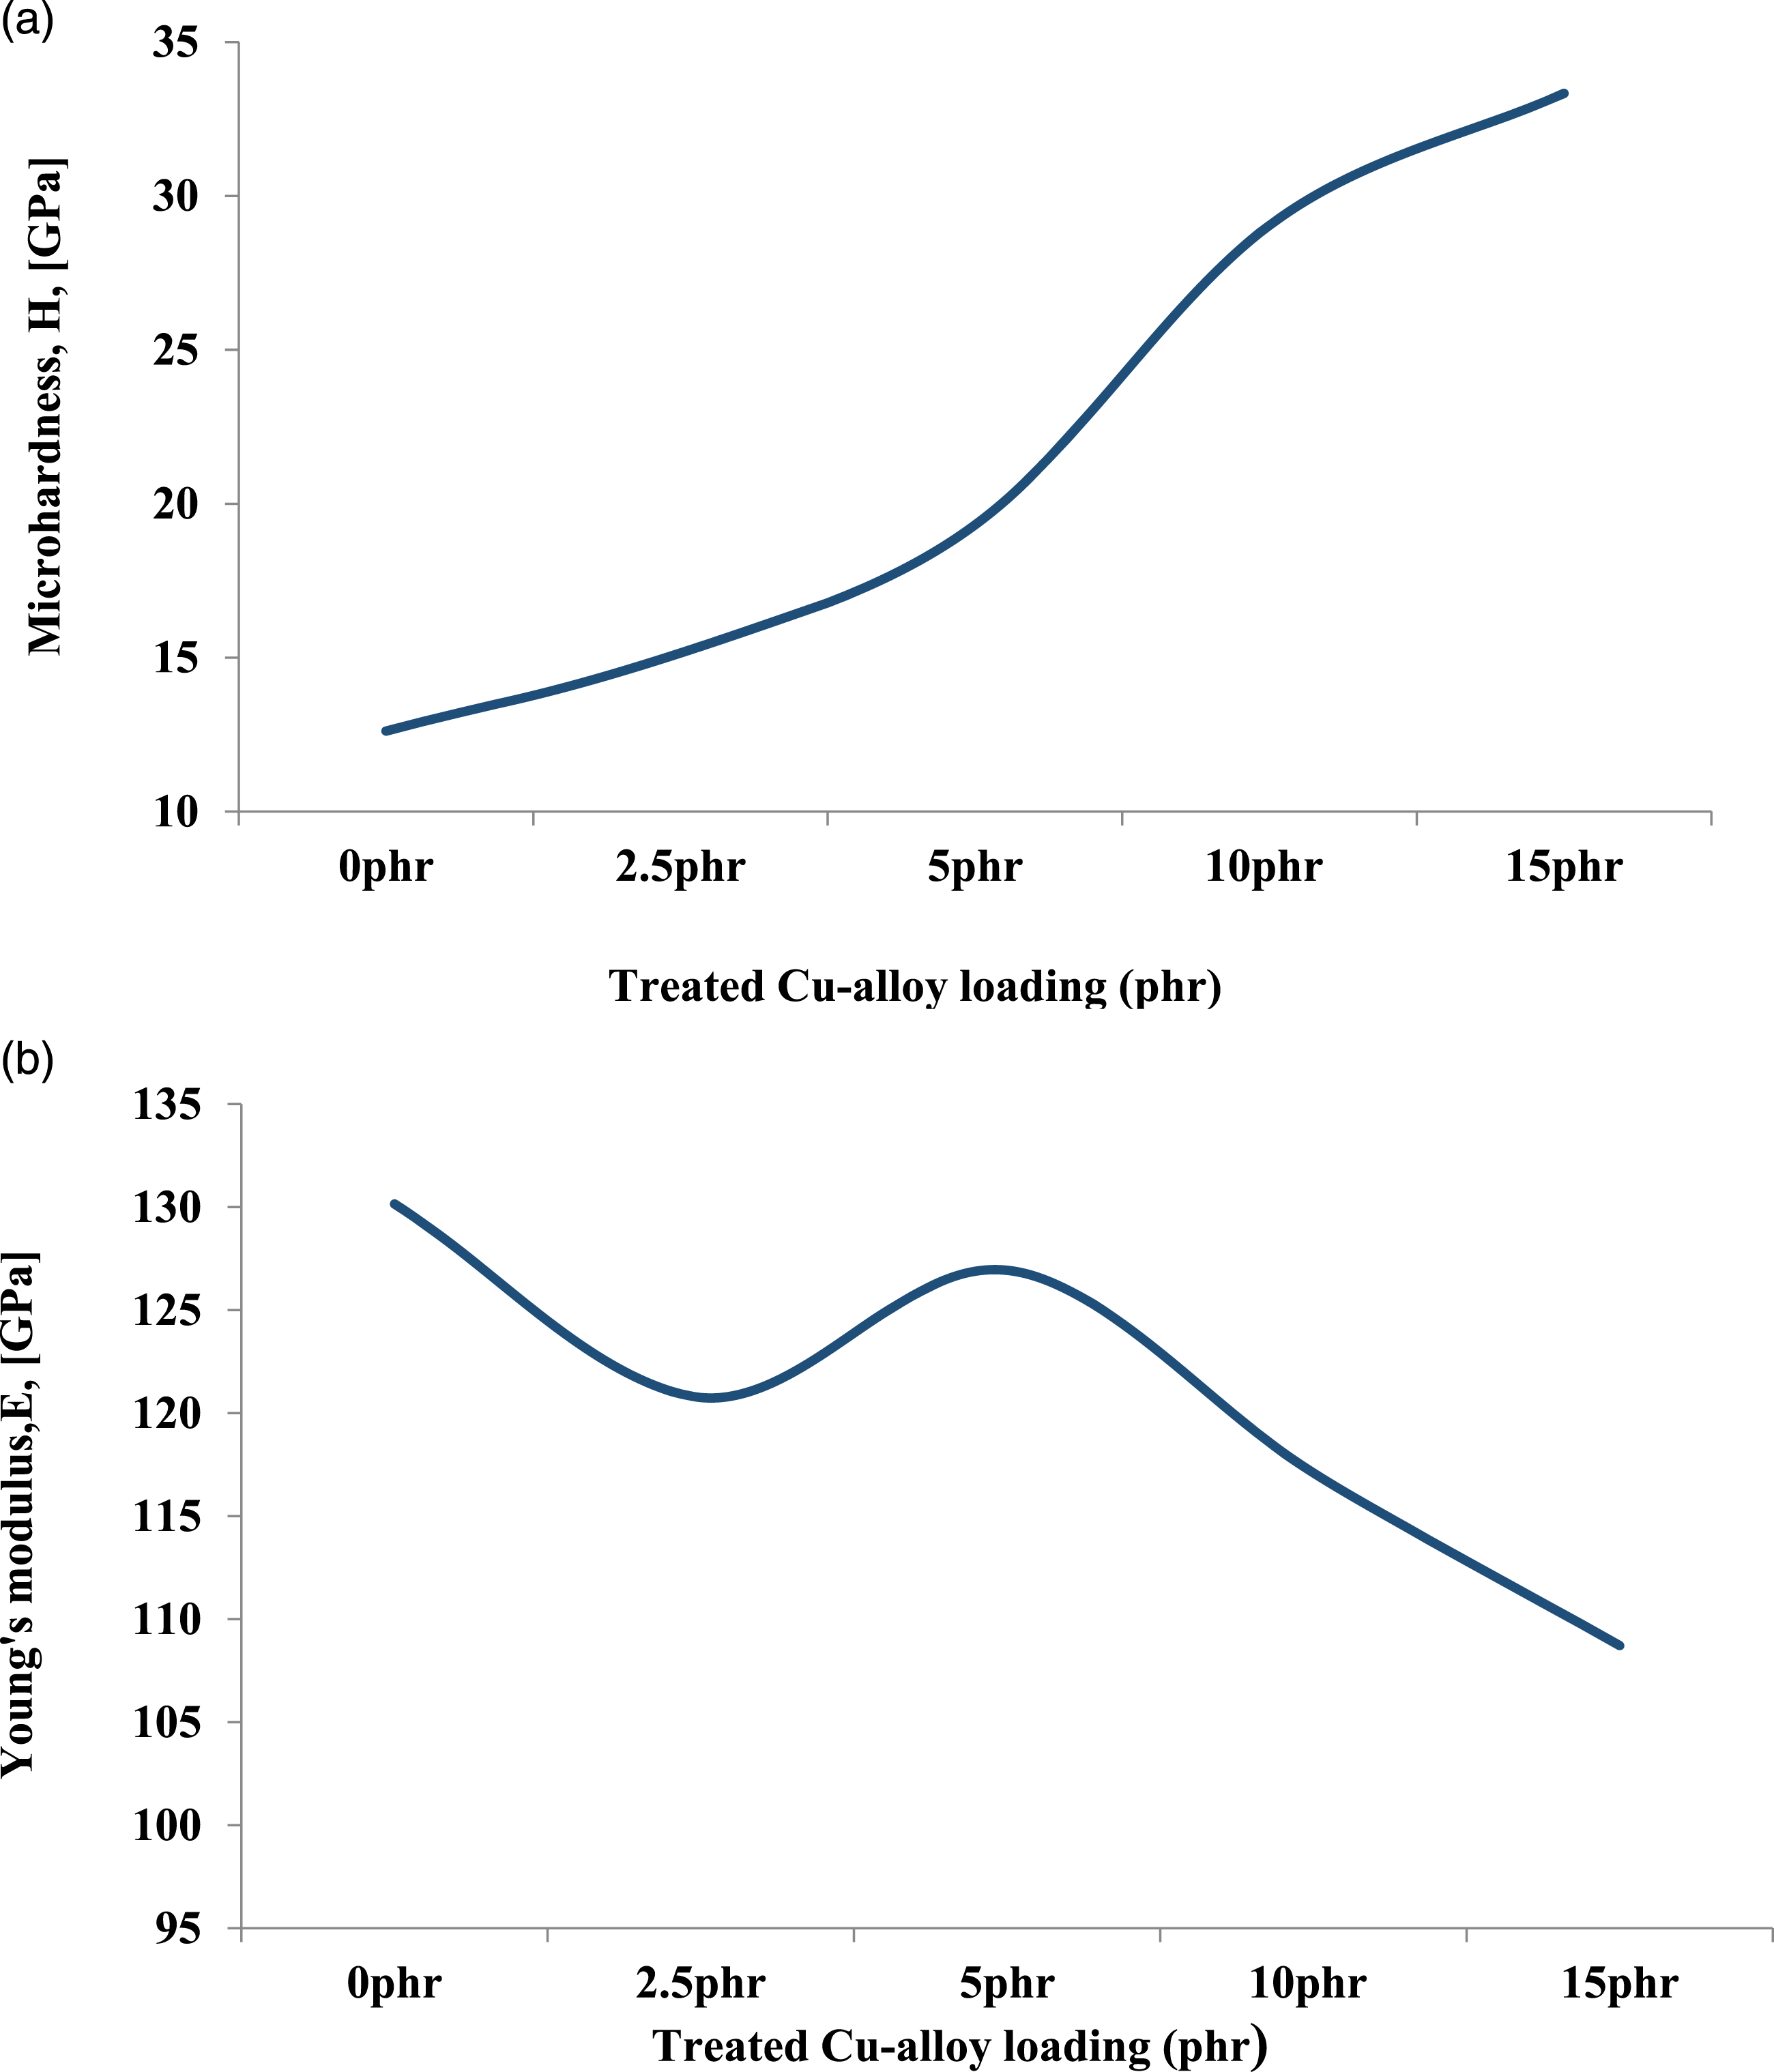
Micro-hardness (H)
The micro-hardness represents the structure’s rigidity. It may vary with the variation of the compound’s contents or concentration. Also, some other factors, like temperature, aging, pressure, and so on, can have an influence on the micro-hardness of the materials. As shown in Figure 10(a), the micro-hardness increased from 0 phr to 15 phr. This increment is attributed to the increase in rigidity. The addition of treated Cu-alloy increased the intermolecular bonds and decreased the space between them; it increased the strength and enhanced the bond formation. The higher content of treated Cu-Al-Zn alloy in the SR matrix caused strong network interaction within the resulting composites. Therefore, rigidity is increased.
Acoustic measurements
Sound absorption characterization
The sound absorption performance of samples is shown in Figure 11(a) in the frequency range of 2000–6300 Hz. Sample SR-0 has the resonance peak (maximum absorption) observed at 0.35 and frequency 2000 Hz; this magnitude is considered a small absorption value. Also, the remaining samples have small amplitudes (0.35) for absorption within the frequency range. Since the reflection coefficient is the opposite of the sound absorption coefficient, it is important to show the reflection coefficient for these samples. Where the reflection coefficient increases the material’s ability to insulate instead of absorb. It is clear from the absorption curve that the samples SR-1, SR-2, SR-3, and SR-4 have small amplitude of absorption, which is around 0.14–0.28. The resonance peaks observed at 2000 Hz for samples SR-1, SR-2, and SR-3 and 2500 Hz for sample SR-4 indicate a small shift in the resonance peak toward a higher frequency. Heat conduction absorption, relaxation absorption, and viscous absorption are the major ways that sound energy is dissipated.4,5,35–37 Represent (a) sound absorption coefficient, (b) sound reflection coefficient, (c) transmission loss, (d) decibel drop and (e) damping factor behavior for all the composites samples versus frequency.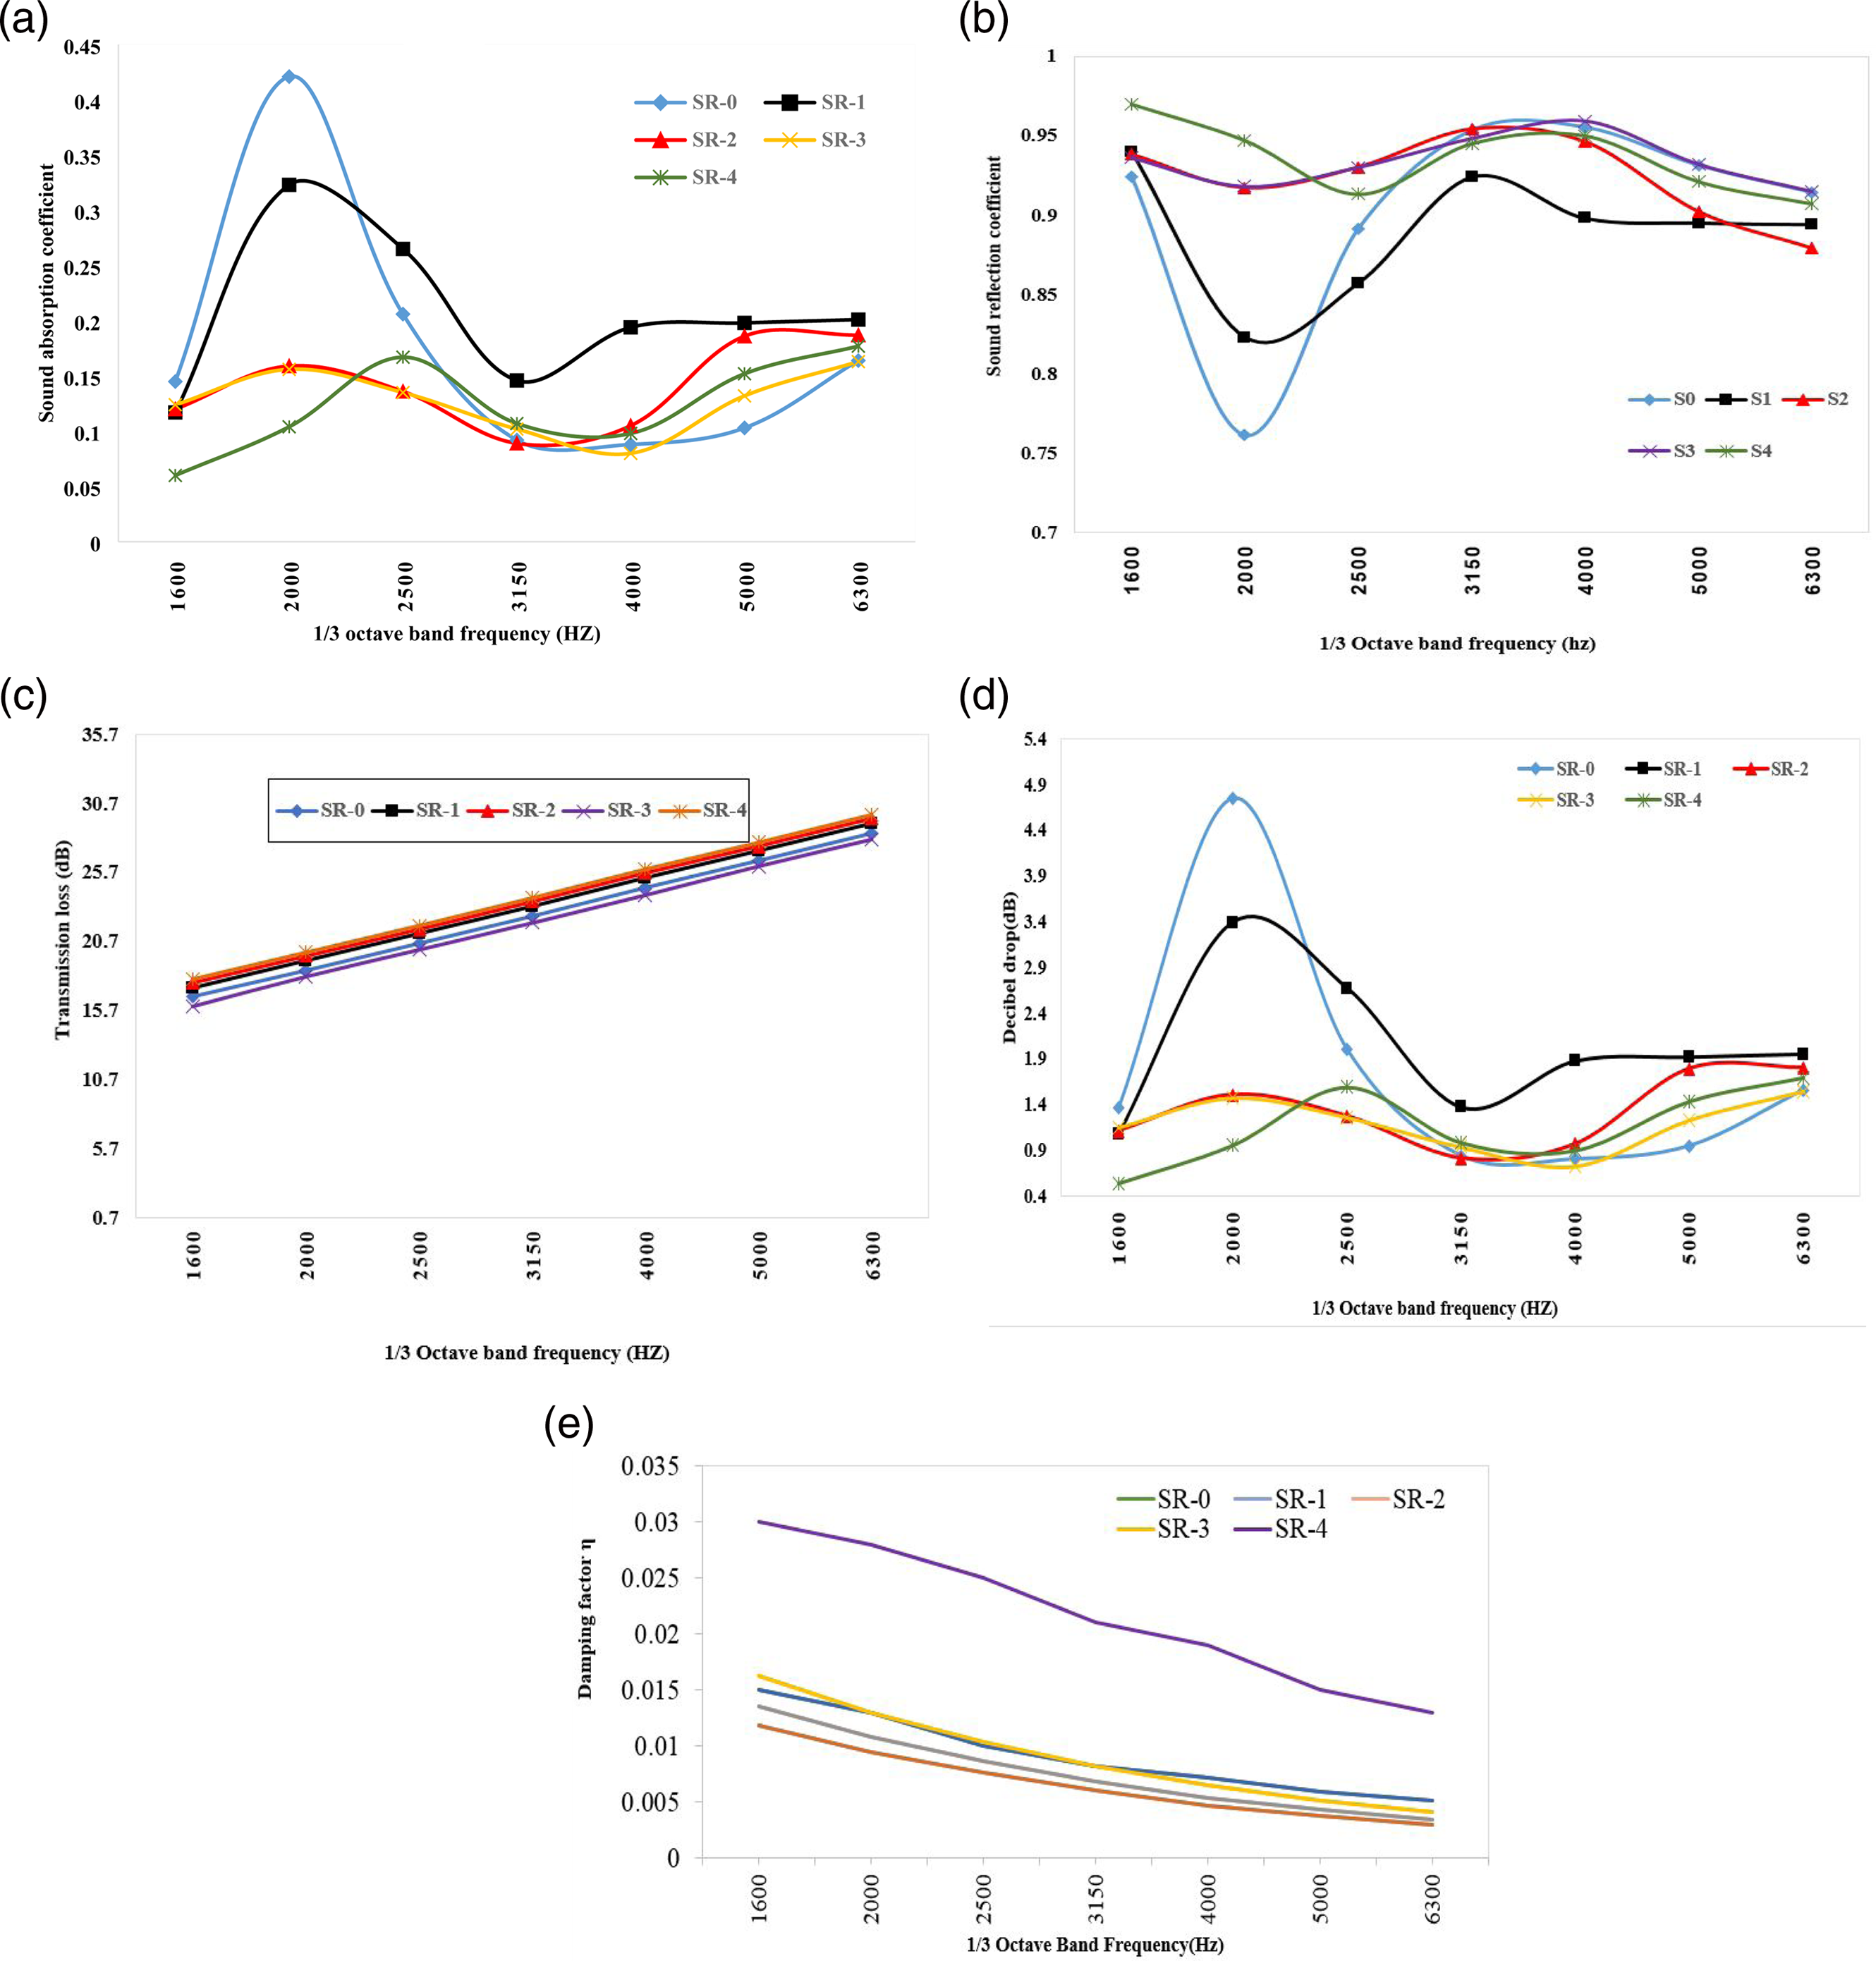
The improved sound absorption coefficient mechanism
When a sound wave hits the SR composite’s surface, the particles of treated Cu-alloy scattered in the SR matrix may be vertical, parallel, or oblique to the sound wave’s incident direction. When sound waves reach the samples, they pass through the little holes. The shearing and friction of air across SR composites causes viscous strains to increase, resulting in increased sound absorption. The air within the limited number of holes vibrates when sound waves pass through them, causing the cell wall material to vibrate as well. The vibration causes more energy absorption, so smaller and more uniform holes within the structure occur. Because SR composites have a low density, sound waves propagate more slowly within the material, increasing sound absorption.
Reflection coefficient
From the reflection coefficient in Figure 11(b), one can observe a dip at the frequency of 2000–2500 Hz for all the samples, and then an increase (∼0.95) in the reflection coefficient recorded from 3150–6300 Hz. Also, the sample SR-4 has higher reflection coefficient amplitude through the frequency range 2000–3150 Hz. The incident sound wave may reflect more and be absorbed more due to the dispersed treated Cu-alloy particles within the SR composites. The viscosity and thermal effects are both dependent on the reduced sound energy. Because the existence of this particle may fill the small number of holes existing in the neat silicone and cause more reflection than absorption. Additionally, the addition of treated Cu-Al-Zn may increase the flow resistivity and increase the reflection coefficient amplitude.
Transmission loss TL
The TL of the mass law prediction was calculated by using equation (8)
In general, The input frequency range, density, and mass of the material all influence the TL,31,33 where (f) represents frequency and (m) represents mass per unit area (kg/m2).
Figure 11(c) shows that the TL was very high (>20 dB) at frequencies 3150–6300 Hz, and it ranged from 16 to 21 dB between 1600 and 2500 Hz. It shows a linear increment through the frequency of interest for all the composite samples. The magnitude of TL for sample SR-4 is thought to be greater than that of SR-2 and SR-3, both of which are greater than neat composite SR-0.
Decibel drops
Determine the decibel drop of the material at the given frequency using the sound absorption coefficient and the formula below

λ is the wave length and is measured in Np/m (Np stands for Neper, a non-dimensional unit used in numerical computations) (8.6 dB = 1Np). α values used from the attenuation in Figure 5 above. 2πη is considered as the ratio of total energy conserved to total energy wasted each cycle, and η is also equal to the loss tangent, tan δ. This tan δ (E* = E′ − iE″, with i = −1) is defined as the ratio of the imaginary part (E″) to the real part (E’) of a complex elastic modulus. From Figure 11(d), one can find the values of the decibel drop within the frequency range. The values of the decibel drop range from 0.4–4.9 dB; each sample has the highest attenuation at the resonance frequency. The average values of decibel drop are 1.0, 1.2, 1.3, 1.2, and 2.3 dB for composites SR-0, SR-1, SR-2, SR-3, and SR-4, respectively. In Figure 11(e), one can find the behavior of the damping factor at different frequencies for the composites; they have an exponential decay with increasing frequency. The amplitudes of the composites SR-3 and SR-4 are considered to be higher, while the differences between the other composites are very small.
Conclusions
SR containing metal alloy (Cu based-alloy) can be used to make ear plugs, electronics devices due to the specific mentioned properties. Uniform dispersion of treated Cu-alloy enhances the properties of the SR composites. The homogeneous dispersion of treated Cu-alloy particles in the presence of the TMSPM coupling agent results in effective load transfer, leading to an improvement in the rheological and mechanical properties of the investigated SR composites. Sample SR-5 with TS (6.25 MPa) and EB% (1627%), which contained 15 phr Cu-Al-Zn filler, was considered an optimum sample for further tests. The ultrasonic measurements revealed that the higher content of treated Cu-Al-Zn alloy in the SR matrix caused strong network interaction within the resulting composites. In addition, the coupling agent TMSPM may increase the crosslinking ability. The sound absorption performance of the SR composites decreases as the percentage of treated Cu-Al-Zn increases. The reflection recorded with high values within 3150–6300 Hz in sample SR-4 is considered optimal as a reflector, especially at lower frequencies below 3150 Hz. The decibel drops for composite samples lie within 1.7, 2.0, 1.3, 1.2, and 1.5 dB, and the damping factor calculation proves that sample SR-4 has higher amplitude in comparison with other composite samples.
Footnotes
Declaration of conflicting interests
The author(s) declared no potential conflicts of interest with respect to the research, authorship, and/or publication of this article.
Funding
The author(s) disclosed receipt of the following financial support for the research, authorship, and/or publication of this article: This research is supported by The National Research Centre Project number 12010313.