
Abstract
By loading Cross model and Oldroyd-B model with User-defined Function (UDF) program, a method to simulate the extrusion flow of viscoelastic non-Newtonian fluid in Fluent software was proposed. In the homogeneous solution of Polyethylene terephthalate (PET) and supercritical CO2, the microscopic bubble growth kinetics model was coupled with the Population Balance Module (PBM), analysis effect of shear rate on bubble nucleation and growth, numerically simulated of the nucleation and growth of bubbles in the extrusion die of PET microcellular foam sheet. Through analysis, the bubble size distribution is more uniform under the condition of 60° template convergence angle. The larger the extrusion speed, the wider the uniform distribution range of bubble density at the outlet position. The initial concentration of CO2 has the greatest impact on the bubble density. Increasing the initial concentration of CO2 can improve the bubble density, but appropriately reducing the initial concentration of CO2 can improve the effective distribution range of bubble density of foam sheet.
Introduction
Microcellular foaming materials have been widely used, which is of great significance for the theoretical and experimental research of polymer microcellular foaming. Microcellular foaming material means foaming material with cell diameter in the order of 10 μm and cell density of more than 108 cells/cm3. Microcellular foamed materials produced by continuous extrusion of polyethylene terephthalate (PET) and supercritical CO2 have excellent mechanical properties,1,2 high thermal stability and safety for use in high temperature environments. 3 PET and CO2 have the characteristics of low preparation cost, PET has strong recyclability, and the foamed sheet prepared by Recycled polyethylene terephthalate (R-PET) has excellent mechanical properties. 4 Microcellular foamed sheets prepared by PET and supercritical CO2 are widely used in wind power and shipbuilding industries. However, compared with static foaming, the continuous extrusion process of microcellular foams is a dynamic foaming process, it is difficult to ensure the stable growth of bubbles and the uniform distribution of the bubble size so as to obtain the sheet that meets the requirements of microcellular foaming.
In the process of polymer foaming, the stable growth of bubbles is an important research factor. Compared with batch foaming, it is more difficult to achieve stable growth of bubbles in continuous extrusion foaming process.5,6 Z. P. Yang et al. 7 studied the PET foaming blending process and compared the effects of different process parameters on the preparation of PET foaming sheets. H. Zhong et al. 8 investigated the integrated process of PET modified foaming and obtained better cell structure. K. Bocz et al. 9 modified PET with epoxy functional chain extender to improve the cell density of the foam materials. S. Yao 10 found that long-chain branched PET materials have better foaming properties by modifying PET materials. The experimental method is often only analyzed by the product after foaming. It is difficult to analyze the foaming process including the nucleation and growth of bubbles. This problem can be solved by building a visual platform,11,12 but the cost is high. With the continuous development of computational fluid dynamics (CFD) software, this problem can be effectively solved.
Some scholars have studied the bubble density distribution of foaming products from a macro perspective. Through visual mold research, V. Shaayegan13,14 found that increasing the pressure drop rate and the concentration of the foaming agent, the bubble density increased significantly, and the flow rate had little effect on the bubble density. S. Yao et al. 15 introduced initial melt stress in a study of PET and supercritical CO2 extrusion foaming, and simulated the prediction of bubble growth during dynamic foaming. J. K. Yang et al. 16 established a new mathematical model based on classical nucleation theory and describe the general form of the nucleation process. D.D.Hu 17 studied the effect of material properties on bubble nucleation and growth, and analyzed the relationship between bubble density and bubble size.
The nucleation and growth process of bubbles is a complex process including mass and energy transfer. Simplifying the model into a single bubble can analyze the flow of bubbles in the polymer from a micro perspective and improve the stability of bubbles. L. Zhang et al. 18 studied the effect of temperature on the evolution of bubble morphology and improved the surface quality of microporous foaming materials. Y. K. Ge et al. 19 drew the bubble wall morphology evolution process and bubble growth curve, and obtained the optimal foaming temperature of the polymer. Y. C. Chen et al. 20 conducted numerical simulation through the bubble growth stability model, and found that the characteristic relaxation time had a great influence on the foaming performance, and calculated the stable growth time of bubbles. H. Azimi 21 studied the effect of gas diffusivity and zero shear viscosity of polymer melts on bubble growth and found that this is a diffusion controlled phenomenon.
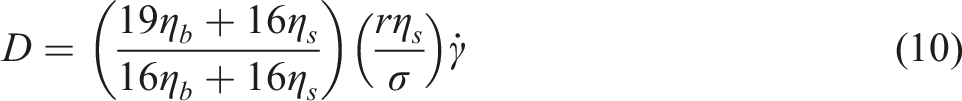
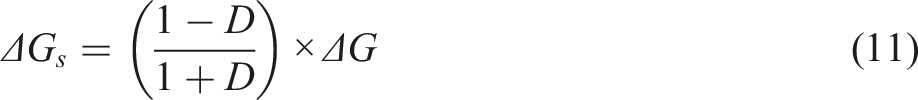
However, there is a gap between the results obtained by CFD method and the experimental results. Some scholars proposed that the promotion of shear force on nucleation was ignored. Through a visual experimental platform, X.F.Peng 11 found that the bubble density in the mold flow channel increased significantly at higher screw speeds. M.J.Pang 22 found that the shear thinning of fluid has an important effect on bubble shape.W. J. Mou 23 studied the influence of shear factor on nucleation with bubbles. Through Taylor deformation theory, the critical Gibbs free energy in shear flow was deduced, and it was pointed out that the deformation of bubbles led to the decrease of the free energy barrier of nucleation. Increasing the shear force is similar to the way of polymer modification 24 both reduce the energy required for bubble nucleation and growth.
In this paper, the microscopic bubble growth kinetics model was coupled with the macroscopic Population Balance Module (PBM) , and the effect of shear rate on nucleation and growth rate was introduced to analyze the microcellular foaming process of PET and supercritical CO2. The Fluent software was used to couple the CO2 nucleation and growth process during PET extrusion with the PBM model, and the polymer flow state was simulated in FLUENT software through the UDF program, to compared effects of different die convergence angles, extrusion speeds and initial CO2 concentration conditions on bubble size, bubble density and bubble distribution. A calculation method for calculating the effective distribution of bubbles at the outlet position is proposed as a judgment method for the uniformity of bubble density distribution at the outlet position. The foaming effect at the die outlet was judged by the uniformity of bubble density distribution, the variance of bubble density distribution with different sizes and bubble density.
Mathematical models
To simplify the calculations, make the following assumptions: 1. Polymer homogeneous solution is incompressible fluid; 2. The flow assumption of homogeneous solution is laminar flow; 3. The experimental process is isothermal; 4. The solubility of CO2 in PET conforms to Henry ‘ s law; 5. The diffusion coefficient of CO2 in PET is a constant; 6. Bubbles are always spherical during nucleation and growth; 7. Ignoring the influence of gravity. Based on these assumptions, the governing equations for bubble nucleation and growth are as follows
Governing equations
Mass equation is expressed as

Momentum equation is expressed as

Viscoelastic model
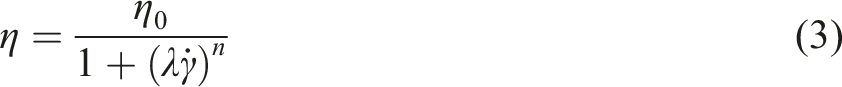
The homogeneous solution formed by PET and supercritical CO2 is a kind of non-Newtonian fluid, and its rheological properties conform to the generalized Newtonian fluid. Cross viscous constitutive model is a kind of generalized Newtonian fluid constitutive model. Under the condition of low shear rate, it can better simulate the shear thinning properties of non-Newtonian fluid, but it cannot show the viscoelasticity of non-Newtonian fluid. The differential fluid model can well represent the viscoelasticity of non-Newtonian fluid. In this paper, the Oldroyd-B model is selected, which is relatively simple and has strong versatility. In the subsequent study, Oldroyd-B model and Cross model were fitted to jointly represent the rheological properties of homogeneous solution.
Cross model
Transport equation of deformation rate tensor

PBM population balance model
PBM model, using PSD (particle size distribution) particle size distribution principle, the bubble distribution simulation. In this process, the nucleation, growth, break up and coalescence of bubbles were considered to obtain the mass transfer and heat transfer between gas and liquid phases. The population balance equation as


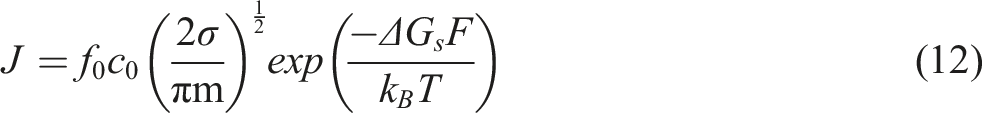
Bubble nucleation rate
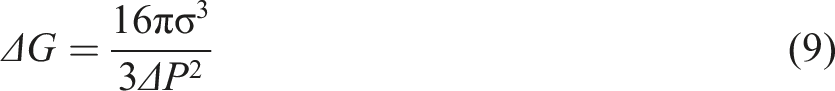
Based on the classical nucleation theory, this paper focuses on the influence of shear rate on bubble nucleation and growth. The nucleation free energy barrier of classical nucleation theory is expressed as
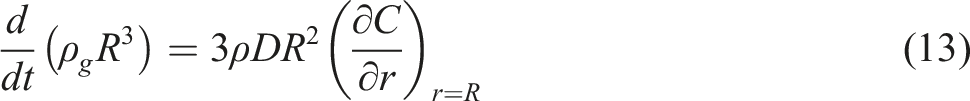
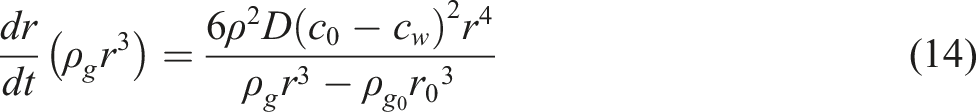
Bubble growth rate
Gas mass conservation equation in bubble
Physical model
The extrusion line for microcellular foam sheet used in this paper is shown in Figure 1, using a Single order co-rotating twin screw extruder and Extrusion die for microcellular foam sheet at back end as shown in Figure 2. After the previous numerical simulation, the pressure drop rate and the extrusion speed of each round hole on the extrusion die the same, so only a single round hole channel in the extrusion die was modeled and analyzed in the subsequent work. Microcellular foam sheet extrusion line. Microcellular foam sheet extrusion die.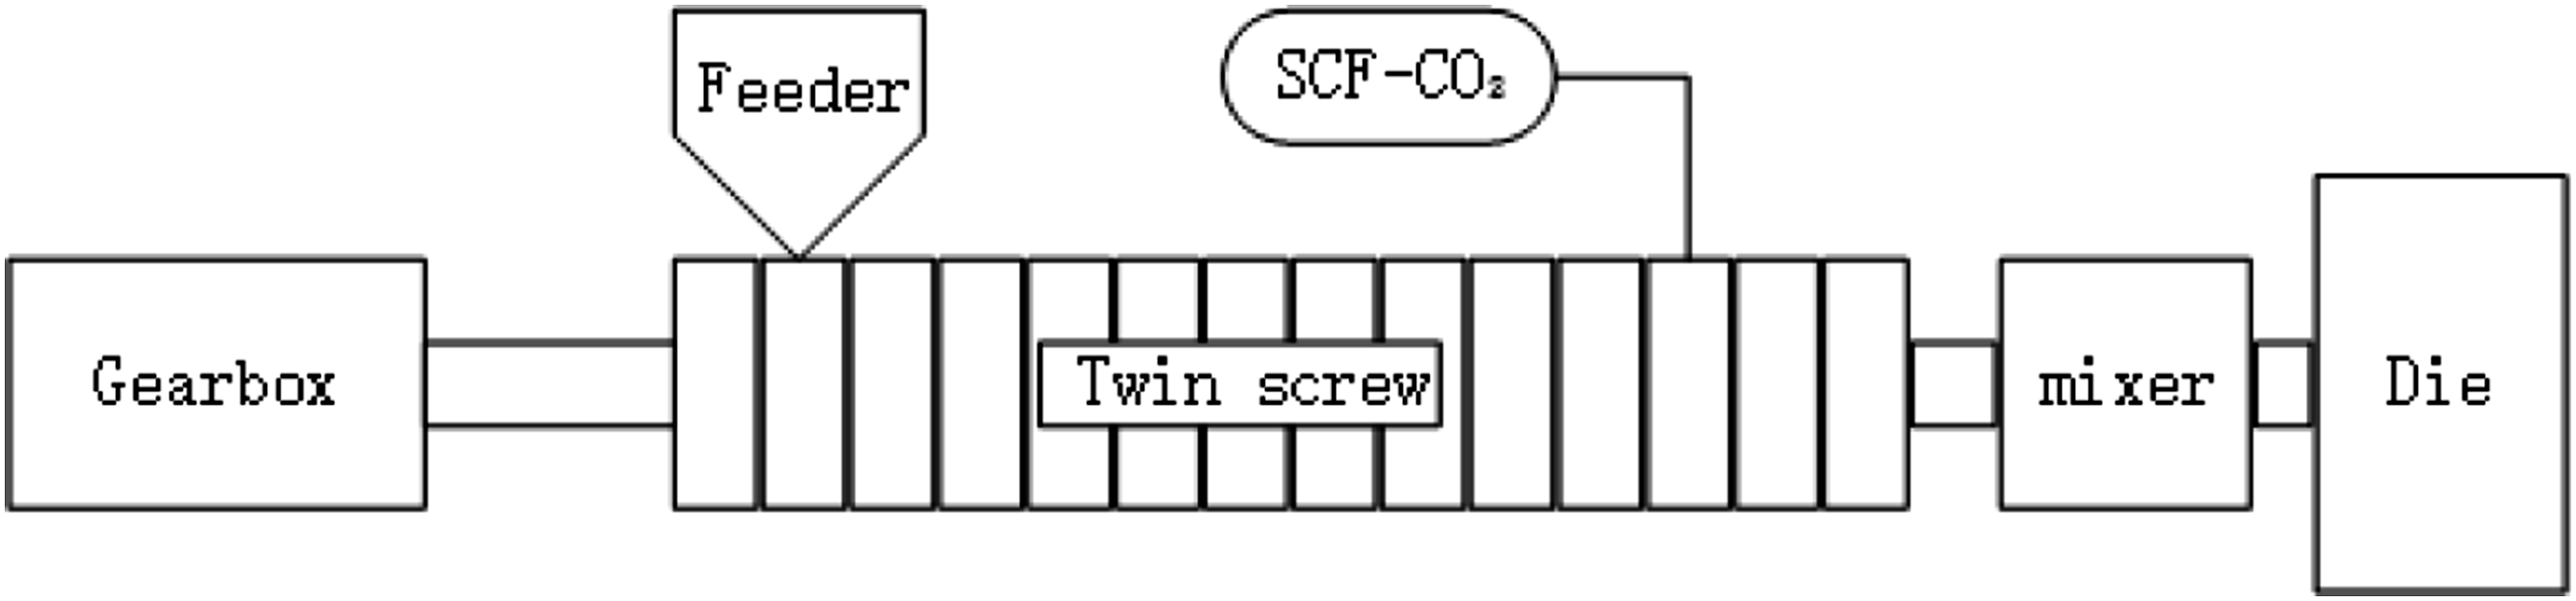
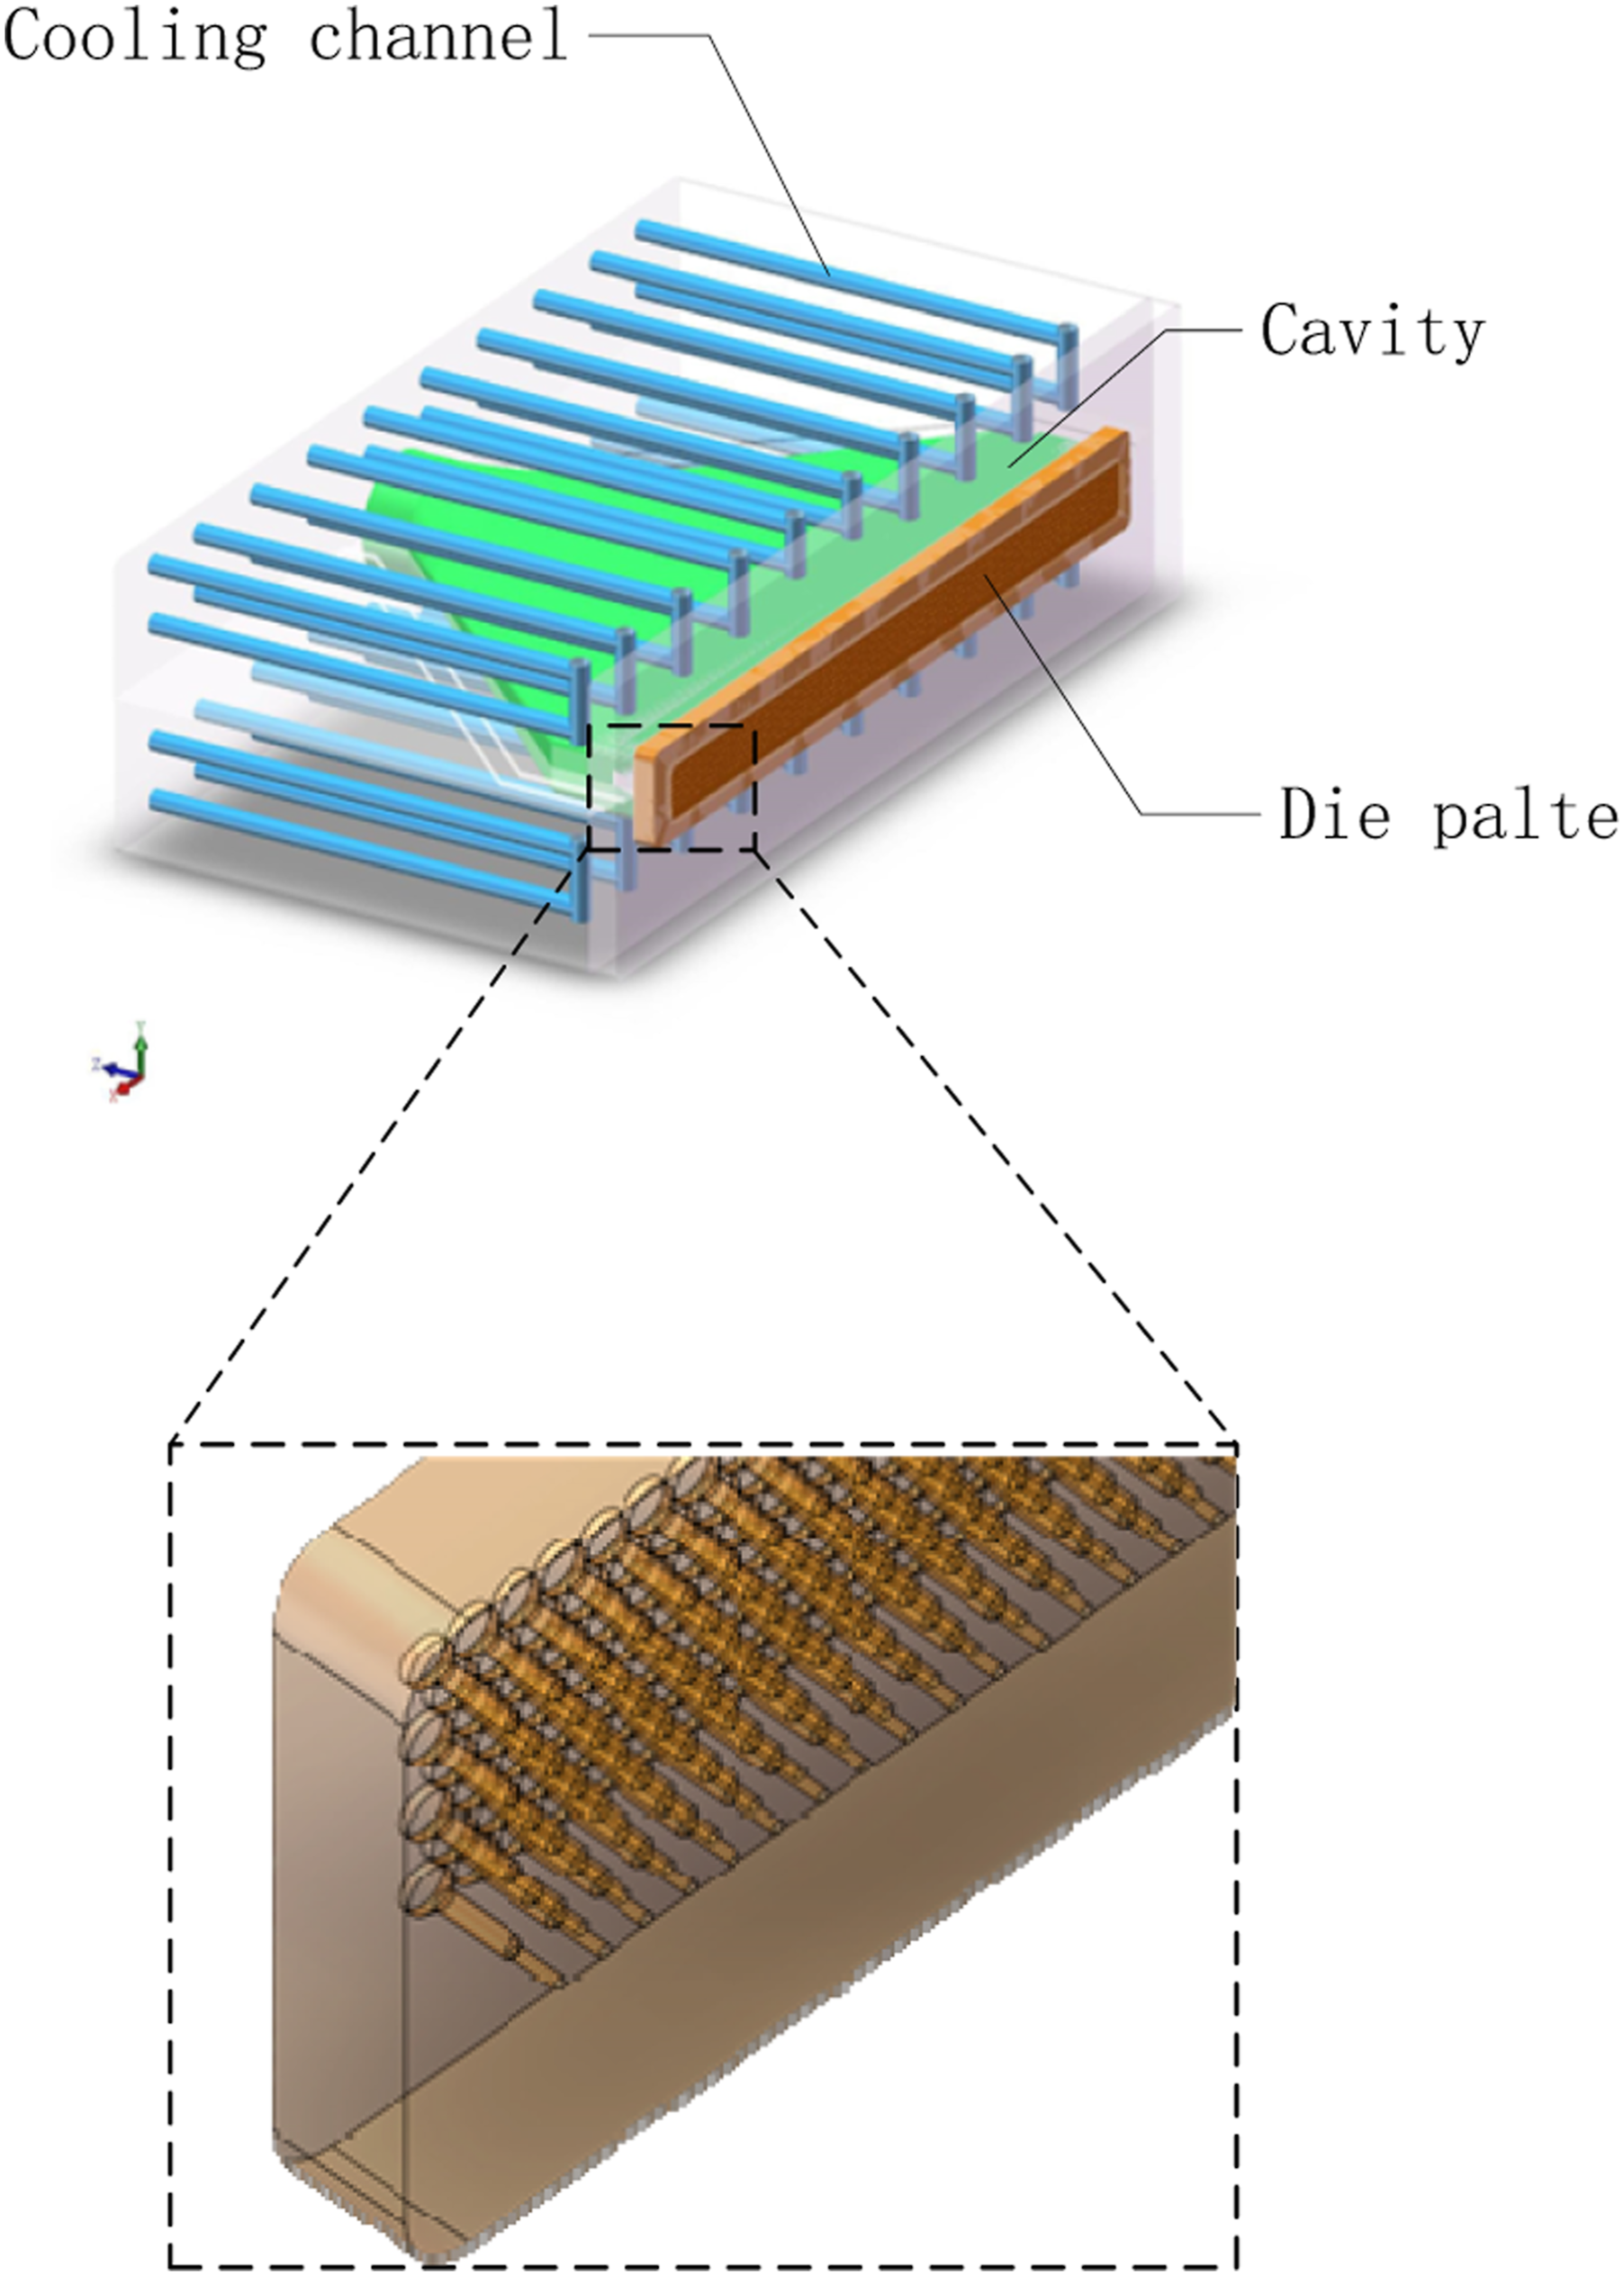
In order to further improve the computational efficiency, the circular pipe flow channel is divided into semi-circular pipe flow channels, as shown in Figure 2. The channel size is shown in Figure 3. All internal channels are divided by structured grids, and all hexahedral grids are used for local encryption of outlet channels to improve the calculation accuracy. Flow channel size in die (mm).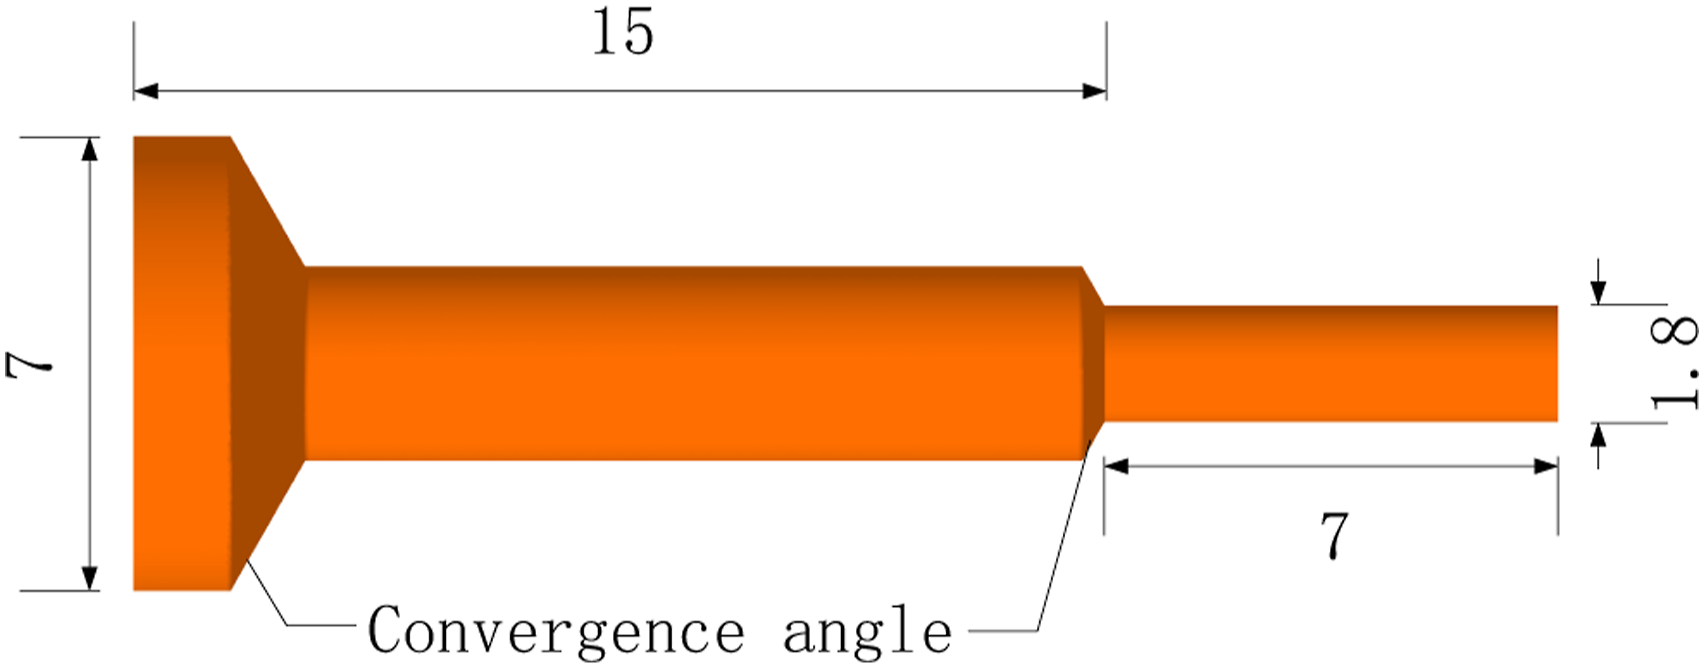
The Inlet velocity is 0.0005 m/s, the no-slip wall, assumed that the inlet is all homogeneous solution of PET and supercritical CO2, the volume fraction of CO2 is 0.02, the wall temperature is 543 K. The outlet is set as pressure outlet, and the pressure is 1 atmospheric pressure.
The bubble size of the final prepared foam sheets is 10 μm orders of magnitude. and the bubble density of more than 100 μm is less than 1cells/cm3 in the numerical simulation. So the minimum bubble size is 1 × 10⁻⁶m, the maximum bubble size is 1 × 10⁻⁵m, in order to improve the computational efficiency Bin set to 16, divided 16 bubble size, ratio index is 2.
The mixed multiphase flow model in fluent software was used to simulate the distribution of bubble diameter and size by coupling PBM model. The PBM model was solved by homogeneous discrete population balance method, and the bubble was dispersed into a finite number of size intervals. Since all bubbles flow with PET melt during extrusion, it is assumed that all bubbles have the same velocity as actual conditions.
The steady-state solver based on pressure is used in the solution process. The flow process is assumed to be laminar. The coupling algorithm between pressure and velocity, continuity equation, momentum equation and energy equation are discretized by second-order upwind scheme. The relaxation factors of pressure, momentum and volume force are 0.5, 0.5 and 0.7, respectively. When the residual is less than 10−6, the calculation results converge.
model validation
Rheological model validation
The homogeneous solution composed of PET and supercritical CO2 is a non-Newtonian fluid, and the flow process has the characteristics of viscoelasticity and shear thinning of polymer viscosity. In order to ensure the accuracy of the fluid model, the above characteristics of the polymer need to be accurately simulated. In this study, the UDF program was used to fit the Oldroyd-B model and the Cross model to jointly represent the rheological properties of the polymer and realize the extrusion flow of the polymer.
In order to verify the accuracy of the model, the results are compared with the existing research results. The shear rate is an important parameter of polymer extrusion flow, and influence of shear effect is also considered in this study. Therefore, the shear rate of polymer fluid flow is verified through the existing literature. S. Yao et al.
15
simulated the extrusion flow of melt in PET dynamic foaming process by Polyflow software. In this paper, the same model was drawn by Fluent software to verify the distribution of shear rate in the flow channel. Figure 4 shows that the distribution in the low shear rate region is consistent, indicating that the model correctly simulates the flow of viscoelastic fluid and the shear effect with the wall in Fluent software. Verification of shear rate distribution by comparing Yaoshun’ s model:Shear rate distribution (a); Shear rate distribution curve from die center to wall (b).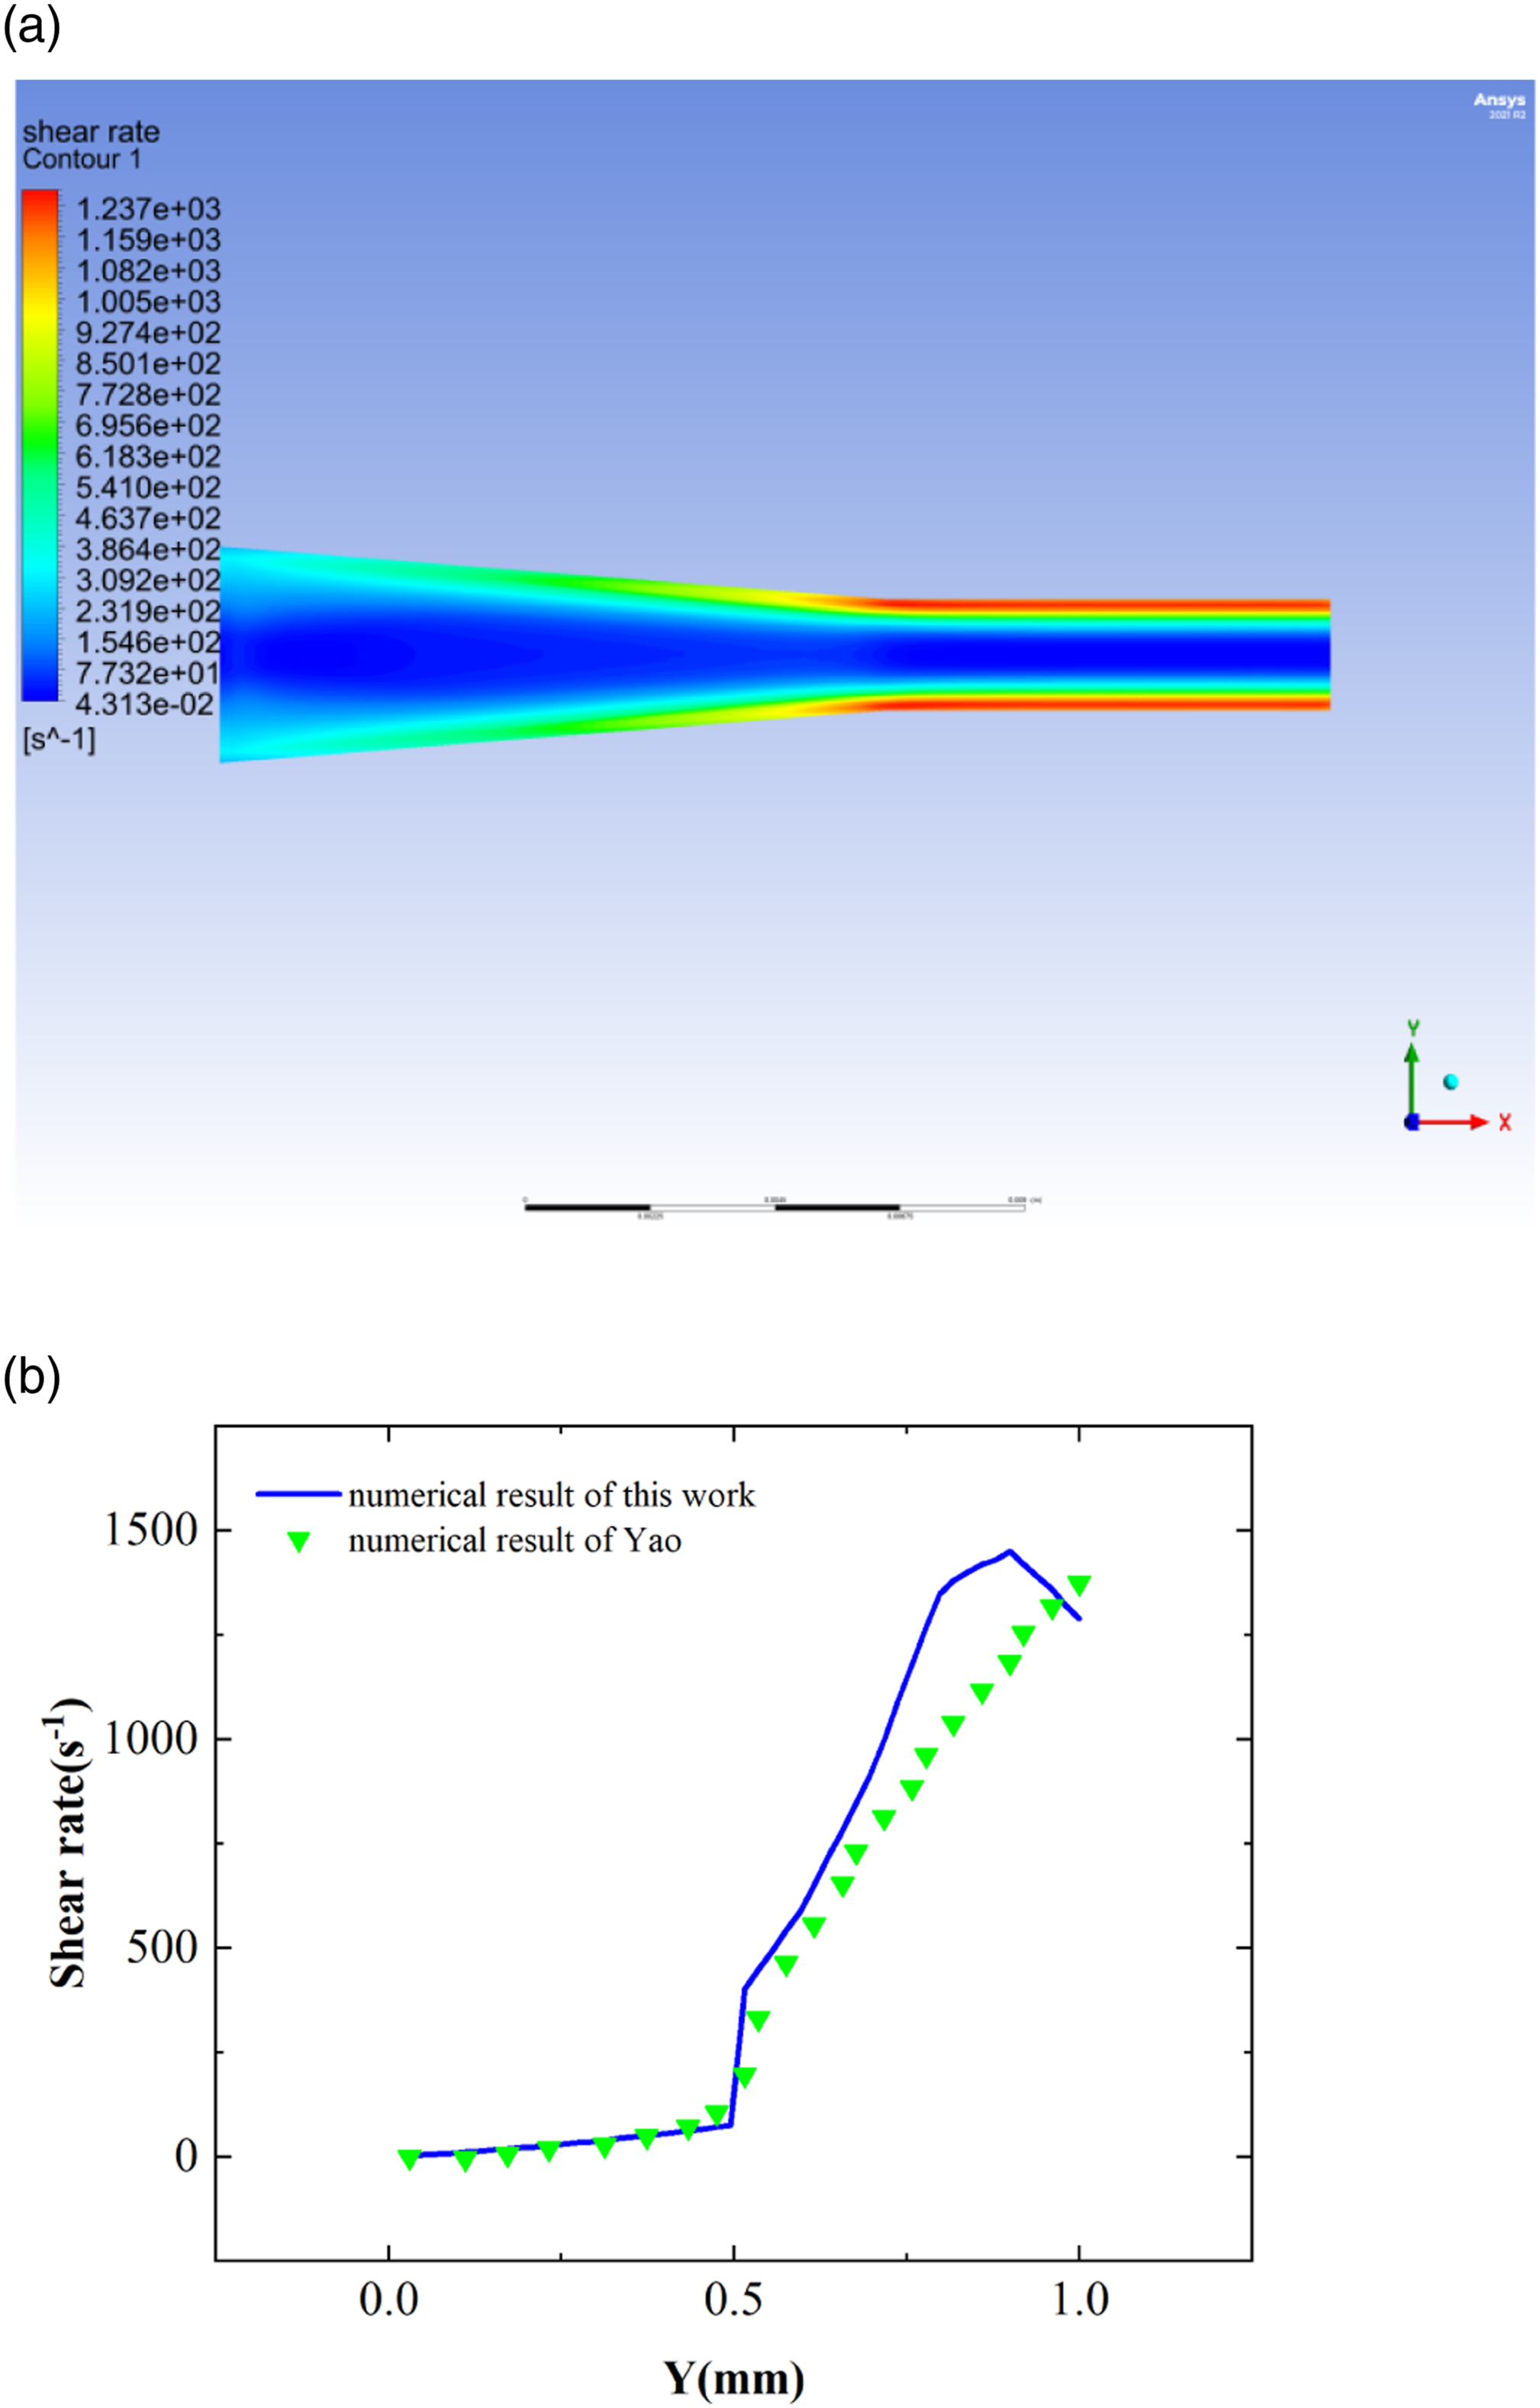
Under different shear rates, the bubble size and density distribution are different. X.F.Peng
11
conducted related research using a visual mold. In this paper, the same geometric model and material properties as in the literature are used to compare the experimental results of bubble density, The results are shown in Figure 5. As the shear rate increases, the bubble density increases and the average bubble size decreases. At higher shear rates, the results are biased, which may be because the breakage and coalescence of bubbles are not considered in this paper, and the breakage and coalescence of bubbles will be aggravated at high shear rates. The subsequent experiments in this paper are carried out at a lower extrusion speed, which is consistent with the experimental results in this interval, and the simulation results are reliable. Comparison of experimental results of bubble density distribution.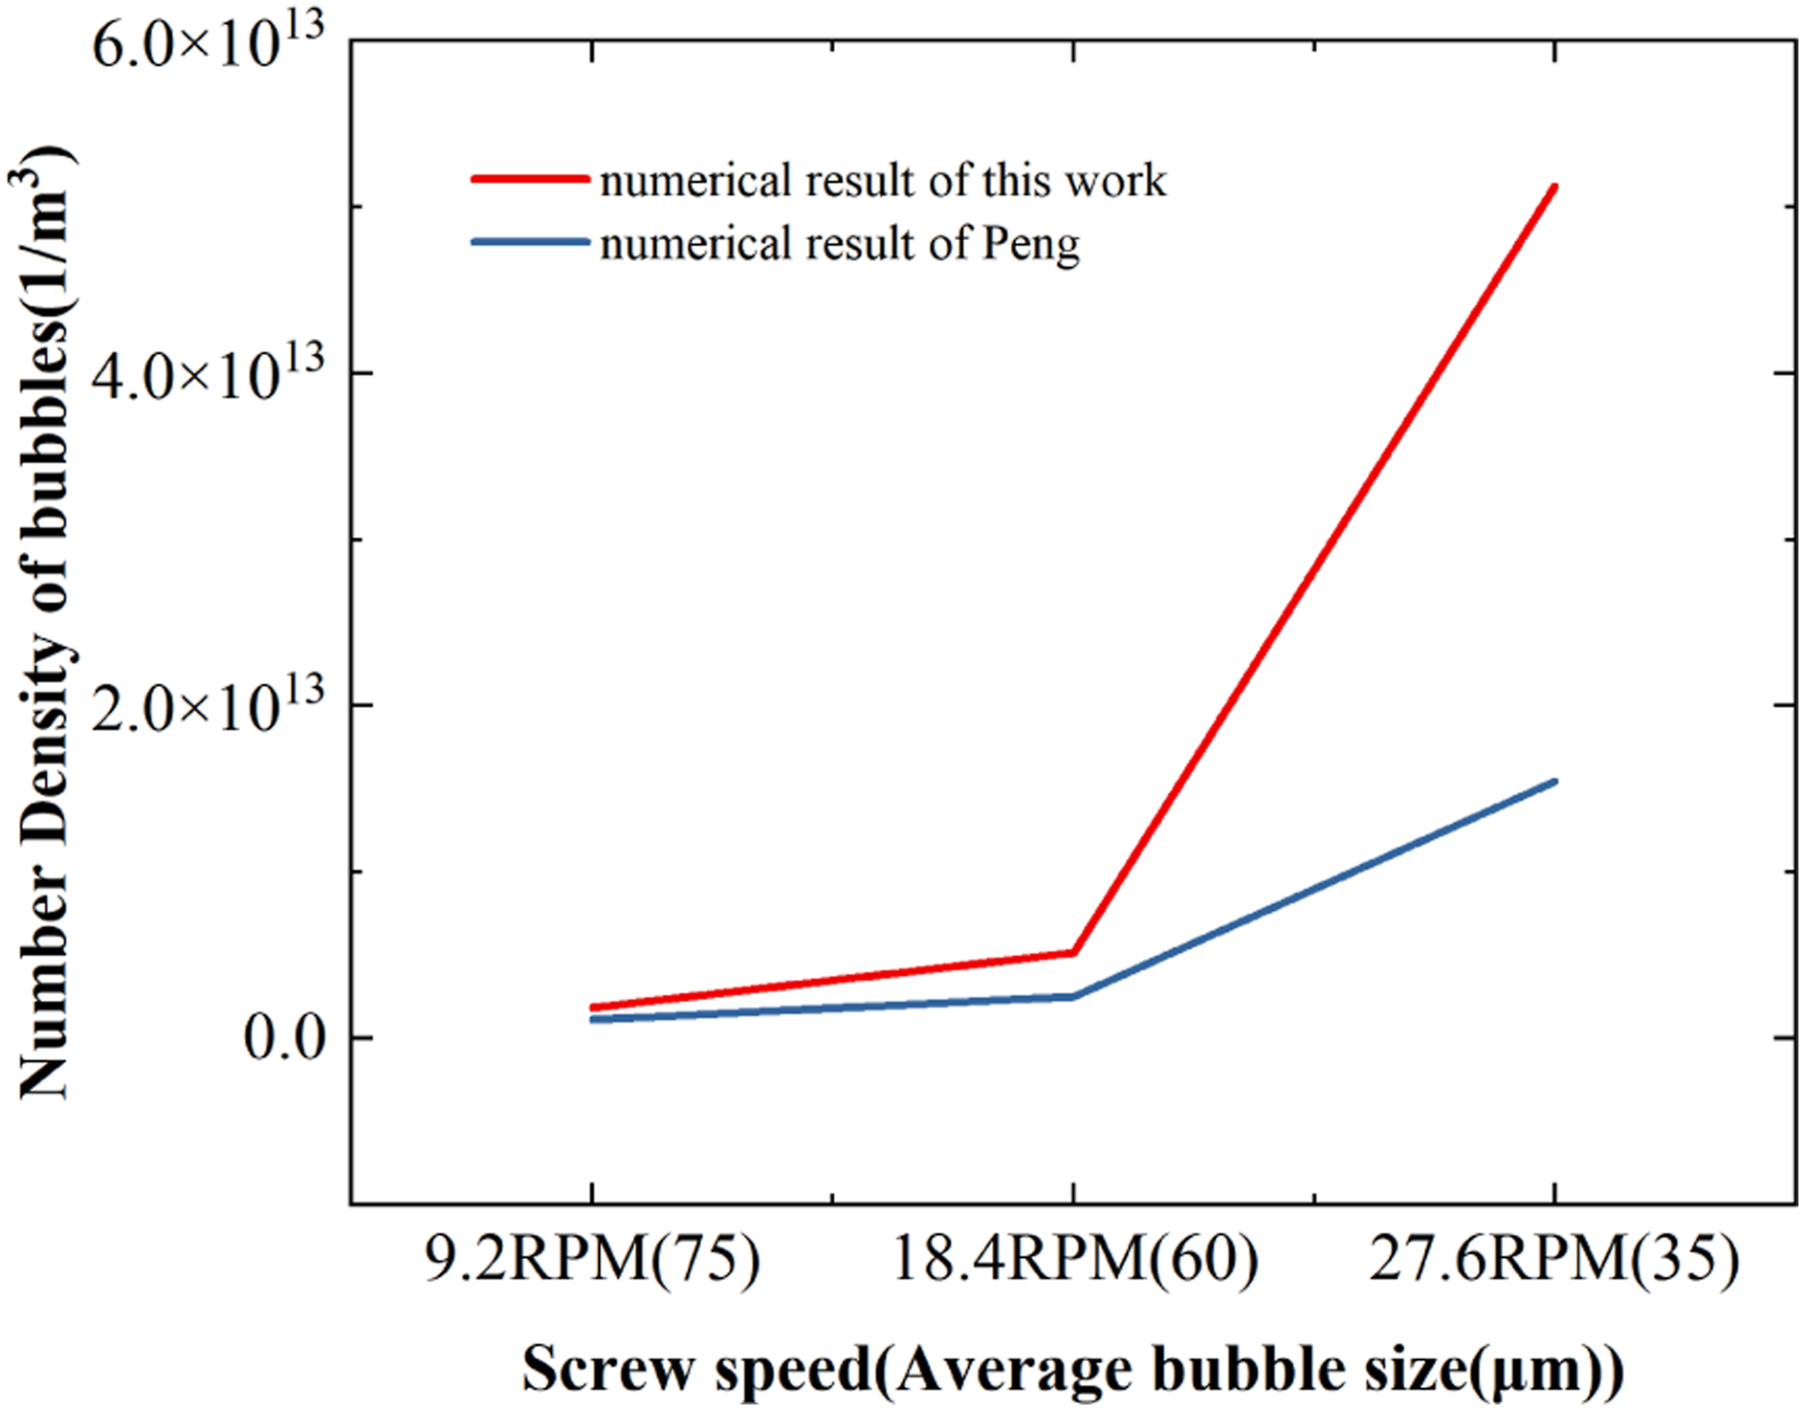
Grid independent verification
The mesh independence of the numerical model is verified to ensure that the mesh size has no effect on the calculation results. Increasing the grid density can improve the accuracy of the calculation results, but it will increase the calculation cost. Therefore, this paper selects four different numbers of grids, Mesh1 (1,737,635), Mesh2 (2,825,117), Mesh3 (4,478,529), Mesh4 (5,450,140). By comparing the error of the calculation results under different grid numbers, the grid with the lowest calculation cost is selected within the allowable error range.
In the extrusion experiment, the bubble size distribution in the die is mainly in the order of 1–10 μm, and in the simulation results, the bubble density of more than 16 μm is less than 1 cells/cm3, which can be ignored. Therefore, in order to ensure that the number of grids has no effect on the distribution of bubble density in subsequent experiments, the distribution of 1 μm and 10 μm bubbles at the outlet of the die was compared under different grid numbers. As shown in Figure 6(a), there is a large error in the bubble density distribution under the mesh number of Mesh 1. When the mesh number is greater than Mesh 2, the mesh number has little effect on the density distribution of 1 μm bubbles, but the density distribution of 10 μm bubbles still has a large error under the mesh number of Mesh 2, as shown in Figure 6(b). Compared with Mesh 4, the density distribution errors of 1 μm and 10 μm bubbles are less than 5% when the mesh number increases to Mesh 3. Therefore, under the premise of ensuring the effectiveness of the simulation results, Mesh 3 with low time cost is selected for subsequent research. 1 μm bubble density distribution (a) and 10 μm bubble density distribution (b) with different grid numbers.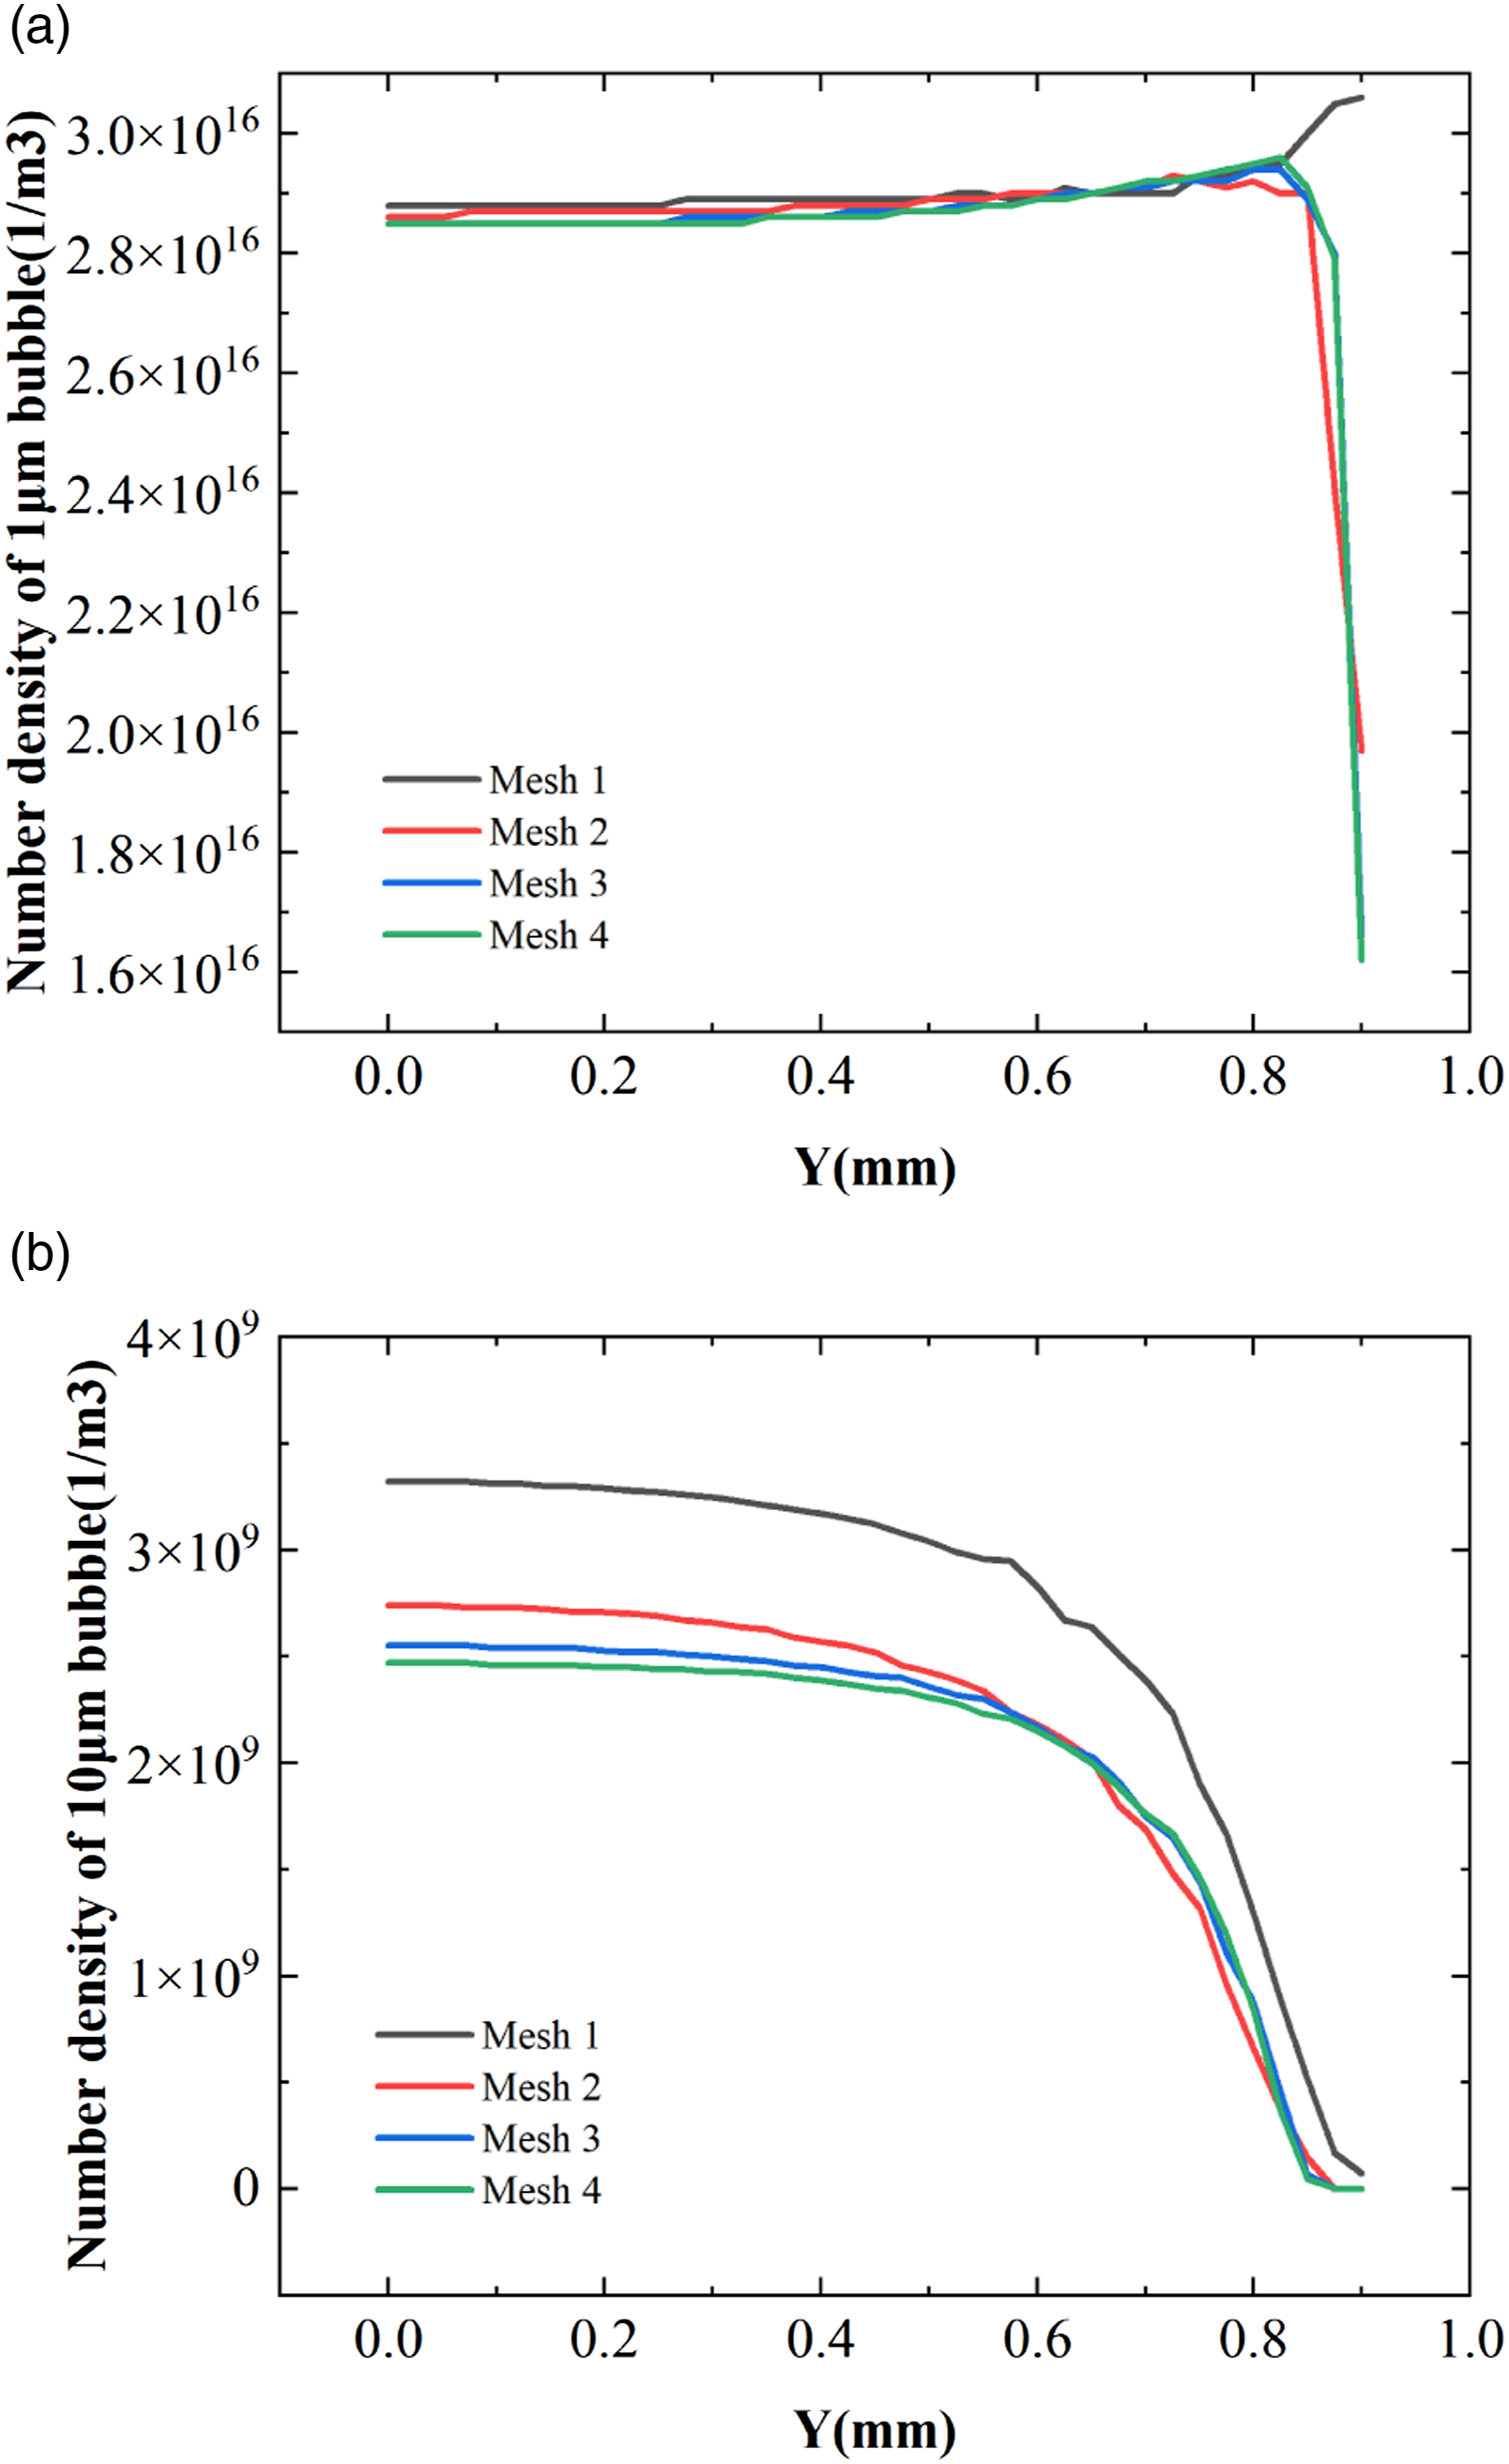
Results and discussion
Figure 7 shows the density distribution of bubbles with different sizes at the outlet. It can be seen that the density of 1 μm bubbles increases gradually from the center of the channel to the wall. This is because the shear effect promotes the nucleation of bubbles. From the center of the channel to the wall, the shear rate increases gradually, and the density of the initial bubbles increases gradually. At the position close to the wall, due to the promoting effect of shear force on the growth of bubbles, the bubbles grow rapidly into smaller bubbles. Therefore, the density of 1.59 μm and 2.52 μm bubbles increases rapidly near the wall, consuming a large amount of CO2. At the same time, the growth of larger bubbles is limited at the wall, and the density decreases rapidly. This phenomenon is similar to the sandwich structure obtained in foaming experiments.
9
Density distribution of bubbles with different sizes at outlet position.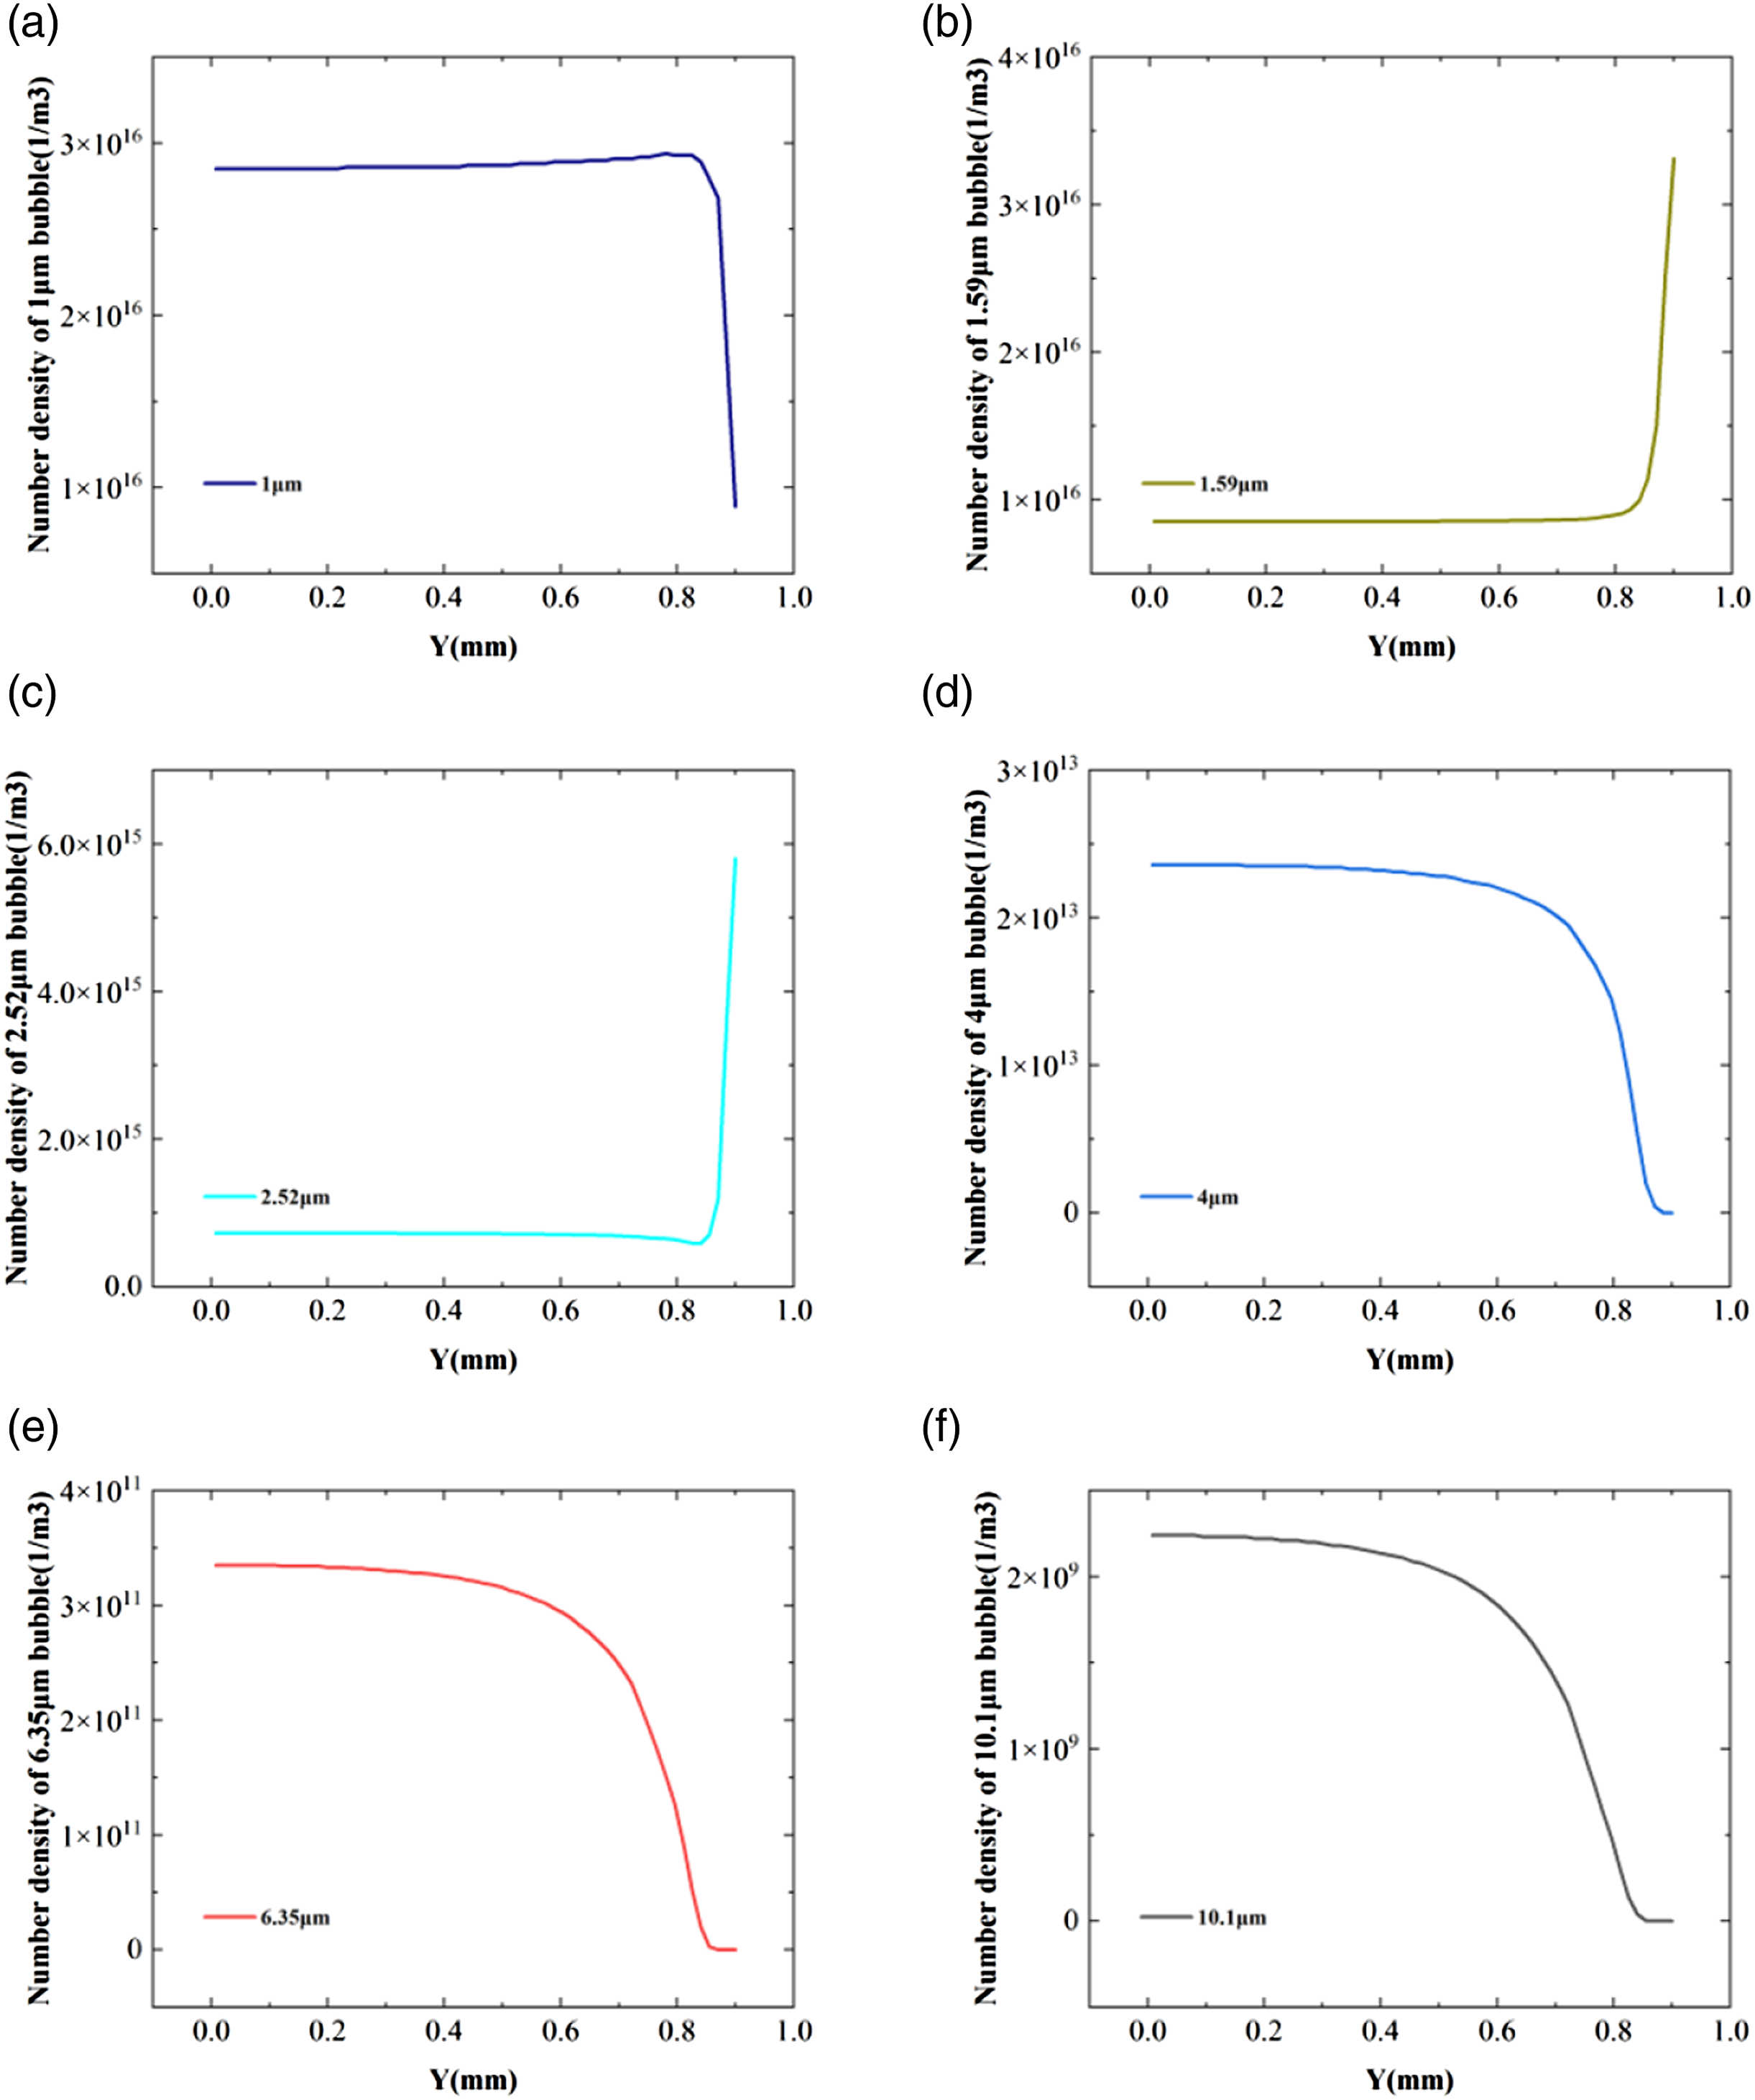
Effect of die convergence angle on bubble nucleation and growth
In order to study the influence of the convergence angle of the die on the polymer extrusion foaming, on the basis of the existing die structure, it was analyzed that under the same extrusion state, the thickness of the die and the length of the extrusion zone were ensured to be consistent. The two-stage convergence zone of the die was divided into five different convergence angles of 15°, 30°, 45°, 60° and 75°, and five different models were established.
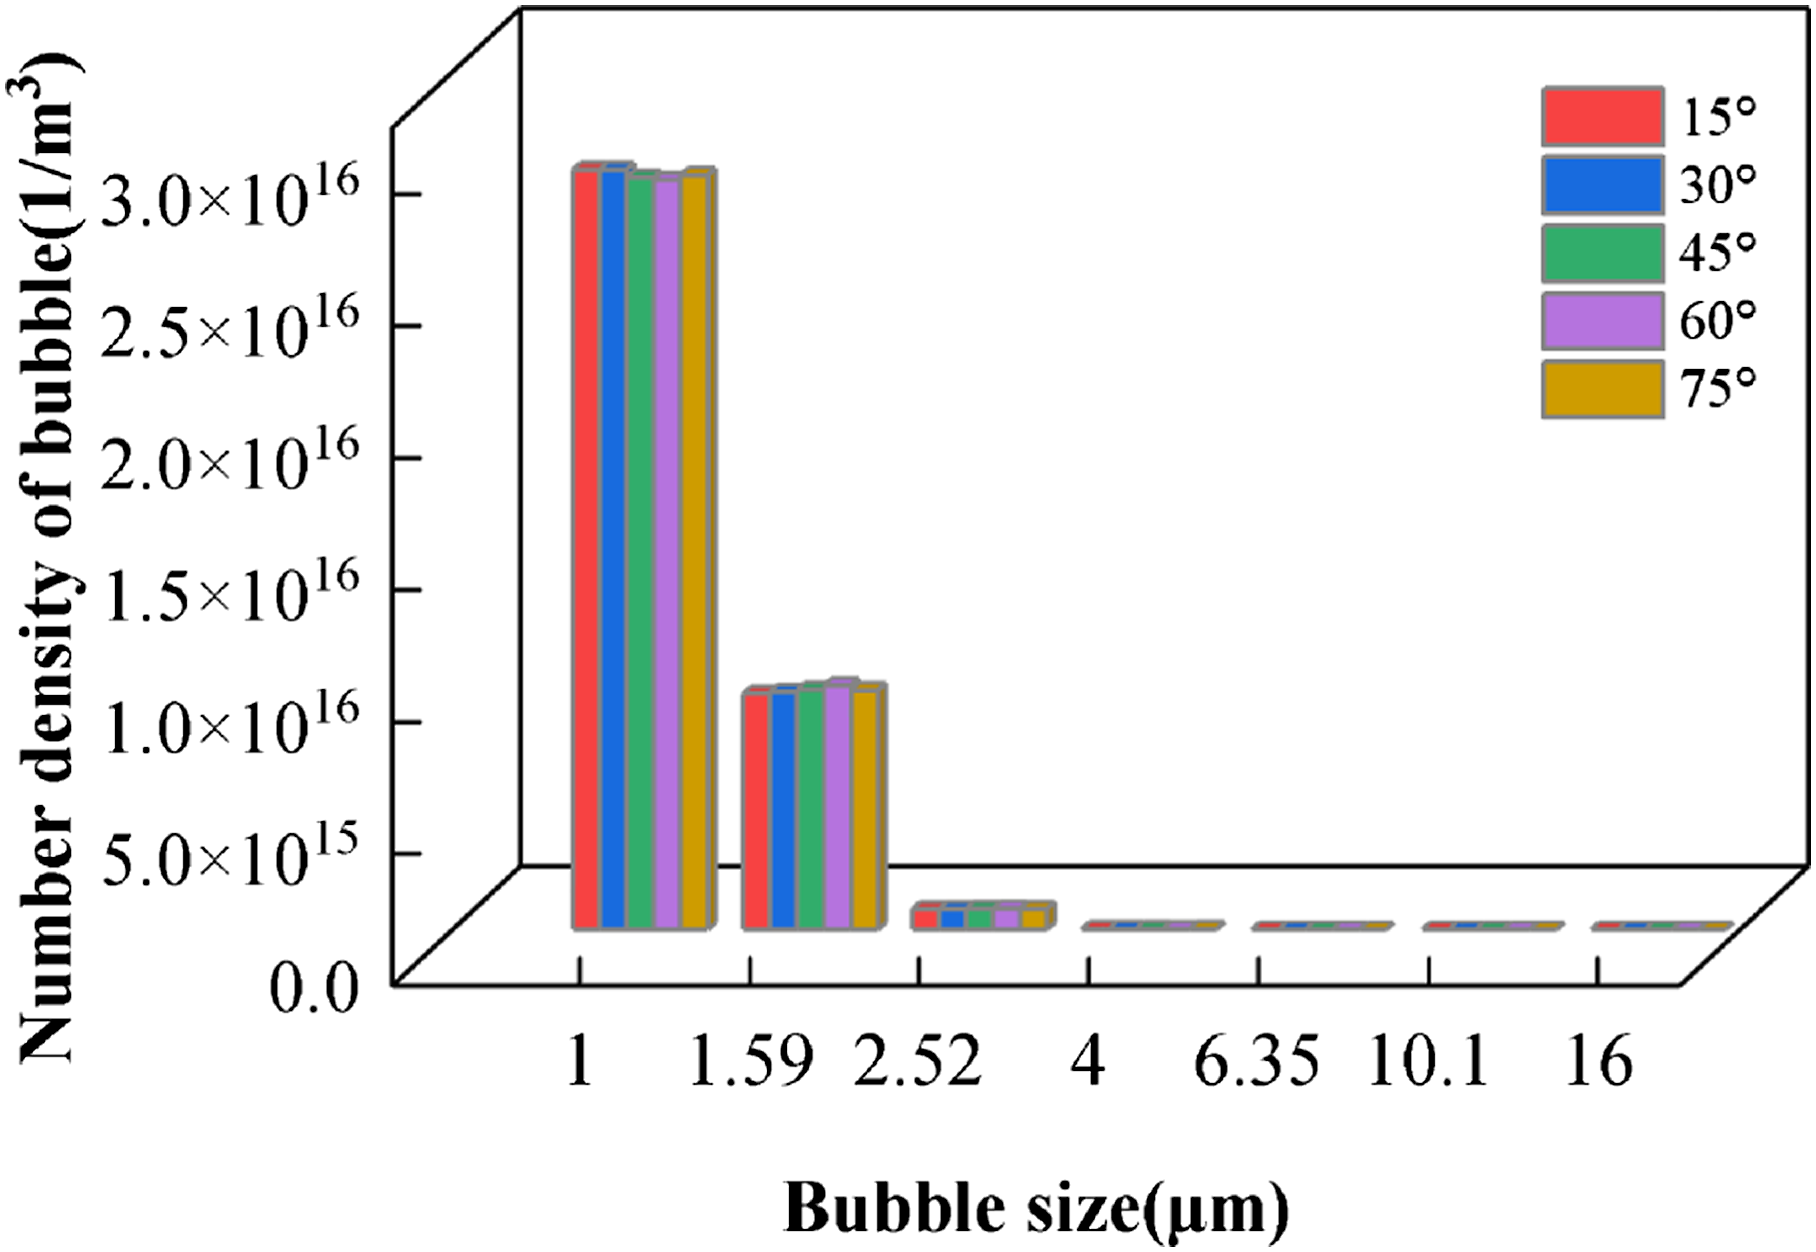
Figure 8 shows that the influence of the die convergence angle on the pressure drop in the die channel is mainly reflected in the convergence region. With the increase of the convergence angle, the pressure at the inlet of the channel increases gradually due to the large viscosity of the homogeneous polymer solution. However, due to the shear thinning characteristics of polymer fluid, the larger convergence angle leads to the increase of shear effect. In the model with convergence angle of 15° in the convergence region, due to the smaller shear effect of the convergence angle, the viscosity of the polymer is larger, resulting in a larger pressure in the convergence region. The shear thinning phenomenon of the other four models is obvious, so the pressure drop rate in the convergence region is faster, and the pressure in the region is lower than that in the 15° model. However, in the forming region, the change of die convergence angle has no effect on the pressure. Since supercritical CO2 reaches saturation in the forming region, in different models, supercritical CO2 reaches saturation at the same position. Bubbles start nucleation and growth at the same position. Figure 9 shows that different convergence angles have little effect on the bubble density distribution at the outlet of the die. This result is consistent with the research results of X.F.Peng.
11
Pressure drop of different die convergence angles. Bubble density of different convergence angles.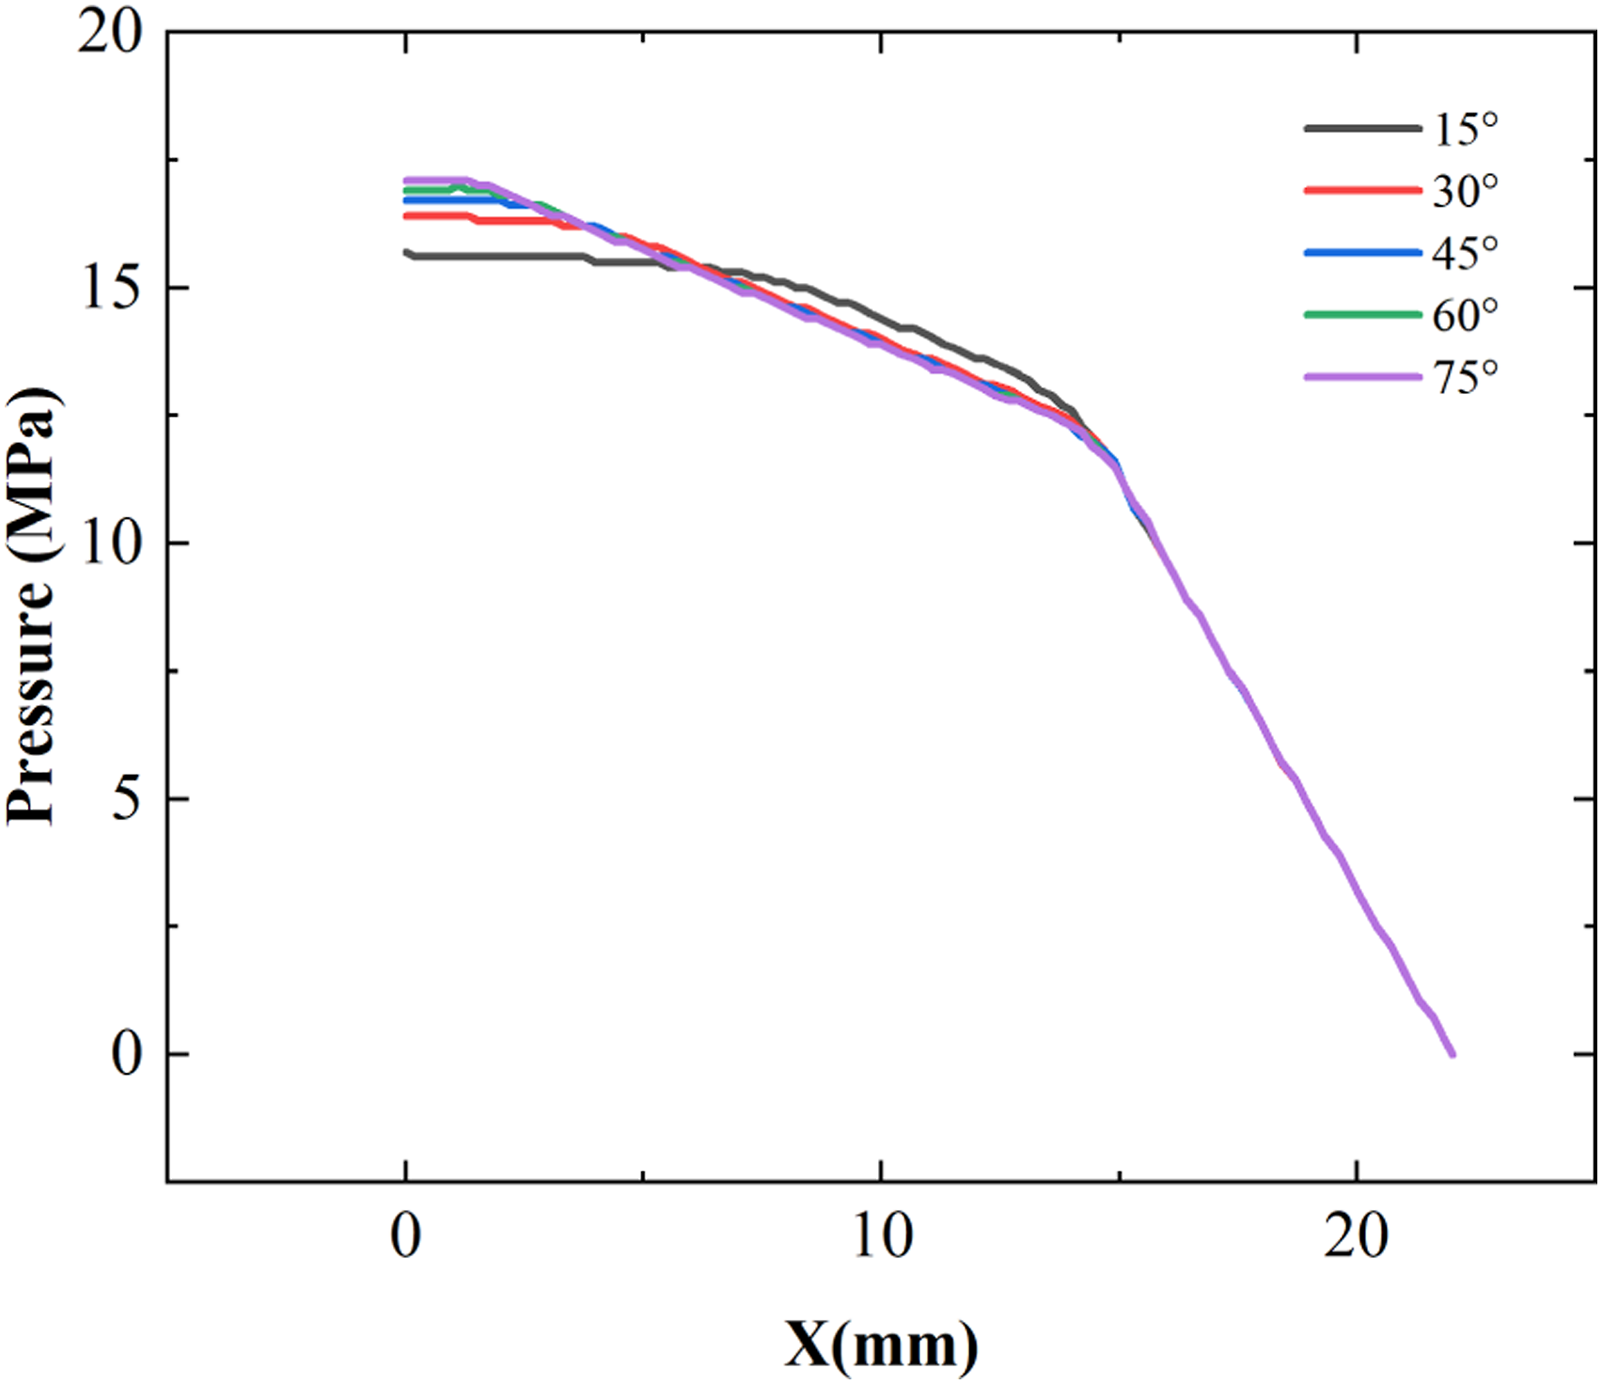
However, through further research, it is found that the die convergence angle has an effect on the distribution of bubbles with different sizes at the outlet. To analyze this effect, the distributions of bubbles of each size under different convergence angles are listed separately in Figure 10. Figure 10 shows that as the convergence angle increases from 15° to 60°, the density of smaller bubbles shows an increasing trend. However, when the convergence angle increases to 75°, the change trend is opposite. The distribution of small bubbles decreases and the distribution of large bubbles increases. In order to see this effect more intuitively, the density distribution of bubbles with different sizes is calculated by standard variance to quantify this effect. Figure 11 shows that in the 60° convergence angle model, the standard deviation of the density distribution of bubbles with different sizes is the smallest, indicating that the density distribution of bubbles with different sizes is closer. The bubble density of different sizes with different mouth mode convergence angle. The standard deviation of the effect of convergence angle on bubble density.
The influence of 75° convergence angle on bubble growth shows an opposite trend. This situation is due to the fact that in this study, the influence of shear rate on nucleation is considered. With the increase of convergence angle, the shear effect of convergence zone leads to the change of shear rate at the entrance of extrusion forming zone. Figure 12 shows that, compared with the models with convergence angles of 45° and 75°, in the model with convergence angle of 60°, the shear rate distribution at the entrance of the forming zone is more uniform, which is conducive to maintaining the nucleation and growth rate of bubbles in a larger range. Therefore, the corresponding 1.6 μm and 2.5 μm bubbles grow rapidly, the density increases rapidly, and a large amount of supercritical CO2 is consumed, which occupies a larger volume. At the same time, the volume of CO2 that can be used for the continuous growth of bubbles decreases, and the growth rate of larger bubbles slows down, resulting in the density of large bubbles being the smallest in the five models, showing the bubble distribution as shown in Figure 10. The more concentrated the bubble density distribution of different sizes in the microcellular foaming sheets is, the better the mechanical properties of the sheet. Therefore, the 60° convergence angle model is used for analysis in the subsequent experiments. Shear rate variation at inlet position of die forming zone with different convergent angles: 45 (a); 60 (b); 75 (c).
Effect of flow velocity on bubble nucleation and growth
According to the existing extrusion foaming experiments, it is found that extrusion speed and pressure drop rate are important factors affecting the quality of foaming sheets, but in the extrusion experiment, it is difficult to analyze the specific influence of extrusion speed and pressure drop rate on bubble growth and distribution. Therefore, on this basis, this paper simulates the bubble size and distribution under different extrusion speeds.
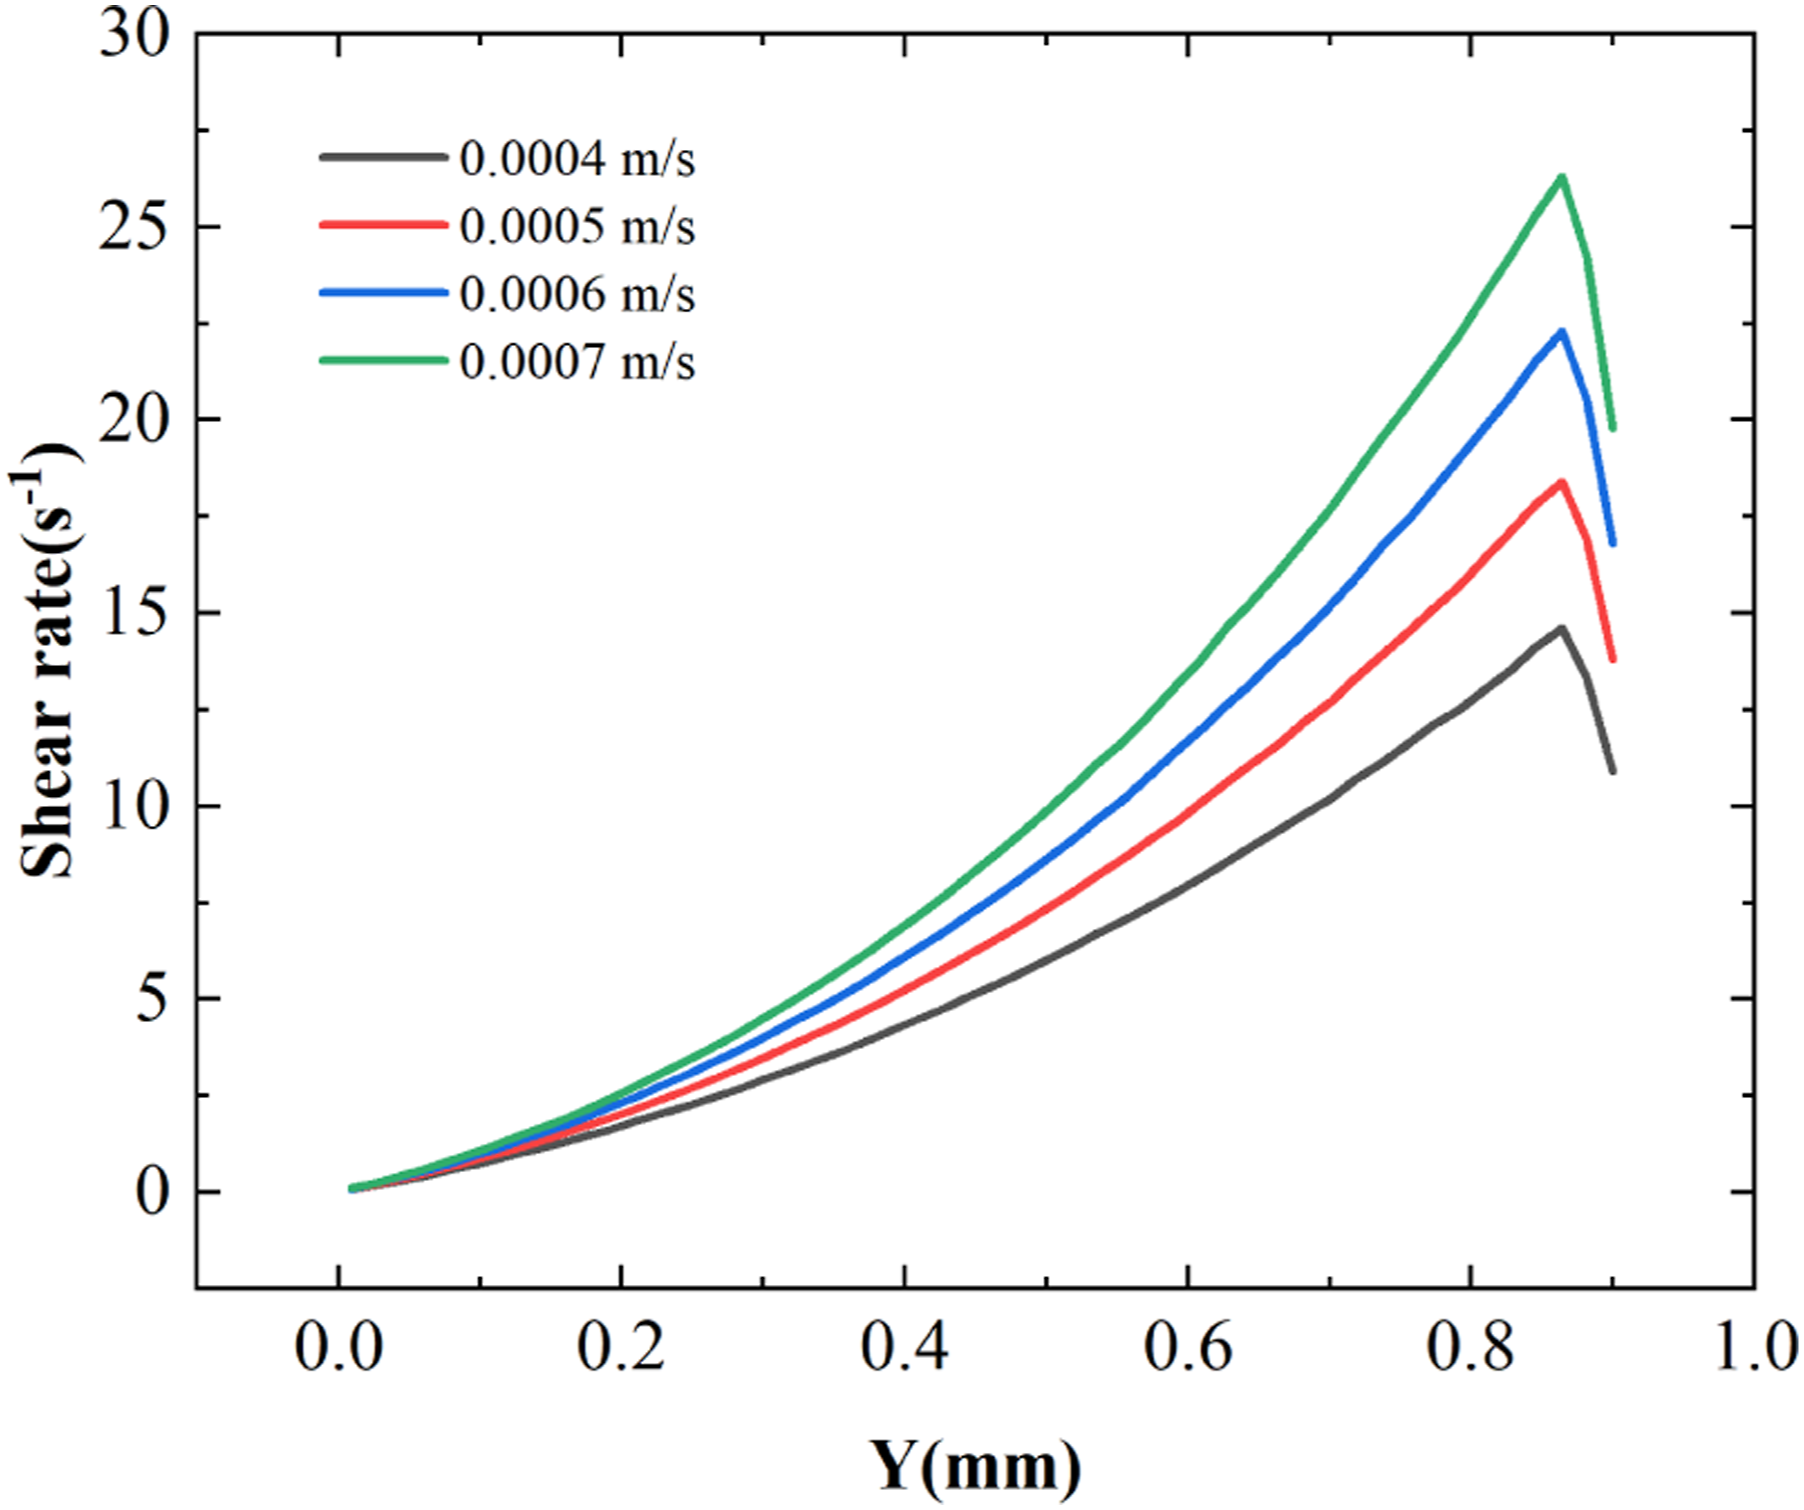
The extrusion speeds were set to 0.0004 m/s, 0.0005 m/s, 0.0006 m/s and 0.0007 m/s, respectively, to analyze the flow state and bubble distribution of polymer in the channel. As shown in Figure 13, the distribution of pressure drop and 1 μm bubble density along the extrusion direction. It can be seen that with the increase of extrusion speed, due to the large viscosity of polymer, the pressure in the convection channel is greatly affected, and the pressure in the flow channel increases gradually. Since the dissolution of supercritical CO2 conforms to Henry’ s law, it reaches saturation under the same pressure at different flow rates, so it increases with the flow rate, the position where the gas reaches saturation moves towards the outlet and the position where the initial bubble appears moves towards the outlet. The density of the initial bubble increases with the increase of extrusion speed. Figure 14 shows that the shear rate increases with the increase of flow rate in the channel, which promotes the nucleation and growth of bubbles. Pressure drop and 1 μm bubble density at different extrusion speeds. Shear rates of nucleation sites at different extrusion speeds.
Through analysis, it is found that increasing the extrusion speed of polymer can not only increase the density of bubbles, but also improve the uniformity of bubble distribution in the flow channel. As shown in Figure 15, With the increase of extrusion speed, the area affected by the shear effect at the wall is smaller, and the area where bubbles are evenly distributed increases. The reason for this phenomenon is that with the increase of shear rate at the nucleation site, the nucleation density of bubbles increases, and the CO2 volume consumed by bubble growth per unit volume increases, which inhibits the difference of bubble growth rate caused by wall shear effect, and makes the growth rate of bubbles close in a larger area. 1 μm bubble density distribution (a) and 10 μm bubble density distribution (b) at different extrusion speeds.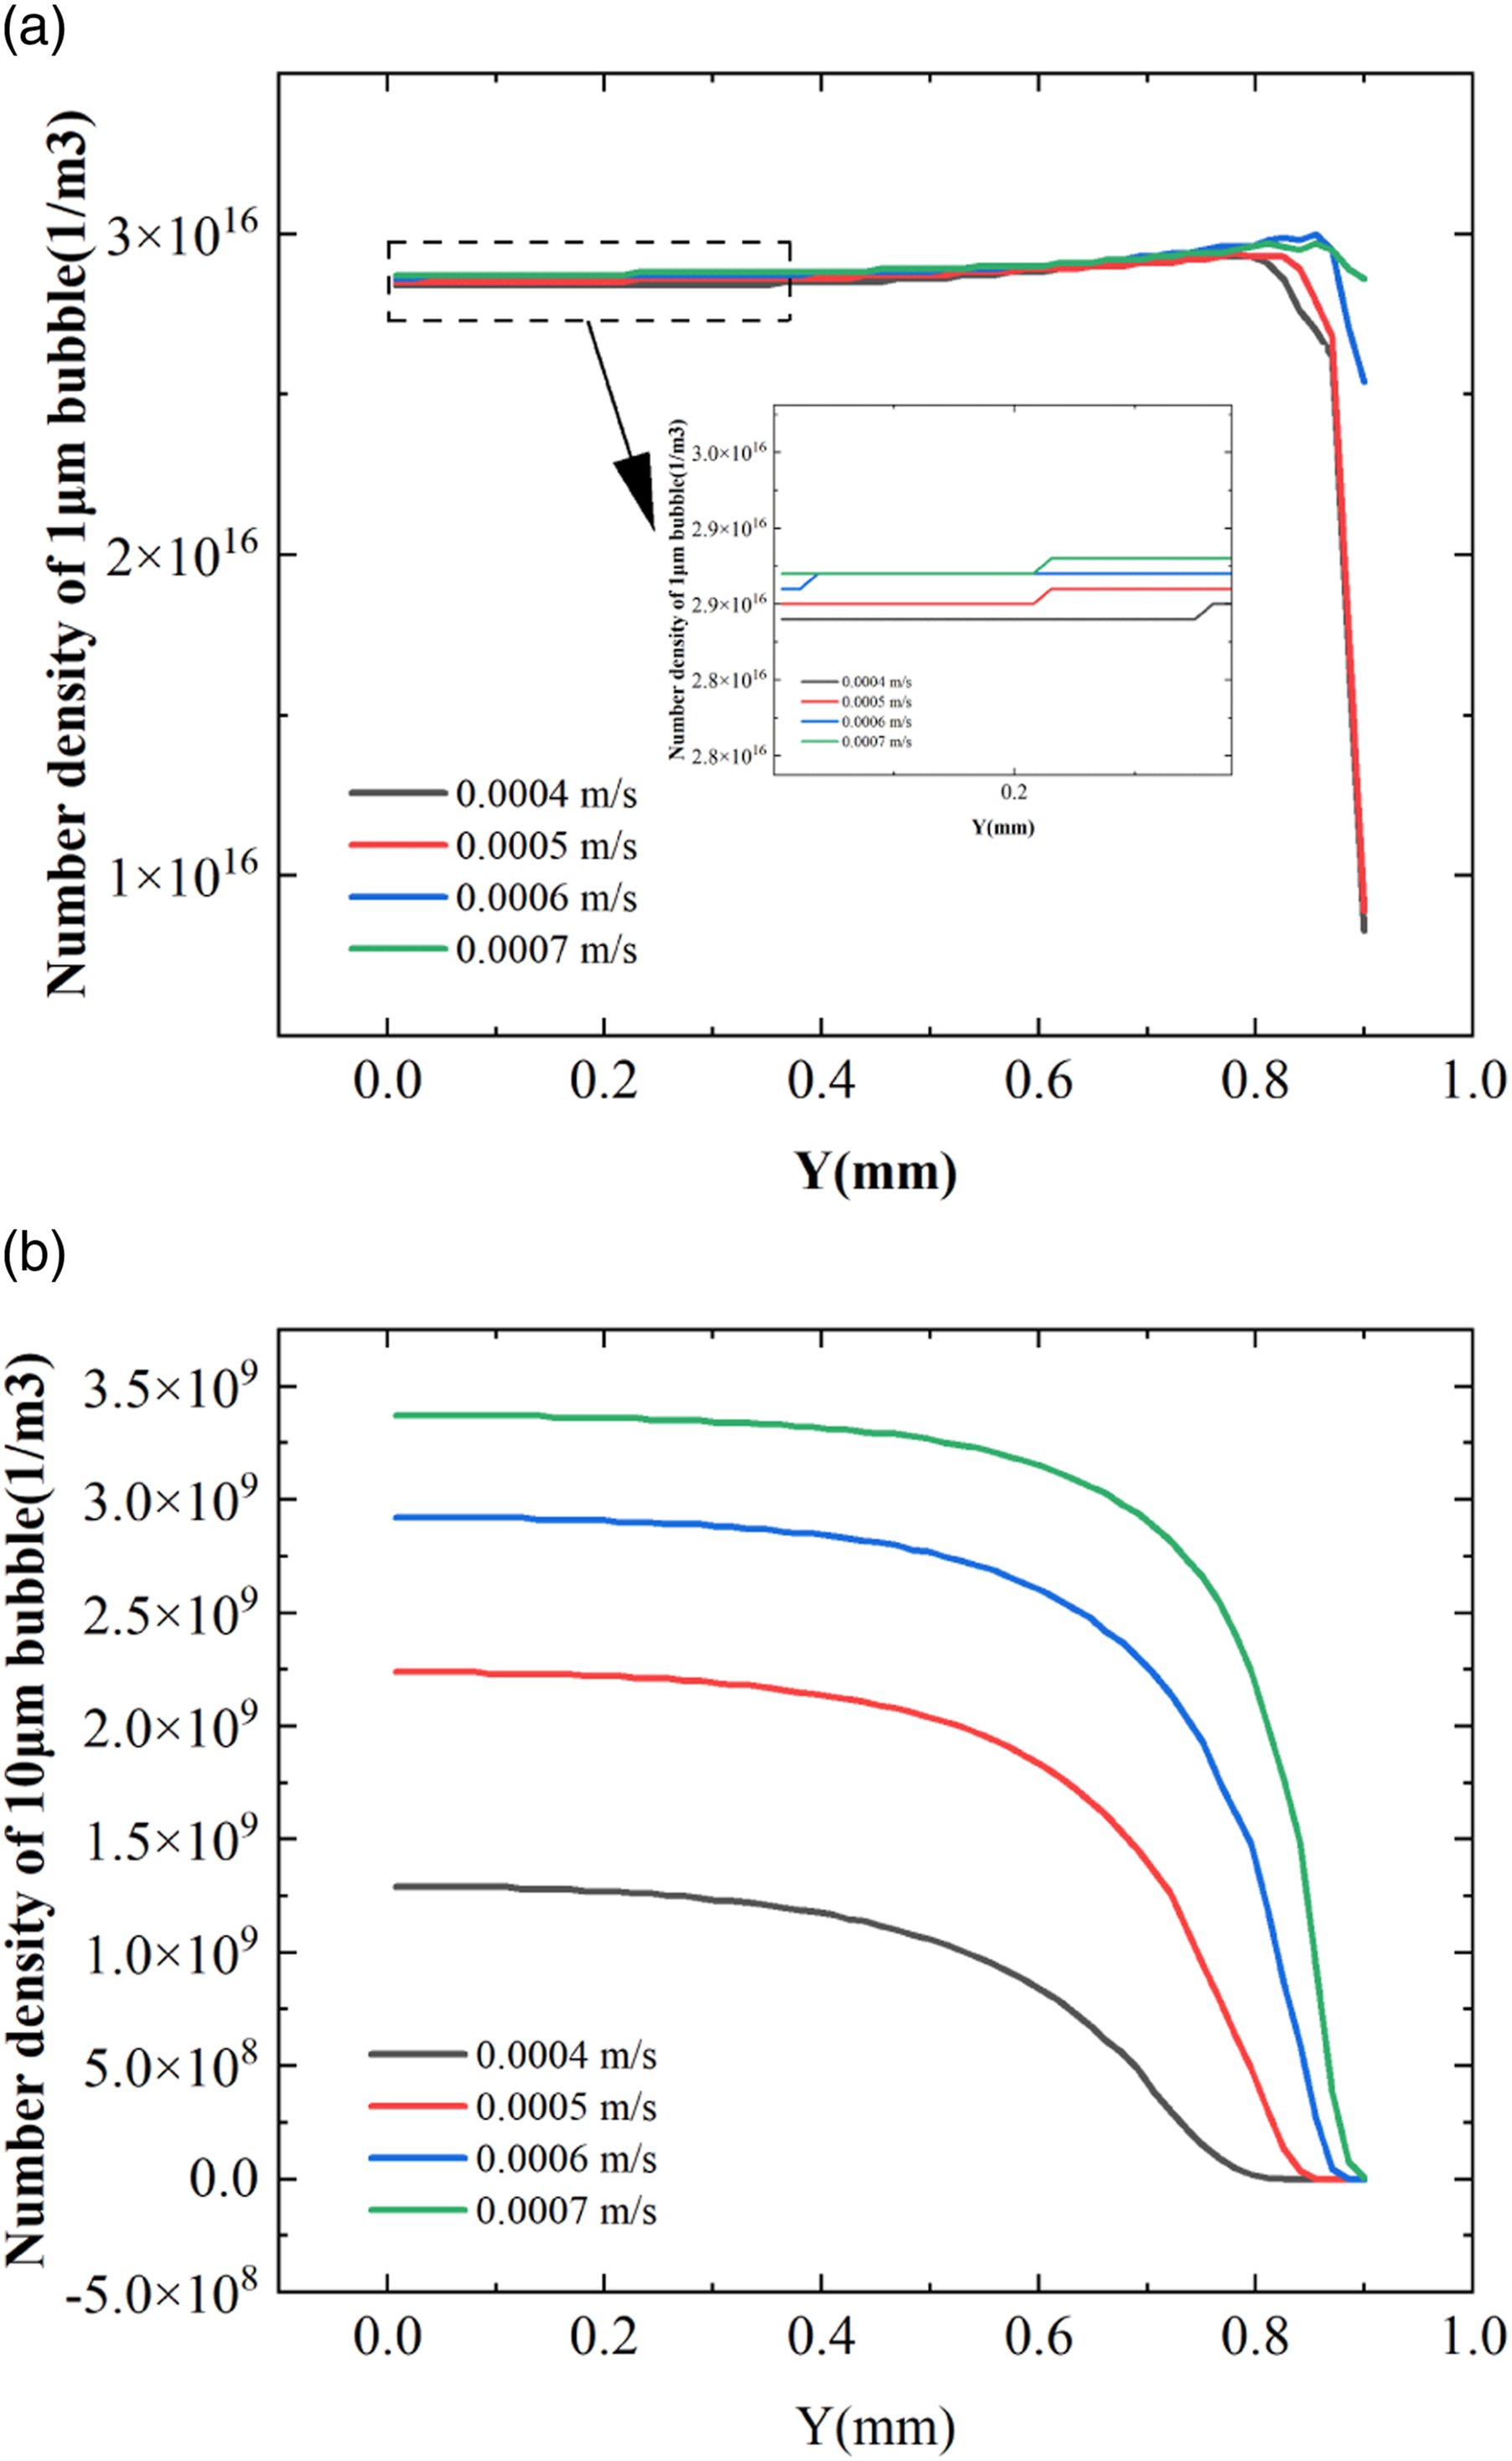
This effect is beneficial for producing microcellular foam sheets with better mechanical properties. In Figure 16, the effective distribution area of bubbles is calculated. The effective distribution area of bubbles is defined in this paper. For each size of bubbles, the density at the center of the flow channel is taken to calculate the distribution area of density distribution error within ± 5%. The obtained area is the effective distribution area of bubbles. Figure 16 shows that with the increase of extrusion speed, the effective distribution area of bubbles in each size at the outlet position increases. Effective distribution area of bubble density at different extrusion speeds.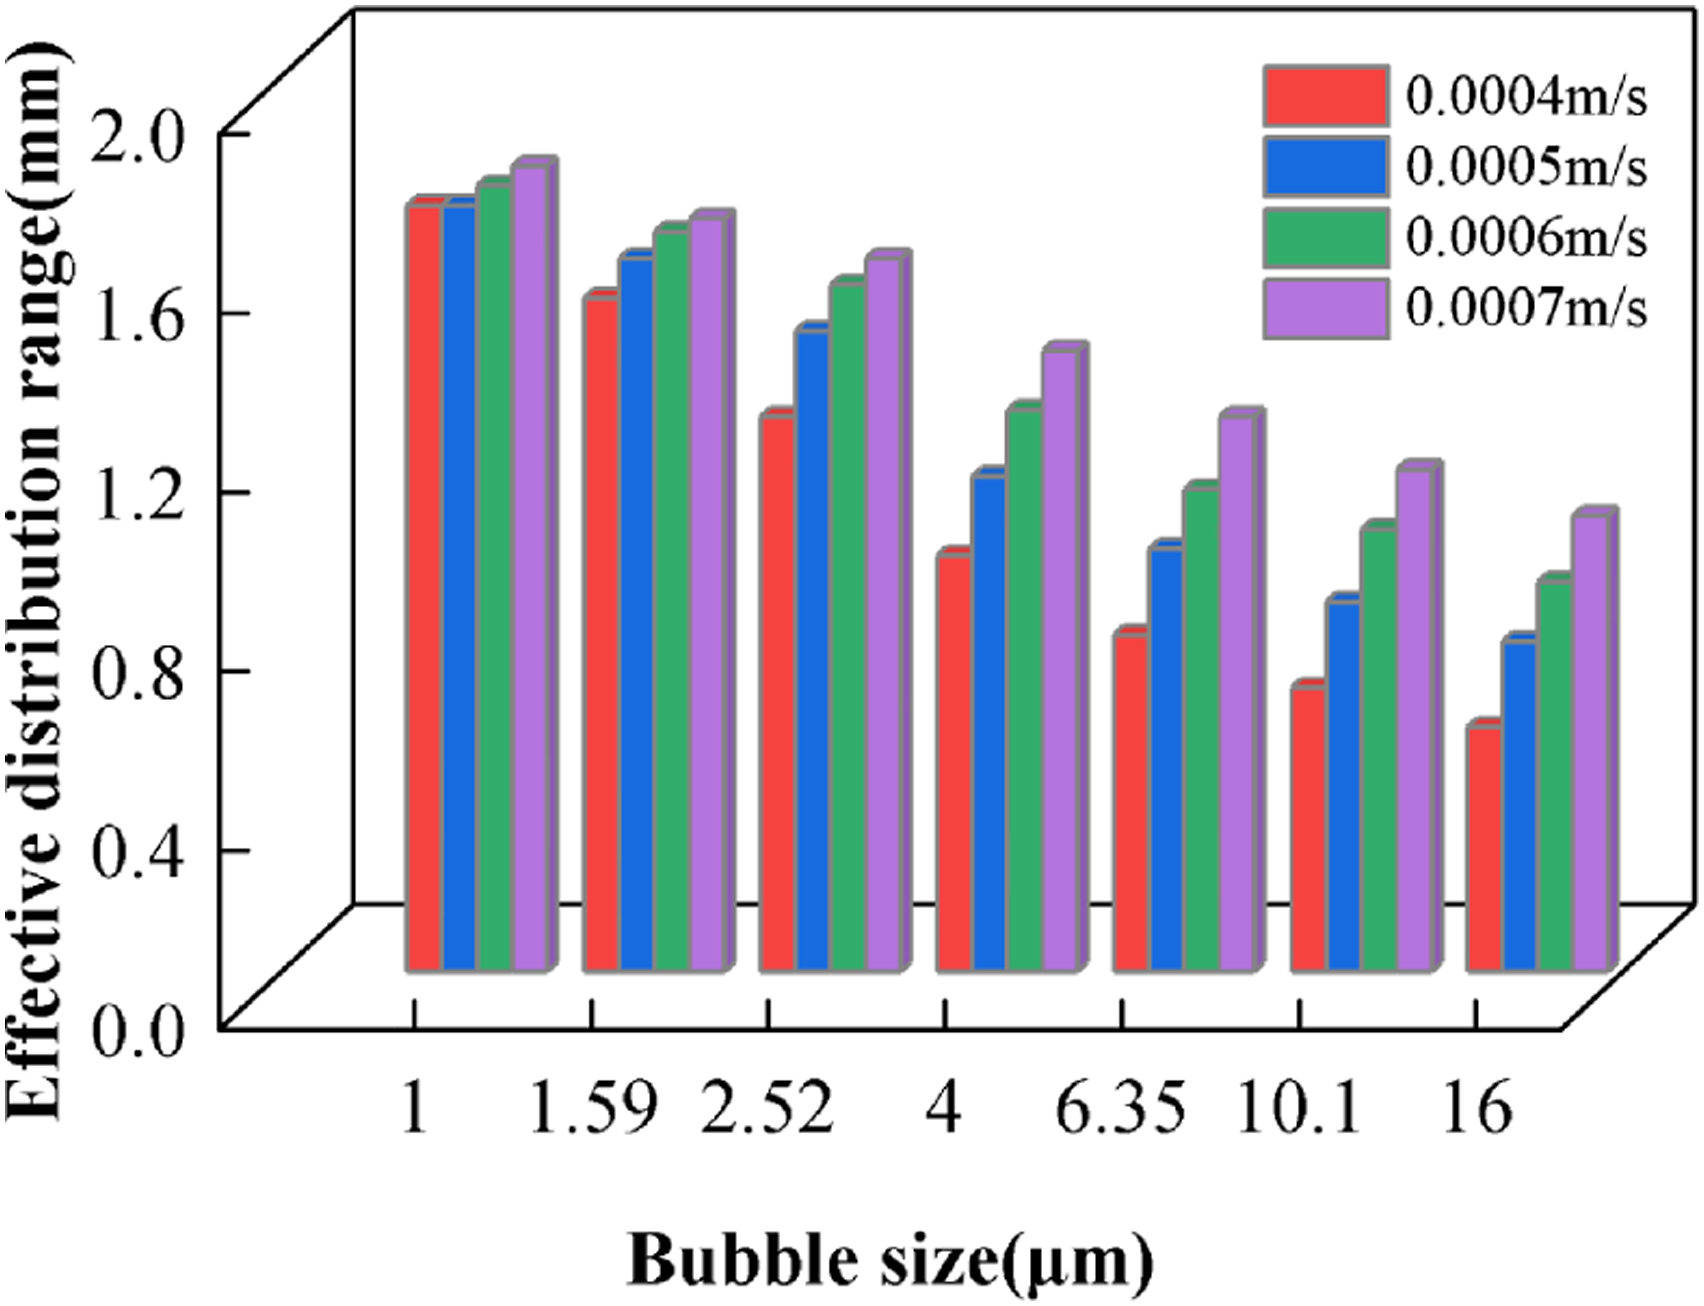
Increasing the extrusion speed of polymer is also not entirely beneficial to the formation of microcellular foam sheets. With the increase of extrusion speed, although the initial bubble density increases, the nucleation and growth of bubbles become easier. The density of smaller bubbles increases, while the density of larger bubbles increases. As shown in Figure 15(b), with the increase of extrusion speed, the density of 10 μm bubbles at the outlet position increases significantly, and bubbles are prone to break up and coalescence in the subsequent extrusion expansion process, which is not conducive to the manufacture of foam sheets with uniform distribution of bubbles. Large extrusion speed will cause excessive pressure on the inner surface of the die, which increases the technical difficulty and manufacturing cost of manufacturing.
Effect of initial gas concentration on bubble nucleation and growth
The final bubble formation process is composed of gas expansion caused by pressure change and supercritical CO2 through gas-liquid mass transfer process. Therefore, the injection amount of supercritical CO2 determines the mass transfer rate of CO2 and the bubble volume in the microcellular foam board. As the volume fraction of supercritical CO2 is 0.02, it is close to the saturation state of CO2 in the extruder. Continue to increase the volume fraction will lead to uneven dissolution of CO2, resulting in bubble breakage in the microcellular foam sheets. So the initial volume fraction of CO2 were set to 0.01,0.015,0.02, the distribution of bubbles in the die was analyzed.
Figure 17 shows that compared with changing other conditions, the initial concentration of CO2 has the greatest impact on bubble nucleation density. When the CO2 concentration decreased from 0.02 to 0.01, the density of smaller bubbles decreased significantly, but the density of larger bubbles increased. Bubble density at different initial CO2 concentrations.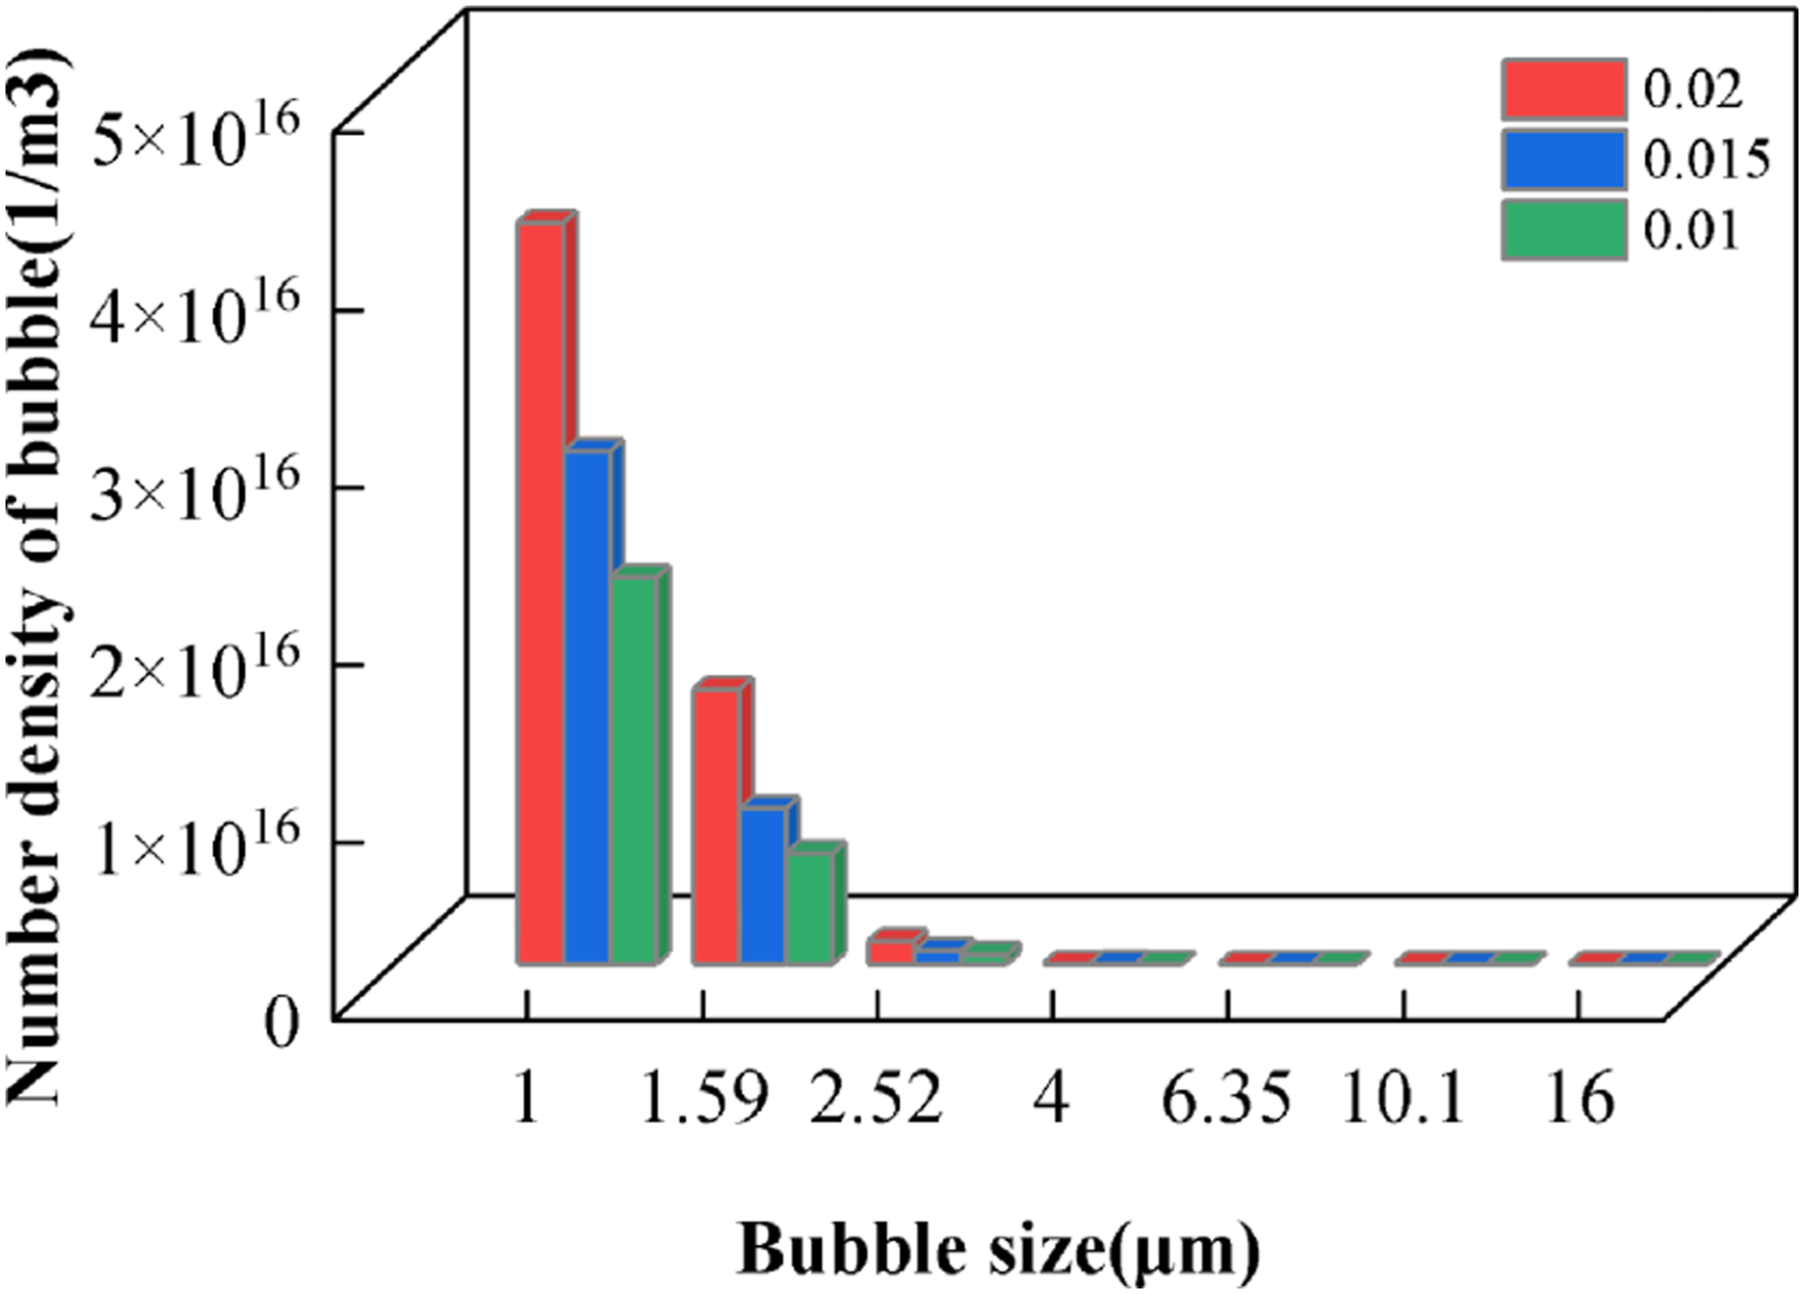
In order to further analyze this situation, Figure 18(b) shows the distribution of 10 μm bubbles at the outlet of the die. When the initial concentration of CO2 was 0.015, the maximum density of 10 μm bubbles in the die increased, but it was concentrated in the center of the flow channel, and the distribution was uneven throughout the die. Due to the shear effect at the wall, the density of large-scale bubbles near the wall decreased rapidly. 1 μm bubble density distribution (a) and 10 μm bubble density distribution (b) at different initial CO2 concentrations.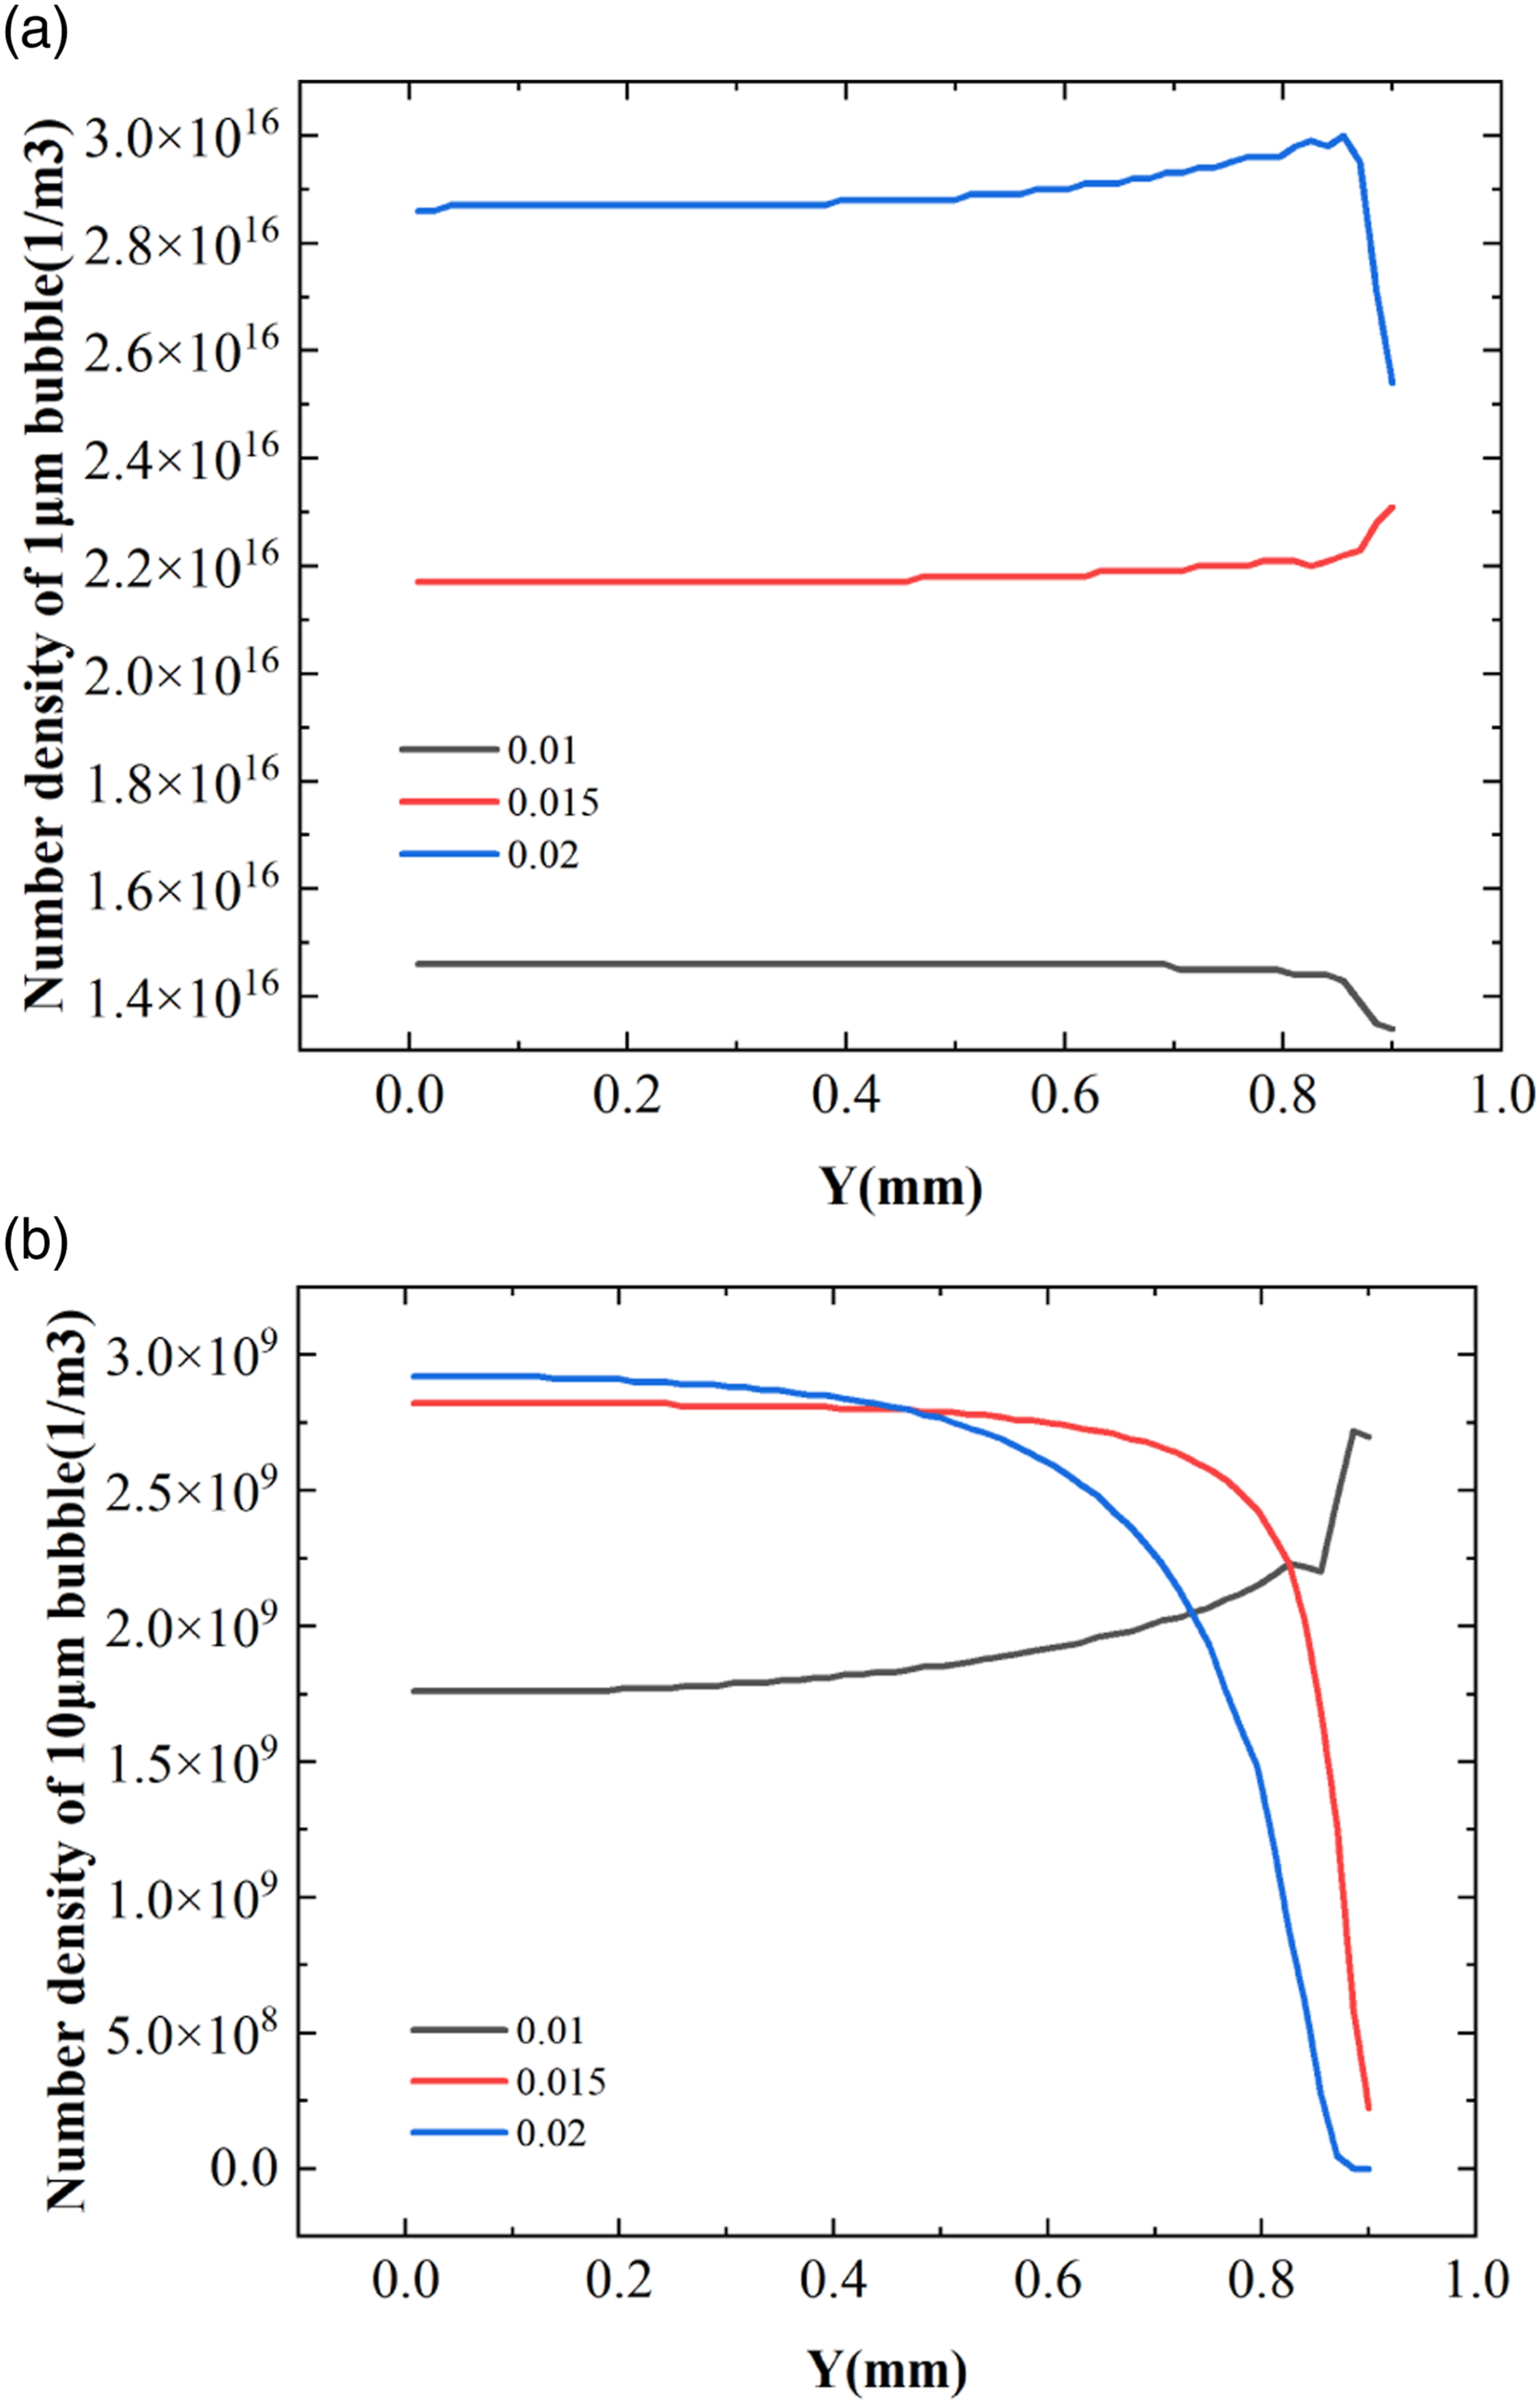
When the initial concentration of CO2 is further reduced to 0.01, the density of bubbles with 10 μm size increases at the wall, because CO2 in the solution has been unable to provide a large number of bubbles. When the CO2 concentration is high, the CO2 concentration is the main factor to promote the bubble growth, but when there is not enough CO2, the shear effect is the main factor to promote the bubble growth, which is similar to the conclusion in Literature. 14 The shear effect can promote the nucleation and growth of bubbles. The shear rate at the wall is greater than that at the center, and the growth rate of bubbles close to the wall is larger. Therefore, the density of 10 μm bubbles from the center of the channel to the wall increases gradually.
The effect of initial gas concentration on bubble nucleation and growth is not only reflected in the bubble density, but also in the effective distribution of bubbles, especially in Figure 18(b). By calculating the effective distribution range of bubbles, Figure 19 shows that when the initial concentration decreases to 0.015, the effective distribution range of bubbles in each size increases. Therefore, under the premise of reaching the final density of foaming sheets, the effective distribution range of bubbles at the outlet can be improved by appropriately reducing the initial concentration of CO2 gas. Effective distribution area of bubbles density under different initial CO2 concentrations.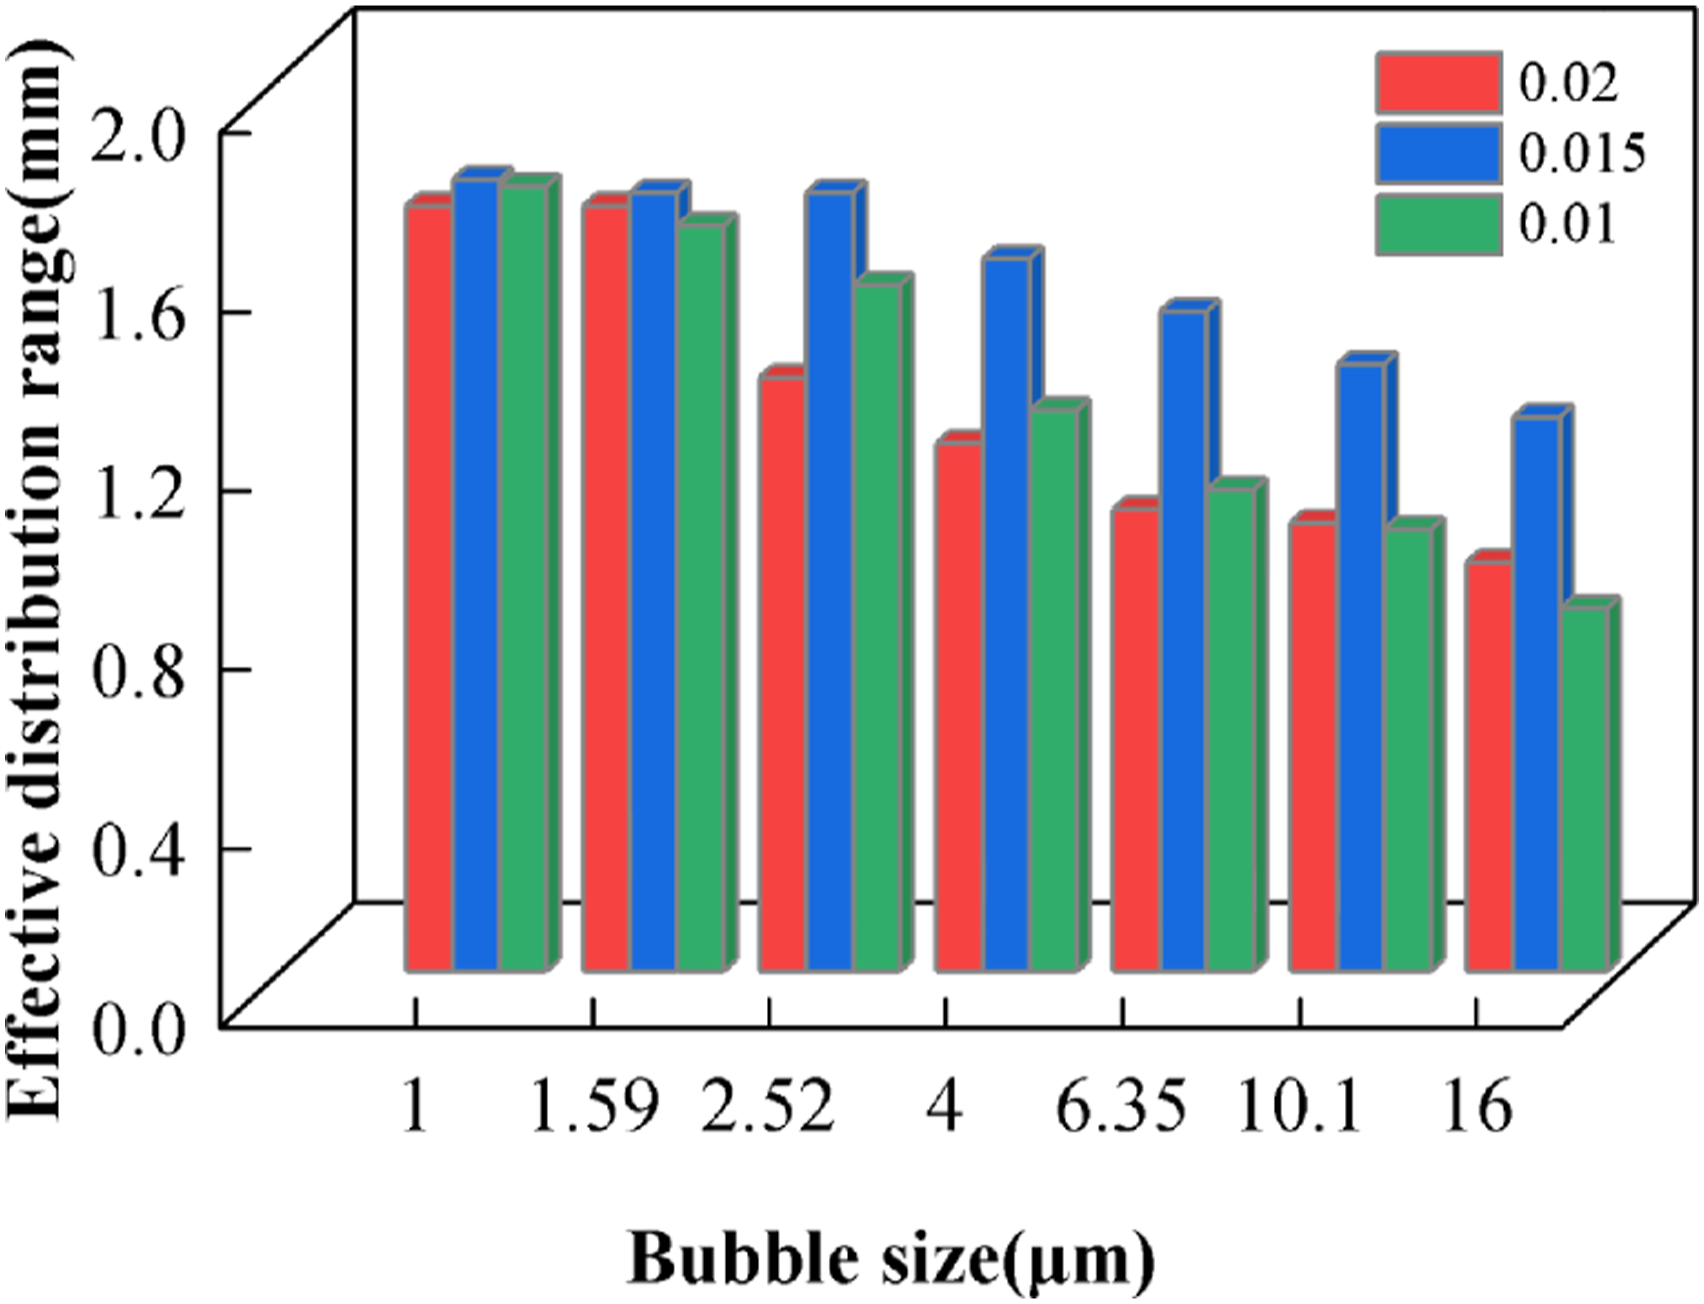
Conclusion
In this paper, the extrusion flow of viscoelastic non-Newtonian fluid was numerically simulated by Fluent software, Coupling micro bubble growth kinetics model with PBM model. The effects of different convergence angles, extrusion speeds and initial CO2 concentrations on the bubble size, bubble density distribution and bubble density at the outlet were analyzed.
The convergence angle has a great influence on the average size of bubbles. By comparing the bubble distribution under five different convergence angles of 15°, 30°, 45°, 60° and 75°. Under the condition of 60° die convergence angle, the standard deviation of bubble density distribution is 1.0656 × 10¹⁶, which is the smallest among the five models, indicating that the bubble size distribution in the whole region is more uniform.
The extrusion speed has a great influence on the effective distribution of bubbles at the outlet position. With the increase of extrusion speed, the range of uniform distribution of bubble density at the outlet position is wider. In this paper, the calculation method of effective distribution area of bubbles is defined. Under the flow rate of 0.0007 m/s, the effective distribution area of 1 μm bubbles reaches 1.8 mm, which is the whole outlet position. Increasing the extrusion speed can improve the uniformity of bubble density distribution.
The initial concentration of supercritical CO2 has great influence on bubble density. When the CO2 concentration is high, the influence of gas concentration on bubble growth is greater than that of shear effect, and when the CO2 concentration is lower than 0.01, the influence of shear effect on bubble growth is greater than that of gas concentration. Under the condition of not exceeding the saturated concentration of CO2, increasing the concentration of CO2 can improve the bubble density at the die. Under the premise of meeting the bubble density requirement of the foaming sheets, appropriately reducing the initial concentration of CO2 can improve the effective distribution area of bubble density of the foaming sheets.
Footnotes
Declaration of conflicting interests
The author(s) declared no potential conflicts of interest with respect to the research, authorship, and/or publication of this article.
Funding
The author(s) disclosed receipt of the following financial support for the research, authorship, and/or publication of this article: This work was supported by Jiangsu Blue Engineering Talent Project and National Natural Science Foundation of China Youth Science Foundation (No. 51906091).