
Abstract
The aim of this study is to investigate the effects of talc/intumescent flame retardant additions on thermal, burning, and mechanical characteristics of the rigid polyurethane foams. At this purpose, the talc which mainly includes SiO2, MgO and CaO and an intumescent flame retardant which is composed of ammonium polyphosphate and pentaerythritol was incorporated into the foam at various weight loadings. The cone calorimeter tests, UL94 tests, thermogravimetric analyses and thermal conductivity measurements were done for investigation of the thermal and burning characteristics. In general, additions of the talc and the talc/the intumescent flame retardant enhanced the thermal and the fire resistance of the foams. However, the best fire resistance was achieved with a composition which include 10 wt % the intumescent flame retardant and 5 wt % talc. The addition of this composition resulted in 32% reduction in the total heat release value.
Introduction
Rigid polyurethane foams (PUR) are used in a wide range of applications like thermal insulating, automotive industry, and construction materials due to low thermal conductivity, low density and good shock absorption properties.1–6 However, the foams have low thermal stability and are highly flammable.7–10 Thermal instability and high flammability properties of the foams are the major parameters which border the usage of these materials.11,12 Therefore, many studies have been performed to improve thermal and combustion behaviors of the foams.13–18 Since the raw materials of the foams are expensive, additions of different cheap fillers and decreasing the raw materials can reduce the cost of the production. Meanwhile, it is expected to improve the properties of the foams with the additives.19–24 One of the effective methods to enhance the thermal stability and fire resistance of rigid polyurethane foams is addition of flame retardants like ammonium polyphosphate (APP), expandable graphite and melamine compounds.25–28 The flame retardants can be classified as reactive and nonreactive flame retardants.29,30 The reactive flame retardants take part in the foaming reaction and join chemically into the foam, the nonreactive flame retardants do not participate in the foaming reaction and incorporated into the foam physically. 30 Chen et al. 31 investigated the effects of surface-modified APP which is phosphorus containing flame retardant on the fire behaviors of PUR. They determined the fire behaviors of the foam by cone calorimeter tests and reported that APP addition enhanced the fire behaviors of the material in which 51.2% reduction in the peak heat release rate was observed. The positive effects of APP on the flame retardancy were attributed to the phosphazene group which causes flame inhibition and barrier effects of the intumescent char. Shi et al. 32 studied the effects of expandable graphite which is halogen-free flame retardant on the properties of the high density PUR. The experimental results showed that high volume expanded graphite was observed on the material surface which inhibits the flame by hindering the combustible gasses and oxygen to reach to flame area. They also reported that expandable graphite addition increased the thermal degradation resistance and slightly decreased the mechanical properties of the foam. Chen et al. 33 studied the effects of trichloroethyl phosphate as flame retardant on the combustion and pyrolysis kinetics of polyurethane elastomers. It was found that peak heat release rate and total heat release decreased with the addition of phosphate. Thermogravimetric analysis showed that the initial decomposition temperature decreased with the addition of phosphate due to the lower thermal stability. Liu et al. 34 performed thermogravimetric analysis to investigate the effects of different flame retardant combinations such as ammonium polyphosphate, aluminum hydroxide and nano-montmorillonite on thermal stability and decomposition of thermoplastic polyurethane. The initial decomposition temperatures decreased as a result of flame retardant combinations due to the early decomposition of aluminum trihydroxide and ammonium polyphosphate. Besides, char residue increased about 26.9–30 wt %.
Intumescent flame retardants (IFRs) have important role in enhancing fire behaviors of rigid polyurethane foams. 35 IFRs are halogen-free flame retardants and have lower toxicity and longer service life, they can reduce smoke release. 36 IFRs which are commonly used in polymers are the mixtures of inorganic acid source (e.g., ammonium polyphosphate), spumific (e.g., melamine) and carbonific (e.g., pentaerythritol). 12 IFRs take role in the condensed phase and form a cellular charred layer on the surface, the char layer protects the underlying material from heat, pyrolysis and flame.30,36,37 Yurtseven 38 investigated the effects of APP and melamine additions on the properties of PUR. He synthesized intumescent flame retardant with APP and melamine in 3/1, 2/1 and 1/1 ratios and the IFR (10 wt %) was added into the foams. It was found that thermal conductivity and compression strength decreased with the addition of IFR due to the deterioration of the polymeric and cellular structure. As a result of UL94 tests, it was pointed out that APP/melamine enhanced the fire resistance of the foams. The best resistance was observed with APP/melamine ratio of 3/1. Wu et al. 39 synthesized P-N containing IFR which was composed of poly ethanediamine spirocyclic pentaerythritol bisphosphonate (PEPS). They have reported that the generated char layer significantly protected the substrate material from flame, and the peak heat release rate and the total heat release decreased about 30% and 28%, respectively.
Addition of fillers into the foam is an important way to improve the fire resistance of the foam. It also reduces the cost of the production. 40 Inorganic fillers like talc, clay, dolomite etc. are widely used in polymers to improve properties of the material and reduce the cost of production.41–44 Talc is an inorganic mineral which is widely used in industry.45,46 Talc is phyllosilicate mineral which has 2:1 layer with Mg3(Si4O10)OH2. It has good thermal stability and resistance to acids. 47 Talc was used both alone and in combination with different fillers into the different polymer composites.42,48–52 Wang et al. 53 studied the effects of talc additions (between 5% to 60%) on the fire behaviors of low-density polyethylene. They used cone calorimeter, UL94 vertical burning test and downward flame spread tests to determine the burning behaviors of the material. The experiments showed that the mass loss rate and the heat release rate decreased with the increase of talc content in the polyethylene. It was reported that the talc covered the surface of the samples and blocked the heat and mass transfer. You et al. 54 investigated the effects of talc and various fillers on the tribological properties of polyamide 6. They reported that incorporation of talc into the polyamide enhanced the tribological properties such as coefficient of friction and wear rate.
Within the knowledge of the authors, there is not any study regarding the effects of talc/intumescent flame retardant additions into the rigid polyurethane foams in the literature. The aim of this paper is to critically analyze the effects of talc/IFR additions on thermal, burning and mechanical characteristics of the rigid polyurethane foams.
Materials and methods
Materials
The raw materials of the rigid polyurethane (PUR) which are the polyol with the trade name of Evopour 1122-28 and the isocyanate with the trade name of PMDI 92140 polymeric diphenylmethane diisocyanate were supplied by Elastogran BASF Group in industrial grade. The densities of the polyol and the isocyanate were 1130 and 1230 kg/m3, respectively, at 25°C, and the viscosities of the polyol and the isocyanate are 240 and 210 mPas, respectively, at 25°C. NCO content of the isocyanate is 31.2%. 55 Talc (TLC) was kindly provided by OMYA Mining Ltd. The chemical composition of the talc was determined with XRF spectrometry, and it was found that it includes mainly 63.45% SiO2, 34.11% MgO and 1.46% CaO. Ammonium polyphosphate (APP) (Exolit AP 423, d50≈ 8 µm) and pentaerythritol (PER, d50≤ 75 µm) that are the components of intumescent flame retardant system were kindly supplied by Clariant-Turkey (Turkey) and MKS Marmara Chemistry Company (Turkey), respectively.
Sample preparation
TLC, APP and PER which are in powder form were put in the oven and dried at 100°C for 24 h. The mixing ratio of the polyol and the isocyanate was 1/1.18. Firstly, TLC, IFR or TLC/IFR was added into the polyol, and the amounts of the polyol and the isocyanate were reduced as the same amount of the additives to keep the density constant. APP/PER mass ratio was adjusted as 2:1 to form intumescent flame retardant (IFR).
Formulations of the rigid polyurethane composites.
Testing equipment and methods
The thermal properties of PUR were determined by Perkin-Elmer Diamond thermogravimetric analyzer. The measurements were performed between 40 and 800°C at a rate of 20°C/min under nitrogen for samples of approximately 10 mg with ceramic pans. The real time weight loss and derivative weight loss were measured and recorded with the software. The mean of three replicates measurements was given for all thermogravimetric analyses.
Kyoto QTM-500 device was used to measure thermal conductivity coefficients of the samples according to ASTM C1113. 56 The mean of five replicates was given for each sample. The thermal conductivities were measured within an accuracy of 3%. The thermal conductivity coefficients of the samples were measured for 55 days periodically, twice in a week.
The cell structures of PUR and the composites were examined at different areas of the surfaces with an optical Nikon SMZ 1500 Stereo microscope system. Then, they were recorded on a personal computer. The mean diameters of the cells were calculated according to ASTM D3576-04. 57 In addition, the dispersion of the additives and morphology of the fracture surfaces were investigated by a scanning electron microscopy (SEM) (Zeiss Gemini, Supra 40VP). The samples were coated with gold before the SEM analyses which were performed at the voltage of 10 kV.
The samples were cut into 150 ± 5 mm long by 50 ± 1 mm wide and 10 mm thickness for UL94H (horizontal) tests. 58 They were marked with three-gauge marks where the distances were 25 mm, 60 mm and 125 mm from the one end of the sample. The burner was adjusted 38 ± 1 mm high providing a blue flame.
The combustion characteristics of the samples were determined by cone calorimeter test device which was manufactured according to ASTM E−1354 59 and ISO-5660 60 standards. The samples were prepared with the dimensions of 100 mm x 100 mm x 50 mm and aluminum foils were wrapped around the samples except upper sides. The external heat flux which was exposed horizontally was kept as 35 ±1 kW/m2. The emissions (CO2, CO, NO, O2), the temperatures and the mass losses were recorded in 1 s increment via a special software. The heat release rate (HRR), the total heat release (THR), average heat release rate (AHRR) values were calculated with equations given in the standards.59,60
Instron 8801 computer-controlled testing machine (model 8801) was used to perform the compression test of the samples according to ASTM D1621-04 61 standard at 23 ± 2°C and 50 ± 5.0% relative humidity. Each specimen was cut to the size of 50 mm x 50 mm x 2.5 mm and the orientation of the compression was parallel to the foam rise direction. The cross-head speed was carried on 2.5 mm/min with a load cell of 500 kN. Five samples were tested for each test and the results were averaged.
Results and discussion
Thermogravimetric analysis
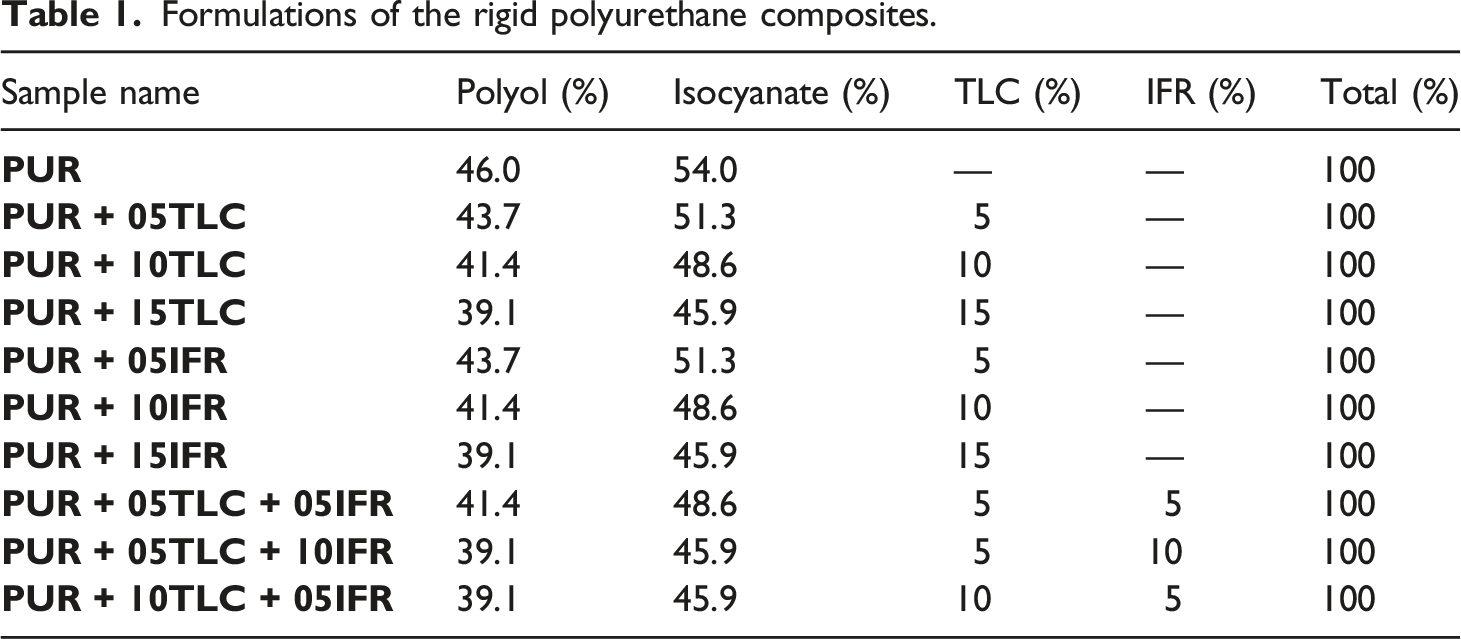
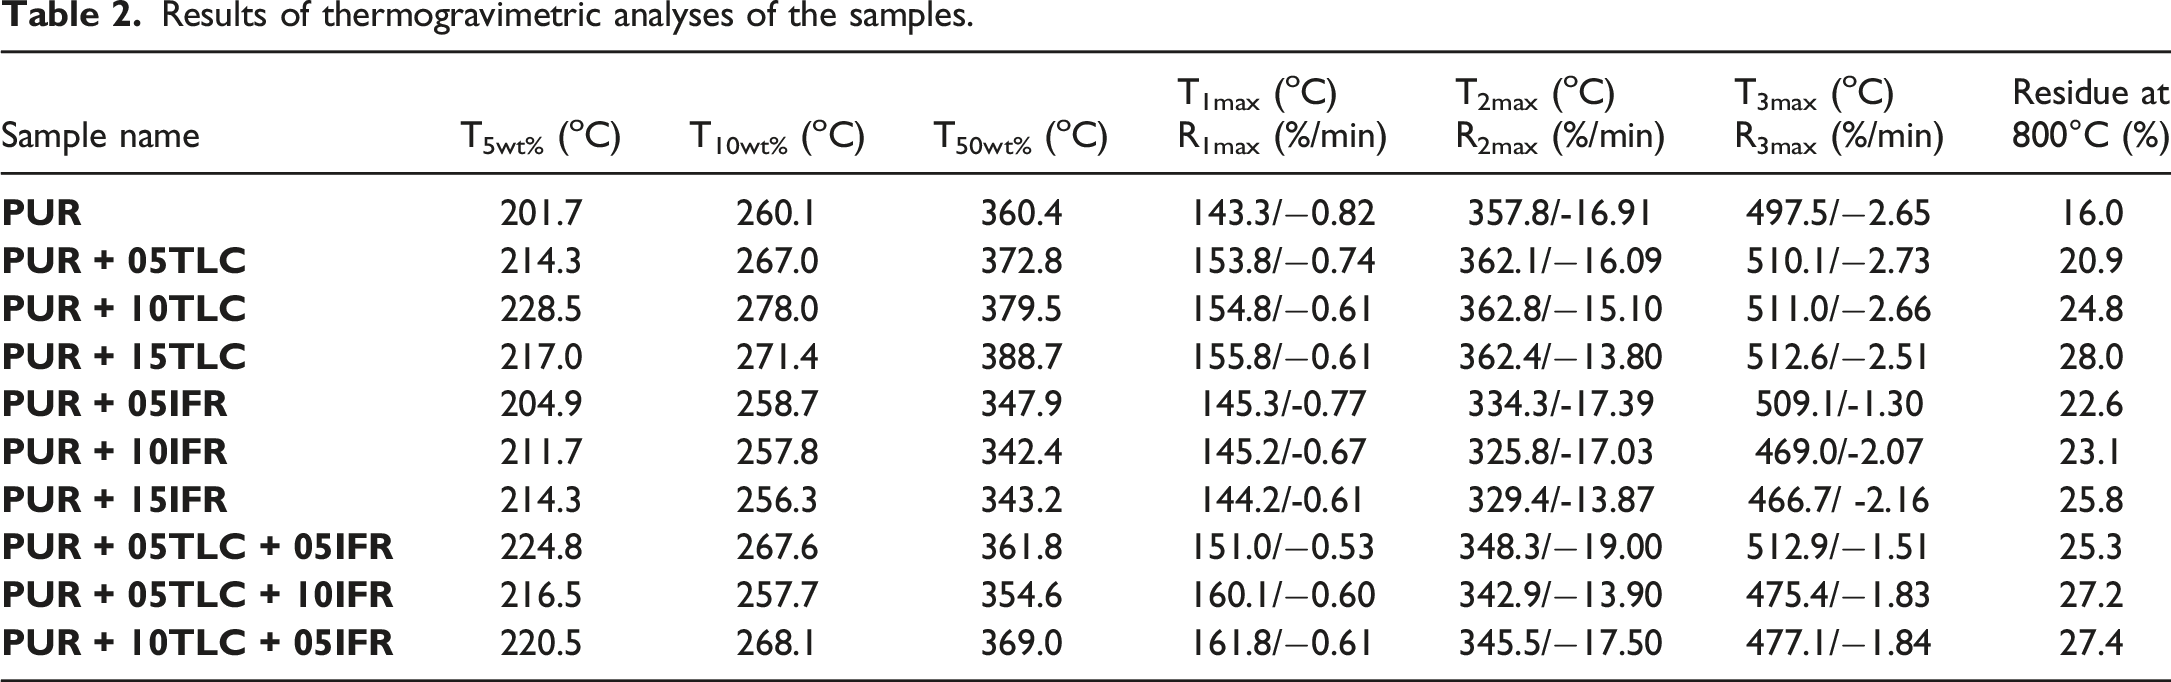
Thermogravimetric analyses of the additives and the foams were performed to investigate thermal degradation of the materials. The weight and the derivative weight curves of TLC, APP and PER are given in Figure 1. APP, PER and TLC exhibited much different degradation processes. Weight and derivative weight curves of TLC, APP and PER.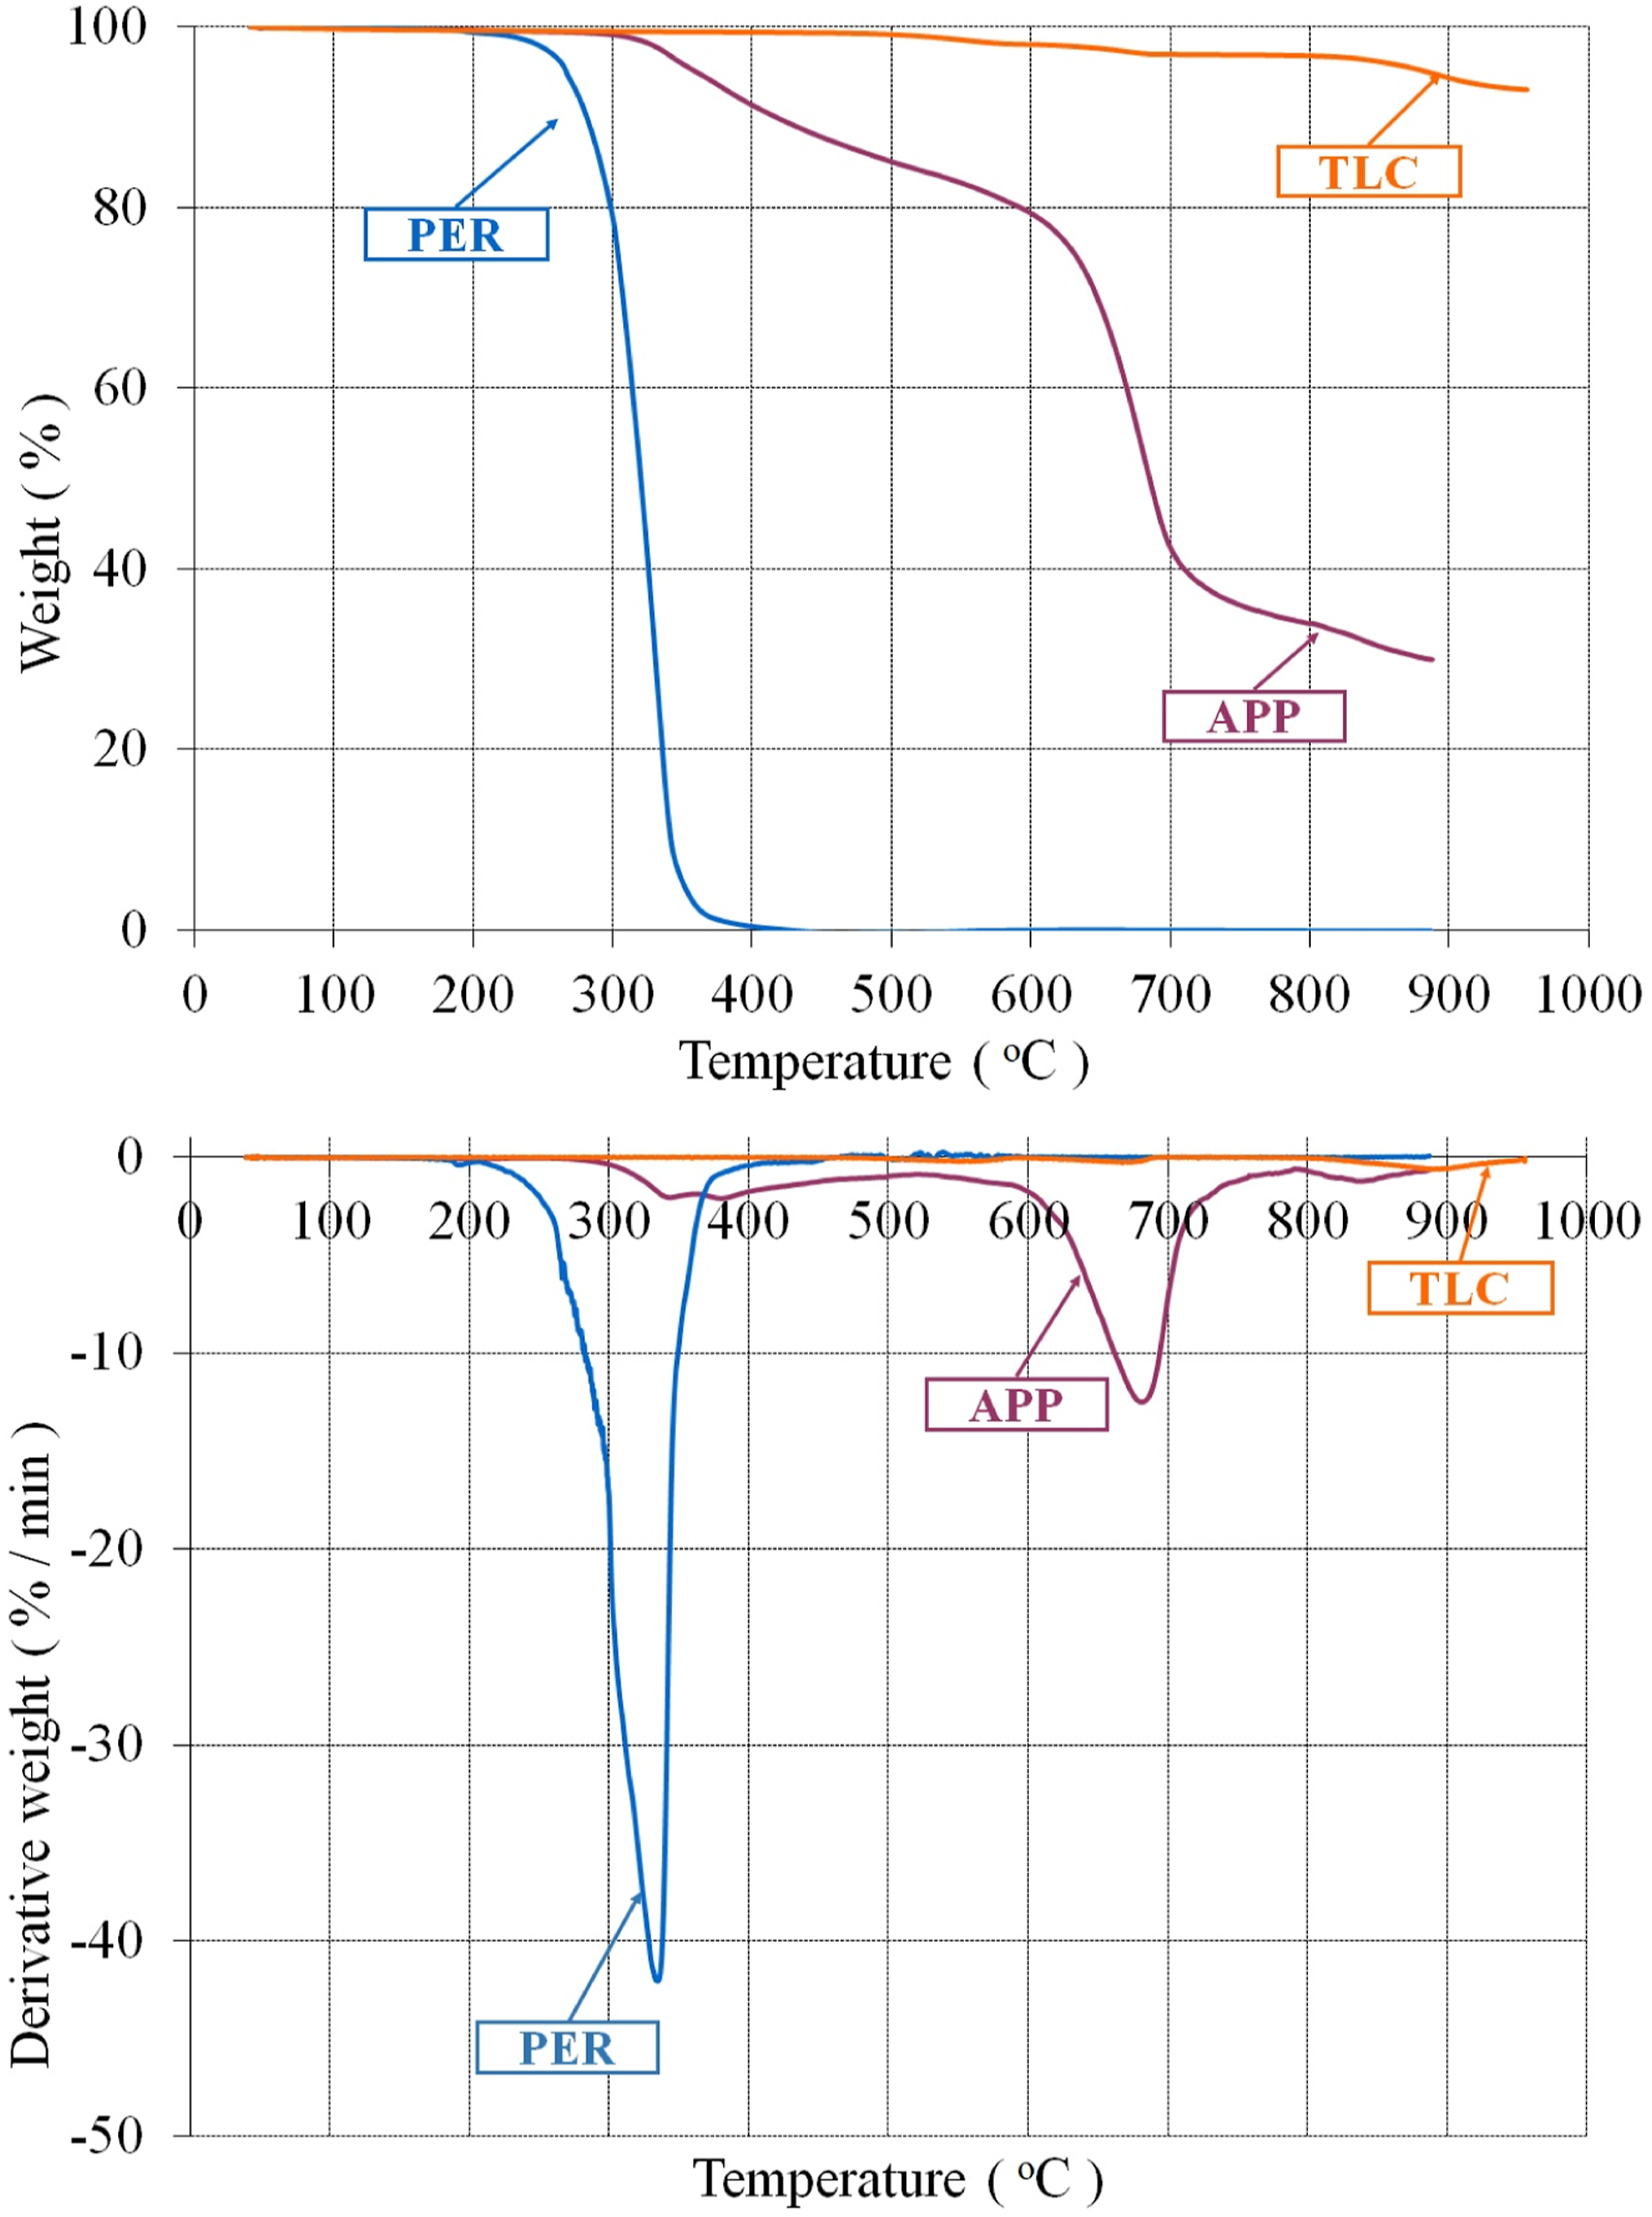
Looking at Figure 1, it is apparent that APP had three decomposition processes. The maximum decomposition temperature (T2max) and the maximum rate of decomposition (R2max) were determined as 685.61°C and 12.31%/min, respectively. In the first decomposition process, the evolution products were basically water and ammonia, and crosslinked polyphosphoric acids were simultaneously comprised 39 . The polyphosphoric acids were evaporated and/or dehydrated to phosphorus oxides in the second decomposition process 62 . PER had only one decomposition process and decomposed completely at about 394.59°C. TLC exhibited three decomposition process like APP, but it lost small amount of mass in the first and second stages. The main mass loss was occurred in third stage where the decomposition temperature (T3max) and the rate of decomposition (R3max) were determined as 899.25°C and 0.57%/min, respectively. The residual weight of TLC was about 94.37% at 900°C. Belgacem et al. 63 and Ewell et al. 64 reported similar results for the decomposition of the talc.
Figure 2 displays the weight and the derivative weight curves of PUR and PUR/TLC composites. It can be seen that the first mass loss occurred around 100°C for all foams. At this temperature, water evolves firstly and then thermally weakest links, like allophanate and biuret, dissociate.
65
Both PUR and PUR/TLC composites showed similar decomposition characteristics, however TLC addition into the rigid polyurethane foam delayed the decomposition process and had more residual weight at 800°C. Qu et al.
66
and Guo
67
also reported that adding fillers into the polymer matrix increase the residue at the end of the decomposition process. Additions of TLC into the foam slightly increased the maximum decomposition temperatures (T2max) and decreased the maximum rates of decomposition in the second stage (R2max), called as the main decomposition stage. Thirumal et al.
68
reported similar results with the addition of different fillers. In addition, the onset degradation temperature slightly increased with additions of TLC. This may be explained by the fact that increasing amount of filler in the samples results in the increase of surface area of the fillers which cause higher interactions with the matrix.69,70 Weight and derivative weight curves of PUR and PUR/TLC.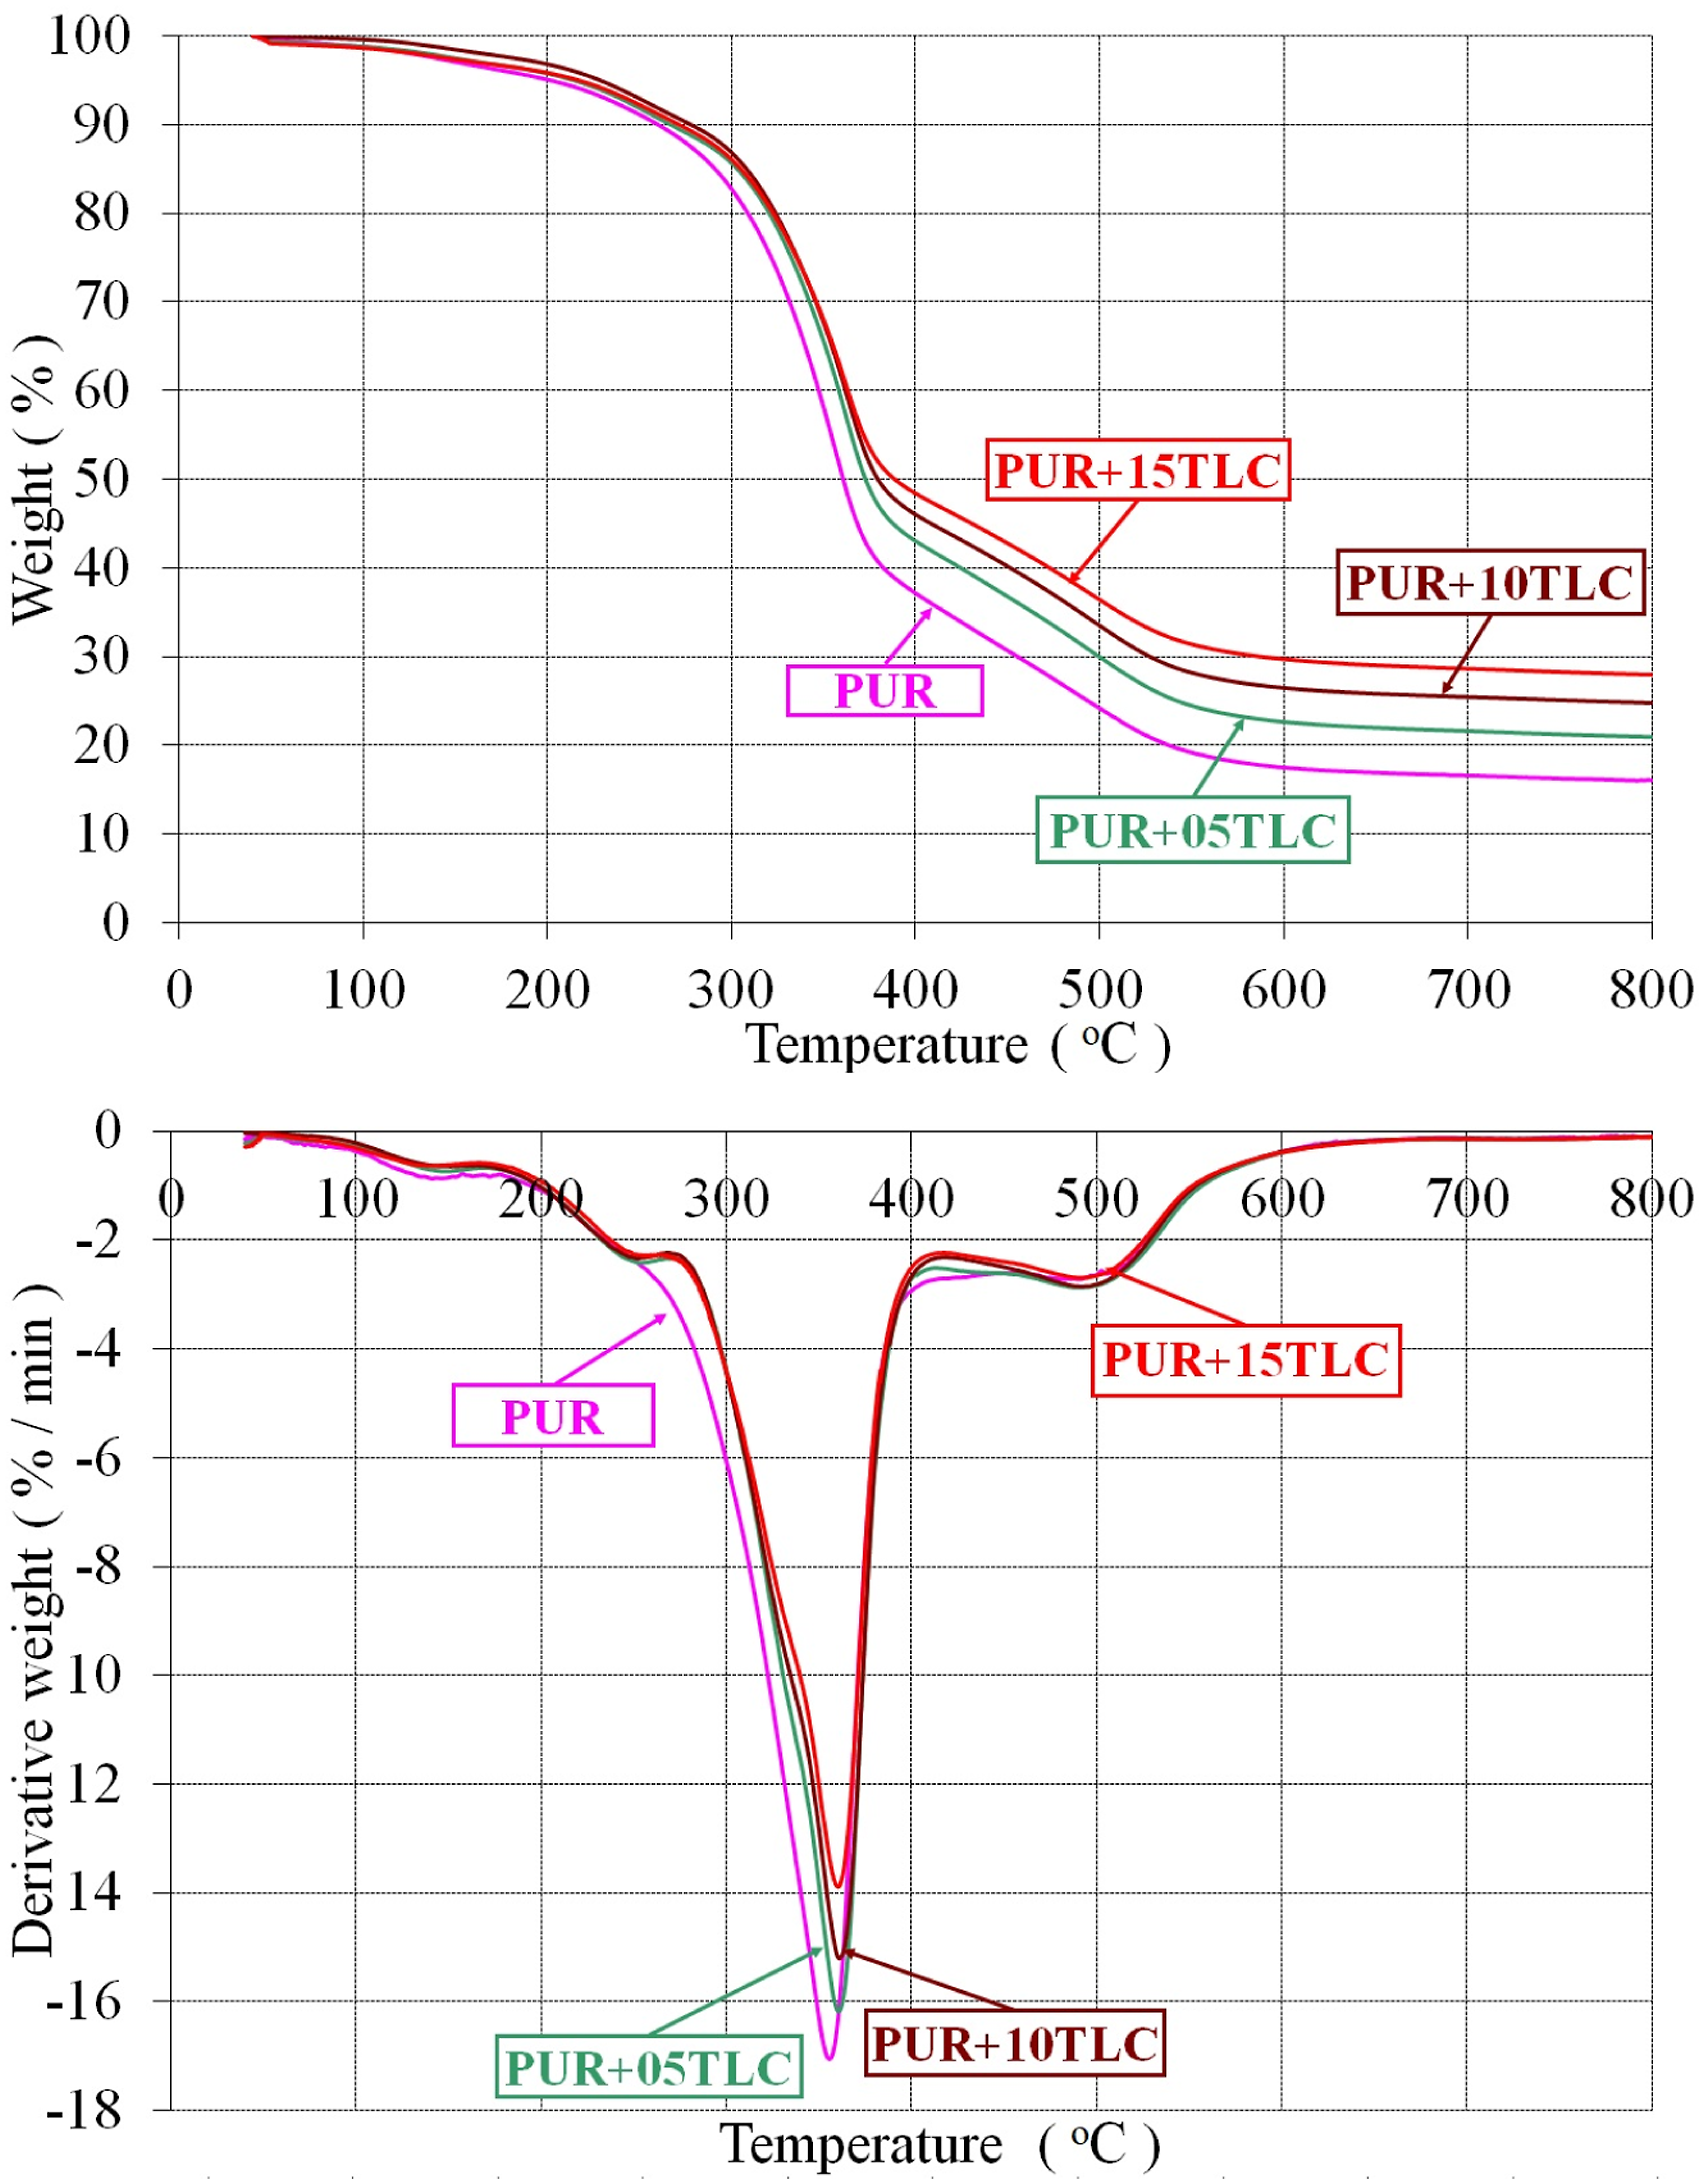
The intumescent flame retardant addition into the foams accelerate the decomposition process.30,62,65 Figure 3 presents the results obtained from the thermogravimetric analyses for the tested samples. What is striking in this figure is the early decomposition of the PUR/TLC/IFR composites. A possible explanation for this might be that intumescent flame retardant decomposes earlier and produces a char layer which protects the underlying materials from heat and flame.71,72 The second decomposition temperatures (T2max) for PUR, PUR+05TLC+05IFR, PUR+05TLC+10AP and PUR+10TLC+05IFR were 357.8, 348.3, 342.9 and 345.5°C, respectively. Increasing the amount of IFR into the foam decreased the main decomposition temperature about 9°C. However, the addition of IFR decreased the maximum rate of decomposition about 17% for the sample which contains 5 wt % TLC and 10 wt % IFR. Weight and derivative weight curves of PUR and PUR/TLC/IFR.
Results of thermogravimetric analyses of the samples.
Thermal conductivity
Thermal conductivity measurements of the samples were performed regularly in different times for 55 days. Figure 4 shows changing of thermal conductivity values of PUR/TLC composites by time. Thermal conductivity is mainly affected by two parameters: the mean cell diameter and the gas inside the cells.41,73,74 The average cell sizes were calculated with the images taken from the cross-sectional surfaces of the samples by the optical microscopy (Figure 5) according to ASTM D3576-04.
57
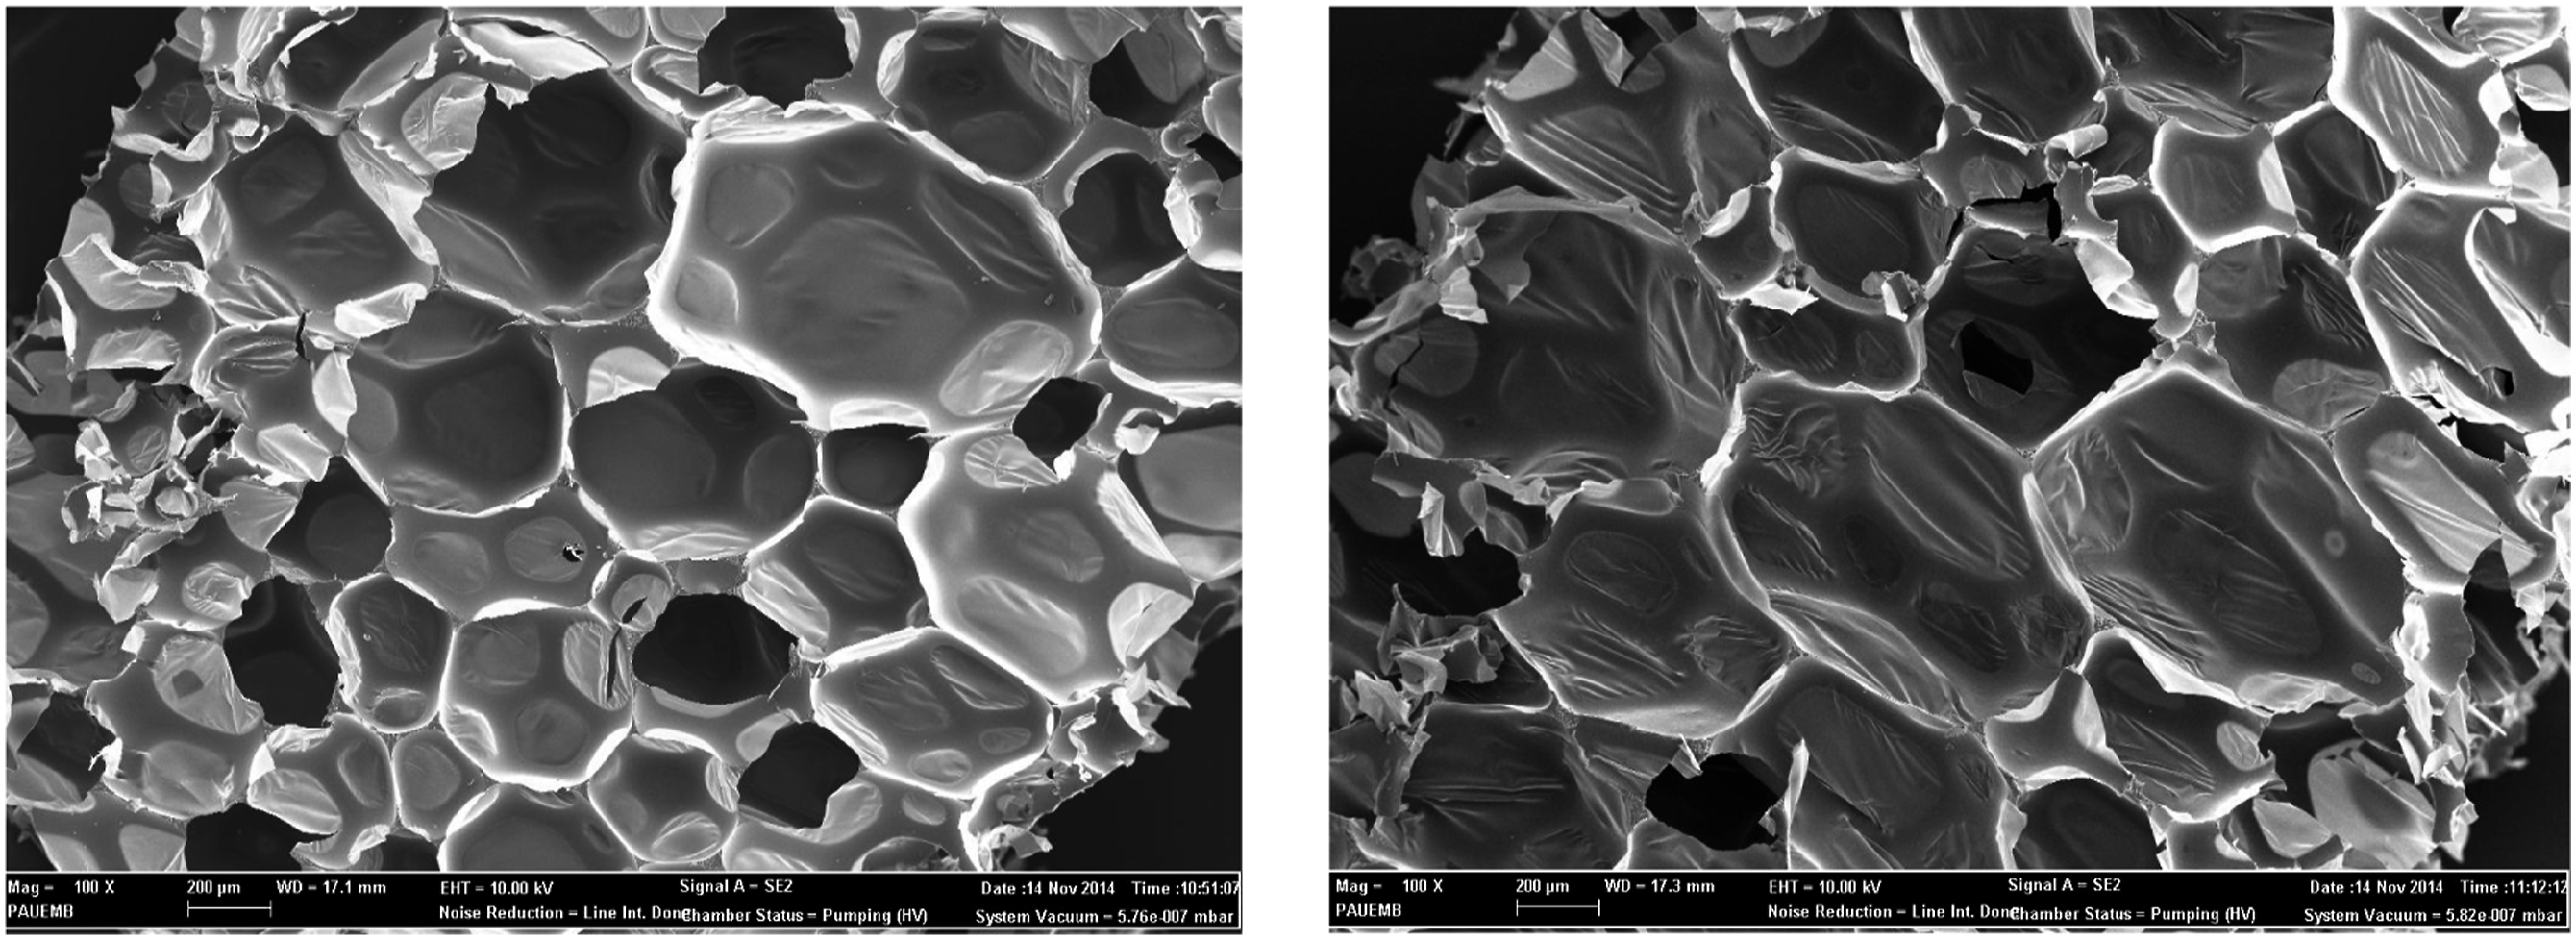
It was determined that average cell sizes increased with the addition of TLC. Besides, Figure 6 shows the SEM images of PUR and PUR+15TLC which contains maximum TLC addition. As it can be seen from the figure that addition of TLC into the foam collapse the cell walls and increase the number of open cells. Average cell sizes of PUR, PUR+05TLC, PUR+10TLC and PUR+15TLC were determined as approximately 689, 674, 742 and 739 µm, respectively. 15 wt % TLC addition increased average cell size approximately 7%. Meanwhile, 5 and 10 wt % IFR additions to PUR+05TLC increased the cell size approximately 14 and 17%, respectively. Usage of 10 wt % TLC and 5 wt % IFR together in the polyurethane matrix increased the average cell size about 10%. Thermal conductivity coefficients of PUR/TLC. The optical microscopy pictures of (a) PUR, (b) PUR+15TLC. SEM images of PUR and PUR+15TLC.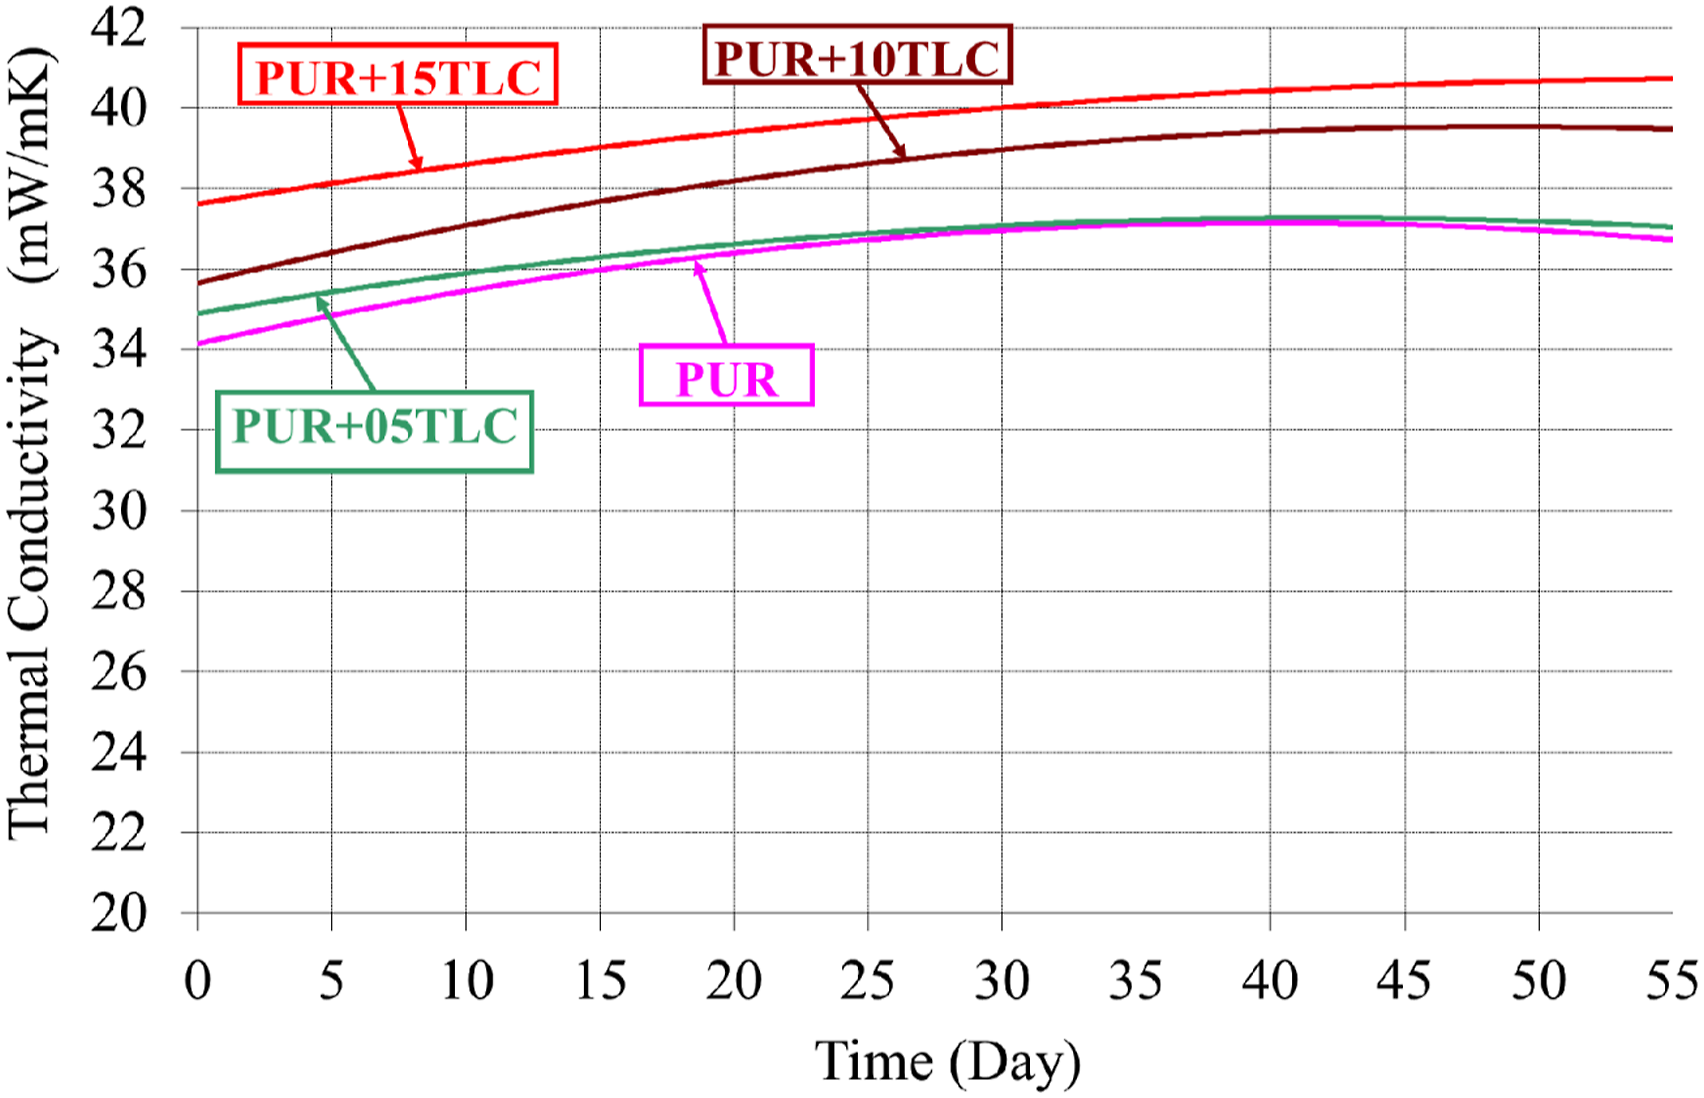

It is known that insulation properties of rigid polyurethanes get worse over the time, and it is called as thermal ageing. 10 It can be seen that the thermal conductivity did not change significantly with the addition of TLC. Thermal conductivity of pure PUR was 33.8 mW/mK on the 1st day, but it increased to 36.8 mW/mK on the 55th day. Thermal conductivity of PUR increased about 9% for the 55th day. The initial thermal conductivity values of PUR+05TLC, PUR+10TLC and PUR+15TLC were 34.85, 35.4 and 37.4 mW/mK, respectively. However, the increases of thermal conductivity values of PUR+05TLC, PUR+10TLC and PUR+15TLC were about 6, 11 and 9% for the 55th day. Modesti et al., 73 Kim et al. 41 and Thirumal et al. 68 also reported similar results for filler additions into the rigid polyurethane foams.
Figure 7 shows the changing of thermal conductivity values of PUR/TLC/IFR composites by the time. Thermal conductivity values of PUR+05TLC+05IFR, PUR+05TLC+10IFR and PUR+10TLC+05IFR were 34.02, 34.96 and 33.45 mW/mK on the 1st day, respectively. The corresponding value increased about 13% for PUR+10TLC+05IFR on the 55th day. The thermal conductivities of the samples which contains 5% TLC/5% IFR and 5% TLC/10% IFR increased about 12% and 10% on the 55th day, respectively. Adding of IFR to PUR/TLC composites did not significantly affect thermal conductivity of the foam. Thermal conductivity coefficients of PUR/TLC/IFR.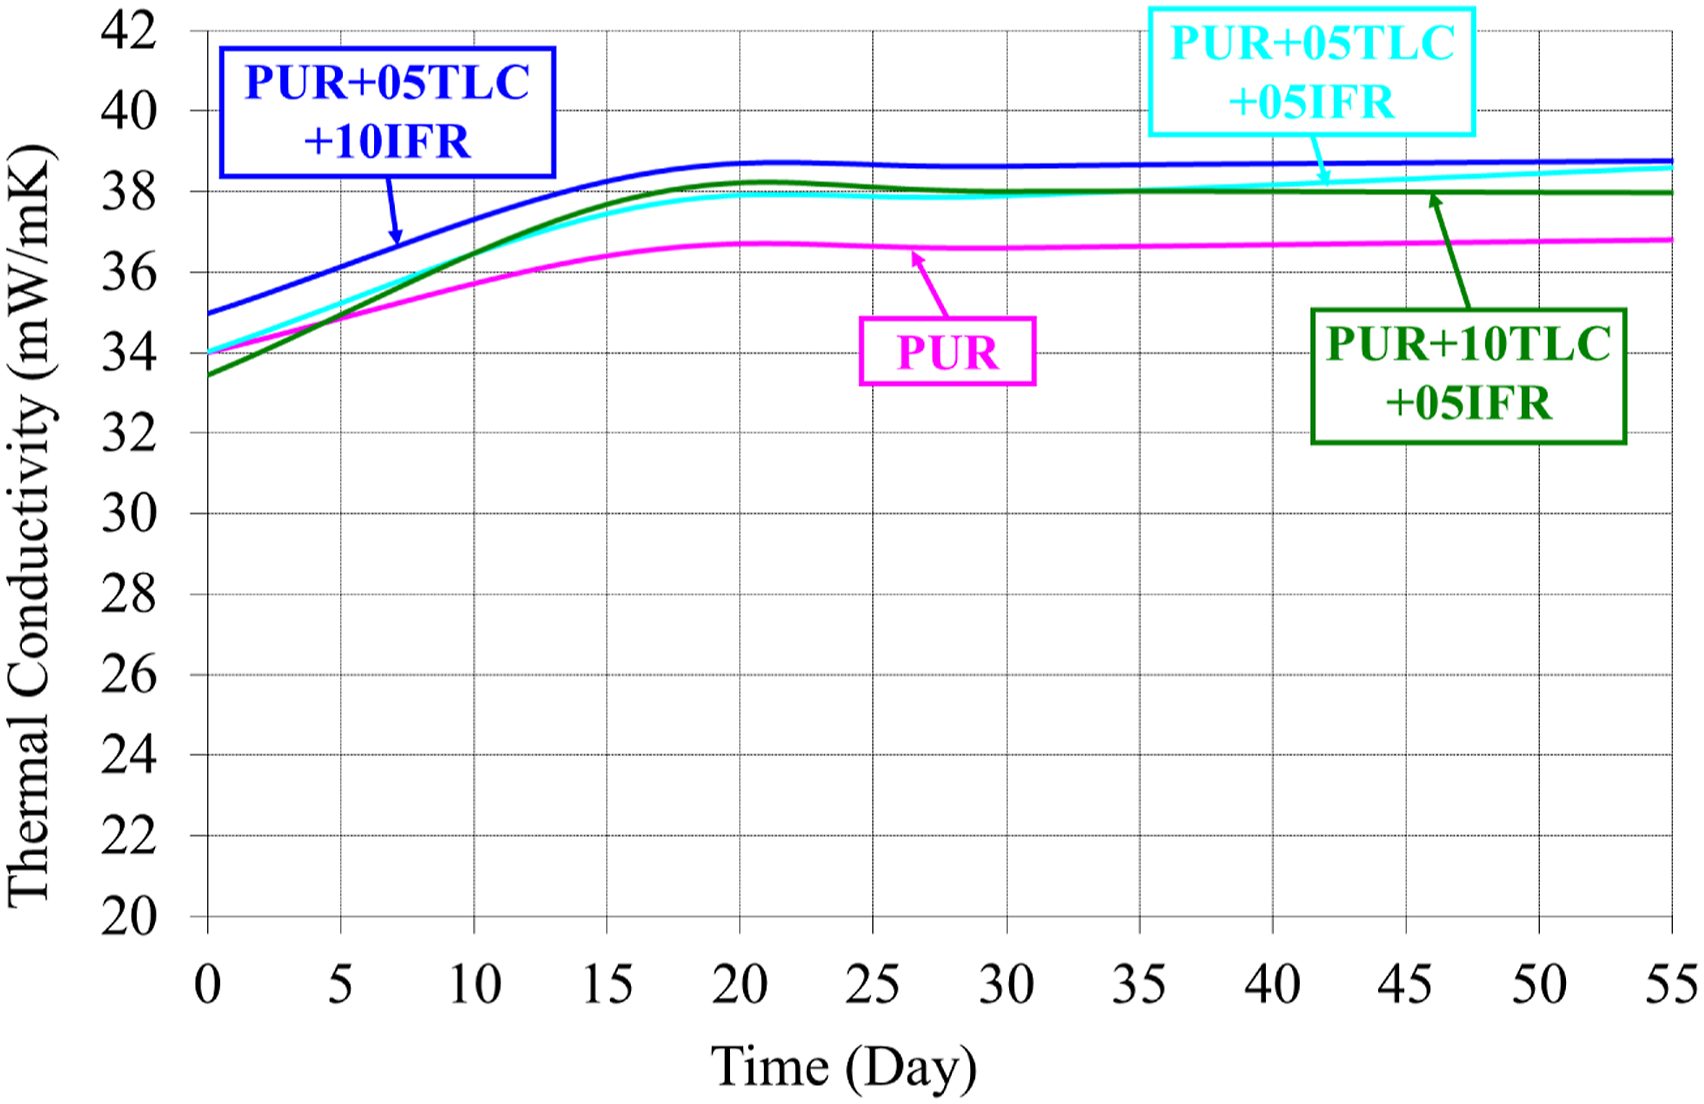
UL94 tests
UL94 is a test to investigate the flammability and the rate of fire spread of the polymeric materials. In this study, UL94H horizontal test was applied to the polyurethane foams. Figure 8 shows pictures of PUR, PUR/TLC, PUR/IFR and PUR/IFR/TLC composites after UL94 tests. 5 wt % TLC addition into PUR did not significantly affect the fire resistance of the foam. However, when 10 and 15 wt % TLC were added to the foam, the flame could not completely reach to the first gauge mark. In other words, the fire resistance of the foam was slightly enhanced with the increase of the talc amount in the sample. This result is likely to be related to SiO2 content of the talc filler. It is thought that SiO2 particles can strengthen the dense structure of char and promote the char formation.
75
IFR additions achieved better fire resistance than TLC additions. Furthermore, it can be said that the best fire resistance was obtained with 5 wt % TLC and 10 wt % IFR addition. As it was mentioned above that APP and PER degrades at low temperatures to form a char layer which can reduce heat and mass transfer, and it also prevent the combustible gasses to reach to flame in a fire. This char protects the underlying materials. This phenomenon enhances the flame retardant effect and slows down the flame progress. Pictures of PUR, PUR/IFR, PUR/TLC and PUR/TLC/IFR after UL94 tests.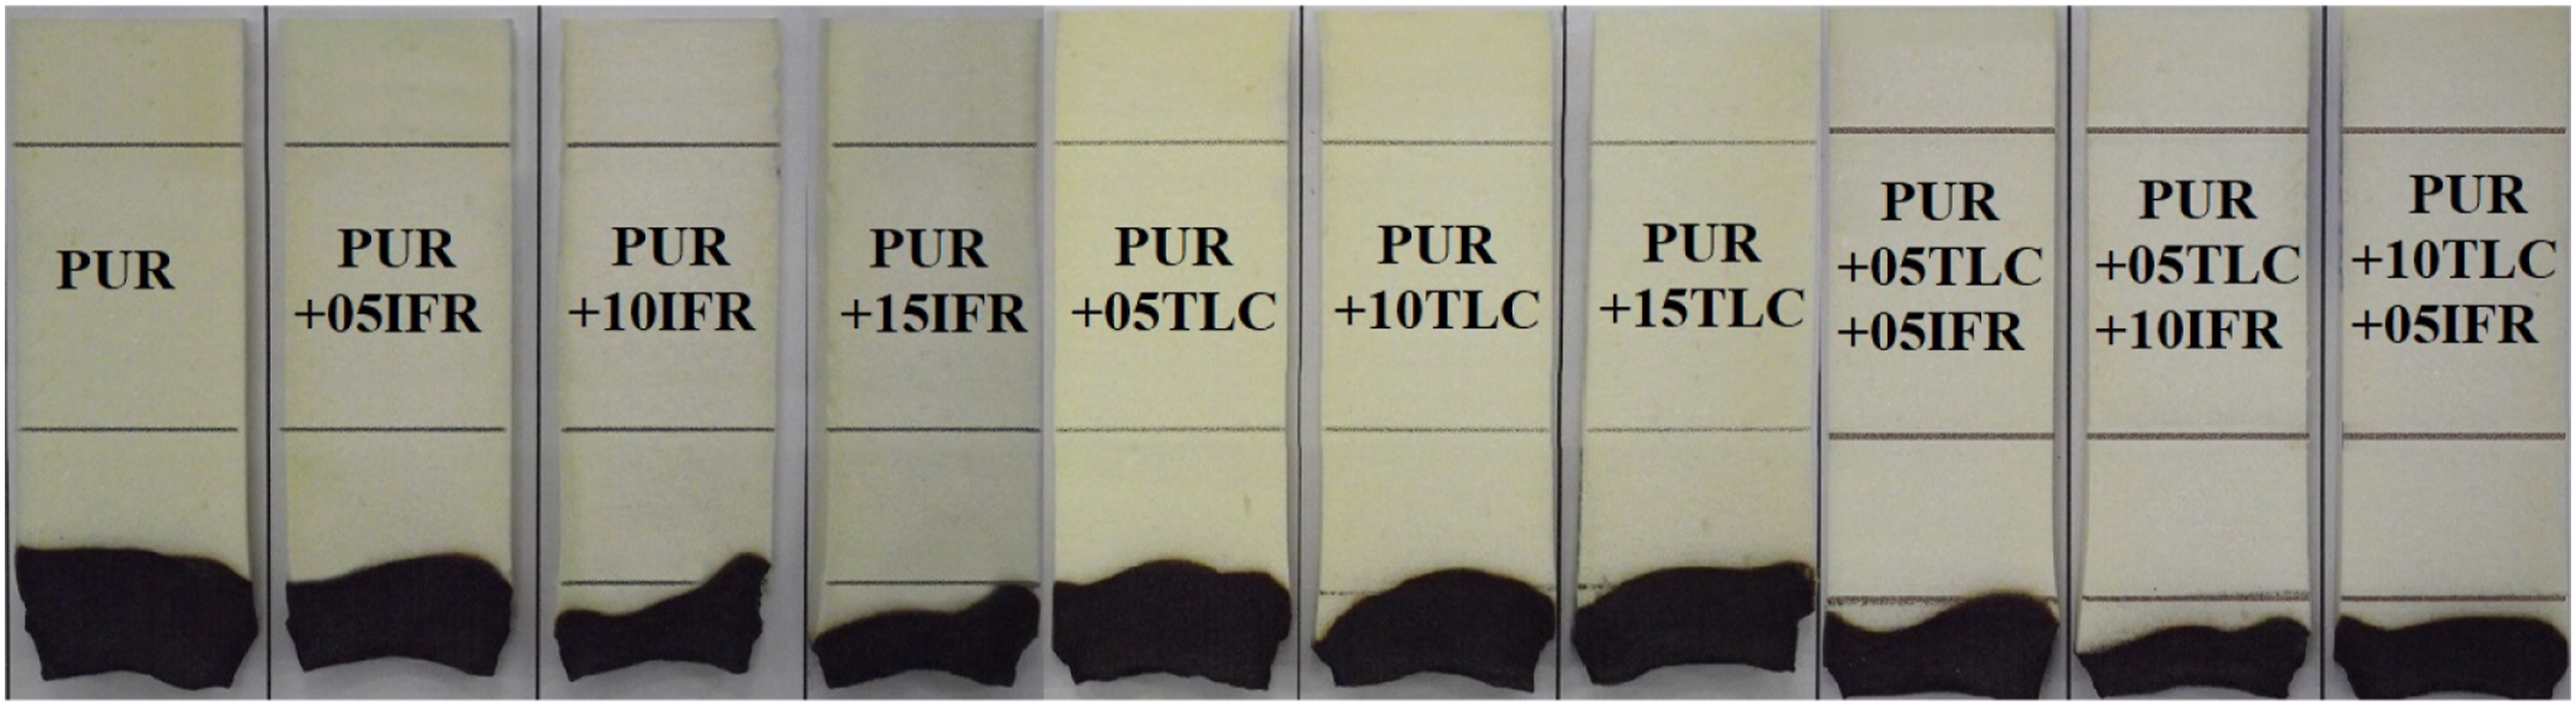
Cone calorimeter tests
Heat release rate (HRR), peak heat release rate (PHRR), time to ignition (TTI) and total heat release (THR) are important parameters which are determined in cone calorimeter tests to define the intensity and properties of a fire.
76
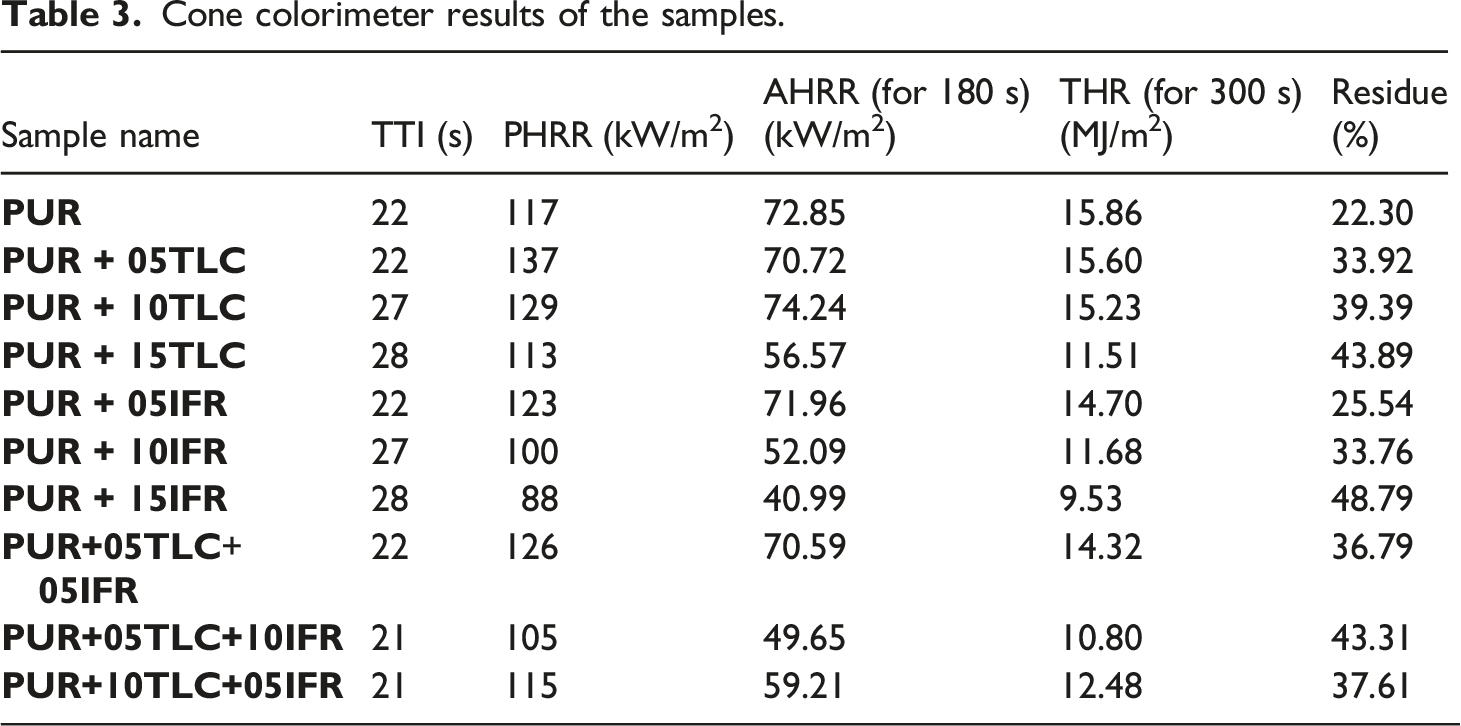
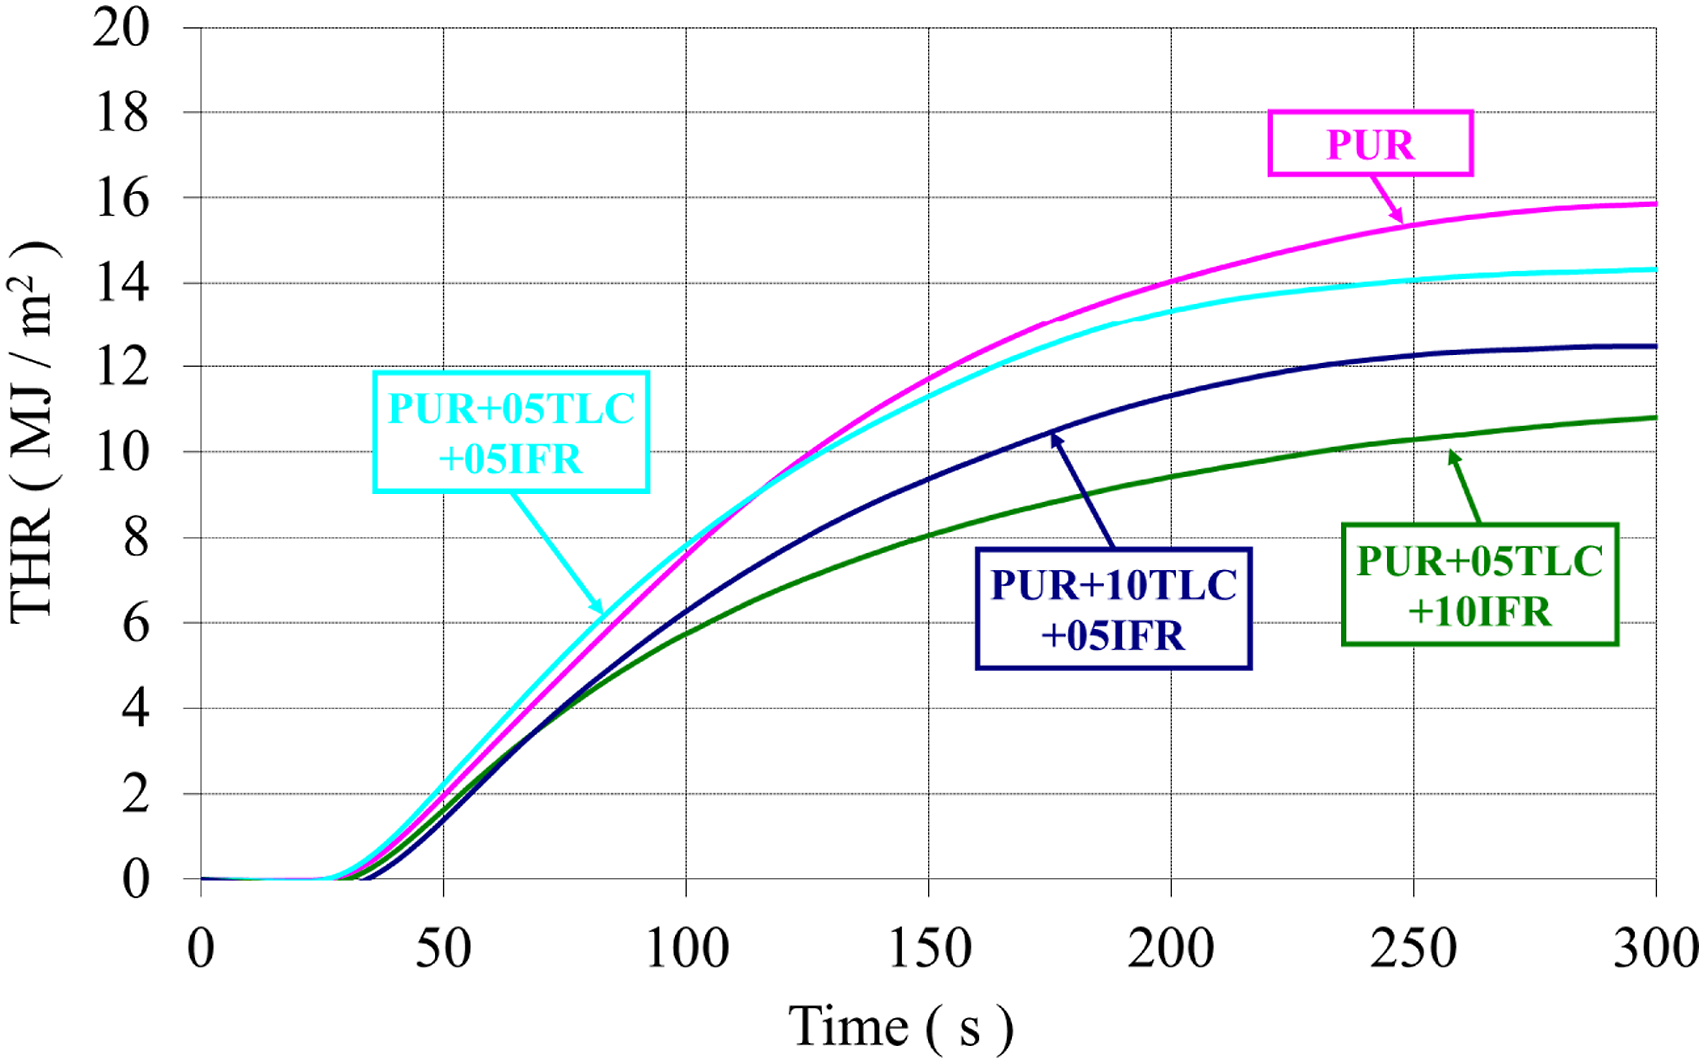
HRR and THR curves of PUR and PUR/TLC composites with respect to time at a heat flux of 35 kW/m2 were given in Figures 9 and 10, respectively. In addition, Table 3 compares the results obtained from the cone calorimeter tests. The heat release rates (HRR) of PUR/TLC. The total heat release (THR) values of PUR/TLC. Cone colorimeter results of the samples.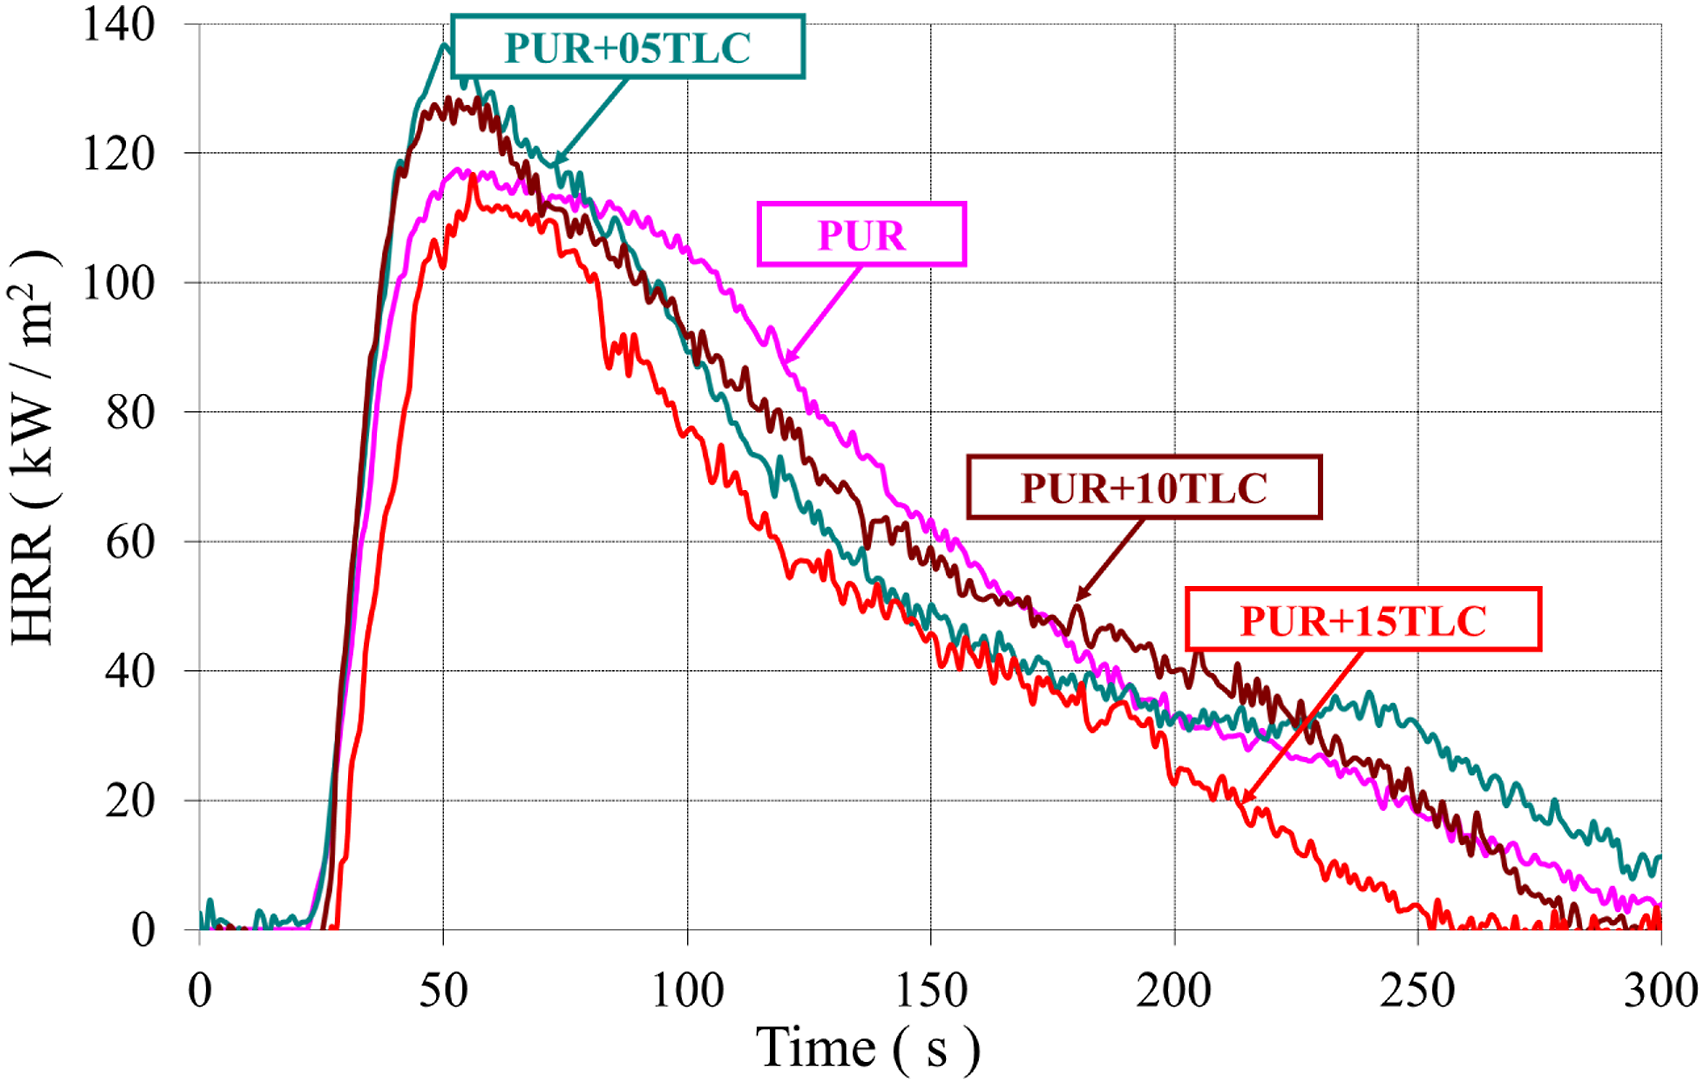
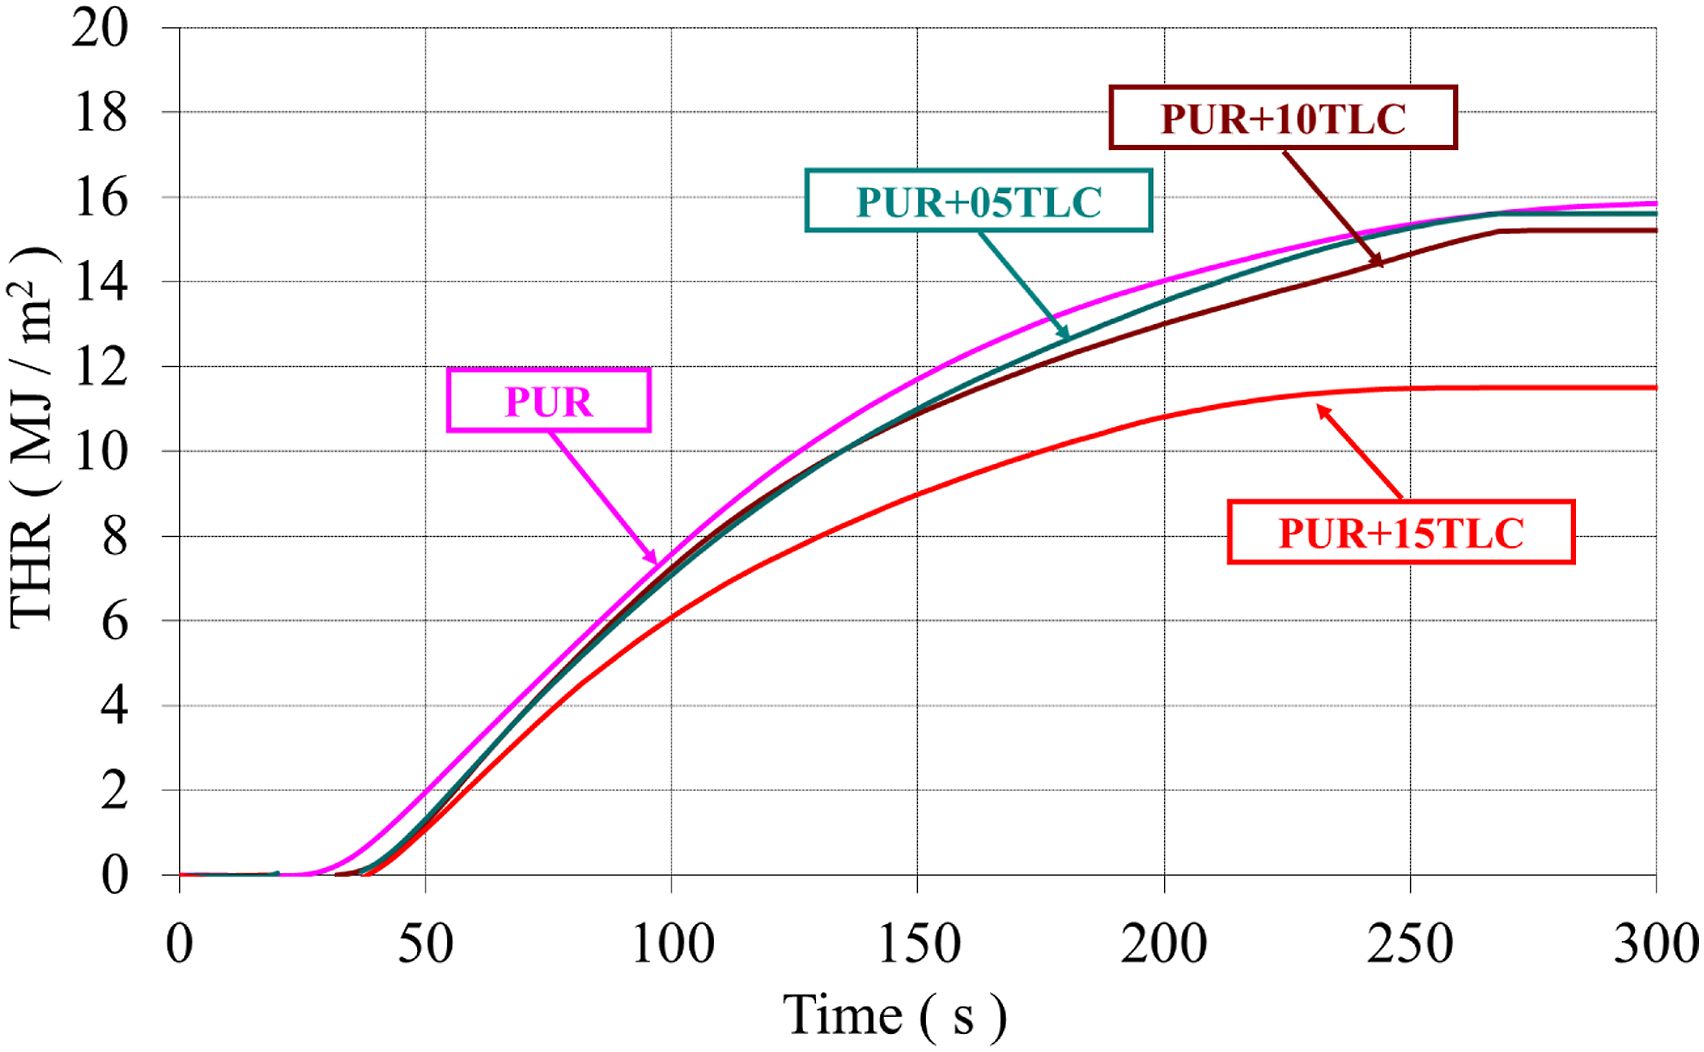
The HRR curve of PUR represented characteristics of typical thermally thick charring (residue forming) material. When PUR was exposed the heat flux, the heat release rate increased until an efficient char layer was generated and then HRR decreased.30,77,78 HRR of PUR reached to the maximum value of 117 kW/m2 and gradually decreased to zero. The burning of PUR stopped within approximately 300 s after the start time of the heat flux application and THR of PUR was determined as 15.86 MJ/m2. PUR/TLC composites also revealed similar burning characteristics with PUR. Although 5 and 10% TLC additions slightly increased PHRR values, 15% TLC addition slightly decreased it. As it is known that inorganic fillers may have positive and negative effects in the flame retardancy of the rigid polyurethane foams.79–81 The positive effects which reduce the flammability and burning rates of the materials may be summarized as follows. The amounts of combustible materials are reduced with the additions of the fillers. Meanwhile the absorption of heat by the fillers reduces the burning rate of the foam. In addition, some fillers may undergo endothermic reactions at different temperatures leading to generation of some non-flammable gases such as water and carbon dioxide, and reduction in the flammability. However, the addition of the fillers may adversely affect the cell structure. The addition of the inorganic fillers may result in cell collapse and cell walls rupture which facilitates escaping of the flammable gasses at the beginning of the burning.31,82 In this way, the burning rate increases. It is thought that the negative effects of TLC addition were dominant at the beginning of the burning of PUR+05TLC and PUR+10TLC resulting higher PHRR. Meanwhile, the positive effects were dominant in the burning processes of PUR+15TLC. Although 5 and 10% TLC slightly decreased THR values, 27.4% reduction in THR value was achieved with 15% TLC addition which helped the formation of more efficient char layer.
In general, additions of TLC and IFR together into the rigid polyurethane foams decreased HRR values of the foam (Figure 11). Figure 12 displays THR curves of the samples. As can be seen from the figure, TLC and IFR additions into the foam resulted in reduction in THR of the foams. Maximum reduction in THR (32%) was achieved with the addition of 5% TLC and 10% IFR. This may be explained with a dense and uniform char layer formed by IFR and TLC. The char layer acts as a protective barrier which delays the burning rate and enhance the flame retardant effect.83,84 The heat release rates (HRR) of PUR/TLC/IFR. The total heat releases (THR) of PUR/TLC/IFR.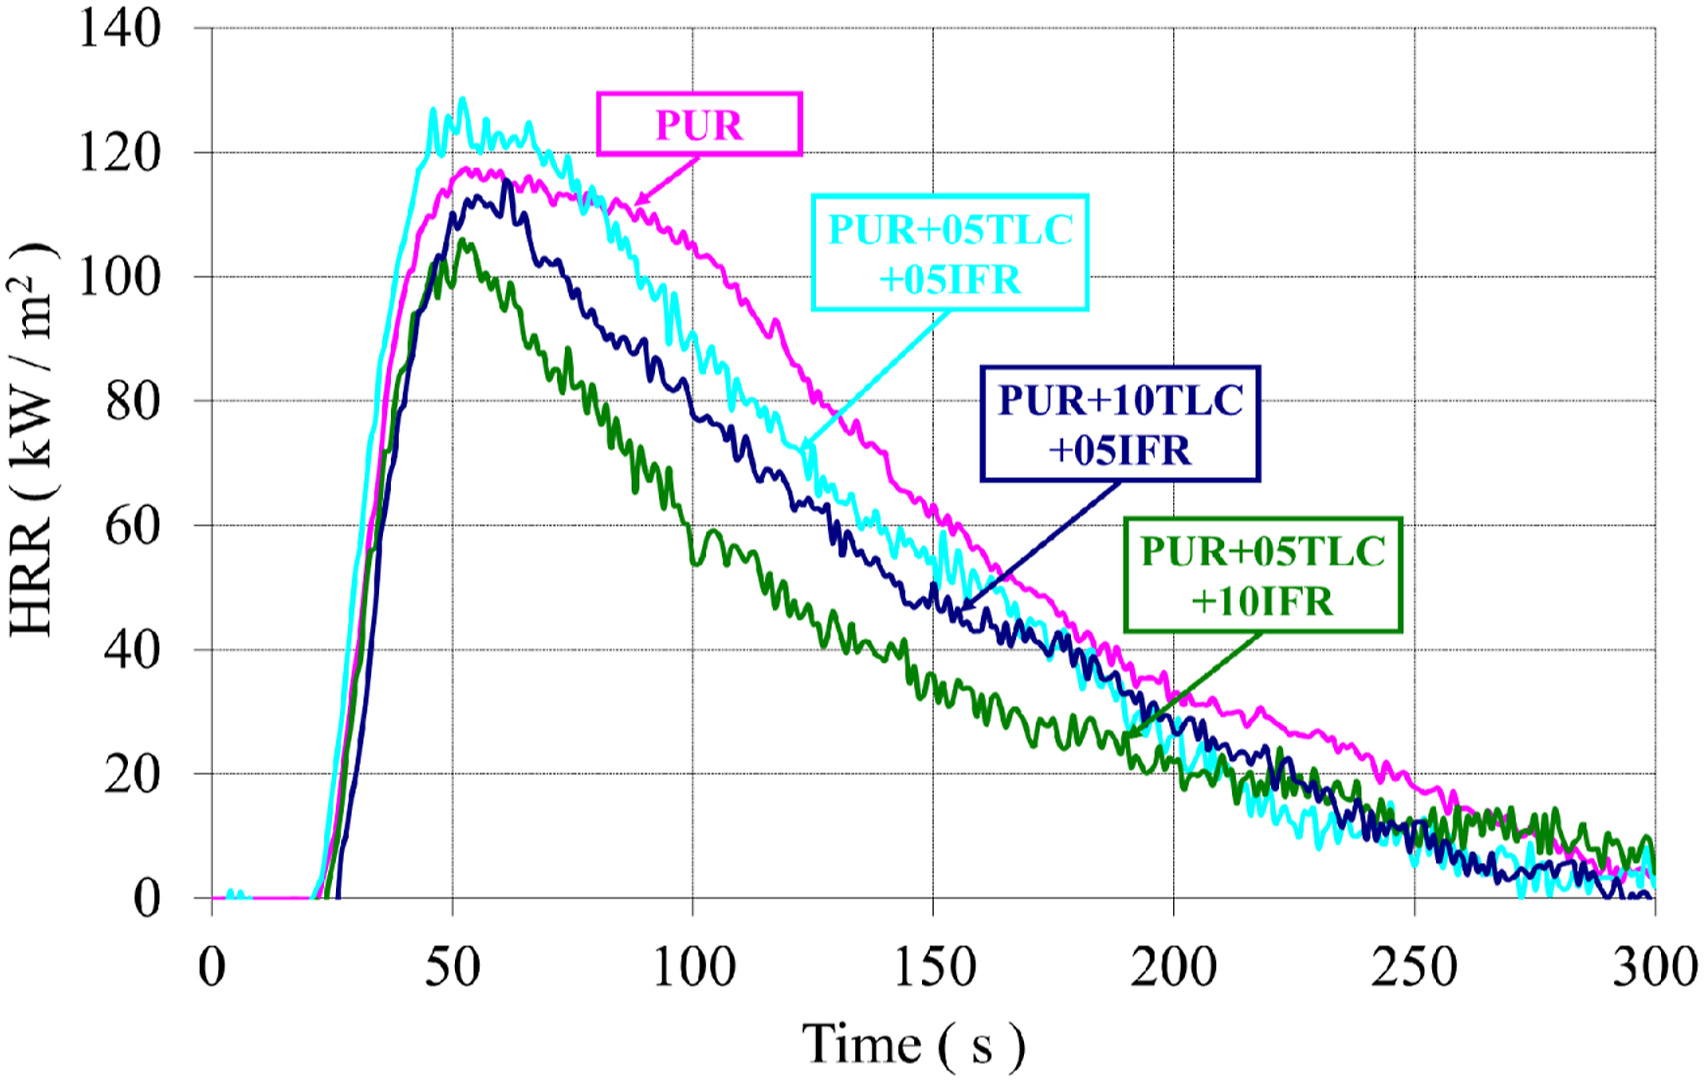
Smoke and CO emissions which are considered as the major cause of poisoning during fires can be measured with cone calorimeter tests.
85
Both CO and smoke productions are generated due to the incomplete combustion of the foam. The smoke and CO emissions in combustion mainly depend on fire and material properties. Figures 13 and 14 show the extinction coefficients of PUR/TLC and PUR/TLC/IFR composites, respectively. The CO and smoke trends were very similar. The smoke emissions of TLC and TLC/IFR added samples were lower than that of PUR. TLC and TLC/IFR additions into the foam decreased the CO emissions of the foams (Figures 15 and 16, respectively). The extinction coefficients of PUR and PUR/TLC. The extinction coefficients of PUR, and PUR/TLC/IFR. The CO emissions of PUR, and PUR/TLC. The CO emissions of PUR, and PUR/TLC/IFR.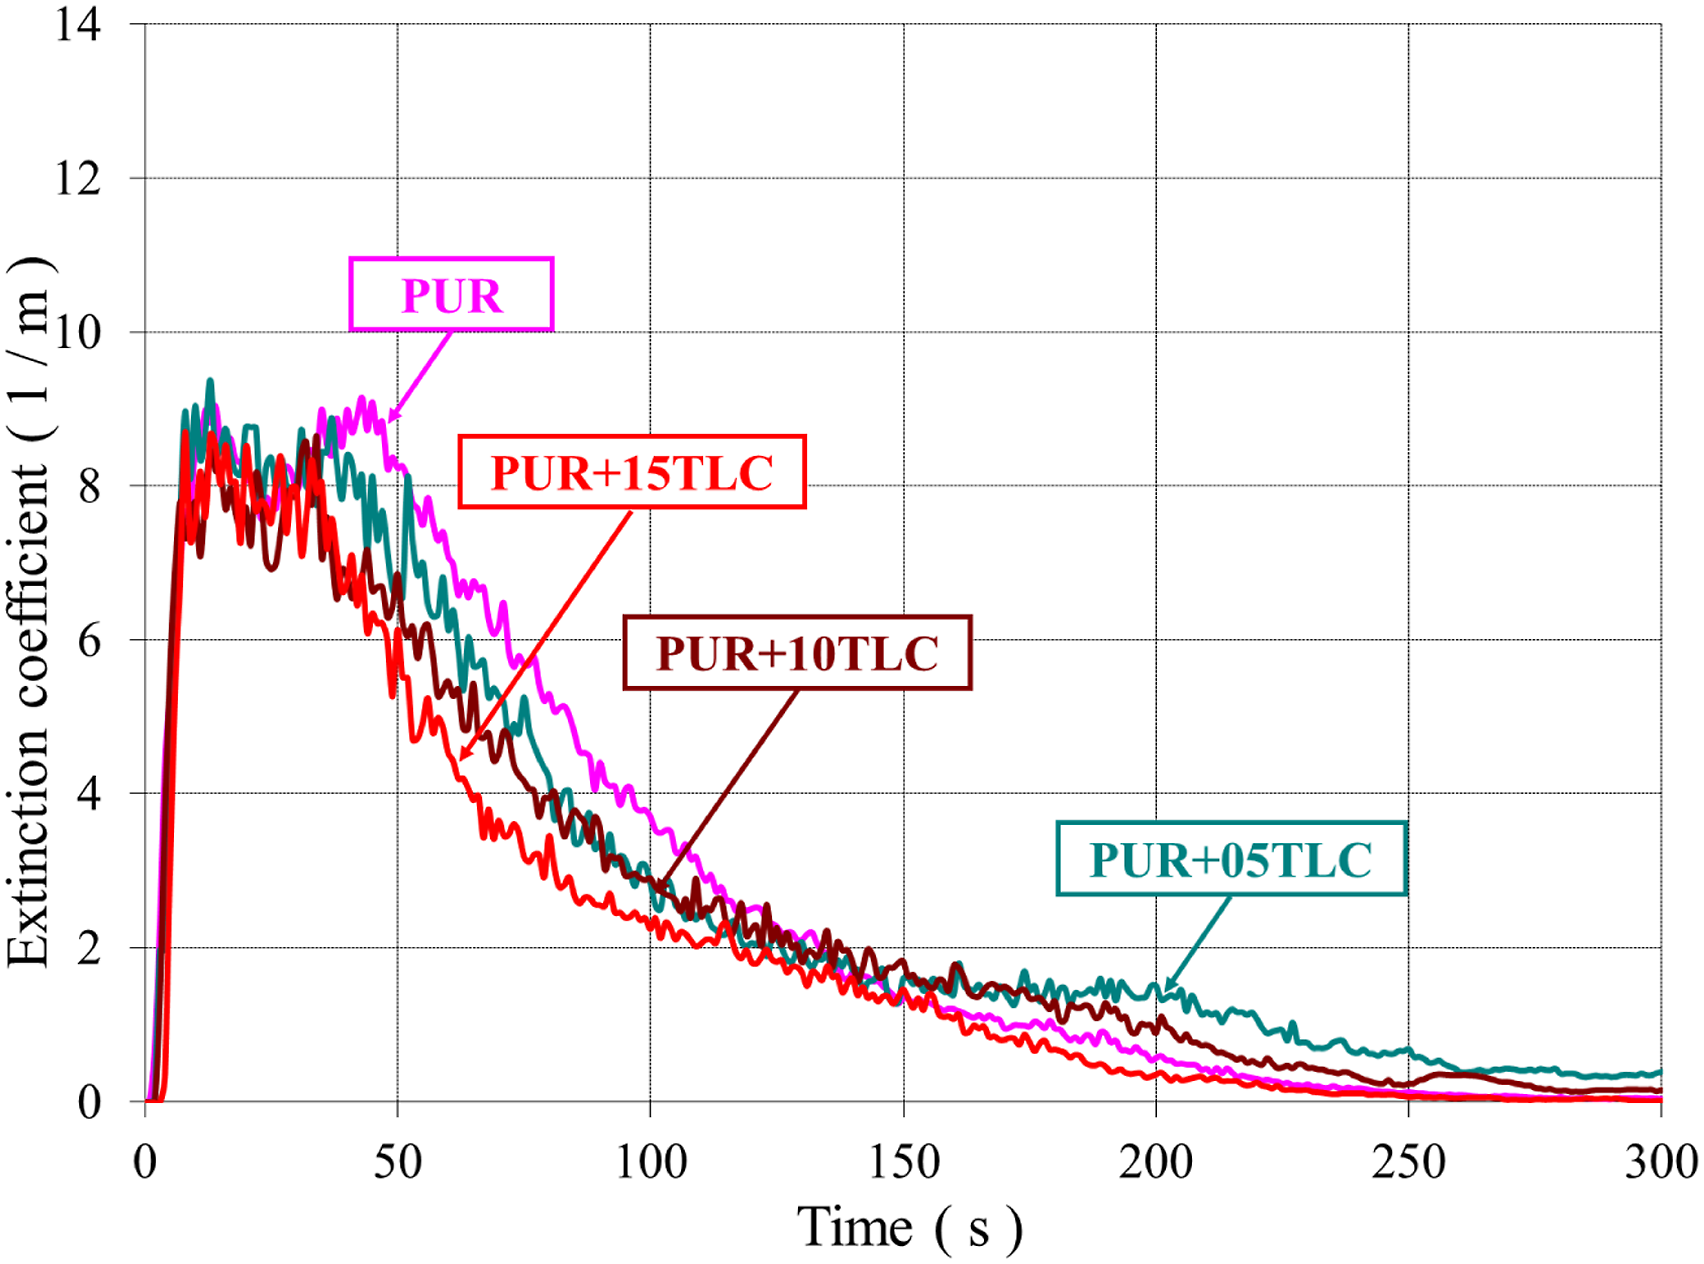
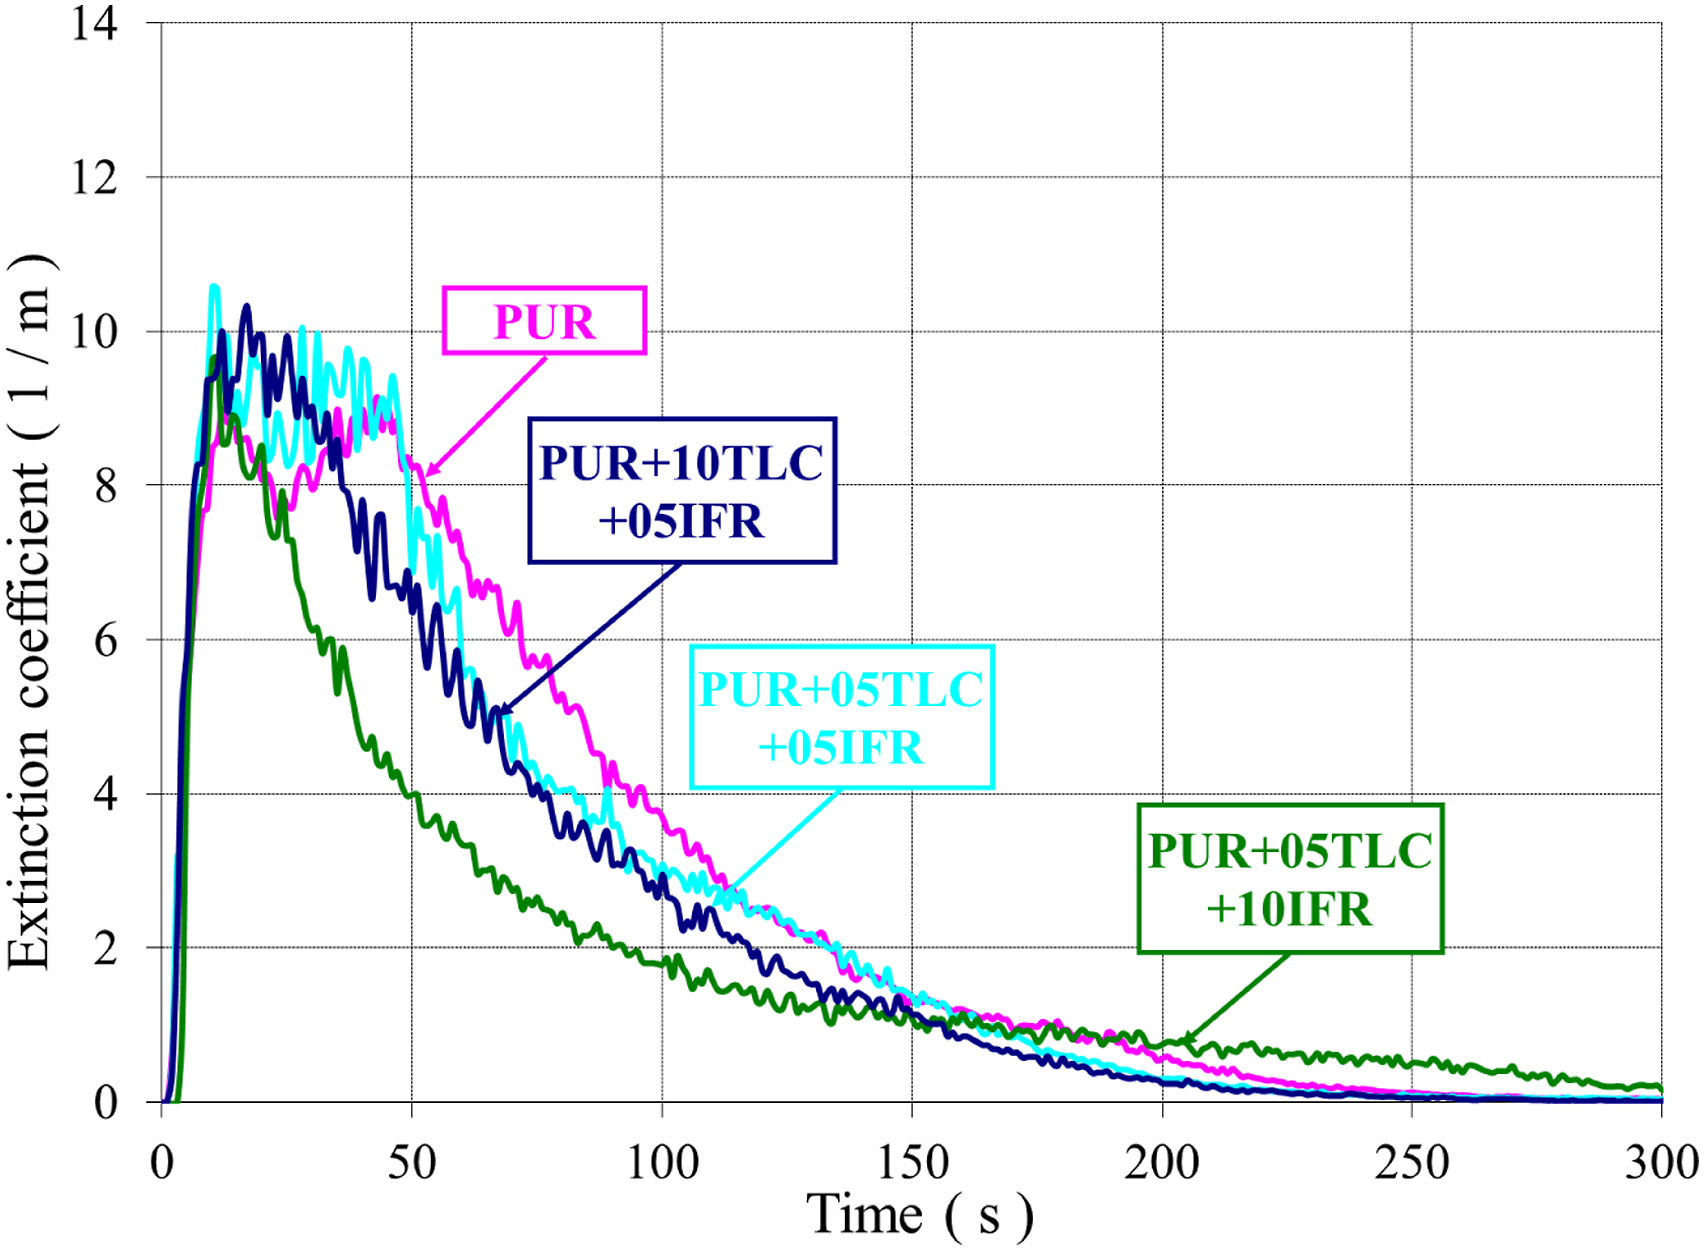
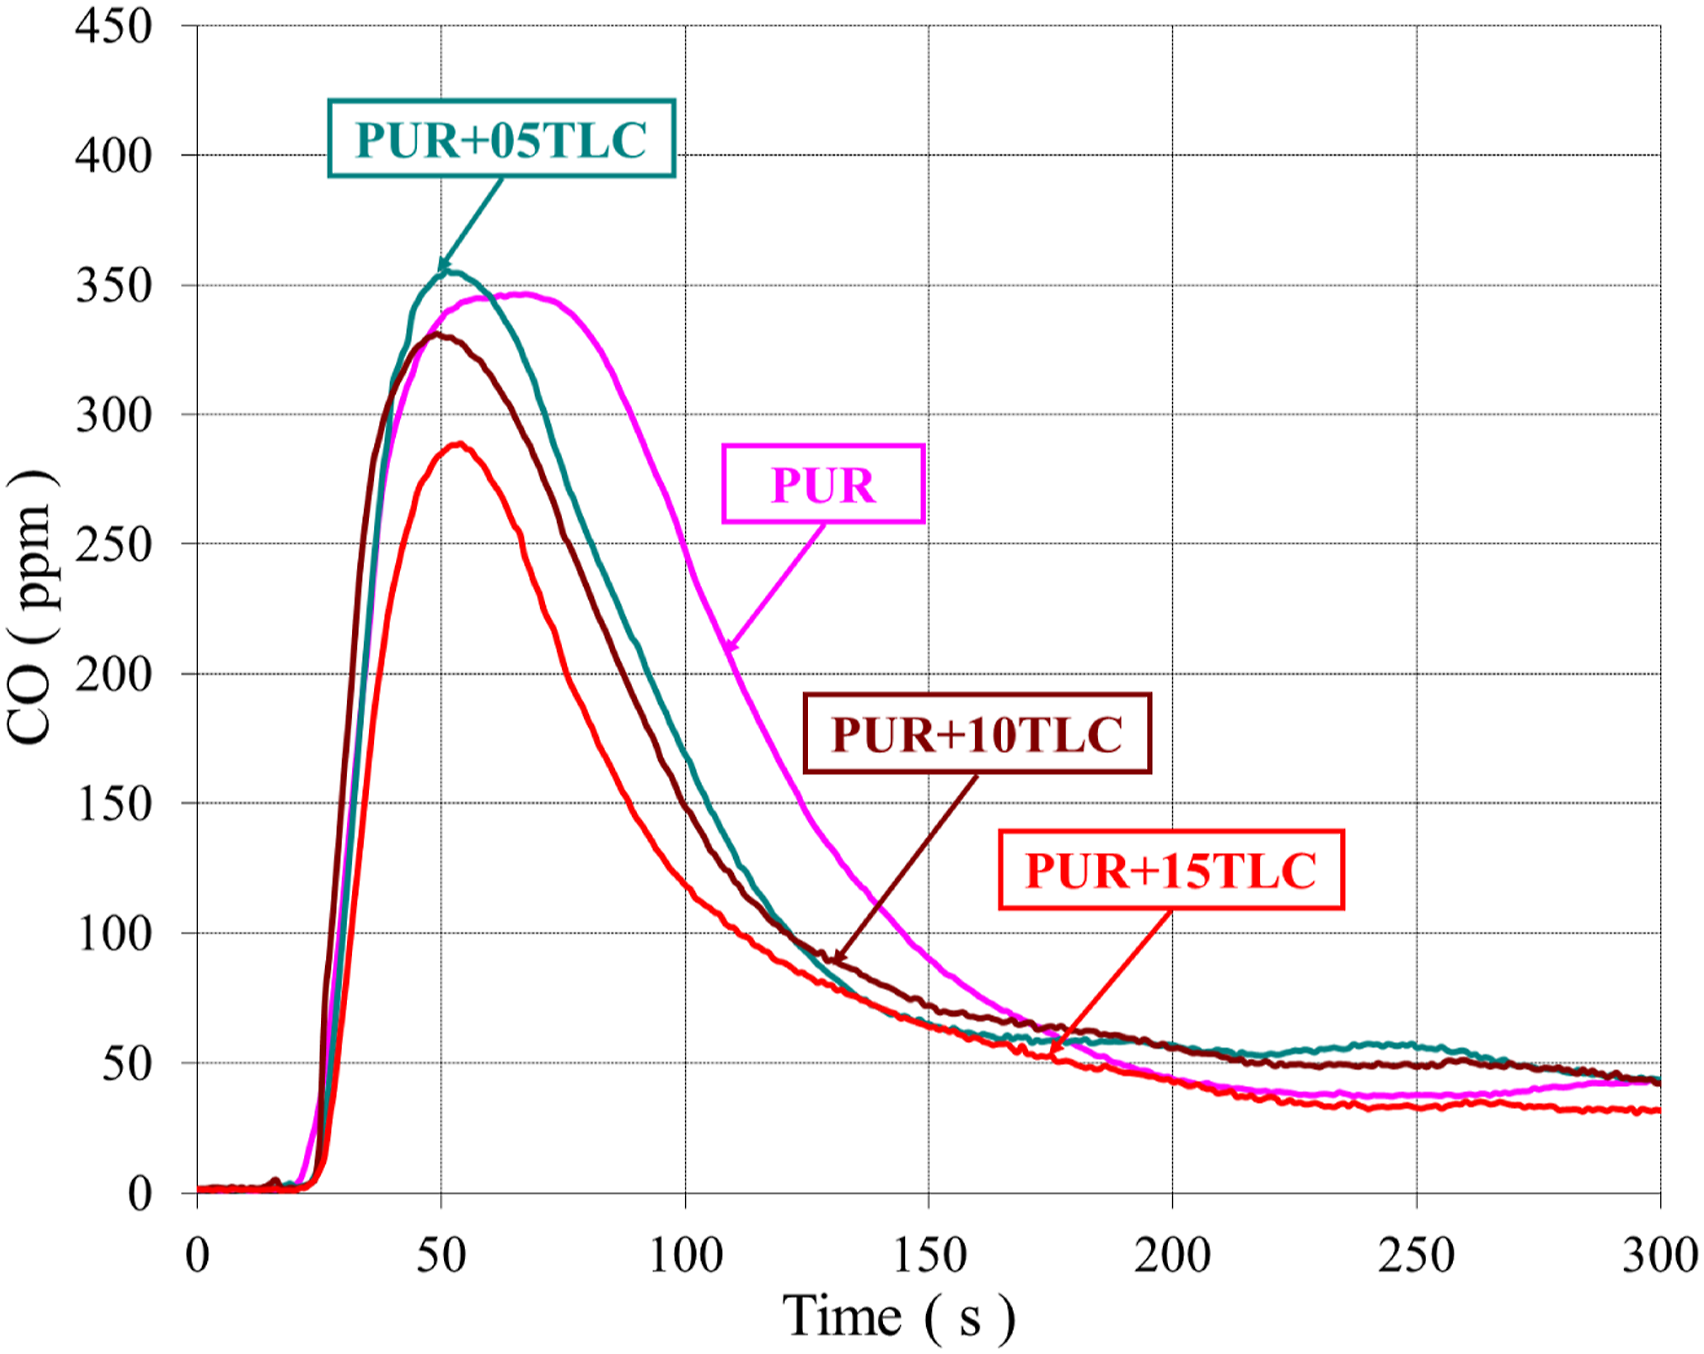
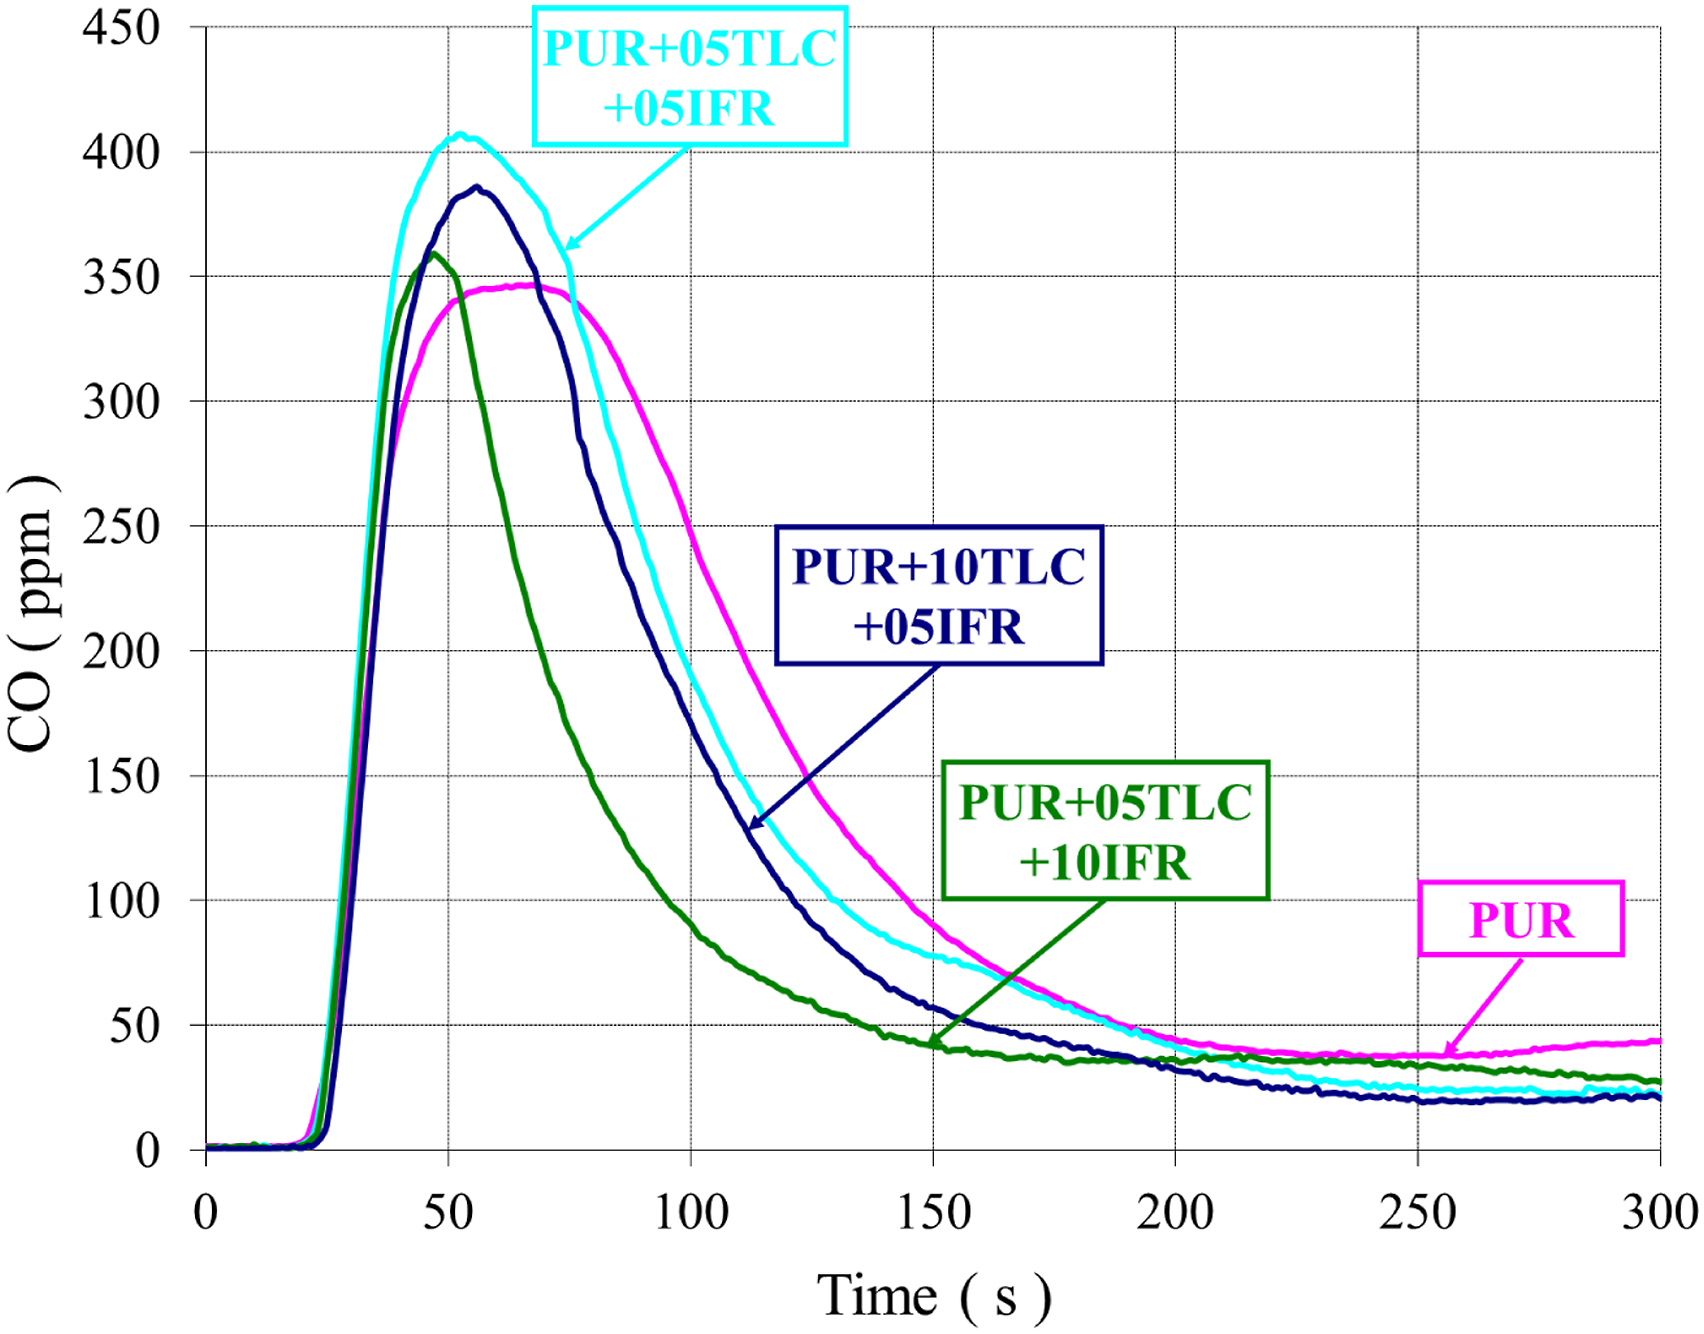
CO emissions decreased gradually with the increasing of TLC content in the foam. However, the peak value of CO emissions increased with the addition TLC/IFR, but later CO values sharply decreased below those of PUR. This may be explained with the early decomposition of IFR and then generation of the char layer. 29
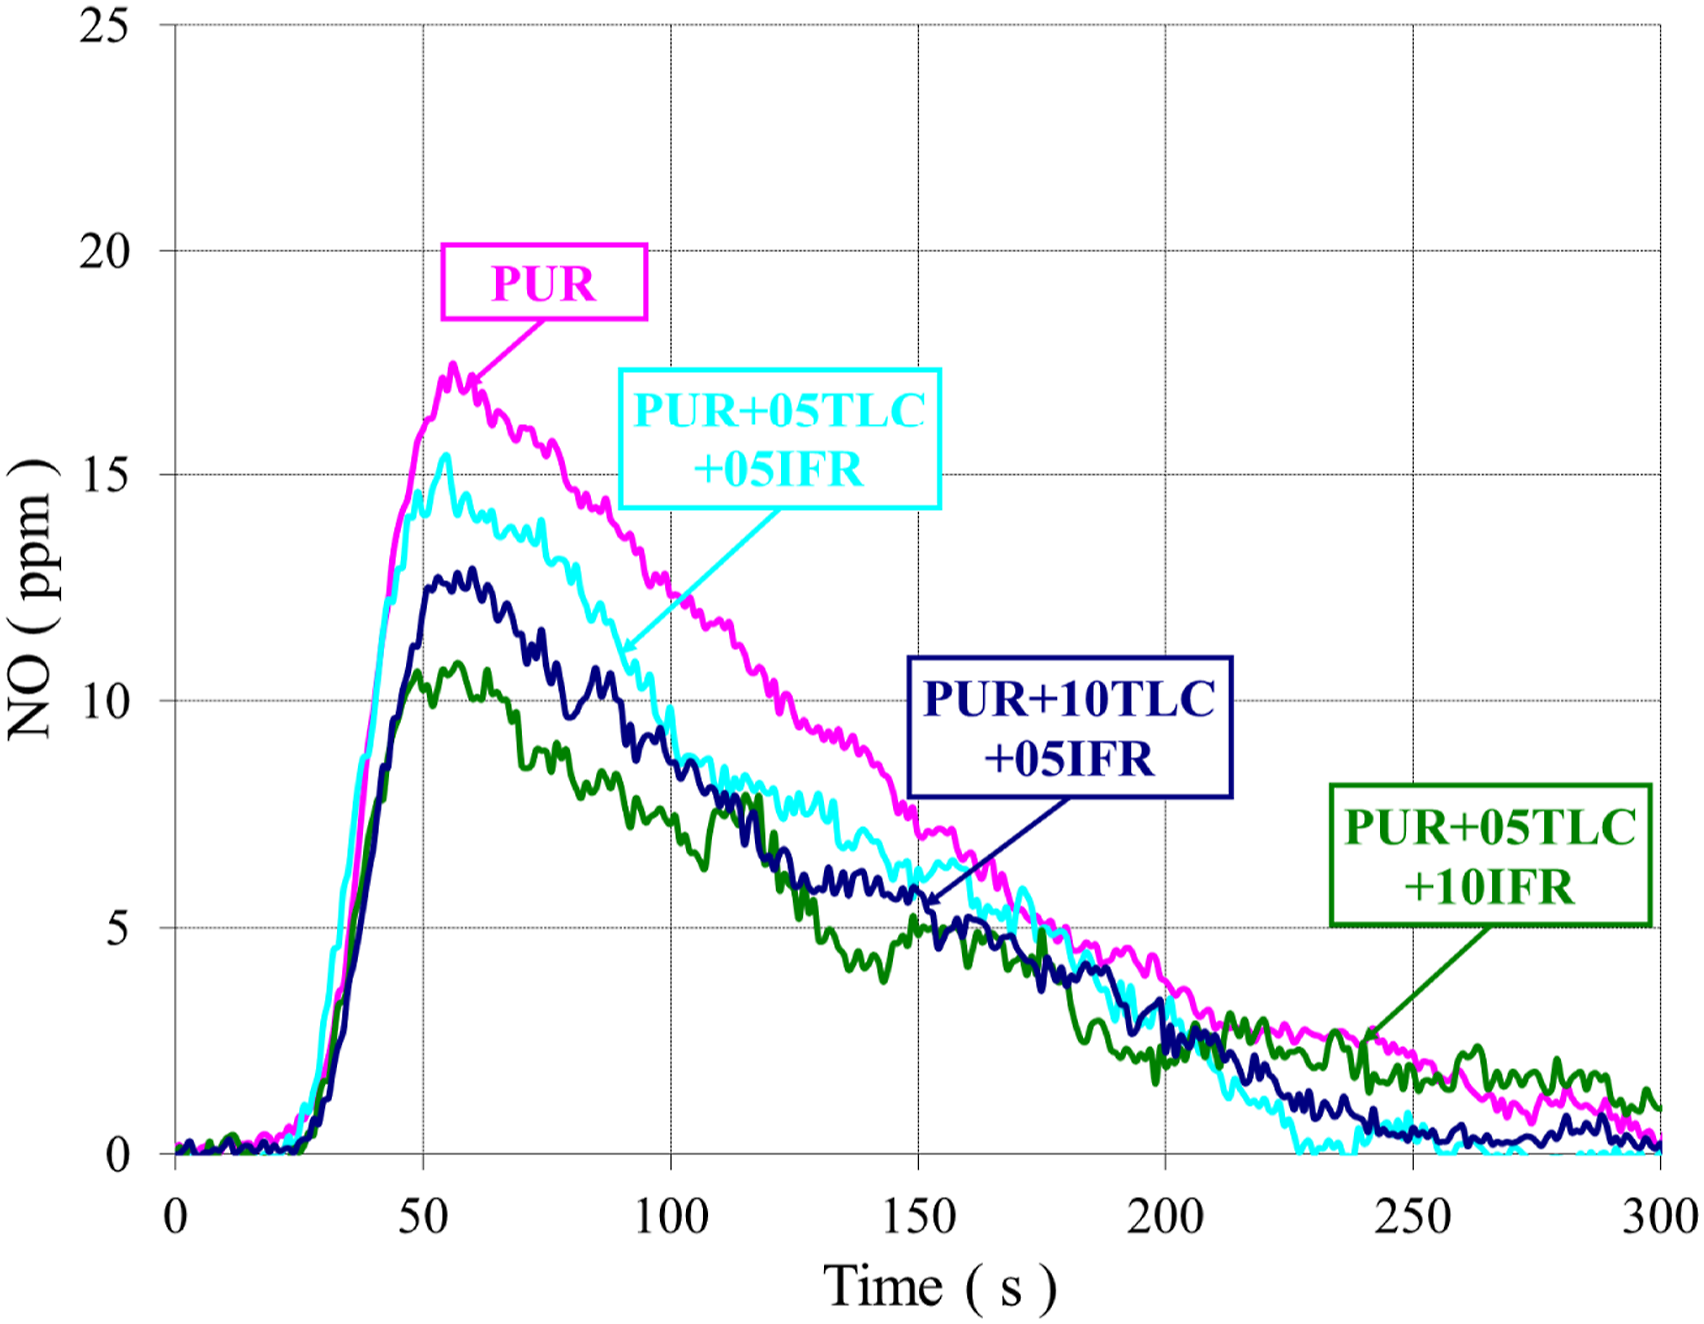
NO emission from the burning of polymers mainly depends on two parameters. The first is the nitrogen content of the polymer and the second is the high temperature generated during the burning. Polyurethane materials contain nitrogen in their structure, so that they can produce HCN during the combustion.
86
The NO emissions of PUR/TLC and PUR/TLC/IFR are shown in Figures 17 and 18, respectively. Adding TLC into the foam did not change the NO emission values significantly, but additions of TLC and IFR together into the foam decreased the NO emission values. Decreasing values of NO emissions can be explained with the decreasing the raw material of polyurethane content with the addition of fillers and lower HRR values. The NO emissions of PUR, and PUR/TLC. The NO emissions of PUR, and PUR/TLC/IFR.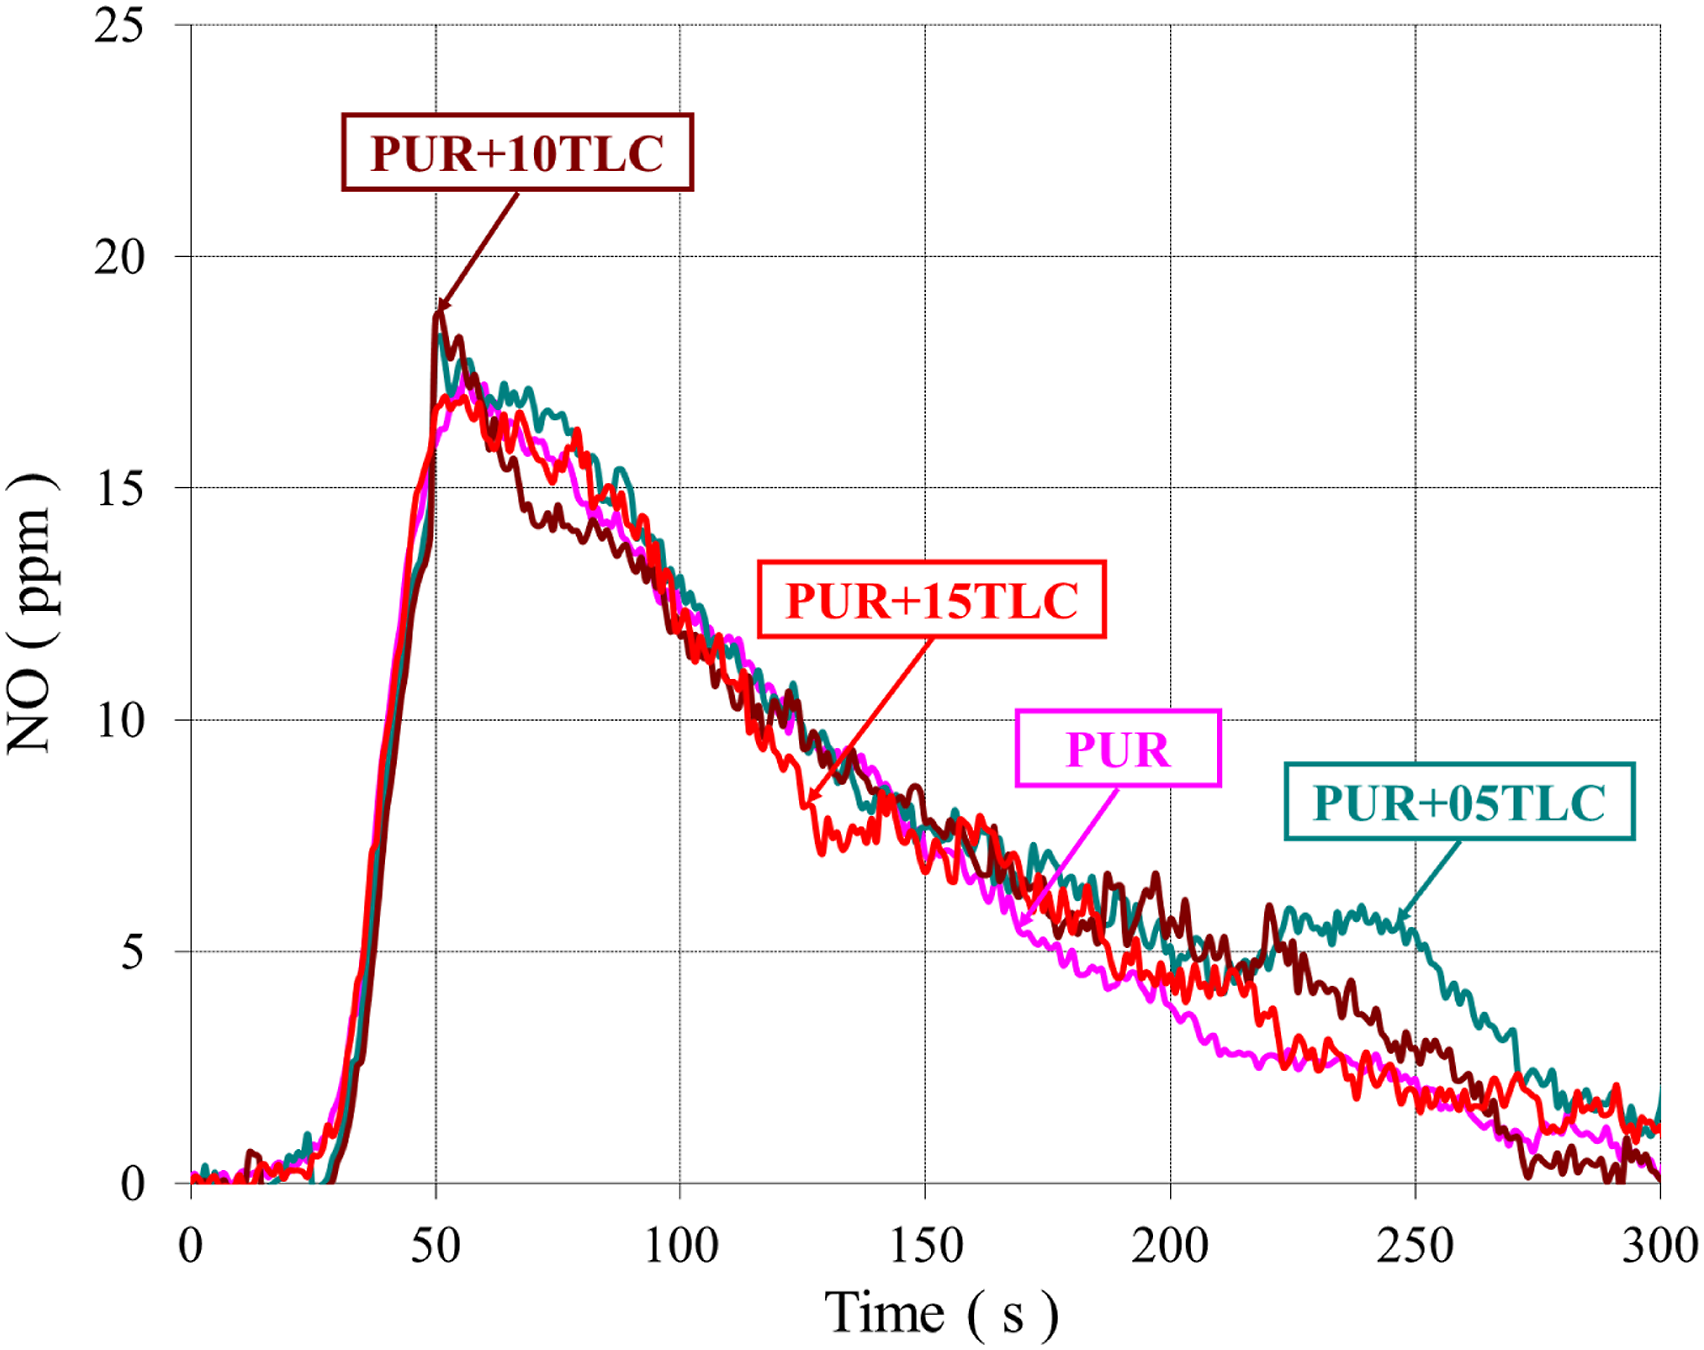
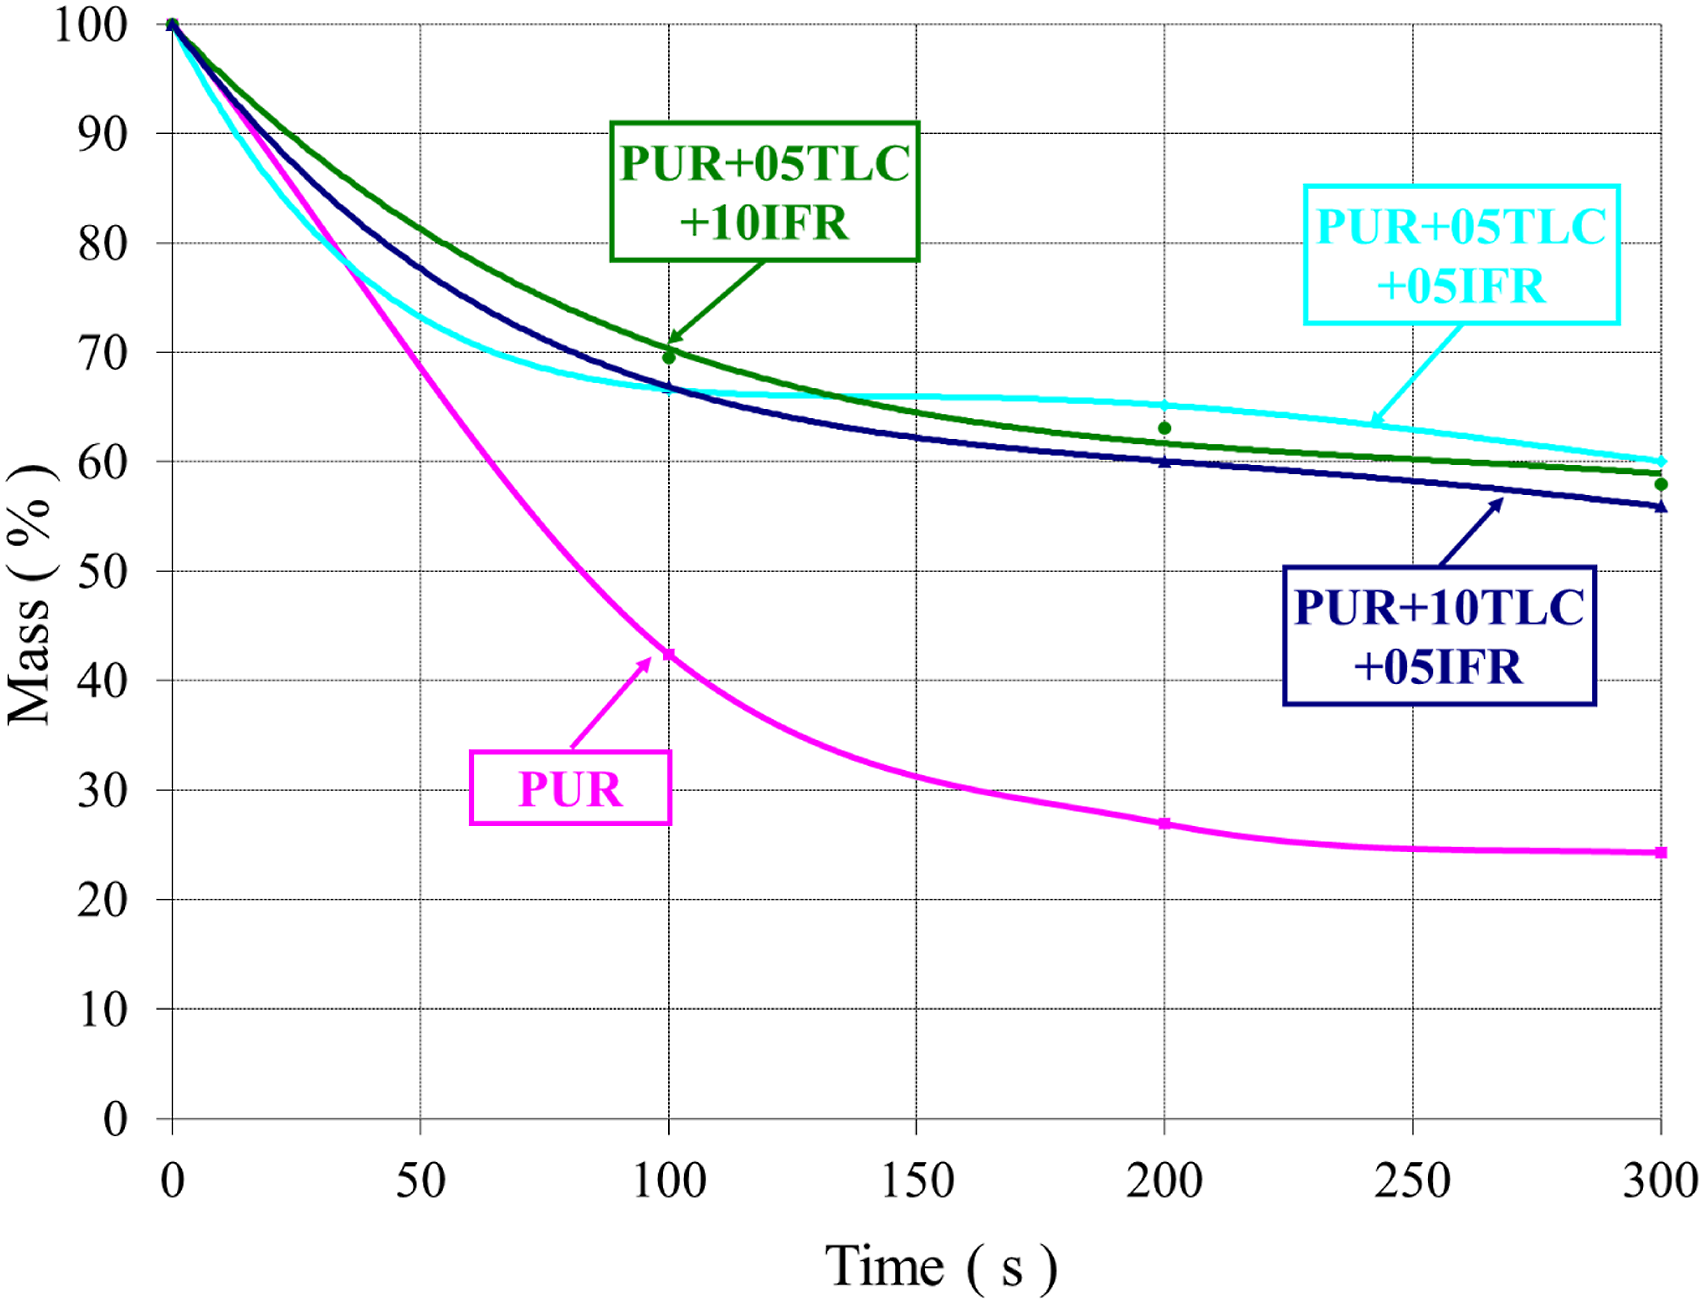
Figures 19 and 20 represent the mass loss by time in the cone calorimeter tests for PUR/TLC and PUR/TLC/IFR composites, respectively. Obviously, it can be seen that there exists a great difference in the mass losses of PUR and the other composites. The mass loss curves sharply decreased in 100 s for all samples. This period can be explained with the highest values of HRR curves. The residue of PUR was about 24.5%. The corresponding values of PUR+15TLC and PUR+5TLC+10IFR were around 60% in 300 s. The mass loss by time of PUR and PUR/TLC. The mass loss by time of PUR and PUR/TLC/IFR.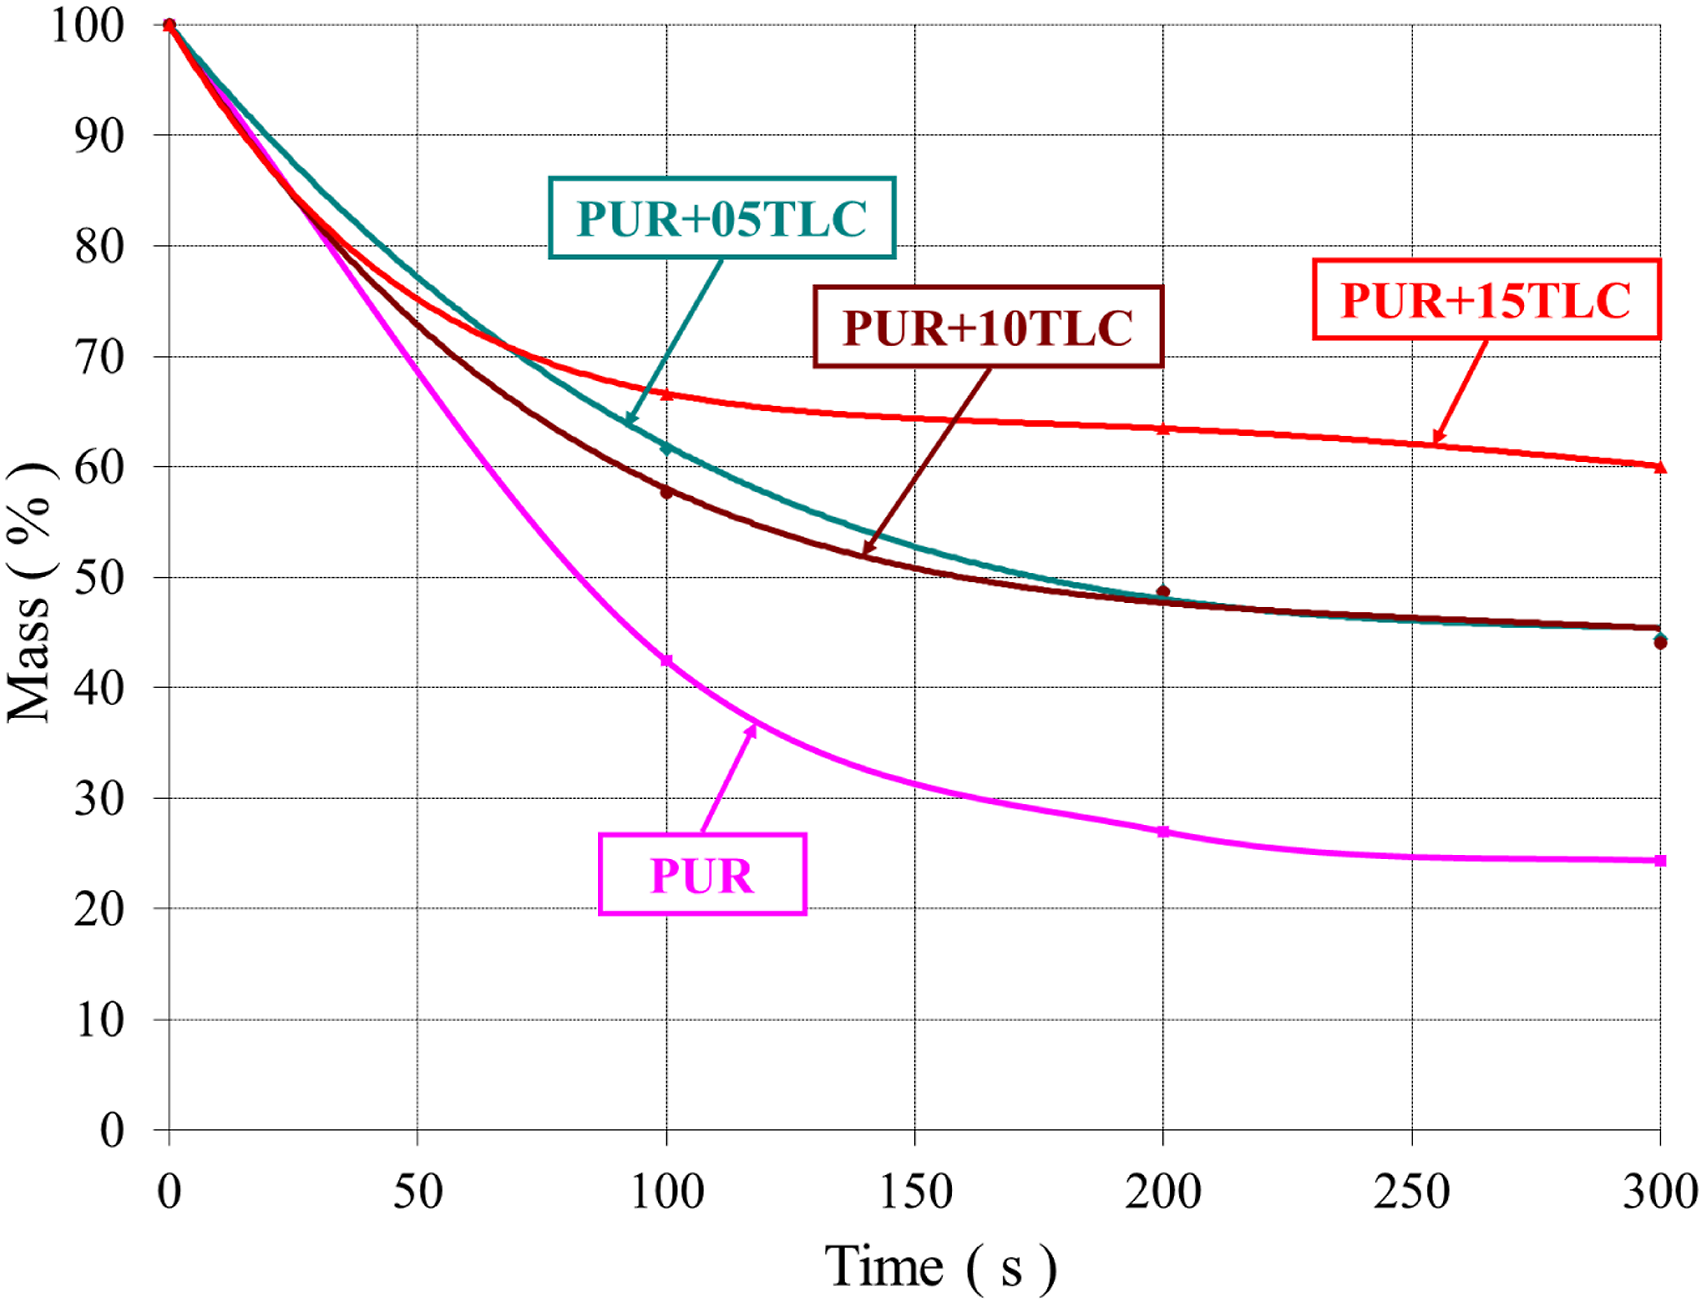
Compressive strength
The effects of TLC and TLC/IFR additions on compressive strength were shown in Figure 21. Increasing the amount of TLC concentration resulted in a dramatic reduction in the compressive strength. This reduction may be explained by the size of the particles. Talc particles lie between the cell walls and these walls can be ruptured with the big sized particles.
71
Compressive strength value of PUR material was 209.5 kPa, and it decreased to 108.25 kPa with the addition of 15 wt % TLC. The maximum decrease was obtained for 5 wt % TLC and 10 wt % IFR addition (97.25 kPa). However, this value is above the acceptable level in many applications. Compressive strengths of PUR/TLC and PUR/TLC/IFR.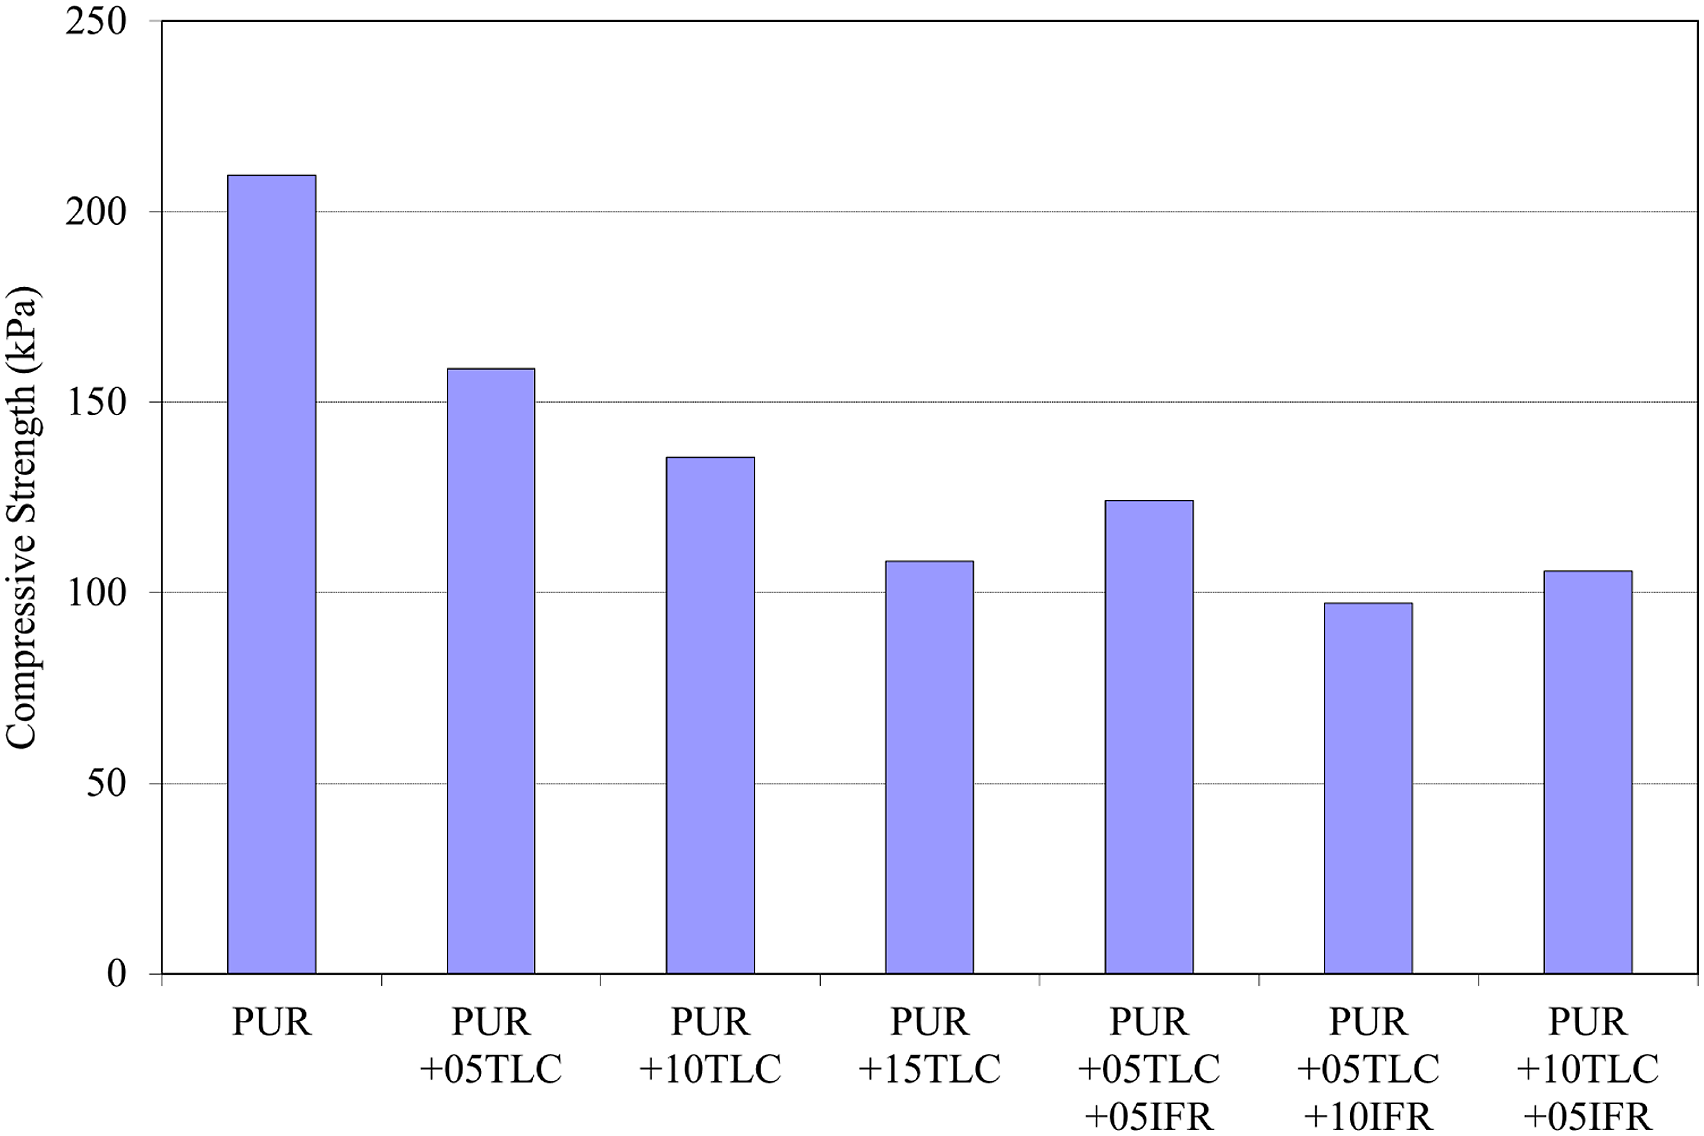
Conclusions
The purpose of the current study was to determine the thermal, the burning and the mechanical characteristics of rigid polyurethane foams incorporated with the talc (TLC) and the intumescent flame retardant (IFR). For these purposes, the cone calorimeter tests, the thermogravimetric analyses, the UL94 tests, the thermal conductivity measurements, the compressive tests were performed. The findings of the investigation can be summarized as follows: - The decomposition processes of APP, PER and TLC were determined one by one. It was determined that TLC has the highest thermal resistance compared to APP and PER. PER was completely decomposed, the amounts of the residues were about 30% and 94% for APP and TLC at the end of the decomposition processes, respectively. - Thermal resistances of PUR were increased with the increasing of amount of TLC. The residue at the end of the decomposition process increased approximately 75% for 15wt % TLC addition when compared to PUR. The maximum decomposition temperature increased approximately 5°C and the maximum decomposition rate decreased approximately 17% for the same sample. - The usage of both TLC and IFR generated good synergistic effect and significantly enhanced the thermal behaviors of the foams. The residues at 800°C increased about 70.0% and 71.3% for PUR+5TLC+10 IFR and PUR+10TLC+05IFR, respectively, when compared to PUR. The minimum decomposition rate for the second stage was obtained as 13.9%/min for PUR+05TLC+10IFR. - Thermal conductivity coefficients of the foam slightly increased with TLC and TLC/IFR additions. - The flammability resistances of the samples were investigated with UL94 tests and it was found that additions of TLC and IFR resulted in better resistances. - The maximum decreases in THRR and AHRR values (approximately 32% reduction) were obtained with 5% TLC/10% IFR addition. - TLC/IFR additions increased the mass ratios of the residues up to 60% after the cone calorimeter tests. - Smoke generation decreased with both TLC and TLC/IFR additions. CO production of TLC added PUR was lower than PUR, meanwhile it was increased first and then decreased for TLC/IFR addition. The NO emissions were significantly decreased for TLC/IFR addition. - The compressive strength decreased with TLC and TLC/IFR additions. But the compressive strength values of the composites were above the acceptable level in many real life applications.
Footnotes
Acknowledgements
The authors would like to thank Pamukkale University for supporting this study under Project Contract No.2014FBE026. Also, the authors would like to thank The Scientific and Technological Research Council of Turkey (TUBITAK) for providing the cone calorimeter under Project Contract No. 108T246.
Declaration of conflicting interests
The author(s) declared no potential conflicts of interest with respect to the research, authorship, and/or publication of this article.
Funding
The author(s) received no financial support for the research, authorship, and/or publication of this article.