
Abstract
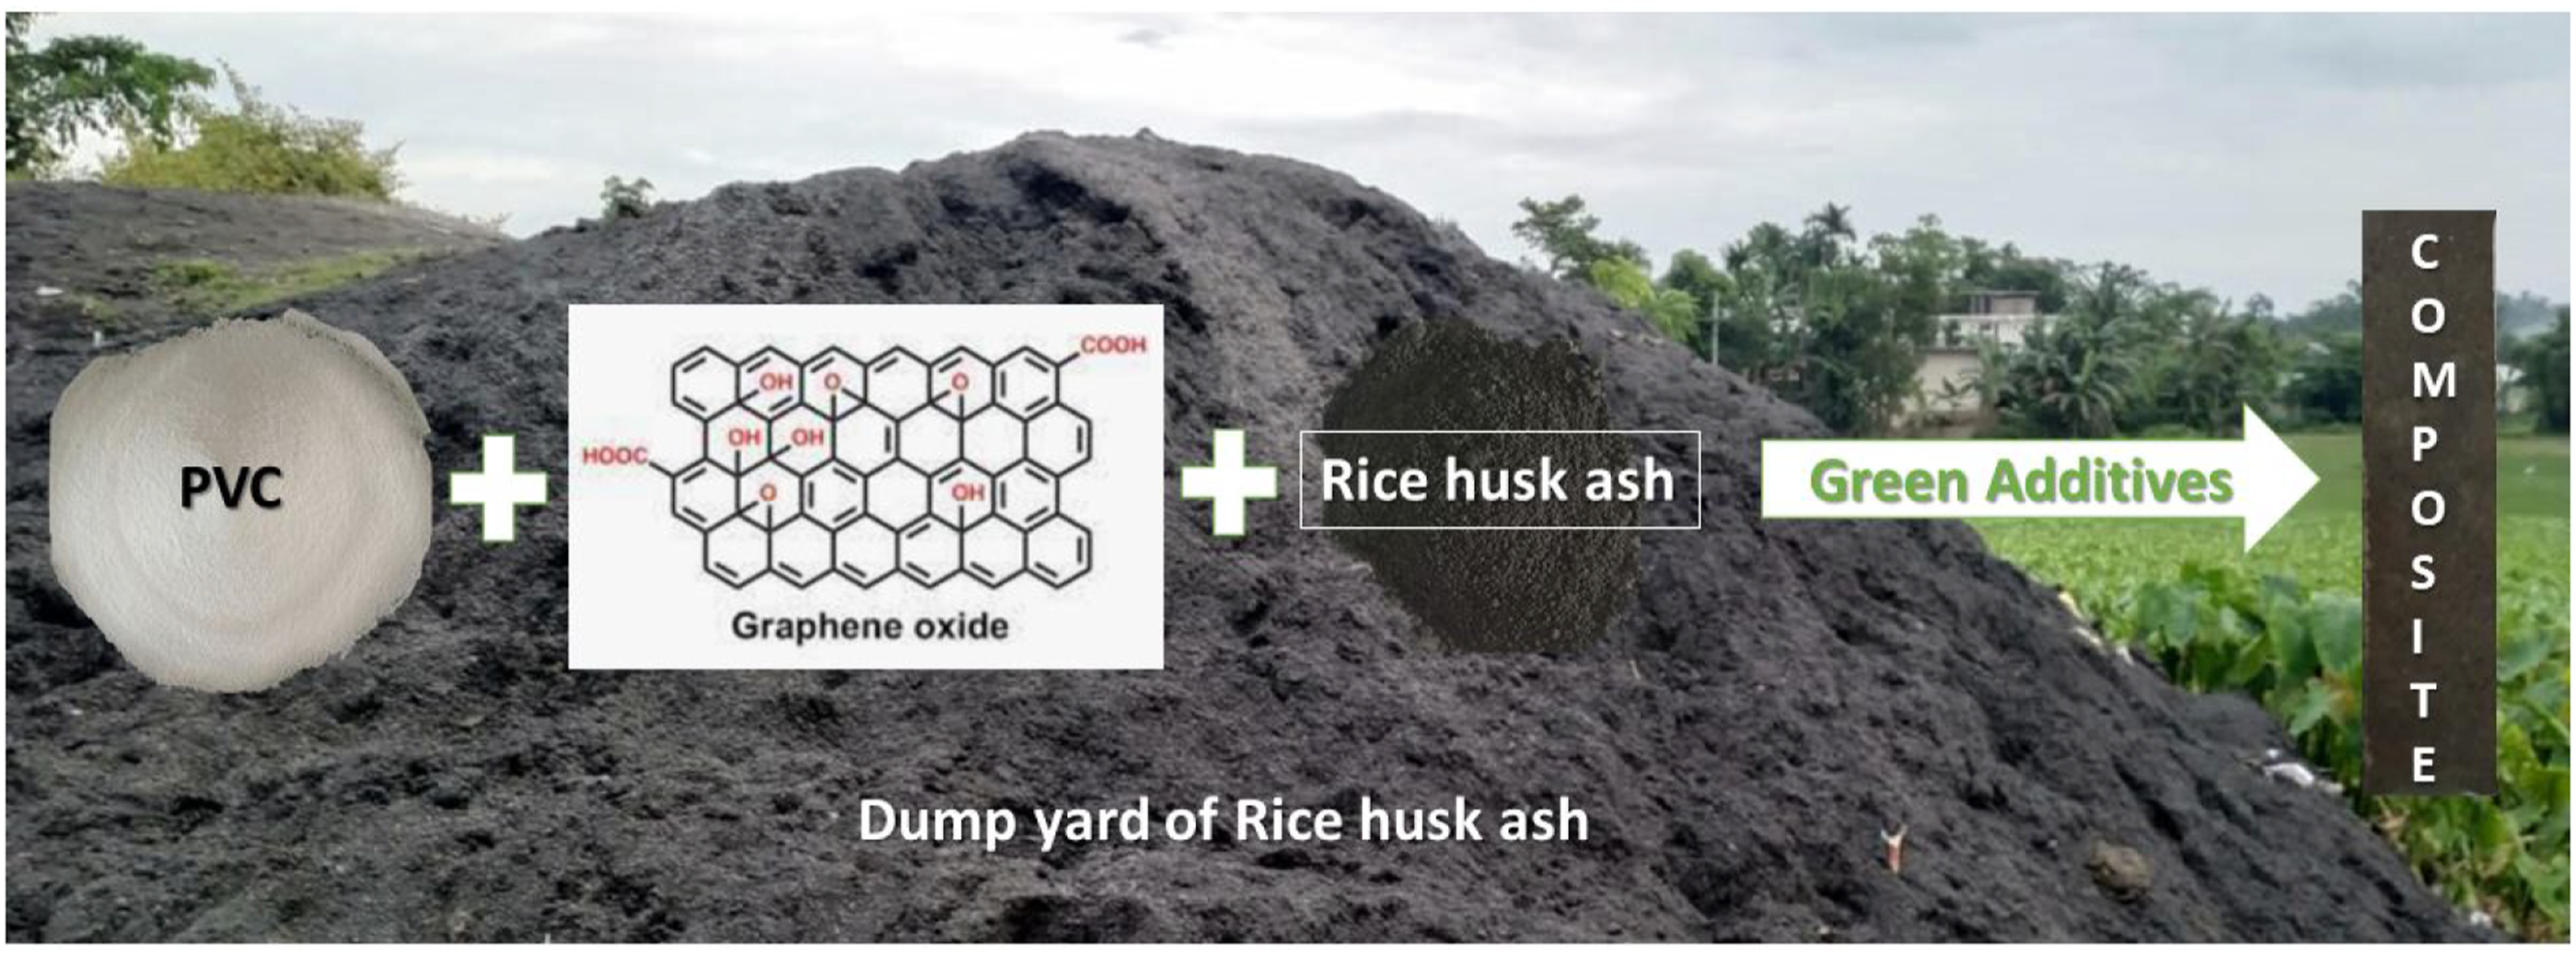
In this study, a biobased composite utilizing waste rice husk ash (RHA) and polyvinyl chloride in a 1:1 ratio was prepared. The composites were prepared in a solventless, green pathway of melt blending using green additives such as tannic acid-calcium oxide (TA–CaO) adduct as a heat stabilizer and epoxidized soybean oil (ESO) as green compatibilizer. The addition of graphene oxide (GO) nanomaterial into the composite improved the thermal, mechanical, chemical and flame resistance properties of the composite. Composite reinforced with 0.5 phr GO, improved the tensile, flexural and, shore D hardness by 34, 37, 14%, respectively. The homogeneous dispersion of the GO layer in reinforced composite was evident from the transmission electron microscopy (TEM) study. Composites with GO as nano reinforcement showed relatively higher flame retardancy due to the synergistic effect of GO and silicon present in RHA. The composite with 0.5 phr loading of GO showed overall improvement in properties among the composites. It is expected that the incorporation of waste RHA along with other renewable bioresource materials will improve biodegradability and decrease the production cost of the composite.
Introduction
Rice husk ash (RHA) is one of the major agricultural wastes generated in south-east Asia. A huge quantity of this ash is generated in local sweet making industries and brick industries. Although it is used as a fuel in steam boilers mostly, it remains a bio-waste material. One of the ways to make it value-added is by forming composite with polymers. 1 Several kinds of literature were available about the use of rice husk as filler in composite.2–4 Rice husk was successfully utilized by António et al. 5 for the development of the composite board. RHA, one of the waste biomass produced from rice husk, can be effectively utilized for different purposes due to the presence of a high amount of silica in it. 6 Literature about the use of RHA as a source of silicon has been reported.7,8 Due to the presence of a high percentage of Silicon (around 89%), the composite prepared by using RHA normally improves the properties such as mechanical, thermal, flame retardancy etc. of the composite 9–11 and also it encourages waste management.12–14
The recent trend focuses on maximizing the utilization of green additives for making composites.15–19 In this context, vegetable oil-based polymer composite has immense potential.20,21 Epoxidized Soybean oil (ESO) is one of the most widely used vegetable oil which finds huge application as a source of natural resin in polymeric composite.22–24 ESO has also been used as a plasticizer and stabilizer in different composites.25–27 ESO as a thermosetting resin is more popular as these composites show good mechanical properties .28,29 Due to the presence of a long aliphatic chain and epoxy group, ESO may also be utilized as a compatibilizer. 30 Different organic/inorganic components and their combination have been used as a thermal stabilizer with PVC.31–34 But bio-based stabilizers are always preferred by researchers due to their biodegradability nature. 35 Literature cited the use of Tannic Acid/calcium oxide adduct as a bio-based heat stabilizer (HS) in preventing the dehydrochlorination of PVC. 36
“Biodegradability” is one of the most significant areas in polymer composite research. An increase in biodegradability decreases pollution created by polymers/resins and thus contributes mostly towards a sustainable environment.37,38 Normally, the composites containing synthetic polymer matrix show an overall improvement in properties compared to the natural polymer-based composites. PVC has been widely used as a polymer matrix in composite due to its various features such as easy molding, good mechanical properties, high hardness and excellent fire resistance.39,40 The incorporation of materials based on natural recourses generally enhances biodegradability but deteriorates the other properties.41,42 A judicial blend of natural and synthetic material may improve the overall properties of the composite.
Till now several PVC based composites have been made and their properties have been extensively studied. Most of the available literature has addressed the use of synthetic additives. But most of the studies cited the use of more than 50 (weight %) synthetic polymers in the composite.
In this study, we have tried to decrease the synthetic part in the composite by reducing PVC to 50% and incorporating an equal amount of RHA as bio filler. Green additives such as ESO as compatibilizer as well as plasticizer and tannic acid/calcium oxide complex as HSs have been incorporated into PVC and RHA to prepare the composite. Finally, modified graphene oxide (GO) as a nanomaterial has been introduced in the system and various properties of the composites have been studied. Incorporating waste RHA with other renewable bioresources would boost biodegradability while decreasing composite production costs.
Experimental
Materials and method
RHA was collected from the dump yard of a local bakery, Assam. The polymer used was polyvinyl chloride (PVC) which was purchased from Finolex Industries Ltd (Pune, India) with grade: SPVC FS: 6701. Tannic acid and calcium oxide used as heat stabilizers were purchased from MERCK (India). Epoxidized soybean oil was bought from M/S Agarwal Organics (Indore), India. Graphite was procured from Sigma Aldrich, USA. Potassium permanganate, hydrochloric acid, and sulfuric acid were supplied by MERCK (India). Hydrogen peroxide, sodium Hydroxide (extra pure) were obtained from SRL (India).
Preparation of RHA
The RHA was collected, dried correctly, ground, and then sieved through a 50-mesh sieve. It is then kept in a desiccator at room temperature for further use.
Preparation of tannic acid–calcium oxide (TA–CaO) complex
10 g of tannic acid were dissolved in 100 mL distilled water at around 60°C with continuous stirring. The pure and filtered saturated aqueous solution of calcium oxide was added slowly to the tannic acid solution under stirring conditions maintaining a pH around 11.0. The reaction was allowed to run for 2 h. The mixture was then allowed to stand for 24 h. The thick and brown precipitate was detected which was then filtered, washed with excess distilled water till the pH reaches around 7.0 and then dried for 24 h at 60°C. 36
Preparation of GO nanomaterial
A modified Hummer’s technique was used to prepare GO from graphite powder.43,44 1 g of graphite and 0.5 g of sodium nitrate were mixed before adding 23 mL of conc. sulfuric acid. The reaction mixture was then kept in stirring condition for 1 h. After 1 h 3 g of KMnO4 was gradually added to the aforementioned solution maintaining the temperature below 20°C to avoid overheating and explosion. The solution was then kept in stirring at 35°C for 12 h, followed by diluted by adding 500 mL of water under vigorous stirring. To confirm the completion of the reaction with KMnO4, the suspension was further treated with 5 mL of 30% (v/v) aqueous H2O2 solution. The resulting mixture was washed with dil. HCl and H2O, respectively, filtered and dried.
Preparation of RHA PVC composite
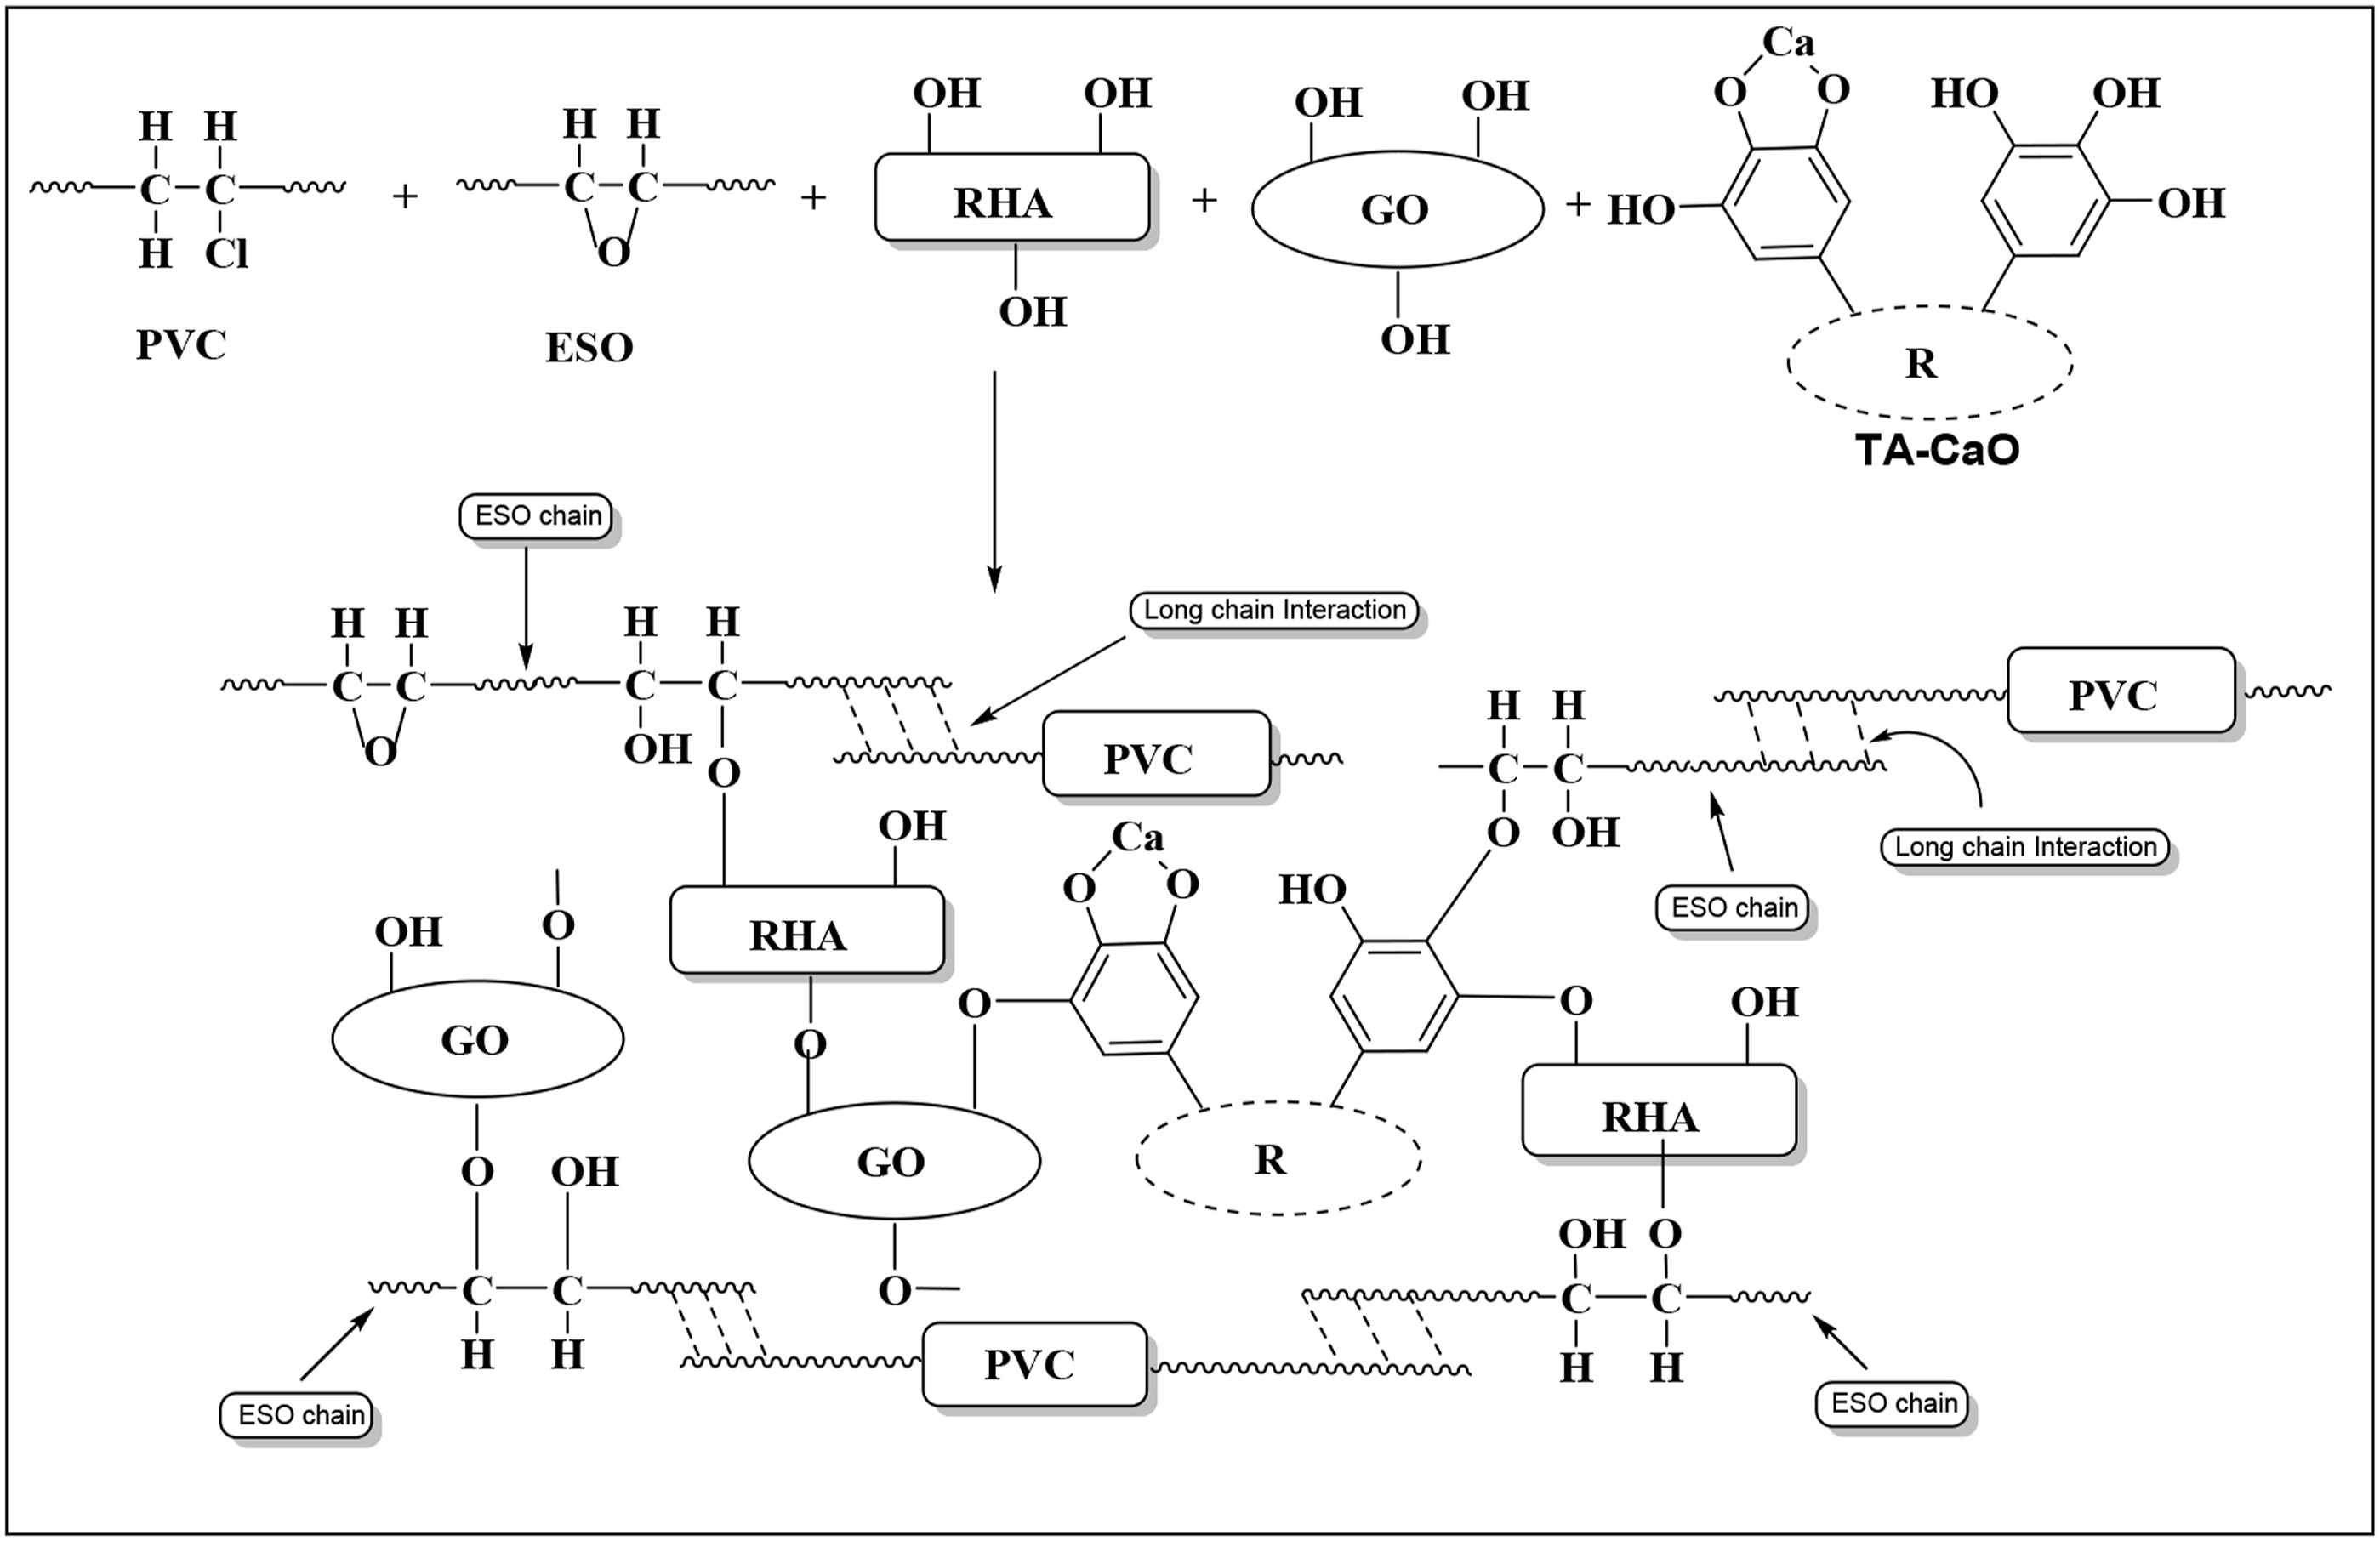
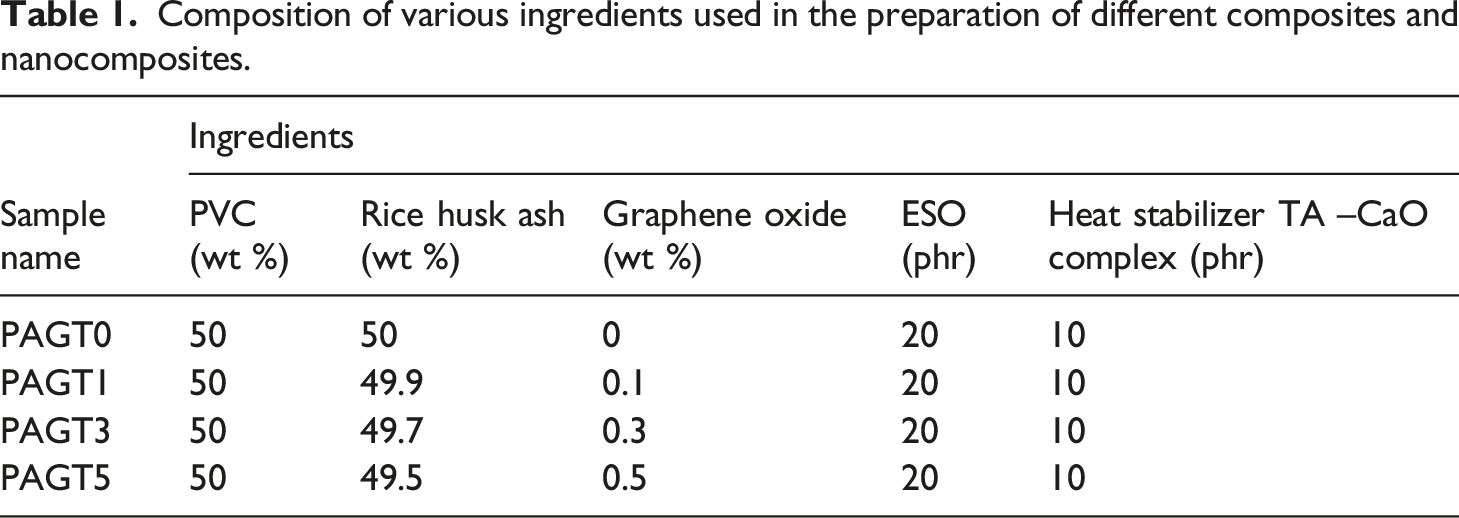
To prepare the composites, PVC and RHA were taken in a 1:1 ratio. Here PVC is polymer whereas RHA acts as bio-filler. Epoxidized soybean oil (ESO) was used here as bio-compatibilizer and Tannic acid–Calcium oxide adduct was used as bio-based HS. The components PVC, RHA, HS, ESO, and GO were kept inside the Brabender Plasticorder for melt mixing. The final blending took place at 185°C for 5 min at 70–75 r/min screw speed. The mixture was then compressed for 10 min at 190°C at a pressure of 5–6 tons in a compression molding machine (Santac, China). Scheme 1 and 2 show the probable structure of Tannic acid–CaO adduct and cross-linking structure of the composite, respectively. The composition of the various prepared composite is presented in Table 1. Cross linking structure of the components inside polymer matrix. Probable structure of Tannic acid–CaO adduct. Cross linking structure of the components inside polymer matrix. Cross-linking structure of the composite. Composition of various ingredients used in the preparation of different composites and nanocomposites.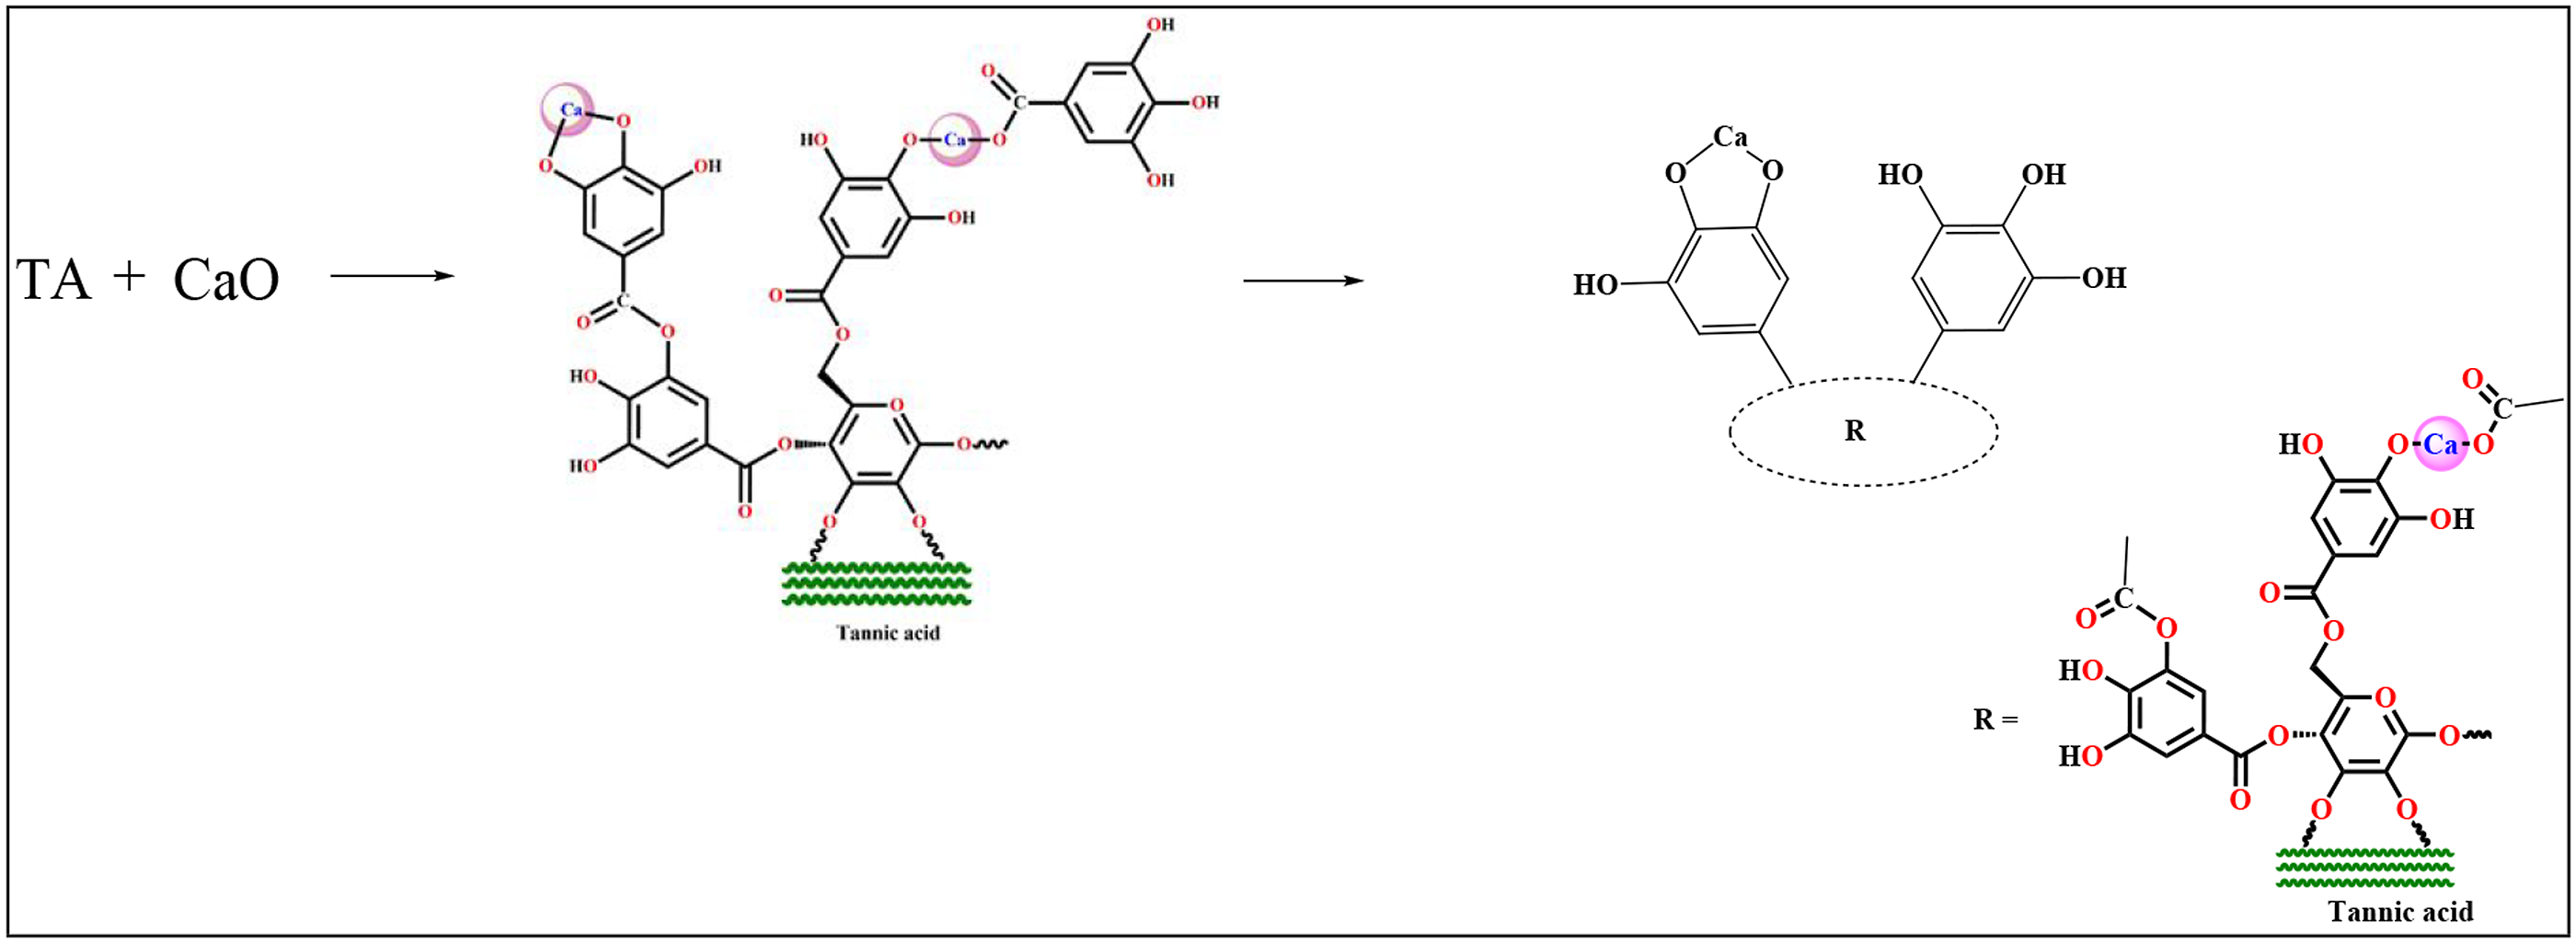
Characterizations
Fourier Transform Infrared Spectroscopy studies
The Fourier Transform Infrared Spectroscopy (FTIR) spectra were recorded for RHA, GO, and composites with or without GO in FTIR spectrophotometer (PerkinElmer, Frontier MIR-FIR) using KBr pellet over the wavenumber range of 400–4000 cm−1.
X-ray diffraction (XRD) studies
The delamination and distribution of GO within the composite were assessed by X-ray diffractometry. The analysis was carried out in an X-ray diffractometer D8 FOCUS (Bruker Axs, Germany) using radiation Cu Kα at a scanning rate of 1°/min with an angle ranging from 5 to 40°.
Scanning electron microscopy (SEM)
The morphology and compatibility characteristics of composites were investigated using a scanning electron microscope (JEOL JSM-6390LV) at an elevated voltage of 5–10 kv. The fractured surfaces of samples were sputtered with platinum and placed on a brass holder for this investigation.
Transmission electron microscopy (TEM)
The TEM study of the composite was conducted out using JEM-2010 (JEOL, Japan) equipment with a slow-scan CCD camera and a 200 kV accelerating voltage.
Thermal property
Thermal properties of RHA, PVC, and GO along with the different composite were studied in a thermogravimetric analyzer machine (TGA) (TGA-50, Shimadzu, Japan) at a heating rate of 10°C/min up to 600°C under an atmosphere of nitrogen and maintaining a flow rate at 30 mL/min.
Mechanical property
Flexural and tensile tests for composites were performed at room temperature using a Universal Testing Machine (model H100K-S) from HOUNSEFIELD, England, with a crosshead speed of 2 mm min−1, according to ASTM D-790 and D-638, respectively. The average values were calculated from three samples of each type.
Hardness
The hardness values of the composite were evaluated according to the ASTMD-2240 method with a durometer (model RR12) and represented as shore D hardness.
Chemical resistance test
In order to check the chemical resistivity, polymer composite samples were cut into pieces of 2.5 cm × 0.5 cm × 2.5 cm for the test and were kept immersed in 4% aqueous NaOH solution and 4% aqueous acetic acid solution. Weights of the samples were measured after 0, 1, 3, 6, 12, 24, 48, 60, 72, 96, 120, 144, and 168 h. The percent swelling was calculated by using the equation as given below
Water vapor uptake test
The percentage of water vapor uptake was calculated by putting the samples in a humidity chamber for different periods and maintaining the temperature and relative humidity at 30oC and 65%, respectively
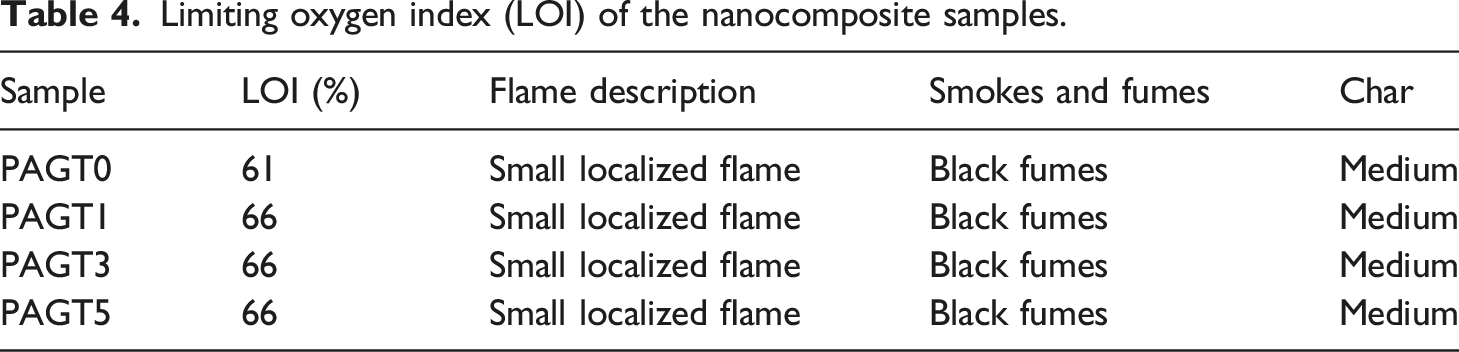
Limiting oxygen index test (LOI)
The flammability of the samples was determined according to the ASTM D-2863 method using a flammability tester (S.C. Dey Co., Kolkata, India). The sample was held vertically in the LOI equipment’ sample holder. For LOI measurement, the sample was burned for at least 30 s at a specific nitrogen/oxygen ratio.
Results and discussion
FTIR
The FTIR spectra of epoxidized soybean oil (ESO), GO, RHA, PVC, TA–CaO mixture are shown in Figure 1. FTIR spectra of (a) ESO, (b) GO, c) RHA, (d) PVC and (e) TA–CaO. FTIR: Fourier Transform Infrared Spectroscopy.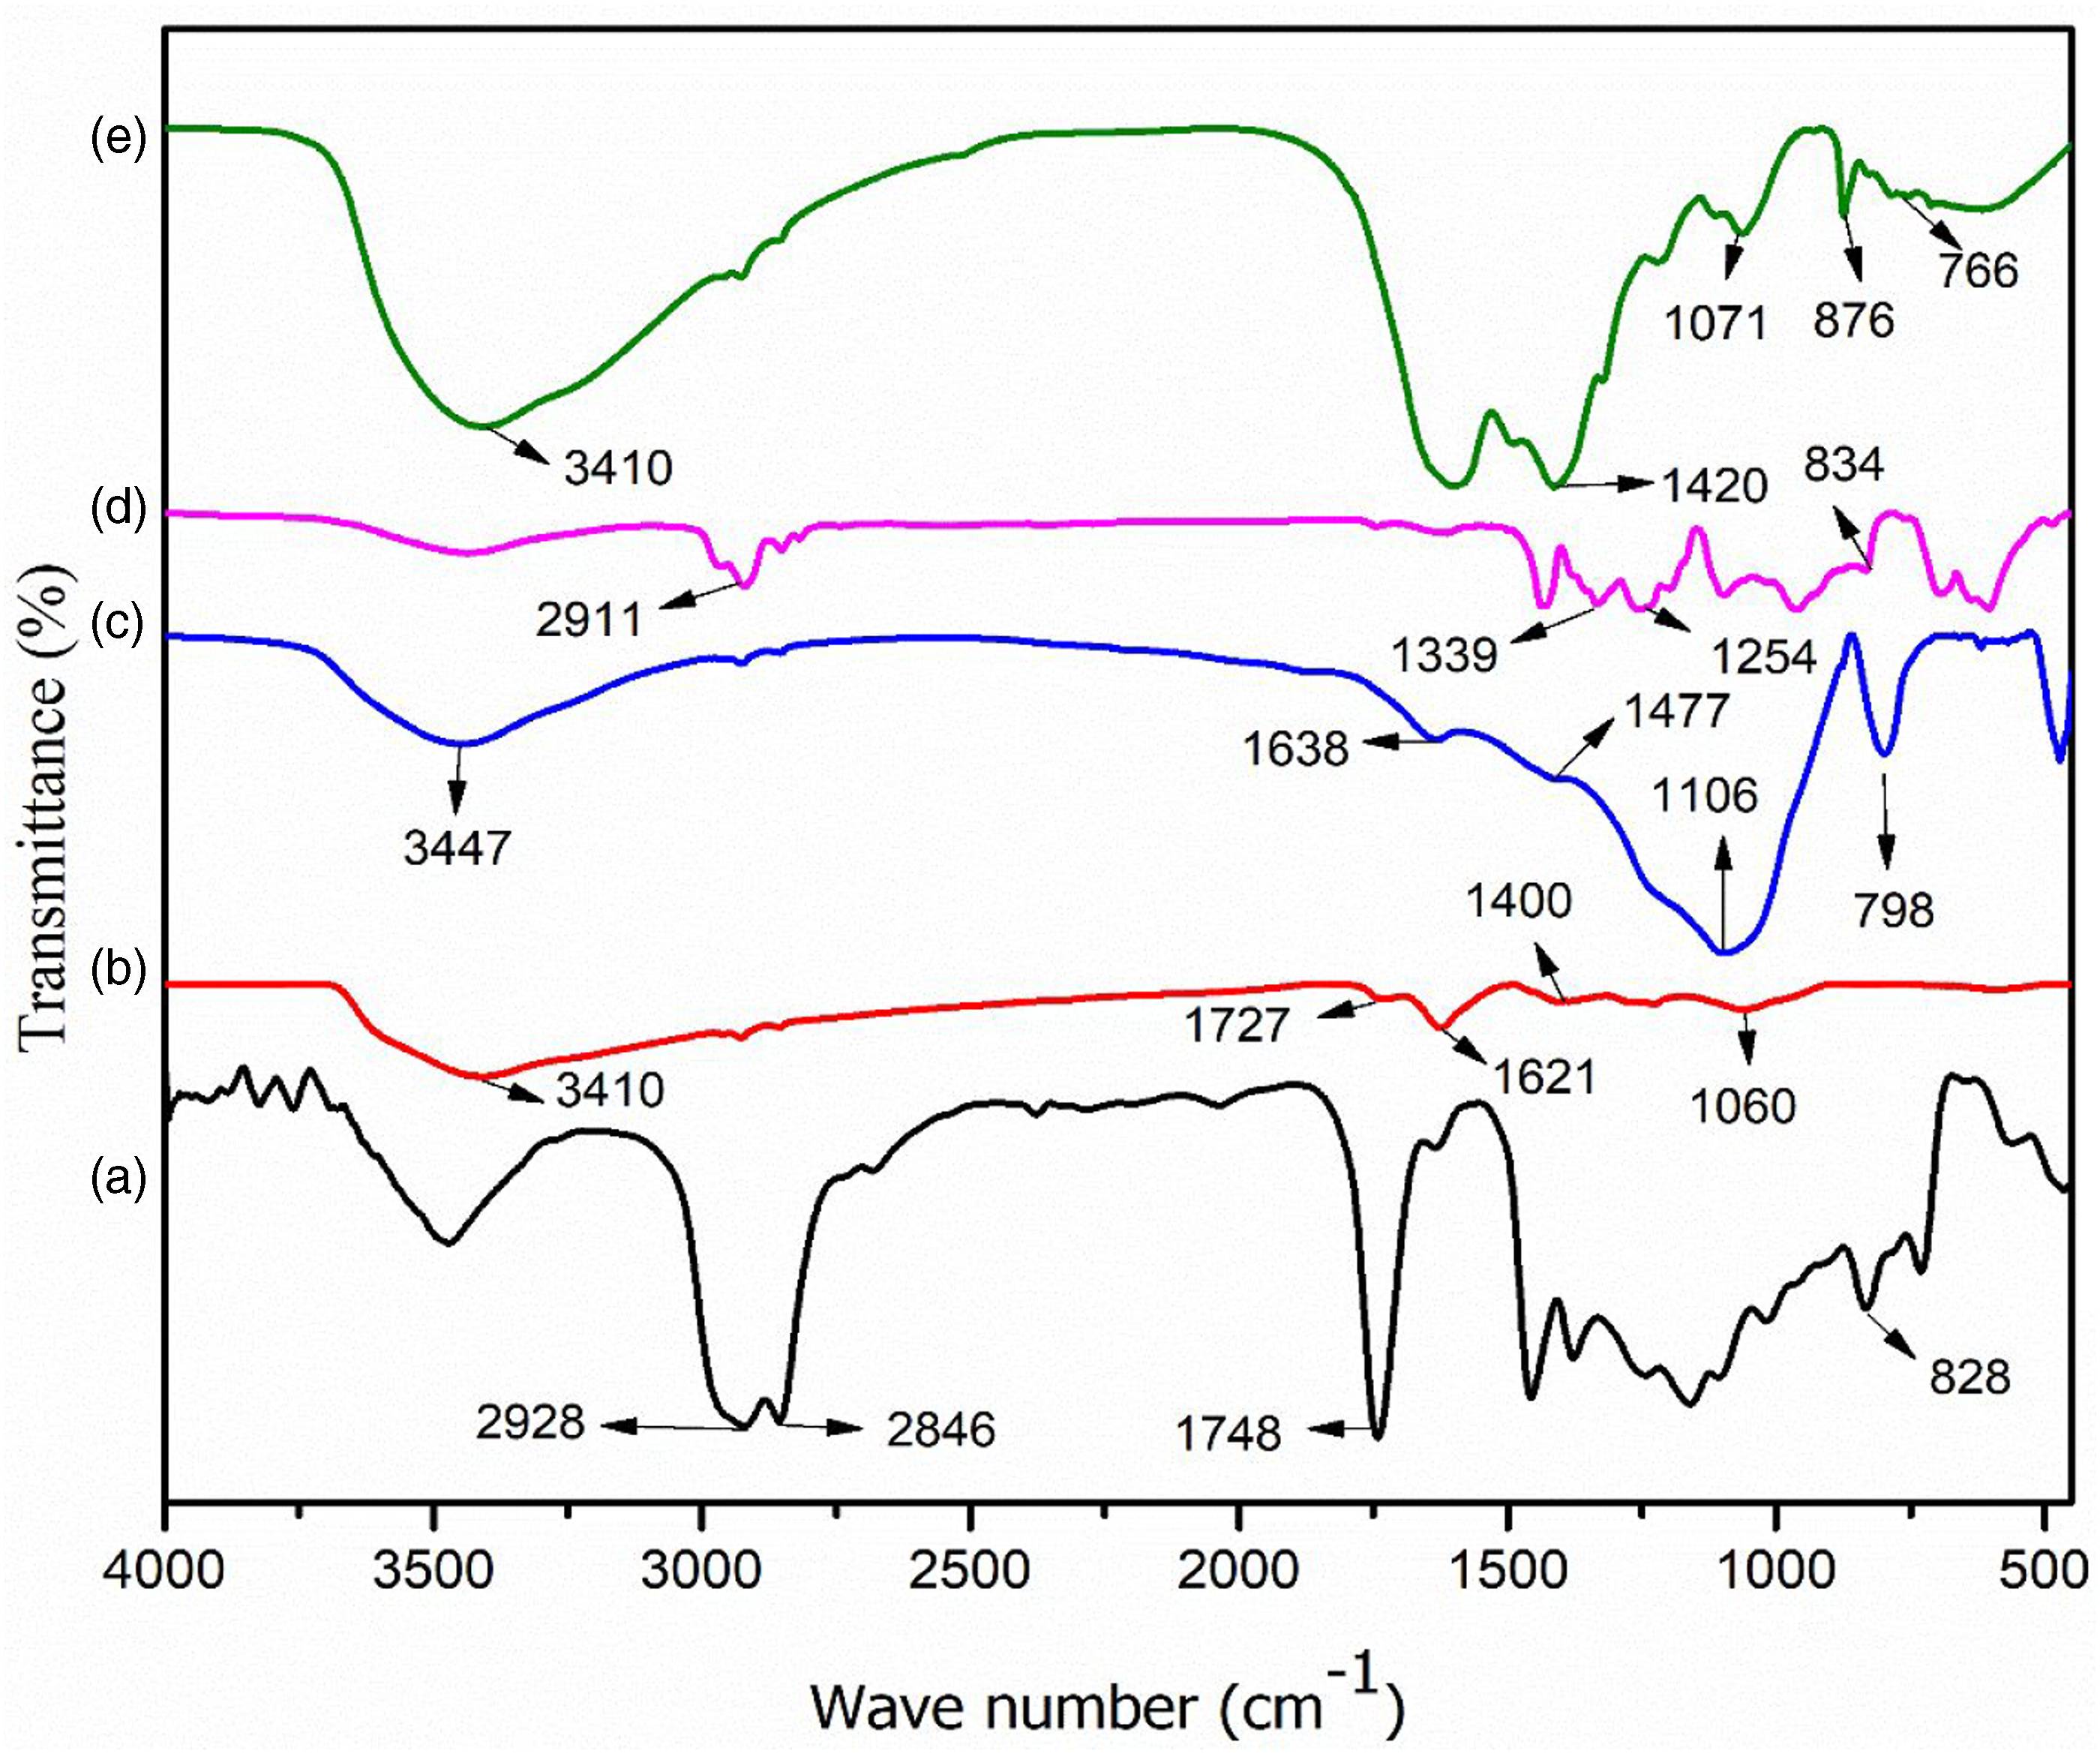
The absorption band near 828 cm−1, typical of the epoxide group was present in ESO (Figure 1(a)). The peak at 1748 cm−1 demonstrates the presence of the carbonyl group -C=O, two strong bands at about 2928 cm−1 and 2846 cm−1 has been assigned to the anti-symmetric and symmetric CH2 stretching vibrations. Figure 1(b) represents the FTIR spectrum of GO. Broadband at 3410 cm−1 depicts a strong stretching mode of the –OH group. The peak at 1727 cm−1 indicates the stretching mode of –C=O while those at 1621 and 1060 cm−1 is for the stretching mode of C=C, –C-O, respectively. The absorption peak at 1400 cm−1 appears due to the bending mode of O-H. In the spectrum of RHA (Figure 1(c)), the peaks at 3447 and 1638 cm−1 are due to the presence of O-H stretching mode and –OH bending, respectively. The bands at 1447, 1106, and 798 cm−1 are assigned for the -C-H bending, C-O strong stretching bond and Si-O symmetric stretching vibration, respectively. In PVC (Figure 1(d)), the absorption bands at 2911 cm−1 for C-H stretching mode, 1339 cm−1 for CH2 deformation mode, 1254 cm−1 for CH-rocking vibration mode and 834 cm−1 for C-Cl stretching are observed. Figure 1© shows the spectrum of TA–CaO. Here the peaks appear at 3410 cm−1 (O-H stretching vibration) and 1420 cm−1 (O-Ca ionic bond). The absorption bands at 1071 cm−1 can be allocated to the -C-O-C bending mode. The peak observed at 876 cm−1 corresponds to out of plane bending of the O-H on the acid functionality in tannic acid. The C-H out-of-plane bending vibration of the phenyl group is observed at 766 cm−1. The probable structure of the TA–CaO complex has been presented in Scheme 1. Initially, CaO present in the solution ionizes to form a calcium cation (Ca2+). Two adjacent phenolic-OH groups of tannic acid are then associated with the Ca2+ through a complexation reaction. The presence of a peak at 1420 cm−1 in TA–CaO spectra confirms the formation O-Ca ionic bonds. 45 Moreover, the ester group existing in tannic acid molecule hydrolyzed in alkaline medium to form carboxylate anion. 46 The formation of a bond was caused by the simultaneous association of the calcium ion (Ca2+) with the carboxylate anion and the nearby oxidized phenolic-OH group.
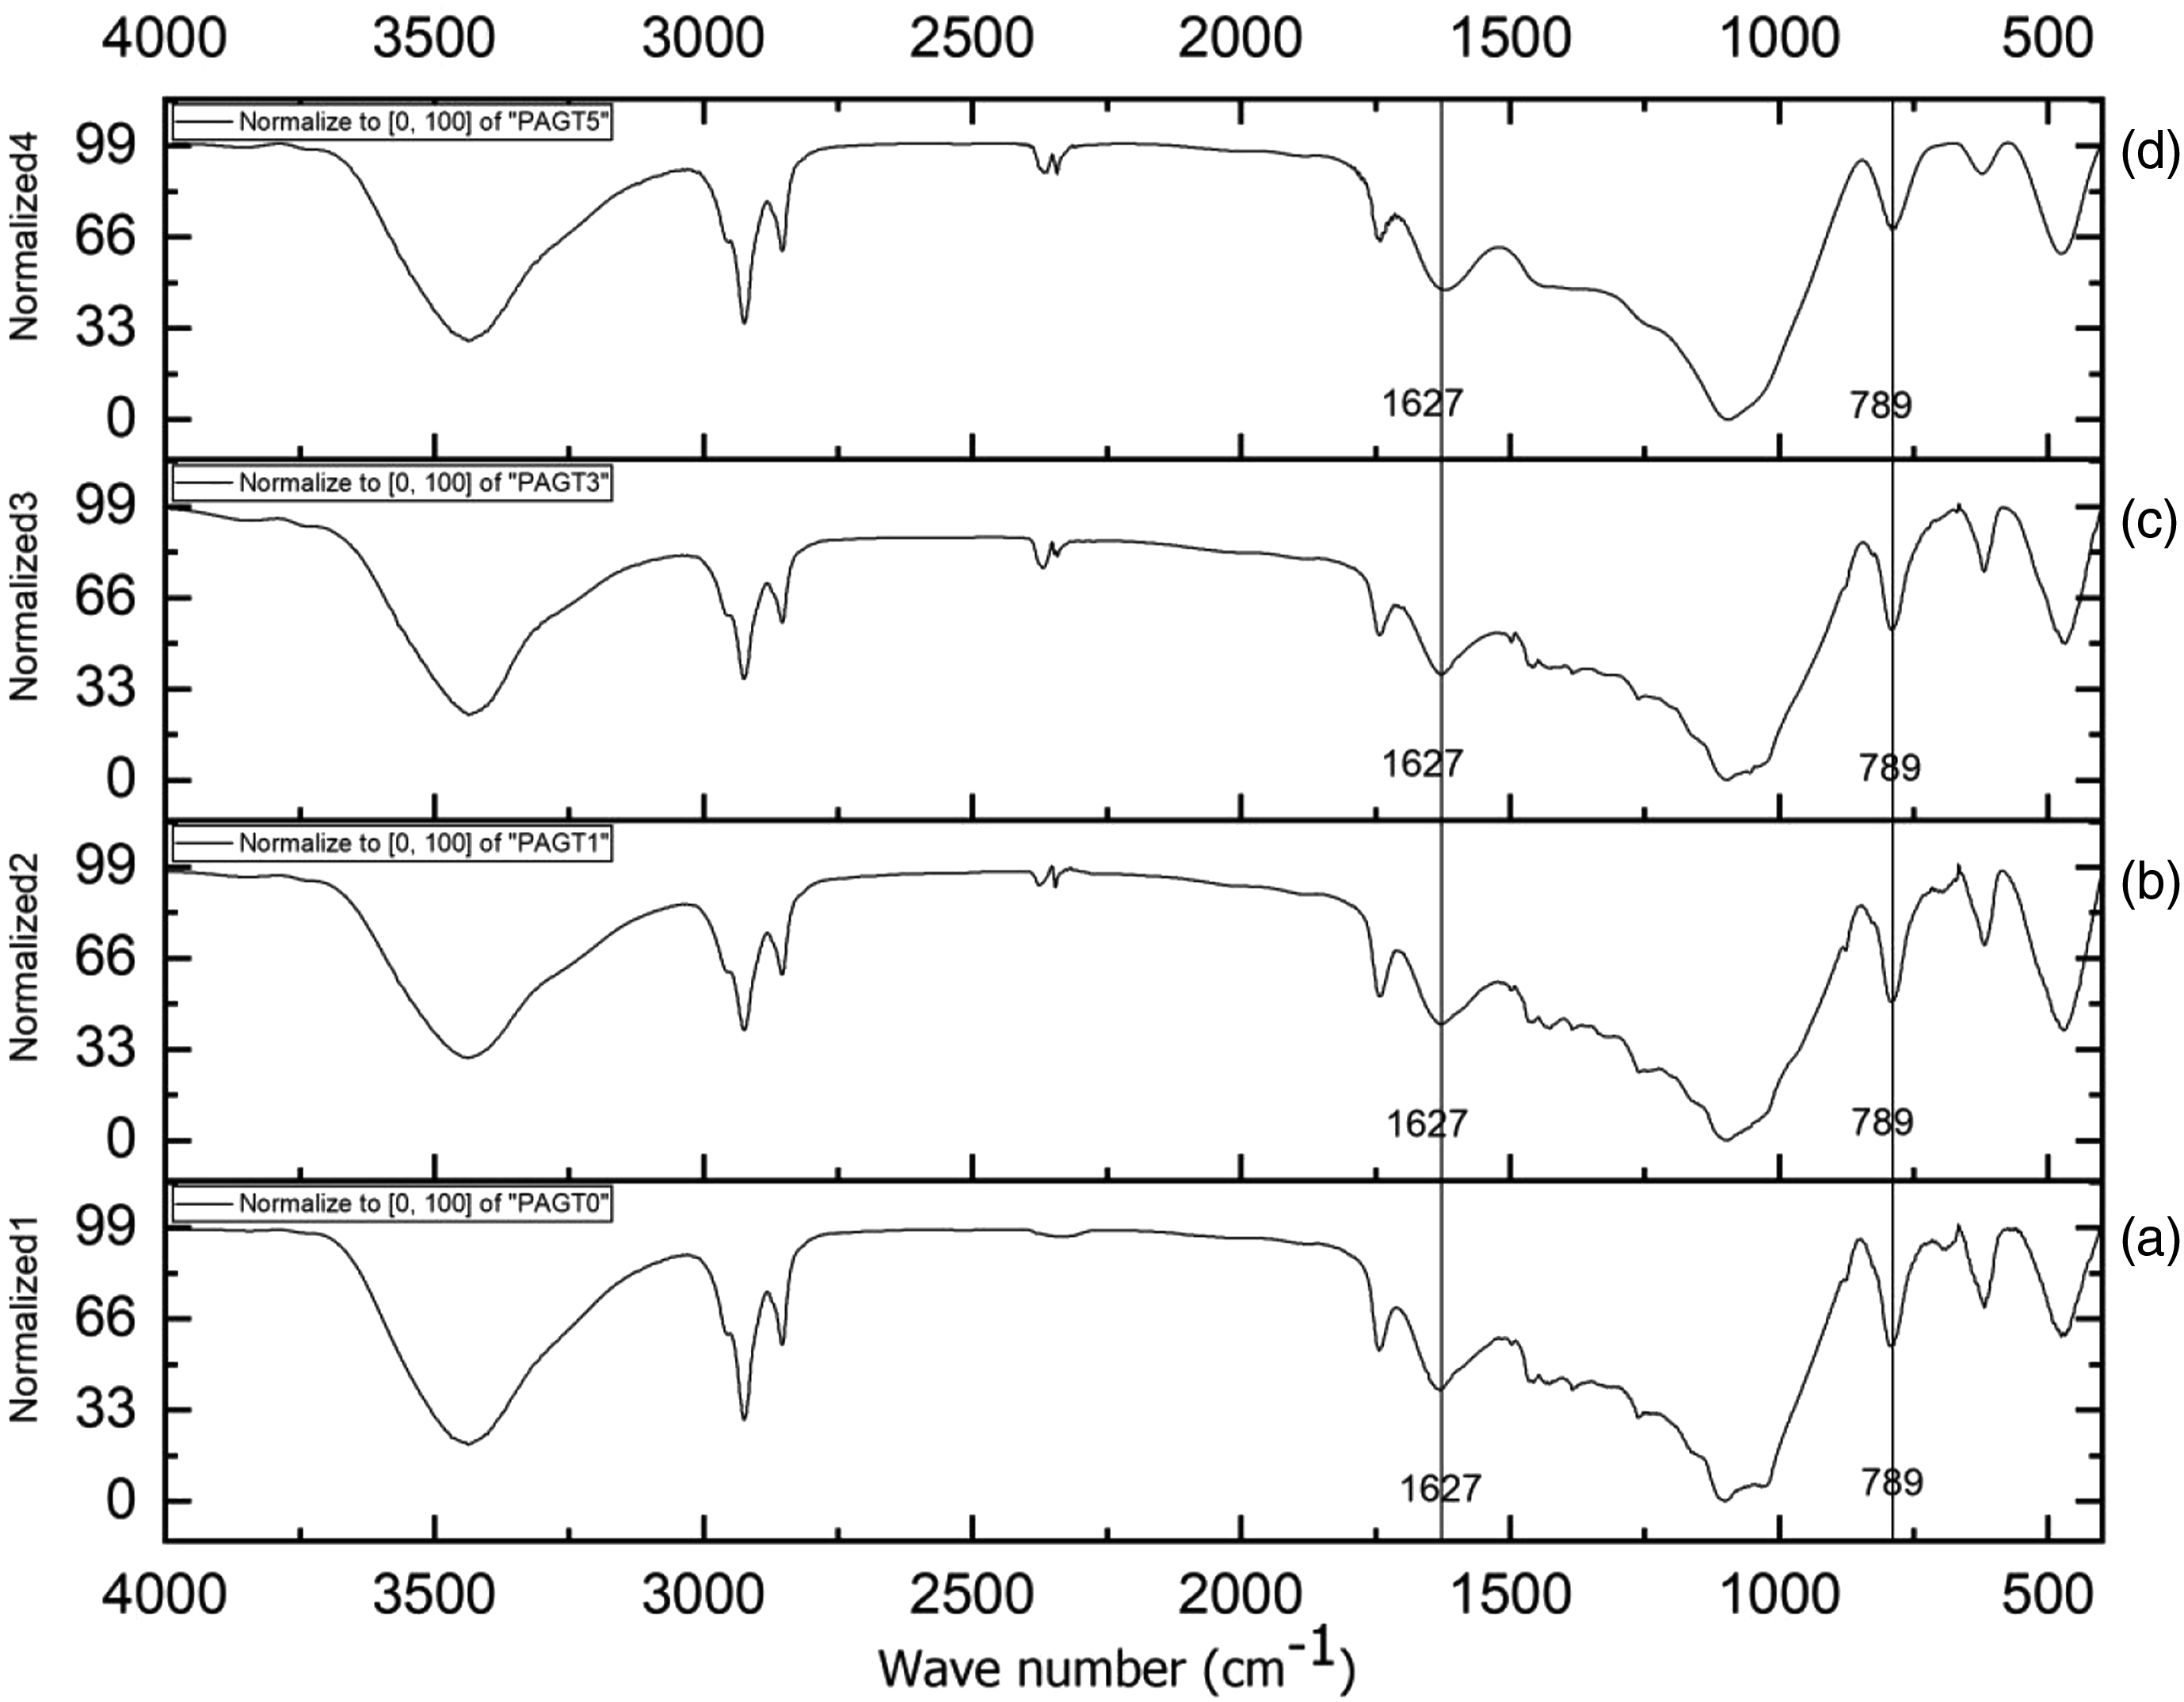
Figures 2 and 3 shows the FTIR spectra and normalized FTIR spectra of different composite samples. In the composite without GO (Figure 2(a)), the peaks present in RHA (Figure 1(c)) at 3447 cm−1 (O-H stretching), 1638 cm−1 (-OH bending), and 798 cm−1 (Si-O group) shifted to 3440 cm−1, 1627 cm−1 and 789 cm−1, respectively, in the composite. In all the spectra, it was also observed that the position of the hydroxyl peak shifted to a lower wavenumber from 3440 cm−1 to 3426 cm−1 as the percentage of GO increased from 0.1 to 0.5%. Further, the intensity of peak at 1627 cm−1 (-OH bending) and 798 cm−1 (Si-O stretching) were found to reduce with the rise in the percentage of GO. The decrease of vibration intensity of peak due to increase of GO content in the polymer matrix was reported by Mindivan and Göktas.
47
All these suggested an occurrence of interaction between GO and composites. FTIR spectra of (a) PAGT0 (b) PAGT1 (c) PAGT3 and (d) PAGT5. FTIR: Fourier Transform Infrared Spectroscopy. Normalized FTIR spectra of (a) PAGT0 (b) PAGT1 (c) PAGT3 and (d) PAGT5. FTIR: Fourier Transform Infrared Spectroscopy.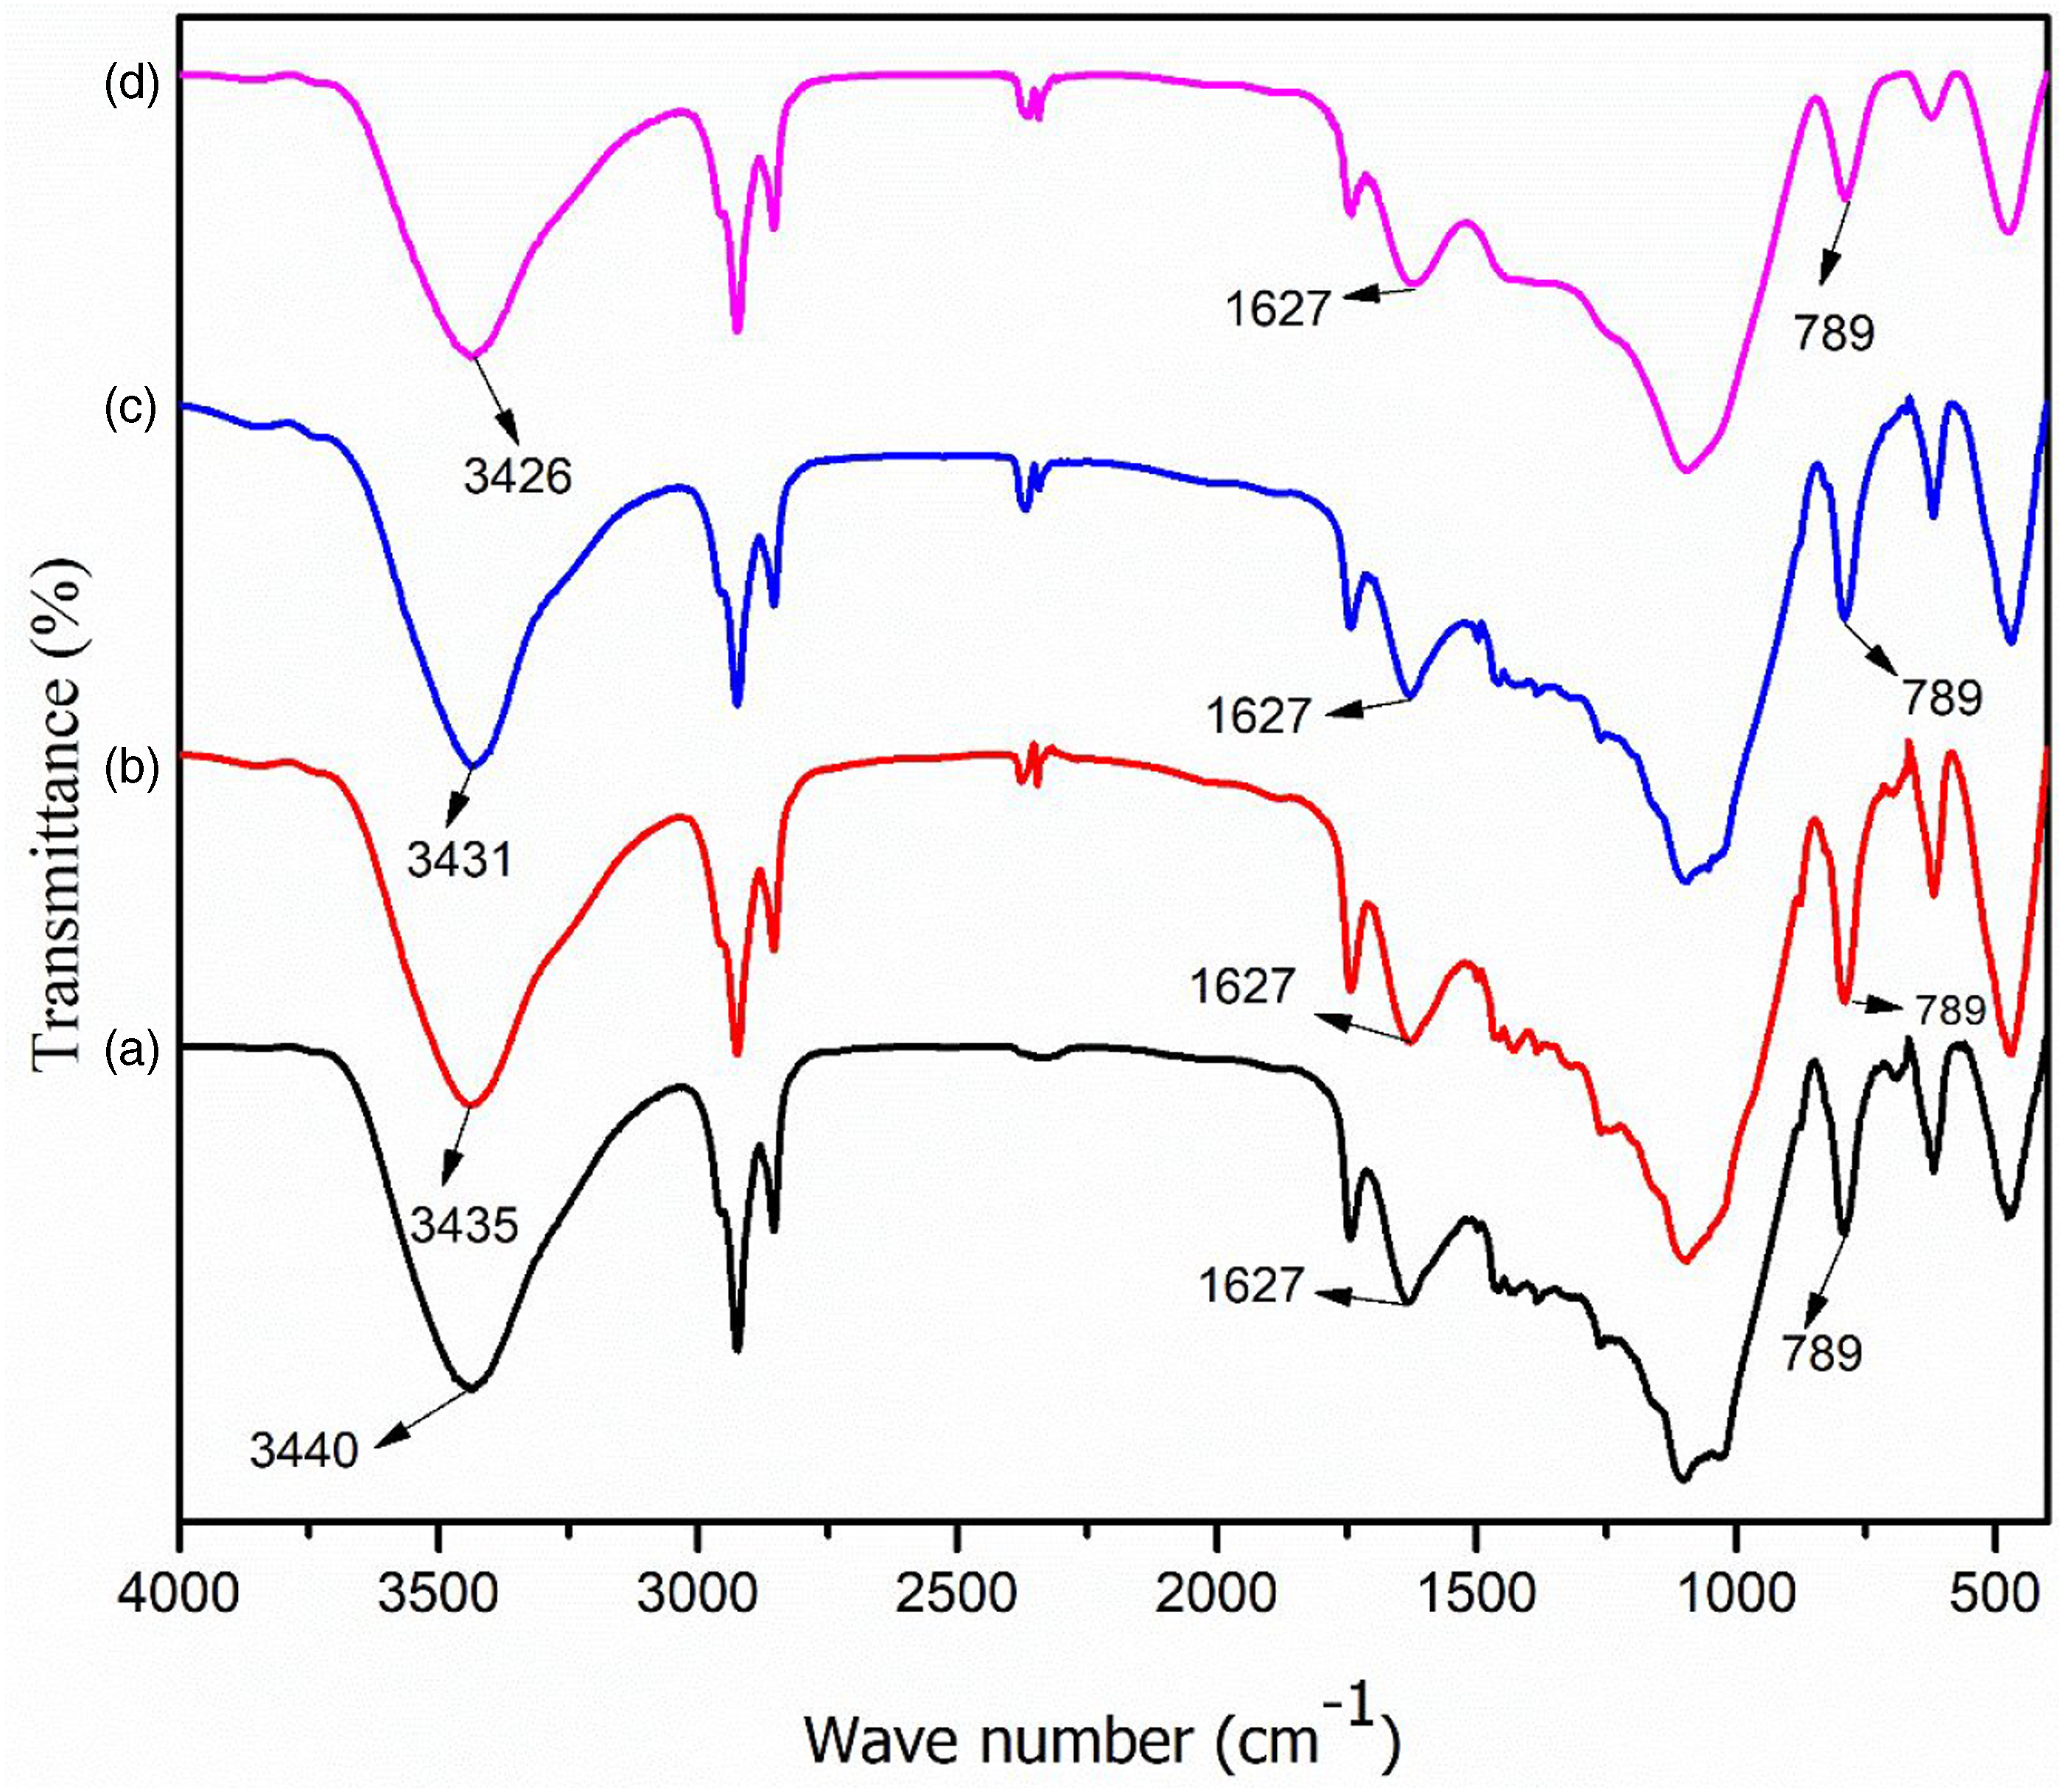
XRD
Figure 4 shows the XRD spectra of GO, RHA, PVC and PVC/RHA composites. GO shows a prominent sharp diffraction peak at about 2θ = 9.62° corresponding to (002) plane.
48
RHA shows a broad peak at around 2θ = 22.6° for SiO2 showing its amorphous nature. Similarly, PVC also shows a broad and a small peak at 2θ = 23.54° and 12.67°, respectively. In all the composite samples, sharp peaks in the range 2θ = 21.5°–21.87° and broad peaks at 2θ= 12.51°–13.04° were observed. The sharp peaks that arise might be due to the development of crystallinity. The peak due to GO at 2θ = 9.62° was found to be absent in GO containing composites. This might be either due to molecular level dispersion of GO or the delamination of GO in the composite which might be difficult to detect by the XRD study. A similar observation was also reported in literature.49,50 XRD diffractograms of (a) GO (b) RHA (c) PVC (d) PAGT0 (e) PAGT1 (f) PAGT3 (g) PAGT5.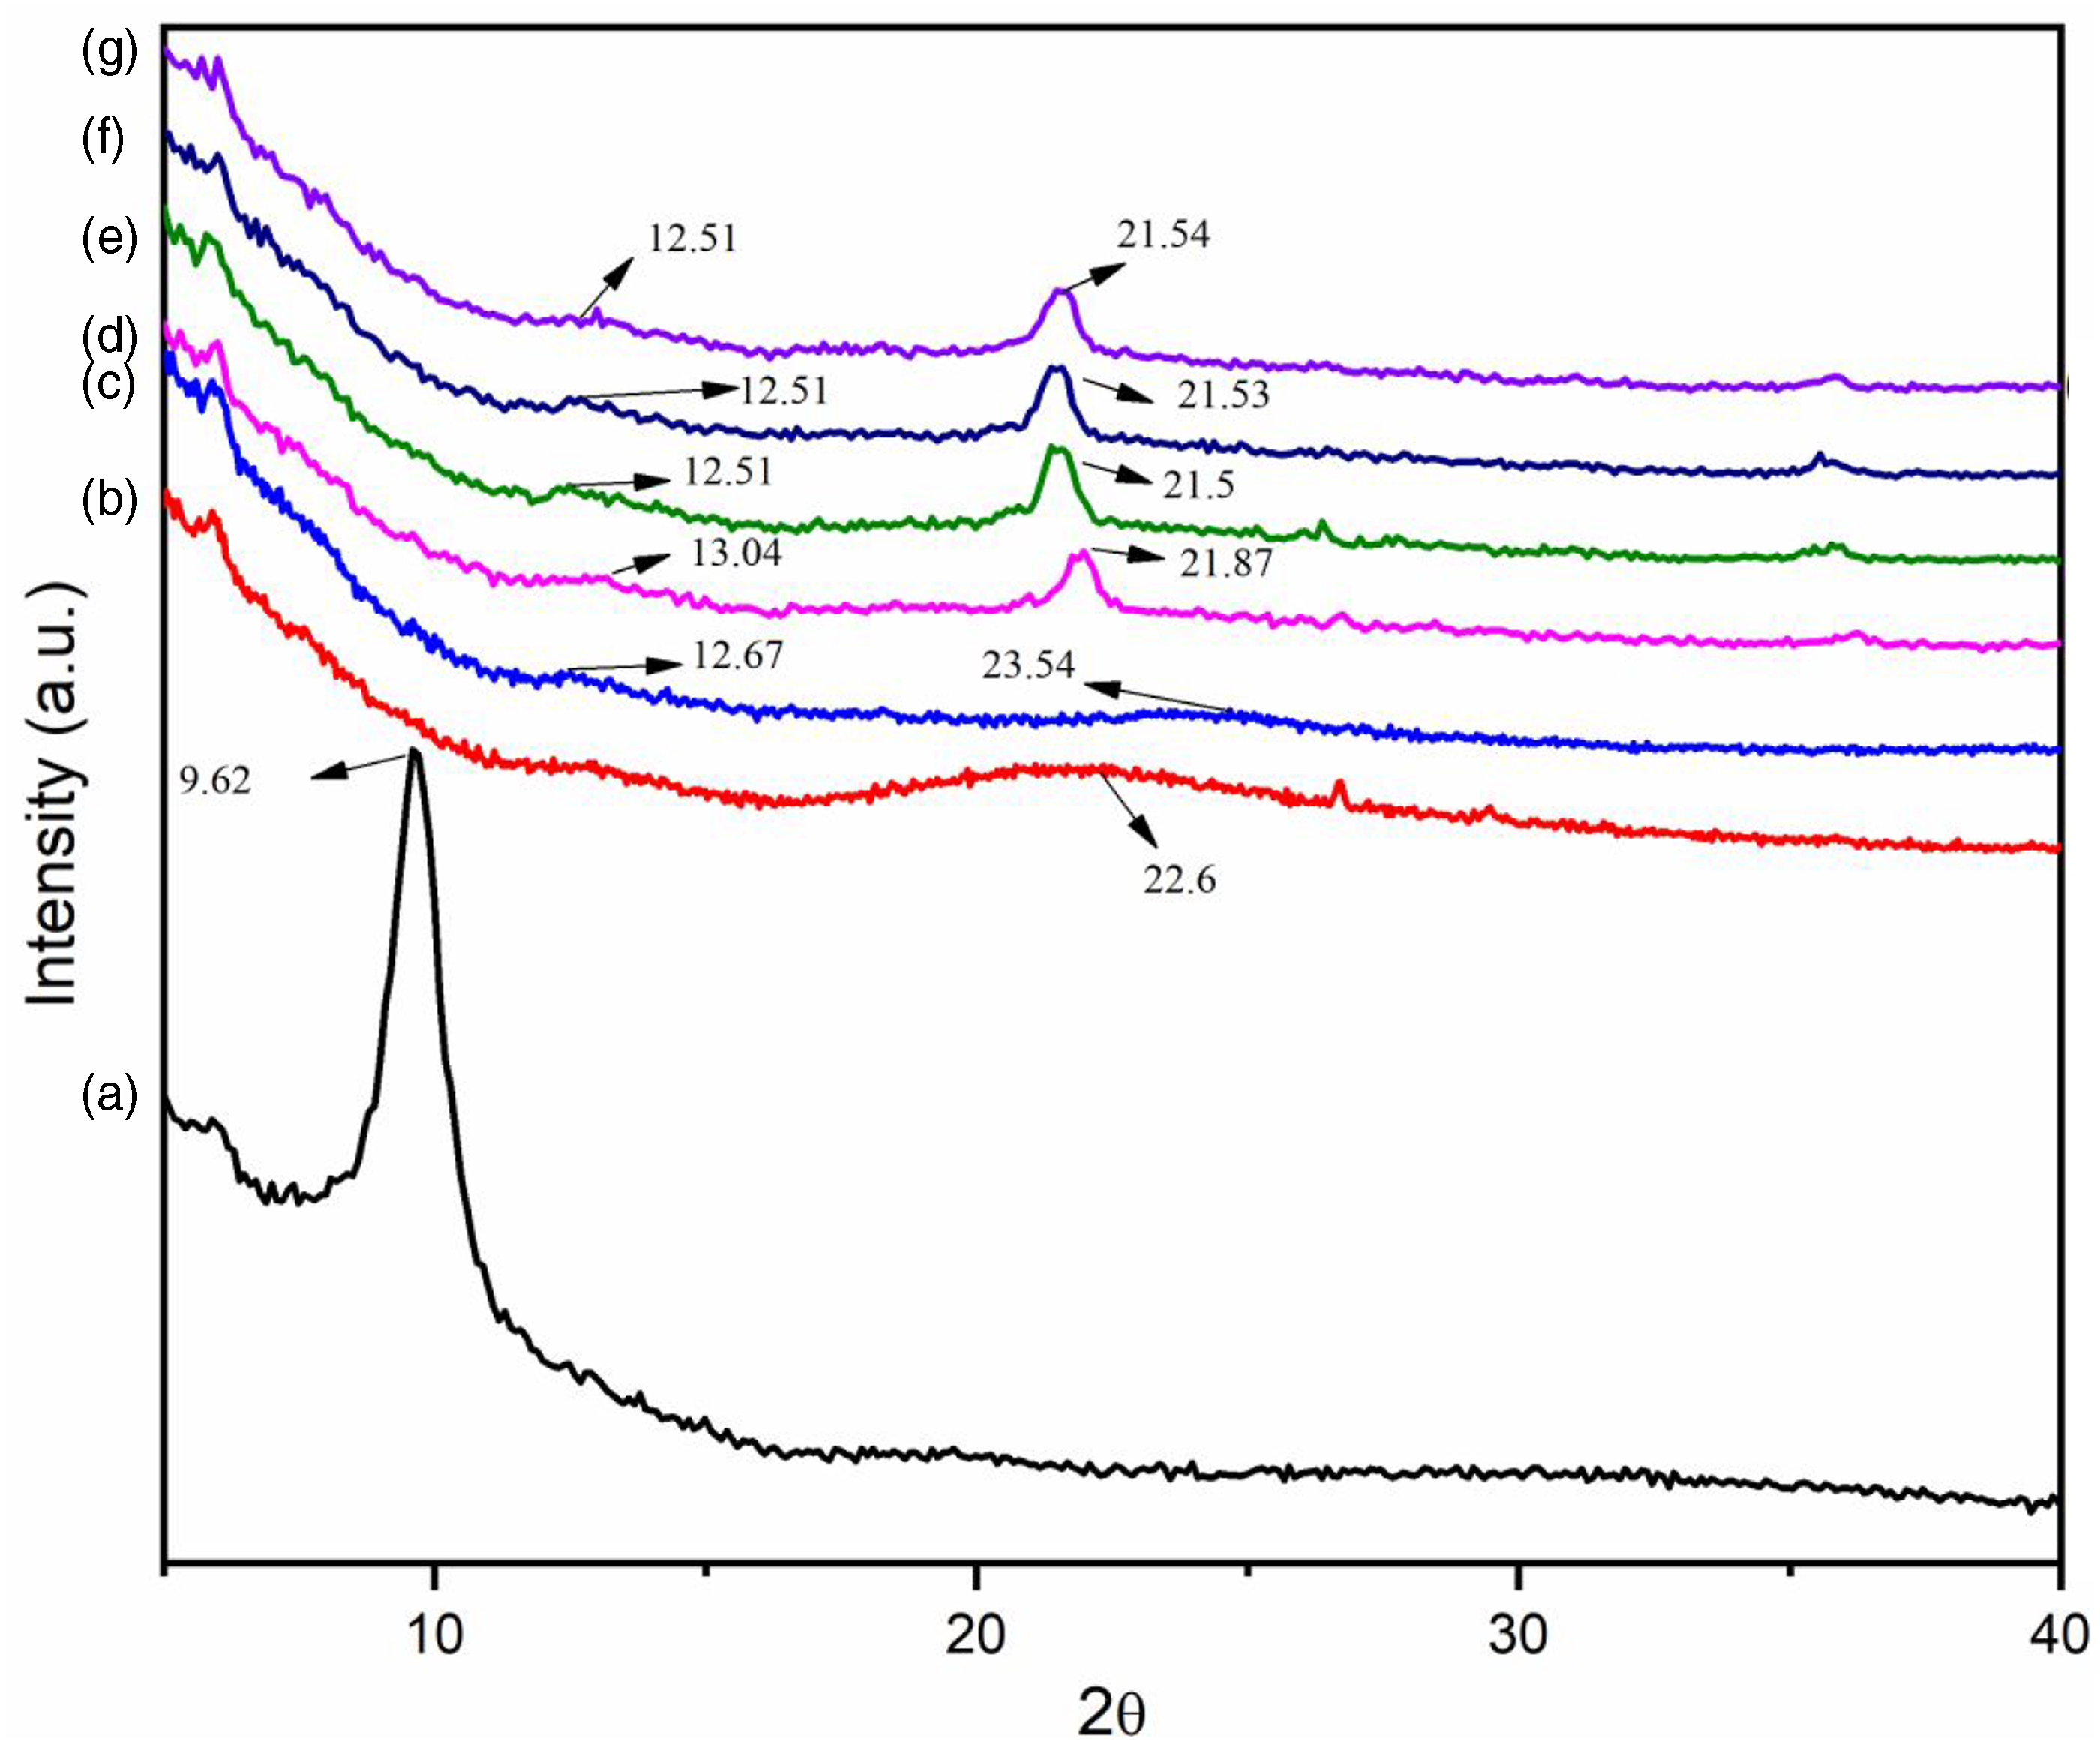
SEM study
The SEM micrographs of RHA/PVC nanocomposites without/or with GO are shown in Figure 5. There was no remarkable difference in morphology between composites with or without GO. However, the surface of the composite containing 0.5 phr of GO was a little bit smooth indicating improved dispersion of GO in the composite compared to other GO containing composites.
51
SEM micrograph of (a) PAGT0 (b) PAGT1 (c) PAGT3 (d) PAGT5.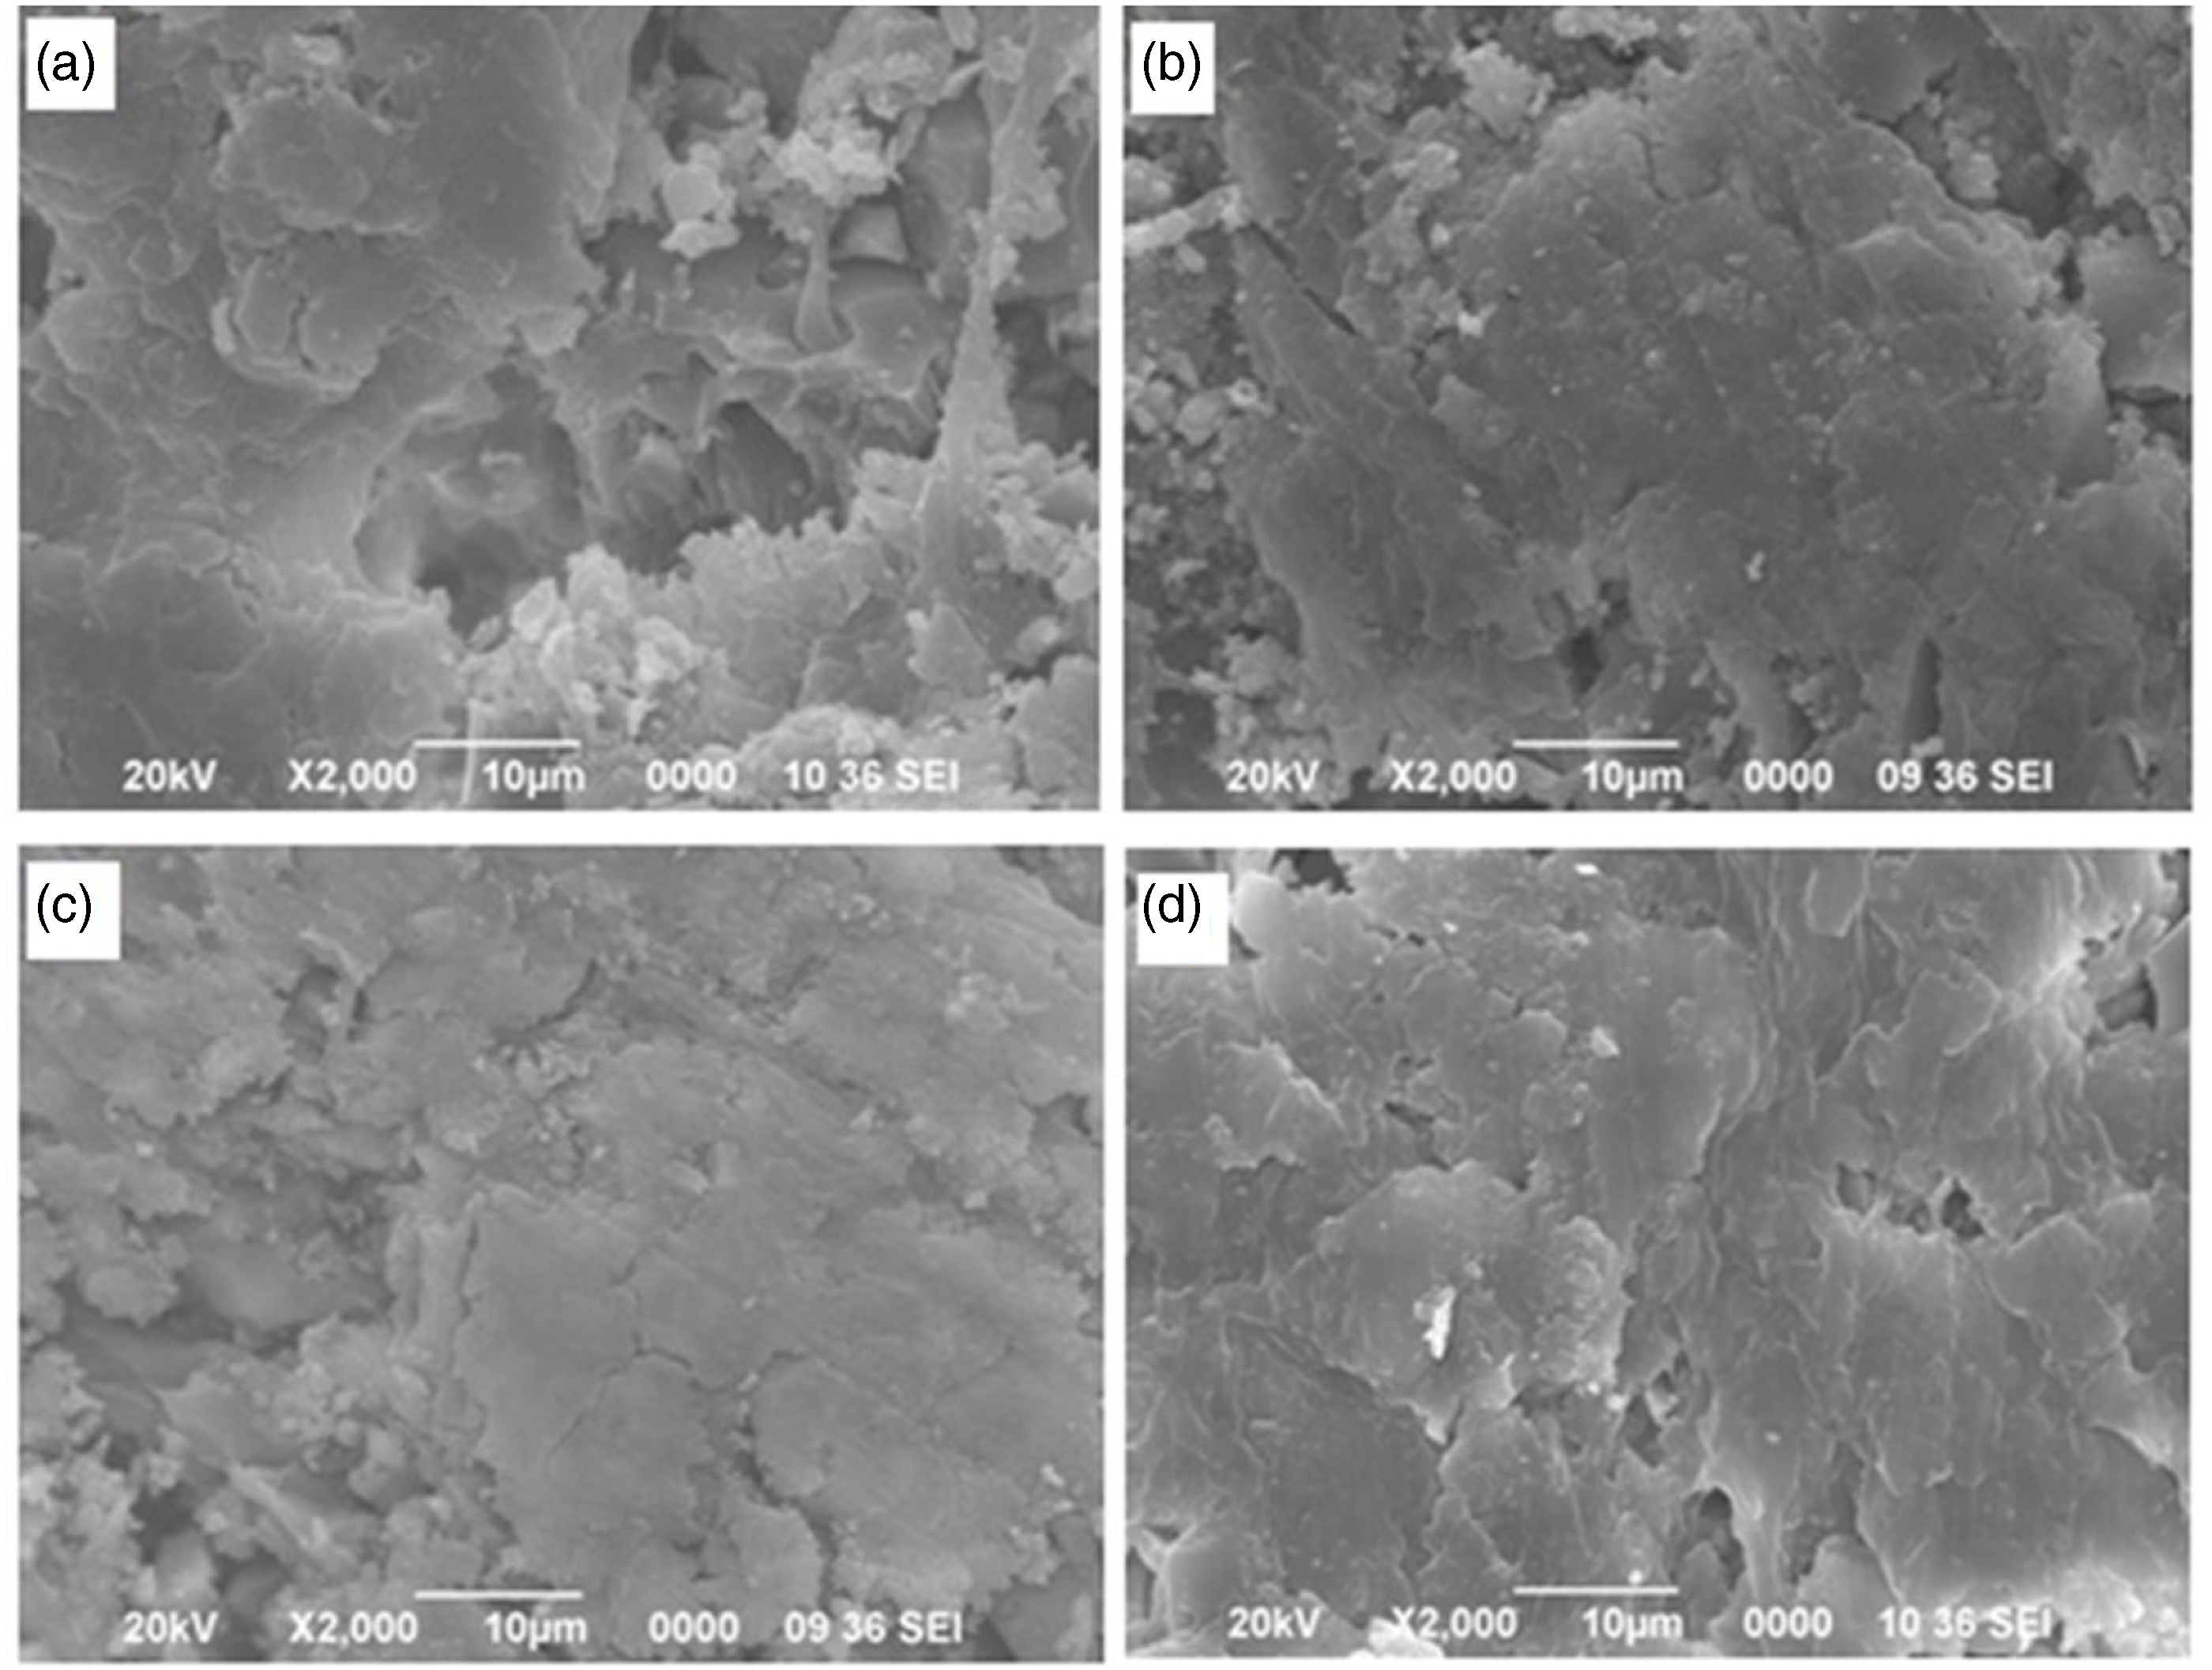
TEM
Figure 6 shows the TEM micrographs of the composite containing 0.5 phr GO at two different magnifications. The TEM micrograph reveals the homogeneous dispersion of GO nanosheets within the PVC matrix. The improved dispersion of GO sheets suggested a better interaction between GO and the other components including polymer by the formation of crosslinked network structure. A similar observation had been reported in literature.
52
TEM micrograph of PAGT5.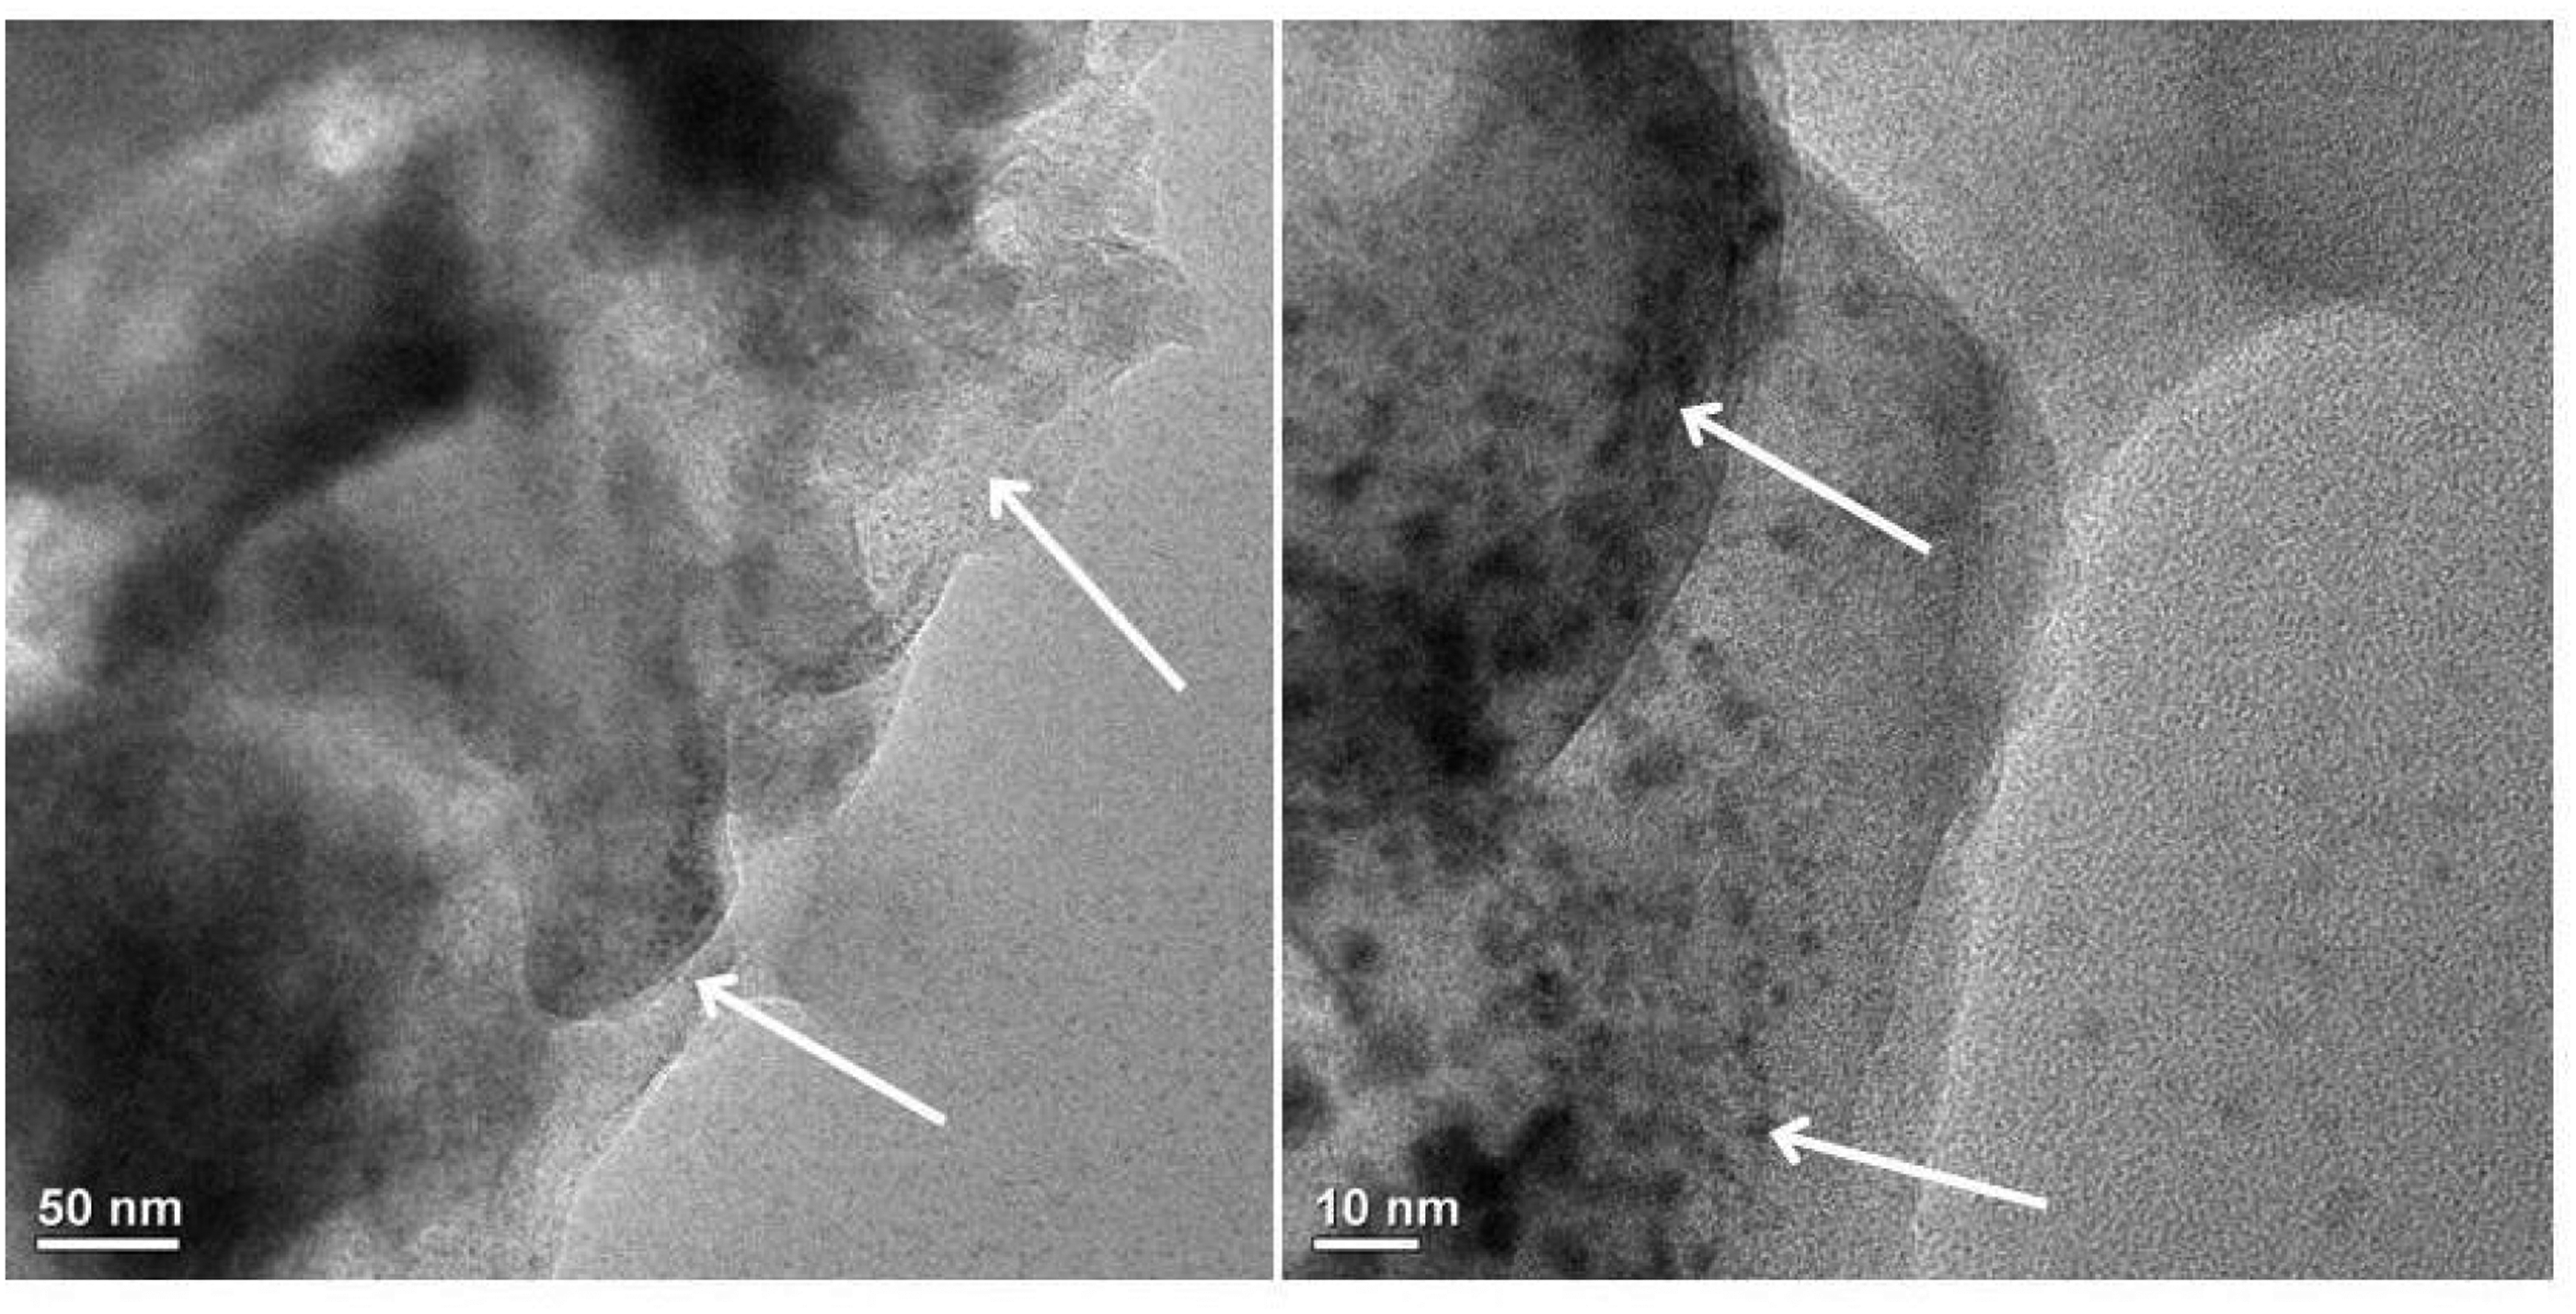
Thermal properties
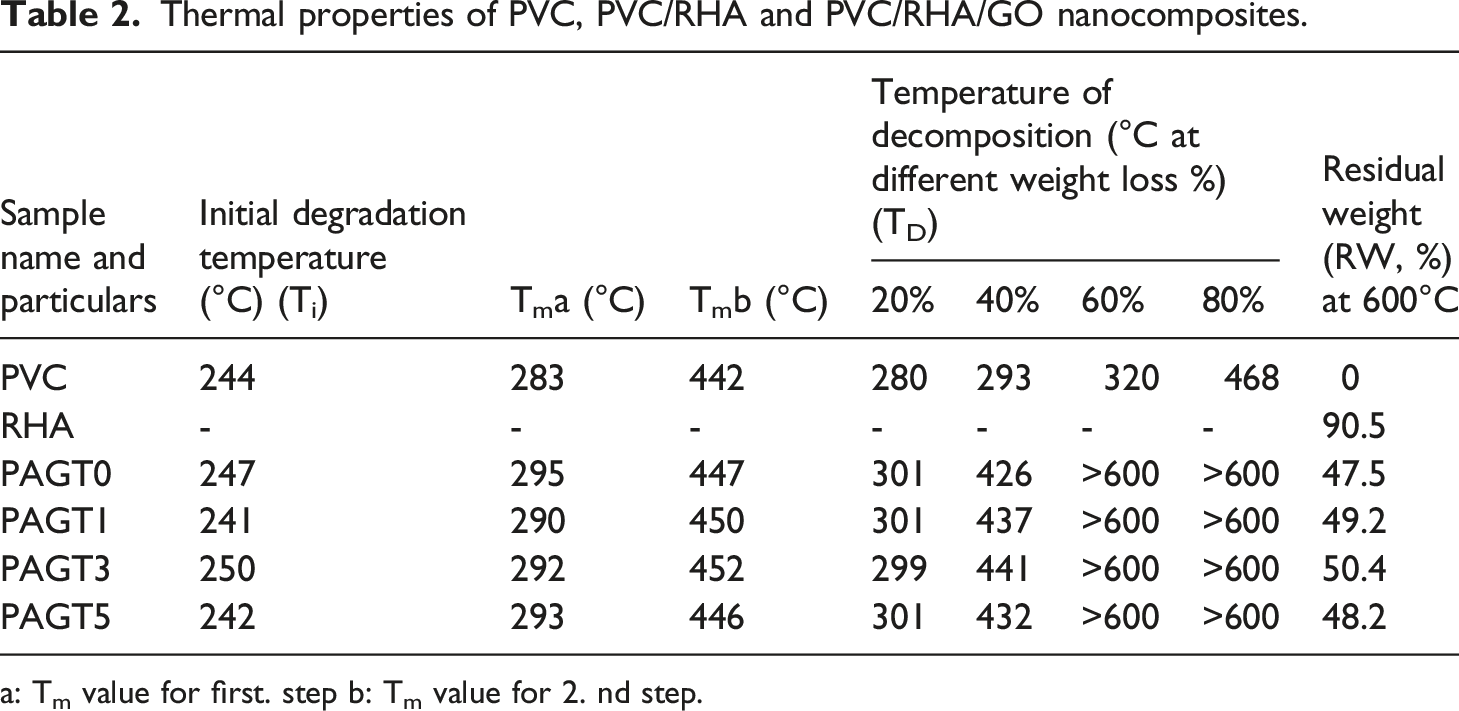
Figure 7 represents the TGA thermogram of PVC along with composites whereas Table 2 displays the maximum pyrolysis temperature (Tm), initial degradation temperature (Ti), decomposition temperature at varied weight losses (TD), and residual weight (RW) (%) for PVC and other composite samples. The Ti value was increased with the introduction of RHA into the polymer matrix. The presence of SiO2 in the RHA enhanced the heat dispersion within the composite.
53
The initial weight loss that occurred in the temperature range 200–340°C was due to the dehydrochlorination of PVC.
54
The second weight loss, which occurred in the 400–500°C range, might be due to the alternating single and double carbon bonds degradation in PVC, which generates carbonaceous residue.
55
Composite loaded with 0.3 phr GO showed relatively better thermal stability. Generation of carbonaceous residue acts as a barrier for moving out the degraded volatile products from the crosslinked composites (Scheme 2) resulting in an enhancement of thermal stability. Further, the silica present in the RHA also hindered the movement of volatile mass from the composite thus enhancing the thermal stability.
56
The RW of the composite at 600°C was higher than that of virgin PVC. Among the composites, composite containing 0.3 phr GO (PAGT3) showed maximum thermal stability as judged by Ti, Tm, TD, and RW values. TGA thermogram of (a) PVC (b) RHA (c) PAGT0 (d) PAGT1 (e) PAGT3 (f) PAGT5. Thermal properties of PVC, PVC/RHA and PVC/RHA/GO nanocomposites. a: Tm value for first. step b: Tm value for 2. nd step.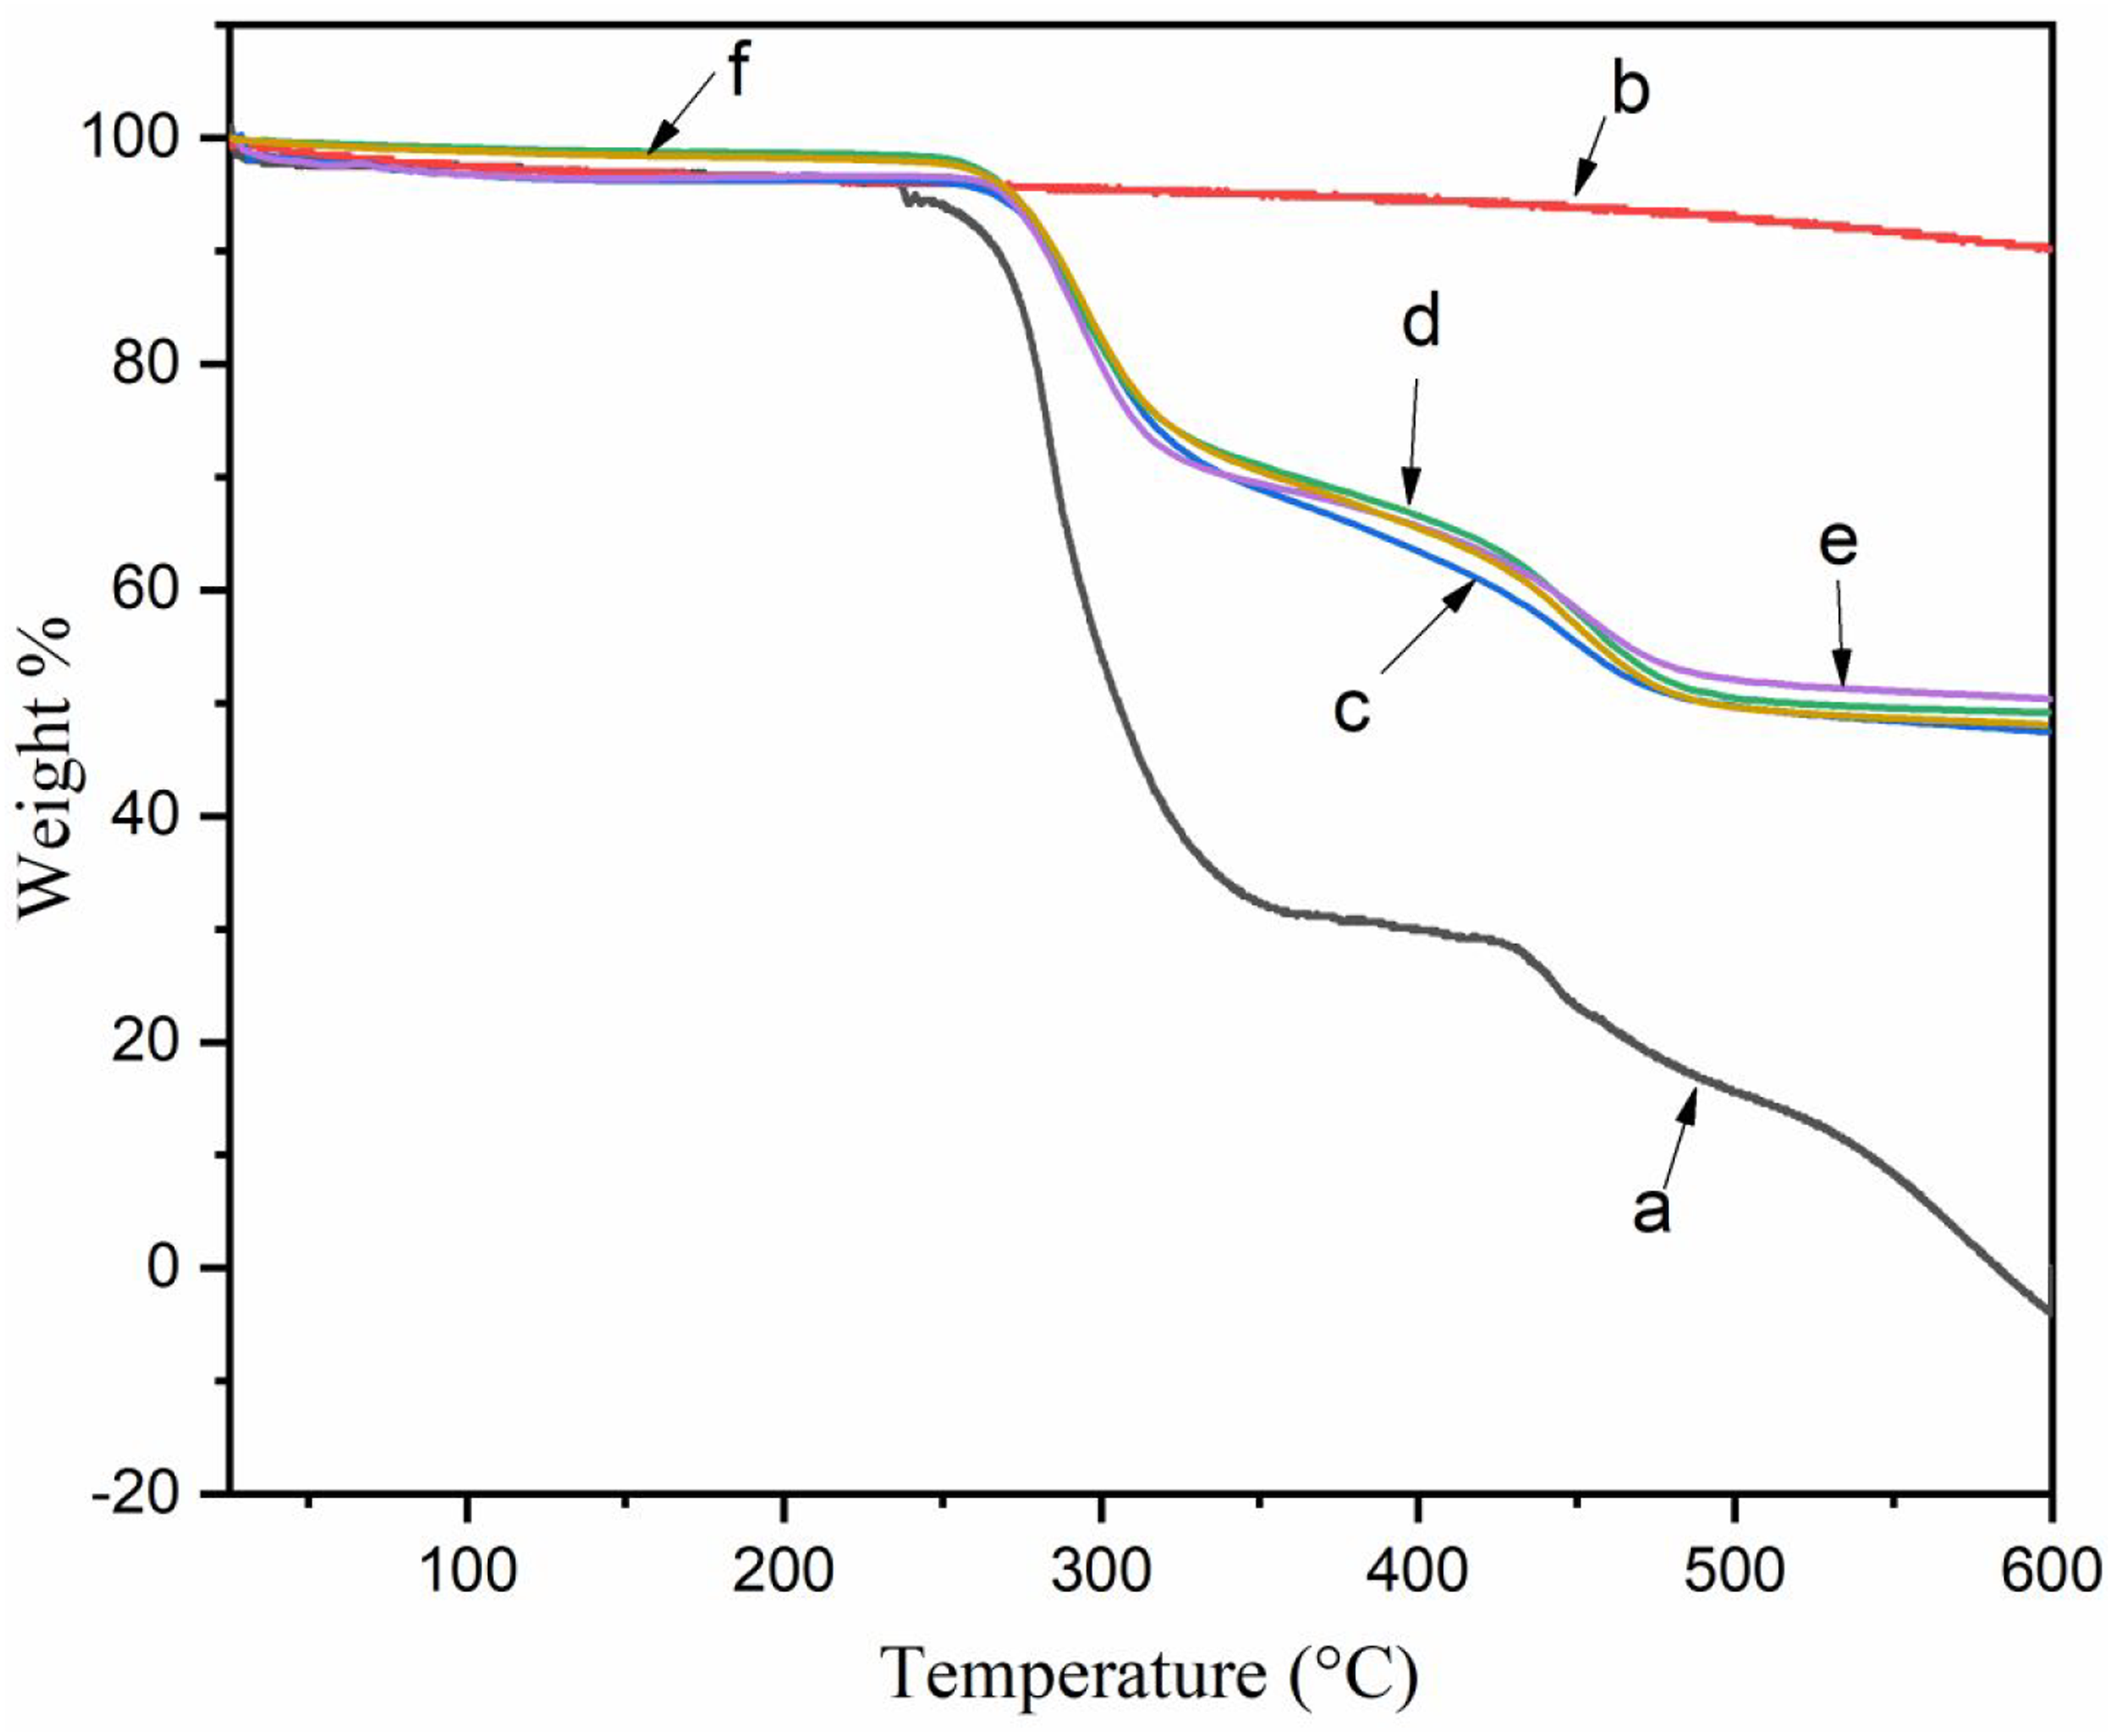
Mechanical and hardness properties
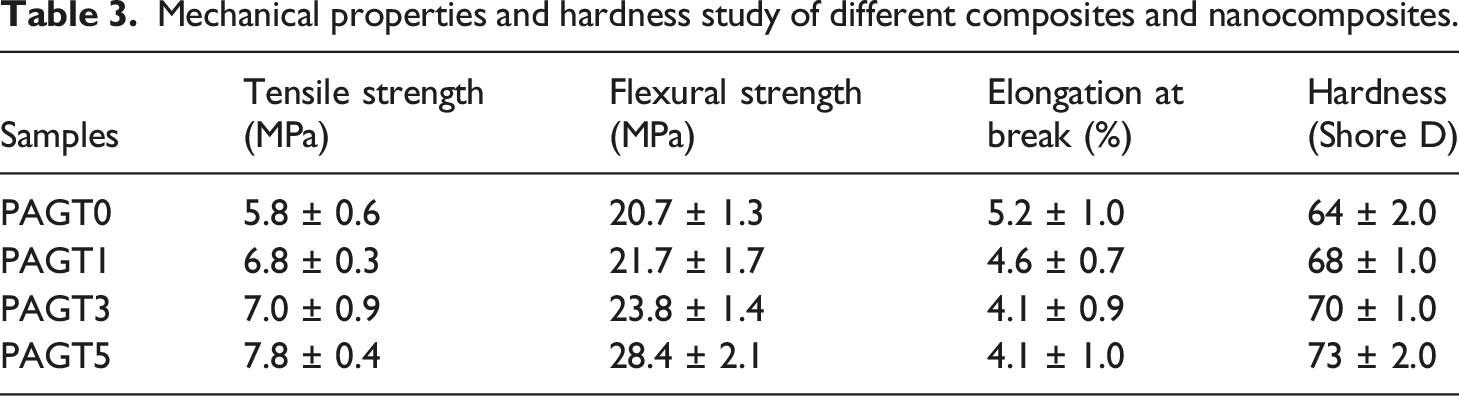
Mechanical properties and hardness study of different composites and nanocomposites.
Chemical resistance test
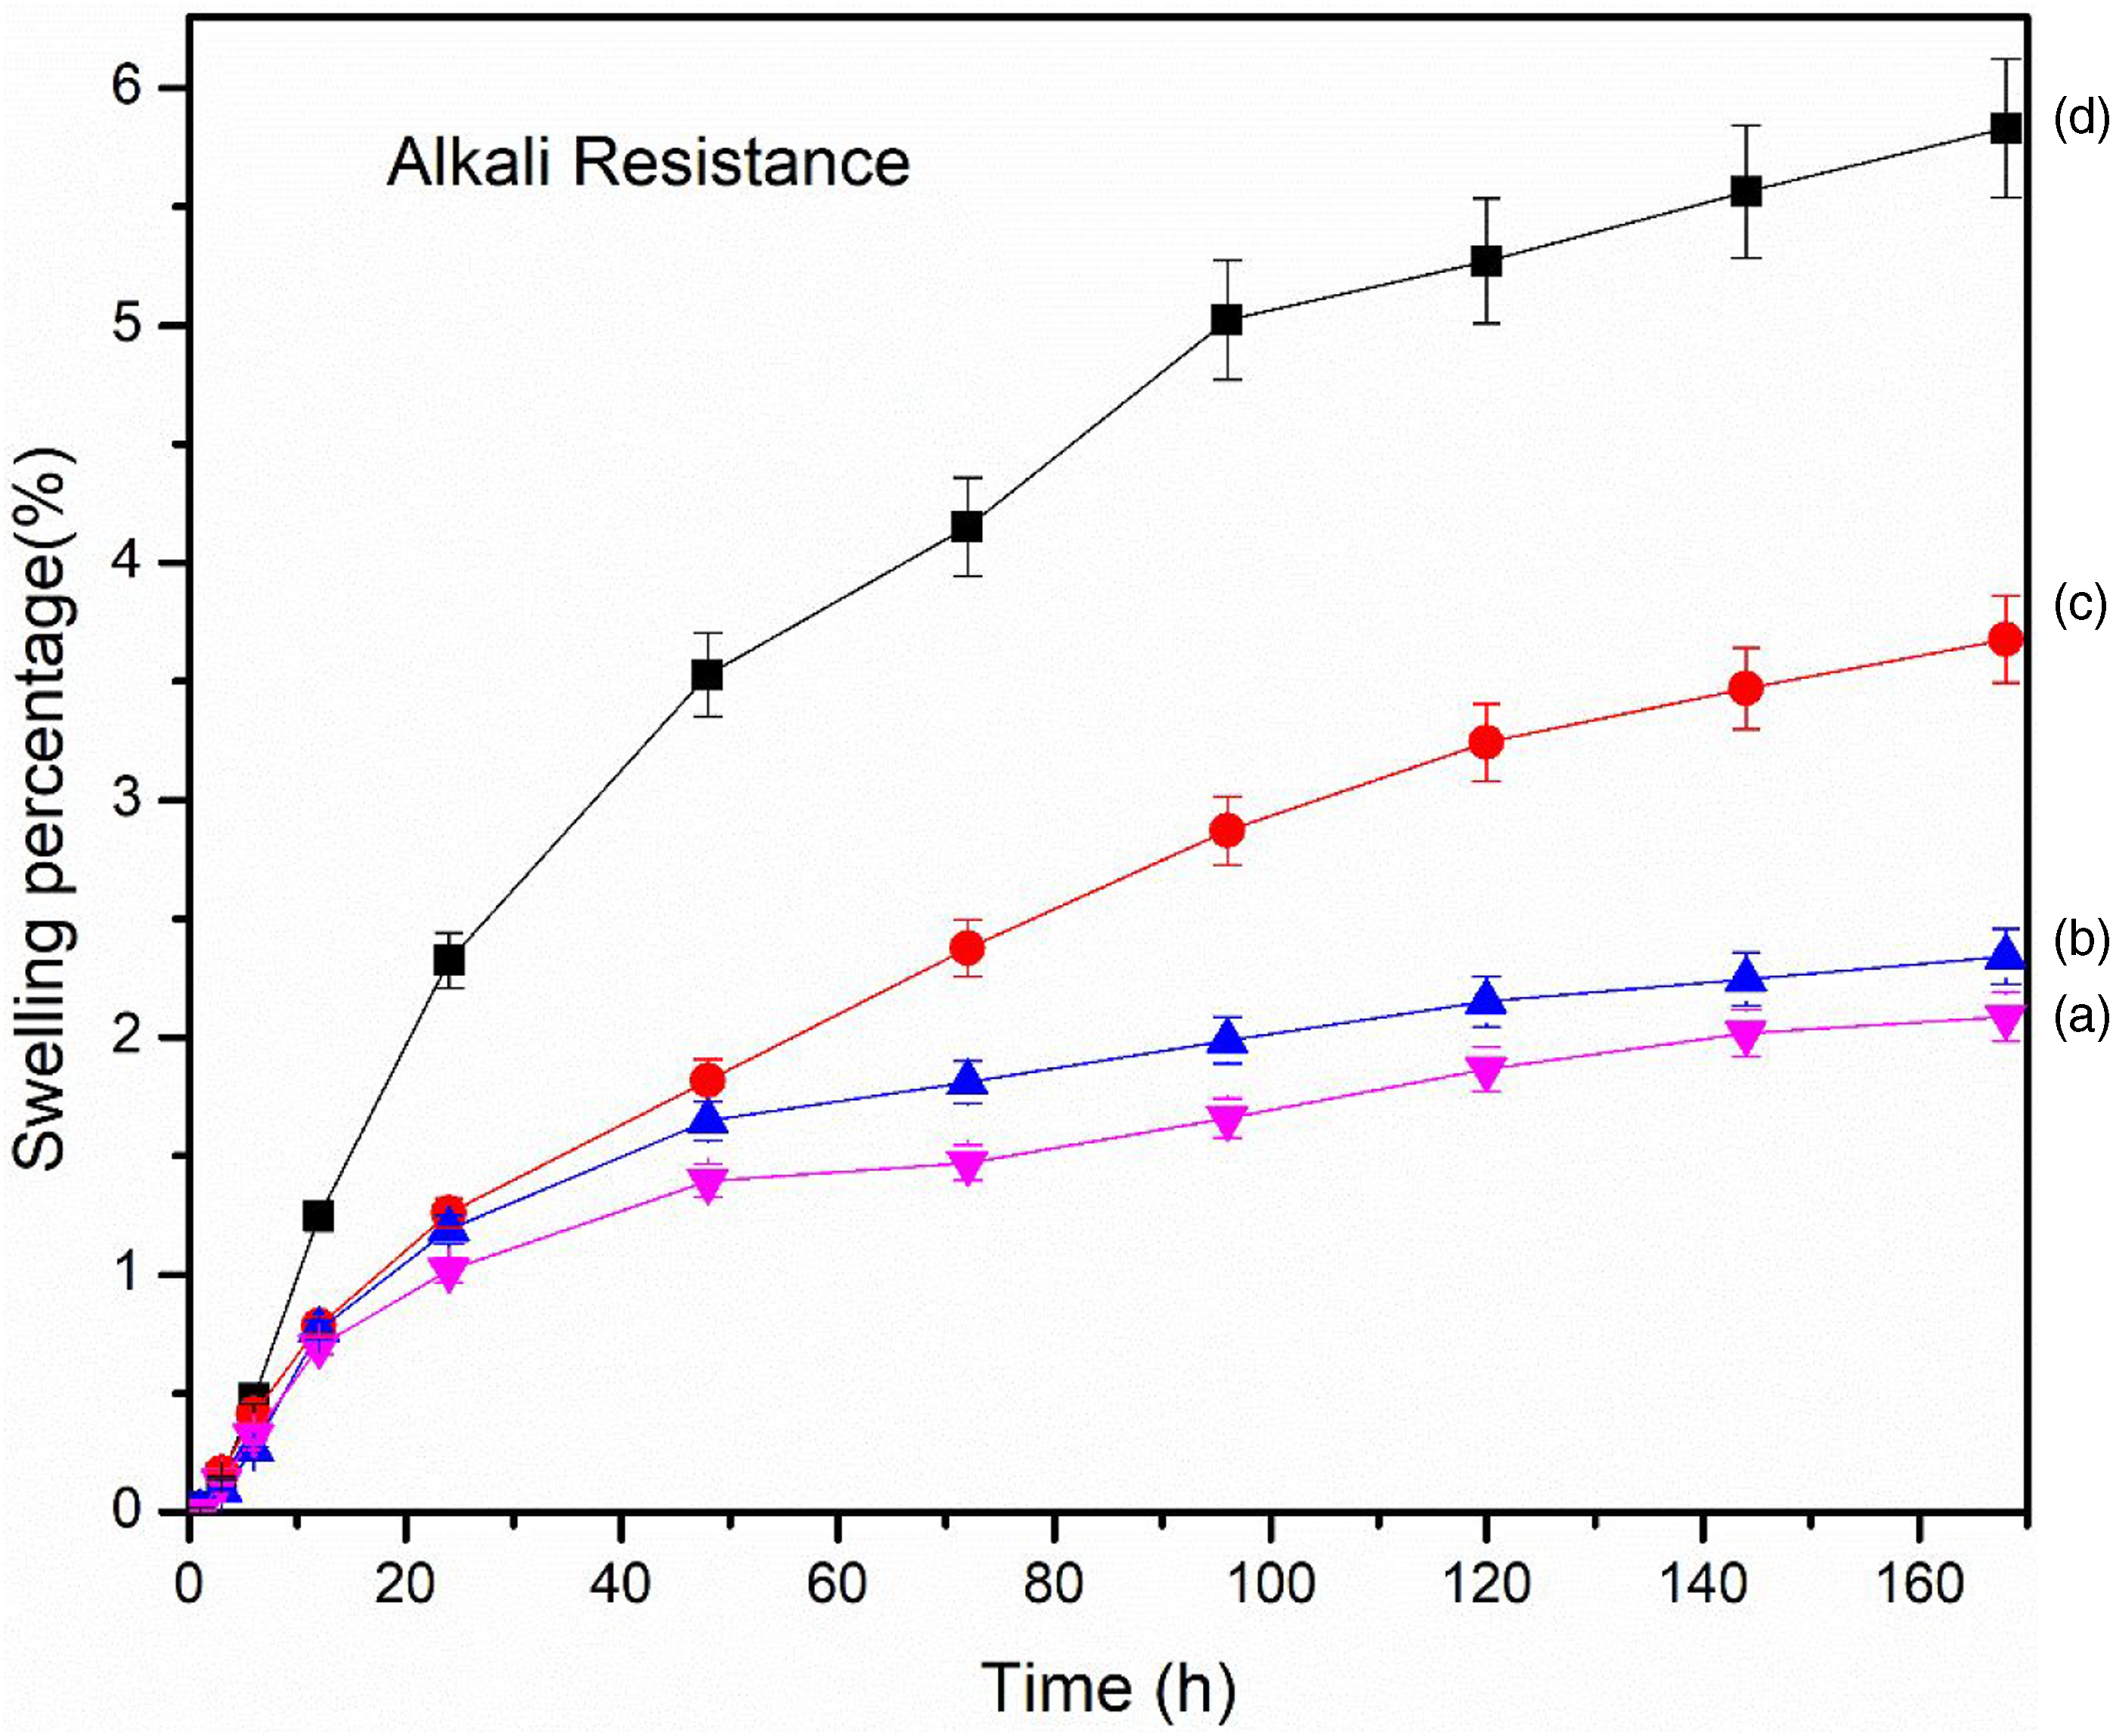
Both acid (Figure 8) and alkali resistance (Figure 9) decreased with the increase in time. The alkali and acid resistance were found better in the composites with GO than composites without GO. The layers of GO hindered the movement of chemicals into the composites causing a decrease in swelling and hence improving resistance. Further, acidic resistance was found better than alkali resistance. The hydroxyl group of NaOH might interact with the hydroxyl group of RHA and GO resulting in increased swelling.
59
The composite with better chemical resistance might be useful for making containers to be used for storage and transportation of chemicals.
60
Acid resistance of (a) PAGT0 (b) PAGT1 (c) PAGT3 (d) PAGT5. Alkali resistance of (a) PAGT0 (b) PAGT1 (c) PAGT3 (d) PAGT5.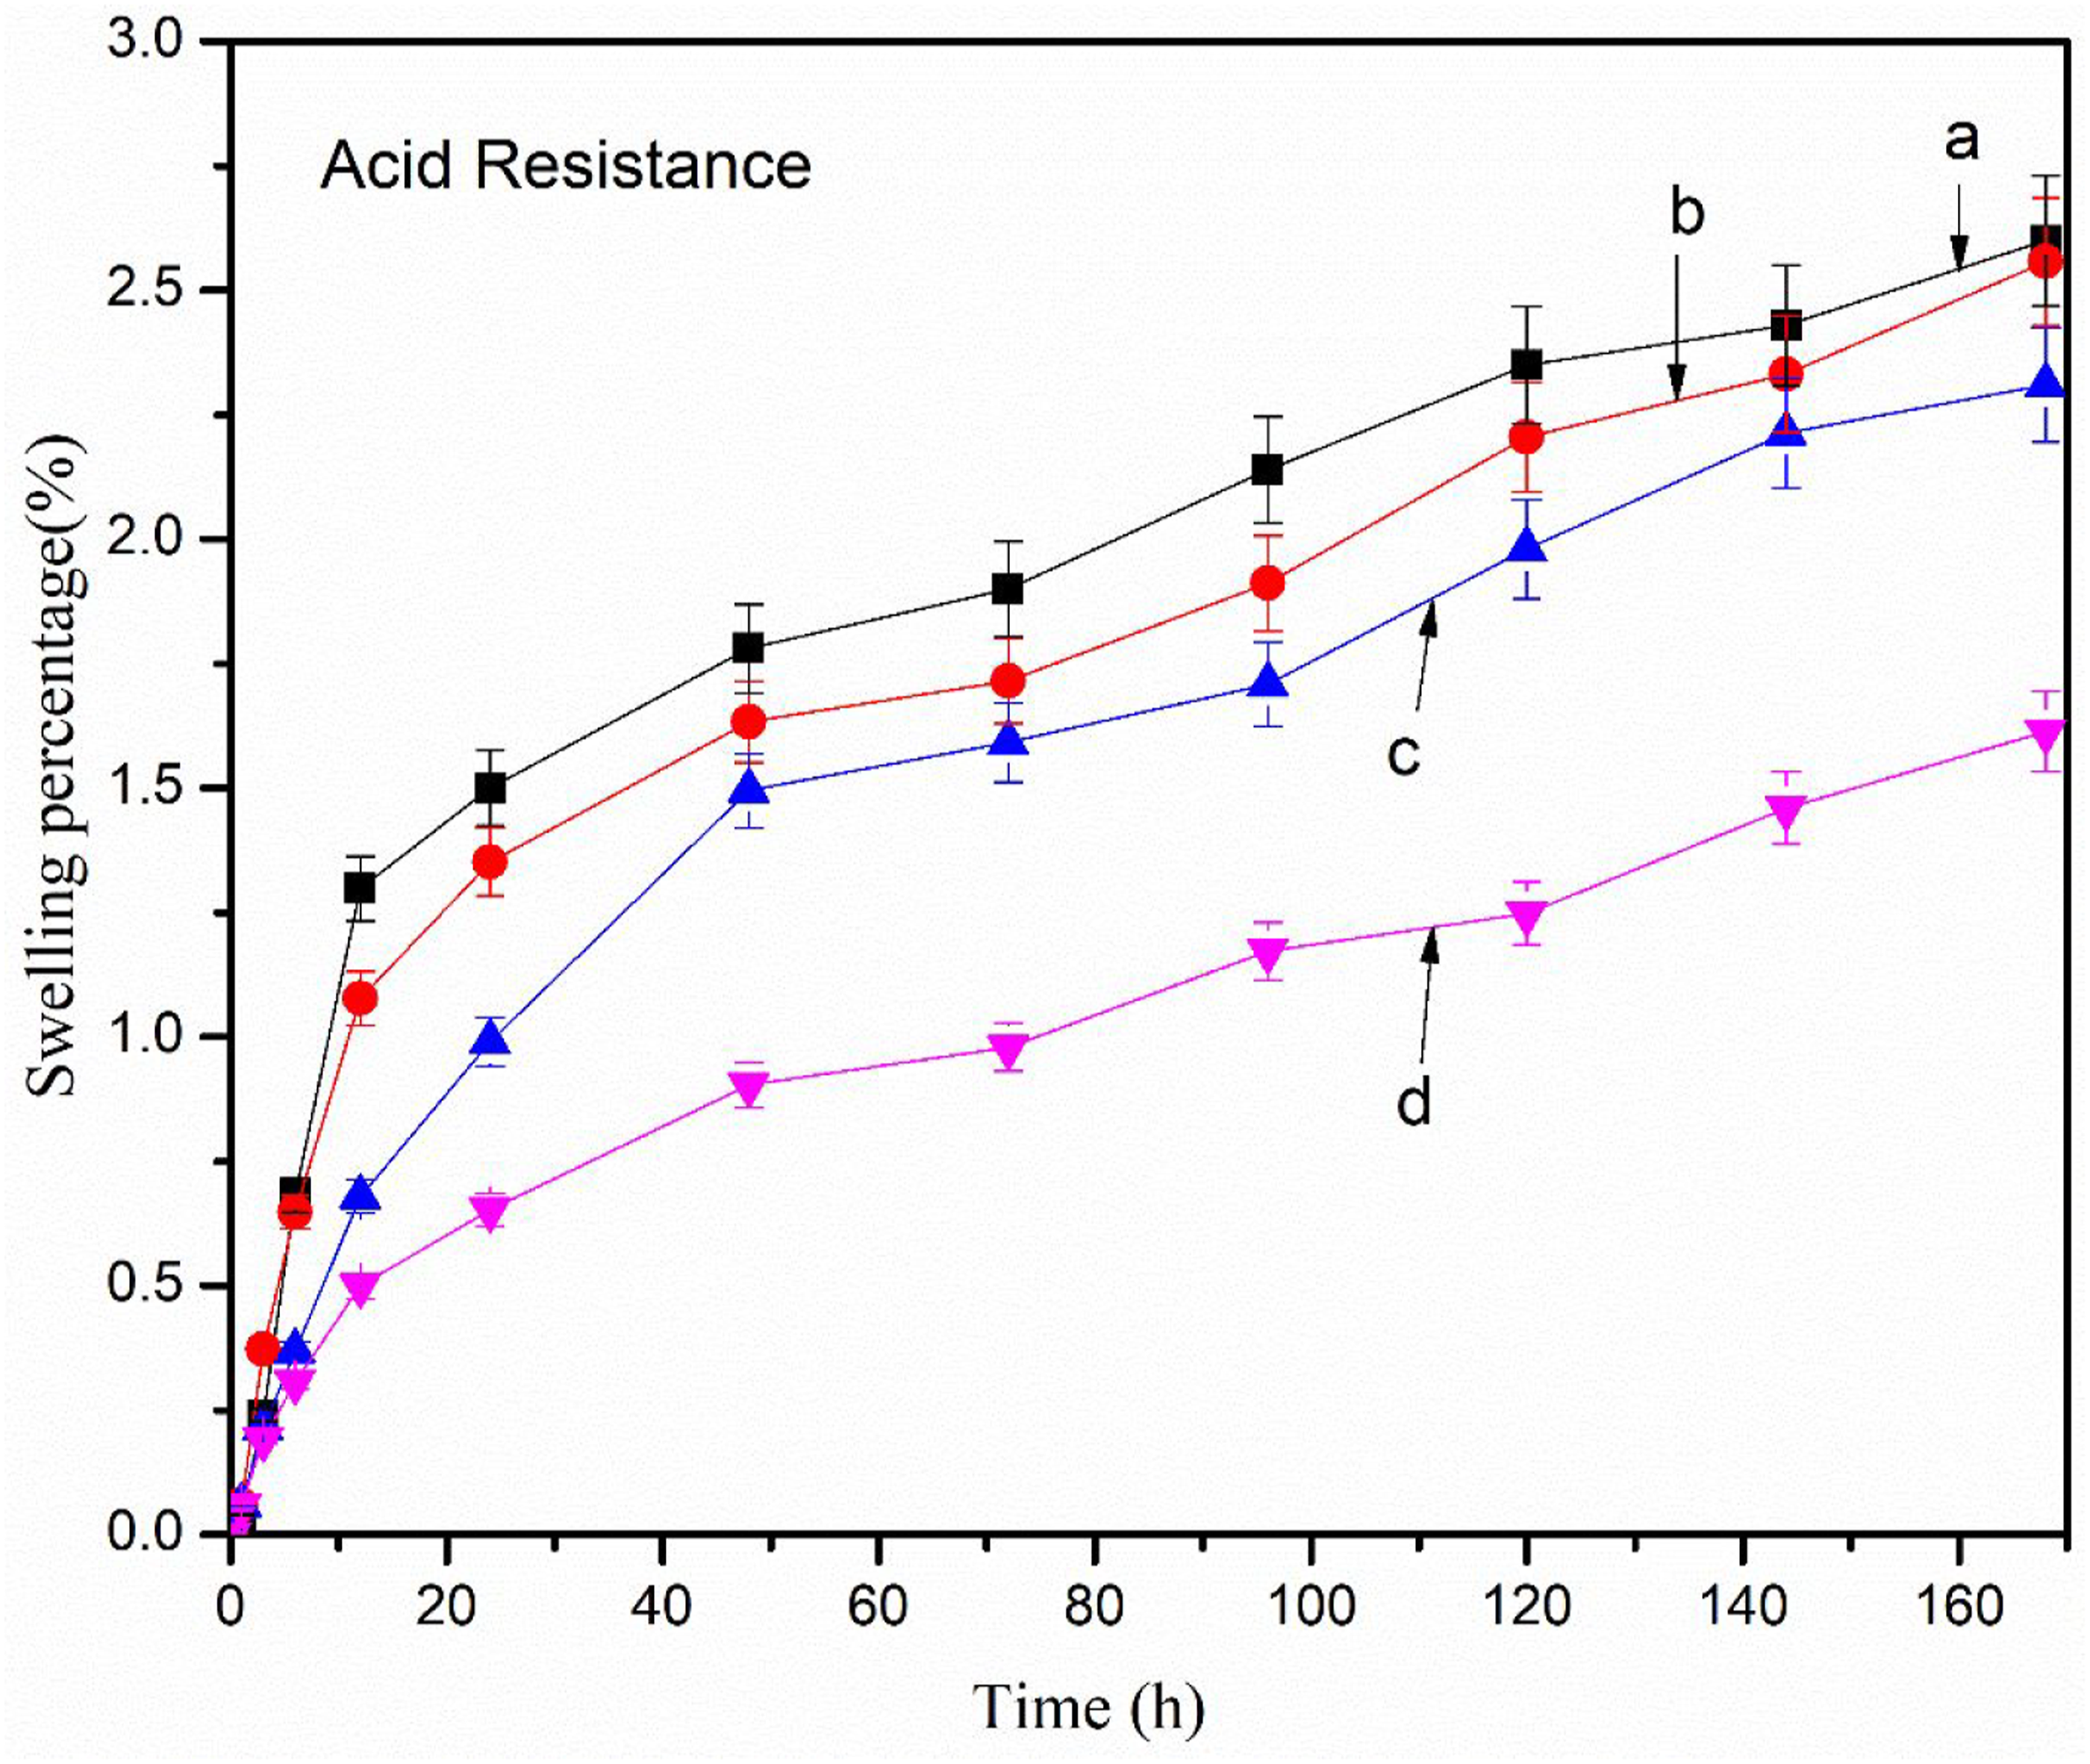
Water vapor uptake study
Figure 10 shows the water vapor uptake results of composites having a different percentage of GO. Composites loaded with 0.5 wt % GO (Figure 10 (d)) showed the least water vapor uptake capacity compared to other samples without GO. This might be due to improved interaction among the components in the composites. GO provides a barrier by preventing the passage of water into the composites. A similar observation was made by Zhang et al.
61
The composite without GO showed the highest water uptake (Figure 10 (a)). The reason might be due to poor interaction between the various components. Water vapor uptake of (a) PAGT0 (b) PAGT1 (c) PAGT3 (d) PAGT5.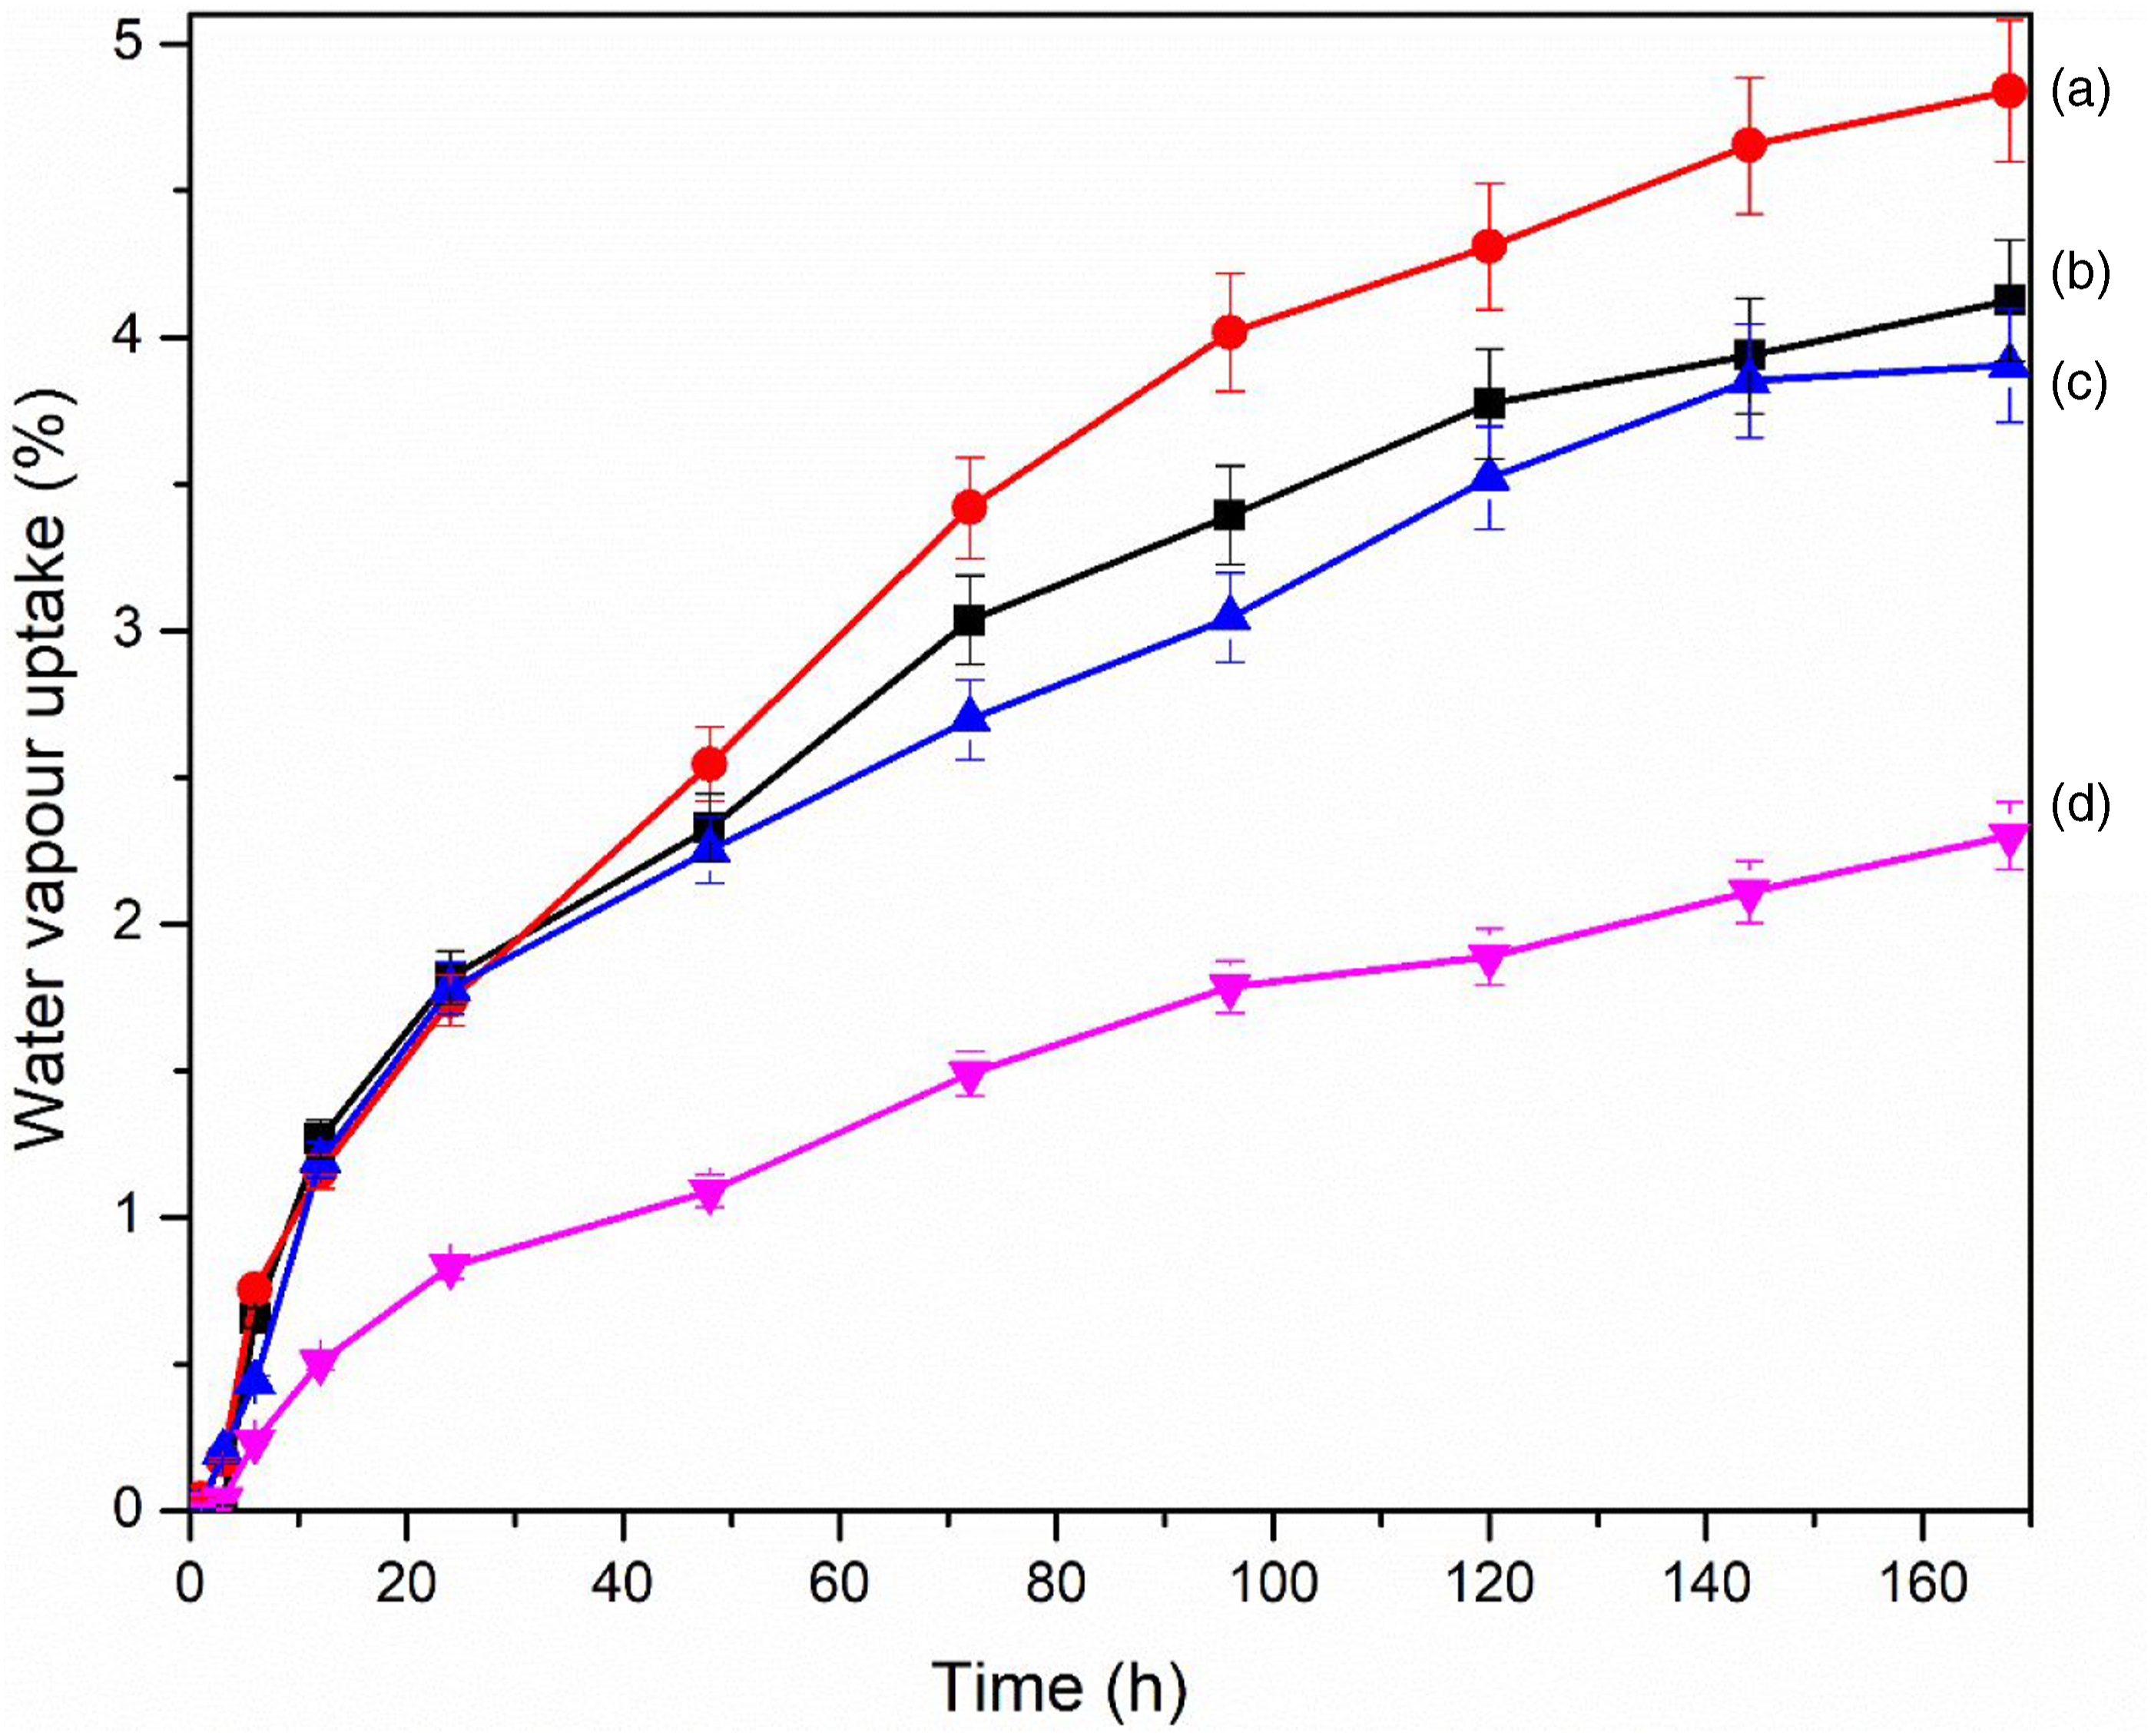
Limiting oxygen index test (LOI)
Limiting oxygen index (LOI) of the nanocomposite samples.
Conclusion
RHA collected from the dump yard of a bakery workshop was successfully utilized as a biofilter in forming PVC composite. An equal proportion of RHA and PVC (1:1) along with TA–CaO complex, ESO, and GO (0.1–0.5 phr) were used to prepare the biobased composite. FTIR and XRD analysis of the composite confirmed the interaction between the PVC matrix and the components. The introduction of RHA improved the physicochemical properties which were further enhanced with the addition of GO. Nanocomposite with 0.3 phr loading of GO showed relatively better thermal stability. On the other hand, nanocomposite reinforcing with 0.5 phr GO showed overall improvement in properties such as mechanical properties, chemical resistance, water vapor resistance, and flame retardancy. The morphological study revealed the homogeneous dispersion of the GO layer in the nanocomposite. The synergistic effect of silica present in RHA and GO improved the flame retardancy property of the composite to a great extent. The use of RHA as reinforcing filler along with other renewable green additives will decrease the production cost while improving biodegradability.
Footnotes
Declaration of conflicting interests
The author(s) declared no potential conflicts of interest with respect to the research, authorship, and/or publication of this article.
Funding
The author(s) received no financial support for the research, authorship, and/or publication of this article.