



Abstract
Calcium carbonate (CaCO3) is frequently added to polyethylene (PE) as a filler to reduce costs. An alternative to CaCO3, calcium fluoride (CaF2) was proposed in this research. PE/CaCO3 and PE/CaF2 composites in a wide composition range (0–60 wt.%) were prepared through a parallel twin screw extruder. Results indicated better interaction of CaF2 with PE matrix which improved samples yield stress. Statistical analysis showed the filler type was more influential factor on the yield stress while filler loading was not a statistically significant one. In contrast, crystallinity was strongly depended on the filler loading. The dynamic mechanical and rheological investigations revealed that PE/CaF2 composites had higher stiffness at ambient temperature and possessed lower viscosity below 40 wt.% of filler loading compared to PE/CaCO3 which could reduce the processing cost. Therefore, regarding its low price and good functional properties, CaF2 can be a promising alternative to CaCO3.
Introduction
According to Geyer et al. over 100 million tons of polyethylene (PE) based resins are produced annually to satisfy global demand making it the most used polymer, 1 accounting for 34% of the total thermoplastic resin use worldwide. This most versatile of polymers, lends itself to many consumer sectors, ranging from refuse bags to foamed products and medical devices.2–6
Ease of processability has allowed PE to dominate many commercial items, particularly thin films used in refuse bags and agriculture film.7–9 However, our focus for PE is in injection molding, and the anticipated growth of the resin in this sector. 8 Cost-effective thermal processing is vital in achieving competitiveness in a crowded market place, and it is a material’s melt behavior which dominating the processing cost factors.10,11 Energy input in conjunction with polymer resin price are among core instigators regarding PE and low-cost filler research.10,12,13 If the addition of filler can achieve a reduction in either of these parameters while still upholding mechanical performance or even improving upon a material’s mechanical attributes, then it can give significant economic benefits for manufacturers.
Calcium carbonate (CaCO3) is one of the most common substances found on earth. 14 It is frequently added to PE products as a filler 15 to reduce costs, either via decreasing the processing energy and/or the cost of bulk materials. 16 An alternative to CaCO3, calcium fluoride (CaF2) is proposed in this research paper. CaF2 is a commonly occurring substance on the Earth’s surface and is often mined as the gangue material fluorite particularly from zinc and lead mines. 17 Synthetic CaF2, the focus of this study, is a byproduct of the semi-conductor industry from the removal of fluoride from wastewater. 18 While CaF2 can be utilized as a component in some niche product areas, in particular as steel flux 19 and the glass and lens markets,20,21 large quantities of recovered synthetic CaF2 exist as a consequence and efforts must be made to divert this byproduct away from landfill in our growing Circular Economy. Under best scrutiny of this study, no evidence of using CaF2 as a significant replacement for CaCO3 as a PE filler in the manufacturing of injection molded parts exists. This study will investigate the feasibility of using raw CaF2 as a possible alternative to CaCO3 master batch as a filler in PE.
The mechanical properties of a polymer is frequently reported as being negatively affected by the addition of an inorganic filler.22–27 In this regard, the filler loading was investigated in a wide range, namely 0–60 wt.%, in this study. Strain-controlled deformation is the most prolific tool in determining the modulus of test specimens, and the importance of strain rate cannot be underestimated.28–31 The composite systems were therefore deformed under two strain rates varied by a factor of 20. Yield stress was a primary comparison factor along with Young’s modulus. Thermal behavior can be a significant indicator of how a material system will perform under loading.32,33 Differential scanning calorimetry techniques were employed to yield crystallinity changes of PE composites before and after hot melt extrusion processing.
The addition of solid particles exhibiting largely non-viscoelastic behavior can pose challenging obstacles concerning melt processing and decrease processability. Rheometric data across a temperature ramp and at isothermal processing temperatures can give a reasonable prediction of processing performance in traditional extrusion and molding equipment.32,34
In order for this filler comparison study to have a valuable and valid objectives a statistical approach to outcomes was sought. After characterizations were completed, both CaCO3 and CaF2 were pitted against each other under the scrutiny of ANOVA. Filler type was not compared in isolation however, filler quantity underwent statistical investigation as the correlation between the wt.% loading and composite saturation is also of primary concern.
Experimental
Materials and sample preparation
The PE resin used in this study was Lotrene Q TR131, which is a medium density hexane copolymer PE resin with the melt index of 0.2 g/10 min (@190°C/2.16 kg). The material was received in sealed double layer bags and was used without any further processing. CaCO3 was received in master batch pellet form Ancal. Co, grade 80. Filler content was observed at 82.5 wt.% calcium carbonate and 17.5 wt.% of polyethylene. The CaCO3 was presented in double layer moisture locked bags and used without further treatment. Recycled CaF2 was obtained from local mineral sources in its common raw gangue form. The mineral came in a large array of aggregate sizes which was preliminarily sieved to 2 mm to allow further lab processing. The material was dried initially in a hot air circulating oven at 80°C for 24 h. Then further sorted to 600 µm and using a ball mill, it was milled until a uniform consistency was achieved. Material that passed a 300 µm sieve was used. The powder was then further dried at 110°C until a moisture of ≤0.1% was reached. Synthetic CaF2 has a density of 3.18 g/cm3, a Young’s Modulus of 75.8 GPa and Bulk Modulus of 82.7 GPa. 35 A Leistritz Micro 27, co-rotating, twin screw extruder with a 38:1 length to diameter ratio was used to compound both the CaCO3 and the CaF2 with the PE pellet. The extruder had 8 heated barrel zones rising in 10°C increments from 80°C at the throat to 160°C. There were two further heated die zones increasing in 20°C increments. This left the terminal temperature zone of the extruder at 200°C. The compounding ratios were achieved by using two volumetric feeders that simultaneously fed the extruder’s screws which was set at the rotational speed of 80 RPM. One gravimetric feeder fed PE pellet and the other fed filler material into the extruder through the hopper, both were tested before trials to ensure correct mass per second rate. The filament strand drawn through an ambient temperature water bath and then pelletized using a sharp edge shear-grinder. The wt.% of filler to PE used for investigation and the corresponding notations of samples has been shown in Table 1.
The corresponding notations of composites.

An Arburg™ ALL-Rounder 370E was used to mould the compounded material. The injection molder had a maximum clamping force of 600 kN, screw diameter of 30 mm and a stroke volume approaching 85 cm3. A family type, tool steel, oil cooled mould was used, containing standardized tensile, impact, dynamic mechanical and rheological test specimens in accordance with ISO 294-1 and ISO 6239 geometries. All material were stored in a hot air circulating oven at 60°C for 24 h prior to use to remove any residual surface moisture post pelletizing. The temperature profile for molding was 50°C at the hopper, increasing to 225°C at the nozzle. Injection speed was optimized at 80 mm/s. The dosage stroke was 55 mm with circumferential screw speed at 350 mm/s. A holding pressure of 1000 bar for 10.4 s was used. Cooling time was set to 35 s with a back pressure of 40 bar.
Characterization
Thermal characterization of samples were examined by Differential Scanning Calorimetry (DSC) test using a Thermal Analysis [TA] DSC 2920 with a refrigerated cooling system, each batch was tested three times for reproducibility. The samples were weighed out between a 10–12 mg window, and using TA pans were tested without lids. The tests were conducted in a nitrogen gas environment. Initially each sample was heated from 20°C to 130°C at 10°C/min to reduce moisture interference at boiling point and to remove PE’s thermal history. The samples were then cooled to −50°C at 10°C/min and held isothermally for 1 min. The characterization curve used a 10°C/min ramp between −50°C and +170°C.
Tensile testing was conducted on a Zwick Roell Z010. Two strain rates of 5 mm/min and 100 mm/min were used. Tests were stopped at 20% strain value or until mechanical failure occurred which was determined as an 80% drop off from max stress point. Five samples per batch for each strain rate were tested for tensile strength and Young’s modulus.
The gold sputtered cryogenically fractured-surfaces of samples were explored via scanning electron microscope (SEM, TESCAN-MIRA//FE-SEM).
Dynamic mechanical analysis (DMA) tests were conducted on a Thermal Analysis Q800 DMA at a heating rate of 3°C/min. A single cantilever clamp orientation was used. Each sample was subjected to a temperature ramp between −110°C to 100°C at a sinusoidal displacement of 12 µm at 1 Hz.
The rheological properties of samples were studied using the Discovery Hybrid Rheometer 2, with oven heating assembly (DHR-2, TA Instruments). The samples were placed between two flat plates of 25 mm diameter after calibration of the zero gap. For the analysis of pure polymer and composite, a frequency sweep was conducted at 2% strain at 230°C with a gap width of 1 mm. The sweep underwent frequency starting at 0.01 to 100 Hz. Applied strain at 2 was within the linear viscoelastic region of all the samples.
Results and discussion
Thermal analysis
Figure 1 compares the non-isothermal DSC thermograms of virgin PE with some of its calcium carbonate and calcium fluoride-filled composites. The comprehensive results are listed in Table 2. As seen in Table 2, incorporation of CaCO3 slightly increased the onset and peak temperatures of PE melting however, CaF2 had an adverse effect. Nevertheless, incorporation of the fillers into PE was not significantly affected the melting characteristics. For all sample, a sharp single melting peak with a vague shoulder at lower temperatures was observed. In general, for semi-crystalline polymers such as polyethylene, the thickness, and perfection of crystals determine the level of melting temperature. 36 Therefore, the existence of the shoulder at the lower temperatures can be attributed to the non-uniformity and imperfection state of crystals in the polyethylene. Due to higher thermal conductivity of calcium fluoride than calcium carbonate, it was expected that the CF composites were exposed to the lower amount of enthalpy which could alter the degree of crystallinity. Figure 2 illustrates the effect of filler type and content on the enthalpy and crystallinity of the samples. As shown in Figure 2(a), by increasing the filler content the enthalpy of composites dwindled for both systems. The decline was more distinctive at the 20 wt.% of filler content for both composites. Since organic fillers increase the thermal conductivity of polymers melt, the decline in the enthalpy of composites by increasing the filler content was a predictable trend. However, in spite of the higher thermal conductivity of calcium fluoride, the enthalpy of PF composites was generally higher than the PC ones in the same filler content. To find more about this, a statistical analysis was applied to DSC results. Actually, by applying the statistical method, the conclusions will be objective as opposed to judgmental in nature. 37

DSC thermograms of virgin PE and its composites with calcium carbonate and calcium fluoride at the heating rate of 10°C/min.
DSC data for PE/CaCo3 and PE/CaF2 composites at the heating rate of 10°C/min.


Comparison of the effect of inorganic fillers type and content on (a) the enthalpy level and (b) the crystallinity of PE composites.
In this regard, an experimental design based on general full factorial method was employed. Two treatment factors, namely filler content and filler type at 6 and 2 levels, respectively, were considered with three replications. The results were examined using analysis of variance technique (ANOVA). There are two main assumptions for the probability distribution of the responses in ANOVA, i.e. independence and normality. Normality assumption can easily be checked using a normal probability plot. If the hypothesized distribution adequately describes the data, the plotted points will fall approximately along a straight line. Independence assumption also can be evaluated through plotting response data in time order of data collection. In this regard, any tendency to positive or negative residuals can violate the independence assumption. 38 Figure 3 shows the normal probability plot and the plot of residuals vs. observation order for the response of enthalpy. The distribution of points along the straight line and the random distribution of residuals within the observation order indicated that both assumptions were fully satisfied. The results of ANOVA for the confidence interval of 95% have been summarized in Table 3. Since among the observed value of F, just the F-value of filler content is greater than the critical F values (F0.025,1. 24 = 5. 27 and F0.025,5,24 = 3.15) the null hypothesis is rejected. It means among the independent variables and their interactions, the only one that had statistically significant effect on the enthalpy changes was the filler content and the variability of the results of other factors simply was rooted in the natural source of variation such as sampling etc. The same trend was observed in the case of crystallinity (Figure 2(b)). By increasing the filler content in both systems the degree of crystallinity fell off, however, the PF composites showed a higher amount of crystallinity in the same amount of filler content. Nonetheless, the ANOVA results revealed that the filler content was the only statistically significant factor (Table 4). In other words, despite their physiochemical differences, both inorganic fillers at the same content have a similar impact on the polyethylene thermal characteristics.
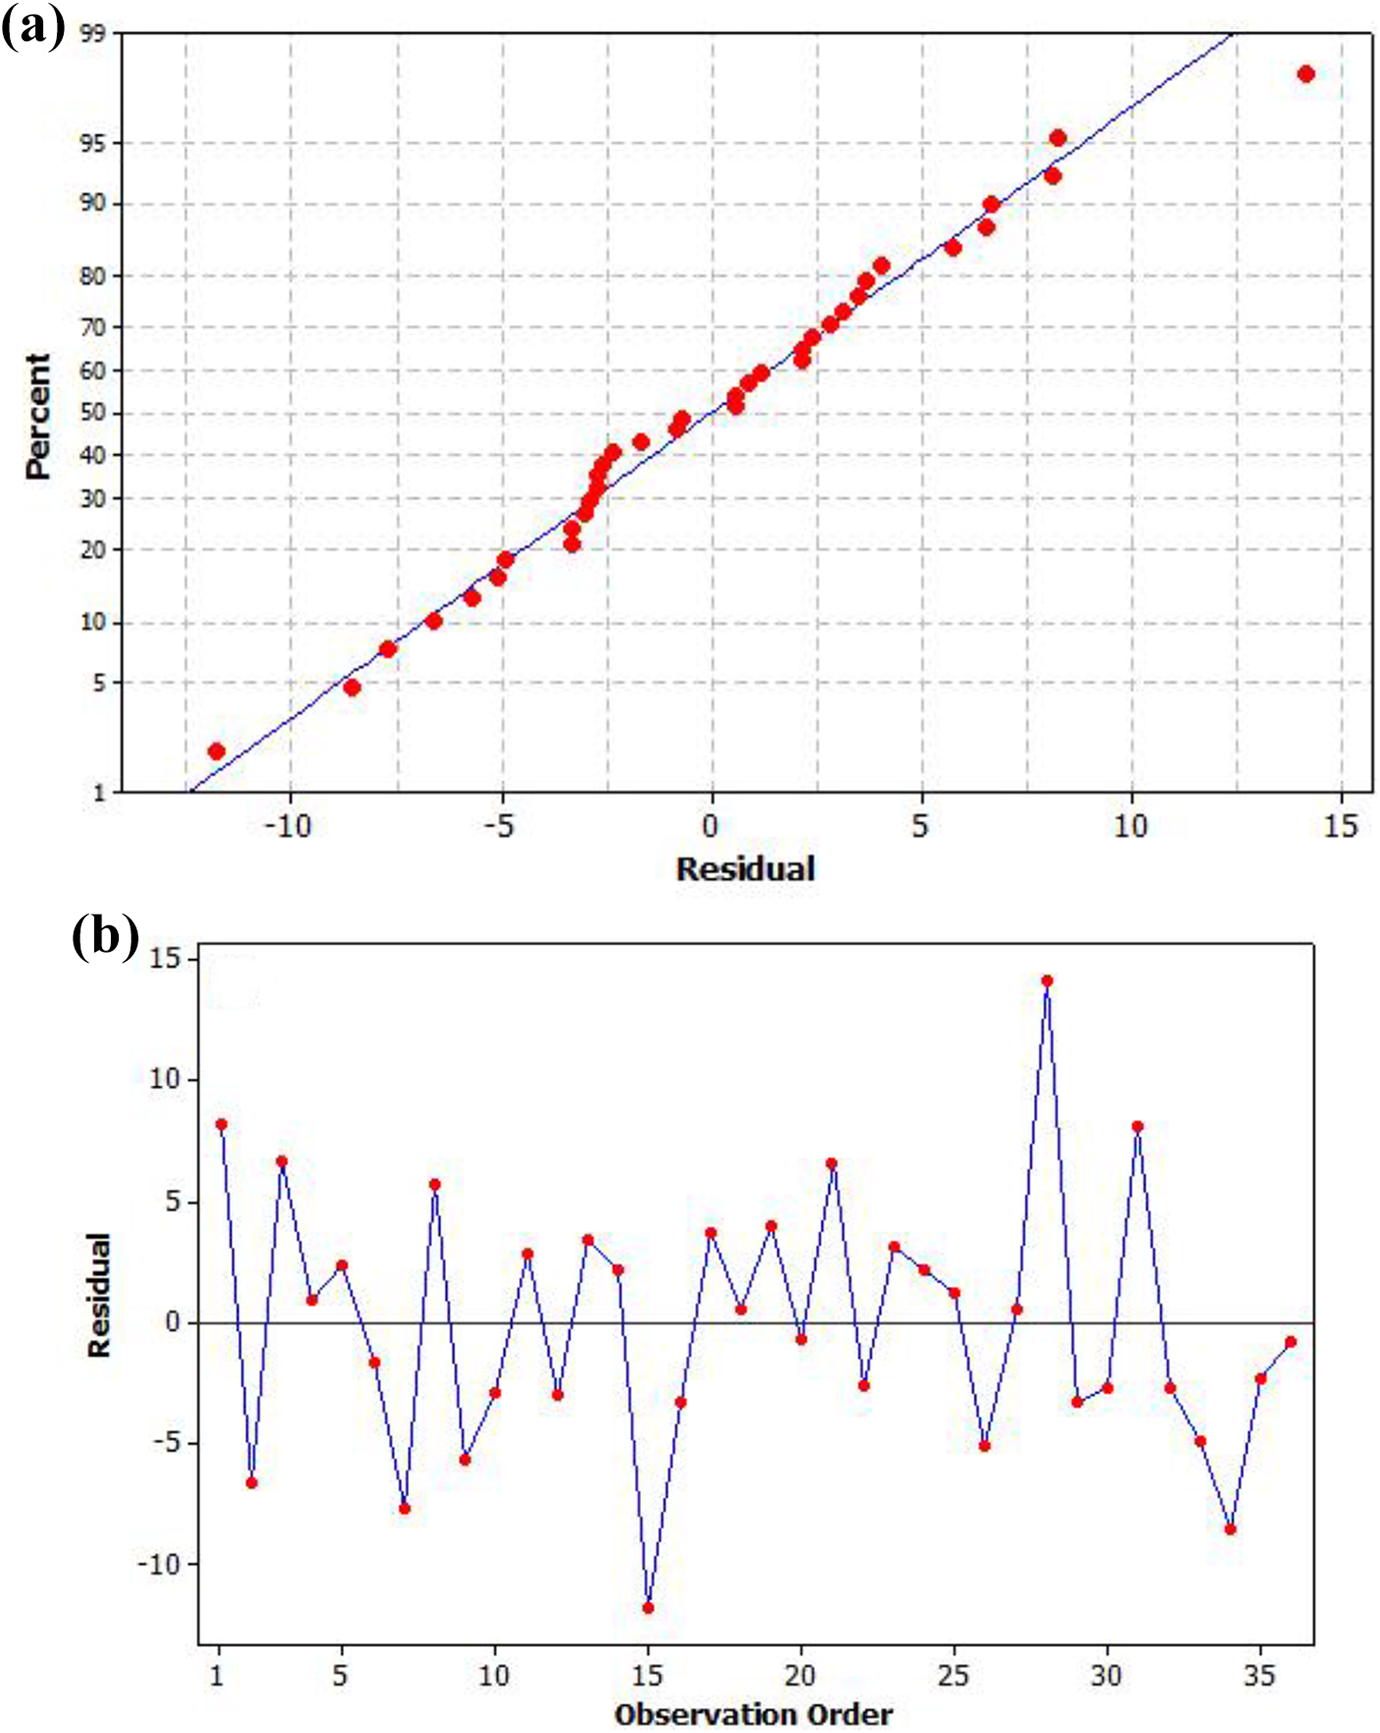
(a) Normal probability plot and (b) residuals vs. observation order of the response of enthalpy.
Analysis of variance for enthalpy.

DF: degree of freedom.
Analysis of variance for crystallinity.

Mechanical properties
The yield stress and the Young’s modulus of the samples were measured at slow (5 mm/min) and fast (100 mm/min) cross-head speeds, to study the influence of the deformation rate on the mechanical behavior. Table 5 summarizes the results of the tensile tests. Each data is an average of 5 replications. Generally, the increase of the strain speed resulted in higher tensile properties. Similar results have been reported by other researchers as well.39,40 According to the time-temperature superposition principle, the time and temperature correspond with each other. Increasing the strain rate would offer an equivalent effect as the decreasing of temperature has. In other words, high strain rates support the elastic properties of materials while low strain speeds favor the energy-damping aspects.
Analysis of variance for yield stress response.

Bold values indicate that the effects of their corresponding source on the investigated property is statistically significant.
Figure 4 illustrates the yield stress and Young’s modulus variations of PC and PF composites over the range of filler content. As seen the yield stress and the Young’s modulus tended to ascend by increasing the fillers loading. However, PF composites demonstrated greater tensile properties compared with PC ones in the same filler content. Again, to provide an objective conclusion over the tensile results, the ANOVA method was employed. Tables 5 and 6 summarize the result of ANOVA for yield stress and Young’s modulus responses, respectively. Interestingly, according to Table 5, the influence of filler content on the yield stress of composites was not statistically significant while the most influential factor was the strain speed. Moreover, from the statistical point of view, except for the interaction of filler content and strain speed, the effect of other interactions between the independent factors on the yield stress was negligible. However, it is obvious from Table 6 that all independent factors even their interactions- except for interaction of filler type and strain speed- had a significant effect on Young’s modulus. The better mechanical performance of PF samples compared to PC ones can be attributed to the better interfacial interaction between PE matrix and CaF2 which was clear through SEM images (Figure 5) As seen in Figure 5(a) and (b), a distinct gap between CaCO3 particles and PE matrix was obvious. Whereas the CaF2 particles were well-covered by the matrix and no gap or discontinuity in interfacial area was observed. While the nature of the interfacial interaction between CaCO3 and polymers has been thoroughly investigated, 41 the information on the interaction of CaF2 particles and polymers are limited. Sanchez-Leija et al. compared the effect of pristine CaF2 and surface modified one on the crystallization behavior of PET. 42 For both fillers, the filler particles were well embedded in PET matrix and surface modification only decreased the filler tendency for agglomeration. De Leeuw et al. showed that CaF2 is a strong ionic catalyst with a potential of formation H-F hydrogen bonding. 43 It seems that the good wettability properties of CaF2 in polymer matrix can be attributed to its possibility in forming hydrogen bonds between F atom in the filler and hydrogen groups in polymers.

The variation of yield stress and Young modulus as a function of filler content for PE/CaCO3 and PE/CaF2 composites.
Analysis of variance for Young’s modulus.

Bold values indicate that the effects of their corresponding source on the investigated property is statistically significant.

SEM micrographs of (a) PC 20 (b) PC 60 (c) PF20 and (d) PF 60. The photomicrographs were obtained with an identical magnification.
This result shows that calcium fluoride can be considered as a potential filler for polyolefins where both mechanical performance and the production cost are concerned.
Dynamic mechanical analysis
Figure 6(a) presents the storage modulus of PF composites as a function of temperature. For composites with the filler content lower than 20 wt.% the storage modulus did not change significantly compared with virgin PE. While in high-loaded PF composites (more than 20 wt.%) the storage modulus increased over the entire range of temperature as filler content increased. A similar manner was observed for PC composites (results are not shown). Figure 6(b) compares the storage modulus of the samples of PC-60, PF-60, and virgin PE. As seen, the storage moduli of composites were higher than the virgin PE over the whole range of temperature, while the storage modulus of PC-60 was higher than PF-60 at minus temperatures and got lower by increasing the temperature above zero. As the performance of the polymer composites at ambient conditions is of interest to industrial applications, Table 7 summarizes the dynamic mechanical characteristics of samples at the ambient temperature. Compared to virgin PE, the stiffness and moduli of the composites at the ambient temperature increased by increasing the filler content. In the meanwhile, PF composites at the ambient temperature presented higher dynamic mechanical properties compared to PC composites. It can be assigned to better interfacial interaction between CaF2 particals and PE matrix as was clear in SEM images. As presented in Table 7, overall PF samples showed lower loss modulus than PC samples at ambient temperature. It seems that better interfacial interaction in PF samples led to more elastic and stronger bonding between the composite constituents resulting in lower loss properties and higher stiffness at ambient temperature.
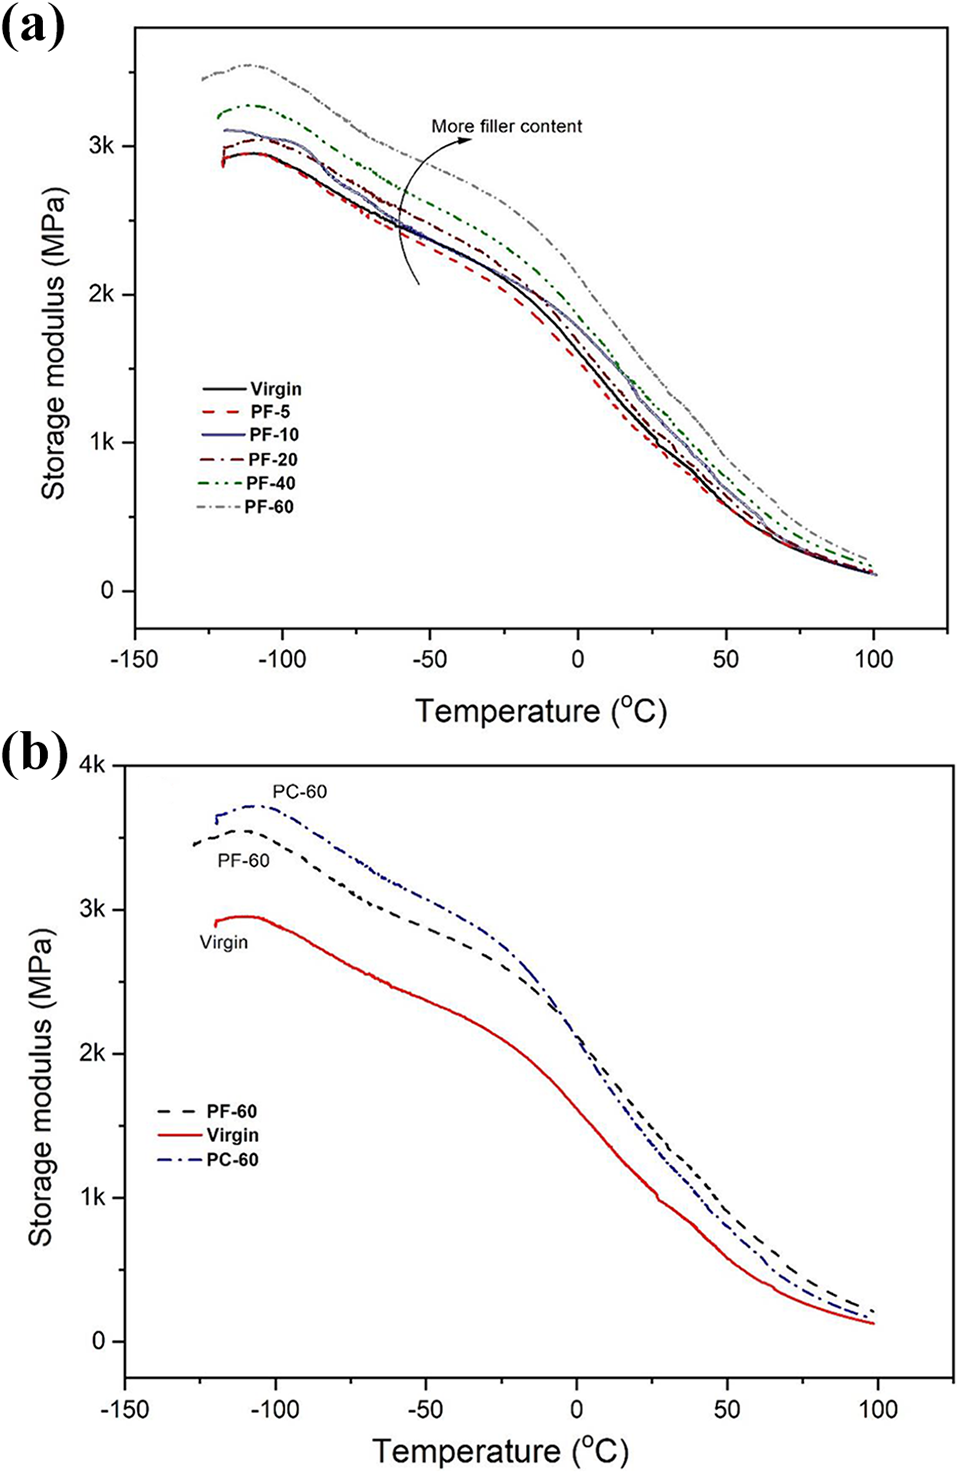
Temperature dependence of storage modulus of (a) PE/CaF2 composites (b) PF-60, PC-60 and virgin PE.
Dynamic mechanical properties of PE/CaCo3 and PE/CaF2 composites at ambient temperature.

Rheological analysis
Figures 7 and 8 demonstrates storage modulus (G’) and the absolute value of complex viscosity (

Dynamic rheological characteristics of PE/CaCO3 (a) storage modulus (b) complex viscosity.

Dynamic rheological characteristics of PE/CaF2 (a) storage modulus (b) complex viscosity.
By comparing the relative viscosities (normalized viscosity of the composites by the matrix (PE) contribution) of both composites their different rheological behavior will be more obvious. Figure 9 compares the relative viscosities of PC-20, PC-60, PF-20, and PF-60. As can be seen, the lowest and highest viscosities belong to PF-20 and PF-60, respectively. The viscosity of PF-60 tended to rise at low frequencies while in the case of PC-20 and PC-60 the relative viscosity had almost a constant trend over the whole frequency range. The divergence of the relative viscosity of PF-60 at lower frequencies indicates network behavior which is resulted from good interaction of CaF2 particles and PE matrix at high concentrations. 44

Relative viscosity composites as a function of frequency for PC and PF samples.
Furthermore, incorporation of CaCO3 and CaF2 showed opposite effects on the crossover point in dynamic rheology test. Higher amount of CaCO3 shifted the crossover points of the samples toward higher frequencies while PF samples behaved inversely (Table 7). The G′-G″ crossover point corresponds to the characteristic elastic time of the composites describes as. 44

where
Figure 10 shows the normalized characteristic elastic time versus the filler content for both types of composites. The characterization elastic time of PF samples went up clearly as CaF2 content increased. While the characteristic elastic time of PC composites tended to decrease slightly by the increase of filler loading. This behavior can be related to better interaction of CaF2 particle with the polymer matrix which constrains movement ability of polymer chains and prolongs the relaxation times.

Normalized characteristic elastic time as a function of the filler content.
Conclusion
Calcium carbonate (CaCO3) is widely used in the polymer industry to reduce costs either via decreasing the processing energy and/or the cost of bulk materials. In this study, reclaimed calcium fluoride (CaF2), diverted from landfill, was introduced as a potential replacement for calcium carbonate. In this regard, PE/CaCO3 (PC) and PE/CaF2 (PF) composites were prepared in the wide range of filler content, i.e. 0–60 wt.%, through a parallel twin screw extruder. Standard samples then were made through injection process and their thermal, mechanical and rheological properties were studied in detail. Statistical analysis of thermal properties revealed that the enthalpy and crystallinity of the samples were independent from filer type and determined by filler content. Whereas, the most influential factors on yield stress of samples were the strain speed of the test and the filler type and the effect of filler content on the yield stress was not statistically significant. Overall, CaF2 was more efficient in improving the mechanical properties of PE especially its young modulus compared to CaCO3. This could be thanks to the better interfacial interaction of CaF2 with PE matrix which was observed through SEM images. Moreover, the dynamic mechanical analysis demonstrated that PF composites had higher dynamic mechanical properties at the ambient temperature compared to PC ones. The rheological investigation proved that the incorporation of calcium fluoride into PE for the amount of less than 40 wt.% could decrease the complex viscosity of the melt and improve its flowability. Therefore it seems that due to its low price and functional performance, CaF2 can be a promising alternative to CaCO3 for the injection molding of PE parts.
Footnotes
Acknowledgements
The authors would like to thank Enterprise Ireland and Career Fit Plus program for supporting this research. This work reflects only the authors’ view and neither Enterprise Ireland nor the European Commission are responsible for any use that may be made of the information that it contains.
Funding
The author(s) disclosed receipt of the following financial support for the research, authorship, and/or publication of this article: This project has received funding from Enterprise Ireland and the European Union’s Horizon 2020 research and innovation program under the Marie Skłodowska-Curie grant agreement No. 847402.
