
Abstract
The low fire resistance property of pristine polyurethane (PU) restricts its areas of usage in domestic applications and especially in the furniture industry. Therefore, PU based materials should be non-flammable besides having favorable mechanical and chemical properties. In this study, boric acid (BA) was added to the polyurethane foam as fire retardant. The effect of amount of BA (5%, 10%, and 15% (w/w)) on fire retardancy was examined. The thermal properties and the surface morphology of the structures were investigated. The amount of BA affected surface morphology. It was observed that BA affects the density and compressive strength in three directions with the physical change it causes in the cell structure. In the X-ray diffraction analysis of the unmodified hard polyurethane and the hard polyurethanes containing BA at different amounts (5%, 10%, and 15% (w/w)), the peaks were observed to appear in three different groups. The thermal stability of the rigid PU treated with BA was investigated via thermogravimetric analysis and the limiting oxygen index (LOI) analysis. The electromagnetic interference shielding effectiveness (EMI SE) was measured via a system consisting of two anechoic boxes and receiving and transmitting antennas. Four different temperature zones were observed when examining the thermal behavior via differential scanning calorimetry. Single source flame test, UL94 test and cone calorimeter tests were performed to determine the ignition property of BA doped PU. It was determined that BA is a better fire retardant than other chemicals also for the low toxicity of the combustion products formed.
Introduction
Polyurethanes (PUs), which were discovered in 1937 by Otto Bayer and his colleagues, are polymers that are obtained from monomer units joined by urethane linkages. 1 PUs are produced by a chemical reaction between diisocyanate and polyester diol. 2 Currently several forms of PUs including thermoplastic, flexible, rigid, and water-borne PUs are used in practice.3,4 PUs are used in different application areas depending on their structural properties that vary with the specific precursors and the nature of the diols and the diisocyanates used. 5 Rigid polyurethane foams (PUFs) are widely used in industry due to their unique properties such as excellent mechanical properties and insulating properties. While rigid PU foams are used for wall and roof insulation, flexible PU foams are used in furniture industry. PUs are also used in automobiles, leather, textiles, footwear, and adhesives.6–10 PUs should maintain their size and thermal characteristics over long-term use. Therefore, several methods have been developed for improving their combustion properties, thermal conductivity, and other physical properties.
Generally PUs are flammable and they emit toxic gases during combustion.11,12 The most common method to improve the flame retardancy of PUs is to incorporate flame retardant fillers into the polymer matrix. The important advantage of this method is that the structure of PUs is preserved. The double sided surfacing approach has shown remarkable fire retardancy performance with PUs.13–15 Current studies indicate that organic coatings (i.e., chitosan/alginate and chitosan/lignosulfonate) on PUs have shown to provide the highest thermal insulation ratio while emission of smoke and toxic gases are reduced.16,17 In a surface coating technique developed by Shi et al. (2020), a polymeric material with titanium carbide nanosheet surfaces—a multifunctional nanohybrid—was produced from melamine cyanurate (MCA) through hydrogen bonding interactions and the material was reported to have excellent mechanical and fire resistant properties. 18 Moreover, Wang et al. found that the Ti3C2Tx coating modified with polyethylene glycol (PEG) and thermoplastic PU nanocomposites increased the mechanical properties and fire resistance. 19
Boron compounds have been widely used as “green” flame retardants in polymer materials. Boric acid (BA) is a cost-effective, pearl-like, white, bright, and oily substance that crystallizes in the form of sheets. BA—an environmentally friendly, heat resistant, white crystalline compound with a density of 1.435 g/cm3 at 20°C, melting point of 170.9°C and boiling point of 213°C—is mainly used in production of boron-based compounds and salts such as borax. In industry, BA is used for production of heat resistant and durable glass with hard surface. It is also used in fire-proof fabrics, electrolysis baths, leather production, porcelain polishing, steel hardening, production of certain drugs, and fungicides for plants.
Much effort is put into incorporation of flame retardant materials into polymers for enhancing their combustion resistance. Various materials (e.g., boron, borax, boric acid, and clay) may be used as flame retardants.20–26 BA is a cost-effective and non-toxic chemical that can form strong hydrogen bonds with starch and enhance its water and thermal stability. 27 Flame retardant PUFs can be produced by mixing and reacting one or more active hydrogens, an organic polyisocyanate, and an acidic boron compounds with polyol—a low molecular weight compound—in the presence of an organo-metal urethane catalyst. 28 Different polyols such as N, N′-di (methyleneoxy-4-hydroxybutyl) urea, N, N′-di (methyleneoxy-3-hydroxybutyl) urea, N, N′-di (methyleneoxy-2-hydroxymethylpropyl) urea and BA were successfully used as flame retardants. 29 Recently, flame retardancy and thermal stability of BA containing polymers were investigated in terms of surface coating.30,31 Aside from this, in his studies Paciorek-Sadowska et al. have shown that the borate obtained by using new boron-organic compound as polyol is very useful in PU production and as flame retardant. In order to reduce the risk of fire via a simple preparation method, 32 Xu et al. added H3BO3 to the polyurethane prepolymer (PUP) in certain proportions by weight. Especially, when the amount of BA added to the mixture is 10% by weight, the total heat insulation and the total smoke release values were observed to decrease. 33
Although there is much research on the use of PU functionalized with commercial flame retardants, there is not much information neither on how BA functions as a physical barrier in hard PUs during combustion nor on how doping with BA affects the morphological structure, mechanical and chemical properties of PUs.
In this study, we targeted at producing a thermally stable, flame retardant BA doped PU by incorporating boric acid to polyol at different ratios. The chemical structure, mechanical properties and combustion behavior of boric acid doped PUs were investigated. Their surface morphology and composition were determined via scanning electron microscopy/energy dispersive X-ray spectroscopy (SEM/EDS). Their structural analysis was made via X-Ray Diffraction (XRD), thermogravimetric analysis (TG/DTA), differential scanning calorimetry (DSC) and by determining ignitability (The single source flame test, UL 94 vertical flame test and Cone Calorimeter), limiting oxygen index (LOI), and electromagnetic interference shielding effectiveness.
Experimental
Materials
Rigid polyurethane (polyol-pol senta 77, isocyanate-isonate 200) were purchased from OSA Kimya (Turkey). The density and viscosity of the polyol at 25°C were 1.10 g/cm3 and 400 mPas, respectively. The density and viscosity of the isocyanate at 25°C were 1.15 g/cm3 and 300 mPas, respectively. Boric acid (99.8% purity) obtained from ZAG Kimya (Turkey) was used as flame retardant.
Preparation of rigid polyurethane
Polyol and isocyanate with densities close to each other were used in equal amounts. They were mixed at 1000 rpm for 100 s and then the mixture was poured into silicone molds. This sample was labeled as pristine. BA was added to the 1:1 mixture of polyol and isocyanate at a weight percentage of 5%. Since BA was added to the mixture before adding isocyanate, the polyol could be mixed with the additive material adequately. The mixture was poured into silicone molds after isocyanate was added. These processes were repeated to prepare samples containing BA at 10% and 15% weight ratios. The structures of these polyurethanes are shown in Figure 1. Based on the amount of BA added, the samples were labeled as BOA05, BOA10 and BOA15.
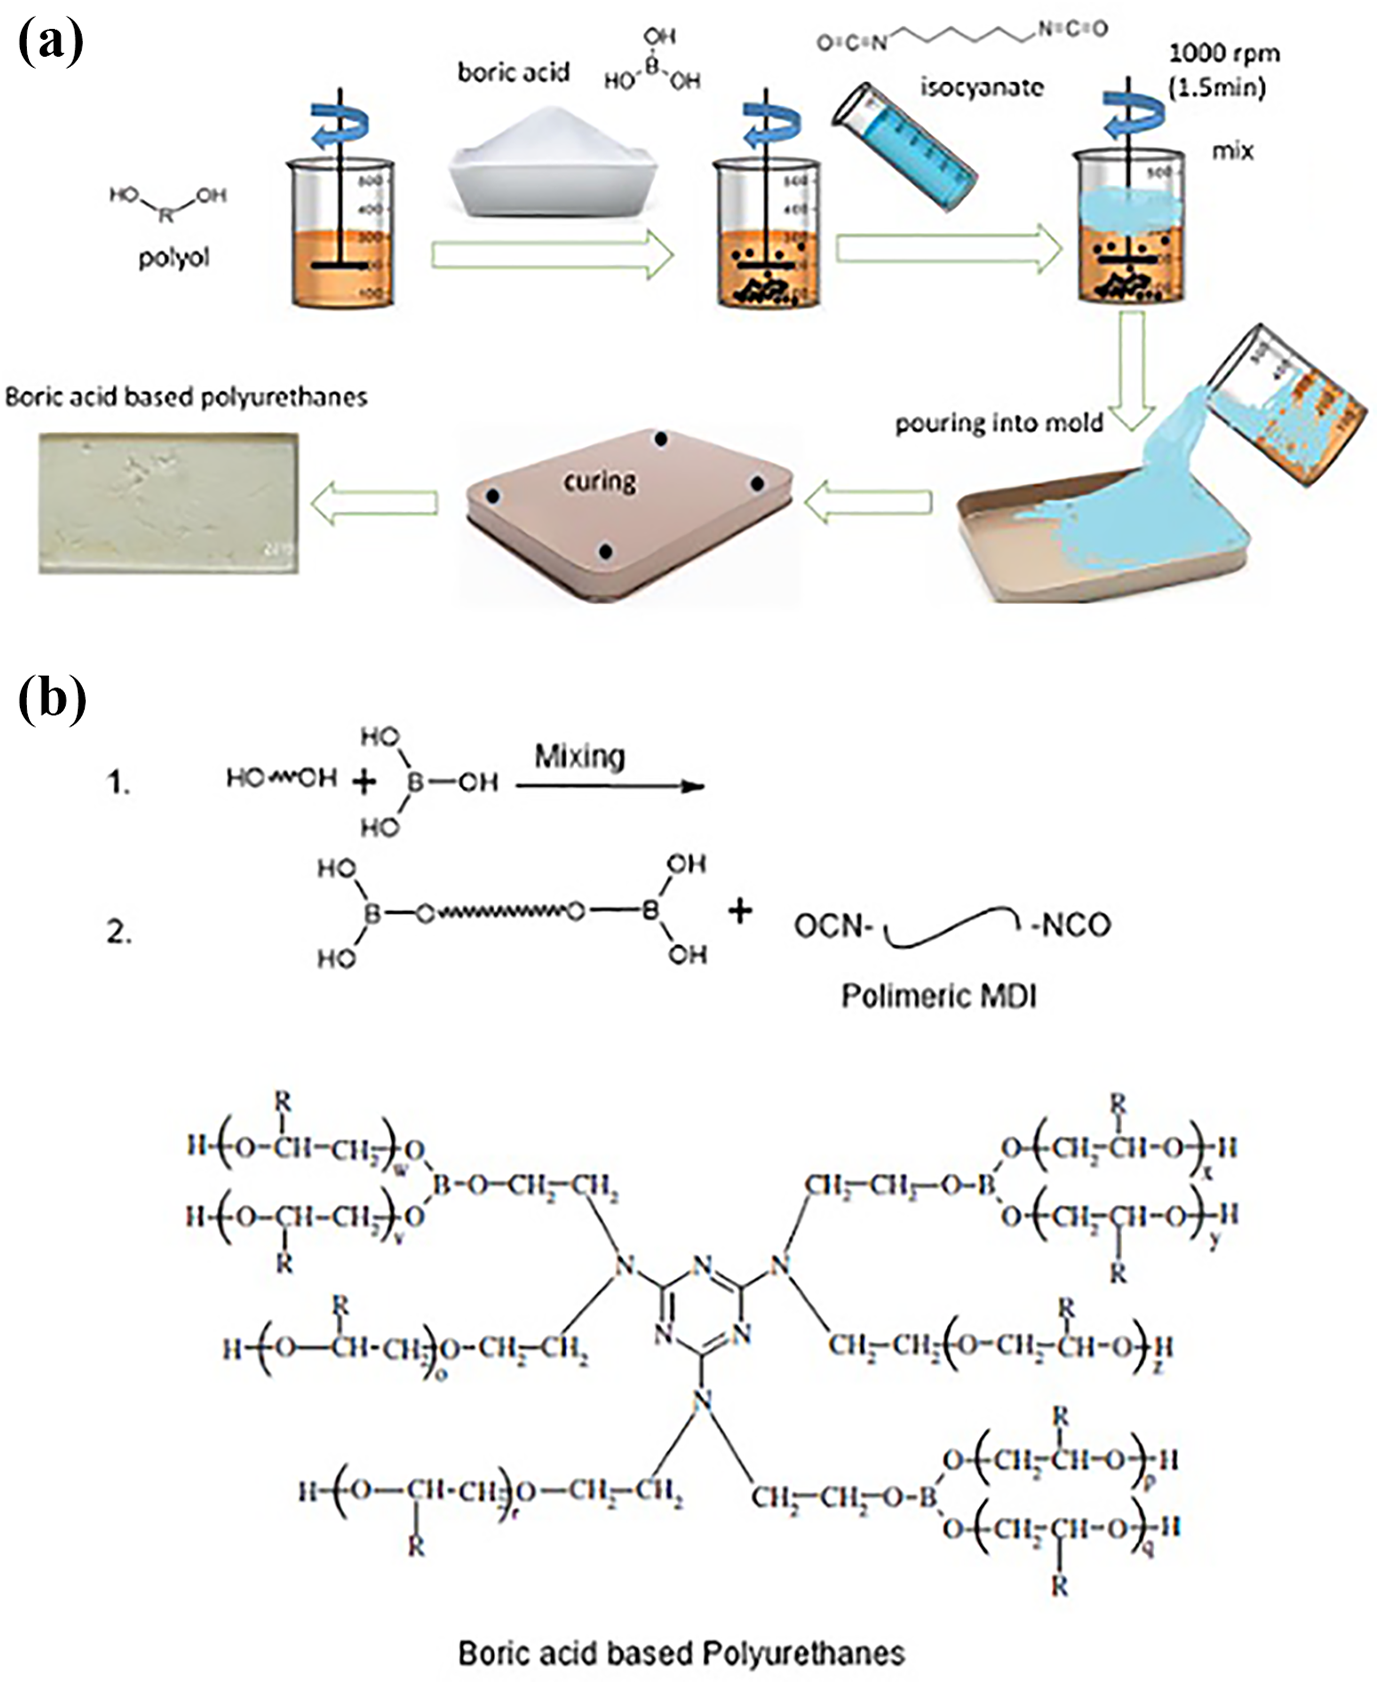
(a) Schematic representation of the boric acid-based PUs fabrication process and (b) structures of boric acid-based PUs.
Characterization
The morphology of polyurethane and the approximate elemental content were examined via SEM/EDS (FEG-250, QUANTA), at an acceleration voltage of 20 kV. The XRD analysis was performed on a BRUKER XRD system (AXS D8 Advance). The compressive strength of PU was determined according to ISO 844: 2009 standard via a Shimadzu AGS-X universal tester. The sample size was 40 × 40 × 40 mm3 and the experiments were repeated five times. The TG/DTA analysis of PU was performed by a thermogravimetric analyzer (Seiko SII TG/DTA 7200, TA Instruments). The analyses were performed under nitrogen flow of 60.0 ml/min, and the samples were heated from room temperature to 800°C at 10.00°C/min. In the TGA analysis, initially (in the original state) the weight of each sample was approximately 5 mg. The DSC analysis was performed with a Perkin Elmer DSC 400 and the analyses were performed under nitrogen flow of 20.0 ml/min, and the samples were heated from 25.00 to 300.00°C at 10.00°C/min. Flammability of PU was studied by an ignitability test according to TS EN ISO 11925-2 standard. The dimension of the samples was 90 × 250 mm2. The flame retardant properties of PU was determined according to UL 94 test standard. The dimensions of specimens was 130 × 13 × 3 mm3. The flame behavior of the rigid PU was determined according to ISO 5660 standard via a cone calorimeter under a heat flux of 35 kW/m2 using a Siemens Oxymat 6. The size of the sample wrapped in an aluminum foil was 100 × 100 × 5 mm3. The limiting oxygen index (LOI) test of PU was performed via a YY 907 type oxygen index test instrument according to the ASTM D 2863 standard. The dimension of the samples was 127 × 10 × 10 mm3. A 6 GHz spectrum analyzer from Rohde & Schwarz was used for determining the electromagnetic interference (EMI). The dimension of the samples was 200 × 150 × 10 mm3. The measurements were made in two steps. In the first step, a reference value was determined and in the second step the samples were analyzed. The difference between these two values gave the effectiveness of electromagnetism shielding.
Statistical analysis
The data obtained in this study were evaluated using the SPSS Statistics Base 22.0 statistical program. Simple variance analysis (ANOVA tests) was used for to interpret the data. Homogeneous groups were determined via Duncan’s test for to evaluate the significant differences in the analysis. The effect of the amount of boric acid on the combustion size was determined with 5% uncertainty.
Results and discussion
Mechanical properties
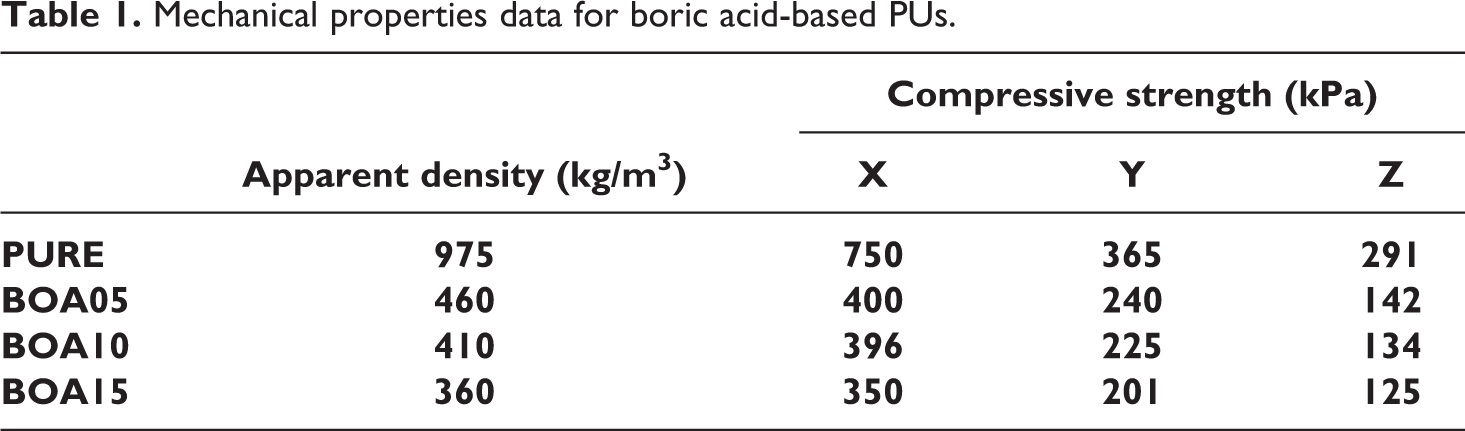
In order to investigate how BA doped at different ratios (5 wt%, 10 wt% and 15 wt%) affected the mechanical properties of pure PU, the compressive strength was measured in three different directions as X (parallel direction) and Y, Z (vertical direction) (Table 1). The compressive strength of the BA doped samples was observed to decrease in all directions as the density decreased since the amount of the additive—BA—increased the density of cross-linking decreased. This change in the density caused physical swelling.
Mechanical properties data for boric acid-based PUs.
Morphological observation (SEM/EDS)
SEM images was used to examine the surface morphology of the pristine and the BA doped hard PUs. As can be seen in Figure 2, incorporation of BA increased the volume of the foam cell and the surface structure became more porous. This is due to the gases released in the reaction. The energy that is released upon addition of BA was observed to increase cell nucleation followed by breaking of the nucleus walls leading to increase in the cell volume (Figure 2(d)). The gradual increase in the BA content caused agglomeration and this increased particle size and foam cell size. In Figure 2(c), it can be seen that the heavily agglomerated particles are formed as crystals formed in the samples containing BA at a ratio of 15% (w/w) due to the release of the gases formed in the exothermic period. It was observed that as the amount of BA increased, the surface porosity increased. These results are consistent with those reported in other studies.34–36 Another important parameter is distribution of the dopant inside the PU matrix. It can be seen in the SEM images of the cross-sections that breaking points of PU and its distribution also changed as the BA content changed. The SEM images revealed that BA added at different rates was evenly distributed in the PU.
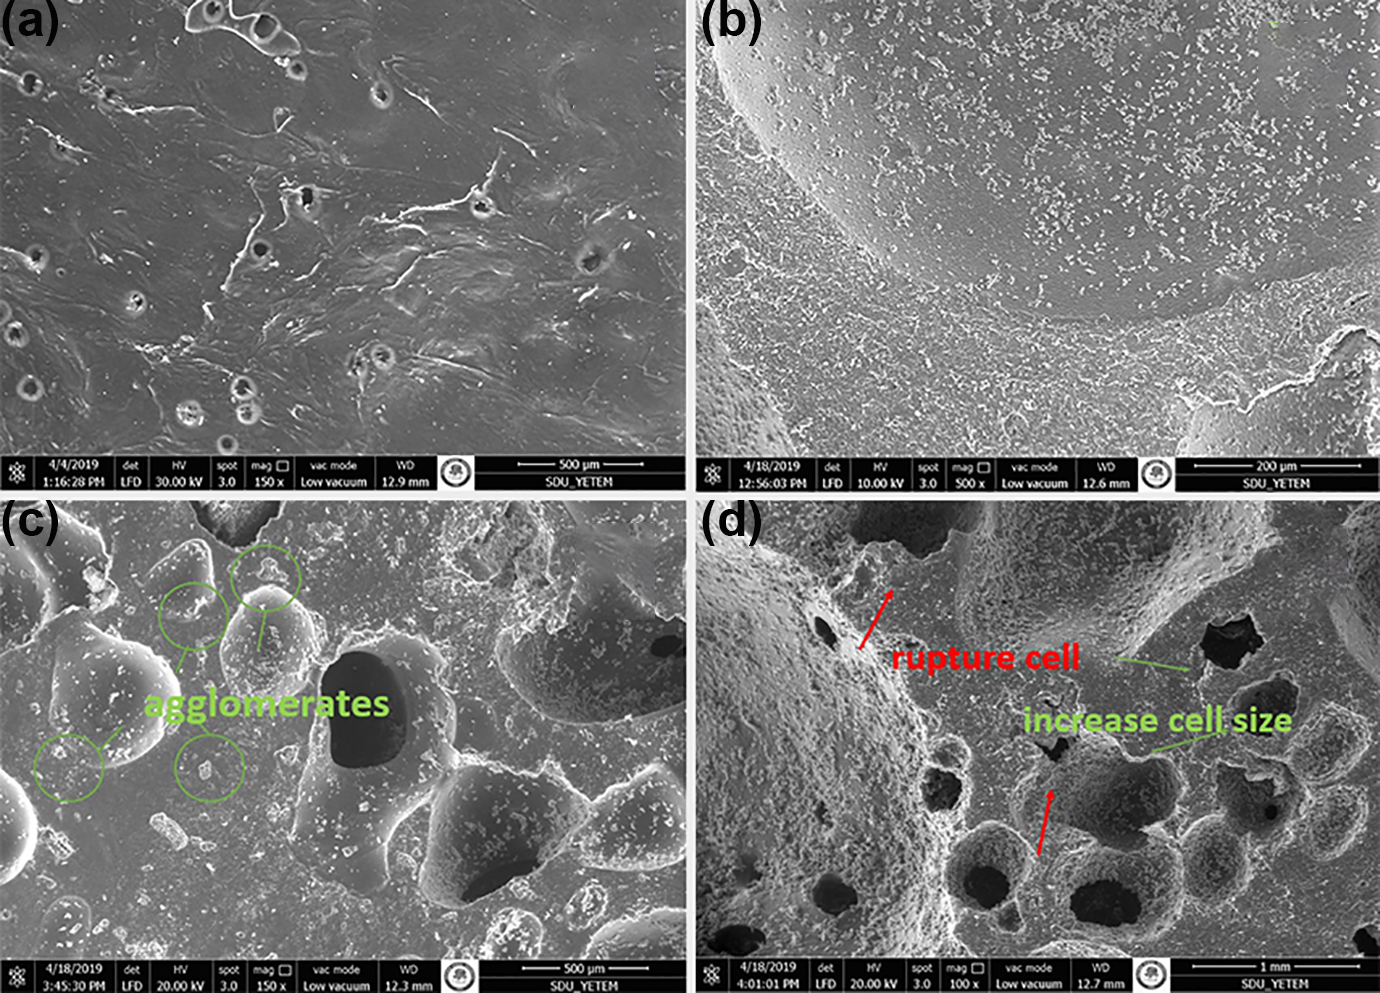
SEM images of (a) PURE, (b) BOA05, (c) BOA10, and (d) BOA15 samples.
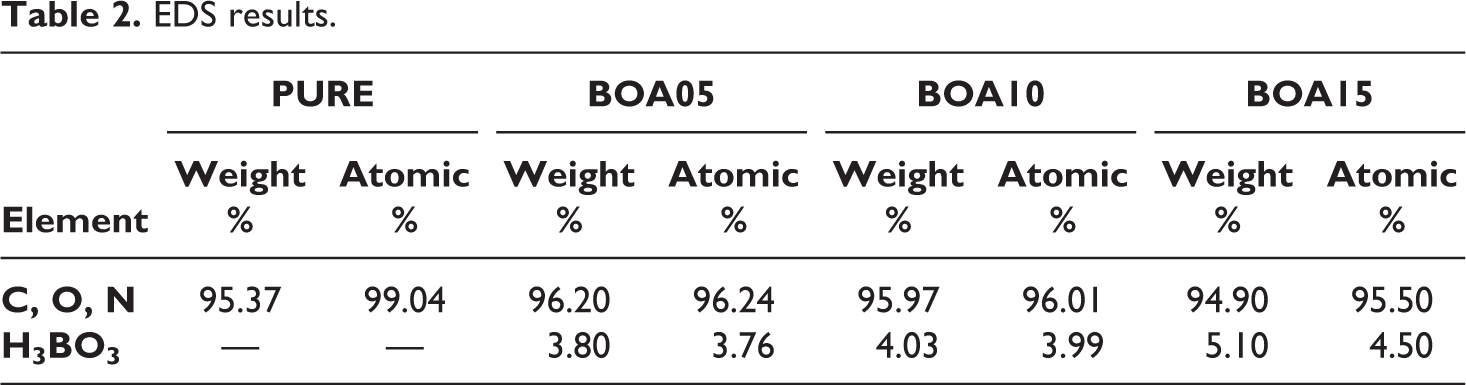
The results of the energy dispersive X-ray (EDS) spectra of the samples given in Table 2 are the characteristic values of BA within the 5% margin of error and there were no atoms that can be considered as impurity are present in the structure.
EDS results.
Structural analysis
The XRD analysis of both pristine and BA doped hard PU are given in Figure 3. It was observed in the XRD diffraction patterns that the peaks appeared in three different groups. The 2θ values for the sharp peaks were observed at 14.7°, 28.2°. For the moderate intensity peaks, the 2θ values were at 30.6°, 40.5°, 43.3° and for the weak peaks, the 2θ values were in the 50–60° range. These peaks are characteristic peaks for BA and are consistent with the values given in the literature.37–39 It was observed that the peak intensity increased as the amount of BA that is doped increased. 40 The XRD pattern of the hard PU samples showed that as the amount of BA increased the structure changed from amorphous to crystalline.34–41
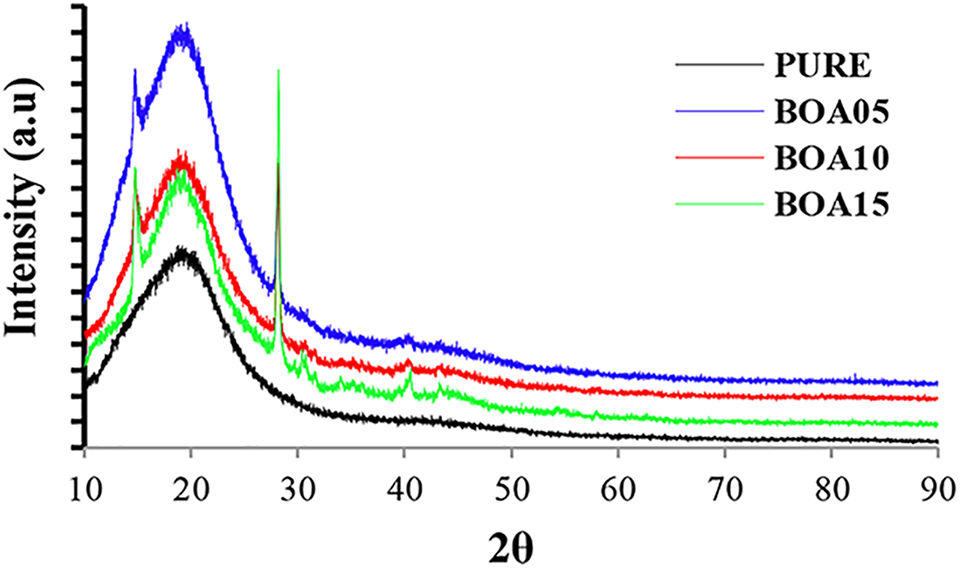
X-ray diffraction patterns of boric acid-based PUs.
Thermogravimetric analysis (TG/DTA)
Thermal stability of a polymer-based material is very important in analyzing its combustion behavior.42–44 In this study, thermal stability of BA doped rigid PU was investigated via thermogravimetric analysis. The results are given in Figure 4(a). Thermal decomposition starts from the weakest ring that forms the PU structure45–47 and it separates the urethane bond groups in the PU into isocyanates and polyols. As the temperature increases, the polyol in the structure is divided into some aliphatic ethers and alcohols, and more complex products are formed during decomposition when different substances are incorporated into the structure. 48 The temperature at which the decomposition begins in each step (Tonset) and the maximum temperature (tmax) are indicated in the DTG curves. 49 The TG-DTG thermograms revealed that decomposition occurs in two steps (Figure 4(b)). The first step is the fast step and decomposition starts at Tonset = 150–165°C when the water in the minerals evaporates. This is followed by a slower second step. In the second step, the maximum decomposition was observed in the temperature range 356–388°C. The maximum temperatures in the first step and the second step were observed to be in the ranges 160–165°C and 263–278.4°C, respectively. As the amount of BA changed, the additional bonds in the samples broke and different peaks were observed. The Tonset, tmax and mass loss values of urethane and isocyanate are given in Table 3. Considering the degradation peaks, it was concluded that the mass loss decreased as the amount of BA increased.
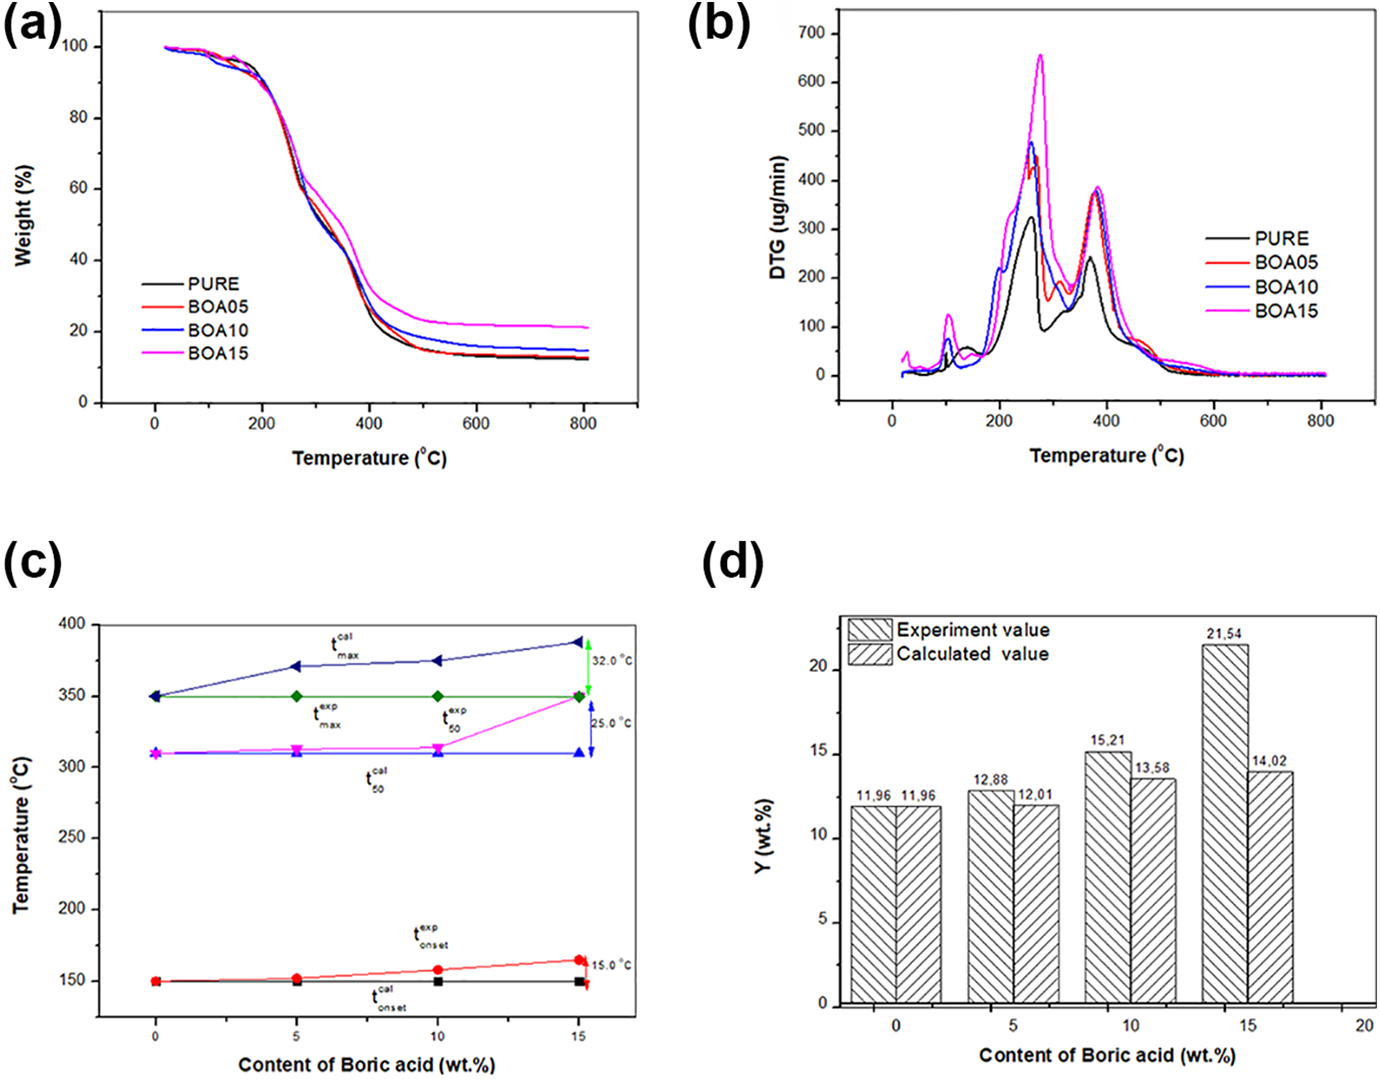
(a) TG, (b) derivative thermogravimetric weight loss, (c) Tonset, T50 and Tmax, and (d) residual yield curves of boric acid-based PUs.
TGA-DTA data for boric acid-based Pus.
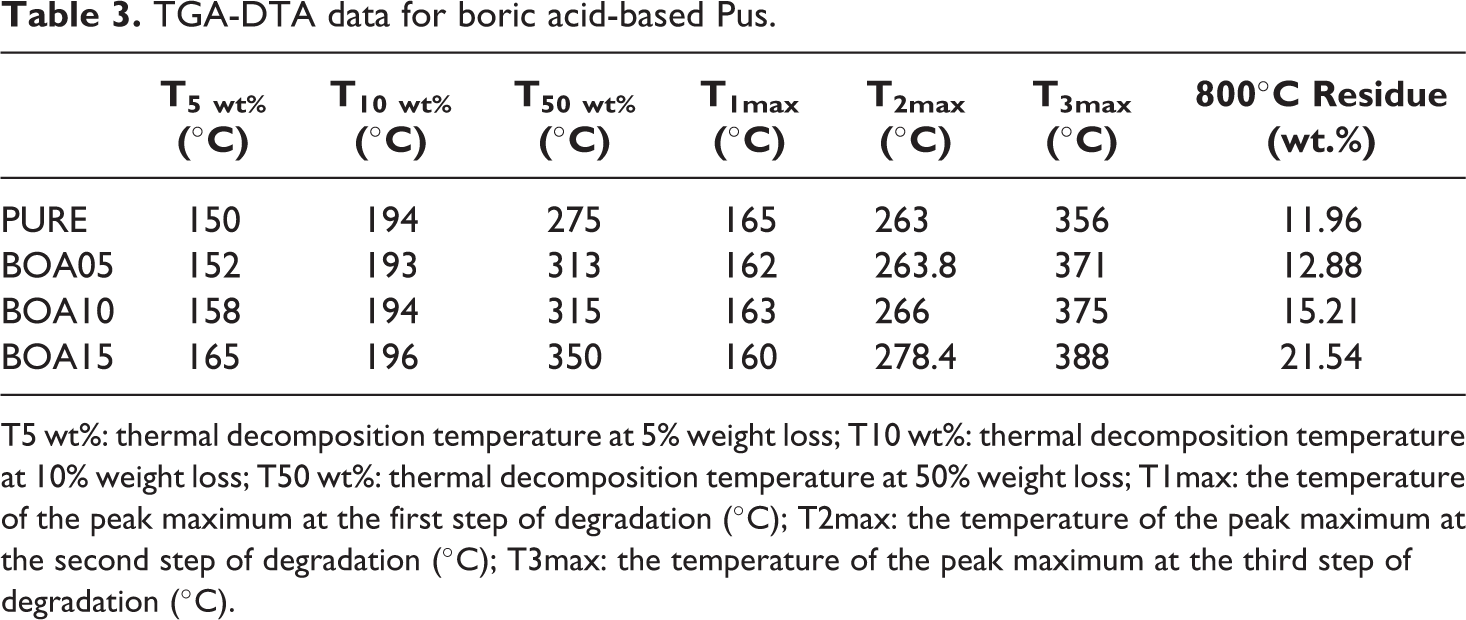
T5 wt%: thermal decomposition temperature at 5% weight loss; T10 wt%: thermal decomposition temperature at 10% weight loss; T50 wt%: thermal decomposition temperature at 50% weight loss; T1max: the temperature of the peak maximum at the first step of degradation (°C); T2max: the temperature of the peak maximum at the second step of degradation (°C); T3max: the temperature of the peak maximum at the third step of degradation (°C).
In the TG-DTG curves, the tonset, t50 and tmax corresponded to 5%, 50% and maximum mass loss, respectively. For the pure PU, the tonset, t50 and tmax were 150, 275 and 356°C, respectively. As the ratio BA is doped increased, the decomposition was observed to occur at a higher temperature. It was observed in Figure 4(c) that when the pristine PU and the 15% (w/w) BA doped PUs were compared, it was observed that the tonset, t50 and tmax increased by 15, 25 and 32°C. While the mass loss of pristine PU was 11.96%, the mass loss was observed to increase to 80% when BA was doped at 15% (w/w).
To further understand the effect of doping with BA on the thermal stability of the PU, it is assumed that the Ycal (calculated residue char at 800°C) of the pristine and the BA doped PU follows the linear mixing rule given in equation (1).

In this equation, Ypristine and YBOA indicate the residual yield of the pristine and BA doped PU, respectively. The ⨍w, pristine and ⨍w, BOA represent the weight fraction of the pristine and BA doped PU, respectively.
The residual yield of the pristine and the BA doped PU are given in Figure 4(d). It was observed that while the residual yield was 11.96% for pristine PU upon doping with BA at a ratio of 15% (w/w) the residual yield was observed to increase to 21.54%. However, it was observed that the experimental residual yield of the BA doped PUs (Yexp) was higher than the theoretical/calculated residual yield (Ycal). The great difference between the experimental and the theoretical values, which can be seen in Figure 4(d), may be due to the barrier effect that the dopant causes besides the strong bonding structure. It was observed that the experimental and the theoretical values were found to differ by 7.2%, 12% and 53.6% for different amounts of BA doping and this is in line with the results reported in other studies. 50
The DTG curves indicate that the rate of the maximum mass loss for the BA doped PUs is much lower than that of the pristine PU. The peaks in the DTG curves indicate the temperature at which the highest rate that the mass loss is observed. In these peaks, the coal layer, which forms as result of fast burning, functions as a barrier against the release of oxidative gases as well as the heat transfer to the inner layers. The early degradation that happens is beneficial with respect to good flame retardant properties. BA appears to function as a barrier to prevent mass loss during the thermal degradation process. The mass loss for the pristine PUs were observed to decrease by 12.88%, 15.21% and 21.54% as compared to that of the BA doped PUs.
As can be seen in the Figure 5, the thermal stability of BOA15 is superior to that of the Expandable Graphite (EG-50), Aluminum branched oligo (phenylphosphonate) (AHPP-7.5), Ammonium polyphosphate (APP-5) and phosphorus (PRUF-15) polymers as BA forms a thin film on the surface which prevents release of toxic gases and delays combustion by reducing oxygen contact and increasing the thermal resistance.51–54 BA prevents mass loss by forming a thin film on the surface during thermal decomposition as indicated by the post-combustion carbon layer analysis. Hence, it was observed that as the boric acid content increased the thermal stability of the samples improved and the mass loss decreased.
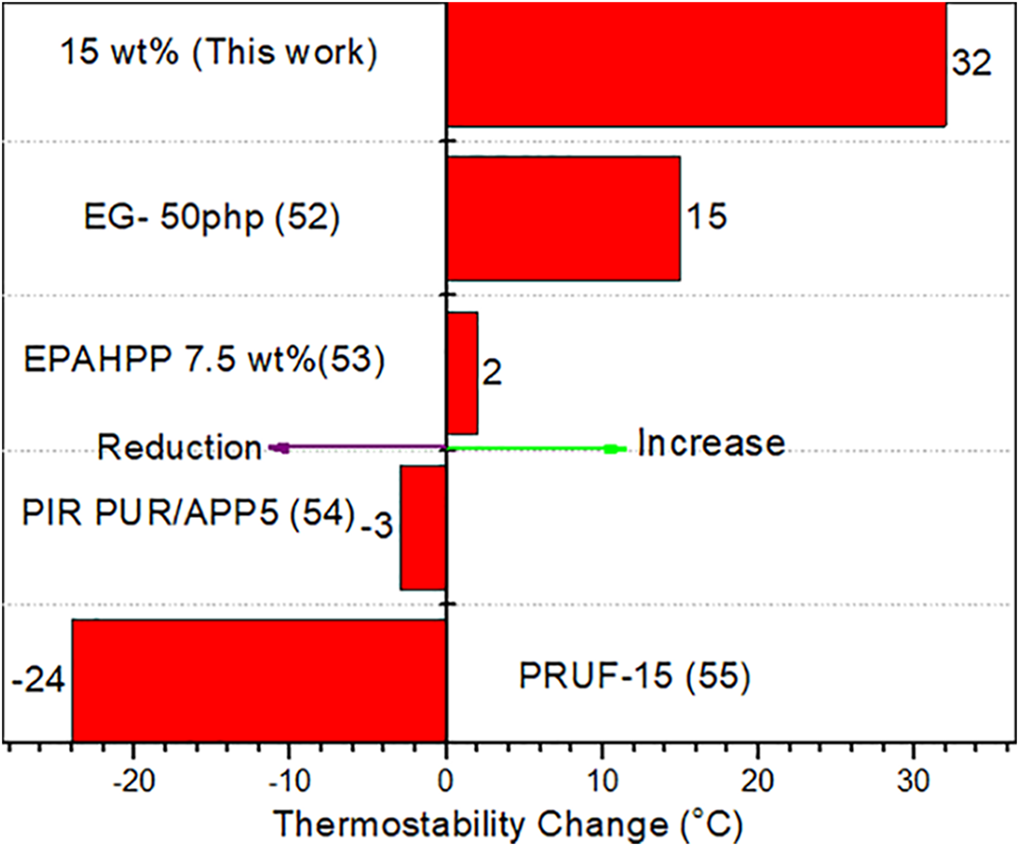
Comparisons of the thermo stability (the maximum thermal degradation enhancement) change of boric acid (15%wt) doped PU with the PU reinforced with other fillers.
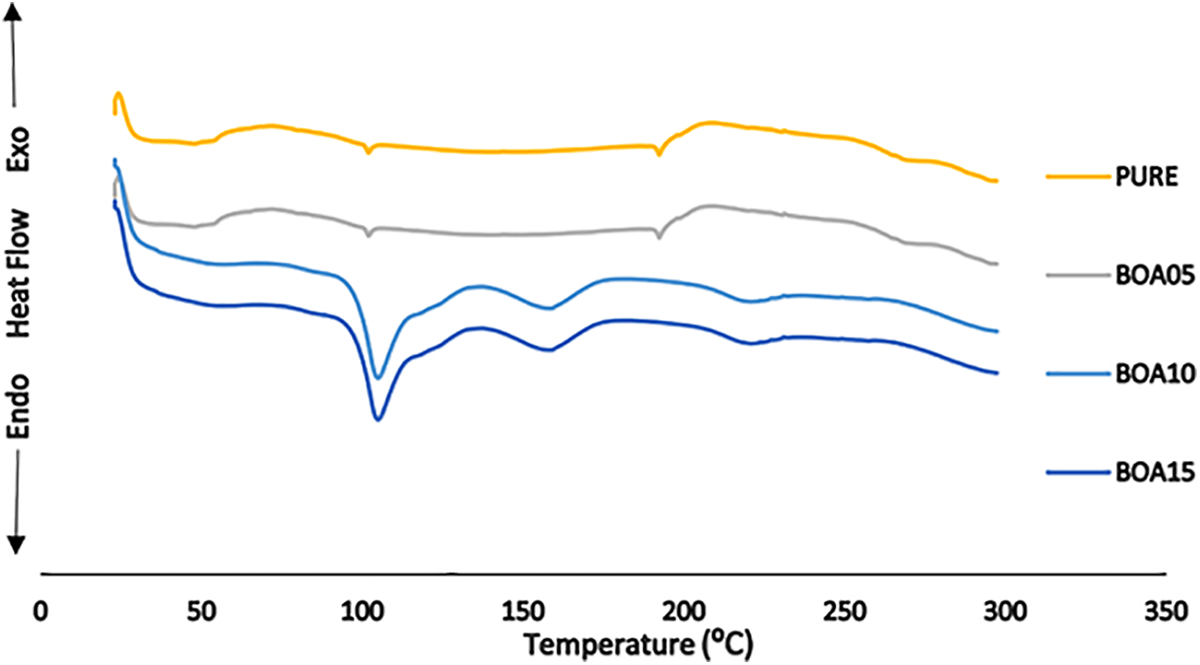
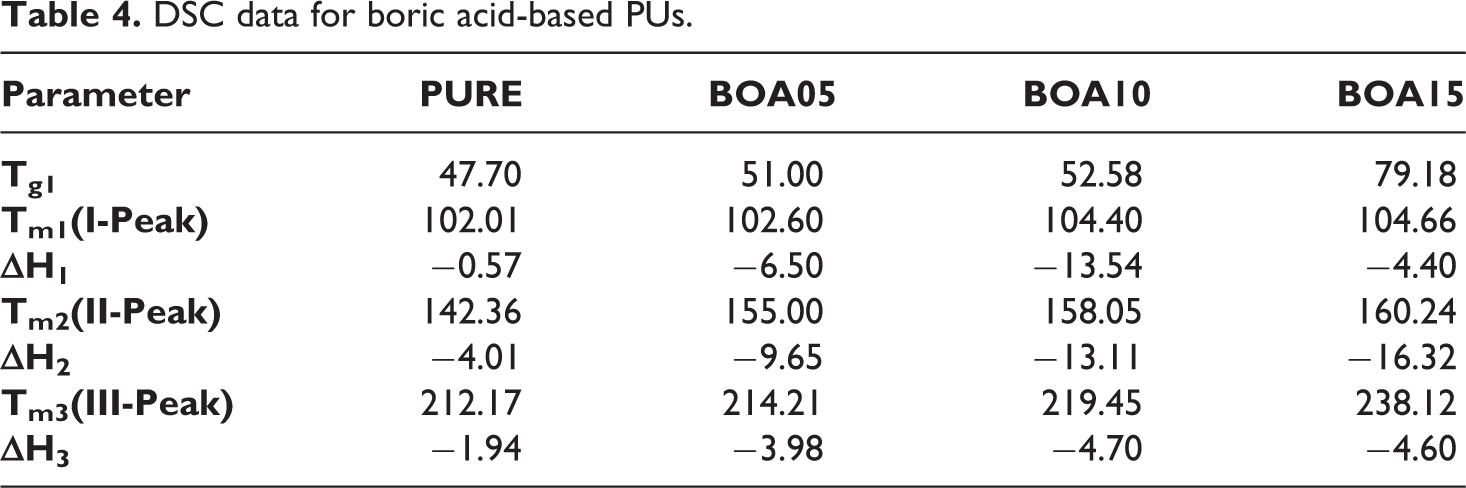
Differential scanning calorimeter (DSC)
DSC analysis was used to determine the crystalline phases and soft-hard segments in the structure of the polyurethane. 55 Four different temperature zones were observed in the DSC that indicates the thermal behavior. As shown in Figure 4(a), the initial temperature value, which is the glass transition temperature (Tg1), increases as the BA—the mineral additive content—increased. The increase in the temperature from 47.70°C to 79.18°C is a soft segment of separation from purity. In the following process, the first endothermic decomposition in the region at 100°C was followed by the second decomposition at 140–160°C and the third peak at 200–240°C. 56 As shown in Figure 6, the mixture is an active flame retardant. An increase in all three peak values were observed in Table 4. The temperature changed upon doping PU with BA. The largest temperature shift of 25.95°C was observed for the BOA15 sample. This shows that the additional additive has positive effect on thermal insulation property of the material and increases the combustion resistance.
DSC curves of boric acid-based PUs.
DSC data for boric acid-based PUs.
Determination of ignitability
Ignitability of the samples were determined via cone calorimeter, UL 94 testing and the single source flame test.
The single source flame test
The ignitability of the PU samples doped with BA was carried out according to TS EN ISO 11925-2 standard. This test determines ignitability of a product when exposed to a small flame source. The single source flame test was performed for samples with the dimensions 250 × 90 mm2. According to the TS EN ISO 11925-2 standard, a burning time of 30 s (total test time 60 seconds) was applied. The test results are shown in Figure 7. In the experiment, the sample integrity did not change and the flame progression did not reach the threshold limit of 150 mm that is specified in the standard value. In the pure sample, the flame proceeded to significant depths and the surface integrity of the sample was impaired. For samples doped with BA, it was observed that heat was absorbed on the surfaces of the samples. The samples also retained their form and the flame did not progress further. According to TS EN ISO 11925-2 standard, materials are classified from A to E according to deflagration time and smoke formation. Accordingly, while A flammability class refers to the material that is the most difficult to ignite, E refers to flammability class related with the material that is easiest to ignite. In this study, it was determined that the samples doped with boric acid passed to class D from flammability class E. Combustion size values of the single source flame test are given in Table 5. It is observed that the fire resistance of the samples increased when the boric acid amount increased. When the combustion areas were examined, similar results were obtained. Combustion areas decreased when boric acid content increased more. In this case, the least affected sample was found to be BOA15. This result is consistent with the findings of the TGA and DSC curves. The single source flame test results for the polyurethane samples showed statistically significant differences for combustion values at the level p < 0.05. The Duncan test divided boards into four separate homogeneous groups. Combustion values were reduced by 53%, 122% and 219%, for BOA5, BOA10 and BOA15 samples, respectively, as compared to the pristine sample.
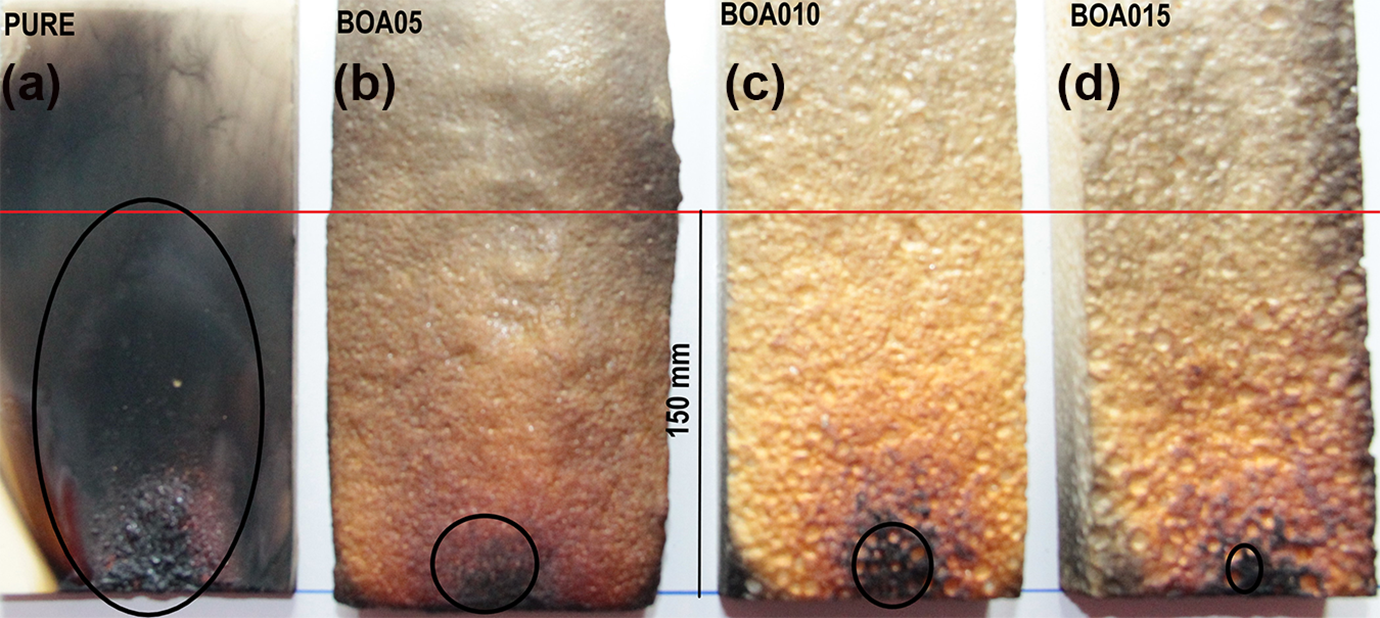
Images of PUs with boric acid additive after single source flame test based on the TS EN ISO 11925-2 standard for (a) PURE, (b) BOA05, (c) BOA10, and (d) BOA15 samples.
Single source flame test of boric acid-based PUs.
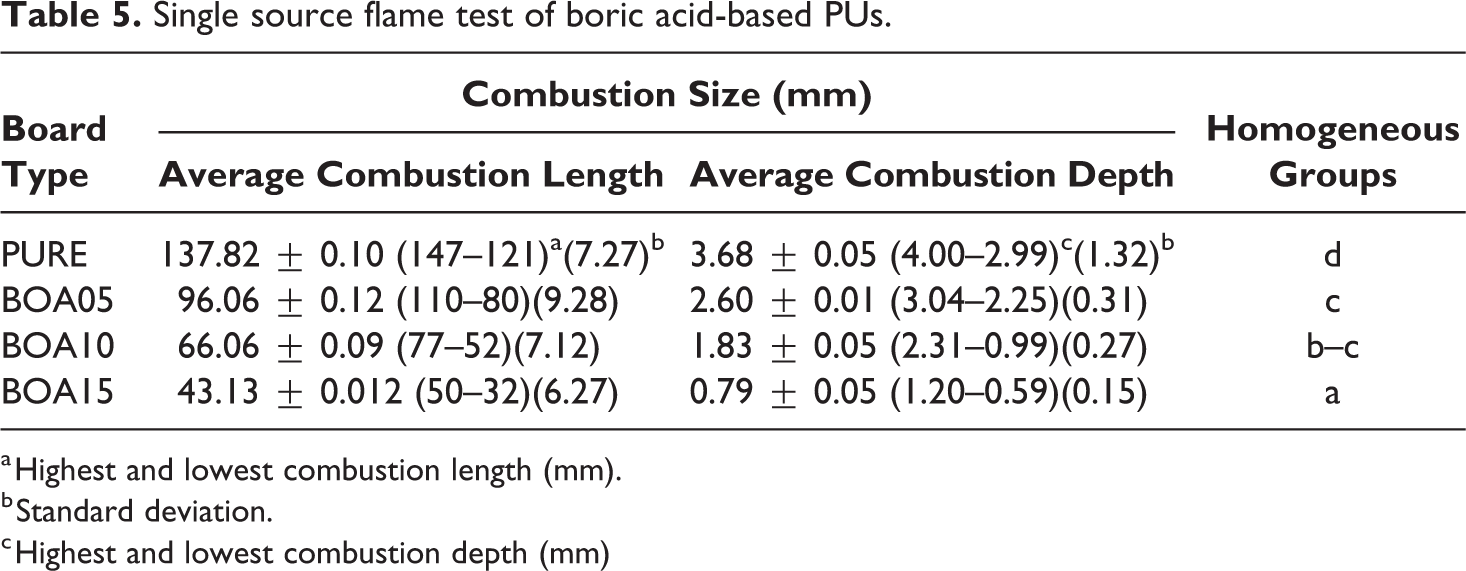
a Highest and lowest combustion length (mm).
b Standard deviation.
c Highest and lowest combustion depth (mm)
UL 94 testing
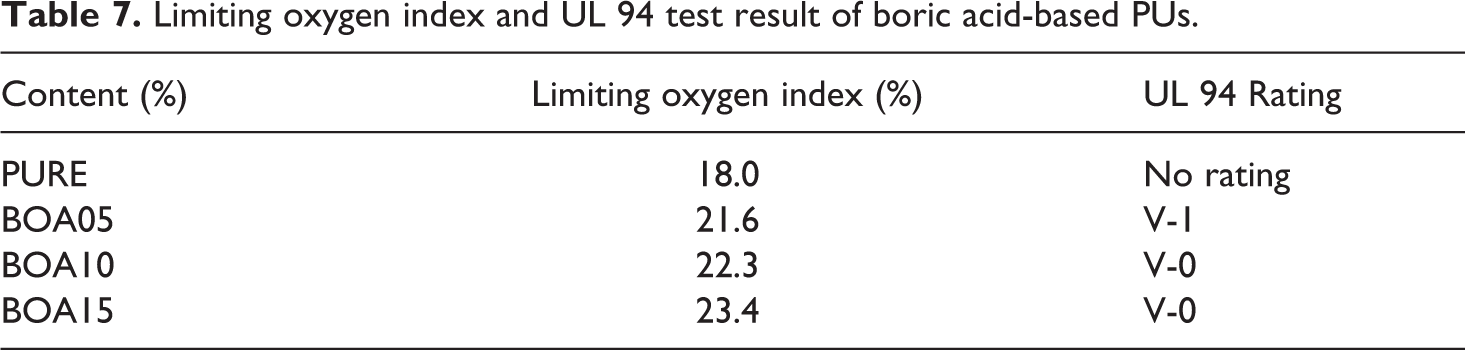
The UL 94 testing was used for to compare the flammability and flame spread of BA doped PU exposed to a small flame source with the pristine PU. The test results given in Table 7 indicate that for the pristine PU “there was no scaling,” but as the mass of the BS dopant increased (5%, 10% and 15% (w/w)) the classification values were found to be V-1, V-0 and V-0, respectively. Hence, during burning, heat is not spread among layers due to the coal layer formed by the boric acid that is used as flame retardant.
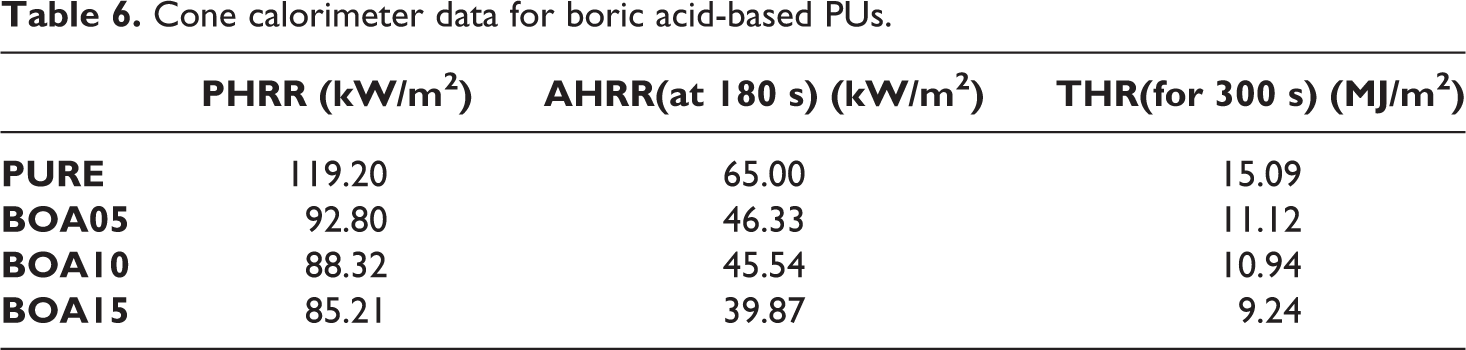
Cone calorimeter
The most comprehensive information on combustion behavior can be obtained with the cone calorimeter test. The rate of heat release (HRR) and the total heat release (THR) are two important parameters in determining the combustion behavior. 57 The cone calorimeter test results for BA doped PU are given in Table 6 and in Figure 8. When the test results obtained for BA doped PU were compared to those obtained for the ones obtained for the pristine PU, the PHRR values were observed to decrease by 22.1%, 25.9% and 28.51% for 5%, 10% and 15% BA doped PU. Thus, it was observed that as the BA content increased the flame retardancy increased and BOA 15 was found to have the most flame retardant property. This is due to the protective insulation layer that increases the flammability of BA and it forms a glassy coating. During a fire, this glassy film layer prevents the release of the oxidative gases and thus it prevents flammability. Actually it absorbs all the heat that comes and thus it forms a carbon layer and prevents transfer of the heat to inner layers. In other words, the decreasing effect of BA on flammability is brought about via decreasing the total heat released.
Cone calorimeter data for boric acid-based PUs.
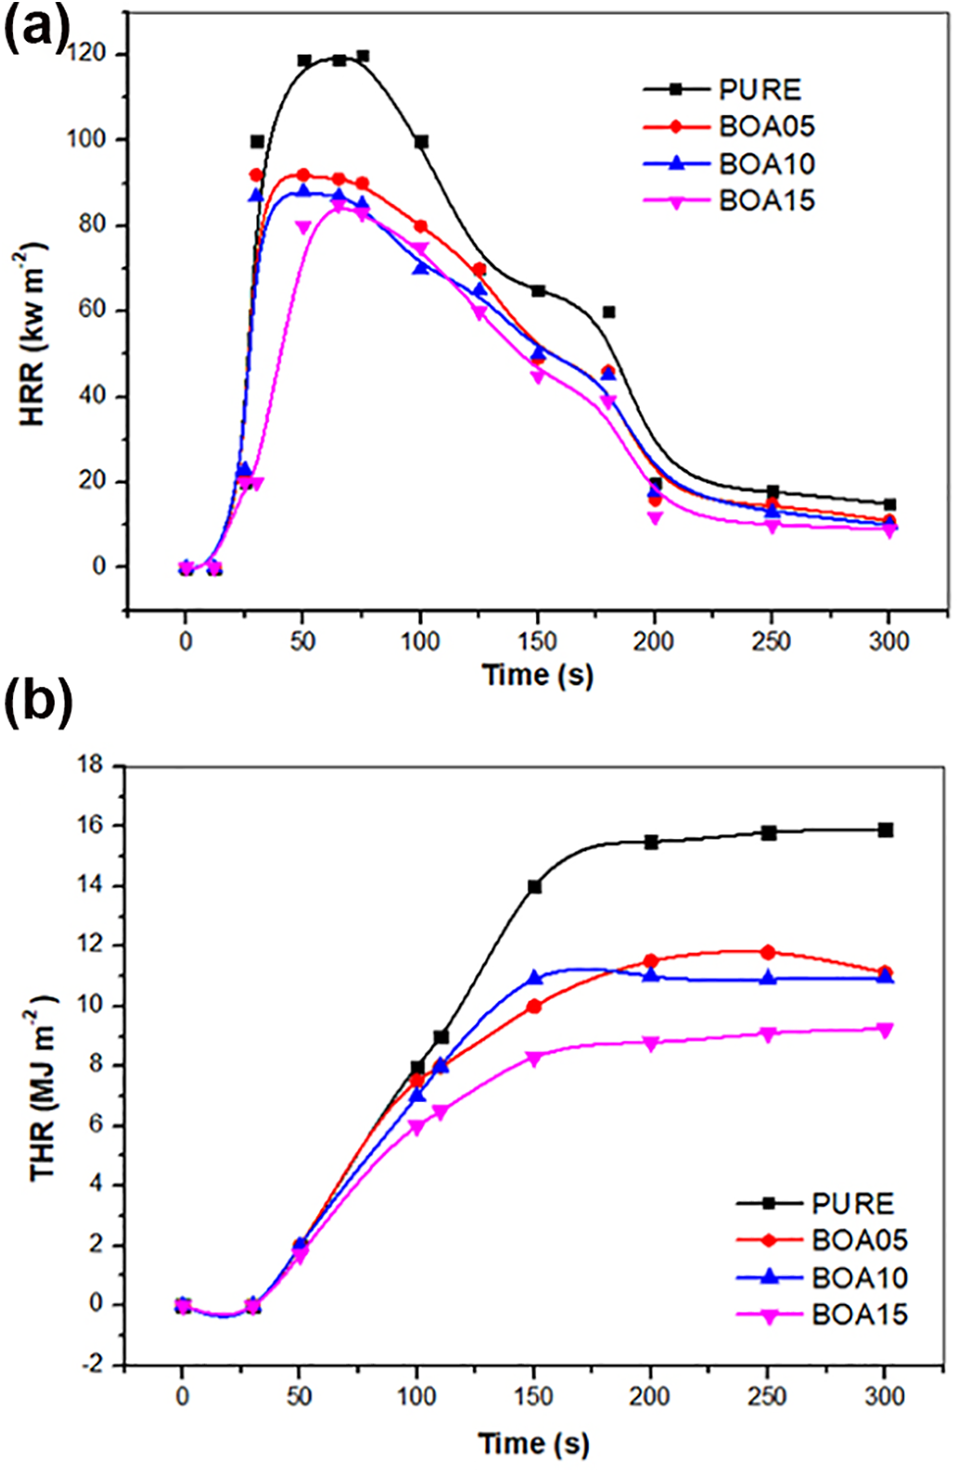
(a) The heat release (HRR) curves and (b) the total heat release (THR) curves of boric acid-based PUs
The limiting oxygen index (LOI)
The limiting oxygen index of the pristine and the BA doped PU samples were determined according to the ASTM D 2863 standard. 58 The LOI is the minimum amount of oxygen required to cause ignition. This means that a substance with a higher LOI would require more oxygen to burn and would not burn until this amount of oxygen is provided. According to Table 7, the limiting oxygen index (LOI) scale lies in the range between 18% and 23.4%. The highest flame retardant board with 23.4% LOI was found to be obtained with BOA15 PU and this increased flame resistance by 30% as compared to pristine PU.
Limiting oxygen index and UL 94 test result of boric acid-based PUs.
The electromagnetic interference shielding effectiveness
The electromagnetic shielding effectiveness (SE) can be defined as the ratio of areas observed with absorption to the areas observed with no absorption. 59 The higher the absorption efficiency is the better the absorption is. The SE is expressed by the following equations:


In Equations 2 and 3, the subscripts t and i refer to the transmitted and incoming waves, respectively. 60 There are three absorption mechanisms for attenuation of electromagnetic interference: Reflection, absorption and multiple reflection.61,62 SE is obtained by summing the absorption efficiency values in these three mechanisms. 63 The electromagnetic screening performance of the pristine PU is not excellent due to poor conductivity. However, doping with boric acid since would improve the conductivity and the permeability of PU and thus it can have electromagnetic screening activity at certain frequencies. In Figure 9 can be seen that the EMI SE of BOA15 exceeds 40 dB at most of the frequencies from 1.6 GHz to 3.2 GHz. For the pristine PU foam the EMI SE is less than 10 dB. The EMI SE values can even reach 40 dB which is sufficient to meet the practical requirements of many electronic devices. 64
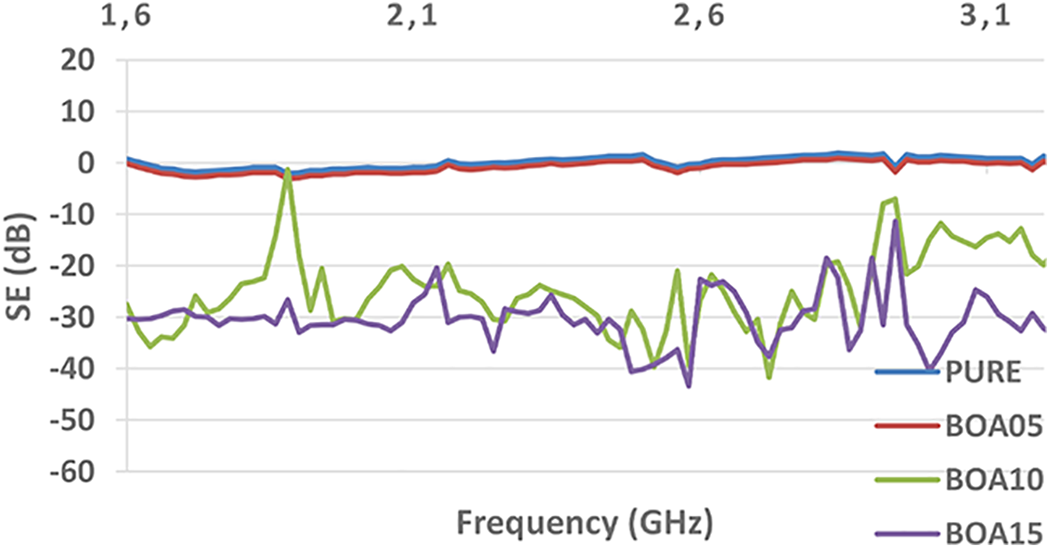
Electromagnetic interference shielding effectiveness of PUs with boric acid additive.
Conclusion
In this study, boric acid (H3BO3) addition to hard polyurethane foam at three different weight ratios (5%, 10% and 15% (w/w)) suppresses combustion by creating a protective layer on the polymer surface during combustion and minimizing oxygen contact. The differences among the thus obtained foams were investigated. As boric acid acted as a viscosity-enhancing agent during mixing it also caused the rigid polyurethane to swell and thus the cell structure was changed and the density and its compressive strength decreased. An amorphous structure was observed in the XRD pattern of the pristine polyurethane (PU) and the structure changed from amorphous to crystalline as the amount of boric acid increased. While the mass loss for pristine PU was 88.04%, the mass loss for 15% BOA PU was determined to be 78.46%. The added boric acid was observed to reduce mass loss by approximately 9.8%. Four temperature zones were observed when the thermal behavior was examined via DSC. Doping with pristine PU with boric acid changed the temperature. The largest temperature change of 25.95°C was observed for BOA15 PU. In the pristine PU, the combustion proceeded to significant depths and the surface integrity of the sample was impaired. It was observed that heat was absorbed on the surfaces of the samples samples were doped with boric acid. The samples also retained their form and the flame did not progress further. According to the TS EN ISO 11925-2 standard, the flammability class of the samples doped with boric acid was D. The UL 94 test results showed that the coal layer formed by the boric acid that is used as flame retardant during combustion prevented heat transfer to the lower layers. The fire behavior of the samples was examined by the cone calorimetry test. The PHRR, AHRR and THR values were observed to decrease significantly as the ratio of boric acid to polyurethane increased. According to the cone calorimeter test results, the BOA15 PU was found to be the most powerful flame retardant. The samples with EMI SE values of 40 dB at frequencies between 1.6 GHz and 3.2 GHz, showed that hard polyurethane foams have moderate EMI SE. The EMI SE even reached 40 dB, which was sufficient to meet practical requirements of many electronic devices. Polyurethane is a material with low fire resistance. However, the flammability threshold can be increased via suitable flame retardants. In this case, the usage area of PU would increase especially in furniture, electronic devices, insulation and other practical applications and it can be said that boric acid may be better than other additives. Our study offers an alternative way to design PU to have excellent performance by using boric acid as dopant.