
Abstract
Besides polyamide 11 (PA 11) outstanding properties, wear performance is considered a key factor for its continued widespread use. TiTanate NanoTubes (TTNT) have a huge potential as reinforcement in polymer matrix nanocomposites, and although nanotubes reinforcement capacity is well understood, its effect on tribological characteristics is still an open question. Thus, the present work has as objective to study the wear behavior of PA 11 and its nanocomposites, highlighting TTNT loading, functionalization and sodium content effects. Seeking the possibility to tailor properties, surface topography is investigated. Based on parameter classification, correlation and functional sense, an ideal roughness parameter set is defined. By taking measurements in X- and Y-axis, parameter variations and sensibility are also analyzed. From the results, maximum wear resistance can be reached in functionalized samples with low TTNT loading and high sodium content. Some roughness parameters demonstrate a moderate to strong correlation with wear performance. Parameter variations are mainly attributed to the non-stationarity of the surface.
Keywords
Introduction
Engineering polymers are being increasingly used in a wide variety of fields,1,2 and several polymers can be considered as competitive materials for tribological applications.3–5 To be suitable, polymeric materials, which usually exhibit mechanical strength, lightness, ease of processing and low cost, together with acceptable thermal and environmental resistances, have to show good abrasion and wear resistance. 6 Among potential tribo-engineering polymers, polyamides (PA) can be highlighted.7,8 Besides PA’s usual characteristics, such as high toughness, considerable tensile strength, low density, and good chemical resistance, wear performance is considered a key factor for its widespread applications.6,9
Due to the feasibility of maximizing mechanical properties while preserving the inherent properties of polymers, nanoscale fillers have been extensively incorporated into polymers to produce polymer nanocomposites.3,6,9–11 As for other thermoplastic matrices, several nanomaterials are suitable fillers for PA, improving their mechanical properties, including wear resistance.11–16 The properties of the resulting nanocomposite depend on the intrinsic characteristics, dimensions, and shape of the inorganic fillers, including the interfacial bonding strength.10,13,14 In recent years, special attention has been given to one-dimensional nanostructures as an outcome of its distinguished aspect ratio, which implies a high specific surface area, thus optimizing final properties.17,18
The unique physicochemical properties of the titania nanostructure combined with its singular morphology make TiTania or TiTanate NanoTubes (TTNT) a promising useful material.12,19 TTNT morphology and its residual sodium content are dependent on the synthesis conditions and washing step.20–22 Therefore, different properties can be reached in the final product. To maximize the reinforcement effect, TTNT surface modification has been suggested.21,23–25 The use of surfactants and coupling agents is appreciated, and silanes are recognized as efficient coupling agents that have found unrestricted use in nanocomposites. 26
Although the improvement of properties in polymers by incorporation of nanofillers has been studied, the mechanisms by which nanomaterials modify the tribological behavior in polymer nanocomposites are still not fully understood.3,6,9,15 Tribological performance is intimately linked with surface texture, and understanding the characteristics of the surface, such as topography, is important in several applications such as wear, friction, and lubrication.13,27 In fact, surface topography can have a significant impact on component longevity and reliability. 28 Alterations of surface topography, even if restricted to a small surface layer, may influence the properties of the component such as fatigue strength, resistance to corrosion and service life.27,28
Surface topography can be described in terms of roughness parameters, 29 which can be considered a powerful tool for control, diagnostics, and prediction.27,28 Despite many surface roughness parameters can be used to describe a surface, the effectiveness of several of them is always in discussion. On the one hand, a large number of parameters available could be seen as positive, leading to an increase in the power to describe texture completely. On the other hand, the myriad number of parameters can be misleading and related to systematic unsuccessful surface characterization attempts.27,28,30 Therefore, there is a clear need for reducing the number of parameters or at least provide clear guidelines in parameter elaboration and selection. 31
Although many investigations have been conducted to clarify surface features in different applications,29,32,33 a lack of solid information still exists in the nanocomposite field. Then, the present work has the objective to study the tribological behavior of PA 11 and its nanocomposites. The effect of TTNT addition on the wear performance of PA 11 nanocomposite is analyzed and contributions of TTNT loading, functionalization and sodium content are highlighted. Surface roughness is discussed, and a set of roughness parameters is defined to characterize surface topography. Targeting the possibility of tailoring tribological properties, the correlation between wear behavior, surface roughness and TTNT addition are also investigated.
Experimental procedure
Nanocomposite processing
The TTNTs used in this work were obtained by hydrothermal alkaline synthesis, as described elsewhere. 20 TTNTs with high (TTNT/H) and low (TTNT/L) sodium contents were synthesized with, respectively, 8.45 wt% and 0.24 wt% of sodium content as measured by flame photometry, and specific surface areas of 224 and 283 m2/g, as measured by BET nitrogen adsorption at −196°C. 21 Independent of the acidic washing step, X-Ray Powder Diffraction (XRPD) has confirmed the complete conversion of the starting anatase powder into layered titanates and Transmission Electron Microscopy (TEM) images have revealed the uniform nanotubular morphology of the as-synthesized TTNTs. 21 A fraction of the TTNTs were functionalized (FTTNT/H and FTTNT/L) with 3-aminopropyltriethoxysilane (APTES), with over 98% of purity, following the functionalization procedures described in other works.21,34 Considering the specific surface areas of high and low sodium TTNTs, APTES to TTNT mass ratios of 0.635 and 0.802 were used for TTNT/H and TTNT/L, respectively. The successful grafting of APTES on functionalized sample surfaces was confirmed by CNH elemental analysis, Fourier-transform infrared (FTIR) spectroscopy and thermogravimetric analysis (TGA). The grafting of APTES over TTNT surface occurs through Ti-O-Si primary chemical bonding. 21
PA 11 produced from a renewable source (castor oil) and designed for extrusion (Rilsan® PA G BESNO TL, supplied by Ackerman) was used as matrix. Samples of neat PA 11 and nanocomposites reinforced with functionalized and non-functionalized TTNTs were manufactured using a twin-screw micro extruder (DSM Xplore, model 5-08-20) and a microinjector (DSM Xplore, model 4-11-10). Nanocomposites with TTNTs loading of 0.5 wt%, 1.0 wt%, and 2.0 wt% were produced.
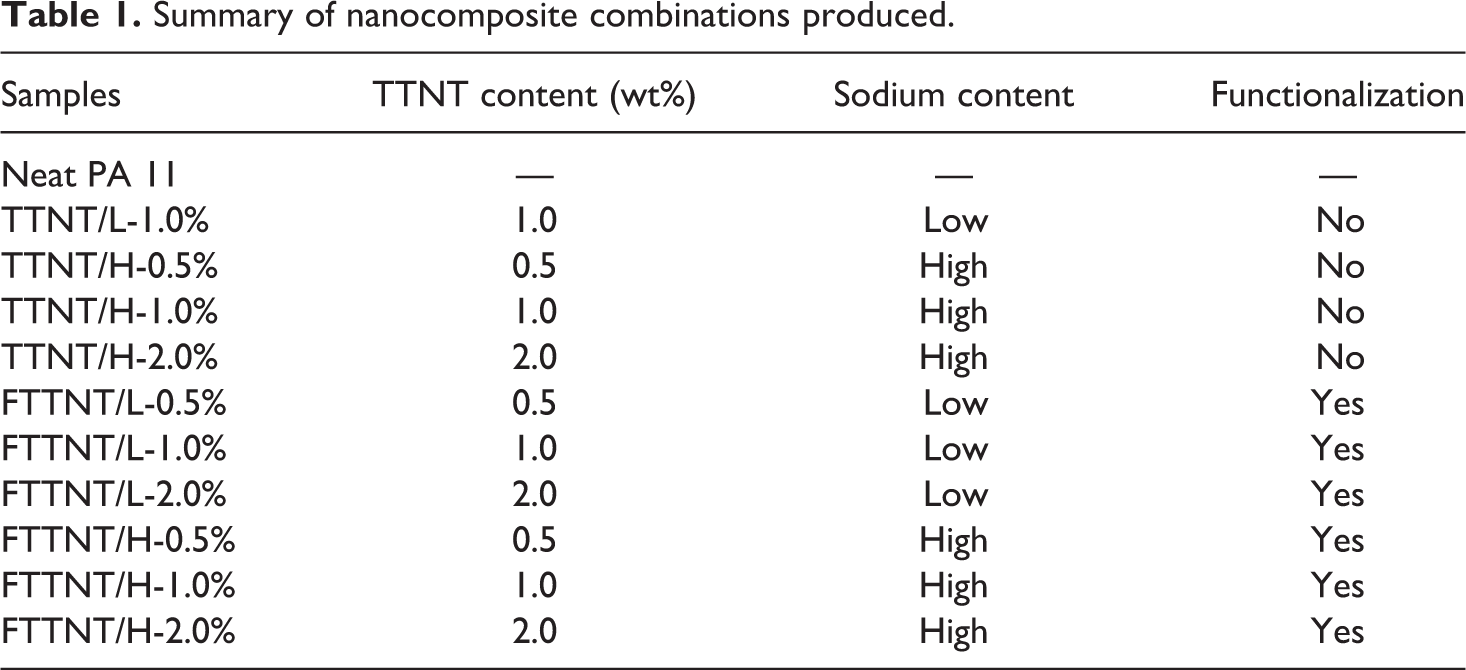
Before processing, PA 11 was dried at 80°C for 8 h in an air circulation oven. The processing conditions used at the micro extruder were: temperatures of 275°C, 260°C, and 260°C at the heating zones; screw rotation speed of 100 rpm; and residence time of 4–6 min per batch. The microinjector processing conditions were: a mold temperature of 60°C and an injection pressure of 7 bar. Table 1 summarizes all nanocomposite combinations produced.
Summary of nanocomposite combinations produced.
In order to detect possible interactions between TTNT and polyamide matrix, FTIR spectroscopy was performed. 35 Comparing the spectra of neat PA 11 and nanocomposites, only for the composites that contain functionalized TTNT two new bands were detected at 1742 and 1712 cm−1. They could be associated to a free- and H-bonded C=O stretching vibrations that reflect bonding of terminal carboxyl group of PA to a silane amido group. More information about morphological and structural characteristics of PA 11 and its nanocomposites can be found elsewhere.22,35
Wear test
The wear test was carried out following the recommendations of DIN 53516. 36 The equipment used in the test consisted of a rotating cylinder covered with a grinding paper (#180) and a sample holder, which rotates on its own axis. The combined movement action of spin and forward motion produces an average sliding path (L) of 40 m. The axial load (FN) exerted on the sample holder, which ensured permanent contact of the sample with the rotating cylinder, was kept constant and equal to 9.81 N. Test specimens with a mean size of 20.0 mm length, 9.0 mm wide and 3.1 mm thickness were used.
Wear performance is commonly evaluated from loss of mass (

Surface roughness measurement
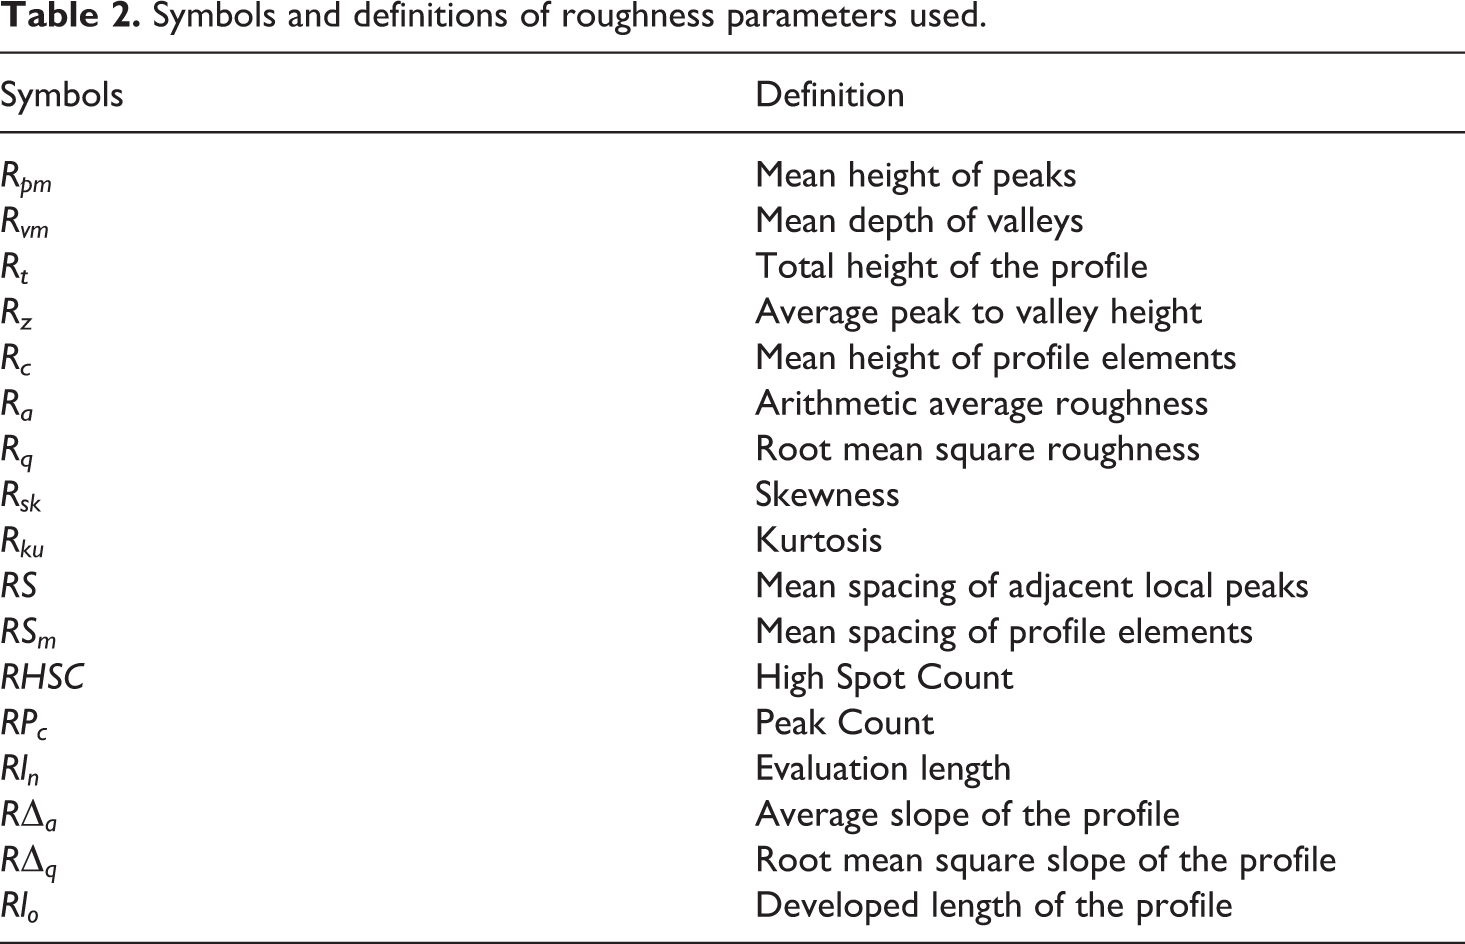
Surface roughness was measured using a rugosimeter (Taylor Hobson). Surface roughness measurements had the objective to quantify the surface of specimens that were submitted previously to wear test. The probe was positioned in the same place for all samples ensuring that equipment always traveled the same distance for the X-axis—7.3 mm—and the Y-axis—2.8 mm, yielding two surface roughness measured per sample. For data analysis, the cut-off standard value of 0.8 mm was set.27,37 Several roughness parameters available in Taylor Hobson rugosimeter were determined. Parameters symbols and definitions are present in Table 2.
Symbols and definitions of roughness parameters used.
Results and discussion
Wear performance
The main results gathered from wear tests are summarized in Table 3 and are graphically presented in Figure 1. Although it was possible to precisely control the axial force during experiments, keeping it constant, it was impractical to guarantee a constant course distance, and small variations occurred. It is known that the relation between slipping distance and wear volume is tight.37,38 Even with small deviations around the mean (± 3.0 m), slipping distance variation cannot be stated as insignificant. Looking at Figure 1 it becomes evident that even though the results of loss of mass and specific wear rate seem practically similar, the consideration of the slipping distance in specific wear rate prediction (Eq. 1) leads to major changes in the wear behavior Therefore, it is inaccurate not to consider the slipping distance in the wear study, making the use of specific wear rate preferable.
Wear tests results.
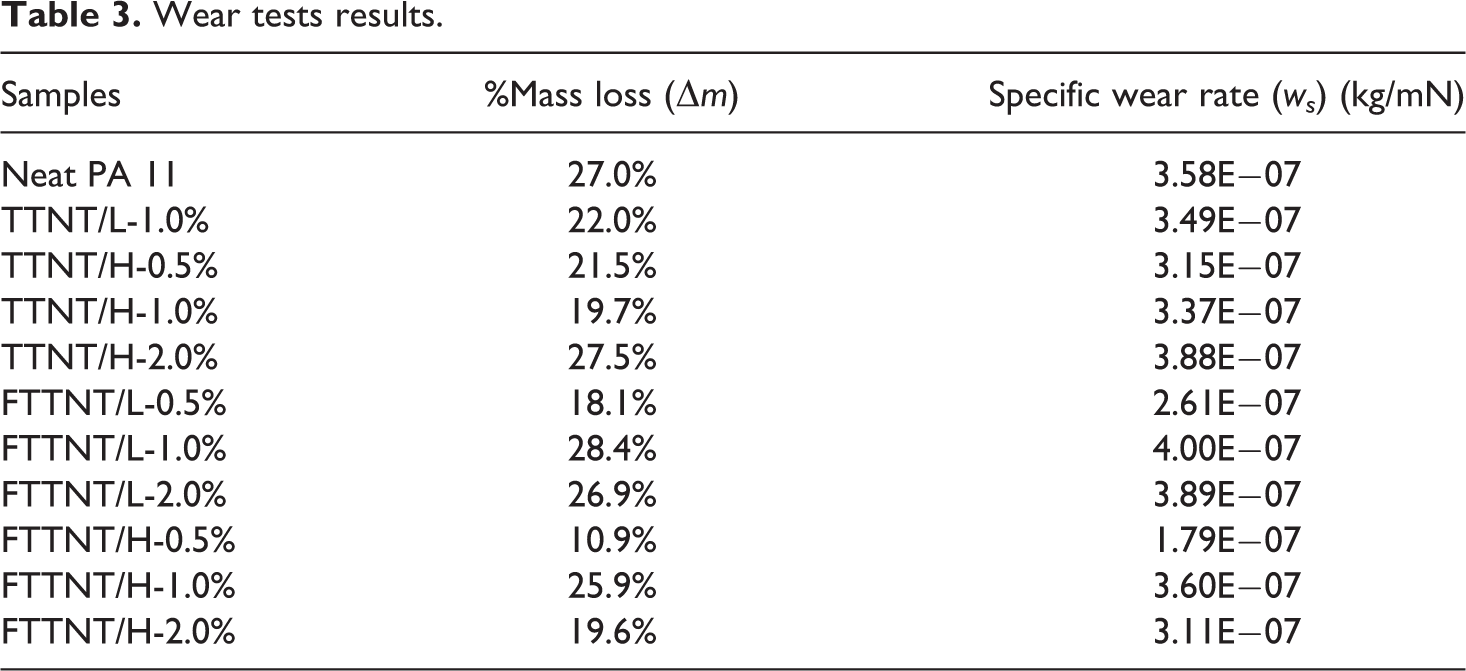
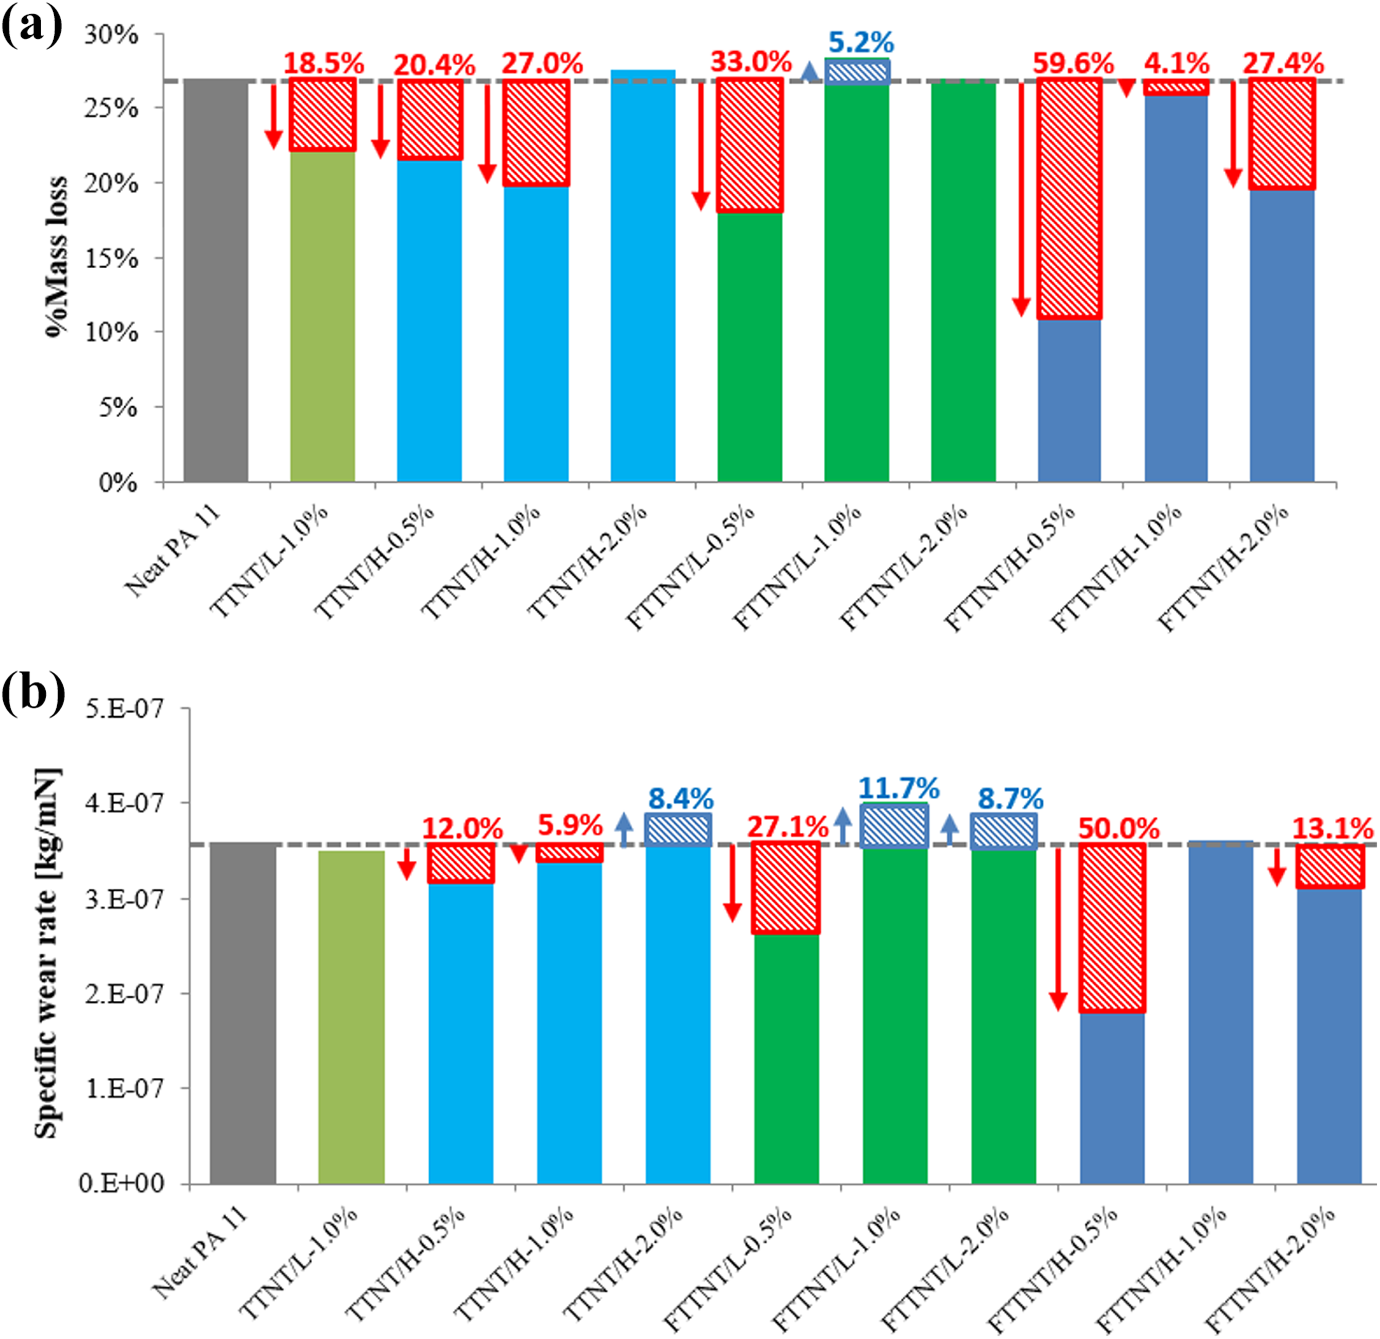
(a) Mass loss (
Looking at the specific wear rate results (Table 3 and Figure 1(b)), the effects of the studied factors can be split into three major groups. Depending on functionalization and sodium content, TTNT addition promoted (i) an increase, (ii) a decrease, or even (iii) no significant change in wear resistance. It is important to note that the specific wear rate has an opposite nature compared to wear resistance.38,39 Therefore, TTNT/H-2.0%, FTTNT/L-1.0% and FTTNT/L-2.0% composites that showed an increase in specific wear rate, demonstrated, accordingly to tribological properties, a decrease in wear resistance compared to neat polymer. In the same way, TTNT/H-0.5%, TTNT/H-1.0%, FTTNT/L-0.5%, FTTNT/H-0.5% and FTTNT/H-2.0% composites, which showed a decrease in specific wear rate, exhibited, consequently, an increase in wear resistance. Furthermore, the composites TTNT/L-1.0% and FTTNT/H-1.0% present almost the same behavior compared to neat PA 11. Among modified composites, it is meant to highlight FTTNT/L-0.5%, and FTTNT/H-0.5%, which showed a specific wear rate decrease over 27.0% and 50.0%, respectively, compared to neat polymer.
The different wear behavior obtained with the incorporation of TTNTs in the polymer matrix reflects the complexity of filler contribution in the tribological performance. Although the extent of the reinforcing effect depends greatly on the properties of the individual composite components, it can be expected that geometrical factors and the interaction of the components may play a significant role in tribological behavior.6,38
According to classical concepts, an improvement in the friction and wear behavior of polymeric materials by the incorporation of filler is achieved by either mechanical or chemical reasons. 13 The higher the wear rate is, the deeper the abrasive can penetrate the surface leading to additional material surface breakage and removal. 38 Thus, wear resistance can be maximized by enhancing material hardness, stiffness and toughness, or increasing material adhesion to the counterpart.39,40 Moreover, especially in polymer composites, the addition of a harder, rigidity and inorganic phase, such as TTNT, should improve wear performance by enhancing polymer modulus and hardness, helping on the formation of a tenacious transfer film.11,25,38,40
However, due to TTNT high specific surface area - an intrinsic result of its small size and high aspect ratio - particle agglomeration may occur, affecting the homogeneous dispersion of nanotubes, and hence resulting in severe abrasive wear. Also, as a result of its hydrophilic characteristic, the TTNT reinforcing effect may be inhibited by its poor adhesion to the polymer matrix, which may give rise to discontinuities and the initiation of cracks, increasing the specific wear rate.6,14 Therefore, although wear resistance can be improved with the incorporation of TTNT, a further increase in TTNT content may be critical to the wear performance of the nanocomposite.6,40
Taking a closer look at TTNT loading (Figure 2(a)), and although non-functionalized combinations showed a distinct trend in comparison to functionalized, it could be verified that lower specific wear rate was obtained for lower TTNT loading (0.5 wt%). If in one hand, the non-functionalized combinations presented a near monotonous increase in specific wear rate, i.e. wear resistance decay as TTNT loading increases, on the other hand, functionalized combinations showed a peak of wear in 1.0 wt% of TTNT with apparent drop up in 2.0 wt%. These results seem to indicate that due to its high specific surface area, even in a relatively low amount, 0.5 wt%, TTNT incorporation promoted an increase in wear resistance. However, a further increase of TTNT content led to a decrease in wear resistance, probably as a consequence of agglomeration and poor dispersion of the nanotubes. Indeed, SEM analysis conducted on previous studies22,35 showed the presence of many agglomerates on fracture surfaces of PA 11 nanocomposites. Figure 3(a) shows an example of fracture surface of PA 11 nanocomposite containing 1.0 wt% of TTNT (Figure 3(a)). EDS analysis confirmed that agglomerates were Ti rich compounds (Figure 3(b)).
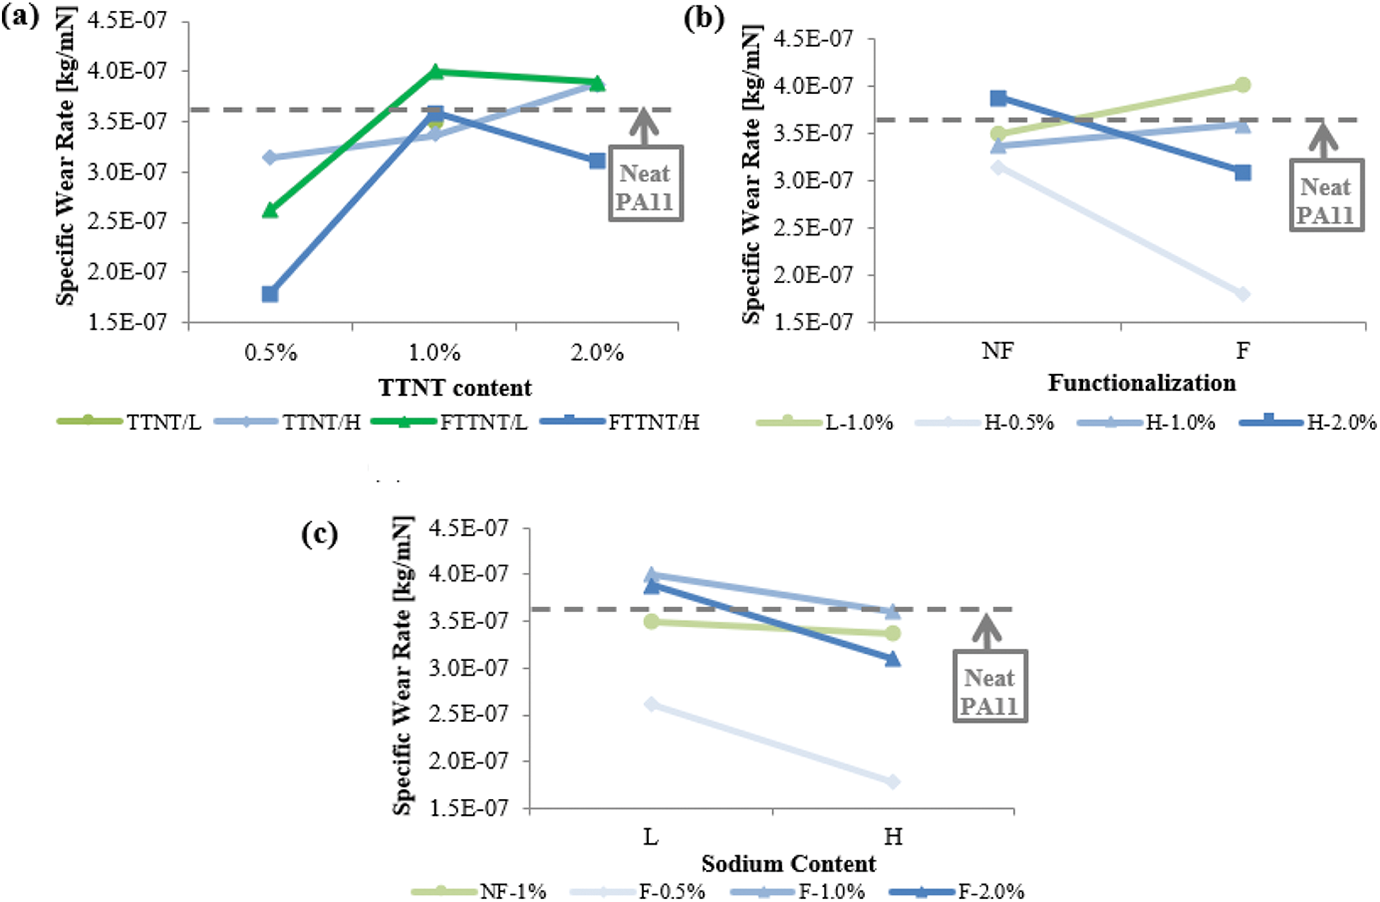
Specific wear rate effect plots of PA 11 and its nanocomposites according to (a) TTNT loading, (b) functionalization and (c) sodium content.
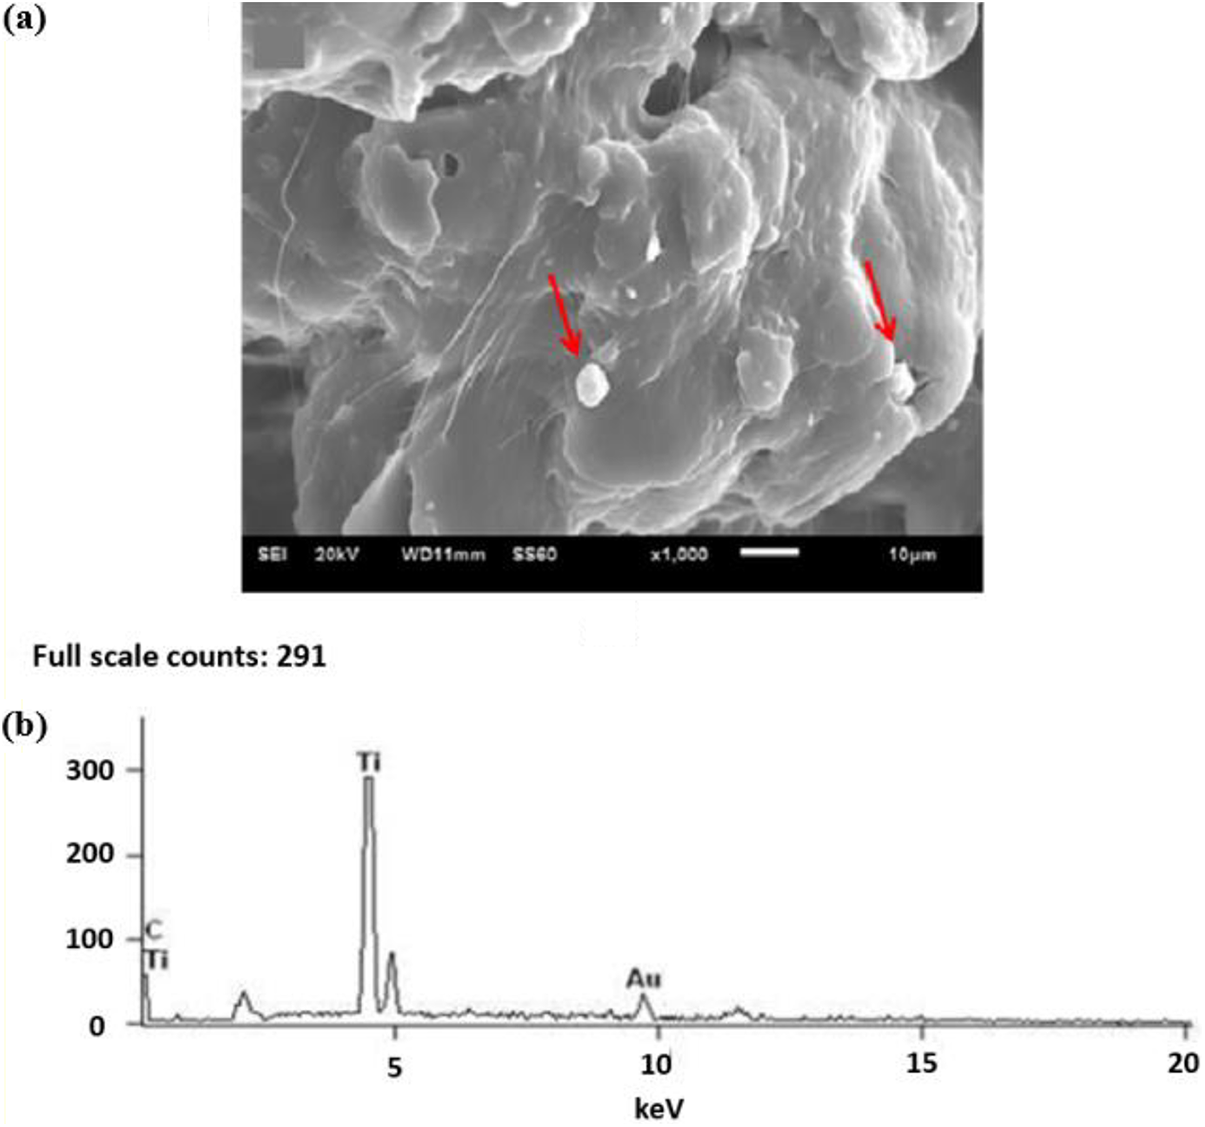
(a) SEM image of PA 11 nanocomposite containing 1.0 wt% of TTNT (TTNT/H-1.0%), showing the presence of agglomerates (→). (b) EDS analysis of an agglomerate.
In respect to functionalization, two different behaviors were verified (Figure 2(b)), demonstrating dependence with TTNT composition. For samples with 1.0 wt% of TTNT, the wear rate of non-functionalized (NF) combinations was lower than that of functionalized (F), showing a decrease in wear resistance with functionalization. Nonetheless, for 0.5 wt% and 2.0 wt% TTNT loadings, the effect of functionalization was the opposite, contributing to a decrease in specific wear rate and a consequent increase in wear resistance for functionalized nanocomposites. Physically, the increase of wear resistance due to functionalization may be explained by interfacial modifications. Functionalization through the use of a coupling agent can act at the interface creating a chemical bridge between reinforcement and matrix. It improves the interfacial adhesion when one end of the molecule is tethered to the reinforcement surface and the functionality at the other end reacts with the polymer phase. 23 Although filler/matrix interactions can be certainly maximized by the successful grafting of APTES on TTNT/H and TTNT/L surfaces, as demonstrated in previous works,20,21 the reduction of TTNT dispersion problems cannot be guaranteed. The cause and effect relationship between functionalization, nanofiller content and dispersion are complex. Even though functionalization may decrease the average size of TTNT agglomerate, its influence on the final properties may be minimal or almost insignificant, as shown by composites with 1.0 wt% of TTNT.
Unlike TTNT loading and functionalization, a single behavior could be verified for sodium content in respect to wear properties (Figure 2(c)). Regardless of functionalization and TTNT loading, high sodium content (H) promotes a decrease in specific wear rate and consequent increase in wear resistance. Sodium content, in addition to being closely related to the amount of the interlayer water and of its influences on TTNT chemistry and thermal stability,20,21 proved to be significant in respect to wear properties. Specific surface area modification, caused by sodium content variation after the washing step, may lead to alterations in adhesion and interface characteristics of TTNTs, which can influence directly the wear performance.6,20 The lower the sodium in the composition is, the higher will be TTNT specific surface area. 20 A higher specific surface area may increase filler/matrix extension and thus enhance the reinforcing effect. On the other hand, it may promote agglomeration, inhibiting TTNT homogenously dispersion, and hence diminishing wear performance. Although it is complex to evaluate the specific surface area major contribution to wear performance, according to the increase of the specific wear rate when sodium content was decreased, it can be inferred that the capability of specific surface area to enhance the reinforcing effect of TTNT was surpassed by the negative effect induced by nanotube agglomeration.
Surface roughness analysis
Parameter set definition
Before starting a discussion about the results of the roughness parameters, a parameter set must be defined. This set must be robust enough to minimize parameters that show limited potential to adequately describe the surface and to avoid parameters that essentially describe the same surface features. 41
Although roughness parameters are widely studied, there is a lack of information about their choice. Usually, parameters are selected according to their greater use, leaving aside their functional potential. De Chiffre et al. 31 state that an ideal parameter set investigation has to follow an analytical approach. Firstly, roughness parameters have to be classified and parameter families specified. Secondly, independent of classification, correlation has to be analyzed, so equivalence and redundancy within each family can be revealed. At last, parameters must be chosen accordingly to their functional sense. An ideal parameter set must be restrictive, robust and fast. That is, a small number of parameters have to be capable of describing major surface features, parameter variation should be minimal over the same surface and between measuring method, and the parameters must be easy to implement.42–44
Roughness parameters can be divided into three major groups: (i) amplitude or height sensitive parameters, (ii) wavelength or spacing sensitive parameters and (iii) hybrid parameters.
45
Amplitude parameters are directly related to the vertical characteristics of the surface deviations.
27
Due to the complexity of profile height, amplitude parameters are diverse. Ra and Rq give a general description of height variations;
Unlike amplitude parameters, spacing parameters measure the horizontal characteristics of the surface deviations.27,33 Although most surface features can be correlated with profile height, spatial properties also have to be described.
37
In this class,
When the use of amplitude and spacing parameters cannot describe successfully surface features, hybrid parameters adoption can be helpful. Hybrid parameters reflect amplitude and spacing information. Any changes, which occur in either profile height or spacing, may have an indirect effect on hybrid parameters.
43
Hybrid parameters generally characterize surface slope and curvature.
Besides roughness parameters, to complement surface characterization, parameter ratios can also be used. Among these relations,
Considering the previous parameter division and definitions, the roughness parameters measured were classified into families as shown in Figure 4. To check redundancy and equivalence between parameters within families, Pearson’s correlation coefficient (
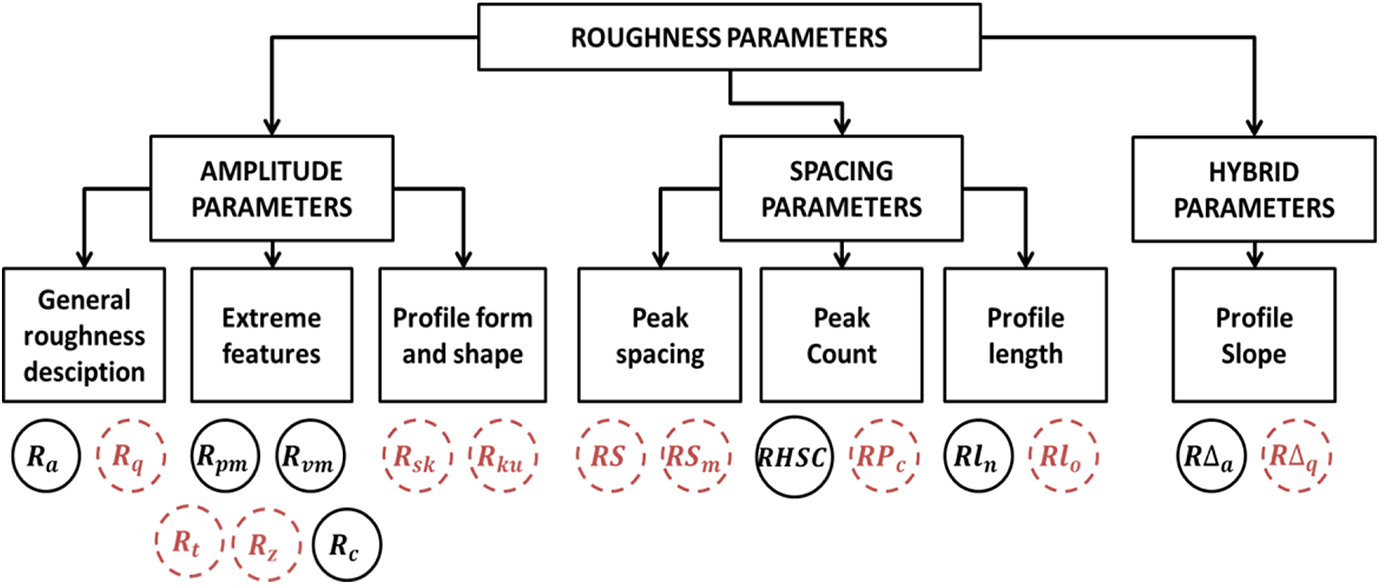
Classification of surface roughness parameters. Highlighted parameters were selected to compose the parameter set.
Correlation between experimental surface roughness parameters. Green color illustrate a strong correlation (
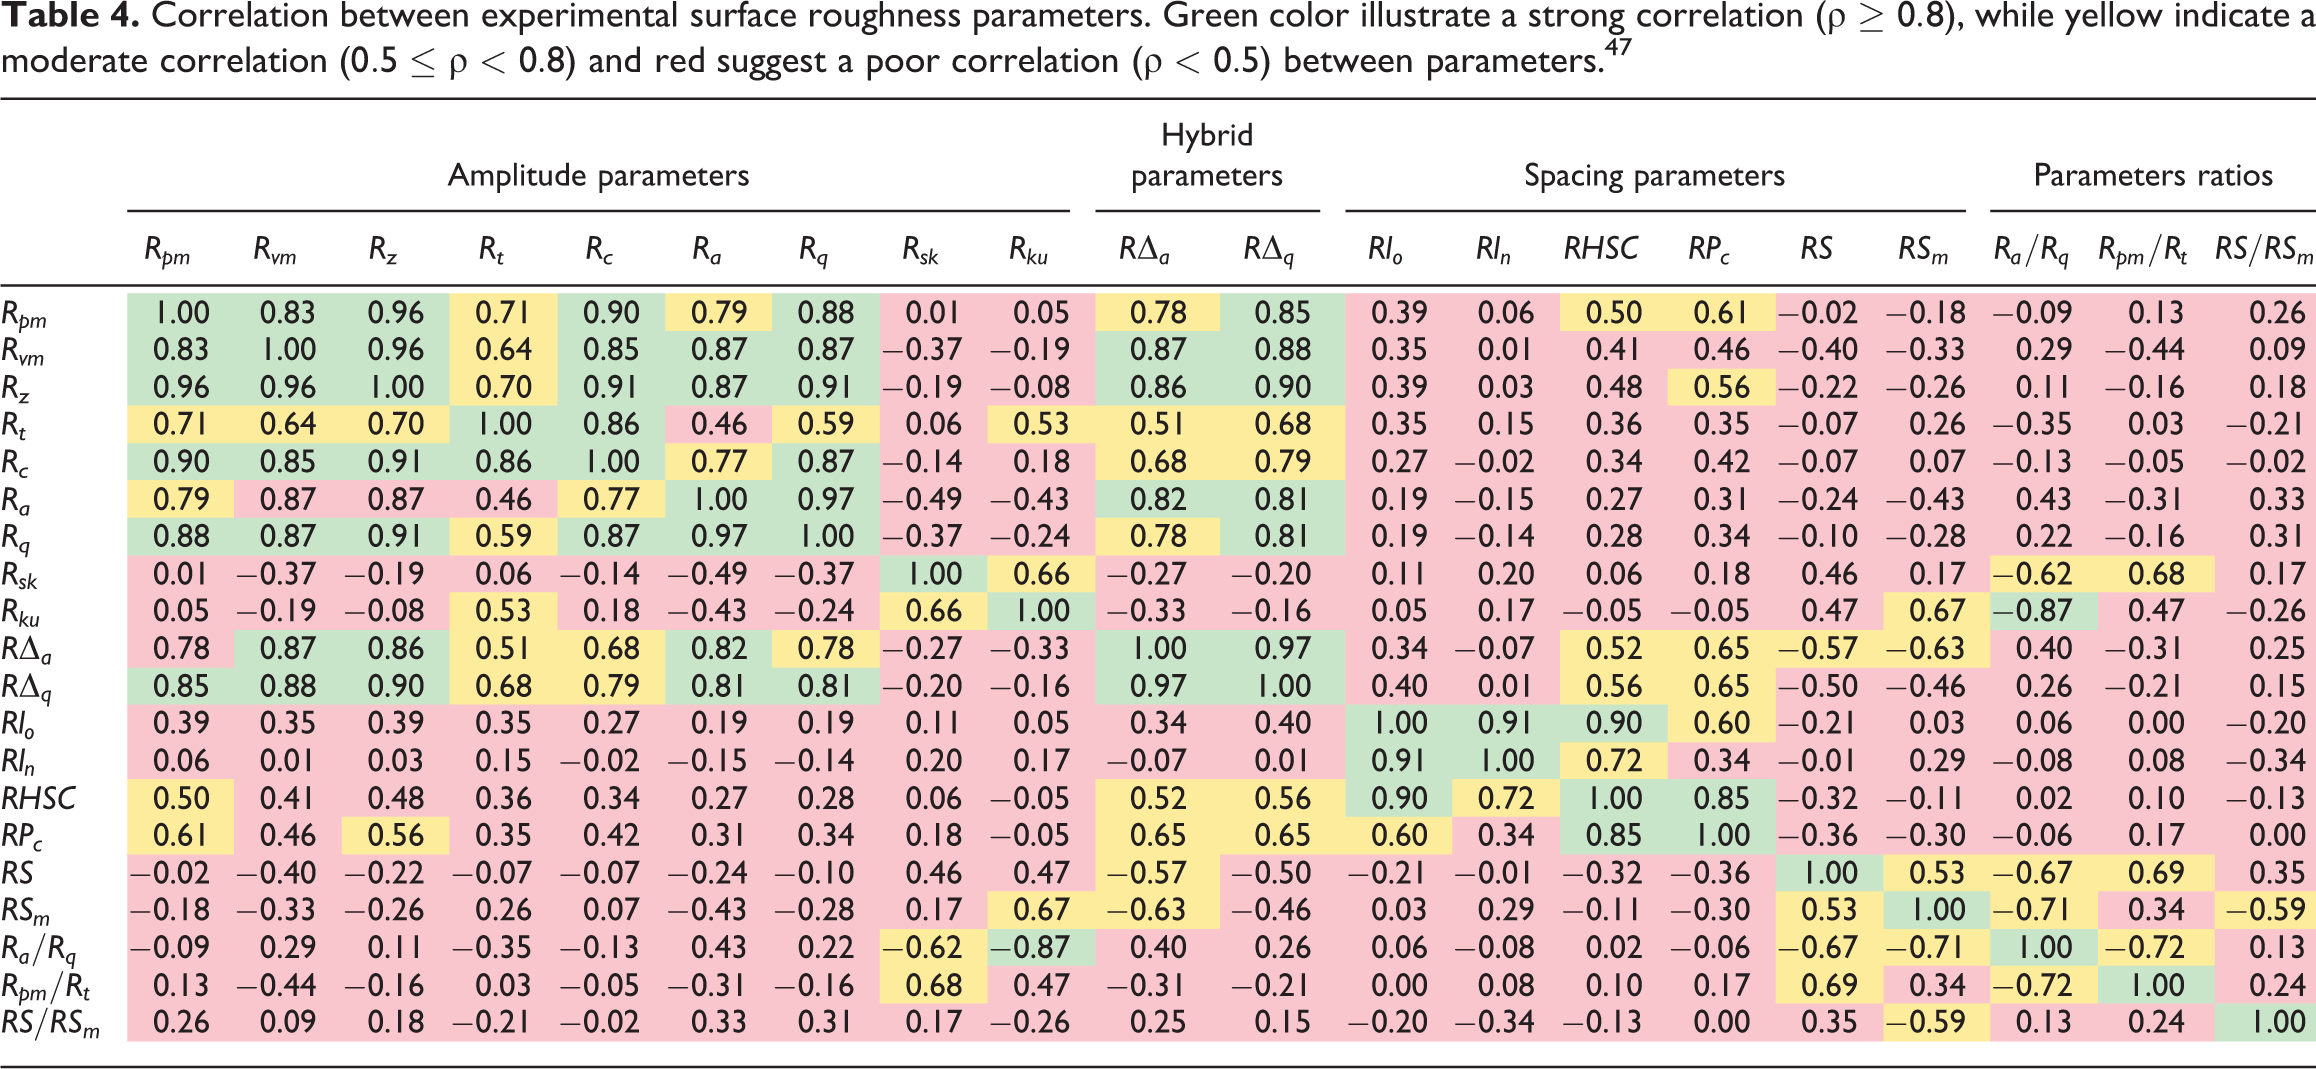
Parameter dissociation has to be carefully analyzed. On the one hand, the peculiar behavior of a parameter can make it special, being its choice indispensable to characterize a unique property of the profile. On the other hand, parameter disconnection may be just a consequence of a poor classification. It becomes evident, in the present study, that the latter alternative should be discarded. The highlighted parameters—Rt,
Rt can be considered unique among its group because it is measured over the evaluation length. Unlike Rz,
Skewness (
The definitions of
Considering parameters importance and correlation previously discussed, a parameter set was established—Rz, Rt, Rq,
Function correlation
Once the parameter set has been defined, ensuring that the majority of surface features could be described, the functional correlation of surface roughness parameters must be tested. Surface topography can be a direct and reliable indicator of tribological performance.13,27 Thus, for the control and design of tribological components, it is important to understand roughness parameters and function relation. 32
The term function describes the use of the surface. 27 Although function is open-ended, because polymer composites applications are tribological diverse, in most of the cases, it is of primary concern to develop polymeric composites that possess a consistent wear performance under dry sliding conditions.39,40 Generally, the optimal tribological properties can be summarized by greater wear resistance. 48 Therefore, a good starting point to understand functional surface relations is to study wear and surface roughness parameter correlation. 32
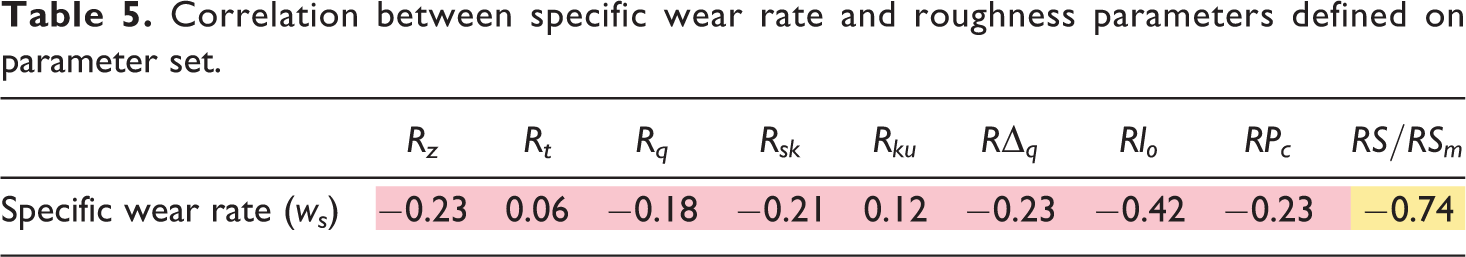
Table 5 presents the Pearson’s correlation coefficient found between the parameter set and the specific wear rate, and Figure 5 shows the specific wear rate as a function of each surface roughness parameter. In general, no correlation between roughness parameters and wear behavior was observed, and
Correlation between specific wear rate and roughness parameters defined on parameter set.
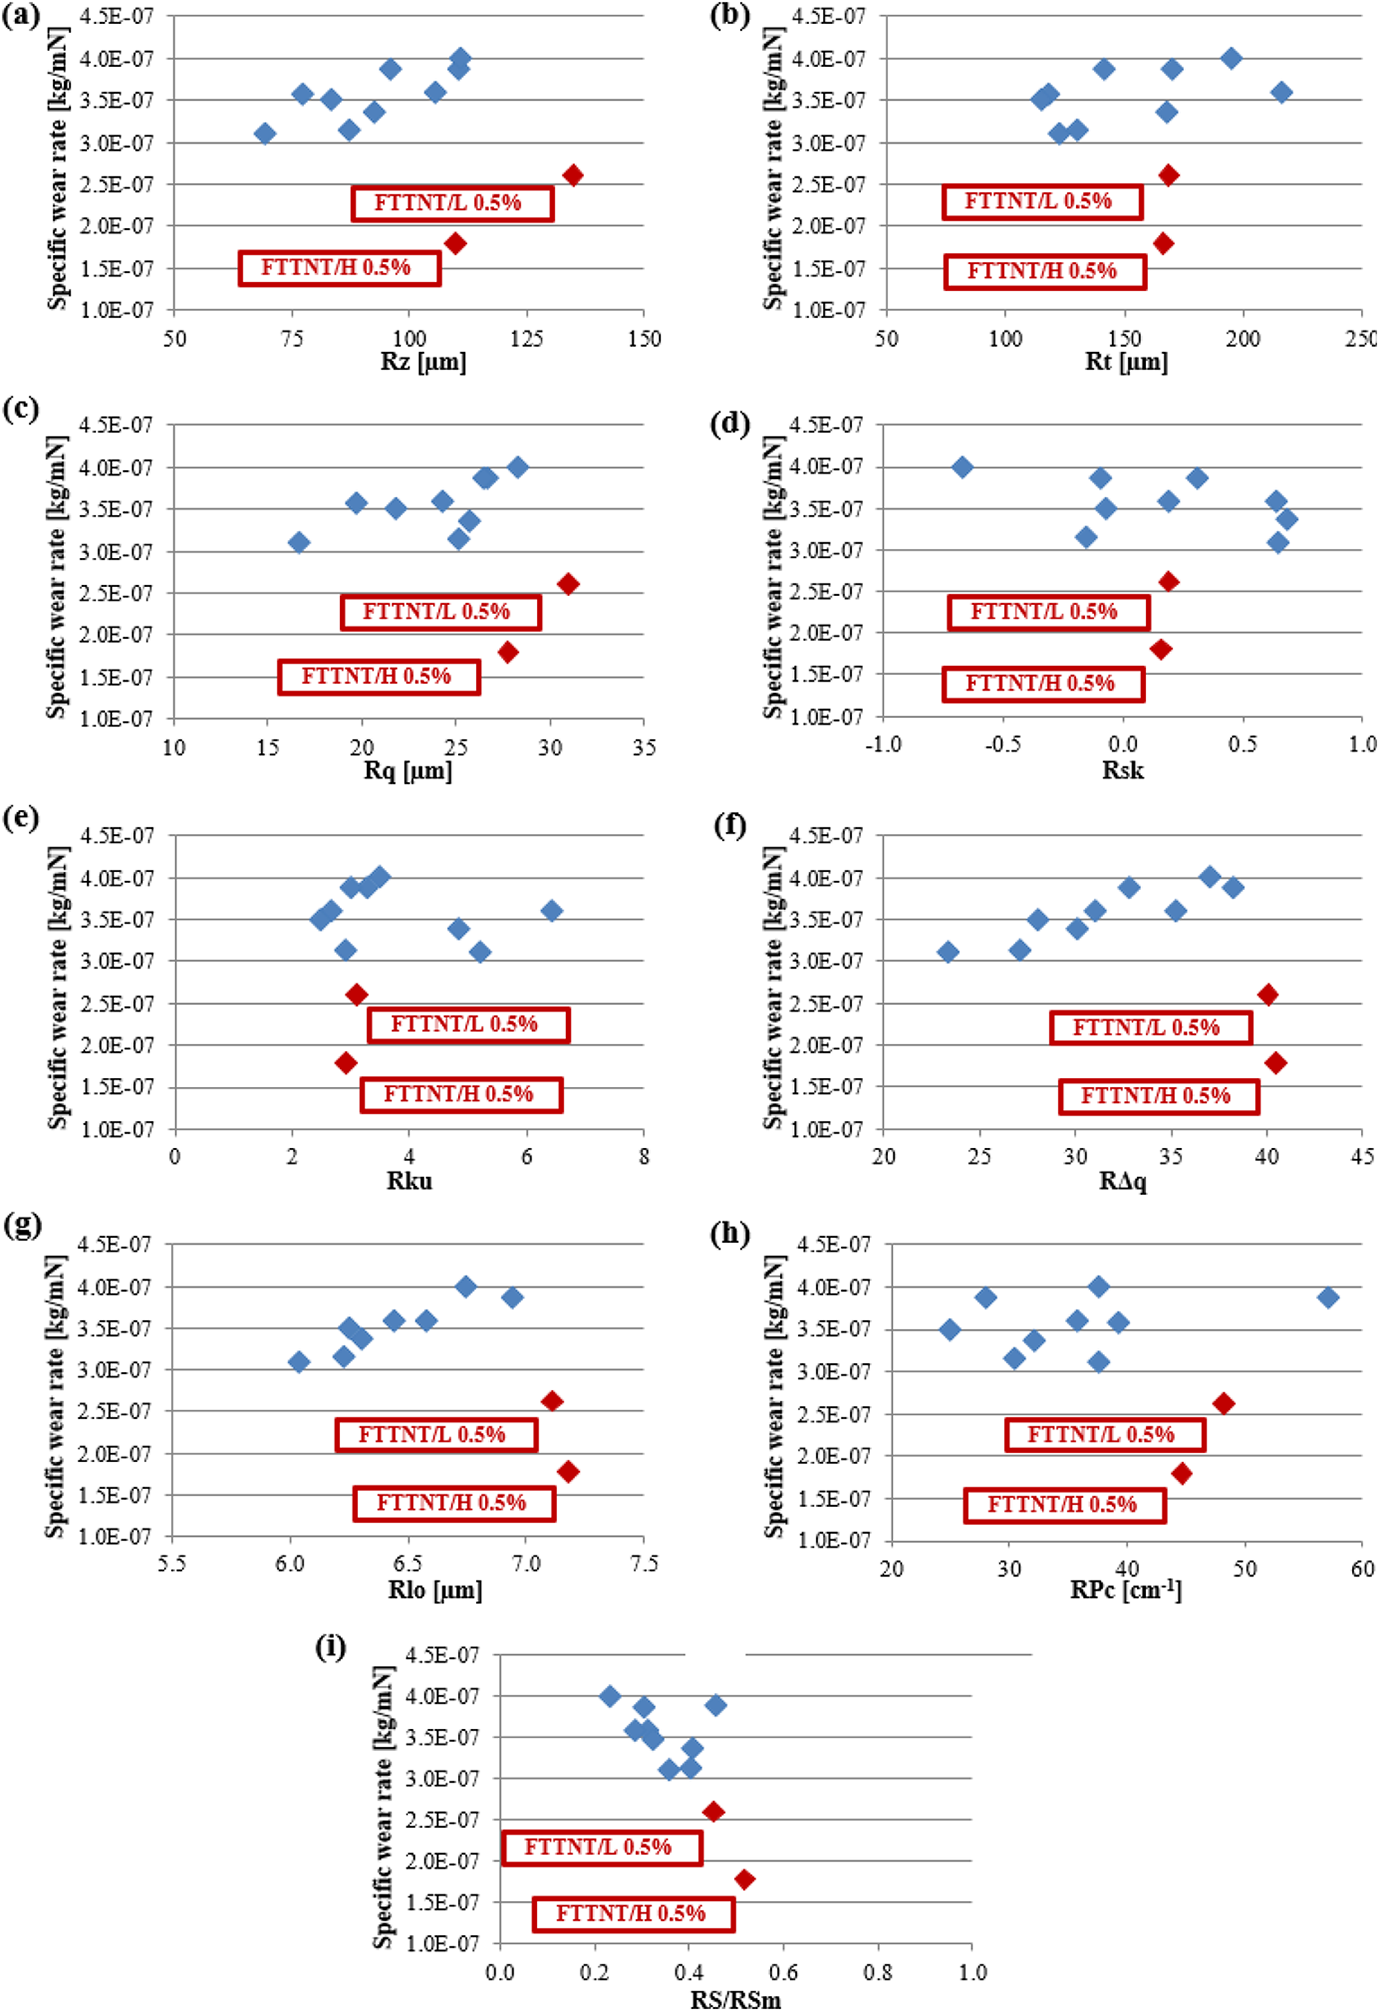
Relationship between specific wear rate and the parameter set: (a) Rz, (b) Rt, (c) Rq, (d)
It is important to remember that surface topography is not the only factor governing function, but one among the geometrical properties that exist simultaneously and interact with material properties and operating conditions.31,38 Depending on the contributions of the material, the geometric properties and the operational conditions, wear performance may be completely different. 37 The potential of surface roughness parameters in describing wear rate is intimately linked to the amount of geometric properties contribution. When the effects of material properties or operational conditions greatly surpass the influence of surface topography on the wear performance, the ability of surface roughness parameters in describing the wear behavior may be minimal.
According to the literature, changes in material properties are sufficient to modify completely the dominant wear mechanism.13,38,40,48 Particularly for composites subjected to an abrasive process, such as grinding, as filler content increases or/and as filler/matrix interaction extension is modified, the contribution of abrasive mechanisms to the wear of the material may be highly suppressed.38,40 A transition from abrasive wear to adhesive wear may be experienced, and a great decrease in wear rate may occur.13,49 It is important to note that a change in the dominant wear mechanism implies a consequent modification in the contact kinetics and tribological action. 6 Hence, wear behavior may be entirely modified and so surface roughness and wear relation.
Therefore, surface roughness parameters and wear correlation may have been biased by the presence of FTTNT/L-0.5% and FTTNT/H-0.5% (Figure 5). As stated previously at the wear performance section, FTTNT/L-0.5% and FTTNT/H-0.5% showed an outstanding decrease in specific wear rate compared to neat PA 11 and the other nanocomposites. It seems that the particular combination of TTNT content and functionalization present in FTTNT/L-0.5% and FTTNT/H-0.5% led to a synergic improvement of material properties capable of modifying the dominant wear mechanism. This may have changed completely the wear behavior, explaining the peculiar surface roughness parameters and wear relation showed by those nanocomposites.
Considering FTTNT/L-0.5% and FTTNT/H-0.5% as outliers, Pearson’s correlation coefficient increases for most of the roughness parameters reaching levels of moderate to strong correlation with specific wear rate, such as Rz(
Wear is closely related to the asperities and contacts between parts. For most surfaces in relative sliding or rolling contact, the area of effective contact is much smaller than the nominal contact area. The applied load is supported by several small local asperities, making up the real contact area, and the friction and wear behavior result from the interactions between these local asperities. 37 Wear rate is proportional to asperities contact pressure, but contact pressure is inversely proportional to the power of the real area of contact.38,49 Hence, for a given applied load, a small change in the asperities may promote a corresponding modification in the effective contact area, which in turn may lead to a massive change in local contact pressure, influencing significantly the wear rate.
Asperities characteristics, such as sharpness, height, and distribution, are closely related to surface topographic properties, and so can be described by surface roughness parameters. These include the distribution of profile height (Rq, Rz, Rt), the profile shape (
Wear rate increases as the distribution of profile height increases. Roughness (Rq) and extreme profile features (Rz and Rt) depend extensively on profile height. Thus, as roughness and extreme profile features increase, profile height may increase, which in turn leads to a decrease in the real contact area and an increase of wear rate (Figure 5(a) to (c)). 49
Wear rate may increase with profile shape modifications. Essentially, profile shape is described by the skewness (
Wear rate increases as the slope of the asperities (
Also, wear rate increases as the relative length of the profile (
Wear rate may increase with the density of peaks (
Wear rate increased as surface regularity (
Parameters variation
A major factor in attempting to establish the relationship between the functional properties and surface topography is that parameters are subjected to variations. 44 Besides parameter set effectiveness in describing surface features, roughness parameters also have to be robust. Thus, understanding parameter variation may be a critical step towards a complete description of engineering surfaces both functionality and analytically. 44
However, the study of parameter variation may be complex. Surface roughness parameters, being necessarily imperfect statistical representation of a very complex geometrical structure, are more prone than many other physical measurements to scatter. The causes of parameter variation may be diverse and the degree of variability due to these causes may be different for different parameters. 42 Although many efforts have been made to study parameter variation, the significance, sensitivity and main cause of parameter variation are still open questions.27,42,44
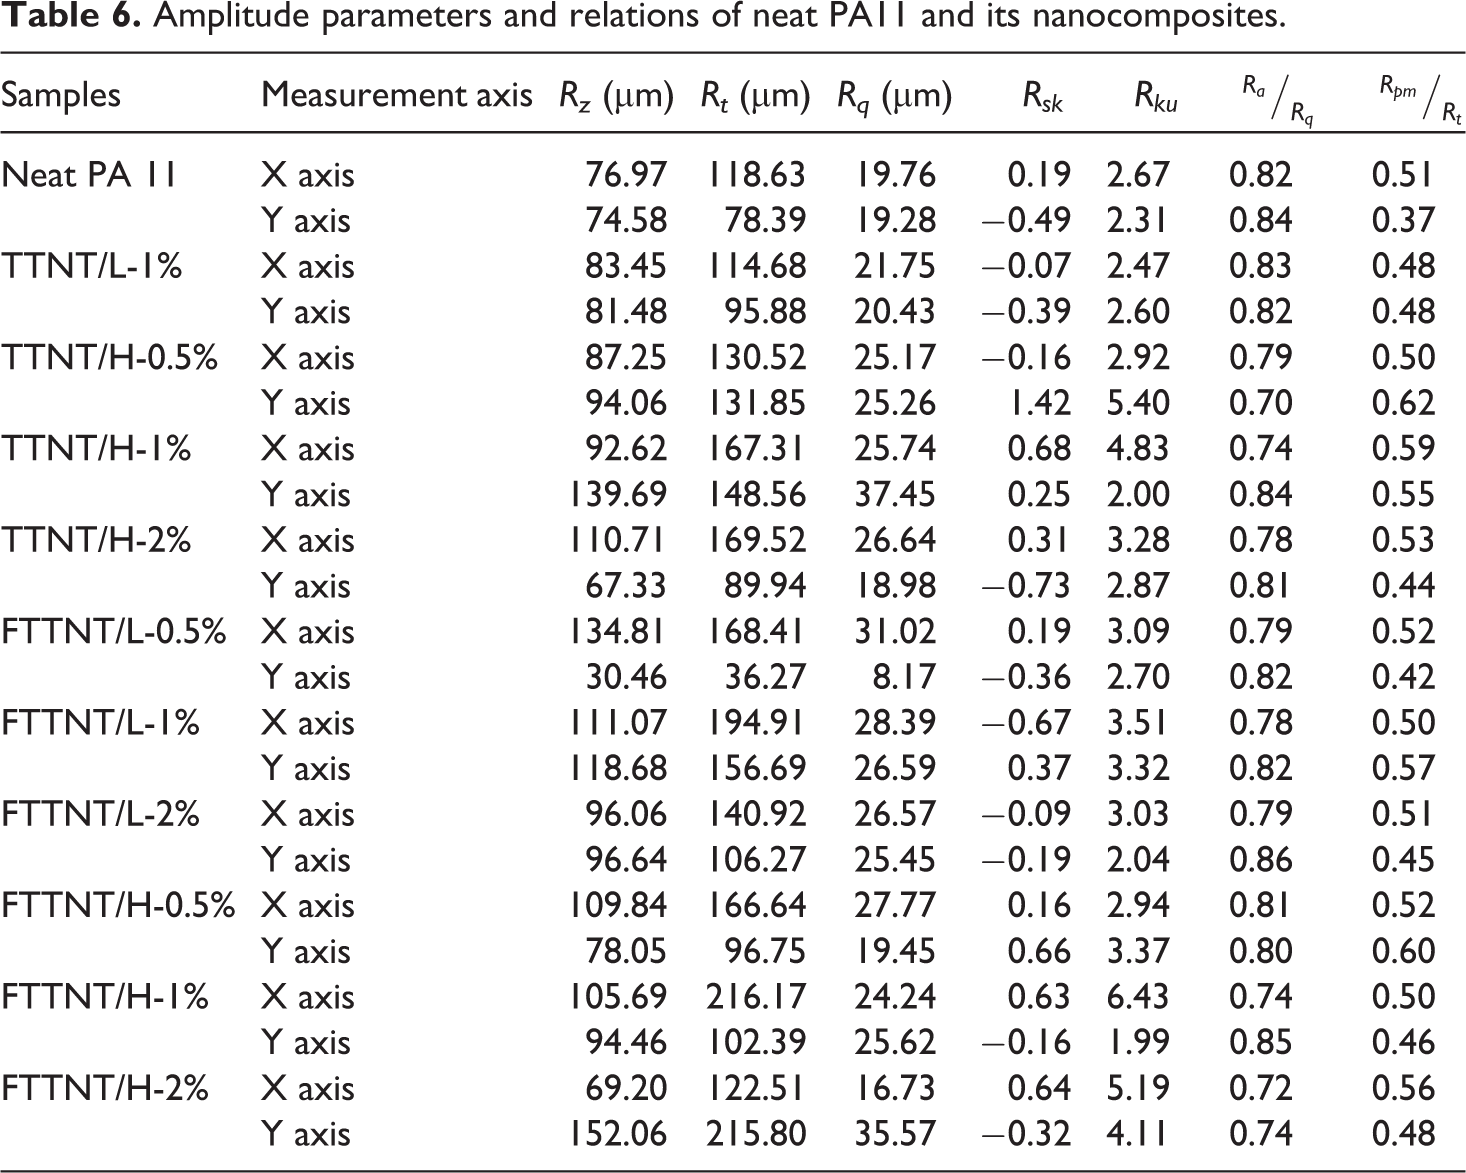
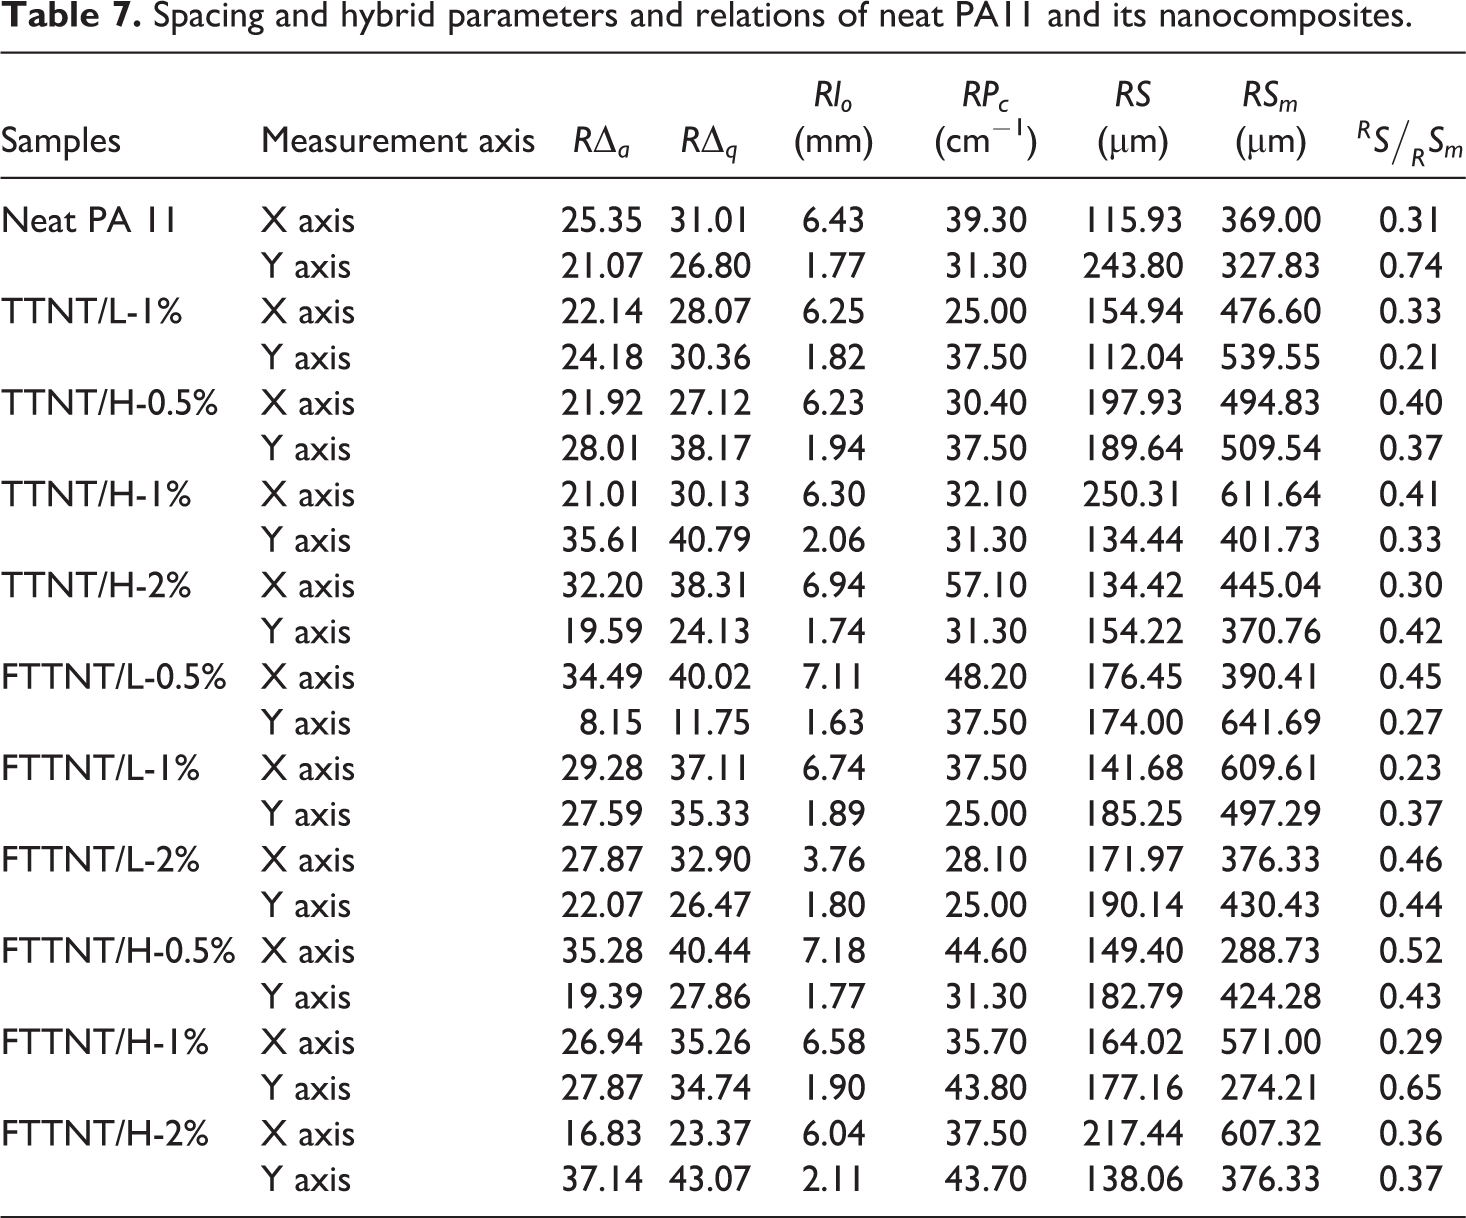
Tables 6 and 7 show the values obtained for all roughness parameters for the neat PA11 and its nanocomposites according to the measured axis. Some surface parameter relations are also presented. Figure 6 summarizes the variations of the main surface roughness parameters, i.e. those which form the parameter set, obtained when comparing the measured axis. In Figure 6, the variation of the parameters is presented locally (Figure 6(a) to (e)), making it possible to analyze TTNT content, functionalization and sodium content contributions, and globally (Figure 6(f)), giving the possibility to examine also the overall sensitivity and robustness of the parameters.
Amplitude parameters and relations of neat PA11 and its nanocomposites.
Spacing and hybrid parameters and relations of neat PA11 and its nanocomposites.
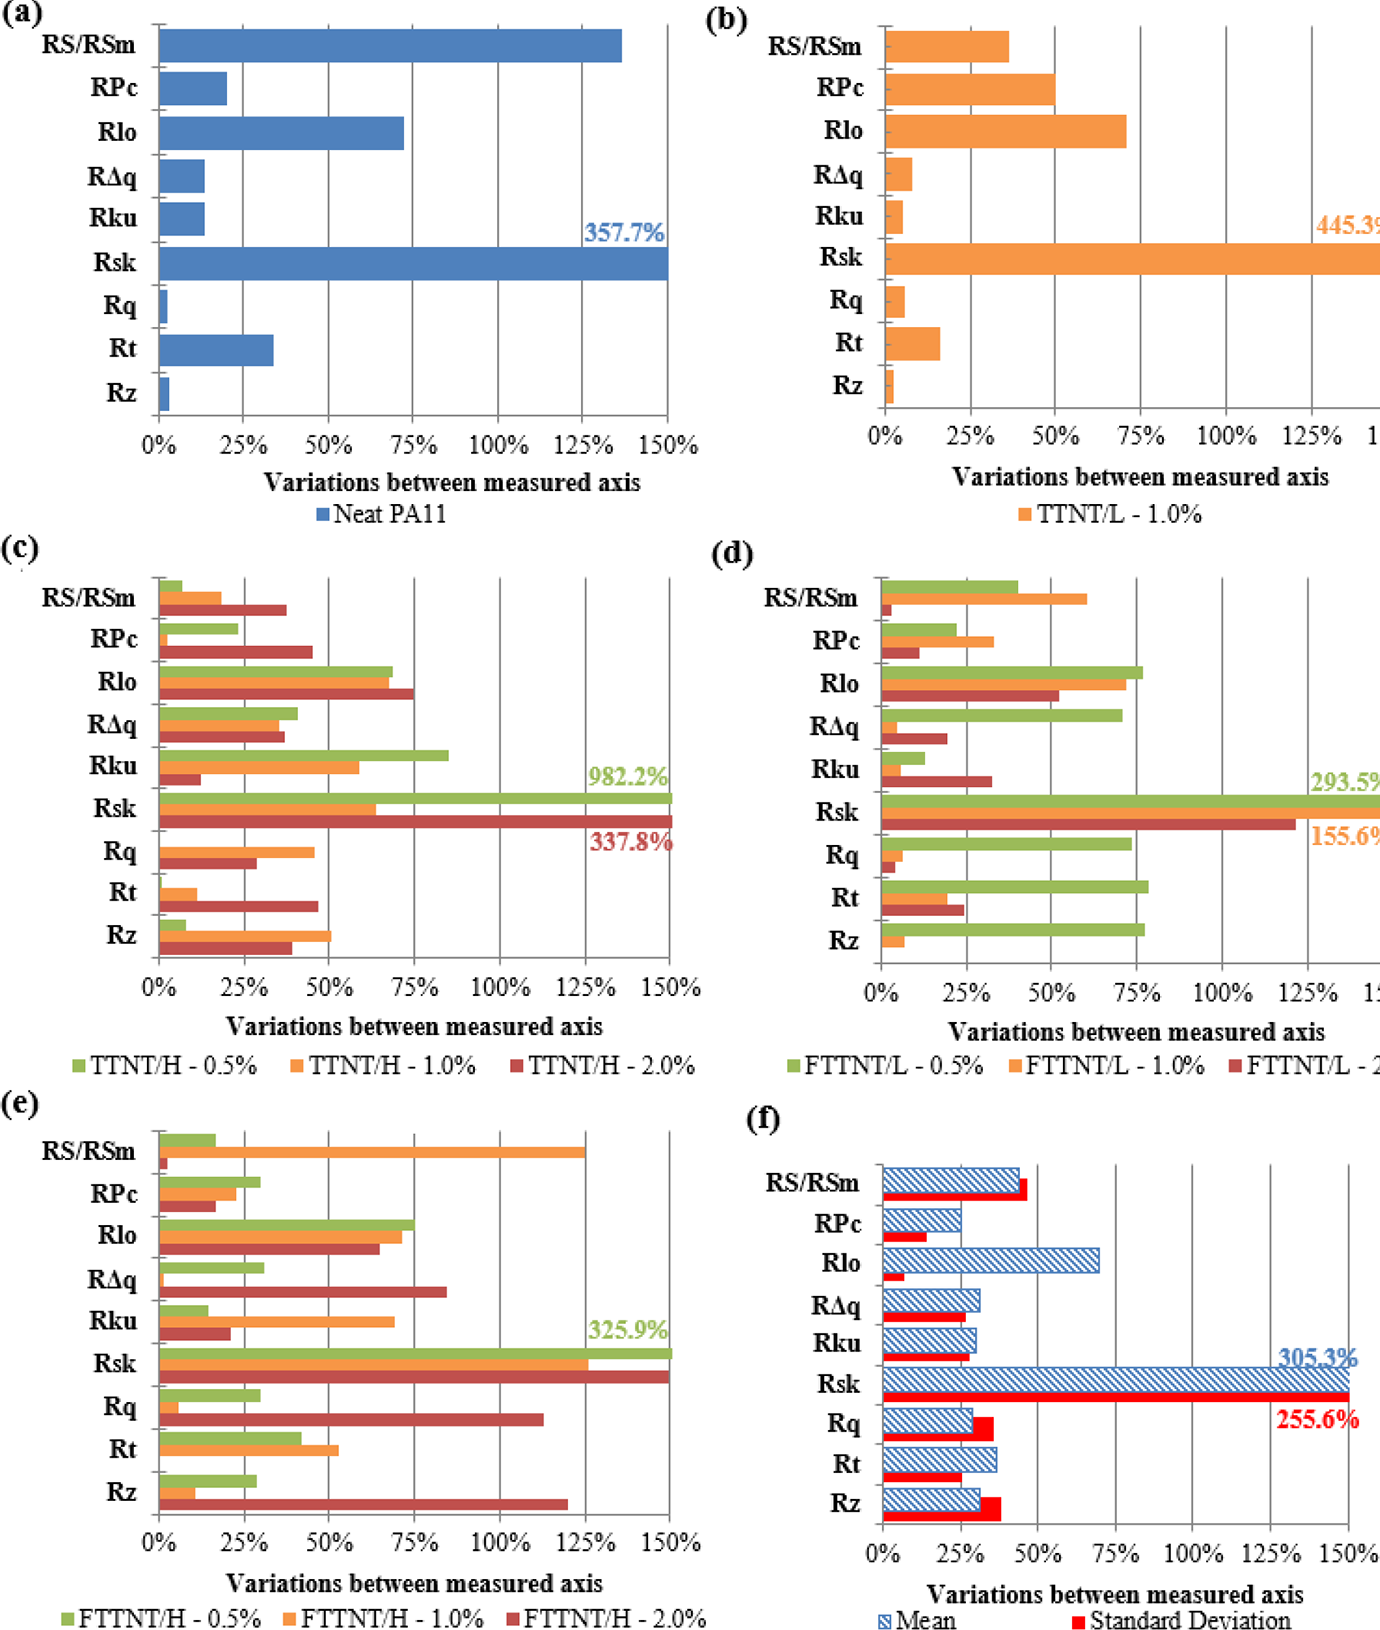
Roughness parameters variation according to the measured axis in (a) neat PA11, (b) non-functionalized nanocomposites reinforced with TTNT low sodium content, (c) non-functionalized nanocomposites reinforced with TTNT high sodium content, (d) functionalized nanocomposites reinforced with TTNT low sodium content and (e) functionalized nanocomposites reinforced with TTNT high sodium content. (f) Overall mean and standard deviation of roughness parameters variations concerning PA11 and its nanocomposites.
Before starting to analyze in more detail the variation of the results, it is important to establish a systematic approach. After the calculation of parameter variations some questions must be drawn27,42,44: (i) How parameters are varying? (ii) Does the surface really contain such a dramatic change that explains parameter relation? (iii) What are the possible causes of parameter variations? (iv) Does a systematic error of form exist? (v) What may be the predominant cause of parameter variation?
A clear change of surface roughness behavior according to the measured axis is perceptible in all combinations. Depending on the amount of TTNT, functionalization and sodium content, the variations of the parameters have changed (Figure 6). In general,
As stated previously, parameter variations causes are diverse. Dong et al.42–44 relate parameter variations due to two main causes. Statistically, parameter variations can be linked to the non-stationarity of surfaces and limited independent samples, and physically, variations can be a consequence of inherent properties of the surface, data measurement and processing conditions. Besides, parameter variations are basically composed of two types of errors: (i) systematic and (ii) random. 27 Systematic errors are sometimes called bias and can be generally related to imperfect devices and measurement procedures, such as limited independent samples and data measuring and processing conditions. While random errors produce the scatter of readings and are caused mainly by a non-constant source of errors either in time or space, such as the non-stationarity of the surface. 27
Although systematic errors are difficult to analyze, the standard deviation may be a good starting point. Although a systematic error results from a persistent issue and leads to a stable variation in the measurement, deviations from the mean value, i.e. the standard deviation, should be minimal, once fluctuations of variation of the parameter are constant. Looking at Figure 6(f),
It is important to note that
The presence of a systematic variation may also indicate limited independent samples. However, its influence on the roughness parameters may have been minimal. Neither in
Besides systematic variation, it is also important to understand parameter variations induced by random errors. Ground surfaces generally exhibit non-stationarity.42,44 During grinding the surface is subjected to many cutting points and the abrasive grains are randomly distributed producing a surface with random characteristics.27,42 Surface randomness can be confirmed by
The sensibility of each roughness parameter to the non-stationarity of the surface may be completely different. Commonly amplitude parameters are mainly affected by non-stationarity. As an accepted rule of thumb, higher-order relative moment parameters, such as
Conclusions
The study shows promise results for the use of TTNT as reinforcing material on PA 11 in terms of wear performance. Depending on TTNT loading, functionalization and sodium content, different wear behaviors can be obtained. Wear resistance can be maximized in nanocomposites reinforced with a low amount of functionalized TTNT (0.5 wt%) of high sodium content. Although at first look the unceasing incorporation of a harder, rigid and inorganic phase, such as TTNT, shows potential to improve continuously PA wear performance, careful attention must be paid to TTNT dispersion and interaction with the polymeric matrix. Due to TTNT inherent characteristics, wear reinforcing effect may be suppressed by nanotube agglomeration and low adhesion to PA.
An efficient and robust roughness parameter set to characterize surface topography can be defined following an analytical approach based on parameter classification and correlation. Several roughness parameters demonstrate redundancy in describing some surface features, like
Some roughness parameters reveal a moderate to strong correlation with wear performance. Rz, Rt, Rq,
Considering the roughness parameters studied,
Footnotes
Acknowledgements
The authors acknowledge the grants from the Brazilian funding agencies CNPq and CAPES.
Declaration of conflicting interests
The author(s) declared no potential conflicts of interest with respect to the research, authorship, and/or publication of this article.
Funding
The author(s) disclosed receipt of the following financial support for the research, authorship, and/or publication of this article: The authors received financial support from the Brazilian funding agencies CNPq (grant number 301299/2010-2) and CAPES (finance code 001).