
Abstract
The poly-lactic acid (PLA), bio compatible polyamide (PA6) and TiO2 has established bio-medical applications especially in 3D printing of scaffolds. But hitherto little has been reported on improving the performance of multi-material matrix for PLA-PA6/TiO2 especially in 3D printing application of biomedical scaffolds. The anti-bacterial properties of PA6/TiO2 make it worthy to be explored with PLA matrix in multi layered fashion on the platform of fused deposition modeling (FDM) being low cost 3D printing technology for in house development of scaffolds. In this work an effort has been made for in-house development of feedstock filaments of PLA and PA6/TiO2 based polymeric composite matrix on twin screw extrusion (TSE) machine. Further the feedstock filament wires were used on FDM to establish the flexural, wear and morphological properties of multi-material 3D printed functional prototype. The results of the study suggest that for flexural strength, infill speed: 90mm/s; infill pattern: triangular and layer combination as 5 consecutive layers of PLA and 5 consecutive layers of PA6/TiO2 are the optimized conditions for FDM printing. The wear testing results suggest that the composite of PA6/TiO2 held low wear rate (823 µm) in comparison to PLA (wear rate: 1092 µm). Further porosity testing (based upon optical photomicrographs) at ×100 and fractured surface analysis at ×30 supported the observed trends for flexural and wear testing. The photomicrographs of fractured surface were 3D rendered to predict the role of surface roughness (Ra) profile for flexural properties. The mechanical and morphological observations are also supported with scanning electron microscopy (SEM) and energy-dispersive X-ray spectroscopy (EDS) analysis.
Keywords
Introduction
The reinforcement of fillers (in terms of fiber/powder) into thermoplastic matrix induces valuable enhancement in physicochemical and mechanical properties of thermoplastics. 1 At present, different types of fillers are reinforced in order for enhancement of one or more mechanical properties such as tensile, compressive, flexural, pull-out strength etc.. 2 It has been reported that nano particle reinforcements offers new technological and economic benefits. The reinforcement of nano particles as reinforcement (e.g. nanofibre, nanotubes and layered silicates of clay and metal nanoparticles in polymeric materials) significantly has improved the mechanical properties of base polymer. 3 Nano powder of TiO2 is one the oldest and most conventional agents for the purpose of self-cleaning, antibacterial, UV blocking substrate, catalytic, purification, and optoelectronic devices.4–9 Variety of polymers (such as thermoplastics, thermoset, functional polymers, composites, and hydrogels) has been used extensively in additive manufacturing. For enhancement of mechanical properties of polymeric blends while using 3D printing technology it has been established that the input process parameter parameters (like mechanical properties, build speed, surface finish and accuracy etc.) played vital role hence, the process parameters need to be optimized for selected polymeric composite. 8 The advancements in 3D printing materials (such as thermoplastics: PLA, PA6, acrylonitrile butadiene styrene (ABS), etc.) has helped in enhancing the scope of FDM process.10,11 The mechanical and water barrier properties were improved with the blending of PA6 in polypropylene (PP). 12 PA6 has been established as a good barrier against oxygen but has shown poor resistance to water and water vapor. On the contrary, PP exhibits excellent moisture barrier, which has helped in enhancement of water resistance property of PA6. 13 FDM process parameter (such as: Infill density, infill speed, building orientation, infill pattern and temperature condition) influences the mechanical properties of 3D printed specimens. 14 Layer thickness and infill density has shown enhancement in mechanical properties of the 3D printed functional prototype. 15 The process parameters (such as built orientation, layer thickness and fiber volume content) have significant impact on the mechanical properties of 3D printed specimens of fiber reinforce composite. The layer thickness and number of perimeter for 3D printed object in case of PA6 functional prototypes have increased the tensile and flexural strength significantly. 16 The mechanical properties for polymeric composite has been observed to be increased with 3D printing at low infill angle (0°) and high infill density (100%) than high infill angle and low infill density. The 3D printed virgin PLA sample printed at 0° orientation of nozzle has shown better tensile strength (105 MPa) than sample printed at 45° orientation angles. 17
For in-house development of feedstock filament of new polymeric composite the twin screw extrusion (TSE) machine has been widely used with reinforcement of metallic /non-metallic /ceramic fillers in polymer matrix. The various process parameters (such as: material composition; rotational speed of TSE; die temperature of TSE; particle grain size and applied load on TSE) are mainly used for the preparation of feed stock filaments. 18 Better feeding and more positive conveying characteristics of TSE prepared filament with uniform distribution of fillers as compared to single-screw extruders have been widely reported. 19 The process parameters of TSE have significant impact on tensile characteristics of reinforced polymer. TSE has brought a revolution in material extrusion because of uniform blending of suitable proportions of different ingredients in thermoplastic granules. 20 There is significant effect of size of reinforcement in polymeric matrix as researchers have observed higher flexural modulus with the addition of nanofillers in comparison to virgin thermoplastic. Also, with increase in filler percentage in polymeric matrix the water intake capacity of the thermoplastic nano-composites has been found to be enhanced. The nano-composite containing carbon nano-tubes exhibited better water absorption capabilities. 21 The increasing load of PA6 wt% in the composite has shown significant improvement in flexural properties of polymeric matrices. 22 The Kenaf-bamboo-coir/PLA composites reinforcement increases the mechanical strength approximately 20 to 78% higher than bamboo-coir/PLA and Kenaf coir/PLA reinforcement respectively. But the Young’s modulus of the three composites was obtained ranging from 6.0 to 7.5 GPa. 23 Researchers have widely explored the impact of different input parameters (such as: layer density, thickness, speed, infill perimeter and extrusion temperature) on maximum value of flexural force in PLA specimen. 24 The reinforcement of 4 wt% organoclay in polymeric matrix has shown better mechanical properties than other reinforcement levels of organoclay in polymer thus it was observed that with higher loading of organoclay there was drop in both strength and strain values. 25
From literature review it has been ascertained that researchers have focused on FDM printing of polymeric matrix by introducing foreign fillers in the basic matrix of polymer for different applications such as structural, non structural, medicinal application but hitherto little has been reported on flexural, wear and morphological properties of multi-material specimens of PLA and PA6/TiO2. Therefore present investigation deals with primary objective of (i) development of flexural functional prototype of PLA-PA6/TiO2 composite using in-house developed feedstock filament and secondary objective of (ii) optimization of FDM processing parameters and exploration of flexural, wear and morphological properties of multi-material composite matrix through UTM, Wear testing, porosity testing, photo-micrographic image analysis.
Materials and methods
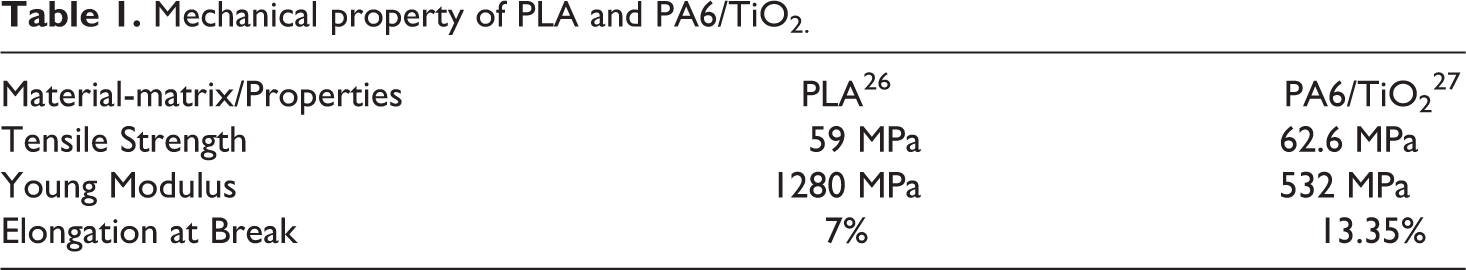
For this study PLA was procured from local supplier (Shiva chemicals limited, Ludhiana, India) and PA6/TiO2 composite was procured from lab of (Dr. Fernando Fraternali, Professor, Dept. of Civil Engineering) University of Salerno, Italy. The procured polymers were in granule form therefore the procured polymers were processed with TSE machine and feedstock filament of standard dimension 1.75 ± 0.05 mm was prepared in-house for FDM processing. Figure 1 shows the methodology used for present investigation. Table 1 shows the mechanical properties of basic polymeric matrix of PLA and PA6/TiO2.
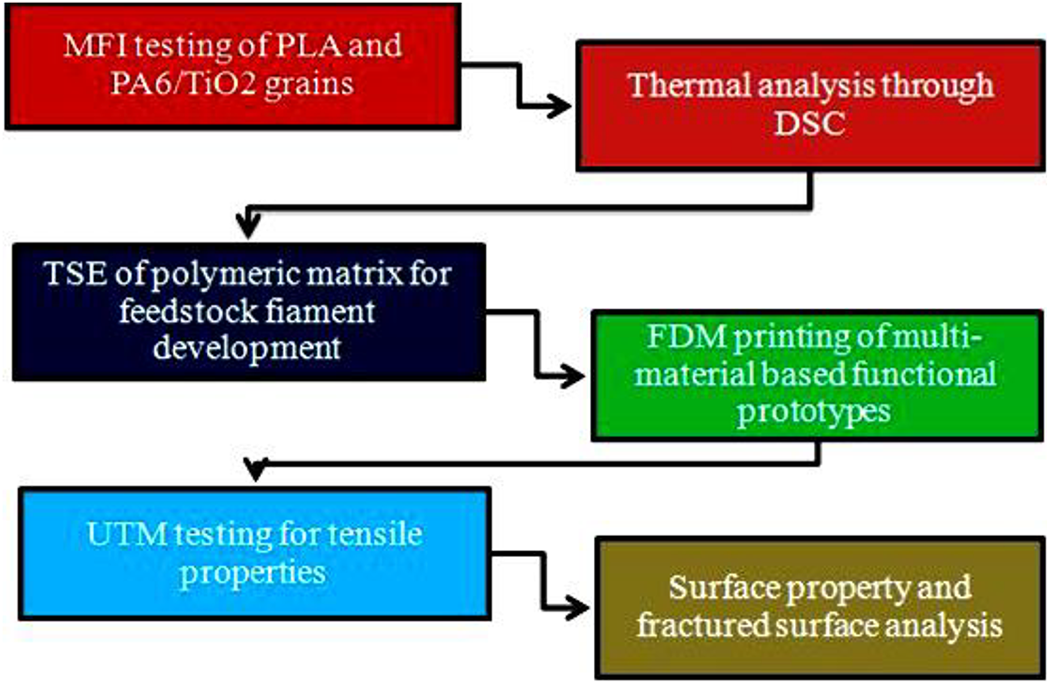
Methodology used for optimization of printing conditions for flexural specimens.
Mechanical property of PLA and PA6/TiO2.
Experimentation
FDM printing of multi-material functional prototypes
The extrusion of polymers was performed using TSE machine (Model: Haake, Germany) using barrel temperature 250°C, load 10 kg and screw rotation of 90 rpm. The developed feedstock filaments were used for FDM printing (FDM model: Accuraft 250D, Divide by Zero) of flexural specimens. The FDM with single nozzle facility was used for current investigation by manually changing the feed stock filament material at required time. An open source slicing software (Slicer 3r) package tool was used for present investigation and 3D printing of functional prototype on FDM platform. For 3D printing of flexural specimen ASTM D790 standard was used. Figure 2a shows the ASTM D790 specification for design of functional prototype and Figure 2b shows the standard testing conditions for flexural functional prototype. 28 Taguchi L9 orthogonal array (OA) methodology was used to optimize the printing conditions. Table 2 shows the design of experiment (DOE) for present investigation as per Taguchi L9 orthogonal array (O.A) and Figure 2c shows the systematic approach for conversion of polymeric grains of PLA and PA6/TiO2 into FDM printed flexural specimens. From literature review of FDM work it has been ascertained that infill speed, infill angle, infill pattern, nozzle diameter, and material selection plays important role in functional prototype performance. Therefore in this study three of the variable input parameters of FDM (Infill speed, infill pattern and layer combination) were chosen while other parameters may have significant contribution toward the mechanical properties of FDM printed prototype. The reason behind selecting only three combination of PLA-PA6/TiO2 (5:5, 6:4 and 7:3) was based on the MFI as the MFI of PLA was approx 27 g/(10 min) and forPA6/TiO2 was approx (56g/(10 min) due to which the PA6/TiO2 matrix held low thickness on solidification in comparison to PLA for the same layer height through nozzle. Therefore for optimum thickness of functional prototype less number of layers was selected for PA6/TiO2 in single multi-material prototype.
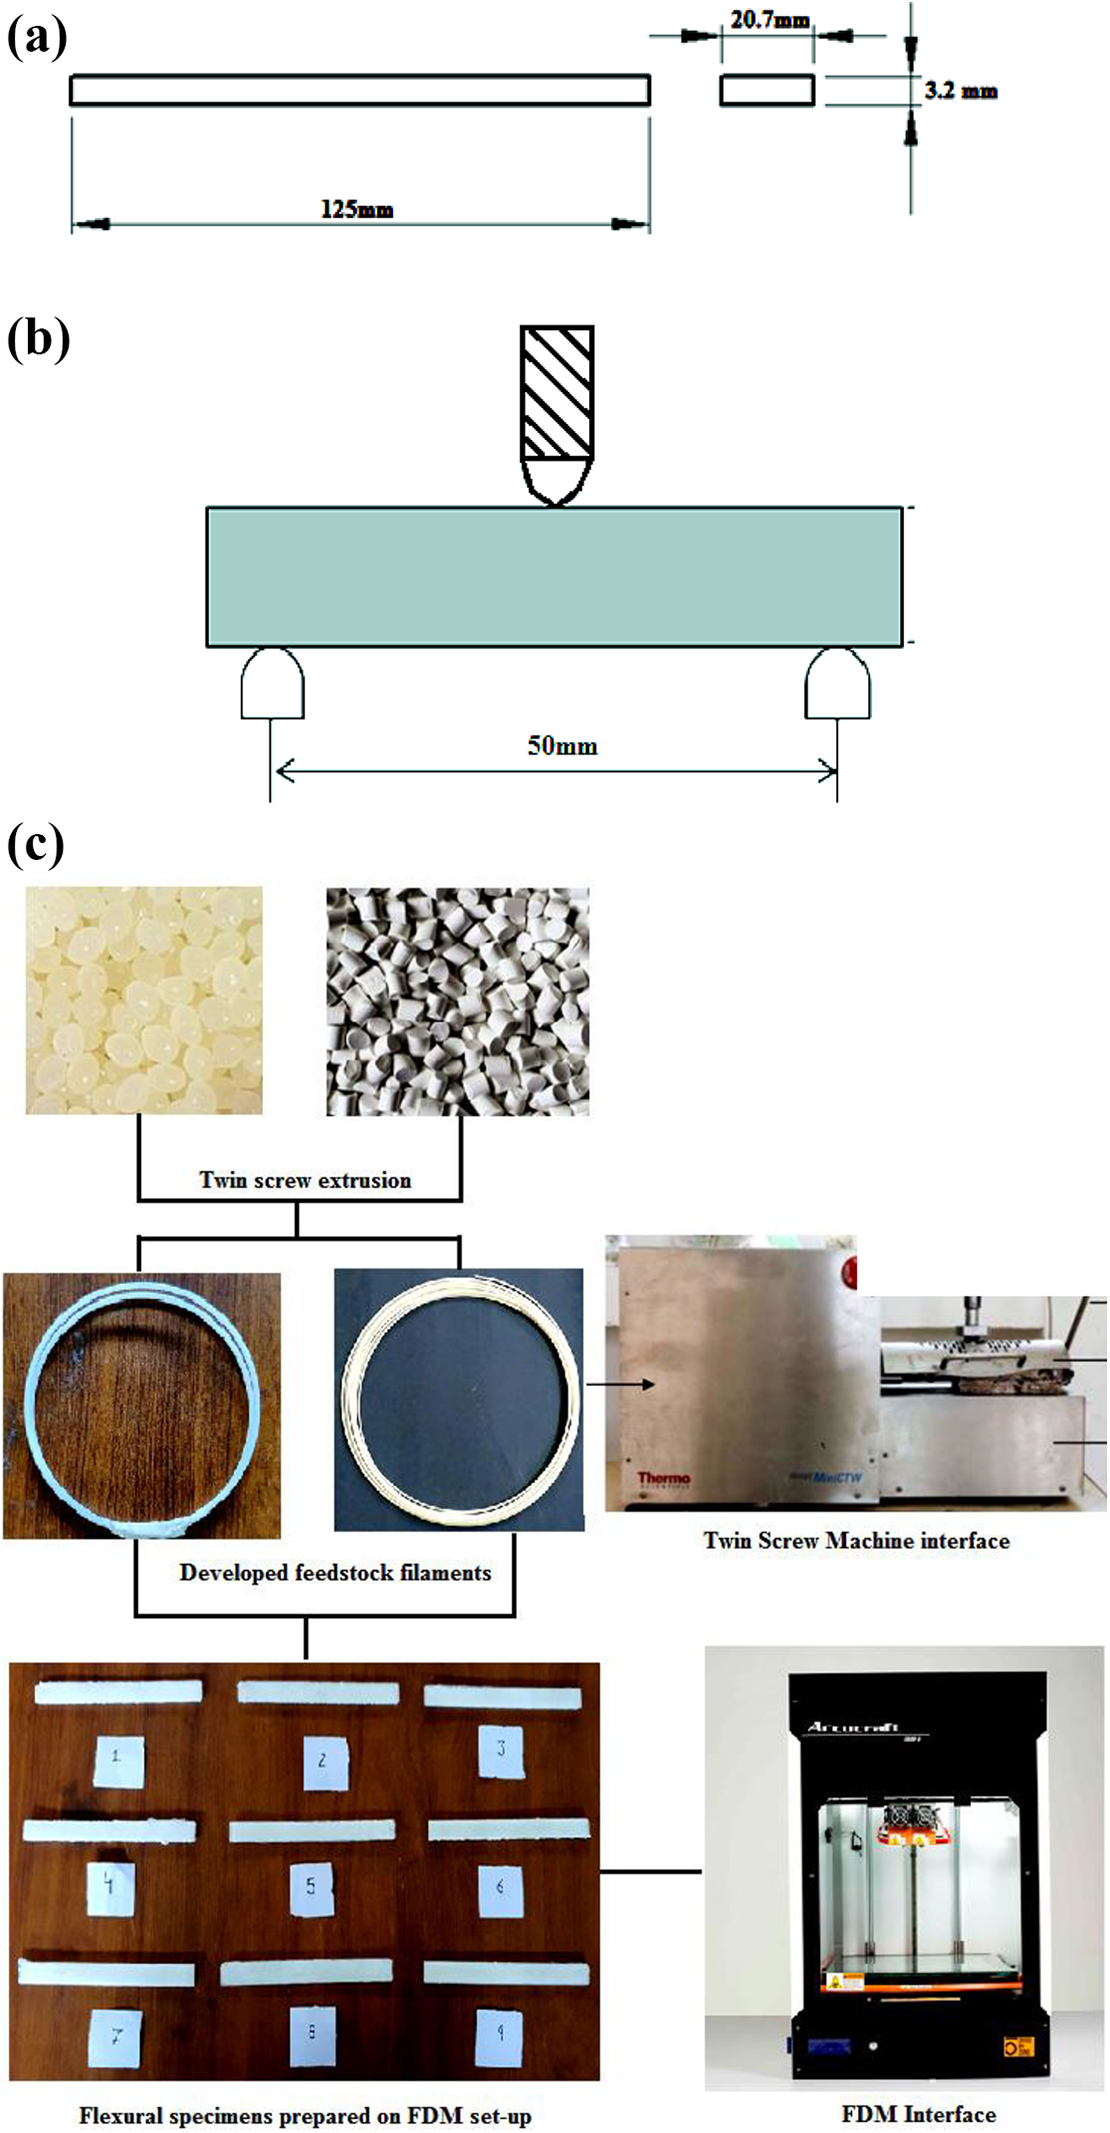
(a) Flexural functional prototype design as per ASTM D790 standard, (b) standard testing condition and (c) systematic approach for development of flexural specimen.
DOE with layer combination representation.
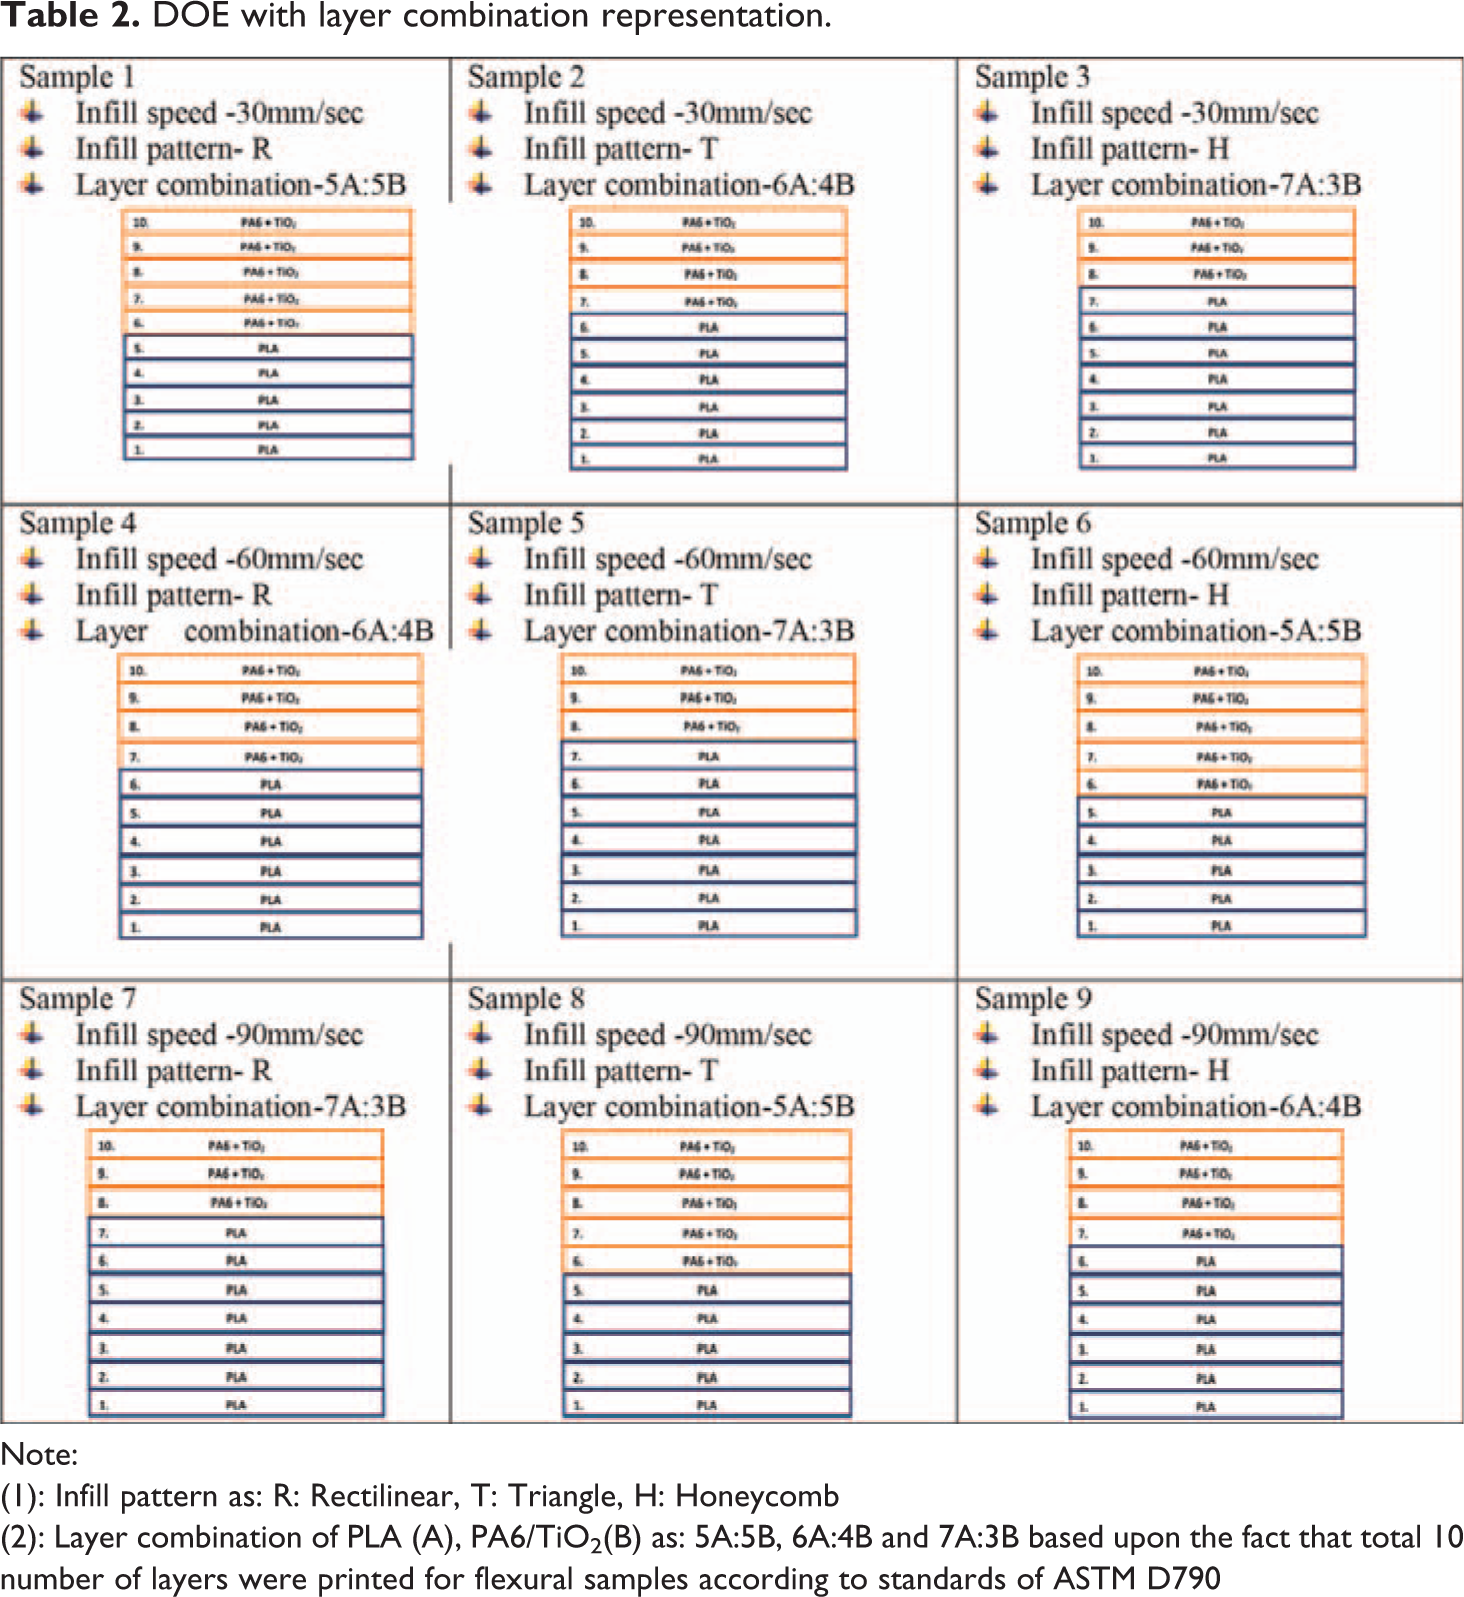
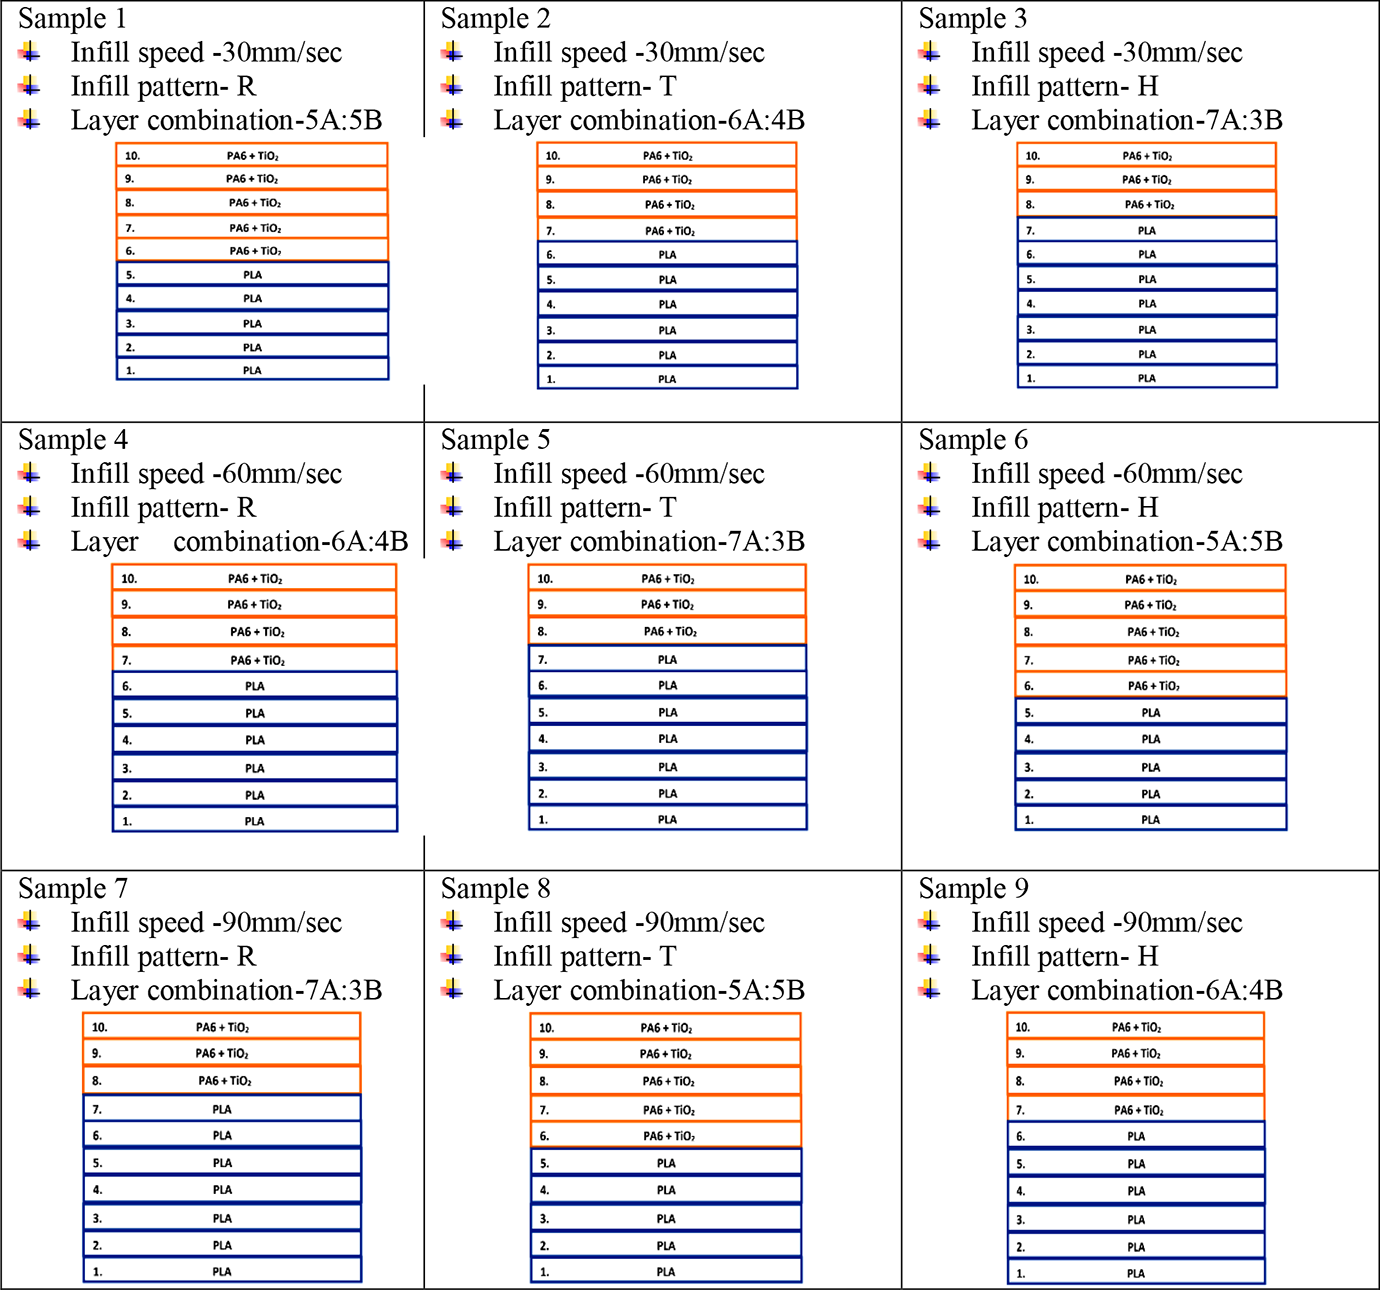
Note:
(1): Infill pattern as: R: Rectilinear, T: Triangle, H: Honeycomb
(2): Layer combination of PLA (A), PA6/TiO2(B) as: 5A:5B, 6A:4B and 7A:3B based upon the fact that total 10 number of layers were printed for flexural samples according to standards of ASTM D790
UTM testing
The developed flexural functional prototypes were subjected to UTM testing according to ASTM D790 standard (see Figure 2b). The UTM machine (Make: Shanta engineering limited, Pune, India) for flexural testing was of 5000 N capacity and the samples were tested at uniform speed of testing 30mm/min. Figure 3a and 3b respectively show the UTM setup used for flexural testing and destructed samples after flexural testing.
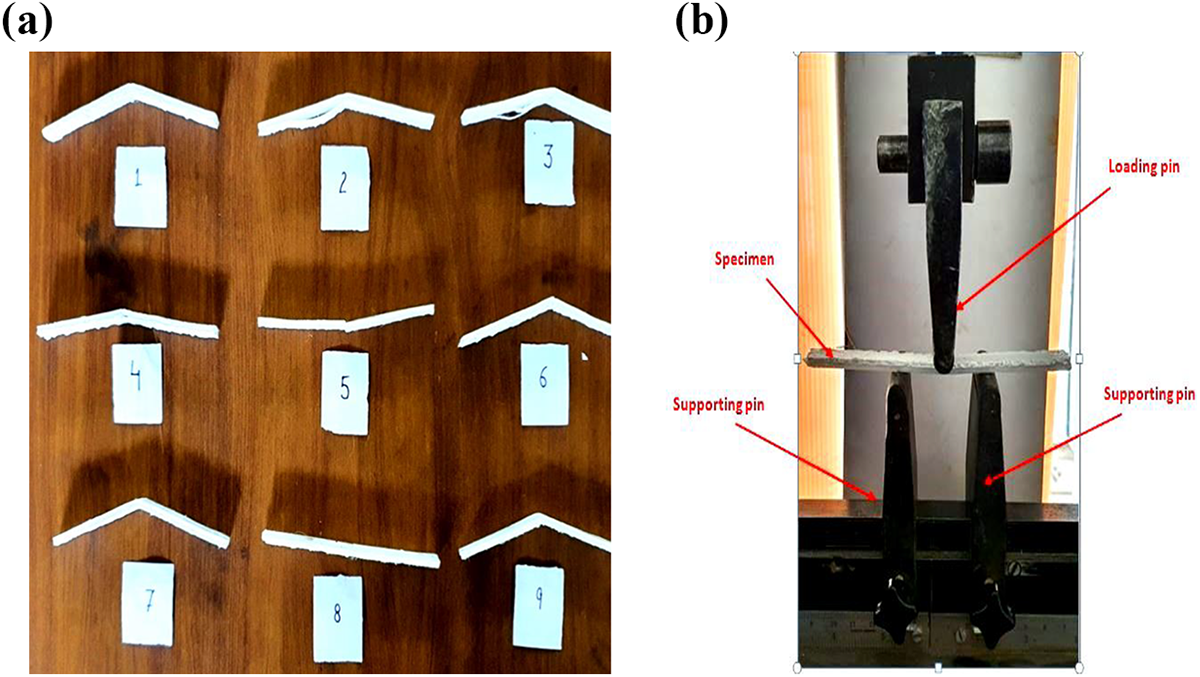
Flexural tested 3D printed functional prototype and (b) flexural testing set up.
Wear property testing
To compare the wear properties of selected composite matrix of PLA and PA6/TiO2 wear testing was performed using wear pins prepared on moulding machine. The pins were prepared of equal size ϕ80 mm. After developments of polymeric pins the pins were loaded on wear testing setup specifically known as Pin on disc (Make: Ducom, Hyderabad, India). The wear testing conditions were selected as weight: 0.5 kg, rotation speed: 71 rpm and time for testing: 2 min. Figure 4 shows the pin on disc setup. For wear testing total six pins (three of PLA (100 wt %) and three of PA6/TiO2 (70/30 wt %)) were tested and average value for wear and frictional force was observed.
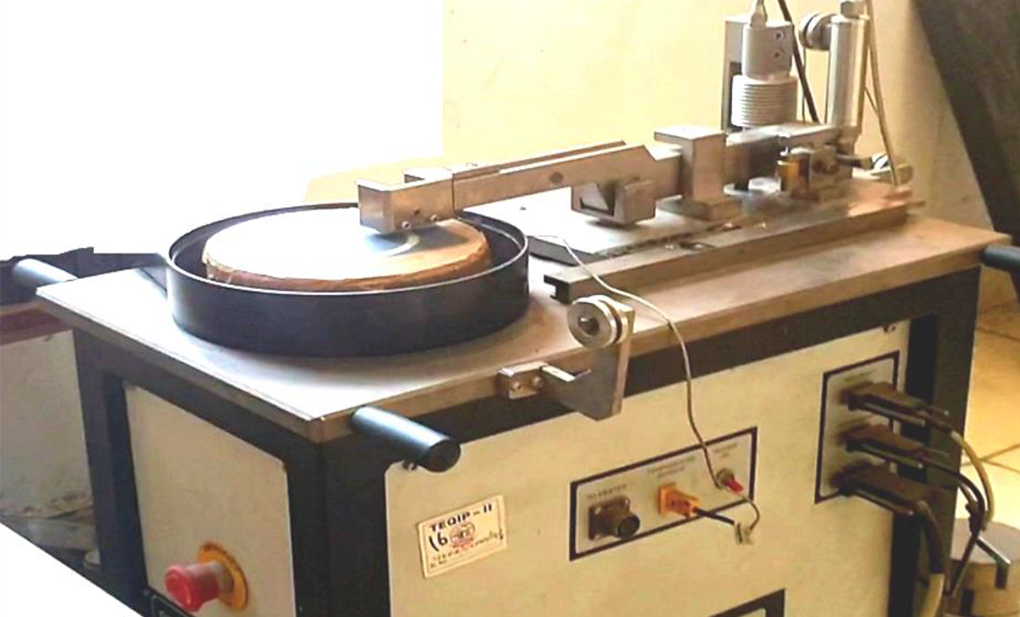
Pin on disc setup.
Morphological testing
For morphological analysis the flexural tested samples were analyzed for morphological properties such as porosity and photo-micrographic analysis of fractured surface. For porosity testing metallurgical image analysis software (MIAS) package was used and photomicrographs were taken at ×100 using ASTM B276 standard of testing. For fractured surface analysis Tool maker’s microscope was used and images were taken at ×30. It should be noted that the morphological properties were observed at fractured surface of tested functional prototype.
Result and discussions
UTM testing results
The flexural specimens of PLA-PA6-TiO2 have shown compatibility for FDM printing as the flexural specimens of different layer combination of functional prototypes were successfully 3D printed. The 3D printed samples were tested for flexural properties such as peak strength and break strength. Table 3 shows the flexural testing results (based upon Table 2). Three samples for each experiment were fabricated using FDM printer with provided DOE (as per Table 2). The average value for each experiment trail was calculated and was quoted in Table 3. The standard deviation for each experiment was also calculated and was given with the average value of flexural properties (see Table 3). The maximum flexural strength at peak (FSP) of 95.91 MPa was observed for sample no. 8 which was prepared with Infill speed: 90mm/s, infill pattern: triangular and layer combination of 5A:5B (A: PLA, B: PA6/TiO2) FDM printing conditions. To optimize the printing conditions of FDM, analysis of variance (ANOVA) has been used. Figure 5 shows the stress vs. strain diagram for flexural samples. As observed from Table 3 relatively better mechanical properties were noticed for sample at S.No. 8 and poor for sample at S.No. 2. Also the area under stress-strain curve (Figure 5) was more for sample at S.No. 8, hence it is ascertained that modulus of toughness will be more for this sample, which may be particularly useful for impact resistance in typical scaffolding applications. Further based upon Table 3, signal to noise (SN) ratio was calculated for maximum the better type case and mean effect plots were drawn (Figure 6). As observed from Figure 6; infill speed; 90mm/s, infill pattern: rectilinear and layer combination of 5A:5B was the optimum FDM processing conditions. It has been observed that the sample 8 which has shown maximum flexural strength was printed with triangular pattern but the optimized condition has recommended rectilinear pattern. To ascertain the reason ANOVA analysis was conducted for PL (Table 4), from which it was observed that layer combination has played maximum role. It was observed that the maximum percentage (%) contribution (76.31%) for flexural property was given by layer combination and second largest contribution for flexural property was given by infill speed (22.93% contribution). Table 5 shows the rank table for SN ratio of PL from which it was observed that layer combination has been given rank 1, infill speed at 2nd rank and infill pattern has been raked at 3 rd position (with just 0.4% contribution). The experimental condition 5, 4 and 9 have shown least strain capacity (approx 0.092, 0.108 and 0.138 respectively) in which it was observed that the sample no. 4 and 9 held large porosity value which resulted into poor strain capacity and mechanical properties whereas in case of sample 5 the composite held 7A:3B (PLA: PA6/TiO2) composition in which large PLA presence has made composition brittle due to which the strain capacity got reduced.
Flexural results of PLA-PA6-TiO2 (as per Table 2).
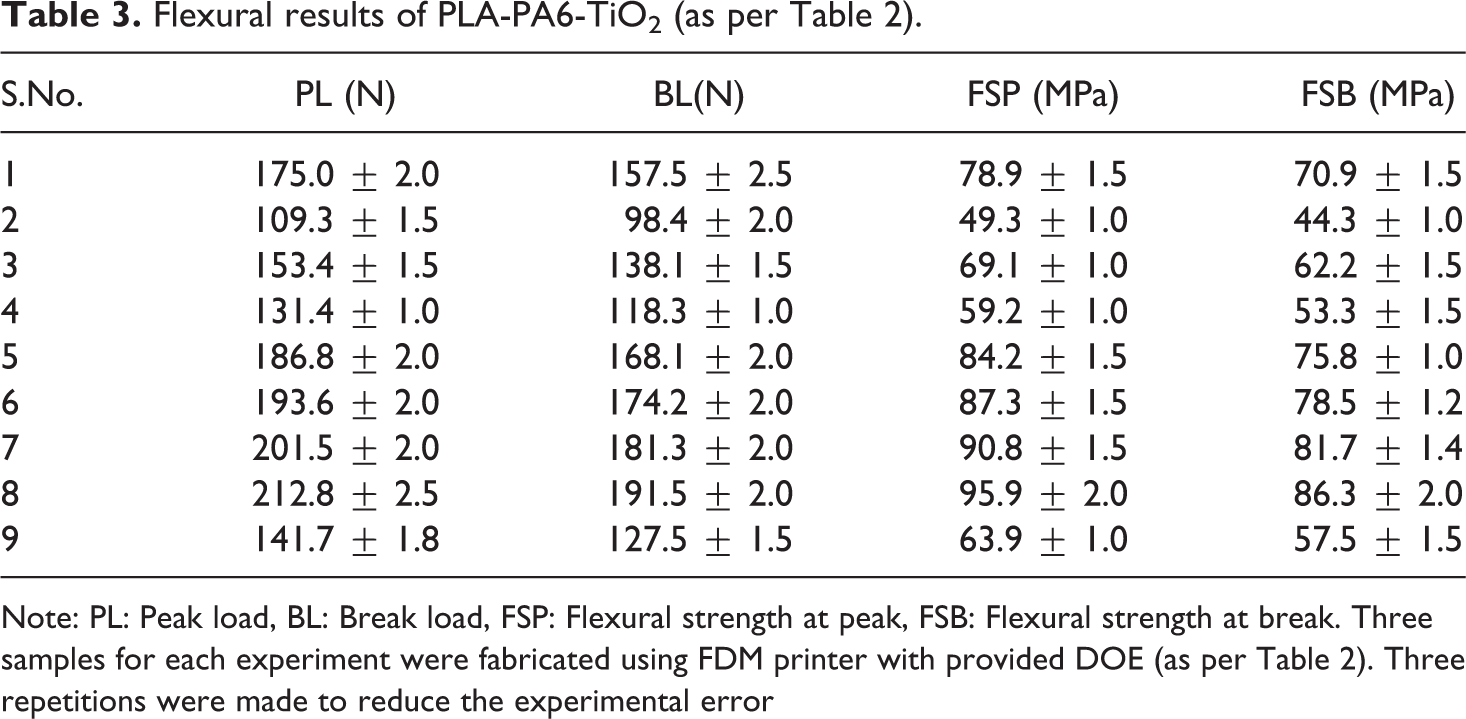
Note: PL: Peak load, BL: Break load, FSP: Flexural strength at peak, FSB: Flexural strength at break. Three samples for each experiment were fabricated using FDM printer with provided DOE (as per Table 2). Three repetitions were made to reduce the experimental error
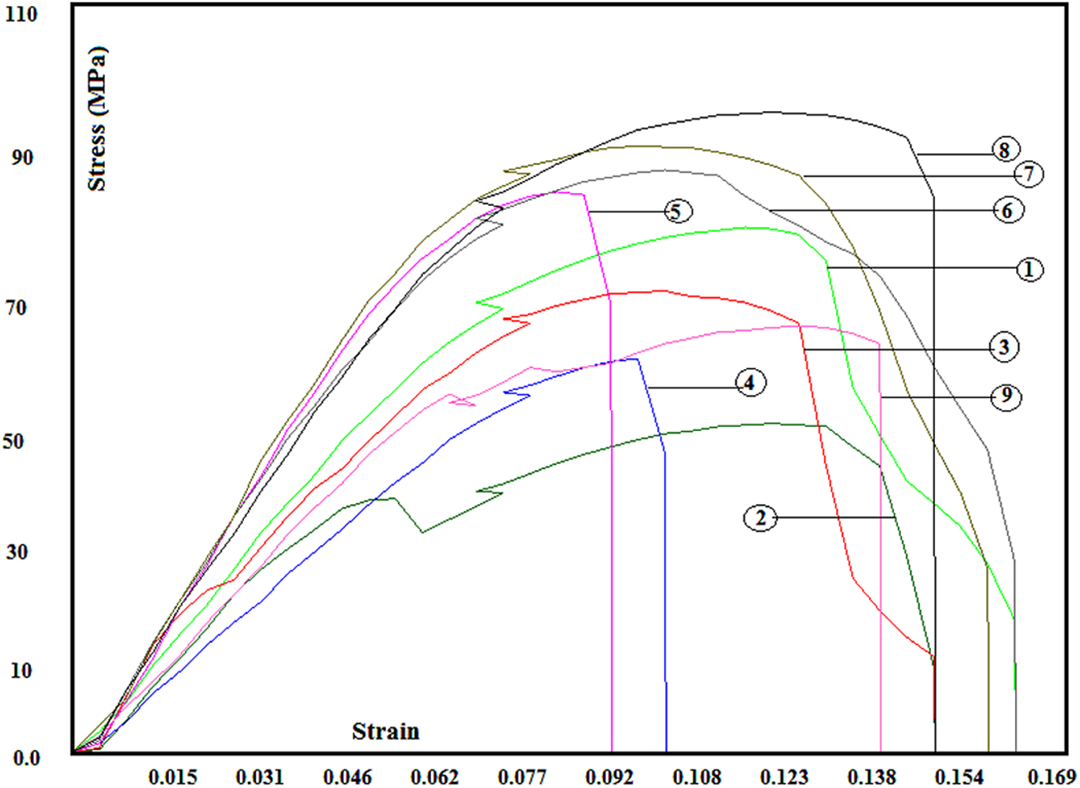
Stress vs. strain diagram for flexural tested specimen (as per Table 1).
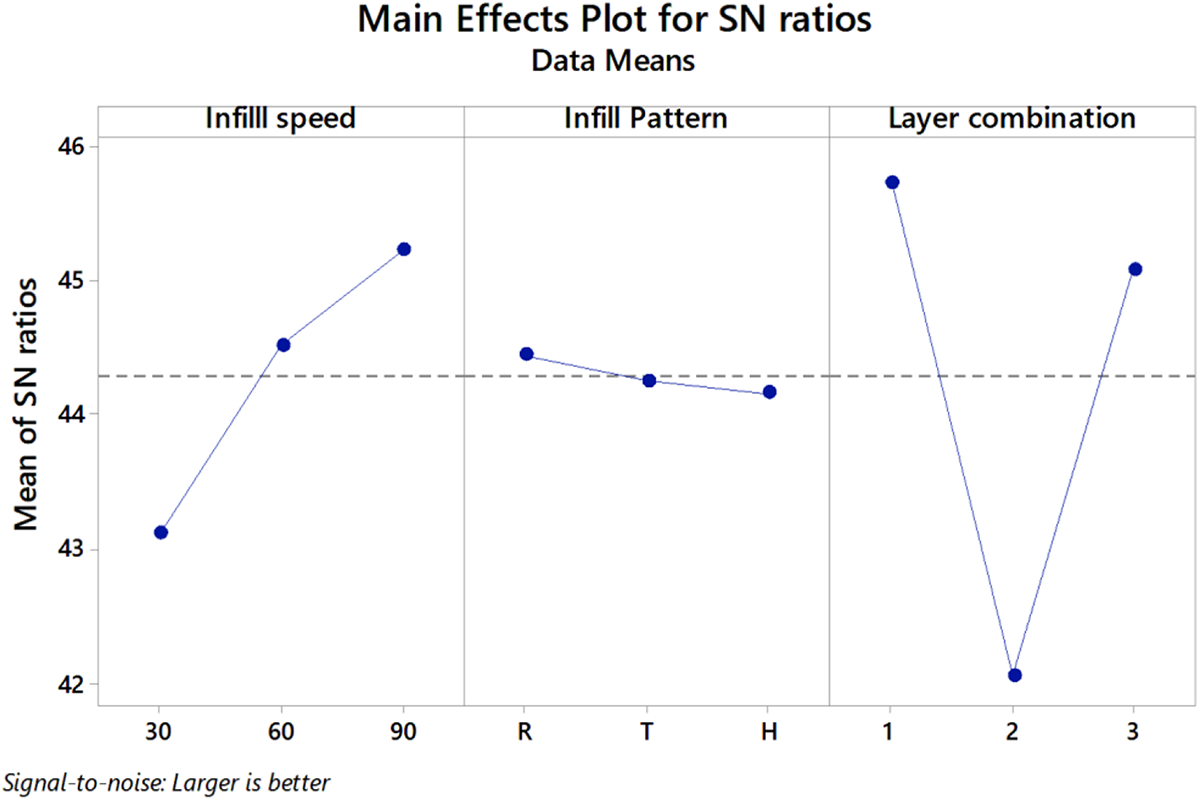
Main effect plot for SN ratio of peak load for flexural specimen.
ANOVA results for SN ratios.
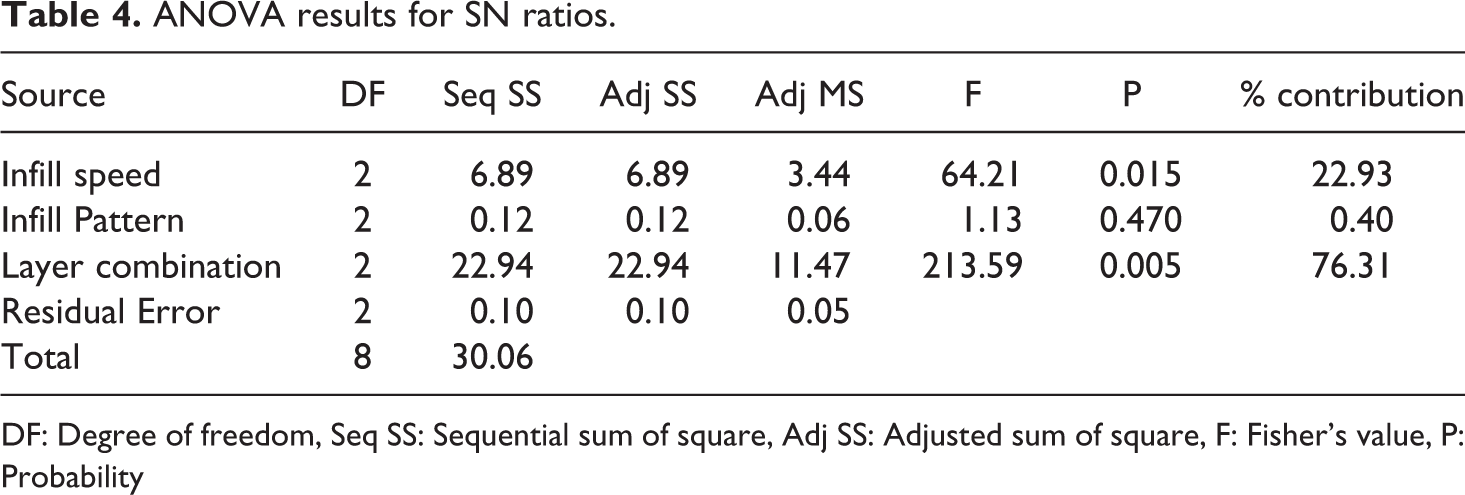
DF: Degree of freedom, Seq SS: Sequential sum of square, Adj SS: Adjusted sum of square, F: Fisher’s value, P: Probability
Rank table for SN ratio of peak load.
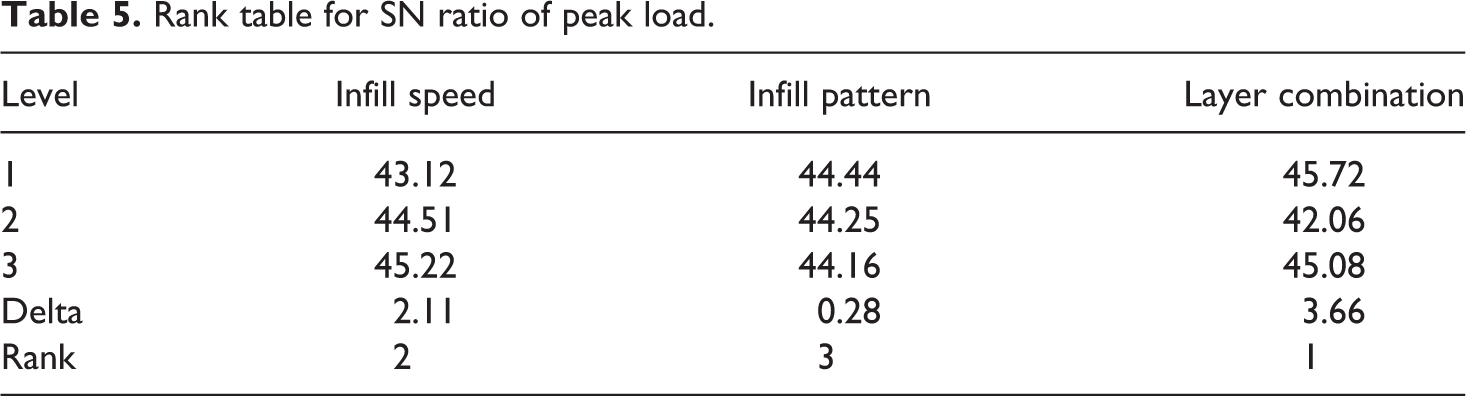
Further the rank table values have been used for optimization of peak load value to know the optimized printing condition.


w = SN mean of PL = 44.28, lA = max infill speed from Table 5 = 45.22, lB = max infill pattern from Table 5 = 44.44, lC = layer combination value from Table 5 = 45.72
Putting all values in equation (1)


Thus it can be observed that the optimized value (219.8 N) for the peak load was very near to the value of peak load for sample no. 8. Therefore the printing conditions for sample no. 8 may be considered as the optimized condition for flexural specimens of multi-material component of PLA-PA6/TiO2.
Wear testing results
From wear testing it has been observed that PLA material has shown highest wear rate (1092 µm) in compare to PA6/TiO2 (823 µm) while the coefficient of friction was approximate equal for both of the sample. This may be due to the reason that PA6 has higher bonding strength than PLA which resulted into low wear rate of PA6-TiO2 composite sample. Figure 7a shows the wear rate graph for PLA and PA6/TiO2 pin from which it was observed that wear graph of PLA was large and for PA6/TiO2 the wear graph has moved upto 823 µm. Figure 7b shows the graph of coefficient of friction from which it may be observed that the coefficient of friction for both sample was 0.7 N. Figure 7c which shows the wear tracks of PLA and Figure 7d for PA6/TiO2 from which it may be observed that the wear track impression was more for PLA which gave evidence of higher wear of PLA. Wear testing was performed on circular pins of PLA-PA6/TiO2 based composite prepared on moulding machine. From wear testing it has been observed that PLA held high wear rate in comparison to PA6/TiO2 thus in situations where wear rate has high significance then there will be top layering of PA6/TiO2. But in most of the cases of biomedical scaffold application the PA6/TiO2 material matrix will always be inside as PA6/TiO2 needs to be in touch with skin as it possesses anti bacterial properties.
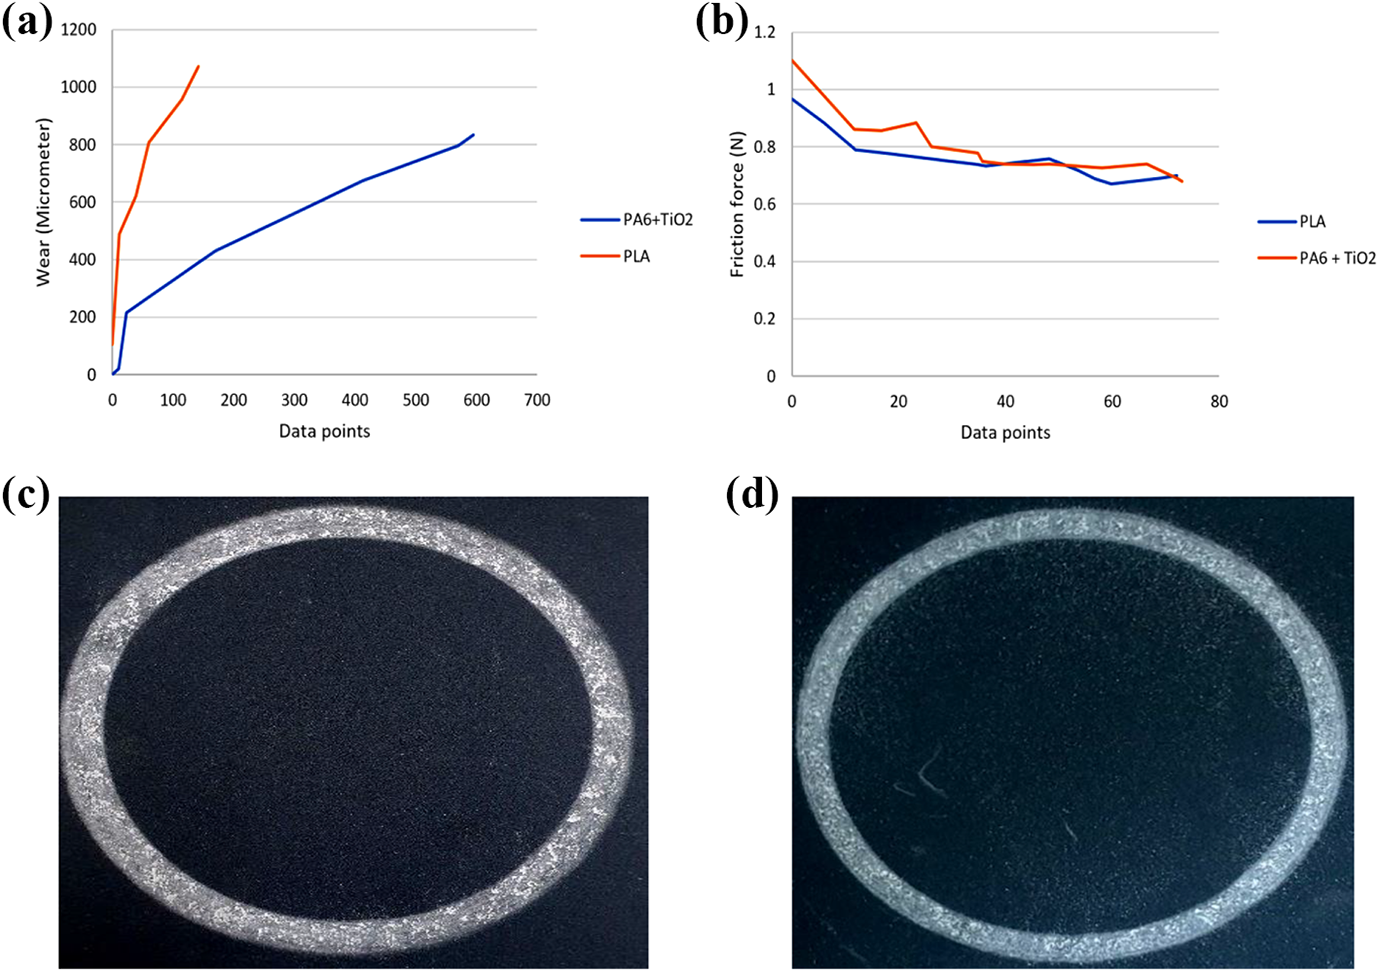
(a). Wear rate graph, (b) Coefficient of friction graph, (c) wear track for PLA pin, (d) wear track for PA6/TiO2.
Morphological property results
Porosity testing results
The photomicrographs of porosity testing have shown clear opposite trends for morphological and mechanical properties of multi-material based specimens (Figure 8). It was observed from the porosity results that the sample no. 8 which held best flexural property held least relative porosity value (11.2%) whereas the sample no. 2 held large porosity value. Hence from porosity analysis it was ascertained that the mechanical performance is inversely related to the sample porosity. This may be due to the fact that large porosity holes/ voids inside the 3D printed components resulted into poor bonding of intra and inter layer semisolid material layer which was ultimately incapable of producing better mechanical performance. The results are in-line with the previous studies.29–33 The high porosity values were observed for sample no 2, 4 and 9 (23.58, 21.56 and 19.2% respectively) which existed for 6:4 (PLA: PA6/TiO2) layer combination. The trends were in-line with the flexural result as for sample 2, 4 and 9 the flexural peak strength was less (49.26, 59.22 and 63.87 MPa respectively). Thus it was clear that there was negative relation between mechanical and morphological properties such as for the samples with poor mechanical properties there was high porosity.
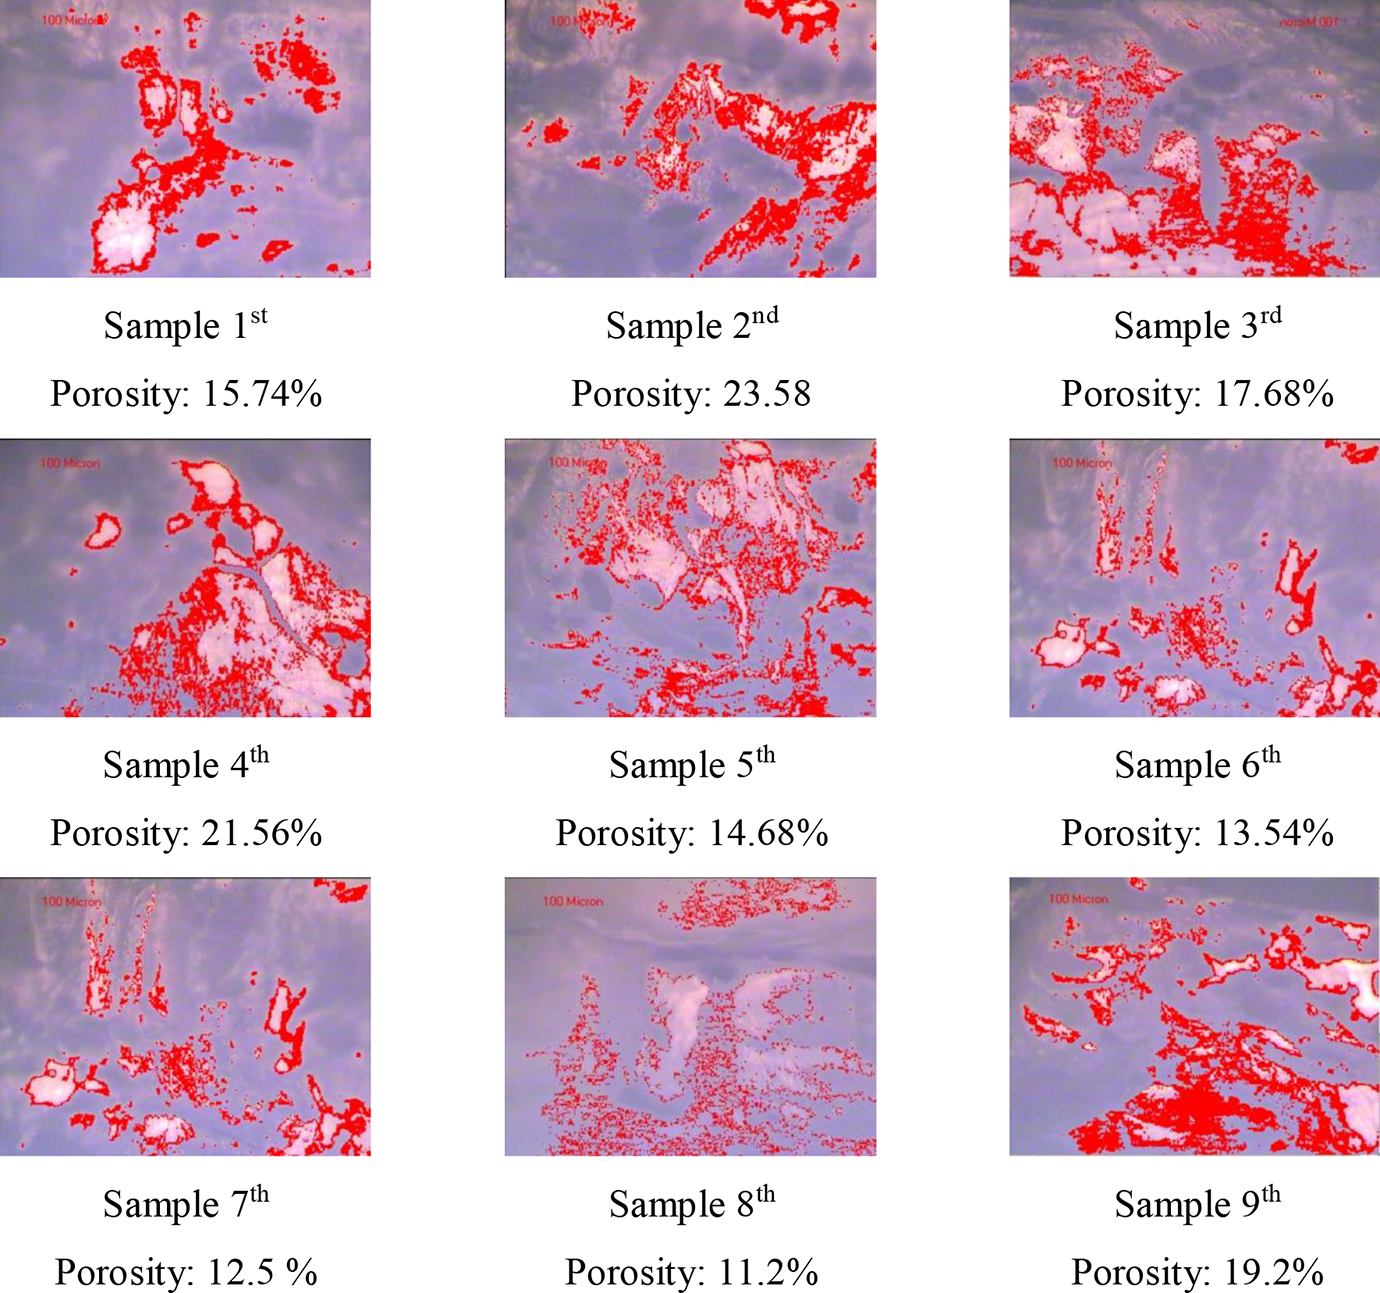
Porosity testing graphs for flexural specimens (as per Table 2).
Photo-micrographic investigation of fractured surface
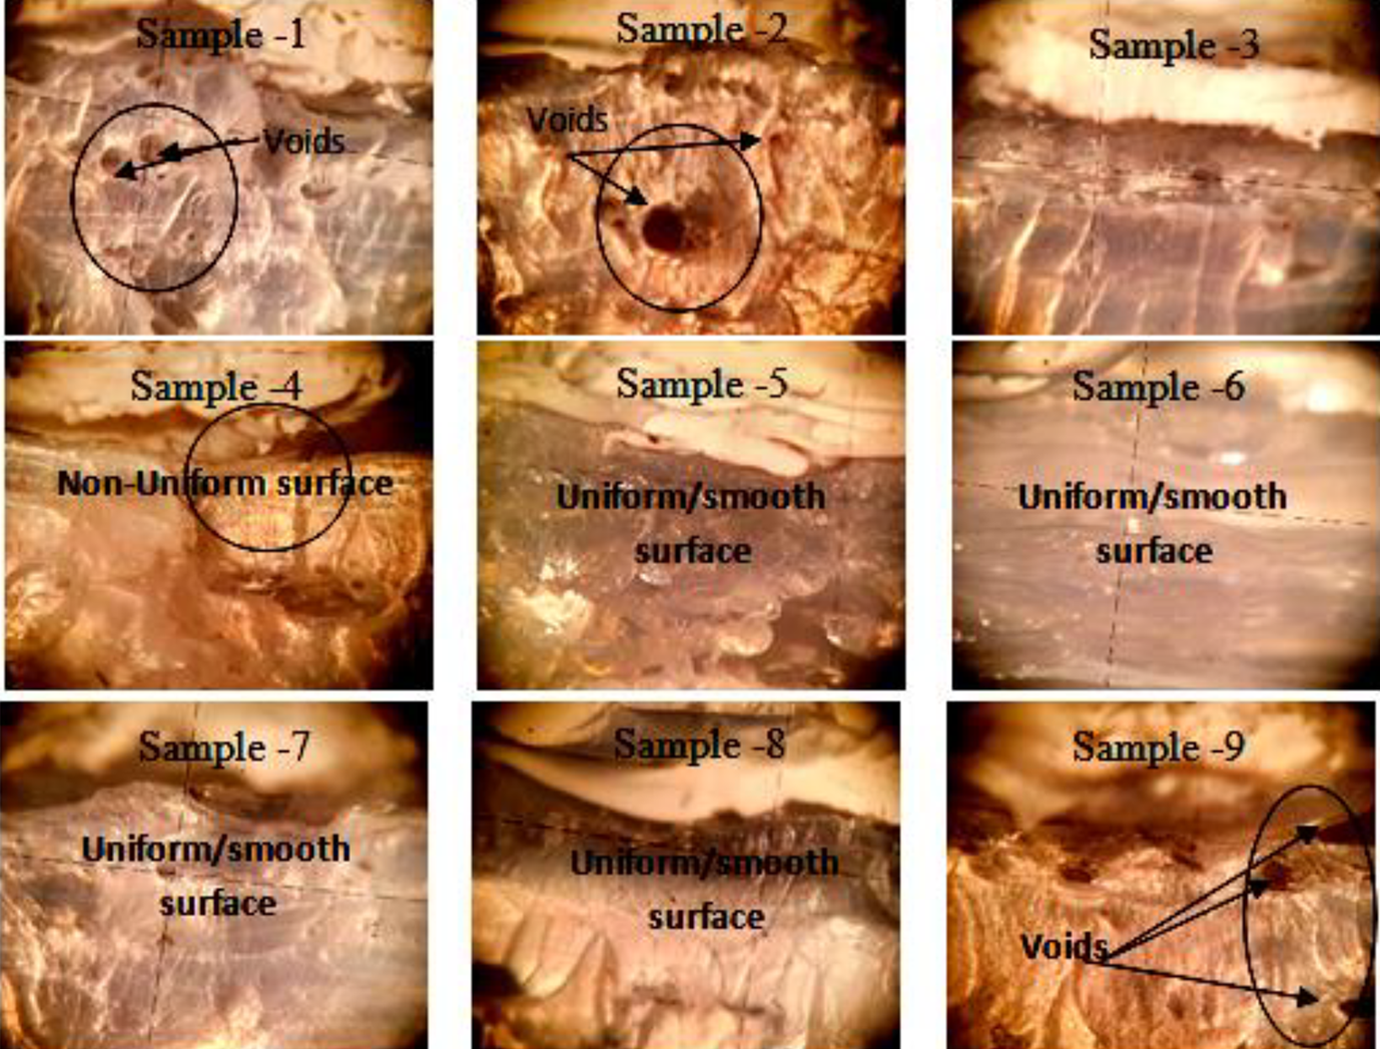
From photo-micrographic image of Tool maker’s microscope it was observed that the sample with better mechanical performance had less number of void/porosity holes on fractured surface. Figure 9 shows the photomicrographs at fractured surface of specimen at ×30 magnification. It was observed that the sample no. 8 held uniform/smooth surface which was indication of better mechanical strength. The results are in line with previous studies.34–36 The photo-micrographic images taken by Tool maker’s microscope for sample no. 8 and sample no. 2 was processed using 3D rendering software package tool (Figure 10) to analyze the Ra profile of best (sample no. 8) and worst sample as per mechanical performance (sample no. 2). The cut off length of 0.05 mm was selected for 3D rendering of images. From Ra profile it was observed for sample no. 8 the Ra value was 306.4 nm which is less than the Ra value of sample no. 2 (611.53 nm), hence counter verifies that the large porosity holes present inside the component resulted into large surface roughness of sample no. 2 and thus ultimately poor mechanical properties.
Tool maker’s microscopic photo-micrograhs (as per Table 2) 3D rendered image Surface roughness profile of fractured sample.
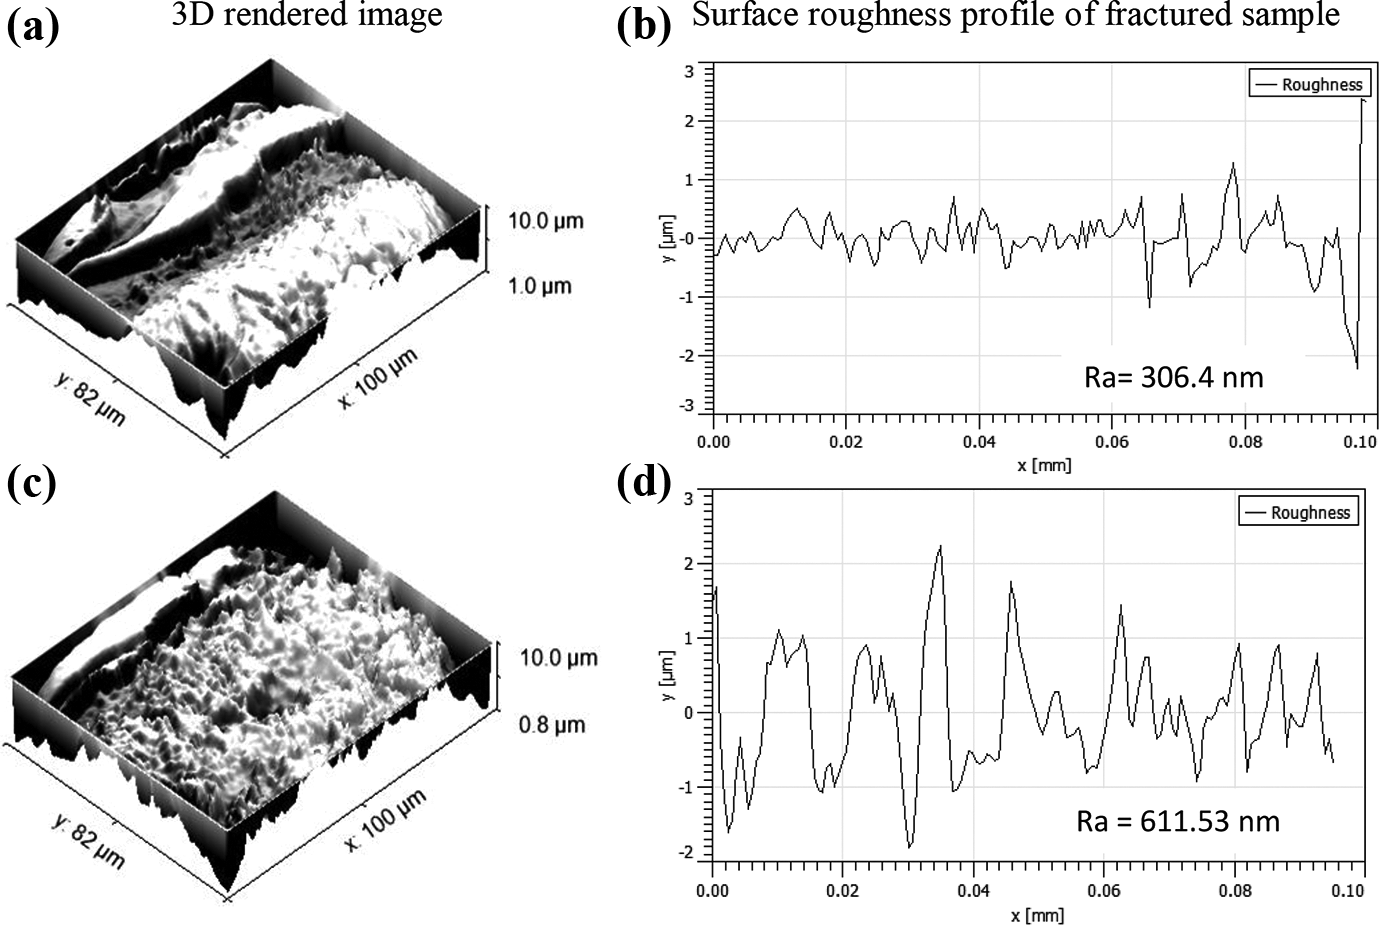
(a) 3D rendered image of sample no. 8, (b) Ra profile for sample no. 8, (c) 3D rendered image of sample no. 2, (d) Ra profile for sample no. 2.
SEM and EDS analysis results
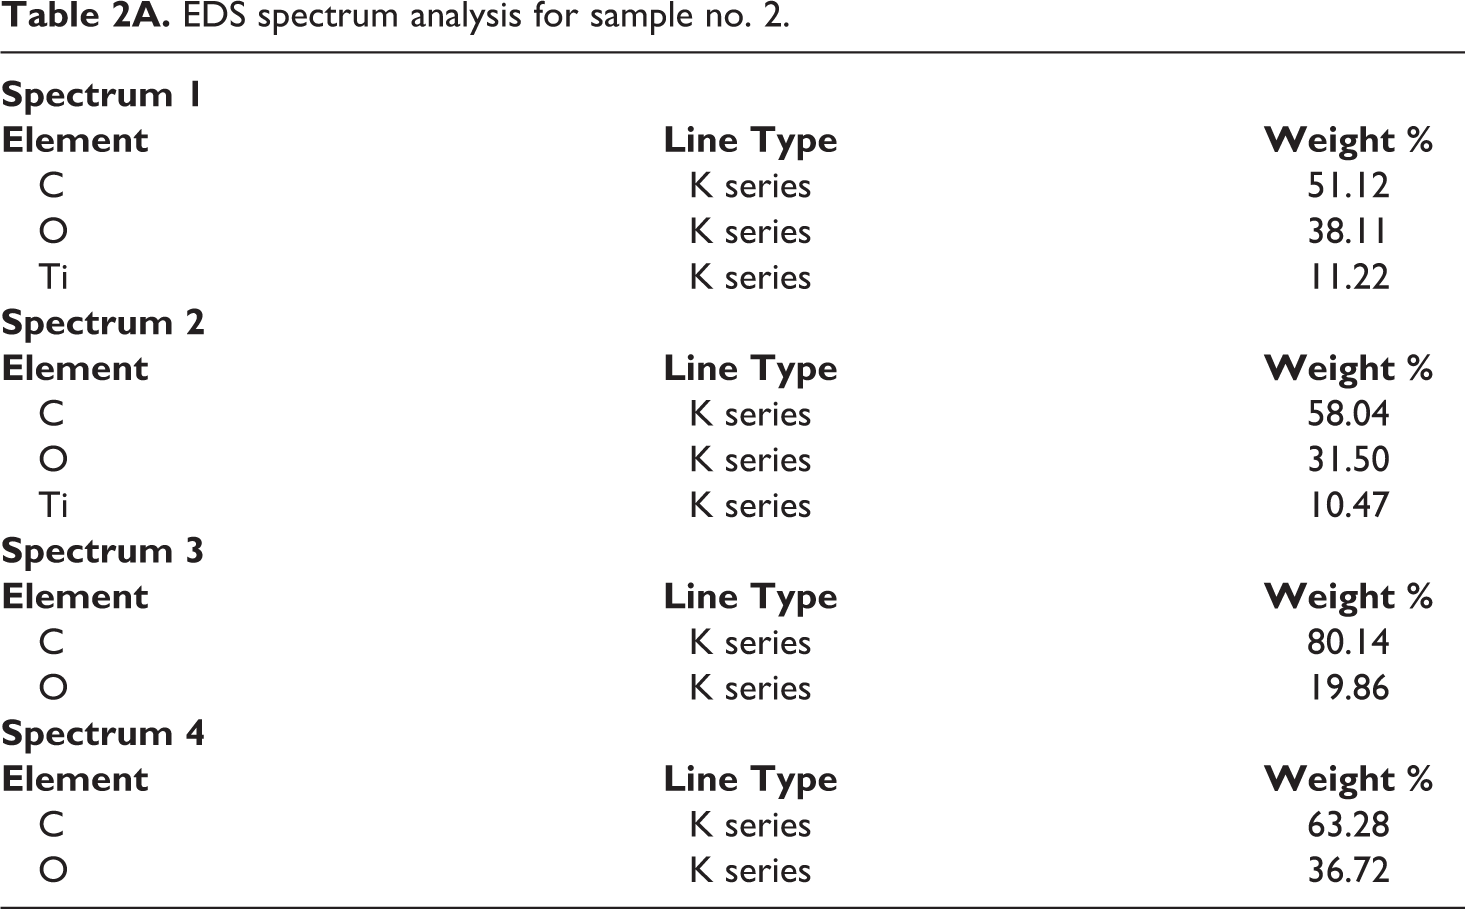
The Figure 11a to d shows the results for SEM analysis from which it was observed that the material settled while solidification in different layers have internal cracks which means that the PLA and PA6/TiO2 were not fully compatible with each other. The same can also be seen from their flexural testing results (Figure 9). In flexural tested samples the images have shown extirpation of layers or pulling out of layers of PLA and PA6/TiO2. From the SEM images of sample no. 8 (Figure 11a and b) and sample no. 2 (Figure 11c and d) it was clear that more internal cracks were present for sample 2 which resulted into poor joining of material layers and ultimately poor flexural strength of 3D printed samples. Figure 12a and 12b shows the EDS results for sample no. 8 and sample no. 2 respectively. From Figure 12a it was observed that maximum TiO2 (12.10%) (See Appendix 1 (Table 1A EDS result for sample no. 8)) was observed in spectrum 1 of selected region which was right side of the spectrum selected as the spectrum moved toward left there was no presence of TiO2 which means toward right side there was only presence of PLA layers. From Figure 12b it was observed that sample no. 2 also held 11–12% of TiO2 ((See Appendix 1 (Table 2A EDS result for sample no. 2)) in spectrum 1 and 2 thus the proportion of PA6-TiO2 for best and poor samples were almost equal which meant that the internal structure (level of cracks/ voids among the deposited layers) of the samples played vital role in their flexural properties.
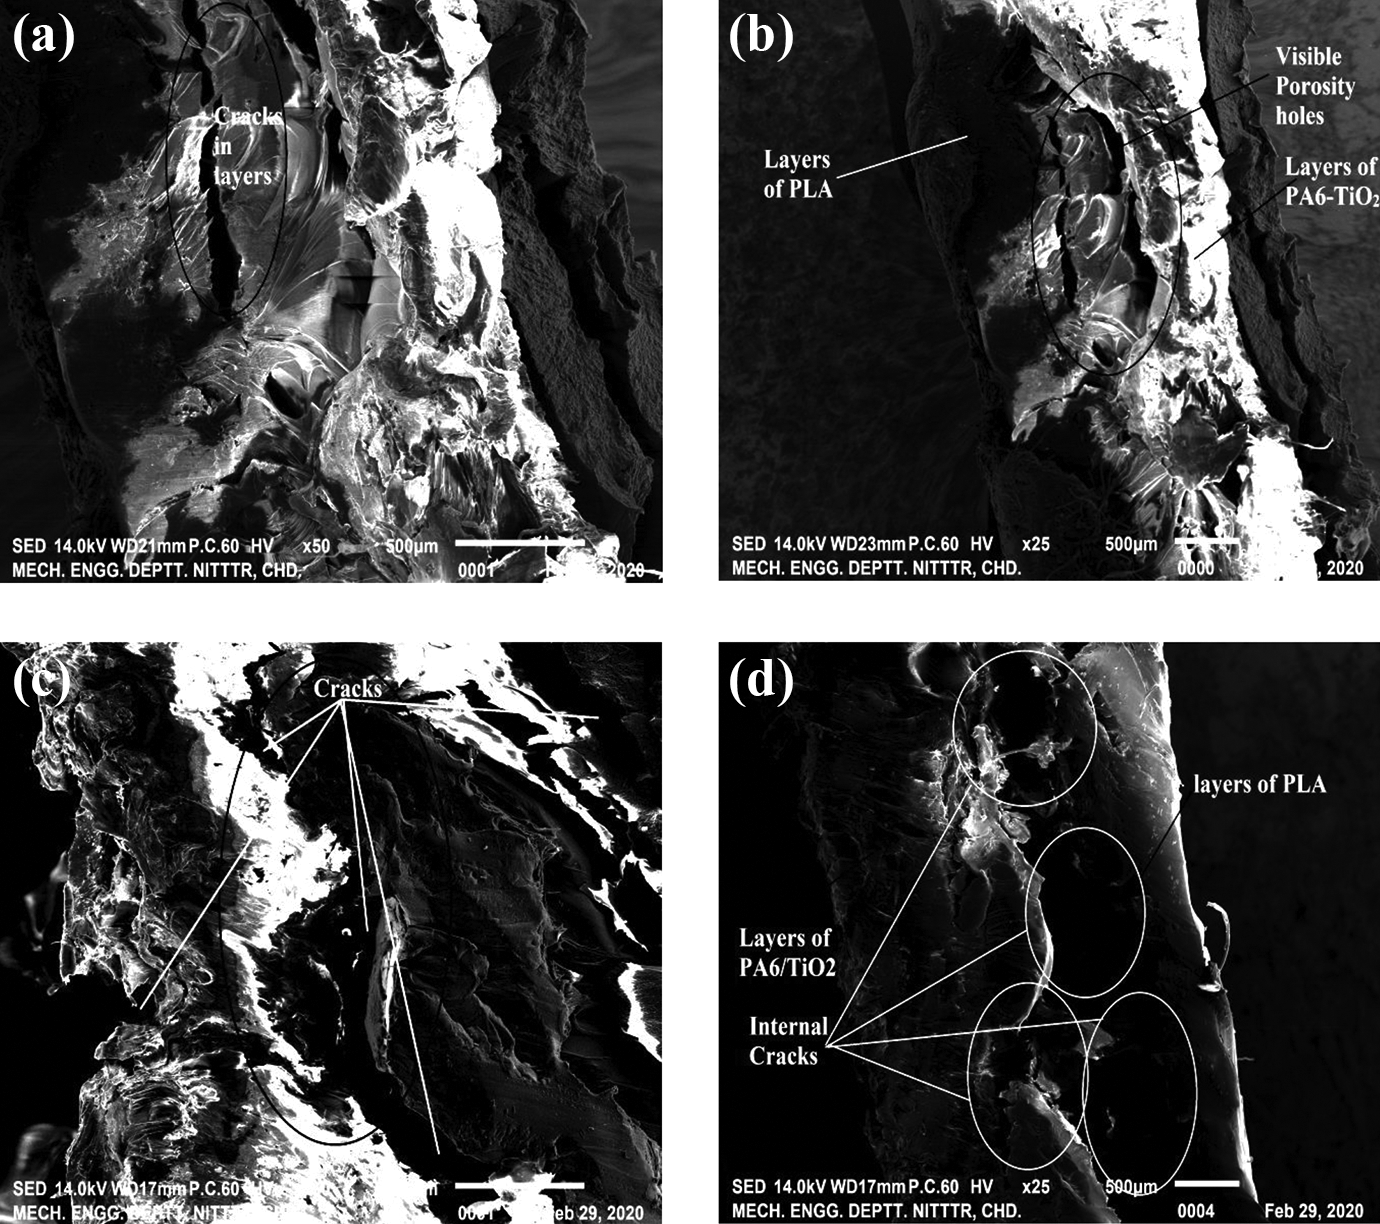
SEM image for (a) sample no. 8 at ×50, (b) sample no. 8 at ×25, (c) sample no. 2 at 50 and (d) sample no. 2 at ×25.
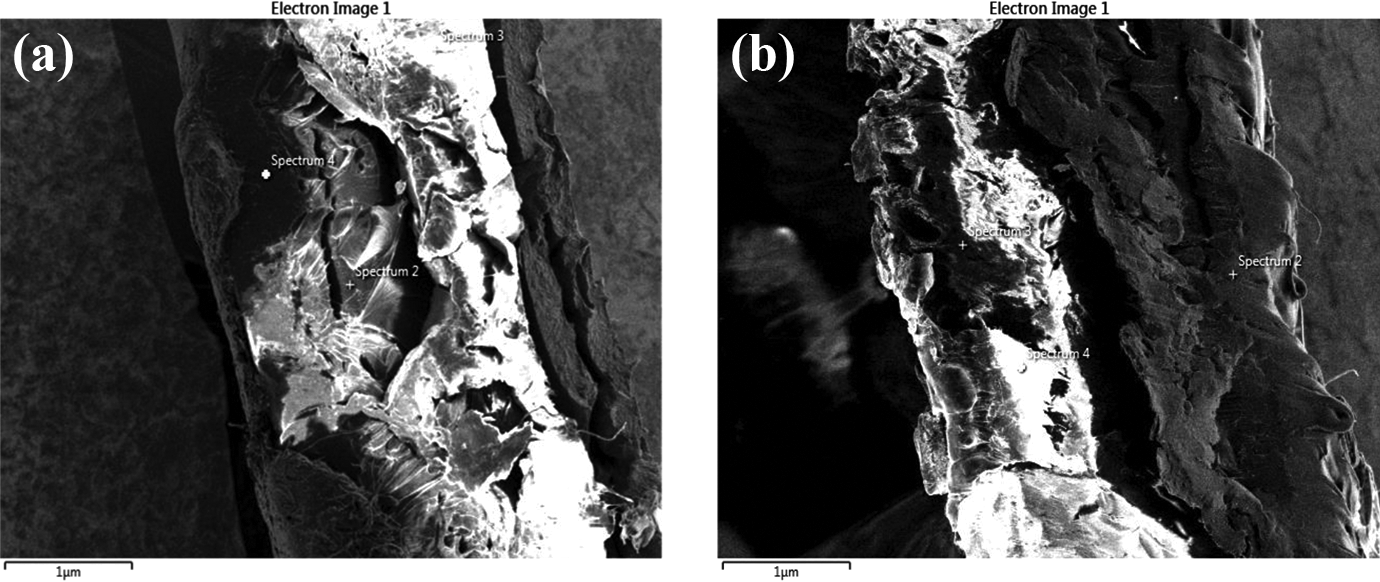
EDS image spectrum selection over the entire region of (a) sample no. 8 and (b) sample no.2.
Conclusions
The present investigation deals with primary objective of (i) development of flexural functional prototype of PLA-PA6/TiO2 composite using in-house developed feedstock filament and secondary objective of (ii) optimization of FDM processing parameters and exploration of flexural, wear and morphological properties of multi-material composite matrix through UTM, Wear testing, porosity testing, photo-micrographic image analysis. Following are the outcomes from the present study:
From the investigation it can be concluded that the selected multi-material composite design is feasible and the functional prototype were successfully prepared.
From process optimization of FDM it may be concluded that infill speed of 90mm/s, infill pattern of rectilinear and layer combination of 5A:5B are the optimized printing conditions for flexural components.
The wear testing has made it clear that the material PA6/TiO2 held less material wear in comparison to PLA; hence PA6/TiO2 based specimens may be used for high wear rate applications.
Morphological testing (porosity, fractured surface analysis and 3D rendering) has clearly supported the observed trends of flexural properties and have shown that the samples with higher porosity/ voids resulted into higher Ra and ultimately lower flexural properties.
From SEM and EDS analysis, it has been ascertained that the internal cracks/ voids present in deposited layers of 3D printed functional prototypes played vital role in flexural strength of specimens.
Future scope
The present work is limited to only three input variable of FDM as the main focus of the study was on investigating the flexural properties of new multi-material composite design of PLA-PA6/TiO2. Therefore further studies may be taken to explore the effect of different input variable on PLA-PA6/TiO2 based multi-material composite design, where several input parameters of FDM may also be taken at once by choosing different DOE and analysis approach. Multi-nozzle FDM may be used further to study the effect of delay in case of manual change of feedstock and automatic change of feedstock on properties of composite.
Footnotes
Acknowledgements
The authors are highly thankful to Professor Fernando Fraternali (University of Salerno, Italy), Thapar Institute of Engineering and Technology (TIET), National Institute of Technical Teacher Training and Research (NITTTR) and manufacturing research lab of Guru Nanak Dev Engineering College for their continuous technical support.
Funding
The author(s) received no financial support for the research, authorship, and/or publication of this article.
Appendix 1
EDS spectrum analysis for sample no. 2.
|
|
||
|
|
|
|
| C | K series | 51.12 |
| O | K series | 38.11 |
| Ti | K series | 11.22 |
|
|
||
|
|
|
|
| C | K series | 58.04 |
| O | K series | 31.50 |
| Ti | K series | 10.47 |
|
|
||
|
|
|
|
| C | K series | 80.14 |
| O | K series | 19.86 |
|
|
||
|
|
|
|
| C | K series | 63.28 |
| O | K series | 36.72 |