
Abstract
In this study, two different types of polytetrafluoroethylene (PTFE) fillers (i.e. fibrillar and particulate PTFE) were utilized to improve the tribological properties of polyoxymethylene (POM). POM/PTFE composites with various filler contents were tested on a commercial block-on-ring tester. To further probe the tribological properties of POM/PTFE composites under severe sliding conditions, a homemade pin-on-disc tester was employed. Results showed that the lowest coefficient of friction and wear rate are obtained from PTFE particle–filled POM composites at 20 wt%, which is attributed to the formation of uniform transfer film at the sliding interface thanks to the well distribution of PTFE particles. The mass wear rate of POM/PTFE fiber composites is lower than that of PTFE particle–containing counterparts due to the better load transfer of high aspect ratio fibers. The tensile properties of POM/PTFE composites deteriorate with the addition of PTFE fillers; however, the impact strength is significantly enhanced for PTFE fiber filled POM composites. Moreover, both the melting and crystallization properties of POM are affected by the morphology of PTFE fillers and filler concentration, as characterized by differential scanning calorimetry analysis.
Keywords
Introduction
There is attractive attention in replacing metal parts with engineering plastics thanks to their weight advantage, good processability, and moldability as well as excellent resistance to corrosive conditions.1–3 The tribological behavior of polymer-based materials is of great importance since a variety of engineering plastics, such as polyoxymethylene (POM),4–6 polyetheretherketone (PEEK),7,8 and polyphenylene sulfide (PPS),9,10 have been ubiquitously utilized in the areas of automotive, machinery, instruments, among others. POM exhibits a typical helical chain structure 11 which is composed of alternating carbon–hydrogen bonds. As a result, POM displays a high degree of regularity in its molecular chain, which endows POM with outstanding solvent resistance and self-lubricating nature.12–14 Investigations on the tribological properties of POM-based composites have been extensively reported. For example, glass fibers, 15 carbon fibers,16,17 and aramid fibers18,19 have been adopted as reinforcement additives to enhance the tribological properties.
Polytetrafluoroethylene (PTFE) is susceptible to slide due to its weak intermolecular interaction. However, pure PTFE cannot be used as pure sliding material due to its intrinsically low mechanical strength. 20 As a result, PTFE has been adopted as an effective filler to enhance the tribological properties of polymers. For example, Chen et al. 21 reported that the coefficient of friction (COF) for polyamide 66/PPS/PTFE 20 vol% is 0.15, which is lower than that of pure PTFE (0.22) under the same sliding conditions. Burris and Sawyer 22 reported that the incorporation of PTFE is favorable for reducing both the COF and wear rate of PEEK. And samples with 50 wt% PTFE demonstrates the lowest COF (0.111) which is less than one-third of the pure PEEK (0.363). Shen et al. 23 reported that a COF of roughly 0.095 was obtained when 12.5 wt% PTFE was added to epoxy resin with a high concentration of silica dioxide, which can be related to formation of PTFE transfer film at the sliding interface. Moreover, Gao et al. 24 found that the addition of PTFE fiber can significantly improve the tribological properties of POM. Gu et al. 25 studied the tribological properties of poly(methyl methacrylate) (PMMA)/PTFE composites and their results showed that the wear mechanism for unfilled PMMA was adhesive wear whereas both fatigue wear and abrasive wear occurred in terms of PMMA/PTFE counterparts. Wang et al. 26 reported that PEEK composites with nano-sized PTFE particles showed superior tribological properties than that of micro-sized PTFE-containing counterparts. Gürgen and coworkers 27 found that the COF of ultrahigh molecular weight polyethylene (UHMWPE) decreased with increasing loading content of PTFE particles; however, the wear rate increased due to the incompatibility between PTFE and UHMWPE. The above studies investigated the influence of PTFE content on the tribological properties of polymer composites. To the best of our knowledge, little research has been performed concerning the influence of PTFE filler shape on the tribological behavior of self-lubricating polymers.
In this present study, two different types of PTFE fillers (i.e. fibrillar and particulate shape) were introduced into POM as functional additives via melt blending. The influence of both filler content and filler shape on the mechanical and tribological properties of POM composites was studied in detail. To investigate the tribological behavior of POM/PTFE composites under different sliding conditions, the sliding blocks were tested on a commercial block-on-ring tester and a homemade pin-on-disc apparatus, respectively.
Experimental
Materials
Pure POM pellets were supplied by Polyplastics Co., Ltd (Japan). The short cut PTFE fiber with a customized average length of 6 mm was obtained from Shandong Senrong New Materials Co., Ltd (China). The PTFE particles were provided by Zhejiang Green New Materials Co., Ltd (China). Images of both PTFE fibers and particles are shown in Figure 1. As can be seen from Figure 1(a), the diameter of PTFE fibers is about 5 μm; therefore, the aspect ratio of PTFE fibers is at least 1200. The average size of PTFE particles is about 5 µm (as displayed in Figure 1(b)). All materials were used as received.
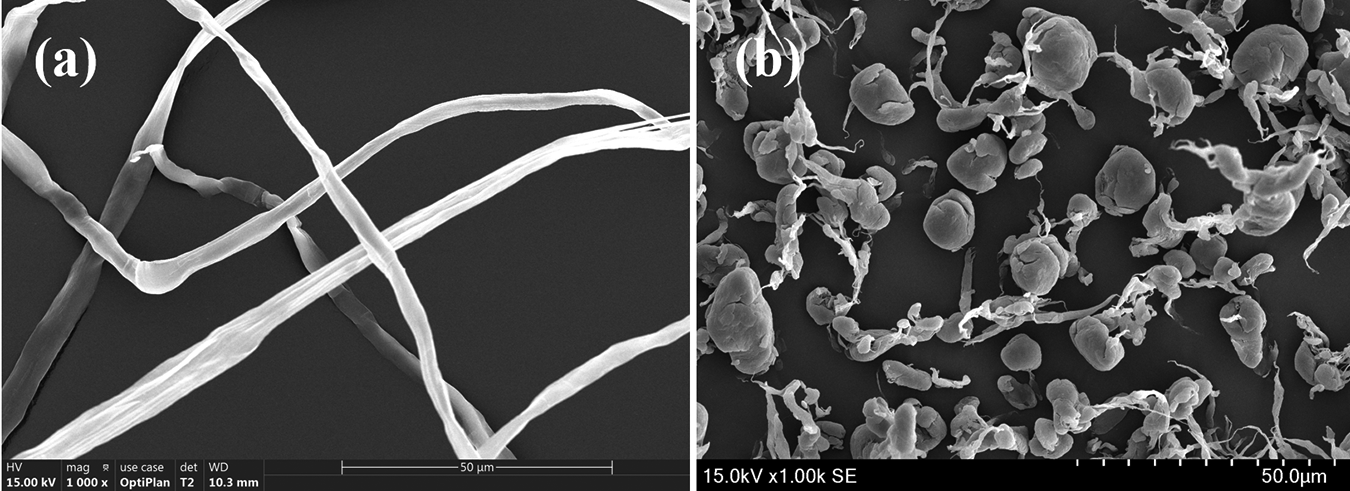
Images of (a) PTFE fiber and (b) PTFE particles.
Preparation of samples
Prior to blending, all materials were dried under vacuum at 80°C for 8 h. Firstly, a series of POM-based samples with various contents of PTFE filler were prepared using a twin-screw extruder. Afterward, the extrudates were granulated and dried under vacuum at 80°C for at least 10 h. Then, the specimens for subsequent characterizations were prepared by injection molding process.
Characterization
Mechanical properties
Tensile and flexural properties of POM/PTFE composites were conducted using a universal mechanical tester (Instron 5567, USA) at room temperature as per GB/T 1040.2-2006 28 and GB/T 9341-2008, 29 respectively. Notched Izod impact strength tests were carried out using a Chengde testing machine (XJU-55, Hebei, China) according to GB/T 1843-2008. 30 At least five specimens were tested for each measurement.
Morphology
The microstructure for cryo-fractured surfaces and worn scars POM/PTFE samples was observed by a scanning electron microscope (SEM; JSM-9600; JEOL, Japan) at an acceleration voltage of 15 kV. All samples were coated with a thin layer of gold prior to observations.
Dynamic rheology measurements
Viscoelastic behavior of PTFE-containing samples was analyzed by a dynamic rheometer (Bohlin Gemini 2000; Malvern, UK) in the melt state. To keep the response in the linear viscoelastic region, the applied strain was set at 1%. All samples were prepared in a parallel-plate form with a diameter of 25 mm and thickness of 1 mm, and the rheological tests were performed at 190°C. All samples were tested in a frequency sweep range from 0.01 Hz to 100 Hz. The storage modulus (G′), loss modulus (G″), and complex viscosity (η*) of all samples were recorded as a function of frequency (ω).
Differential scanning calorimetry
The melting and crystallization behaviors of the composites were determined using a differential scanning calorimeter (DSC-204; Netzsch, Germany). Experiments were performed with 6–10 mg samples under a nitrogen atmosphere. The sample was firstly heated to 195°C at a rate of 10°C/min and then cooled down to 30°C at 10°C/min. Afterward, the sample was reheated from 30°C to 195°C at a heating rate of 10°C/min. The crystallization and melting temperatures were obtained from the cooling and second heating thermograms, respectively. The crystallinity (χc) of each sample can be calculated with equation (1):

where ΔHm is the melting enthalpy of the POM and ΔHcalc represents the expected melting enthalpy for POM based on the measured melting enthalpy for the pure component and the mass fraction of it in the blended composite. The melting enthalpy of 100% crystalline polymer for POM is 251.8 J/g. 18
Friction and wear test
The friction and wear test were conducted on a block-on-ring apparatus (M-200; Beijing Guance Testing Instrument Co., Ltd, China) according to GB/T 3960-2016. 31 The schematic illustration of the measurement is given in Figure 2. The outer diameter of the steel ring counterpart is 40 mm and the surface roughness (Ra) is 0.7–0.9 μm. The dimensions of the specimen are 30 × 6 × 7 mm3 with the surface roughness (Ra) of 0.2 μm. Prior to testing, the samples and counterpart were polished and cleaned ultrasonically in acetone, then dried naturally. Sliding test was performed under ambient conditions (temperature: 20 ± 5°C, humidity: 50 ± 10%) at a speed of 0.42 m/s and a normal load of 200 N. The duration for each test was 2 h. The transient COF can be calculated by equation (2):
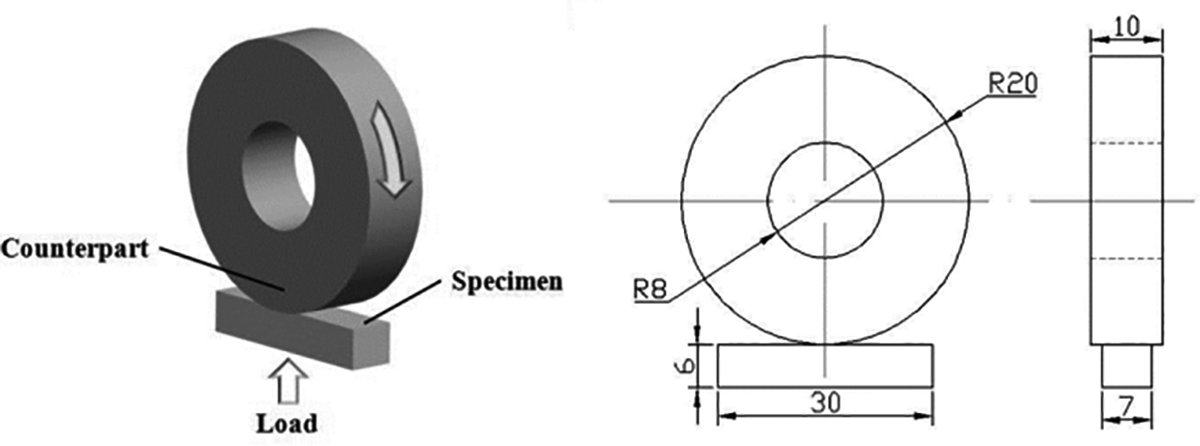
The illustration of the block-on-ring test and steel ring.
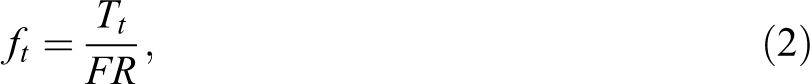
where ft is the transient COF, Tt is the friction torque (kg mm), F and R denote the normal load (N) and the radius of steel ring (mm).
The worn scar was measured using a reading microscope with an accuracy of 0.01 mm, and the wear volume V (mm3) of each specimen is calculated by equation (3):
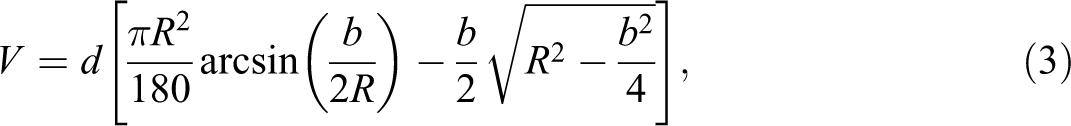
where d is the width of the specimen (mm), R is the radius of steel ring (mm), and b is the width of wear scars (mm). The specific wear rate W (mm3/m) can be calculated using equation (4):
where ΔV and ΔS are the change of the wear volume (mm3) and sliding distance (m), respectively. Three replicate tests were conducted for each measurement.
A home-made pin-on-disc testing apparatus was utilized to test the samples’ performance under severe siding conditions, for example high P×V (P is the applied load and V is the sliding velocity) conditions. In this scenario, the V is at least 4 m/s and the P is 318 N. The diagram of the apparatus is displayed in Figure 3. The real-time torque during testing was recorded by the servomotor driver and it was simultaneously transferred to the computer to calculate the COF. The mass wear rate was calculated by considering the weight difference after sliding testing. The duration for each measurement is 120 s.
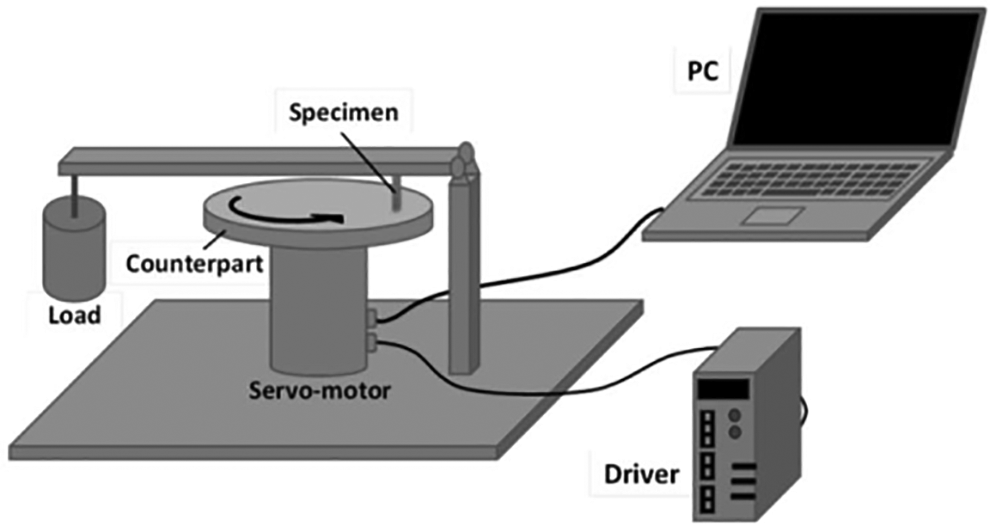
The schematic illustration of pin-on-disc apparatus.
Results and discussions
Mechanical properties
The mechanical properties for both PTFE fiber and PTFE particles loaded POM composites as a function of filler content is given in Figure 4. Figure 4(a) and (b) shows that both the tensile strength and tensile modulus for either PTFE fiber or PTFE particle–filled samples deteriorated when compared with their pure POM counterpart. This can be partially attributed to the poor interfacial interaction between PTFE and the host matrix, POM, which leads to the presence of void defects in resultant samples; in addition, the mechanical properties of PTFE 32 are lower than those of POM, which is detrimental to the performance of PTFE-filled systems. Interestingly, the tensile strength for POM/fiber composites almost leveled off when the filler content is higher than 5 wt%, whereas the POM/particle systems decreased monotonously with increasing filler content. In this scenario, the larger aspect ratio for PTFE fibers could be a contributing factor. For example, larger filler aspect ratio is considered as a prerequisite for filler-reinforced systems. 33
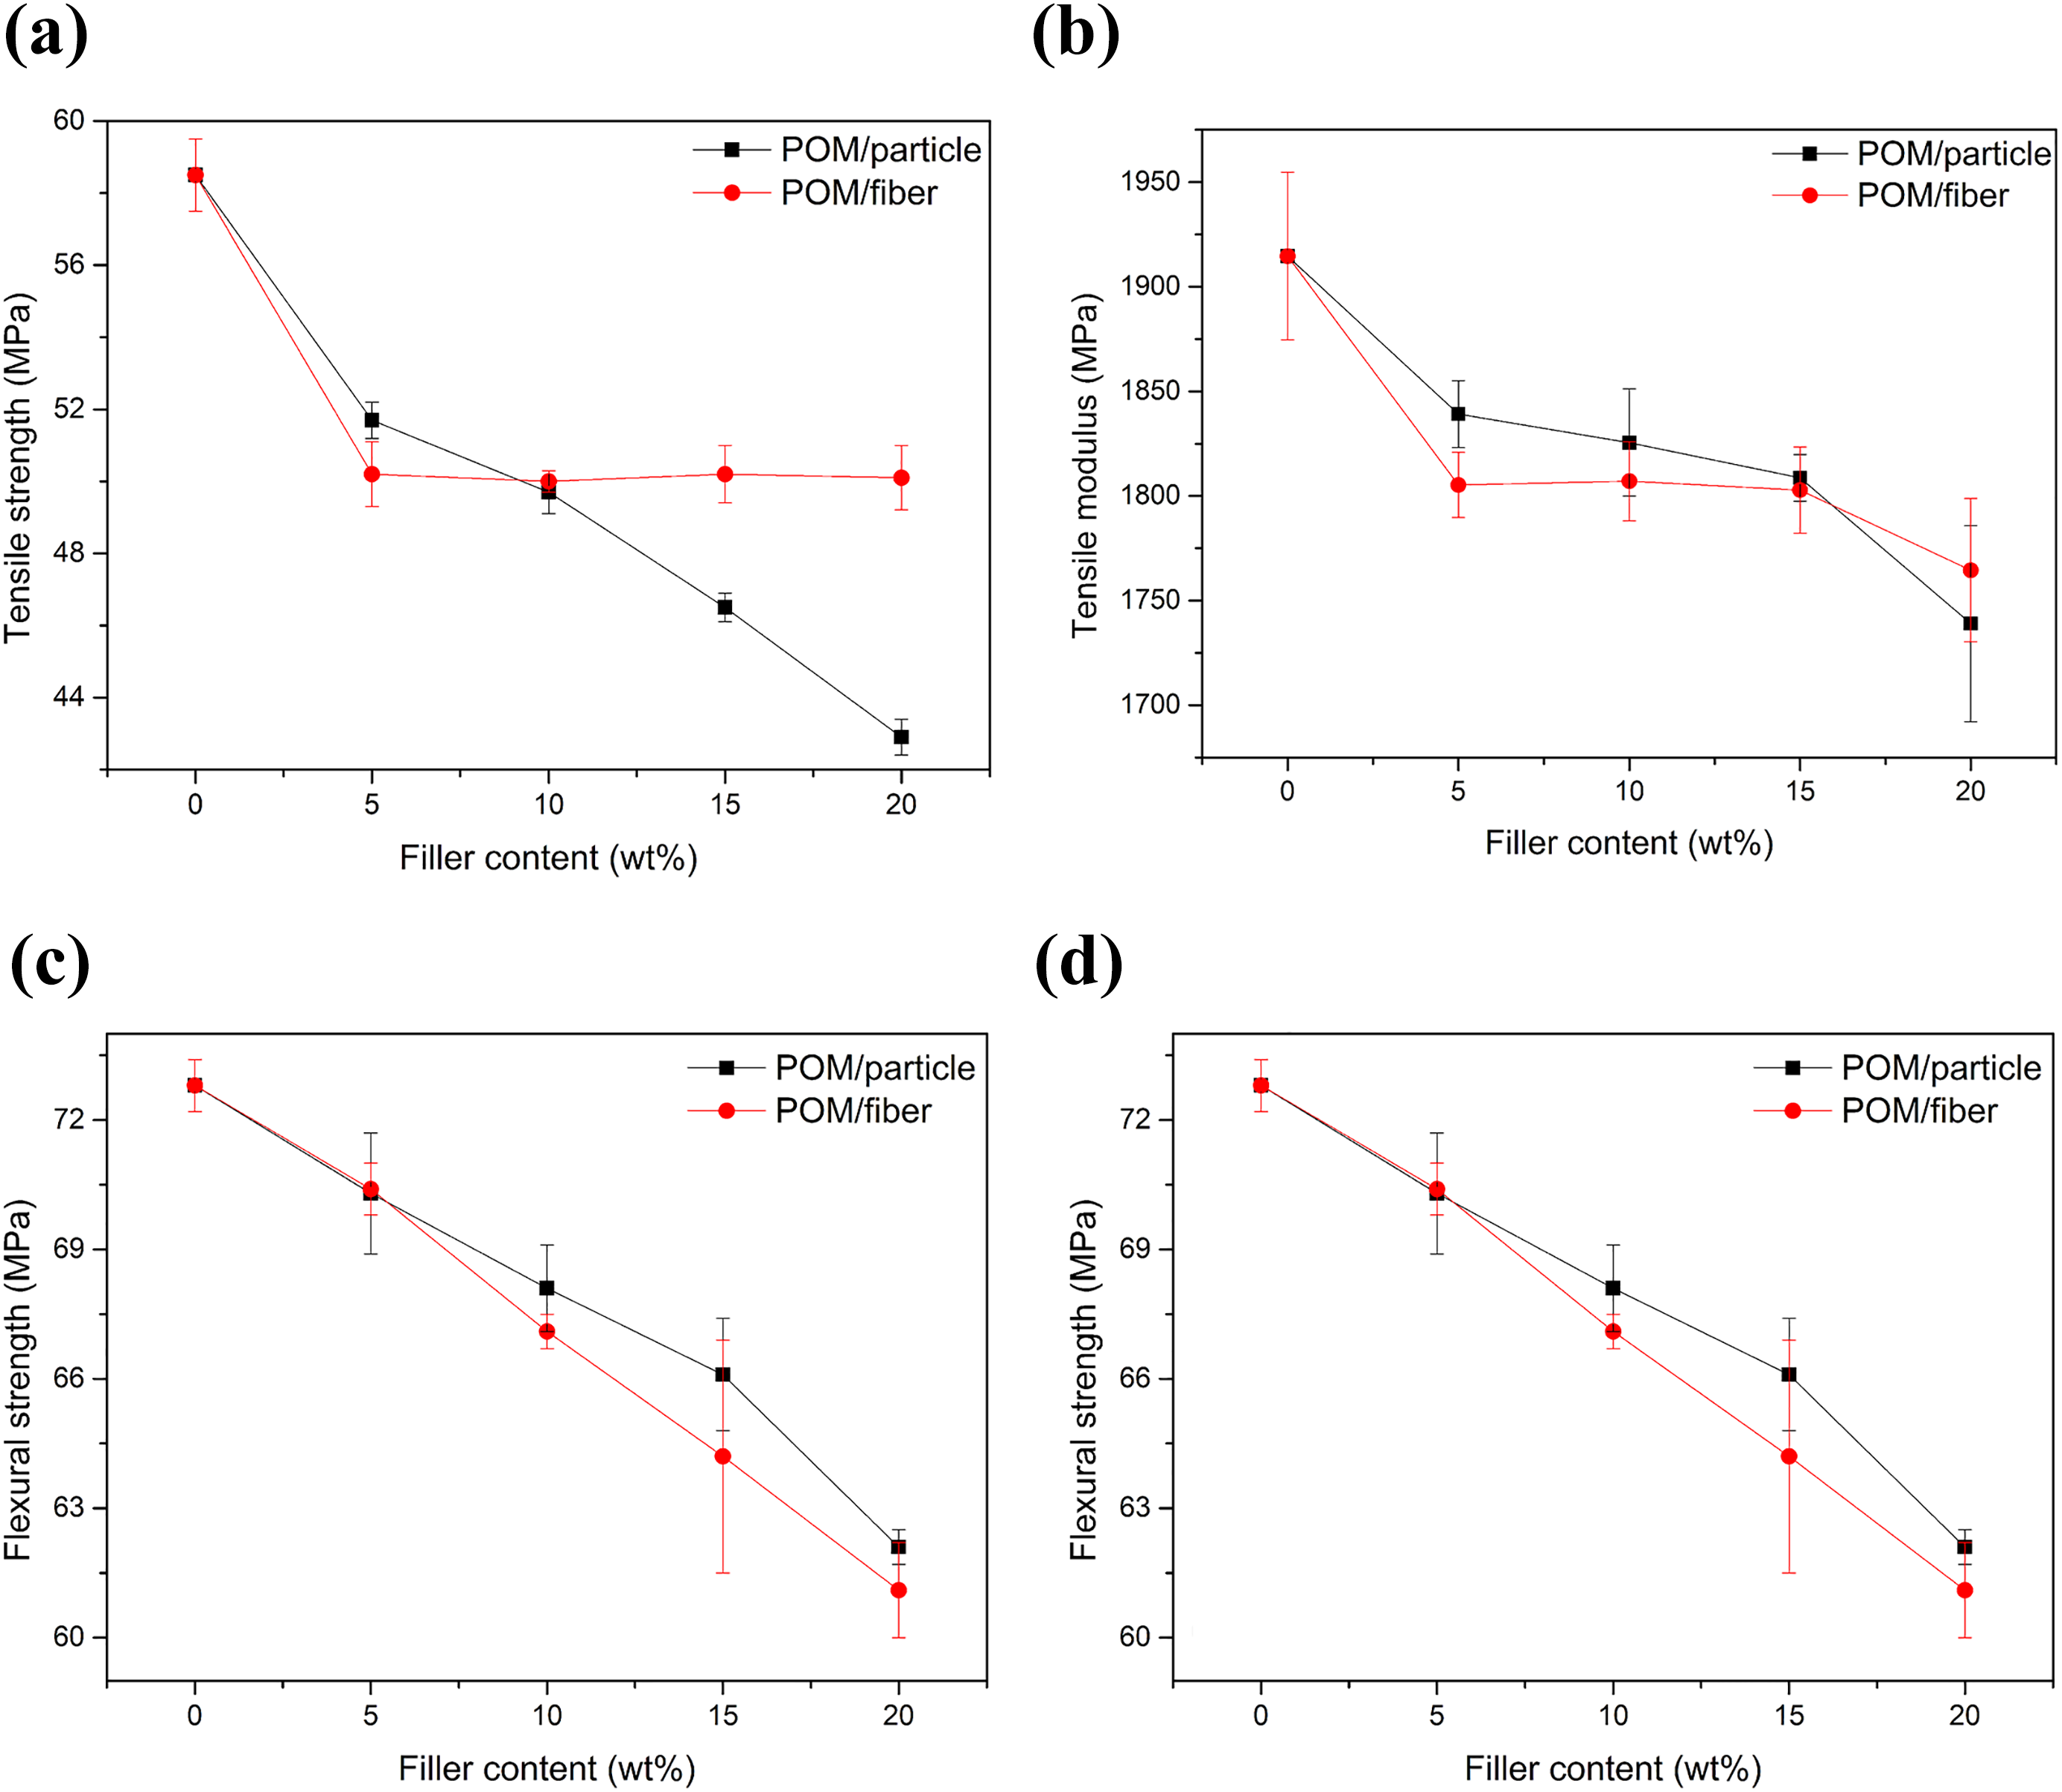
The mechanical properties of PTFE-containing POM composites as a function of filler content.
Moreover, the flexural strength for both POM/fiber and POM/particle systems decreased with an incremental filler content. And the values for POM/particle system are slightly higher than those of POM/fiber counterparts, which is due to the constraint effect that is caused by PTFE particles. The specific surface area for PTFE particles is higher than the PTFE fiber. Therefore, more POM chains can be constrained surrounding PTFE particles, 34 thereby leading to a relatively higher flexural strength. Similarly, Amrishraj and Senthilvelan 35 reported that both the tensile strength and flexual strength decreased with the addition of PTFE in acrylonitrile butadiene styrene. The soft nature of PTFE fillers as well as the incompatibility between PTFE and the host matrix are believed to be the contributing factors. The impact strength for both PTFE fiber and PTFE particles loaded POM composites as a function of filler content is given in Table 1. To our surprise, the impact strength for PTFE fiber–filled POM composites increased considerably when the filler content is higher than 5 wt%. For example, the impact strength for POM/fiber 20 wt% is as high as 13.1 kJ/m2, which is about 1.8 times higher than that of pure POM counterparts. This can be ascribed to the fact that the presence of soft PTFE fibers would absorb a great amount of energy by fiber breakage/pullout when the composite is subjected to external impact. 35 Additionally, the shape deformation or cracking of surrounding matrix will contribute to the increase of impact strength. However, the impact strength for POM/particle composites decreased with an increase of filler concentration, which is attributed to the poor interfacial interaction between PTFE particles and POM, as mentioned previously. Similar results were observed by Luo et al. 18 in terms of the aramid fiber- and aramid particle-containing POM composites.
The impact strength of POM/PTFE composites as a function of filler content.
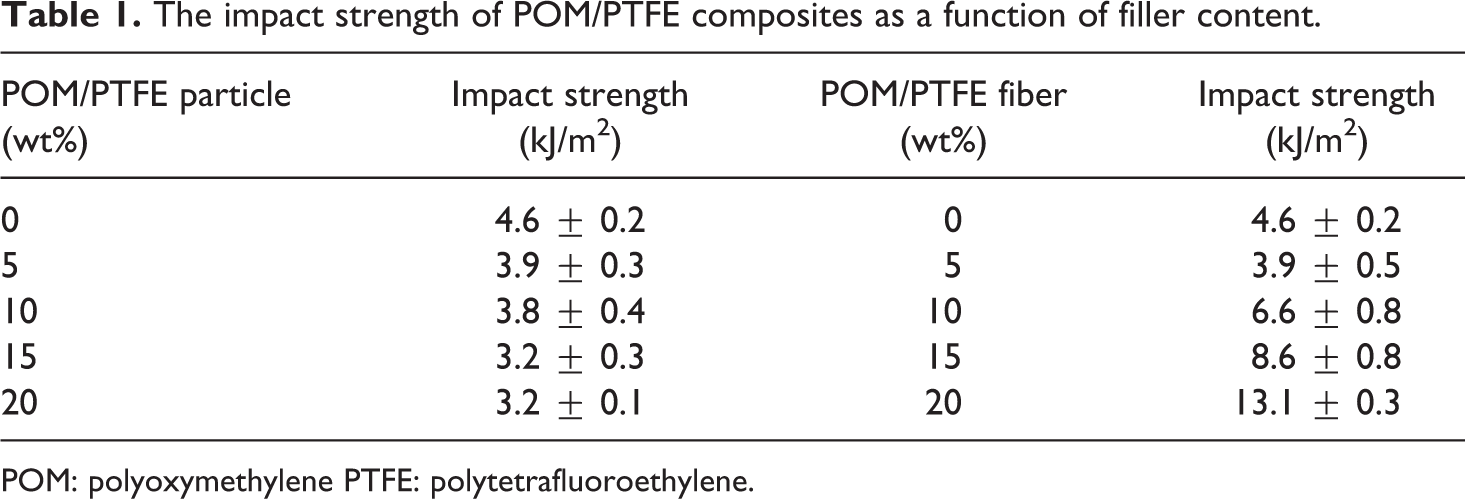
POM: polyoxymethylene PTFE: polytetrafluoroethylene.
Morphology
The morphology of POM/PTFE composites was investigated using SEM. Results revealed that the presence of voids or holes in POM/fiber composites can be attributed to the pullout of PTFE fibers. In addition, Figure 5 reveals that both PTFE fibers and PTFE particles were uniformly distributed in POM (Figure 5(a) to (f)) except that the PTFE fibers entangled at higher filler content, as displayed in Figure 5(g). Although there is poor interfacial interaction between the POM and PTFE fibers due to the intrinsically low surface energy of the incorporated fillers, the embedment of PTFE fibers in the POM matrix is key to enhancing the impact strength of corresponding composites. In this scenario, the pullout or breakage of PTFE fibers will considerably lead to the enhancement of impact strength. As to PTFE particles loaded systems, there is a relatively uniform distribution of PTFE fillers in POM. The presence of voids in POM/particle composites was ascribed to the shedding of PTFE particles due to their poor interfacial interaction. Thus, the impact strength for POM/particle composites is lower than that of POM/fiber counterparts.
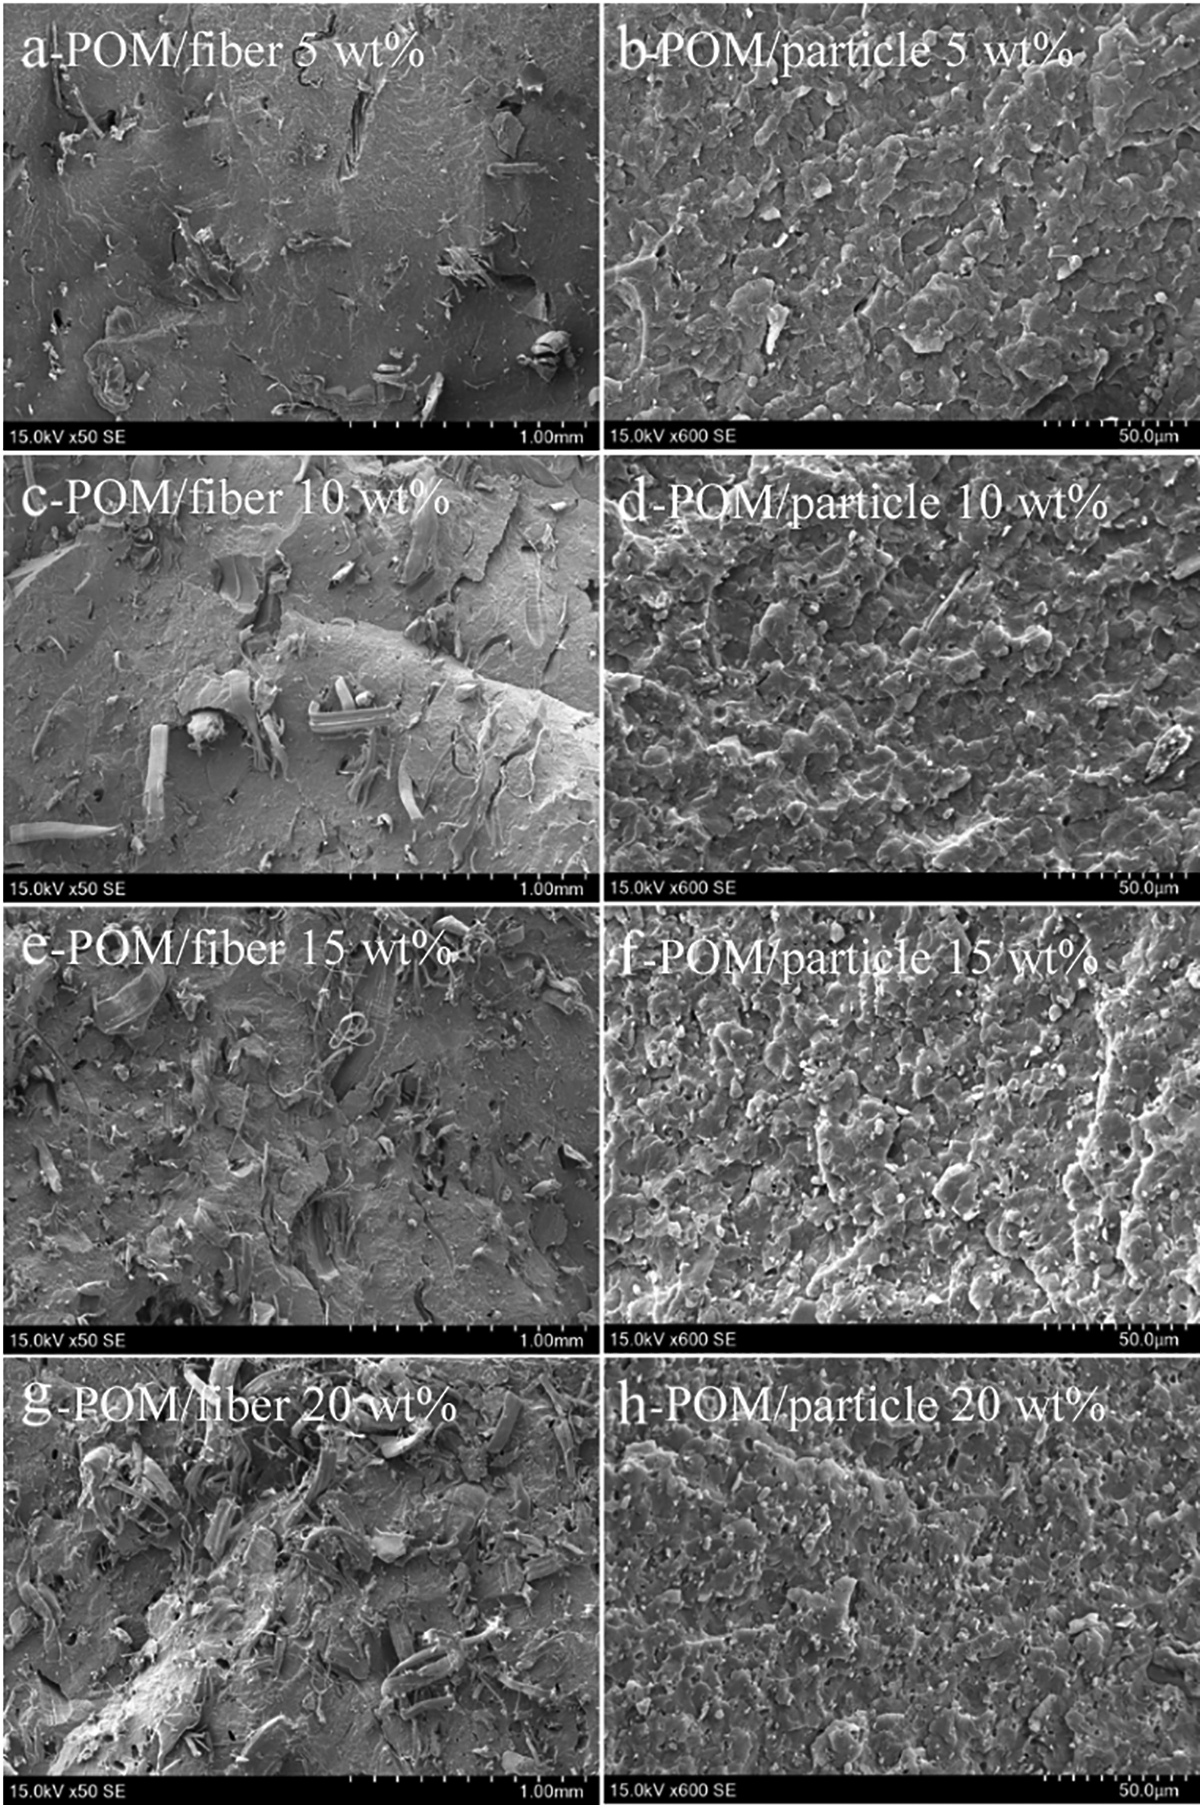
The cryo-fractured surface of POM/PTFE composites with various filler contents. (a) POM/fiber 5 wt%; (b) POM/particle 5 wt%; (c) POM/fiber 10 wt%; (d) POM/particle 10 wt%; (e) POM/fiber 15 wt%; (f) POM/particle 15 wt%; (g) POM/fiber 20 wt%; (h) POM/particle 20 wt%.
Dynamic rheology analysis
The viscoelastic properties of POM/PTFE composites with various filler contents are exhibited in Figure 6. Figure 6(a) indicates that the η* of POM/PTFE composites follows a similar trend when the filler content is 5 wt%, suggesting that the addition of lower amount of PTFE does not significantly affect the viscous properties of POM. However, the behavior of η* deviates greatly from that of pure POM with further increasing the filler content, especially for the PTFE fiber–containing POM composites. For example, the η* for POM/fiber 10 wt% composite is nearly 10 times higher than that of pure POM at lower frequency regions. In addition, the η* for POM/fiber 10 wt% composite is higher than that of POM/particle 20 wt% counterparts, suggesting that the presence of PTFE fibers can significantly enhance the viscosity of corresponding systems via self-entanglement, as corroborated by morphology observations. Similarly, both the G′ and G″ for POM/fiber systems are higher than those of POM/particle counterparts, as given in Figure 6(b) and (c). Particularly, a plateau is observed at low frequencies in both G′ and G″ for POM/fiber composites when the filler content is higher than 10 wt%, and a pronounced shear thinning behavior is noticeable in η*. The relation is a well-known phenomenon for filler-containing composites, which indicates a physical network formation by the inorganic fillers. 2 The viscoelastic behavior for POM/fiber composites is more significant when compared with their POM/particle counterparts, which is attributed to the higher aspect ratio of fibrillar fillers. For example, the entanglement of PTFE fibers within the host matrix hinders free movement of POM chains, thereby leading to a notable increase of η* and the solid behavior of composites at higher filler content.
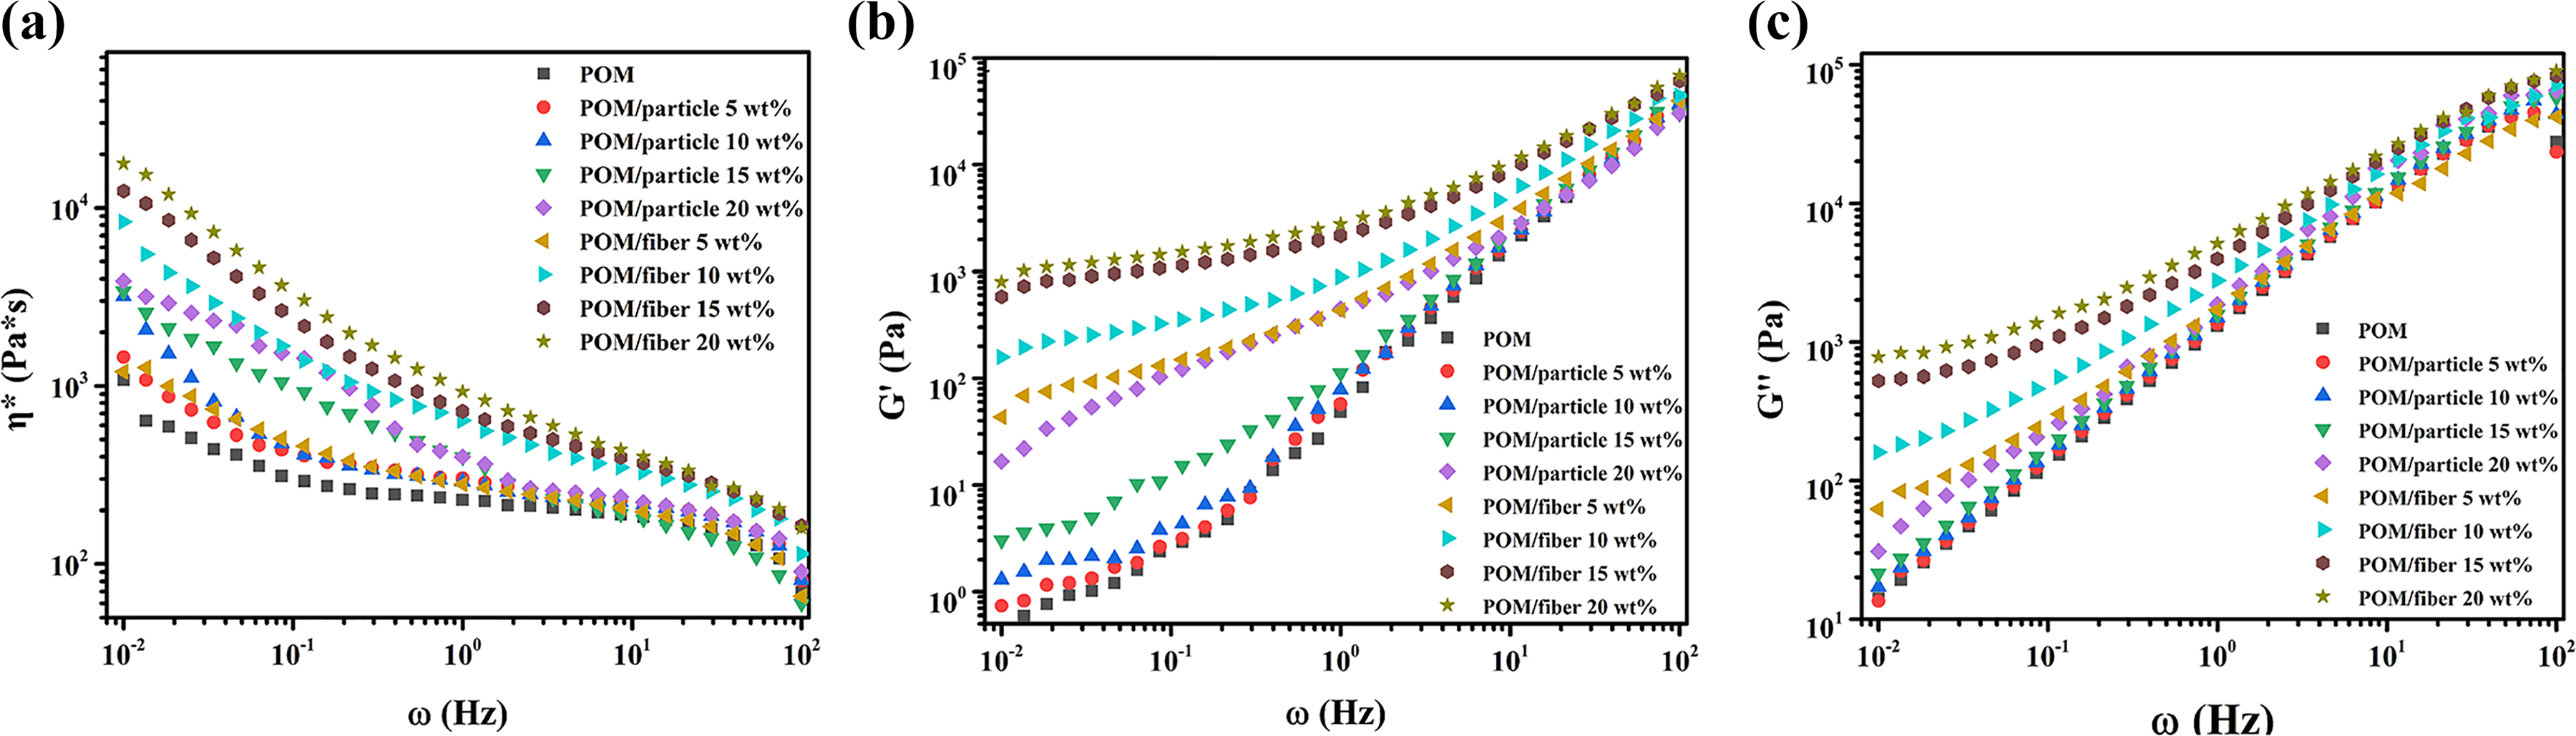
(a) G′, (b) G″, and (c) η* as a function of ω with various filler contents for POM/PTFE composites, respectively.
Differential scanning calorimetry
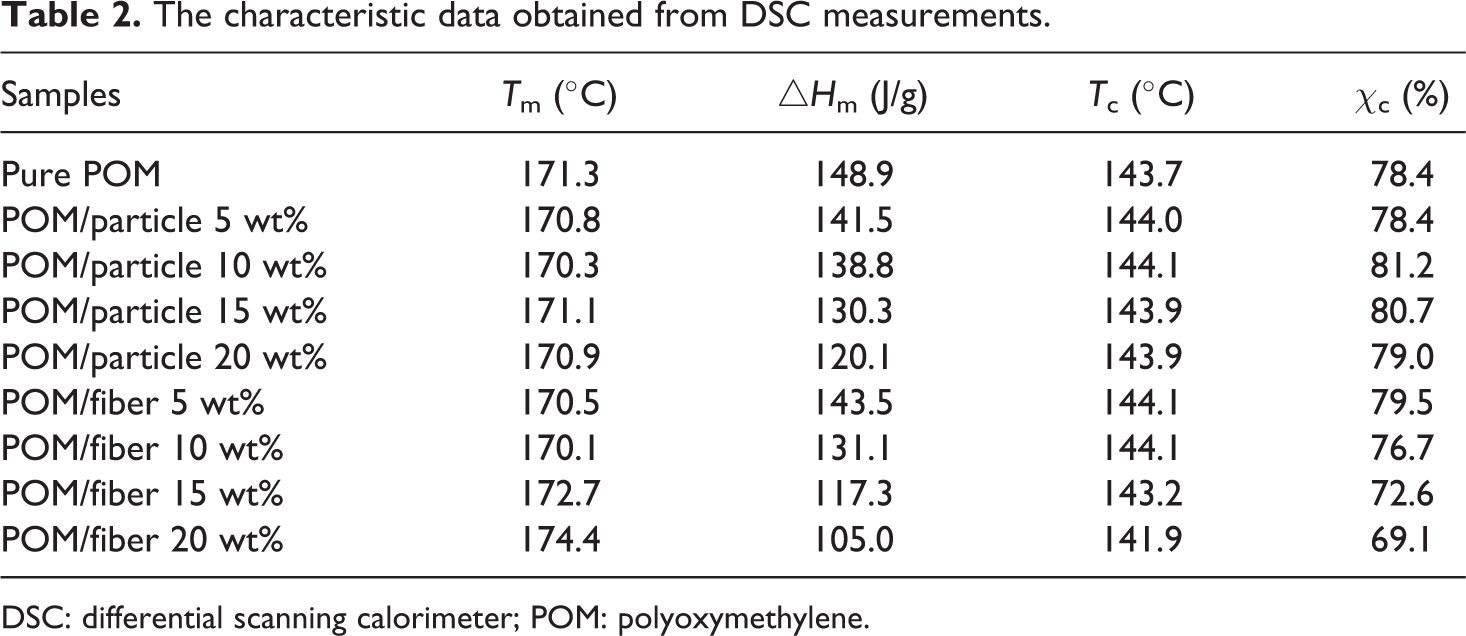
Figure 7 shows the melting and crystallization behavior of pure POM and POM/PTFE composites. Table 2 tabulates the characteristic data obtained from the DSC heating and cooling curves. Results indicated that the addition of PTFE particles has little effect on both the melting and crystallization behavior of POM. However, the melting temperature (Tm) of the POM/fiber composites shifted to higher temperature regions when compared with pure POM. For example, the Tm for POM/fiber 20 wt% composite is 174.4°C which is 3.1°C higher than pure POM. This can be attributed to the confinement effect that is caused by the incorporated fibers, which retards free motion of polymer chains, thereby leading to an upshift of Tm at higher PTFE fiber concentrations. However, such effect is insignificant when it comes to POM/particle systems. Therefore, the morphology of the added fillers has a significant impact on the melting behavior of subsequent composites.
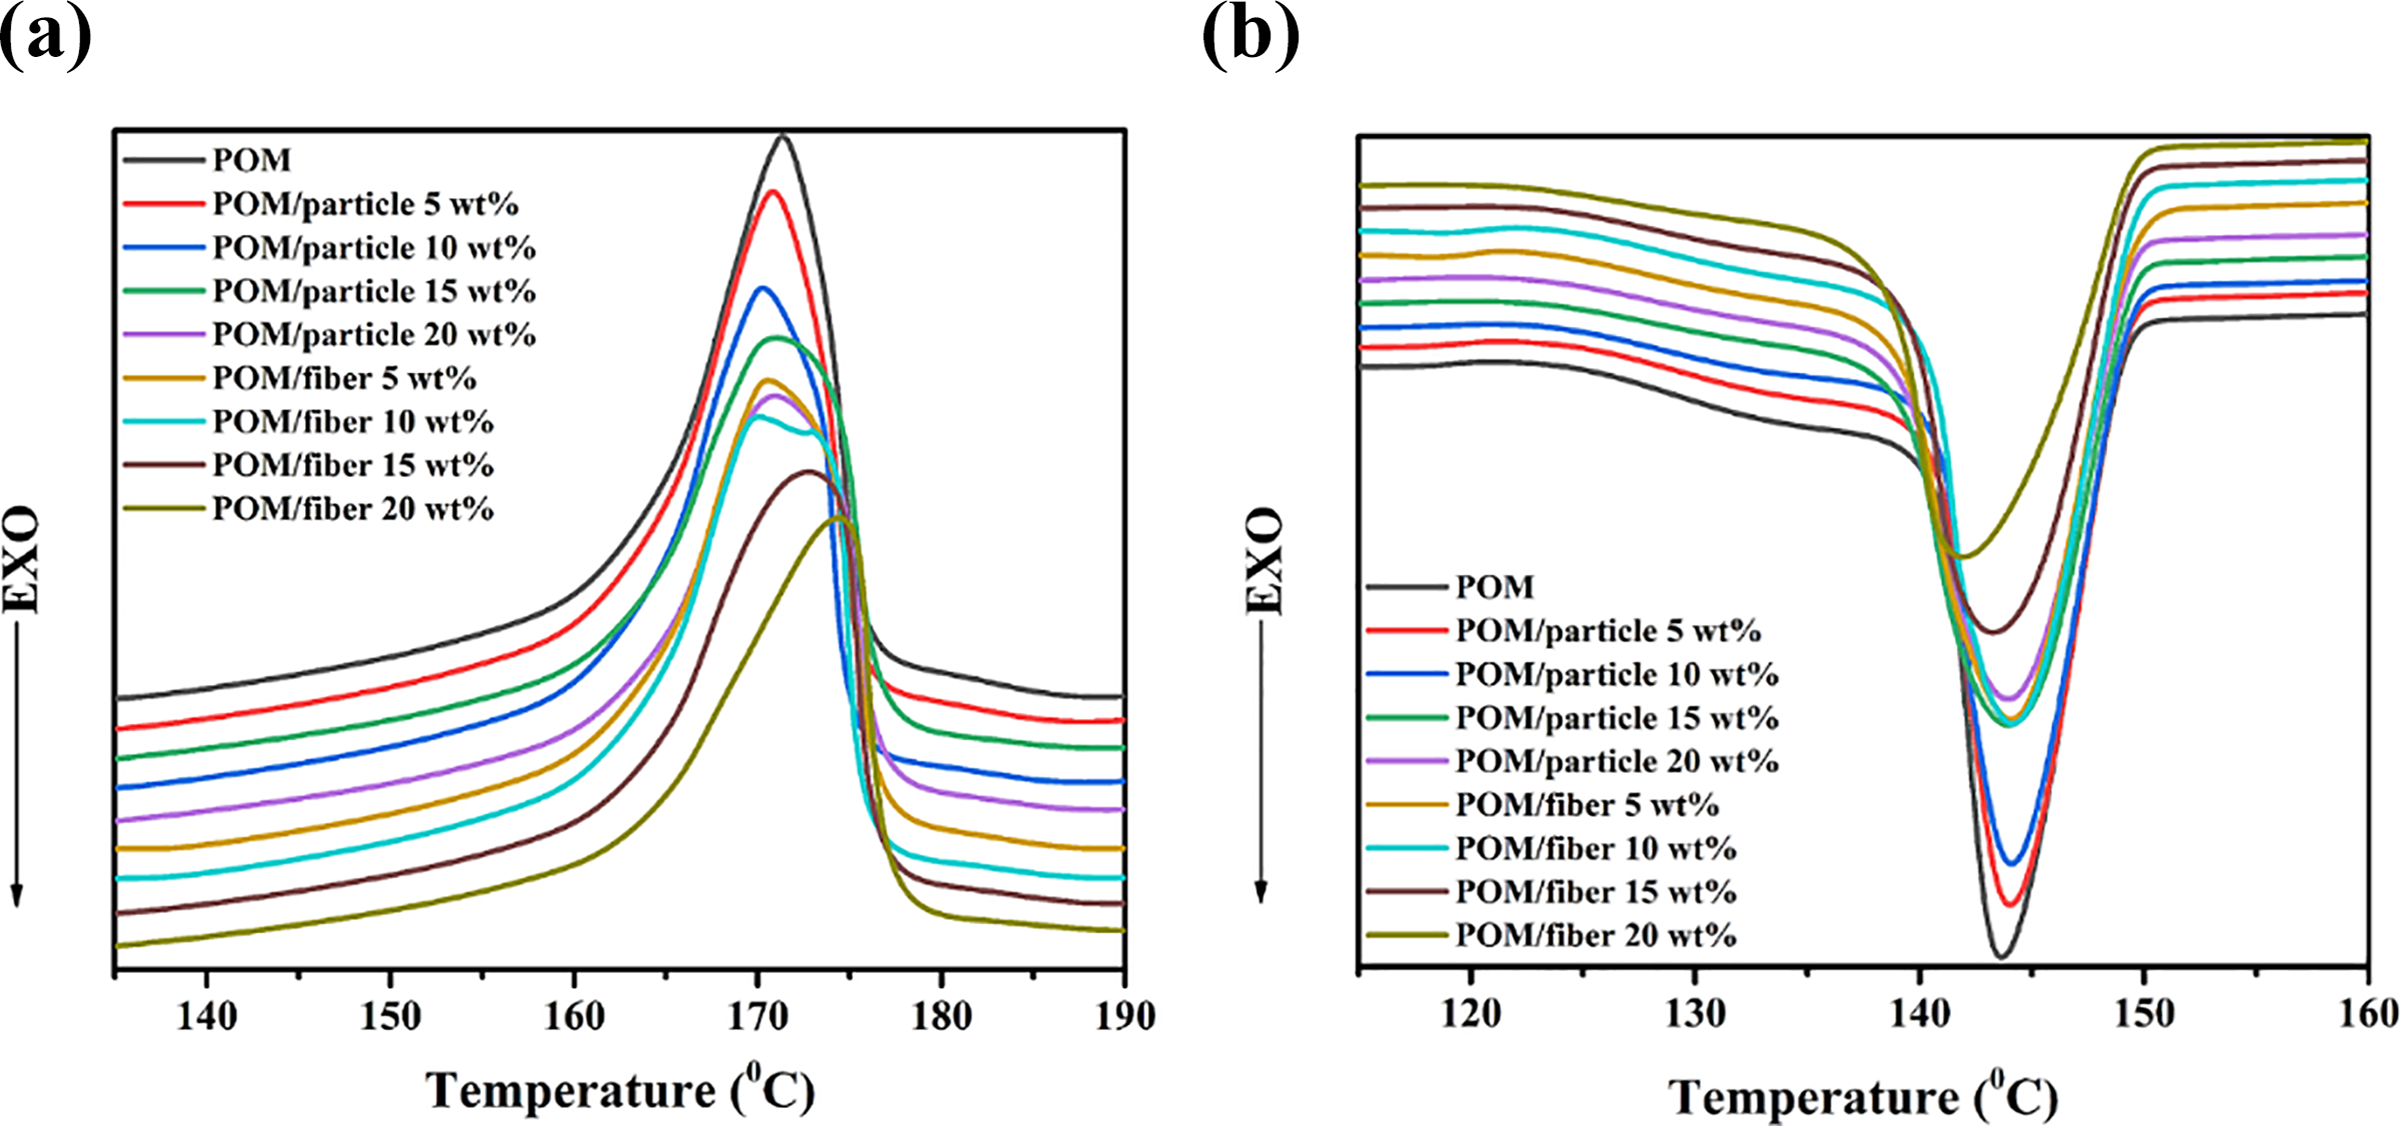
The melting and crystallization behavior of pure POM and PTFE-loaded POM composites.
The characteristic data obtained from DSC measurements.
DSC: differential scanning calorimeter; POM: polyoxymethylene.
Table 2 reveals that the crystallinity (χc) of POM/PTFE particle composites is higher than that of pure POM, whereas the χc of POM/PTFE fiber composites is lower than pure POM when the fiber content is higher than 5 wt%. In this scenario, the higher χc for PTFE particle–containing POM composites suggests that the added particles play a role of nucleation agent, which is favorable for the crystallization of polymer chains. The χc for POM/fiber composites decreased with increasing loading content of PTFE fiber. This indicates that the presence of high aspect ratio fibers has a suppression effect on the crystallization of POM chains, which can be related to the entanglement of PTFE fibers. For example, the crystallization temperature (Tc) for POM/fiber 20 wt% composite shifted to lower temperature regions when compared with other systems.
Friction and wear tests
Transient COF
The transient COF for both POM/fiber and POM/particle composites as a function of sliding time is presented in Figure 8. It is clear from Figure 8(a) that the COF of pure POM fluctuated heavily throughout the whole sliding process, which is attributed to the accumulation of frictional heat. The generated heat during the sliding process leads to severe melting or softening of POM matrix. In addition, a small peak of COF was typically observed at the sliding distance of 320 m (i.e. sliding time 760 s), which can be attributed to the adhesive wear of testing specimen. The sample was partially melted and a rapid dropping of COF after sliding 2000s is related to the boundary lubrication between the sliding block and rolling steel counterpart. During testing, the melted layer can be easily peeled off due to the strong heating and shearing effect. After that, the frictional heat is continuously generated and accumulated between the sliding block and steel ring counterpart, which causes recurrent softening of POM matrix, thereby leading to an increase of COF.
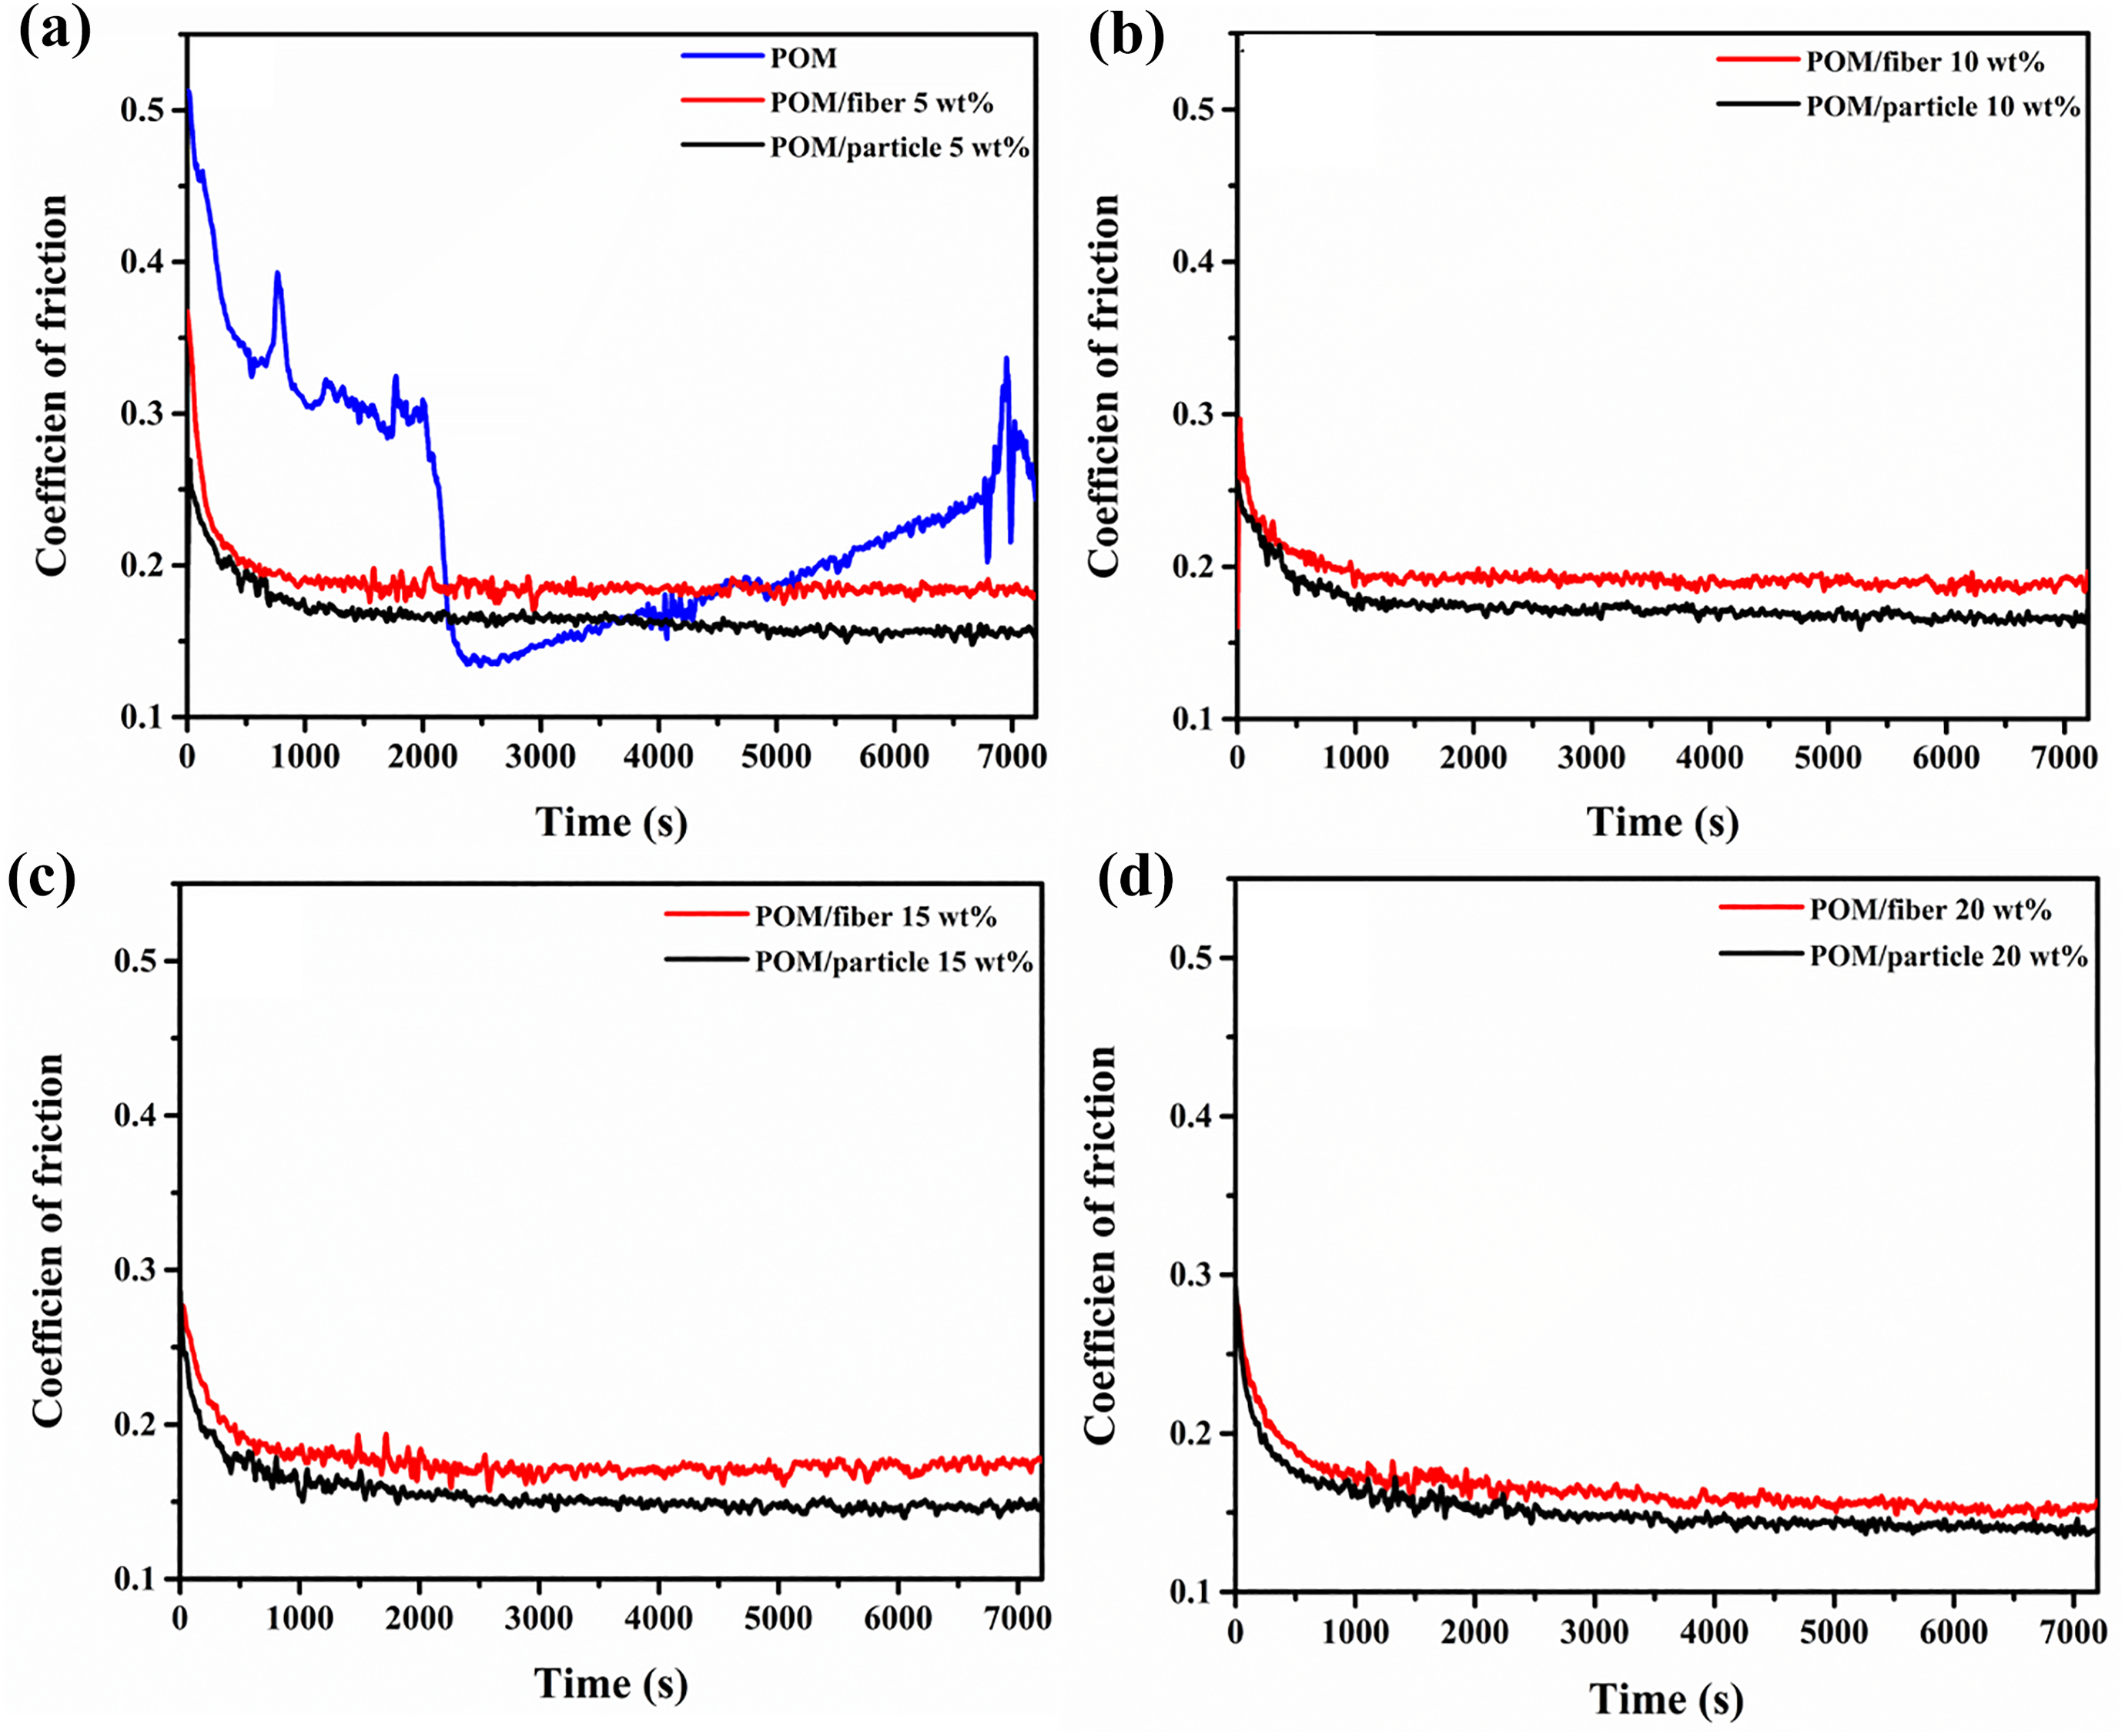
The transient coefficient of friction for POM/PTFE composites with various filler concentrations.
Notably, the tribological behavior of POM was greatly improved with the introduction of PTFE fillers. All samples firstly demonstrated the highest COF upon direct contact between the sliding block and steel ring counterpart, at the initial sliding state. After sliding for a certain period (i.e. 1000s), the values of COF became rather stable with further progression of sliding process. The values of COF decreased with an incremental loading concentration of PTFE fillers, which is related to the formation of PTFE transfer films on the steel ring counterpart. 24 Apart from that, the COF of POM/particle composites is invariably lower than their POM/fiber counterparts. Thus, it can be concluded that PTFE particles are more effective in reducing the COF of POM. This can be attributed to the fact that the mobility of PTFE particles is much higher when compared with that of PTFE fibers, under the intensive shearing effect applied by the rolling steel ring. As a result, the PTFE particles can be easily transferred on the outer surface of steel ring, which is beneficial to formation of continuous films that helps reduce the COF. This is confirmed by energy dispersive spectroscopy (EDS) analysis, which will be given later.
Steady-state COF and volumetric wear rate
The steady-state COF and volumetric wear rate of POM/PTFE composites as a function of filler content are displayed in Figure 9(a) and (b), respectively. Figure 9(a) shows that pure POM exhibits the highest COF and the COF decreases with an incremental loading concentration of PTFE fillers in POM. Moreover, the incorporation of PTFE particles not only showed better performance in terms of lowering the COF, but also the POM/particle composites demonstrated lower volumetric wear rate when compared with their POM/fiber counterparts. On the one hand, although the high aspect ratio PTFE fibers can, to some extent, improve the mechanical properties of POM, the distribution of PTFE fibers in POM is uneven due to the entanglement of fibers, as displayed in Figure 5(g). As a result, the unevenly distributed PTFE fibers cannot protect the entire sliding area from damaging when subjected to external sliding shearing effect. In contrary, the distribution of PTFE particles is quite uniform which is helpful for the formation of continuous transfer films, thereby lowering the COF. On the other hand, the construction of physical network of PTFE fibers is not favorable for the crystallization of POM chains, as corroborated by the dynamic rheology analysis and DSC measurements. As a result, the lower crystallinity of PTFE fiber–containing composites leads to worse tribological behavior when compared with PTFE particle-containing POM counterparts. 36 In addition, Perego et al. 37 reported that samples with higher crystallinity demonstrate better heat resistance. Therefore, the POM/particle system would have a higher tolerance to temperature, thereby lowering the COF and volumetric wear rate.
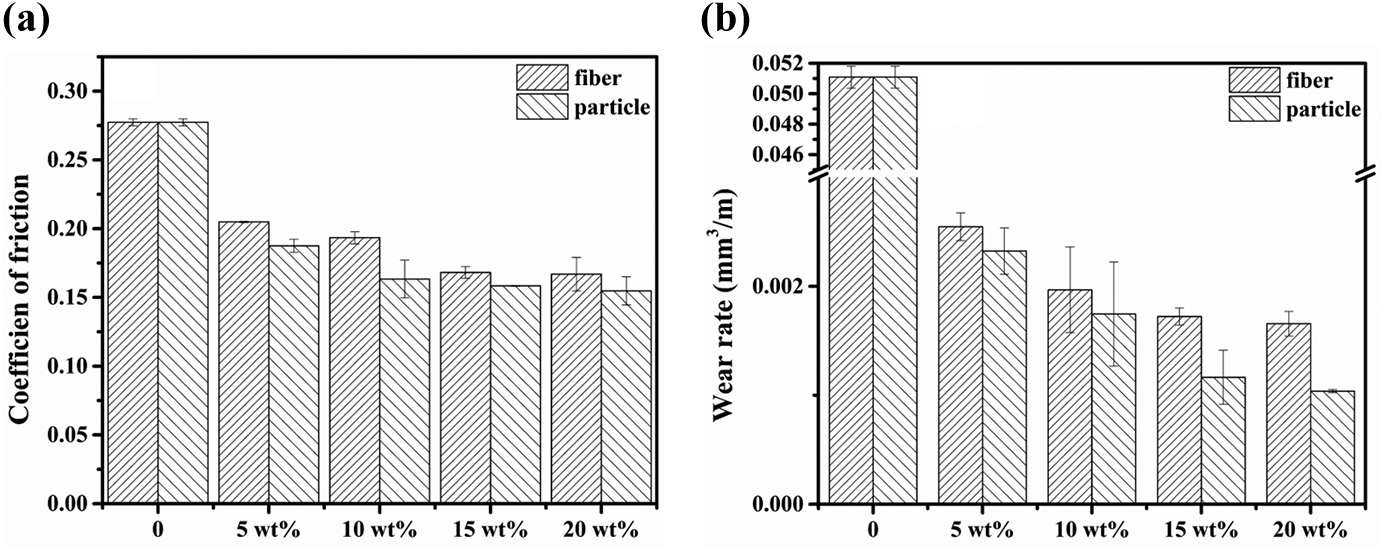
The (a) steady-state COF and (b) volumetric wear rate of POM/PTFE composites as a function of filler content.
The morphology of worn surface and related wear mechanism
The morphology of worn surface for pure POM and PTFE filler–loaded POM composites is shown in Figure 10. Figure 10(a) reveals that pure POM demonstrated obvious worn scars, which is typical of plastic deformation. This is due to the imperfect contact between the sliding block and steel ring counterpart because both the surface of samples and steel ring countersurface contain some micro-sized asperities. The presence of these asperities will generate a certain amount of heat during the sliding process, leading to the softening of POM matrix. In addition, the hard protrudes will plow the soft polymer matrix, thereby leading to the appearance of large area worn scars, as shown in Figure 10(a). The worn surface of PTFE-loaded POM composites was greatly improved due to the formation of transfer film on the countersurface of steel ring. As to POM/PTFE particle 10 wt% composite, the sliding surface is quite smooth and microgrooves can be observed along the sliding direction which is attributed to the shearing effect that is caused by the rolling steel ring. However, the worn surface of POM/fiber 10 wt% is quite different when compared with previously described systems. For example, the worn surface is quite smooth at the upper region of Figure 10(c), whereas the surface becomes sort of rougher at the bottom part of Figure 10(c). This can be related to the state of dispersion of PTFE fillers in POM matrix. The distribution of fluorine (F) atoms in the POM/PTFE composites is characterized using the EDS analysis. The mapping results for POM/particle and POM/fiber 10 wt% composites are given in Figure 11. Results showed that the distribution of PTFE particles is quite uniform in comparison with the PTFE fiber–loaded counterparts, which supports the findings described in sections “Transient COF” and “Steady-state COF and volumetric wear rate.”
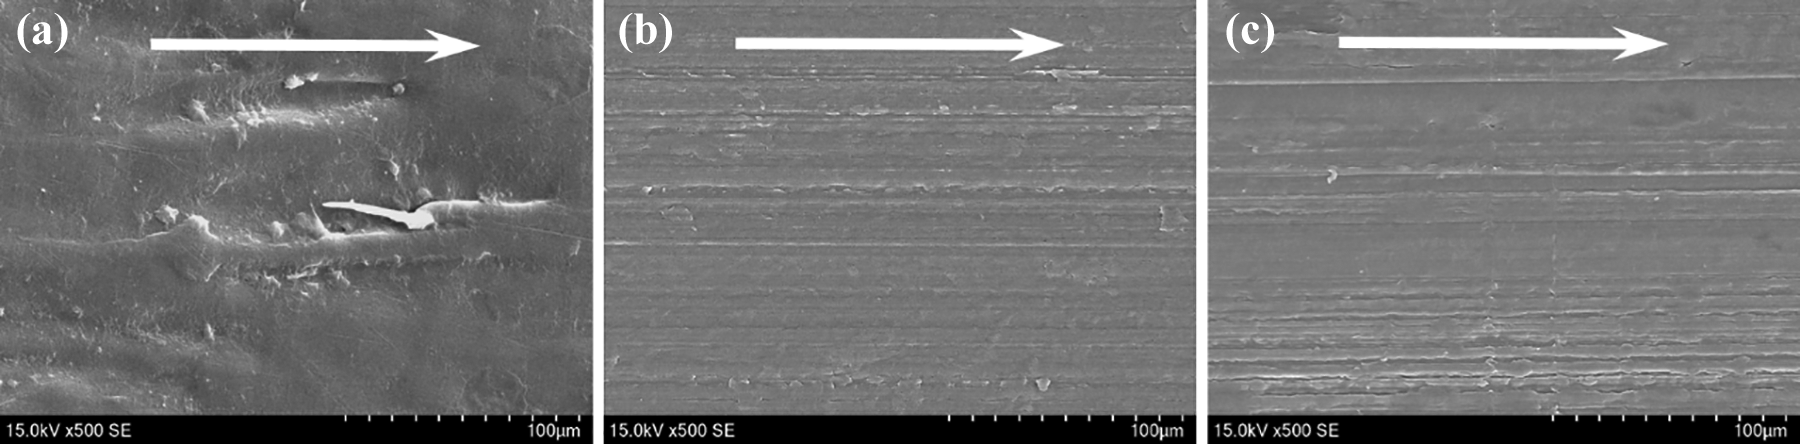
The images of worn surface for (a) pure POM, (b) POM/particle 10 wt%, and (c) POM/fiber 10 wt% composite. The white arrow denotes the sliding direction.
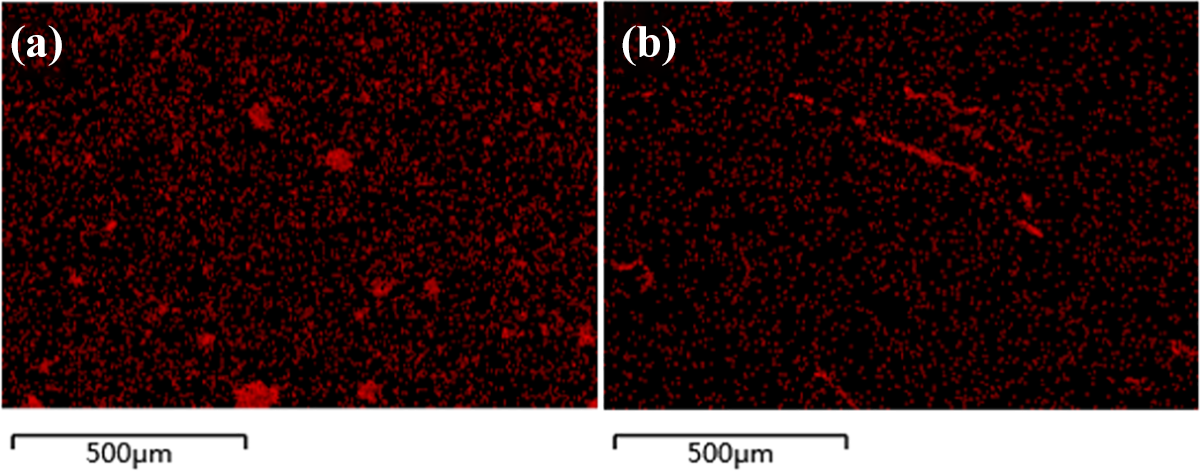
The mapping images of (a) POM/particle 10 wt% and (b) POM/fiber 10 wt% composites.
Worn surface of POM/PTFE composites
The morphology of the worn surface for pure POM and POM/PTFE composites with various filler contents is presented in Figure 12. Figure 12(a) shows that the worn surface of pure POM is quite rough which is due to the plastic deformation of sliding block, arising from the accumulated heat between the sample and rolling steel ring countersurface. As a result, pure POM exhibited a typical adhesive wear behavior. The addition of PTFE fillers can greatly improve the roughness of worn surfaces. For example, the worn surface becomes quite smooth and the appearance of parallel grooves along the sliding direction suggests that POM/PTFE composites exhibited characteristic abrasive wear behavior. When the filler concentration is 5 wt%, the morphology of POM/PTFE particle worn surface is smooth and the wear scars are relatively shallow. On the contrary, obvious worn scars or furrows were observed at the surface of POM/PTFE fiber counterparts. This can be attributed to the fact that the distribution of PTFE fibers is not uniform and severe plowing effect occurs at the regions where are devoid of PTFE fibers. Moreover, the worn surface of both POM/particle and POM/fiber composites becomes flatter and smoother with an incremental loading fraction of PTFE fillers. No significant disparities can be detected at the worn surface of both fillers loaded polymer composites when the filler content reached 20 wt%, which explains the smaller difference of transient COF between POM/particle and POM/fiber 20 wt% composites, as displayed in Figure 8(d).
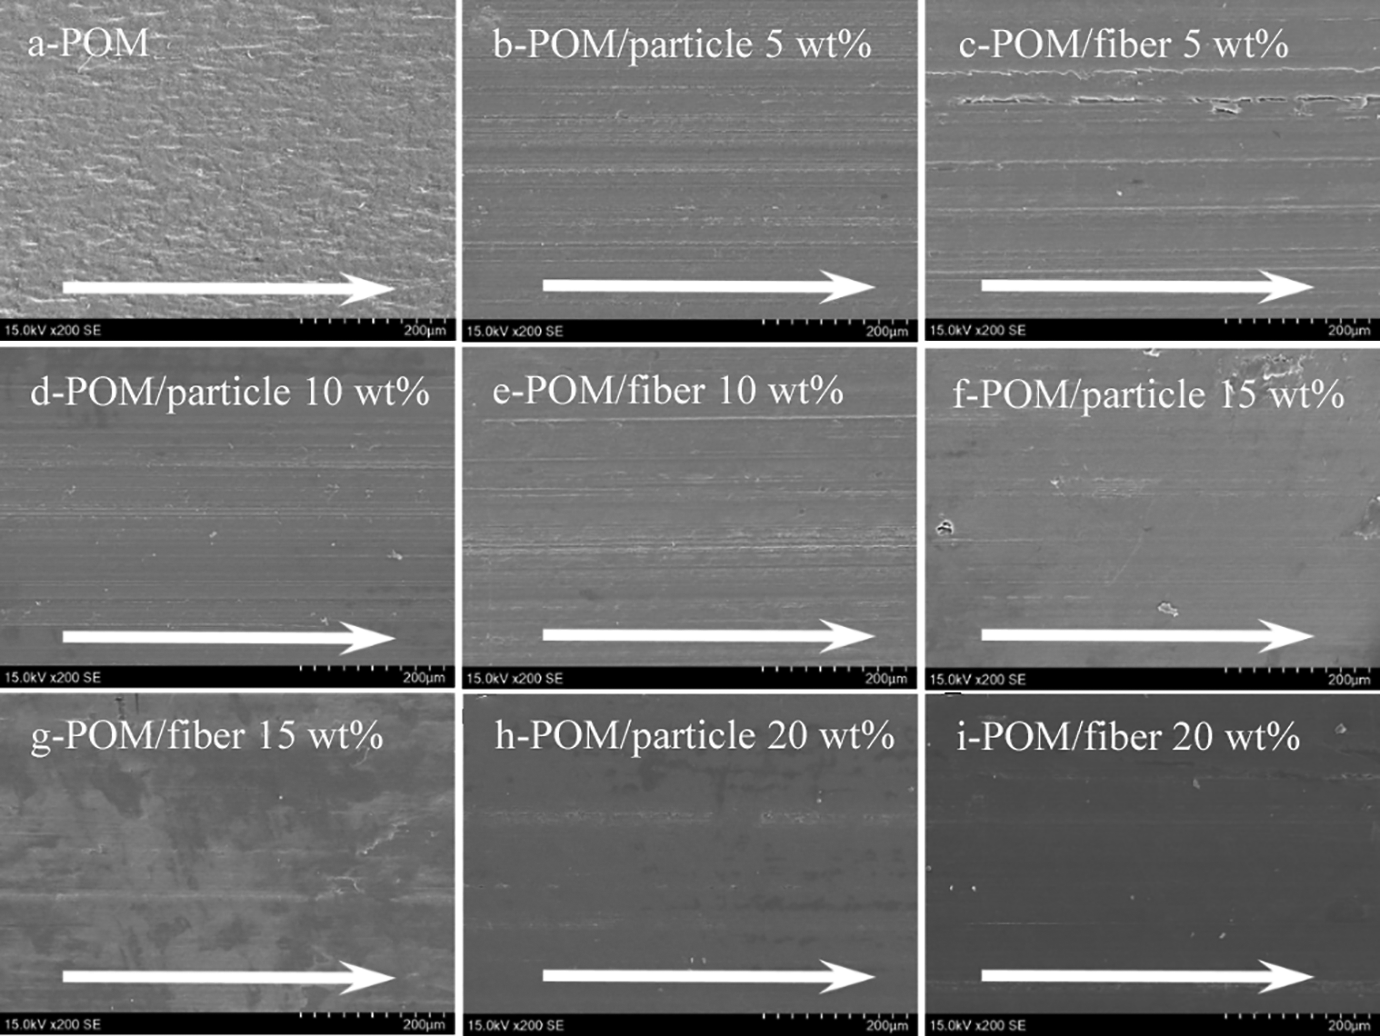
The morphology for the worn surface of POM/PTFE composites with various filler contents. The white arrow indicates the sliding direction. (a) POM; (b) POM/PTFE particle 5 wt%; (c) POM/fiber 5 wt%; (d) POM/particle 10 wt%; (e) POM/fiber 10 wt%; (f) POM/particle 15 wt%; (g) POM/fiber 15 wt%; (h) POM/particle 20 wt%; (i) POM/fiber 20 wt%.
To further probe the wear mechanism, the elemental content on the outer surface of steel ring was characterized using EDS analysis. The steel ring was taken out after continuous sliding for 7200s. The elemental analysis results are provided in Table 3. Results indicated that the content of F atoms increased with increasing the PTFE concentration in POM. Additionally, the countersurface which was in direct contact with POM/PTFE particle composites exhibited a higher content of F. This is believed to easier formation of transfer films. On the one hand, the PTFE chains can be transferred to the steel ring countersurface under sliding conditions thanks to the intensive shearing effect and low cohesive energy of PTFE. On the other hand, the high aspect ratio PTFE fibers are heavily entangled within the POM matrix, which leads to the embedment of PTFE fibers. As a result, the embedded fibers cannot be easily transferred to the steel ring countersurface due to the anchoring effect. In this scenario, the formed PTFE transfer film can prevent the sliding block from abrasive wear, thereby reducing the COF and lowering the volumetric wear rate.
The percentage (%) of the elements detected at the countersurface of rolling steel ring.
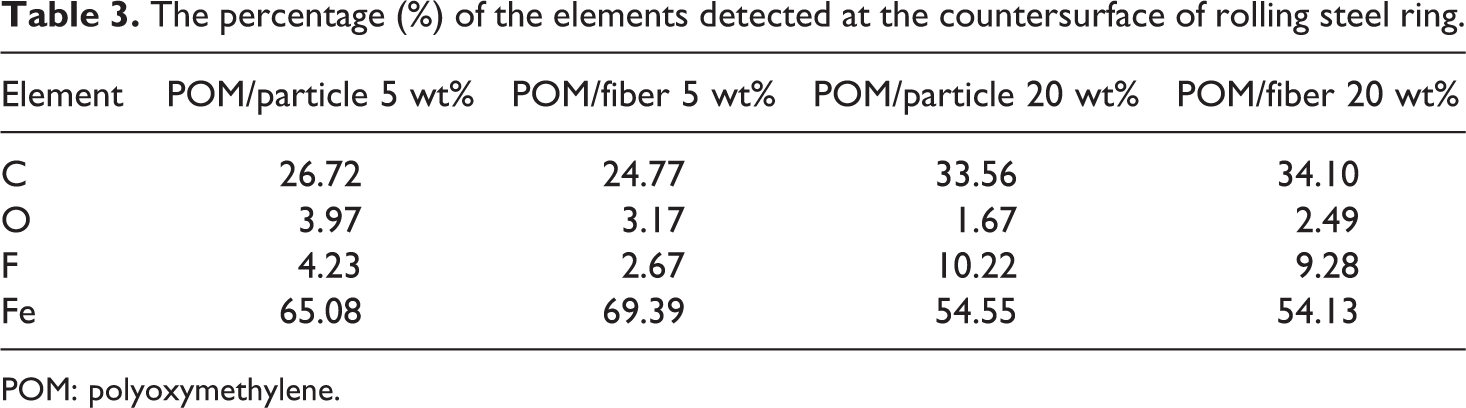
POM: polyoxymethylene.
The tribological behavior under high P×V conditions
Basically, the tribological properties of polymeric self-lubricating materials can be significantly affected by the sliding conditions. Presently, most studies were conducted under relatively lower applied loads38,39 or sliding speeds,40–42 in which cases the sliding conditions are quite mild. However, the tribological behavior of engineering plastics under severe sliding conditions is of great importance since more and more plastics are being utilized in key structural components, due to the trend of replacing metals by lightweight plastics. To investigate the tribological behavior of POM/PTFE system under severe sliding conditions, a pin-on-disc testing apparatus was developed in our laboratory. The torque during testing was recorded by a servo motor which was used for calculating the COF. The sliding conditions are given as follows. The normal pressure is 7.6 MPa, the sliding speed is 4.7 m/s, and the testing duration is 210 s. The average COF was taken from at least three measurements.
The average COF of pure POM and POM/PTFE composites at different sliding duration is reported in Figure 13. Figure 13 shows that the pure POM demonstrates the highest COF and the values of COF slightly decreased with increasing sliding time. This is ascribed to the fact that fragmentary POM matrix can be peeled off under severe sliding conditions and adheres to the steel countersurface, thereby forming transfer film and, to a certain degree, reducing the COF. However, the values of COF for pure POM during the period of 168–210 s cannot be accessed because the sliding POM block fractured after sliding 168 s due to the brittleness of POM. As to the PTFE-containing POM composites, the COF decreased effectively with the presence of PTFE. However, the COF for POM/PTFE composites changed marginally with the increasing concentration of PTFE, despite of the morphology of the incorporated fillers. It is believed that the addition of self-lubricating PTFE fillers can reduce the COF of POM composites. However, Song et al. 36 reported that high sliding velocity is detrimental to the tribological properties of PTFE due to the generation/accumulation of frictional heat. In the other words, the transfer film on the countersurface of steel ring can be scraped off by the sliding block under severe sliding conditions. As a result, the COF does not change significantly with an increase of PTFE concentration.
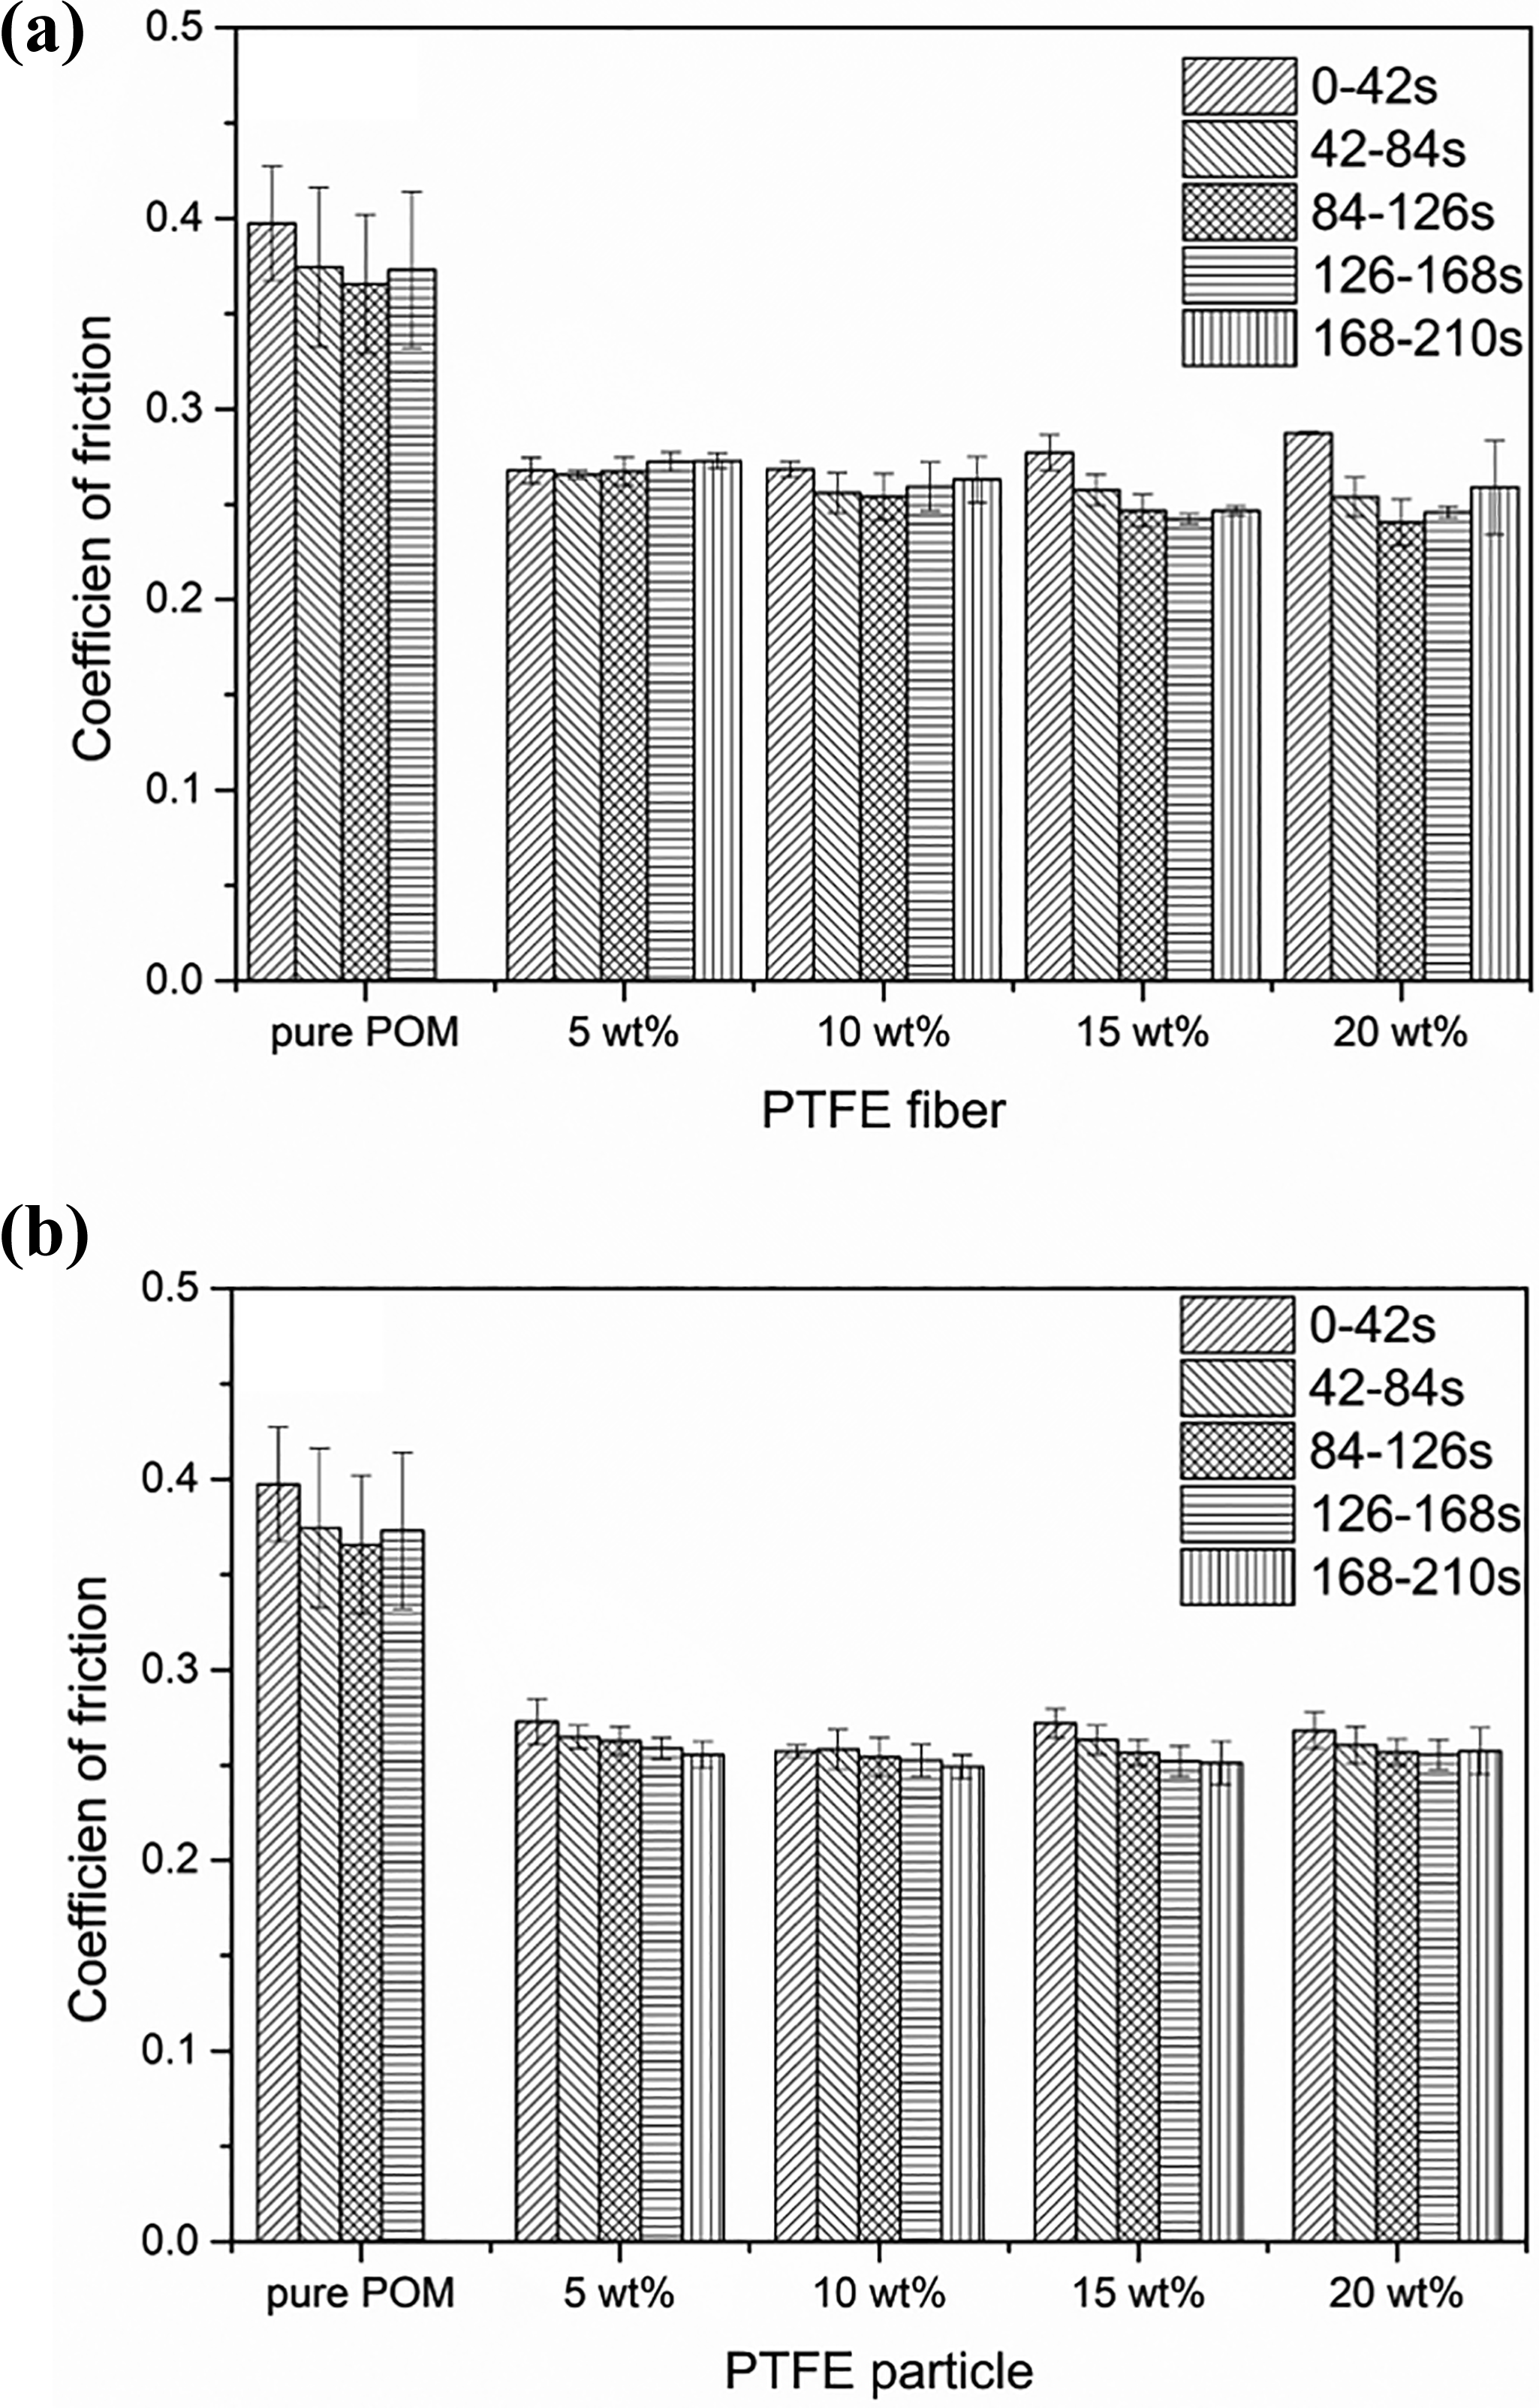
The relationship between the coefficient of friction and the content of PTFE fillers under high P×V sliding conditions: (a) PTFE fiber and (b) PTFE particle.
The mass wear rate of POM/PTFE composites under severe sliding conditions is reported in Figure 14. Figure 14 reveals that the wear rate of POM/PTFE composites increases with increasing filler concentration, which is attributed to the recurrent formation and scrappage of transfer film at the countersurface of steel ring, under severe sliding conditions. In addition, the fast accumulation of frictional heat deteriorates the mechanical properties of the sliding POM block due to an increase of temperature at the contact surface, thereby leading to an increase of mass wear rate. This also partially contributes to the failure of pure POM sliding block. Moreover, the mass wear rate for POM/fiber composites is lower than their POM/particle counterparts, which can be related to the better mechanical performance of POM/fiber composites, as shown in Figure 2. Thus, it is suggested that higher PTFE content is unnecessary for the improvement of tribological properties of POM-based composites, under severe sliding conditions. The finding is extremely useful for engineers to tailor the properties of self-lubricating composites according to the applied sliding conditions.
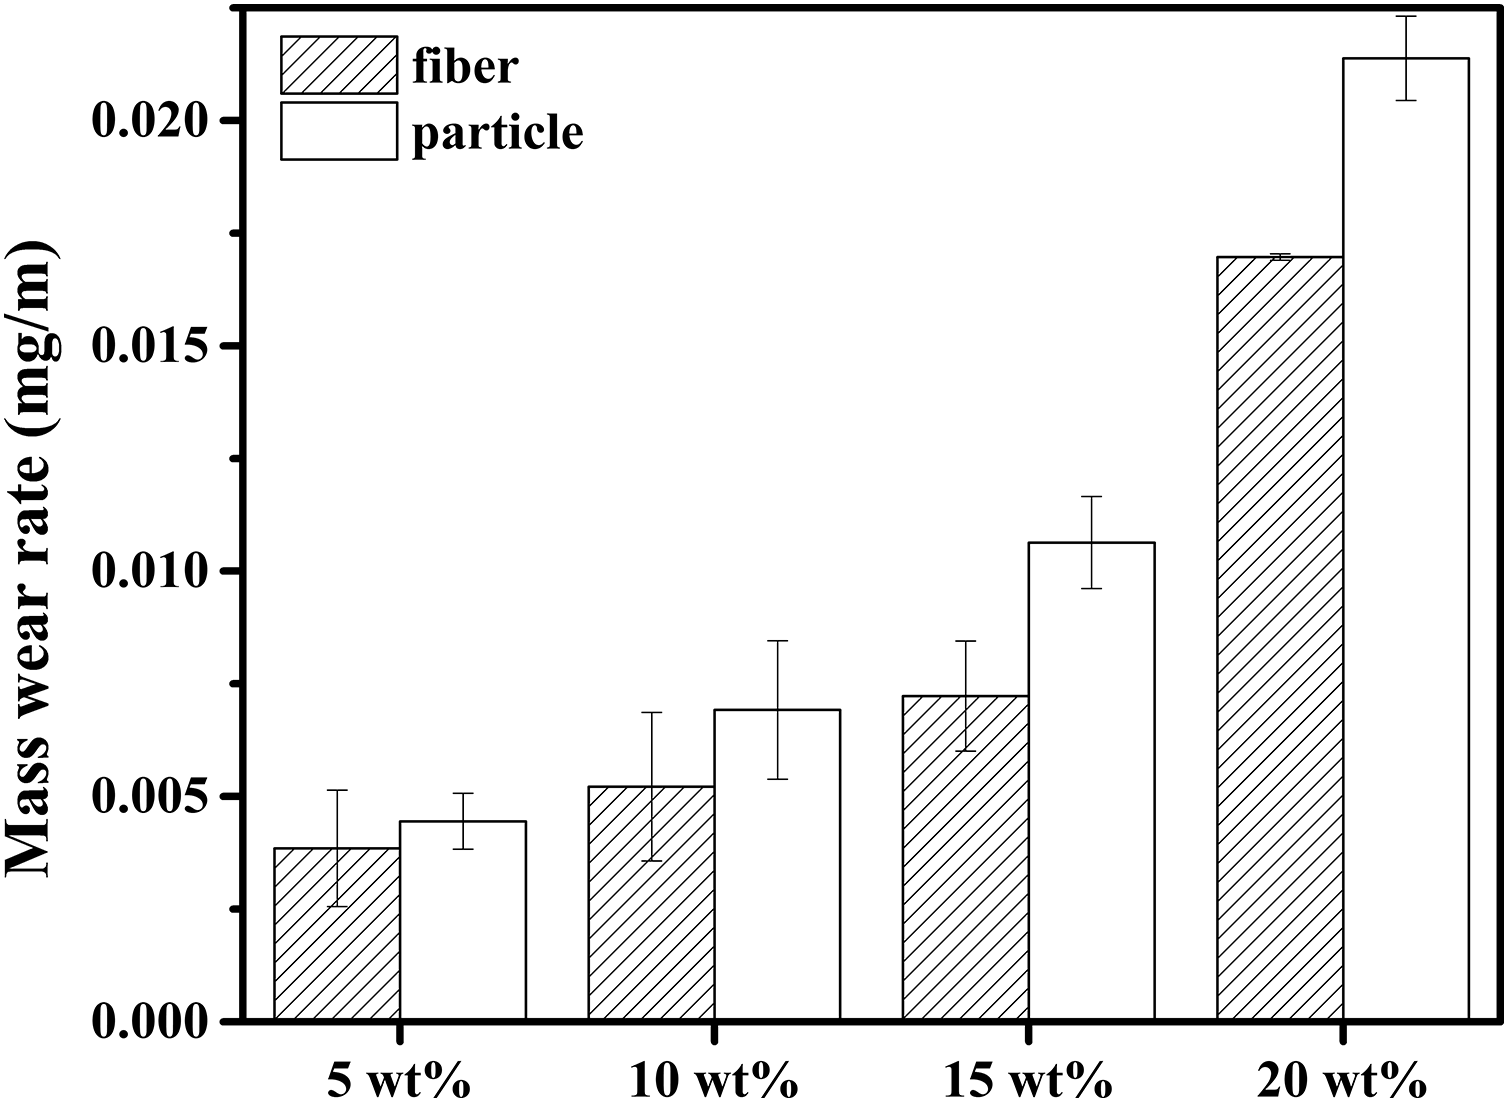
The relationship between the wear rate and the content of PTFE under high P×V sliding conditions.
Conclusion
In conclusion, the tribological properties of POM can be greatly improved with the addition of PTFE. Despite the filler shape, POM/PTFE 20 wt% composites showed the lowest COF and wear rate. In addition, samples with PTFE particles demonstrated lower COF and wear rate when compared with PTFE fiber–containing counterparts, which is ascribed to the formation of effective transfer film on the countersurface of steel ring. The lowest COF (0.1548) and wear rate (1.04 × 10⁻³ mm3/m) were obtained from POM/particle 20 wt% composites. Under severe sliding conditions, there is trivial influence of filler content on the COF for POM/PTFE composites and the mass wear rate increased with increasing PTFE loading concentration. However, the mass wear rate of PTFE fiber–filled POM composites is lower than that of POM/PTFE particle system. Although the tensile properties of POM composites deteriorated with increasing content of PTFE fillers, the impact strength was remarkably enhanced with the presence of PTFE fiber. For example, the impact strength of POM/PTFE fiber 20 wt% is 13.1 kJ/m2, which is about 1.8 times higher than that of pure POM counterparts.
Footnotes
Acknowledgment
The Analytical and Testing Center of Sichuan University is acknowledged for SEM observations.
Funding
The author(s) disclosed receipt of the following financial support for the research, authorship, and/or publication of this article: This work was supported by the Fundamental Research Funds for the Central Universities and the National Natural Science Foundation of China [51273118].