
Abstract
Understanding the effects of pressure and oxygen concentration on the flame spread behaviors of electrical wires is crucial for establishing fire safety strategies for plateau cities, aircraft, and spacecraft. During the combustion, the polymeric coating first liquefies to form molten agglomerations, after which these droplets boil to release combustible gases that propagate the combustion process, which brings a potential fire threat. To better evaluate this fire risk, the flame spread of polyethylene (PE) and ethylene tetrafluoroethylene (ETFE)-insulated nichrome wires was investigated in a subatmospheric cabin. During the combustion of the insulation, the PE flame always presents a closed teardrop-like structure, while at the limiting oxygen concentration condition, the ETFE flame presents an asymmetric pentagram-like structure due to uneven heat losses. In this experiment, dripping was exhibited only by the PE insulation mainly because of the difference in surface tension. When the oxygen concentration was raised from 21% to 30%, the critical pressure for dripping shifts from 60 kPa to 38 kPa. Air pressure has a slight negative effect on flame spread rates, because, at lower pressure, the burning rate is lower, but the heat loss and convective and radiant heats of the flame decrease.
Nomenclature
As: sectional area of the insulation
B: Spalding number
cp: specific heat
d: core diameter
g: gravity acceleration
h: convection heat transfer coefficient
H: maximum flame height
ΔH
L: heat of gasification
p: air pressure
r: stoichiometric oxygen to fuel mass ratio
T: temperature
Vf: flame spread rate
W: maximum flame width
Xr: flame radiant fraction
Greek letter
α: diffusion coefficient
η: effective coefficient related to the flame heat feedback to the wire insulations
λc: conductivity
ρ: density
σ: surface tension
τ: diffusion time
τres: resident time
Subscripts
c: core
cr: critical condition
l: liquid droplet
py: pyrolysis
s: insulation
Introduction
A detailed understanding of the flame behavior of electrical wire (typically coated with polymeric materials) under low air pressures is crucial for establishing fire safety strategies for plateau cities, aircraft, and spacecraft. During the combustion of such materials, the polymeric coating first liquefies to form large molten agglomerations, after which these droplets boil to release fuel gases that propagate the combustion process, which brings a potential fire threat.1,2
Previous work regarding flame spread in low pressure or microgravity has frequently employed nonflame resistant (non-FR) thermally thin materials, such as the polyethylene (PE)-insulated wire,3–7 cellulosic paper,8–10 or thermally thick materials, such as polymethylmethacrylate, 11 expanded polystyrene, 12 or polyurethane. 13
Frey and T’ien 8 studied horizontal flame spread over paper under various oxygen concentrations and pressures in a quiescent subatmospheric pressure environment. These studies determined that the flame spread rate (FSR) can be described by a power law relationship involving two gas phase parameters, in which increases in both the oxygen concentration and air pressure promote the FSR.
Nakamura et al. 4 examined flame spread along PE-insulated wire with a nichrome (NiCr)/iron core under subatmospheric pressure to gain a better understanding of the effects of electrical fires in aircraft and space vessels. Based on a simple thermal length analysis, they proposed that there are two flame spread modes depending on the controlling factor: the wire-driven mode, in which flame spread is primarily governed by the thermal input through the wire core, and the flame-driven mode, in which flame spread is largely determined by the thermal input from the flame.
FR materials more commonly used in space applications, such as ethylene tetrafluoroethylene (ETFE), have less often been employed in microgravity flame spread experiments. Recently, Osorio et al. 1 studied the standard gravity and microgravity limiting oxygen concentrations (LOCs) for the combustion of ETFE-insulated copper wires exposed to an external radiant flux. Limiting oxygen index (LOI) results obtained with ETFE were also compared to available data for PE and it was determined that microgravity conditions have a greater impact on ETFE than PE. The LOC was defined as the oxygen concentration below which flame spread cannot be maintained given a certain current supply.
The present work examined the mechanism underlying the different flame spread characteristics of PE- and ETFE-insulated NiCr wires under subatmospheric pressure conditions. The individual effects of oxygen concentration and pressure on the flame morphology and spread rate were analyzed, as a means of better understanding the variations in the flame spread between non-FR and FR materials in aircraft and space vehicles.
Experimental
The experimental subatmospheric pressure vessel (400 mm diameter × 400 mm height) and wire flame spread apparatus are shown in Figure 1. Oxygen (99.99%) line was attached to the vessel to allow adjustment of the oxygen concentration from 21% to 80%. In addition, the total pressure in the vessel could be varied from 0.3 kPa to 100 kPa with an accuracy of 0.01 kPa.
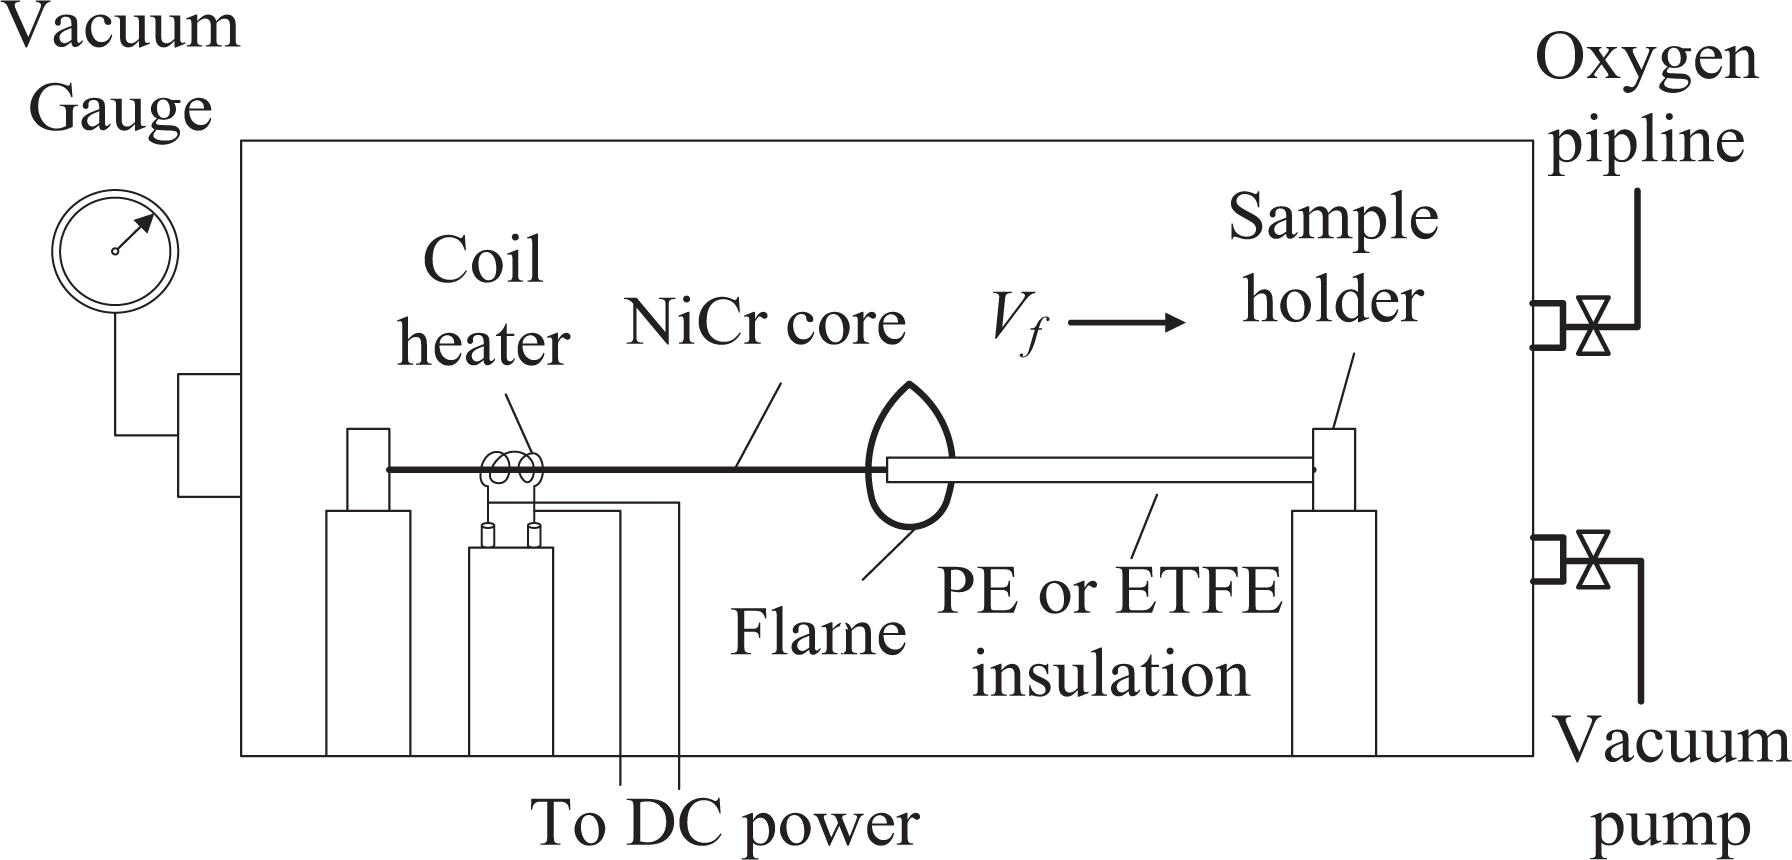
Diagram of the subatmospheric pressure vessel and the wire flame spread apparatus.
PE- or ETFE-insulated NiCr wire samples were placed on the sample holder at the center of the vessel. The core metal diameter of the wire samples was 0.5 mm, the insulation thickness was 0.15 mm, and the wire length was 14 cm.
A coil heater (5 mm diameter and 15 mm wire length) was used as an ignition source, placed on one end of the wire sample. A voltage (6 V) was applied to the coil by a regulated DC power supply and the duration of heating applied by the coil to the wire sample was less than 7 s.
Flame spread images were recorded using a digital single-lens reflex camera (Nikon D7100, [Nikon, Japan], 1920 × 1080 pixels, 30 fps) through the side window of the vessel. All trials were performed in a darkened room to avoid any possible stray light in these images, and each test was repeated at least three times showing a good repeatability.
Table 1 summarizes the physical properties of the NiCr core and the PE and ETFE insulation under standard conditions.
Properties of the NiCr core and PE and ETFE insulation under standard conditions.
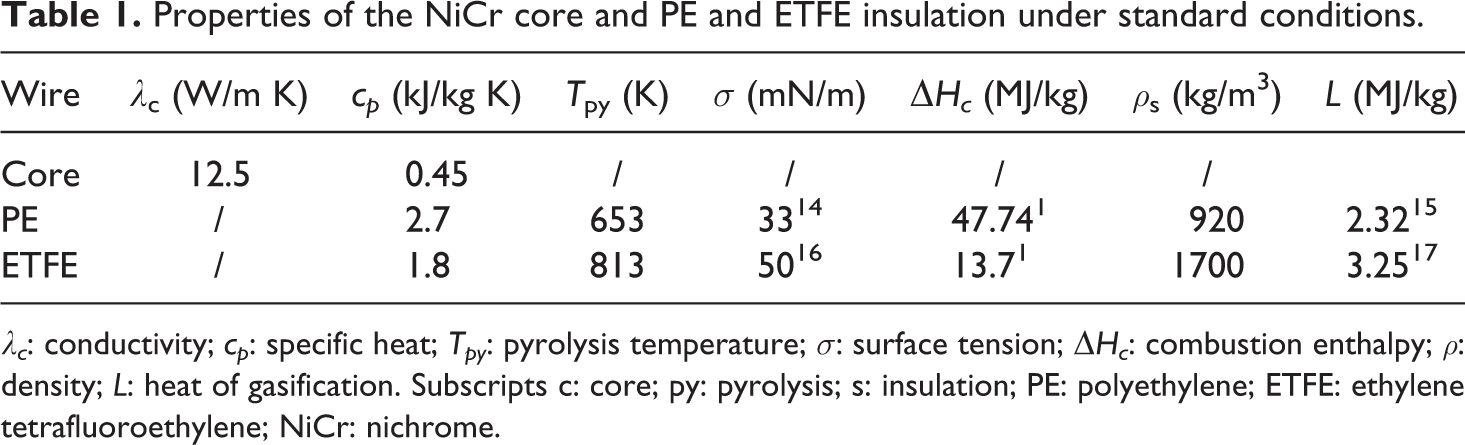
λc: conductivity; cp: specific heat; Tpy: pyrolysis temperature; σ: surface tension; ΔHc: combustion enthalpy; ρ: density; L: heat of gasification. Subscripts c: core; py: pyrolysis; s: insulation; PE: polyethylene; ETFE: ethylene tetrafluoroethylene; NiCr: nichrome.
From the literature, it is known that, for PE-insulated NiCr wire samples, flame spread could be maintained at air pressure higher than 28 kPa given 21% oxygen concentration, 4 while for ETFE-insulated NiCr wire samples, the LOC of flame spread at 100 kPa are about 30% oxygen concertration.1,18
In this study, a preliminary examination was conducted to determine the steady-state flame spread above the flammability limits of the materials. To ensure steady flame spread, oxygen concentrations of 21% and 30% were employed when testing the PE with pressures ranging from 30 kPa to 100 kPa. In the case of the ETFE insulation, the oxygen concentrations were 35% and 50% with pressures in the range of 40–100 kPa.
Results and discussion
Mechanism underlying teardrop-/pentagram-shaped flame
Figures 2 and 3 present images showing the flame spread process of PE and ETFE at various oxygen concentrations and pressures.
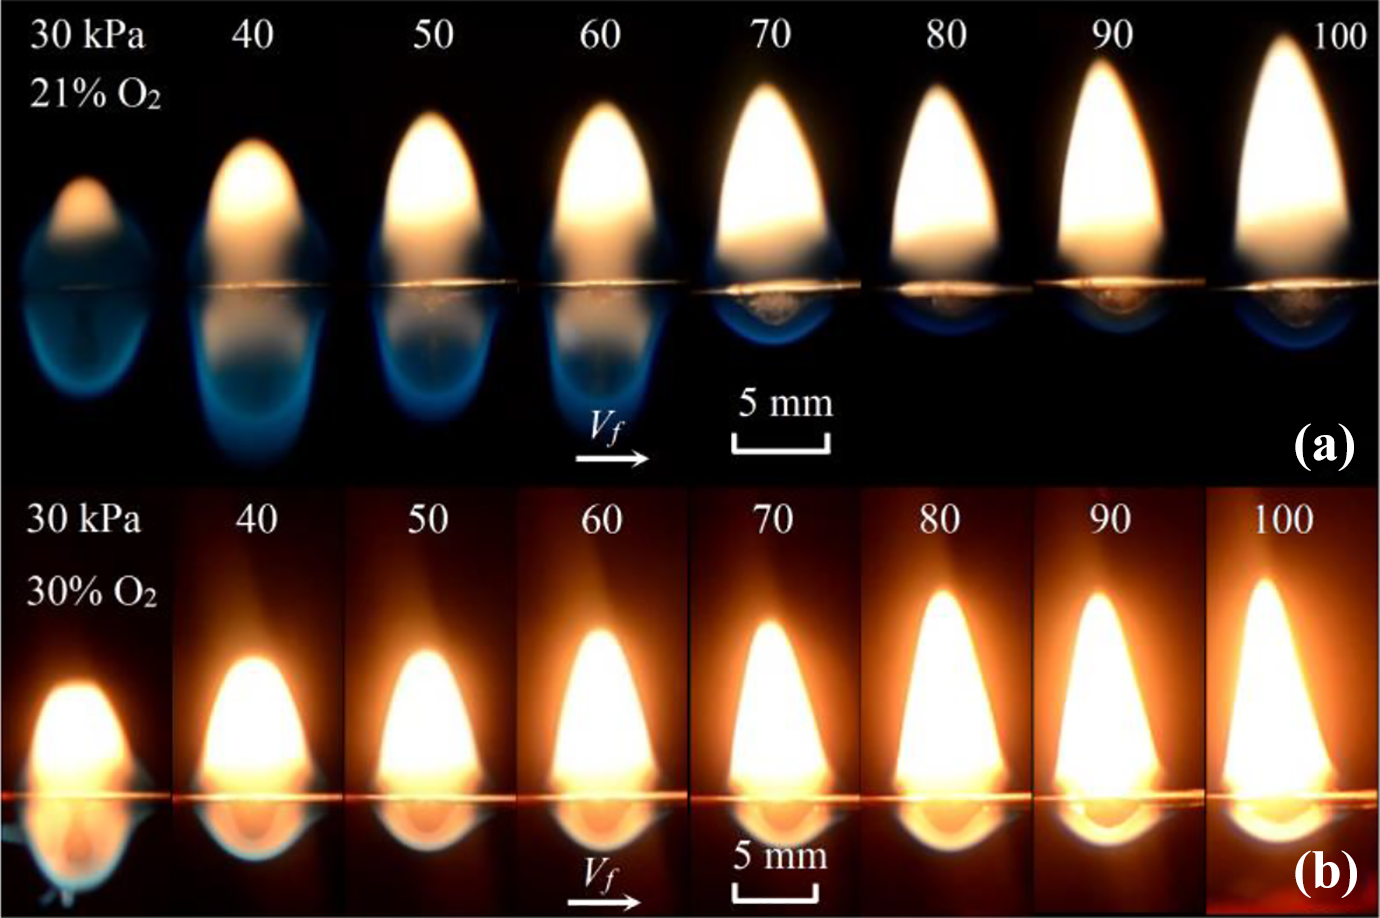
Flame spread of PE insulation at varying pressures at (a) 21% and (b) 30% O2.
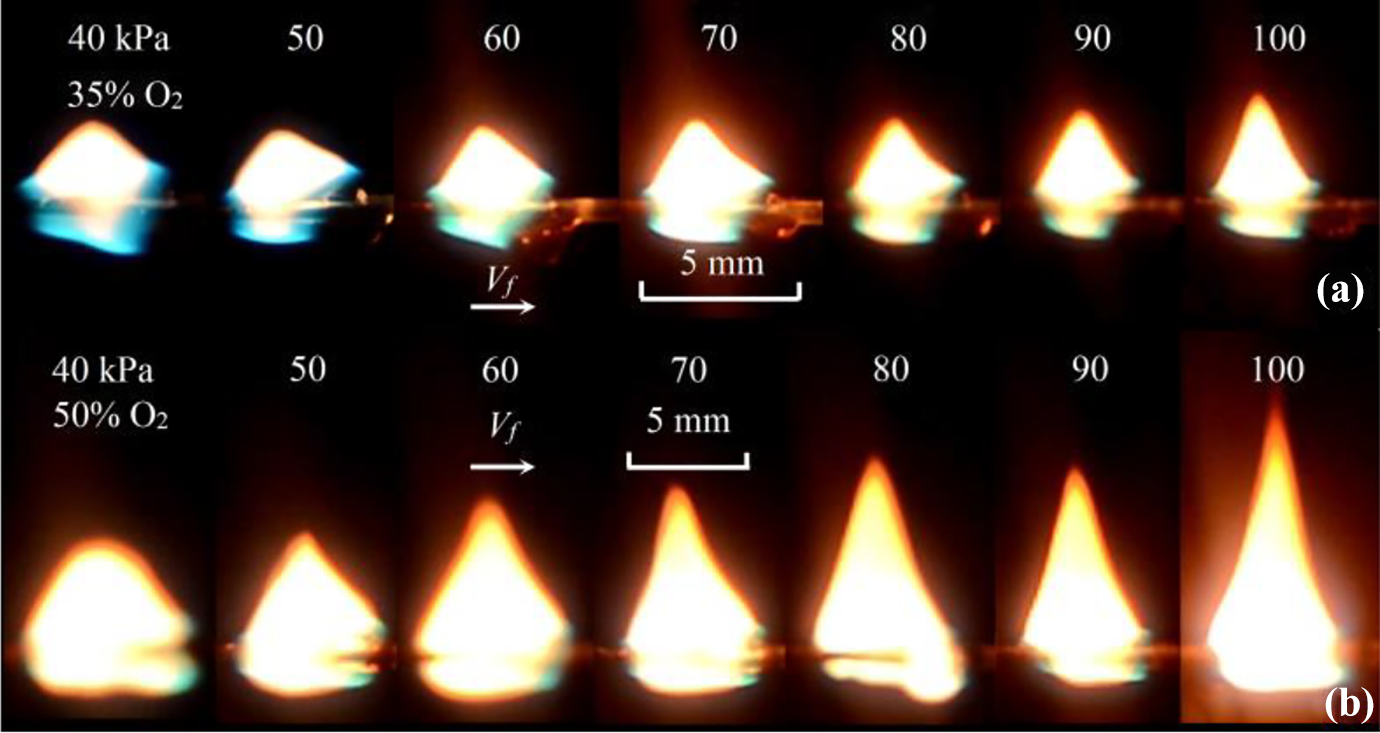
Flame spread of ETFE insulation at varying pressure at (a) 35% and (b) 50% O2.
The typical flame morphologies obtained from PE and ETFE wire insulations are shown in Figure 4. As can be seen in Figure 4(a), in the case of the PE insulation, continuous pyrolysis and melting occurred along the flame spread direction with a bigger droplet hanged on the core inside the flame and a smaller droplet in the flame edge attached to the core. Because the molten polymer viscosity was comparatively low, the continuously melting polymer flowed beneath the core to feed the large droplet, which evaporated and burned. Since the combustion products of PE were primarily H2O and CO2, there was little soot particle deposition on the wire core. As a result, the bare core received sufficient heat feedback from the flame to maintain a high temperature and the flame had minimal heat losses near the core because of small temperature difference. For these reasons, the large flame generated by the droplet had a closed teardrop shape in conjunction with a symmetric flame structure. Due to the buoyancy effect, the soot particles formed above the insulation (in association with luminous radiation), leaving the blue area at the flame bottom nearly soot-free.
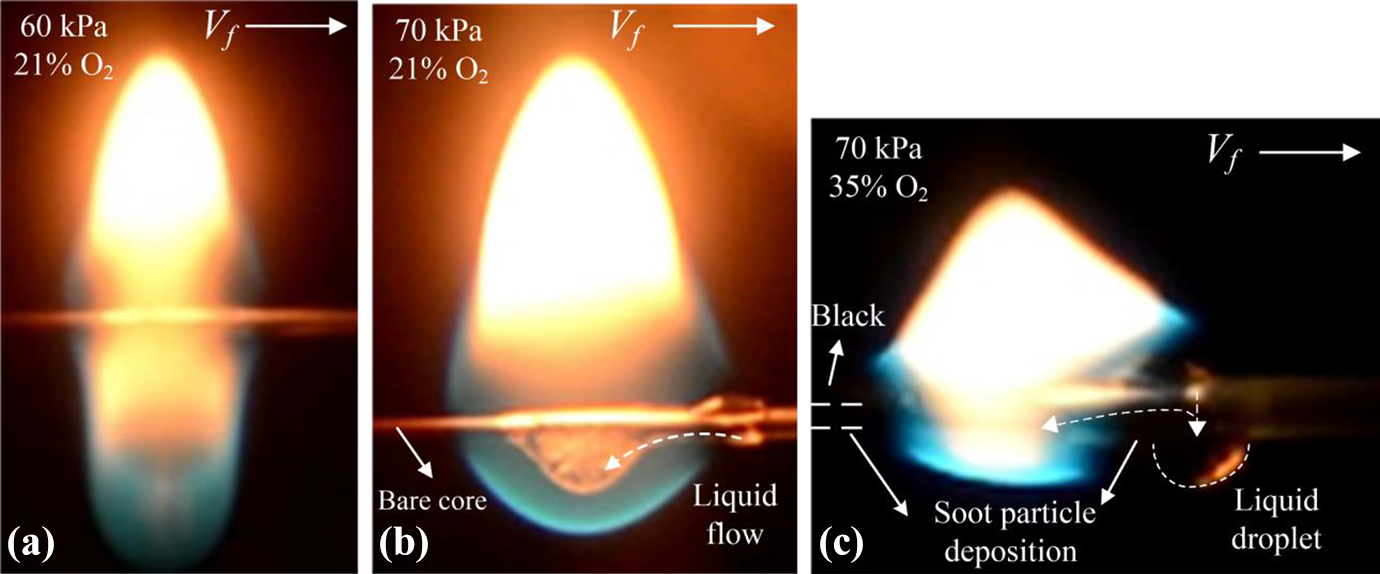
(a) A teardrop-shaped PE wire flame with dripping and (b) without dripping and (c) a pentagram-shaped ETFE wire flame.
As shown in Figure 4(b), in contrast to PE insulation, because the combustion products of ETFE included numerous soot particles, 19 the flame was more luminous as a result of soot particle radiation. Soot particles were also deposited due to thermophoresis on the core of the ETFE wire, which was seen to be blackened in Figure 4(b), such that the surface absorptivity of the core was increased significantly. Correspondingly, the radiative heat transfer from the flame to the core was enhanced, which disrupted the flame envelope so that there were two breaches at both sides. In the spread direction, the heat losses were comparatively large; thus, the flame exhibited an asymmetric pentagram-shaped structure with an inclined lower surface. Similar to the teardrop flame generated by the PE, there were also soot-free blue areas distributed at the lower parts of the flame.
In the case of the ETFE insulation at 35% O2, there was a big liquid unburned droplet hanged on the core outside the flame and a small droplet attached to the bare core inside the flame. That occurs because of the higher pyrolysis temperature of ETFE and more soot particle deposition. The upper insulation outside the flame in the flame spread direction pyrolyzed, melted, and flowed downward to feed into the adjacent, large unburned droplet, while the melting polymer flowed beneath the core to feed the small droplet inside the flame. Without a big supply of new molten polymer, the burning droplet under the core shrunk generated a comparatively small flame.
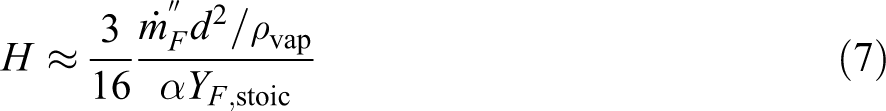
The burning rate of the liquid droplet

where the Spalding number

where h is the convection heat transfer coefficient,
At lower pressure, h is smaller because the convection heat transfer coefficient is proportional to the square root of the pressure (i.e.
For ETFE insulation, it has a smaller ΔHc with bigger L and Xr than those of PE insulation inducing a small B number and a lower burning rate. So, at the LOC condition shown in Figure 3(a) at 40 kPa and 35% O2, ETFE insulation has small heat release rate, besides the soot cooling has a significant effect to form a pentagram structure.
Furthermore, for the ETFE flames at 50% O2 shown in Figure 3(b), as the combustion heat release increased markedly, the flame became wider and the large adjacent droplet joined in the combustion. As a result, the breaches became smaller and irregular, and the pentagram structure of the flame became smooth.
As the mass of the droplet becomes great enough to outweigh the surface tension, the droplet will fall off. In this experiment, dripping was exhibited only by PE insulation. At 21% O2 and below 60 kPa, dripping and flame spread coexisted, while above 60 kPa only, flame spread was evident. When the oxygen concentration was raised from 21% to 30%, the critical pressure for dripping shifts from 60 kPa to 38 kPa.
At the critical condition, when the semispherical droplet falls off, assuming the contact area between the droplet and the wire insulation is π(dcr/2)2, it has a pressure difference with the surface tension of 2σ/(dcr/2). Here, σ is the surface tension of the liquid droplet and dcr is the critical diameter of the semispherical droplet at which the dripping occurs. The surface tension is balanced by the gravity as follows:

Thus, the critical droplet diameter can be expressed as follows:
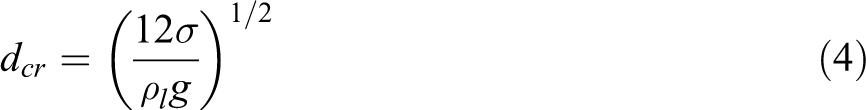
For PE insulation, at lower pressure, the burning rate was lower with smaller droplet consumption, which enhanced the increase of the droplet to surpass the critical diameter, therefore, the dripping occurred. For ETFE, as the surface tension had a significant increase at a lower temperature,14,21 the adjacent big droplet outside the flame did not drip.
What’s more, with an increase in oxygen concentration, the B number increases, as well as the burning rate. That is to say, with given air pressure, the droplet burns more quickly and more difficult to grow above the critical diameter in higher oxygen concentration. 7 Based on equation (4), the critical diameter is related to the surface tension that is proportional to the pressure and inversely proportional to the temperature. The higher the oxygen concentration, the higher the temperature and the smaller the critical diameter. So, for PE, the critical pressure for dripping shifts from 60 kPa to 38 kPa, as oxygen concentration increases from 21% to 30%.
Flame height and width
A digital image processing program based on OTSU algorithm was used to demarcate the flame edge that separated flame from the background, as applied by Tu et al. 22 and Fang et al. 23 The flame widths (W) and heights (H) were the time-average value over the entire spread. For the conditions that generated dripping, these values were determined and averaged under the steady-state conditions before dripping. The flame widths and heights were summarized in Figure 5.
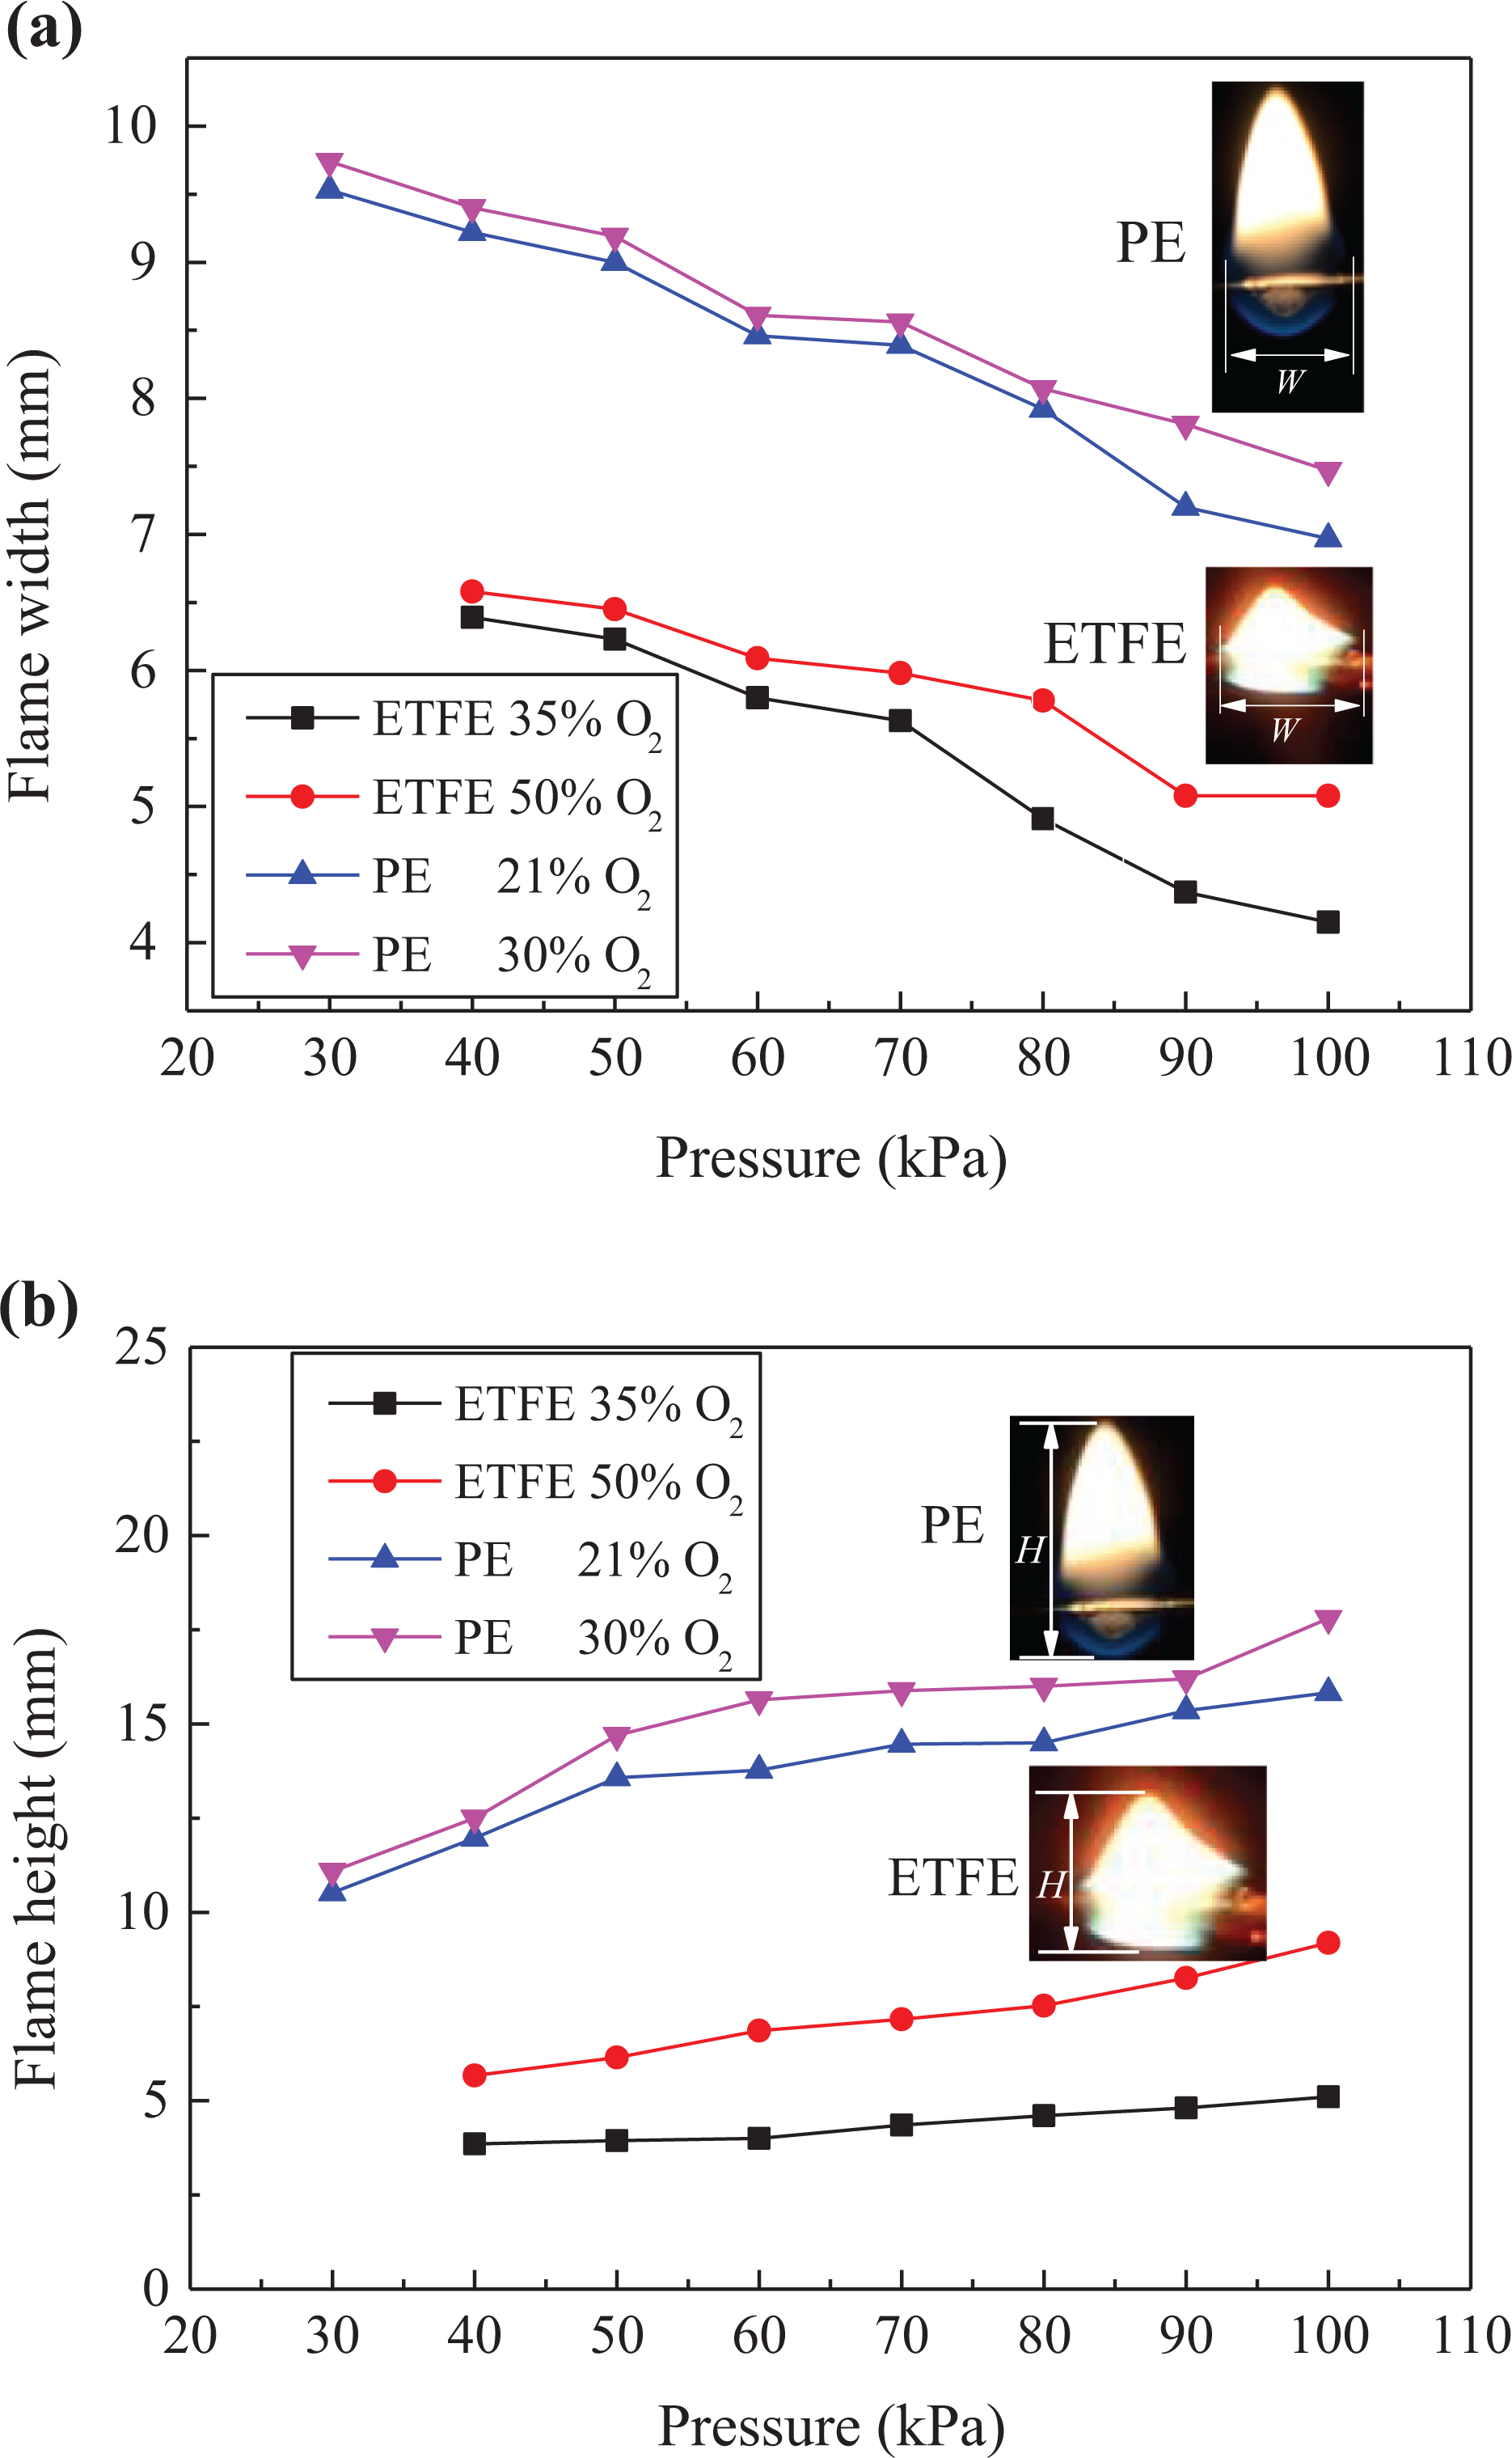
Flame (a) widths and (b) heights of PE and ETFE insulations at varying pressures and O2 levels.
The fitting relationships between W and H, and p and
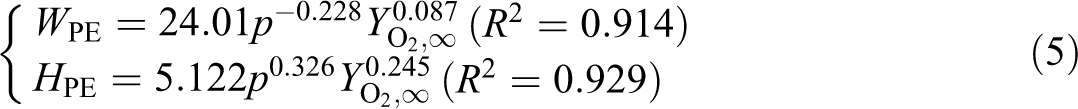

It can be seen that the air pressure has a positive effect on flame heights but a negative effect on widths, while the oxygen concentration has a positive effect on both the flame heights and widths.
The diffusion flame height can be expressed as follows 24 :
where d is the diameter of the semispherical droplet, α is the diffusion coefficient, and
Unlike flame height that is mainly controlled by the buoyancy, the flame width is mostly dominated by the diffusion in horizontal direction, which can be expressed as follows:

where τ is the diffusion time. As
FSR
FSR data were obtained by image analysis of the moving velocities of the flame fronts. When there was no dripping, the flame spread was very steady and easy to measure. In contrast, under conditions that generated dripping of PE, the average FSR was determined from the slope of the distance traveled against time.
The FSR values for PE and ETFE are plotted against oxygen concentration and pressure in Figure 6, where the vertical slash indicates the critical pressure value that determined dripping of the PE.
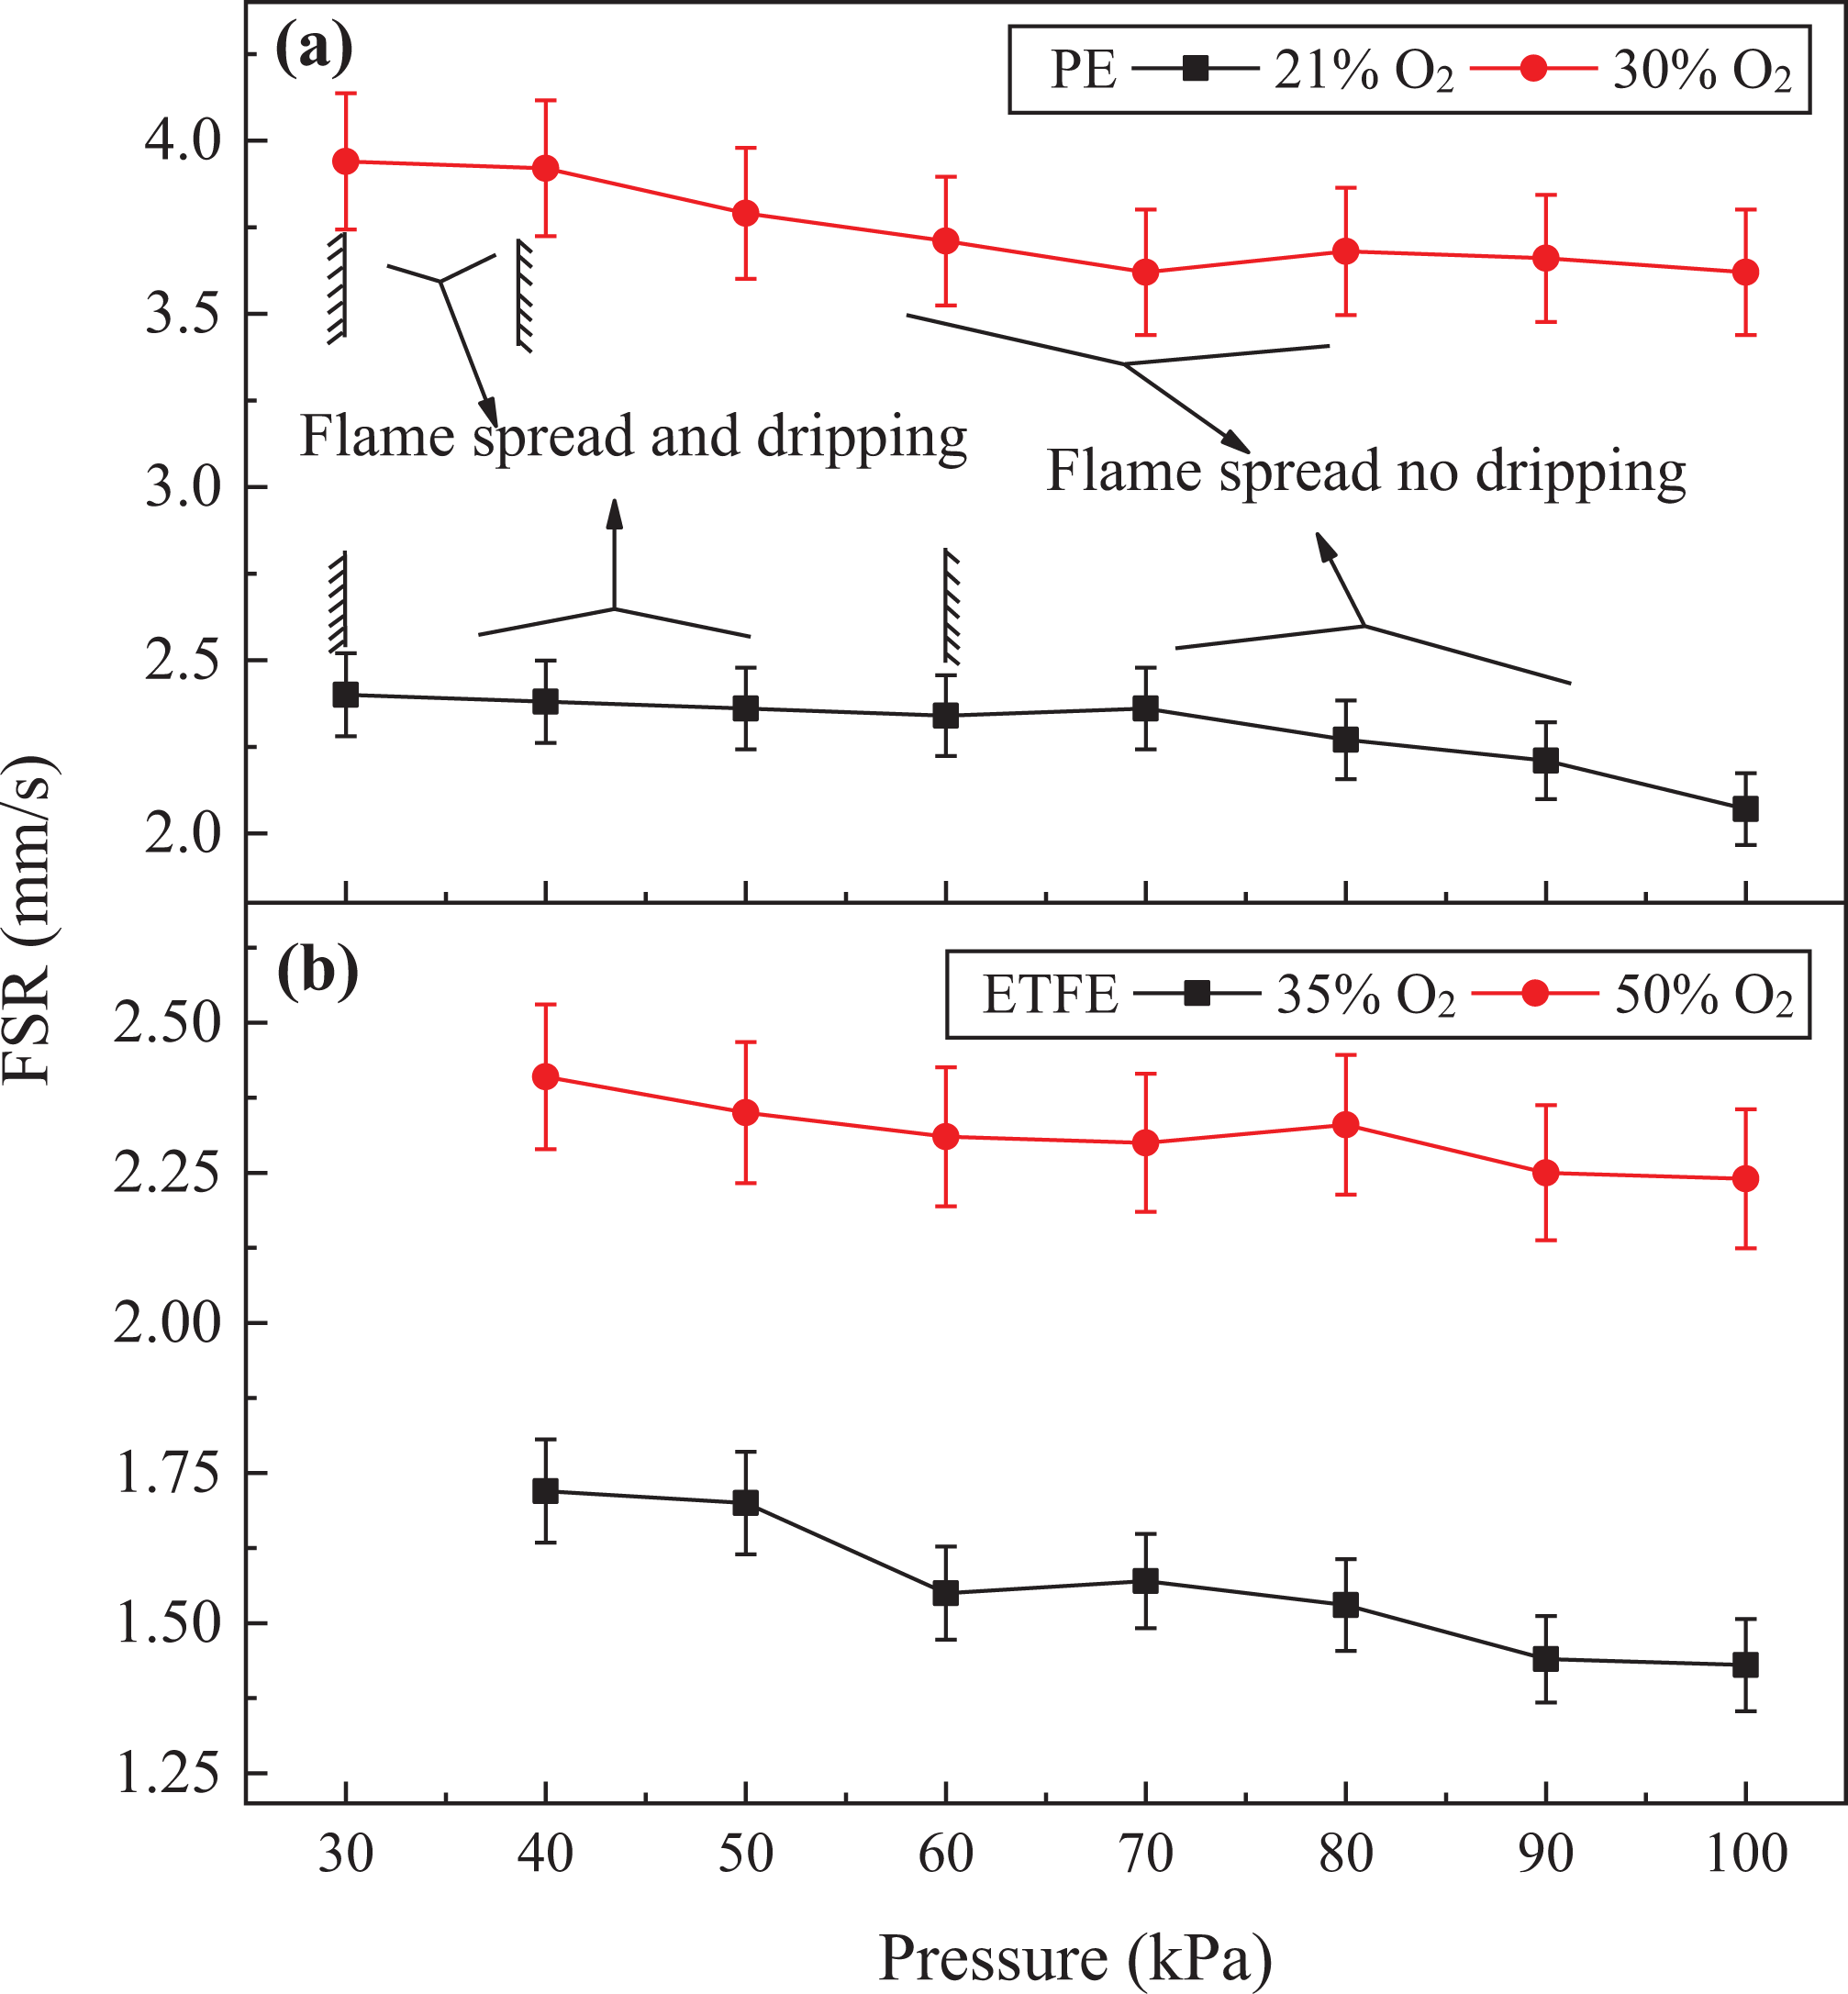
FSR values for (a) PE and (b) ETFE at various pressures and oxygen concentrations.
The FSR (Vf) data shown in Figure 6 were fitted as in the following equation (9):

It shows that the FSR decreases slightly with increasing air pressure while increases with oxygen concentration.
For the case of fire spread in wire insulation, the core material has a significant effect on the FSR. For NiCr wire, the slight decrease in FSR with pressure can be attributed to the properties of the core material. As discussed by Nakamura et al., 4 the low conductivity of the NiCr core means that the gas phase length scale is greater than the solid phase length scale, so the heat sustaining the FSR comes more from the flame than the core. This mode is known as “flame driven.” But the reason for the higher FSR of “flame driven” is not fully understood.
The FSR can be described as in the following equation:
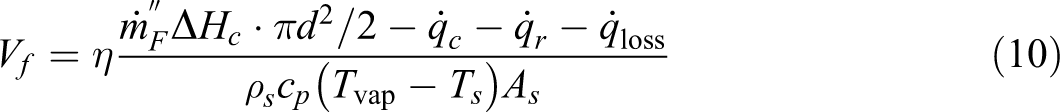
where
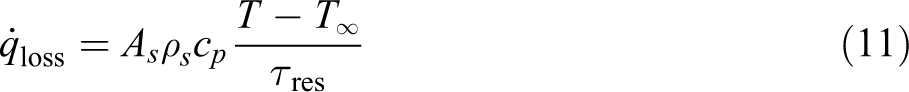
where the resident time τres is proportional to the ratio of the square of the boundary layer thickness δ (
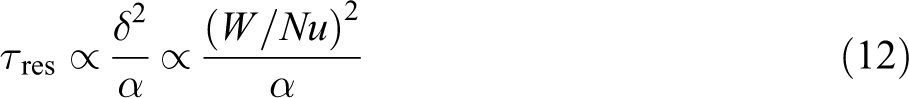
where Nusselt number for the cylinder wire is Nu =hd/k.
So, equation (11) can be rewritten as follows:
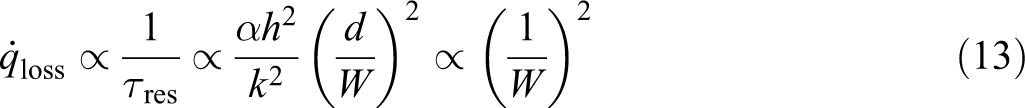
where
Combining equations (1), (10), and (13), at lower pressure,
In addition, the FSR values of the PE are generally larger than those for the ETFE insulation under the same pressure. The combustion enthalpy value of PE is bigger, while its density and pyrolysis temperature are lower (Table 1), such that the FSR of PE is bigger than that of ETFE.
Conclusion
In the case of PE-insulated wire, the continuously melting liquid formed in the flame spread direction flows underneath the core and generates a large droplet inside the flame, where dripping occurs usually at lower pressures. The combustion of this droplet produces little soot to deposit on the bare core, and thus, the flame exhibits minimal heat losses near the core. As a result, a closed teardrop-like droplet forms with a symmetric flame structure.
At the LOC conditions, during the combustion of ETFE wire insulation, a large unburned droplet forms outside the flame. Plenty of soot particles are deposited on the wire core, which increases the surface absorptivity. The uneven heat losses at the flame sides give the flame an asymmetric pentagram-like structure. ETFE insulation has smaller heat release rate resulted from a smaller B number and a bigger latent heat, besides the soot cooling has a significant effect to form a pentagram-shaped flame.
For both insulations, as the pressure rises, the flame becomes thinner and taller inducing more heat loss, while as oxygen concentration increases, the flame becomes bigger due to stronger combustion with bigger B numbers. Increasing oxygen concentration and pressure produces more luminous flames.
At lower pressure,
Footnotes
Funding
The author(s) disclosed receipt of the following financial support for the research, authorship, and/or publication of this article: National Natural Science Foundation of China (grant numbers: 51576186 and 51636008), NSFC-STINT joint project (grant number: USTC-Lund University), Key Research Program of the Chinese Academy of Sciences (grant number: QYZDB-SSW-JSC029), Fundamental Research Funds for the Central Universities (grant number: WK2320000042), and Anhui Provincial Natural Science Foundation (grant number: 1908085QE205). Jun Fang expresses sincere appreciation to Prof. Forman A. Williams for his valuable suggestions.