
Abstract
Biodegradable polymer blends were prepared by melt blending poly(lactic acid) (PLA), poly(butylene adipate-co-terephthalate) (PBAT), and organic-modified montmorillonite (MMT). The effects of MMT on the structure, morphology, thermal, and mechanical properties of the blends were thoroughly investigated. The results revealed that MMT was preferable to localize on the interface of PLA and PBAT and esterification reaction took place between organic-modified MMT and PLA/PBAT. MMT enhanced the compatibility of PLA and PBAT, accelerated crystallization, and improved the thermal stability of PLA and PBAT. In addition, MMT illustrated the reinforcing effects on PLA and PBAT in their tensile strength, especially for PBAT.
Introduction
Bio-based and biodegradable polymer materials are getting greater attention from people around the world in recent decades for the great white pollution caused by petroleum-based polymers. 1 Poly(lactic acid) (PLA), a linear aliphatic thermoplastic polyester, originates from bio-based materials like corn and starch and possesses excellent biodegradability. PLA is getting more and more attention as it possesses not only the advantage of high strength and modulus like poly(ethylene terephthalate) and polystyrene but a relatively lower price compared with other commercial biodegradable materials like poly(butylene succinate) (PBS), poly(caprolactone) (PCL), and poly(butylene adipate-co-terephthalate) (PBAT).2,3 All of this makes PLA the most potential alternative to traditional petroleum-based plastics in the packaging and medical fields. However, low distortion temperature and inherent brittleness significantly limit its industrial implementation in various applications, particularly in durable applications such as automotive, electronics, and semi-structural parts.4–7
To overcome brittleness and widen the application of PLA, previous researchers used some plasticizers like polyethylene glycol (PEG), glucose monoesters, partial fatty acid esters, and thermoplastic elastomer such as thermoplastic polyurethane (TPU) to toughen PLA. 8 After the addition of plasticizers or elastomers, the elongation at break and impact strength have been greatly improved. 6 However, these plasticizers and elastomers like polyethylene, PEG, thermoplastic polyolefin, or TPU are nondegradable, which means that toughening PLA with these materials sacrifices the biodegradability of the final product of PLA blends.
Therefore, in order to toughen PLA without losing the biodegradability of the final product, many researchers adopted PBS, PCL, PBAT, and thermoplastic starch as plasticizers to toughen PLA.3,9–13 In our study, PBAT was chosen. It is a biodegradable aromatic aliphatic copolyester synthesized from adipic acid, terephthalic acid, and succinic acid. Excellent ductility and good toughness make it a potential candidate for toughening PLA.
In the past several decades, there has been a growing interest in researching PLA and PBAT, not only for scientific research but also for durable applications of packaging and agricultural films. Dil et al. 14 thoroughly studied the surface morphology and incompatibility of PLA and PBAT. It is found that PBAT exists a one-way partial miscibility in the PLA-rich phase, and they attributed this partial miscibility to the various entropy of mixing. Yeh et al.15,16 studied the compatibility and crystallization properties of PLA and PBAT and found that PBAT could be miscible with PLA molecules when PBAT contents did not exceed 2.5%. Gu et al. 17 found that incorporation of PBAT increased the viscosity and reduced the flow activation energy of the blend. Considering their immiscible nature, one great change is enhancing the compatibility of PLA and PBAT. Al-Itry et al. 3 prepared a thermally stable blend of PLA and PBAT with the presence of a chain extender named Joncryl ADR-4368 which is produced by BASF, Ludwigshafen, Germany. Viscosity and molecular weight increased with the addition of chain extender. Ma et al. 1 prepared in situ compatibilized PLA-PBAT blends with the presence of dicumyl peroxide (DCP) as a free-radical initiator. The incorporation of DCP initiated free radicals of PLA and PBAT and results in the formation of a PLA-g-PBAT copolymer. Zhang et al. 18 found that the strength and toughness of PLA/PBAT blends were greatly improved with glycidyl methacrylate as a reactive processing agent. In addition, a better phase morphology and higher storage modulus were obtained.
Traditionally, we use organic compatibilizers, as described above, to enhance interface connection, but actually, polymer performance could be strengthened by filling nanoparticles such as montmorillonite (MMT), calcium carbonate and silica. Dissimilar to traditional polymeric compatibilizers, nanoparticles could be readily incorporated into polymer via blending. In addition, the incorporation of nanoparticles can generate high-performance materials integrating the merits of both polymer blends and nanocomposites. In the last few years, organo-clays, such as organo-MMT (OMMT), have been used by many researchers as compatibilizers for immiscible polymer blends.19–26 Ojijo et al. 22 studied the mechanical and thermal properties of PLA/PCL blends employing OMMT as compatibilizer through melt blending, and they found that the presence of OMMT promoted the mechanical and thermal properties of PLA/PCL blends. Besides, they found that the addition of OMMT reduced the domain size of phase-separated particles and increased interface adhesion.
Dil and Favis 27 studied the localization of micro- and nano-silica particles at the interface of PLA and PBAT. It shows that silica particles were localized in the PBAT phase rather than the PLA phase due to the lower interfacial tension of PBAT and silica. Jiang et al. 28 explored the effects of nano calcium carbonate (NPCC) and OMMT on PLA, and it found that OMMT was successfully intercalated by PLA when less than 5% of OMMT was added. Both NPCC and OMMT showed clear stress yielding and higher elongation at break. Nofar et al. 29 explored the effects of organo-clay and its contents on PLA and PBAT. The results showed that organo-clay could work as a droplet coalescence barrier and stabilized the blend morphology under shear flow to decrease the degradation of PLA in processing.
In this work, we prepared PLA/PBAT/MMT nanocomposites through melt blending. We investigated the effect of MMT on structure, morphology, thermal, and mechanical properties. In addition, the influence of PLA/PBAT blends with various weight ratio on the properties of ternary PLA/PBAT/MMT blends was thoroughly studied.
Experimental
Materials
PLA (4032D) was purchased from Natureworks LLC, Blair, Nebraska, USA. It is a semicrystalline material, containing 98% of L-lactide and 2% of D-lactide units. PBAT (Ecoflex FBX 7011) was supplied by BASF. MMT clays Cloisite 20A (C20A), which was organic modified with a quaternary ammonium salt, was obtained from Southern Clay Product, Inc., Gonzales, Texas, USA.
Equipment and sample preparation
All of the samples were melt prepared by an internal batch mixer, DDRV501 Brabender (C. W. Brabender Instruments, Inc., South Hackensack, New Jersey, USA). Prior to melting blending, PLA and PBAT were dried in the oven at 80°C for 8 h to remove the moisture content. MMT was dried at 100°C for 10 h. PLA and PBAT were first fed into the mixing chamber with the temperature set at 180°C and mixed for 1 min at a rotation speed of 20 r min−1. Then, MMT was poured into the chamber and mixed for an additional 10 min at a rotation speed of 80 r min−1. Finally, the samples were hot-pressed into various shapes using a compression-molding machine (QBL-350, Wuxi No.1 Rubber & Plastics Mechanical Co. Ltd, China) to prepare specimens for further characterization.
Characterization
Fourier transform infrared (FTIR) spectroscopy was used to investigate the chemical structure of PLA/PBAT/OMMT nanocomposites through an FTIR spectrophotometer (Bruker vector3, Germany). The samples were recorded at 16 consecutive scans with a resolution of 4 cm−1 within the wave numbers from 4000 cm−1 to 400 cm−1.
X-ray diffraction (XRD) measurements were performed by an X’Pert PRO (PANalytical, Malvern, United Kingdom) powder diffractometer at a generator voltage of 40 kV and a tube current of 40 mA with a copper Kα radiation (wavelength, λ = 0.154 nm). The samples were scanned at a scan step size of 0.01313° with the diffraction angle 2θ from 1–10°.
Differential scanning calorimeter (DSC) study was conducted on a Netzsch DSC204 (Germany) under a nitrogen atmosphere. Samples of 6–10 mg were used in this test. The samples were first heated from room temperature to 200°C at a rate of 10°C min−1 and then held at that temperature for 3 min to eliminate the thermal history. After that, the samples were cooled to 30°C at a rate of 10°C min−1, followed by a second heating from 30°C to 200°C at a rate of 10°C min−1.
Thermogravimetric analysis (TGA) was used to characterize the thermal stability of PLA, PBAT, and their nanocomposites by using a TGA equipment (Netzsch TG209, Germany). Samples about 5 mg were heated from 25°C to 600°C at a rate of 10°C min−1. A nitrogen atmosphere was used to protect the samples from oxidation.
Scanning electron microscopy equipment (S-3700 N, Hitachi, Japan) was used to observe the morphology of the blends under the operating voltage of 5 kV. Before observation, the samples were sputtered with a thin layer of gold.
The dispersion of MMT in PLA and PBAT matrix was assessed with a transmission electron microscopy (TEM) (JEM 2100F, JEOL, Japan) under the operating voltage of 200 kV.
The tensile and impact properties of the PLA/PBAT/MMT nanocomposites were measured by an Instron 5566 tester (Instron Engineering Corporation, Norwood, Massachusetts, USA) and an Izod Impact Tester (Zwick 5117, Zwick GmbH, Ulmer, Germany), respectively, according to ASTM D638 and ASTM D256. The crosshead speed was 20 mm min−1 in each round of the tensile test at room temperature. The samples for tensile tests were compression-molded into dumbbell-shaped sheets with 1 mm in thickness, 75 mm in length, and 4 mm in width. The specimens for impact tests were 4 mm in thickness, 80 mm in length, and 10 mm in width.
A contact angle analyzer Dataphysics OCA 15, Filderstadt, Germany was used to obtain the contact angle of PLA and PBAT. The surface energy of the components can be calculated according to Young’s equation:

where γLV and γSV represent the interfacial energies of the solid and liquid against their saturated vapor, and γSL represents the interfacial energies between the solid and liquid.
Results and discussion
Structure analysis
The composition of PLA/PBAT/MMT nanocomposites was identified by FTIR and the results are presented as Figure 1. The peaks at 465 and 520 cm−1 are visible at the nanocomposites and corresponding to Al–O and Si–O groups of MMT, respectively. 30 The peaks of 1471 cm−1 proved the existence of the amine group of organ-modified clay (C20A). 31 MMT fillers contain many polar groups, such as hydroxyl groups and carboxyl groups, which are uniformly distributed along the MMT bulk structure and that tend to cause some polar interactions with PLA and PBAT. With the addition of MMT, the peak intensity at 3644 cm−1 declined significantly. This confirmed the presence of an esterification reaction between MMT and PLA/PBAT.
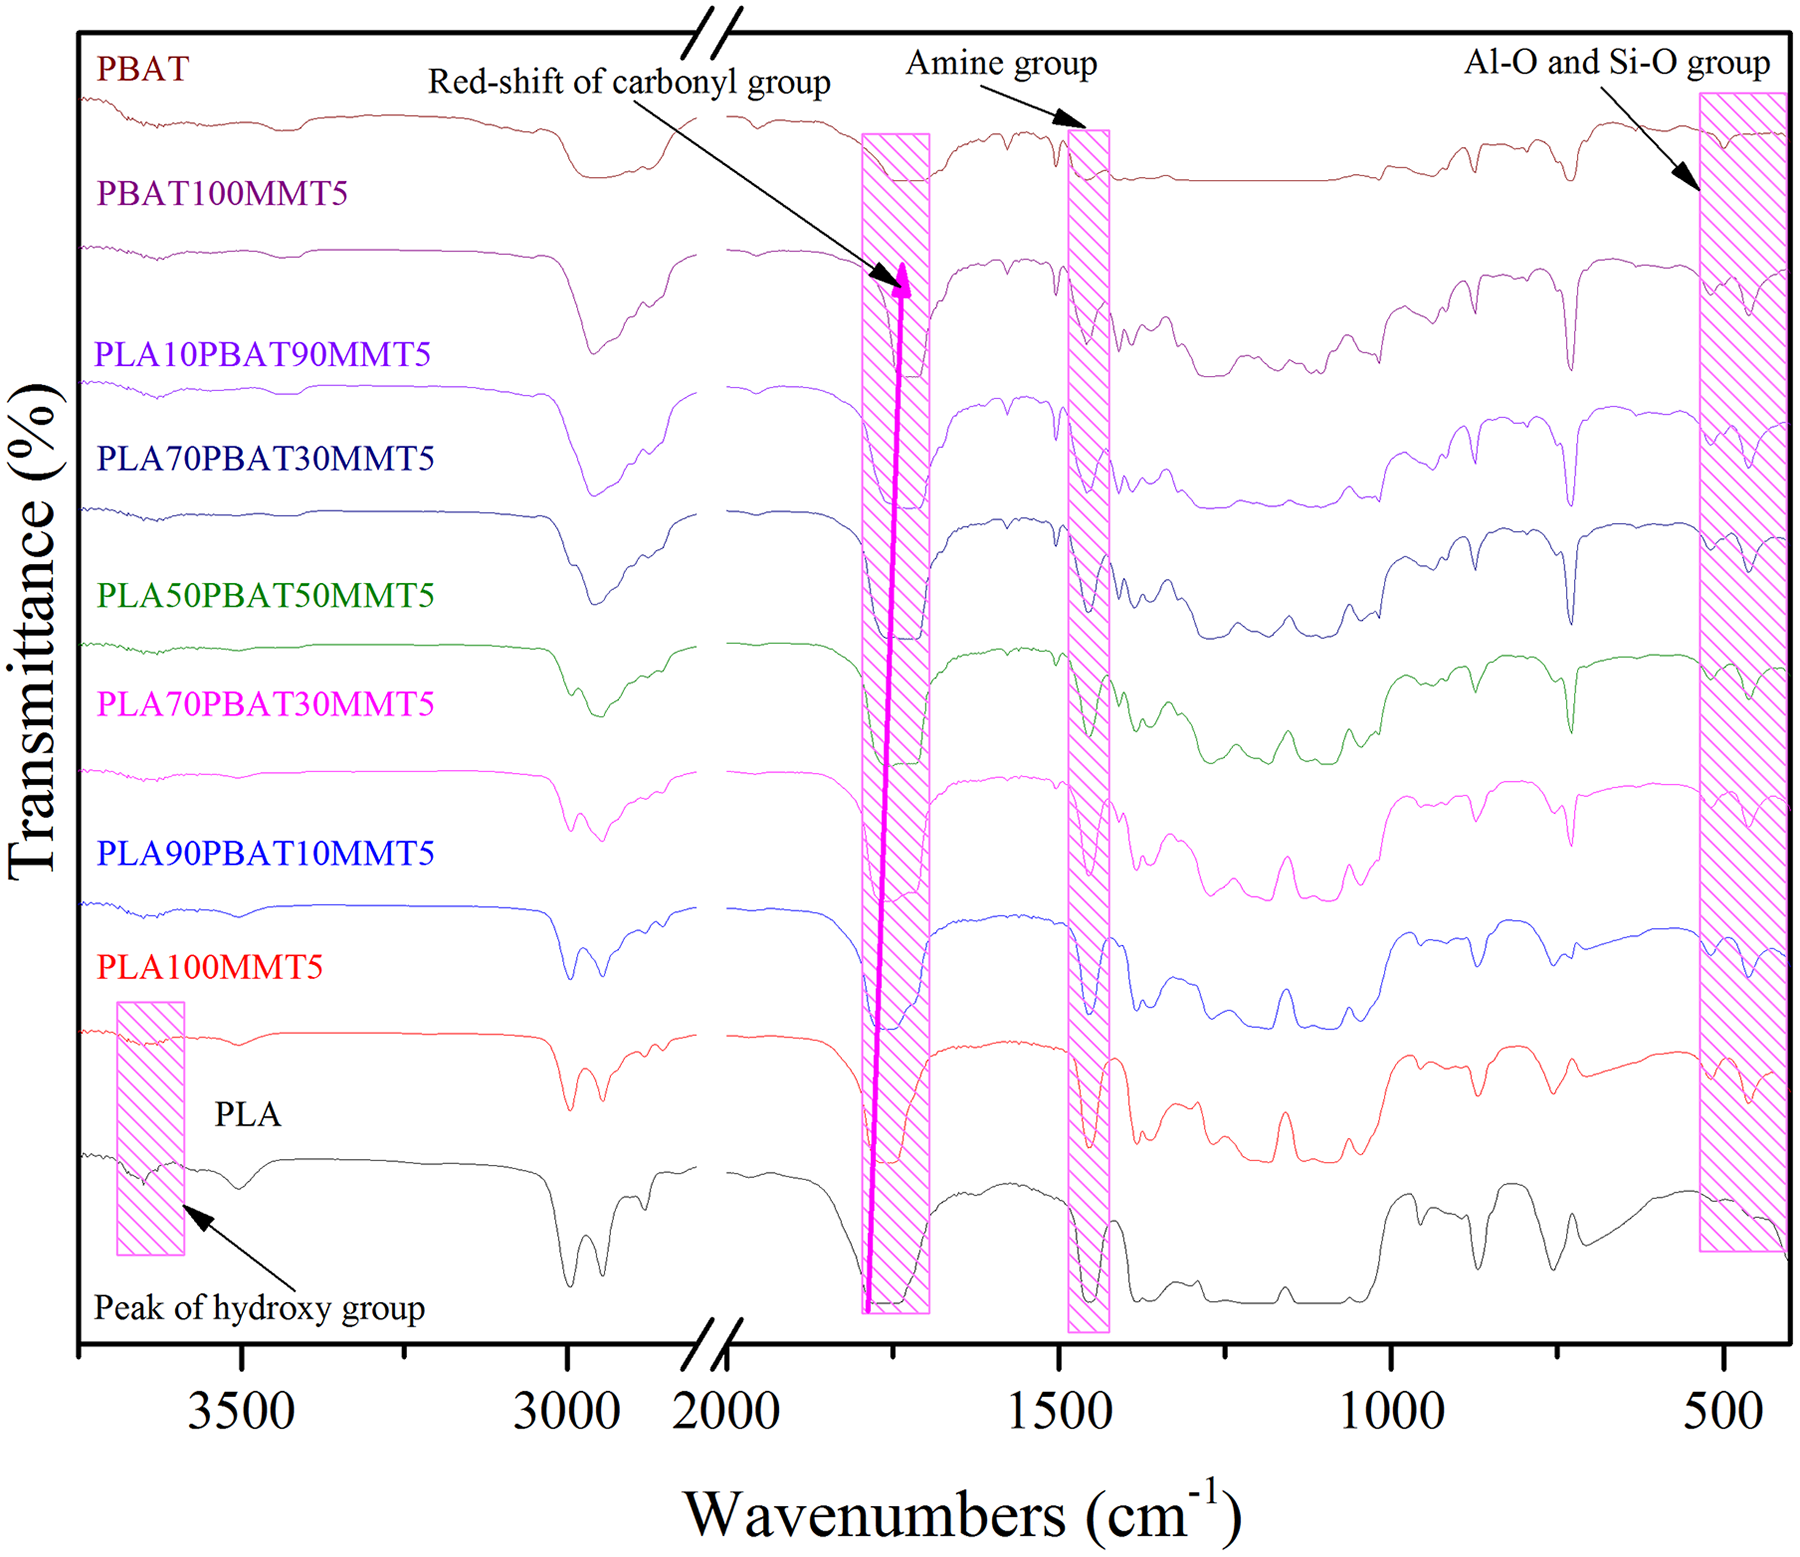
FTIR patterns of PLA/PBAT/MMT nanocomposites with different weight fraction.
All of the system could observe a strong peak at 1710–1770 cm−1, which is the characteristic peak of carbonyl group in the ester bond. However, with the addition of MMT, the area of the characteristic peak of PLA and PBAT is somewhat reduced. Because the addition of MMT greatly promotes the shearing of the system, thereby accelerating the degradation of PLA and PBAT during the mixing process, and ultimately reducing the strength of the ester group. Also, the addition of MMT and PBAT caused the characteristic peak of the carbonyl group in the PLA ester bond to move toward the direction of low wave number, indicating that the structure of PLA was somewhat destroyed by MMT and PBAT, causing the structural stability lowered.
Dispersibility analysis
To investigate the distribution of MMT in PLA, PBAT, and their blends, an XRD pattern was obtained, as shown in Figure 2. Table 1 summarizes the statistical values of the interlayer spacing and relative intercalation of MMT in the corresponding blends. The interlayer spacing (d-spacing) and relative intercalation were obtained according to the following two formula 32 :
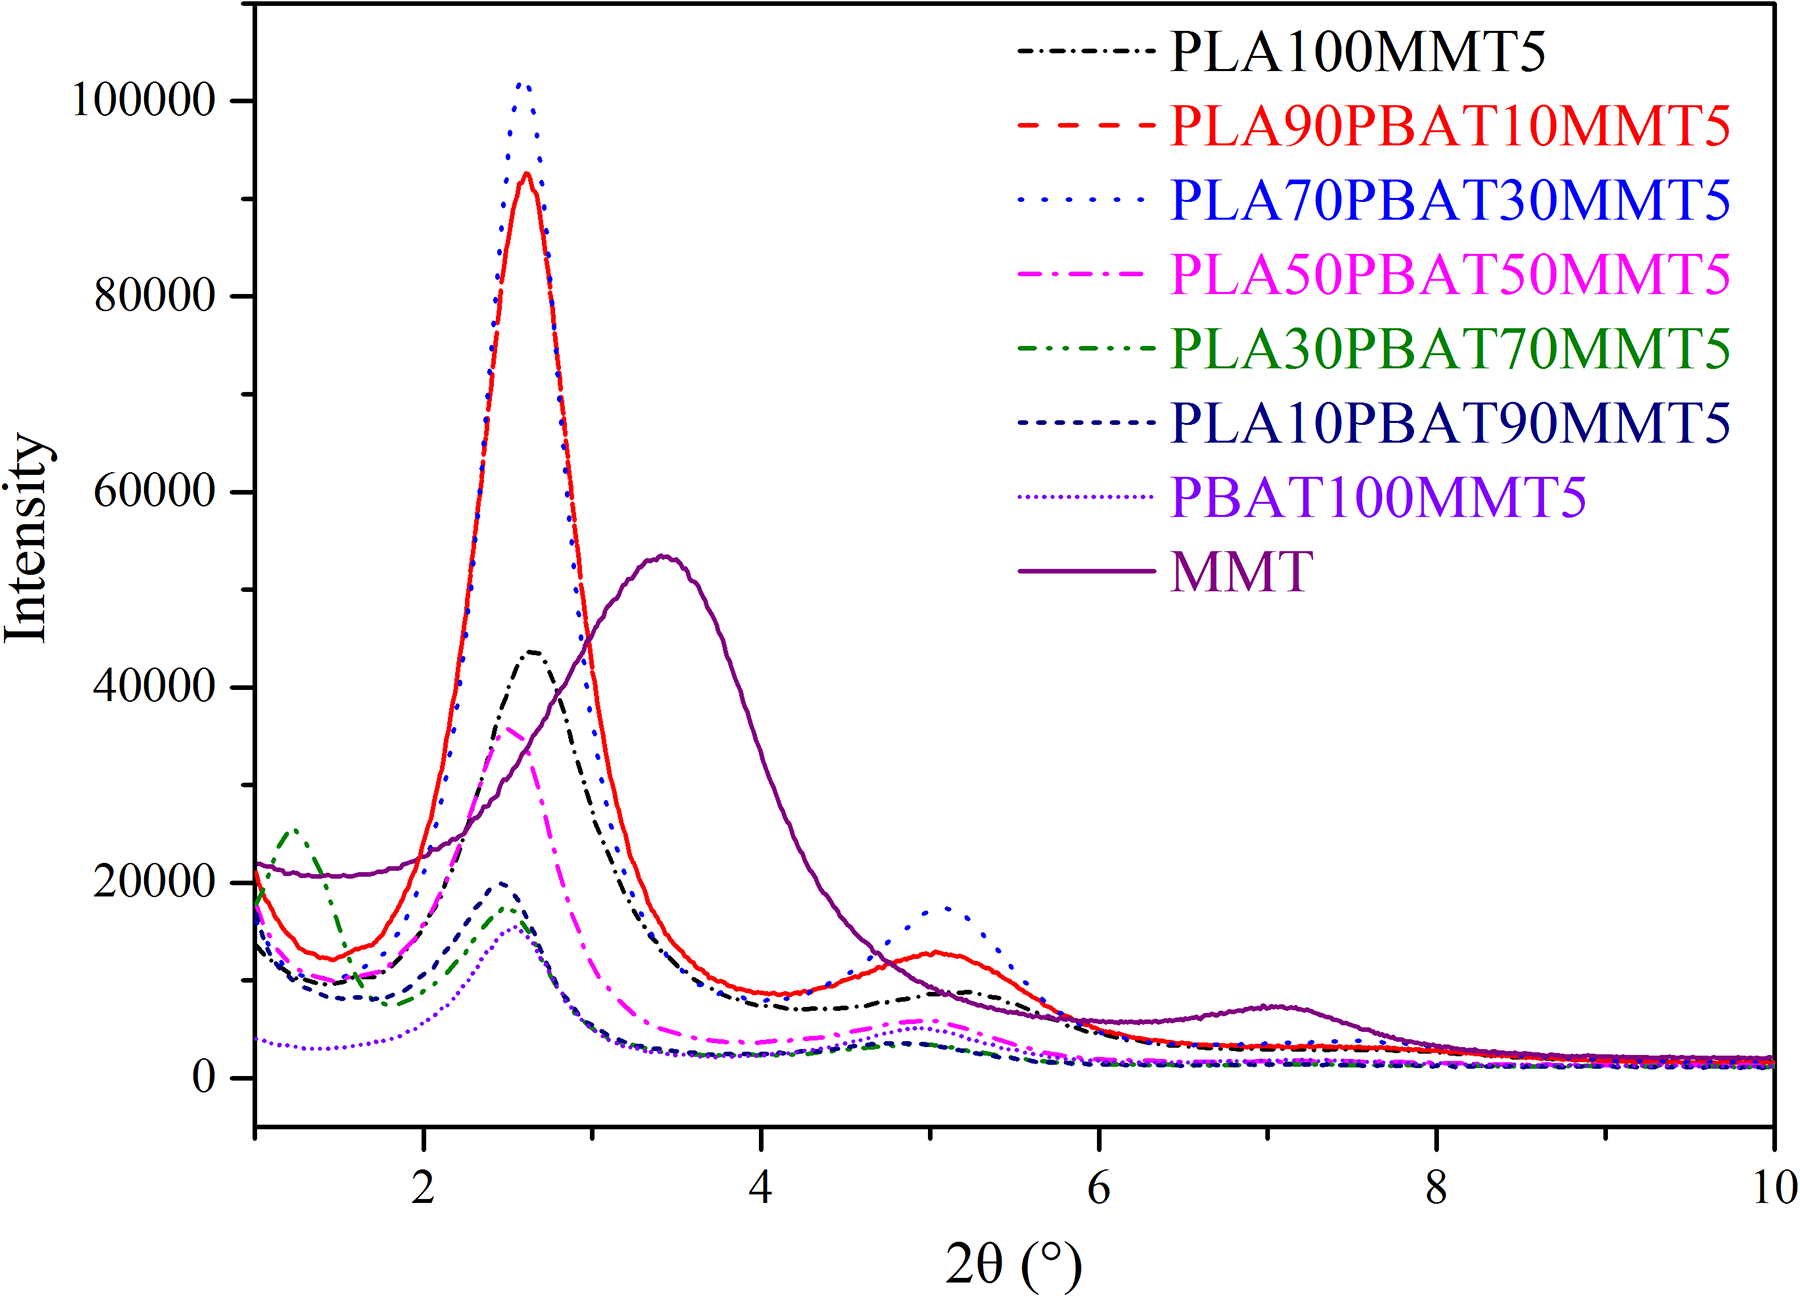
XRD patterns of PLA/PBAT/MMT nanocomposites with different weight fraction.
Interlayer spacing and relative intercalation of MMT in the blends.
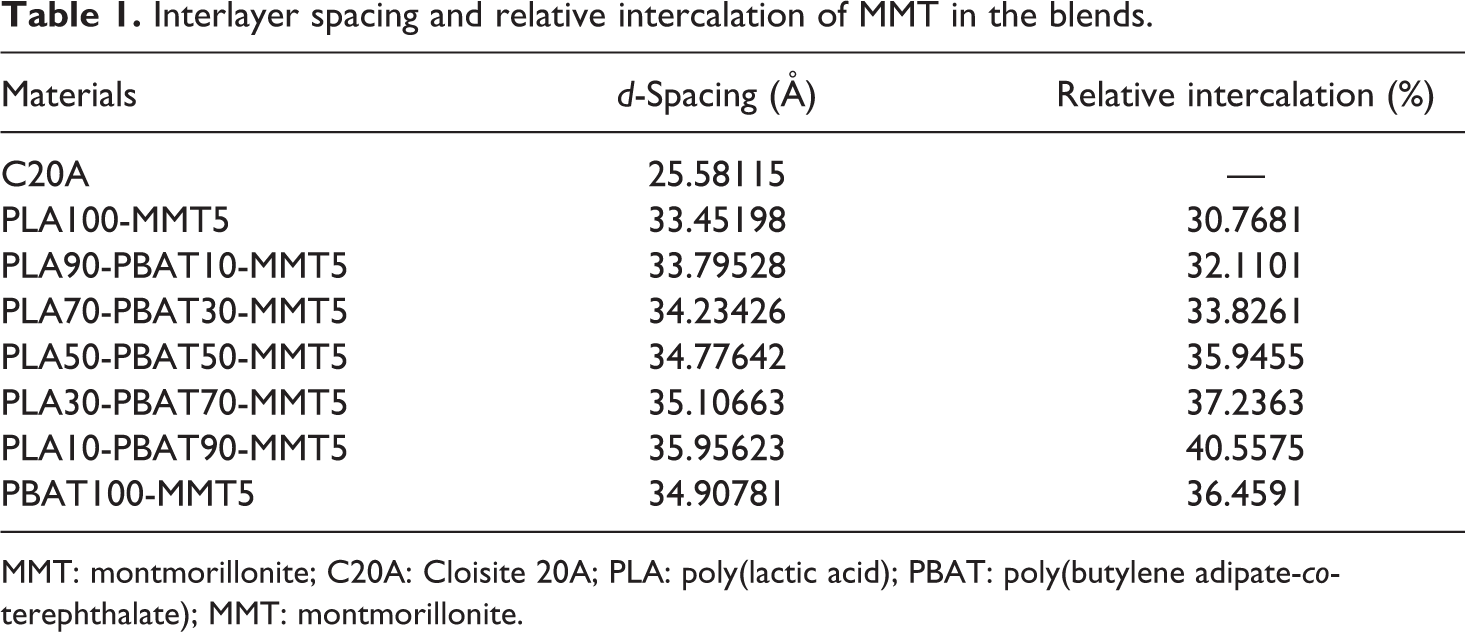
MMT: montmorillonite; C20A: Cloisite 20A; PLA: poly(lactic acid); PBAT: poly(butylene adipate-co-terephthalate); MMT: montmorillonite.


where n represents the number of wave numbers (n = 1), λ is the wavelength of the X-ray radiation (λ = 0.154 nm), d refers to the interlayer spacing of two consecutive diffraction lattice planes, θ refers to the measured diffraction angle, RI means relative intercalation, and d0 is the interlayer spacing of virgin MMT (C20A).
d-Spacing of neat MMT is 25.6 Å, while d-spacing of MMT in pure PLA and PBAT is 33.5 and 34.9 Å, respectively. Furthermore, OMMT has better dispersion in PLA/PBAT two-phase blends than pure PLA or PBAT as d-spacing and relative intercalation of MMT in PLA/PBAT nanocomposites are higher than those in single PLA or PBAT nanocomposites. In addition, we found that d-spacing is greater where PBAT occupies the main part in the PLA/PBAT blends. This is because that, as the modifier of MMT, quaternary ammonium salt owes better compatibility of PBAT and organic-modified MMT.28,33
Although significant amounts of MMT were intercalated in PLA, PBAT, and their blends, a large number of MMT still maintained the layered structure after melt blending as there still hold three distinct diffraction peaks as shown in Figure 2. Chains of PLA and PBAT transfer into MMT particles and intercalate into silicate lamellar, resulting in an increase in the gap between the silicates. The array of the silicate lamellae is still in order because of strong van der Waals force between silicates lamellar. This explains why the relative intercalation of MMT in PLA/PBAT blends ranges from 30% to 40%.
MMT location analysis
The preferred positioning of the MMT on the blend can greatly affect the compatibilization effect. We could use the wetting coefficient

where
The interfacial energy could be estimated with a geometric mean equation:

and a harmonic mean equation:
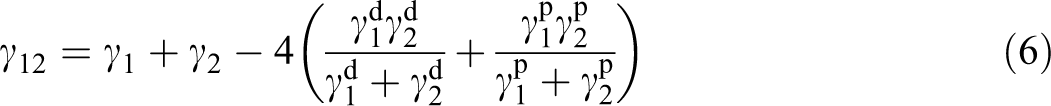
where
In this research, the surface energy of PLA and PBAT was calculated according to the measured contact angle with water and diiodomethane at room temperature, and then extrapolates to the processing temperature with temperature coefficient −dγ/d T , and the results were presented in Table 2.
Surface energy components of PLA, PBAT, and MMT.
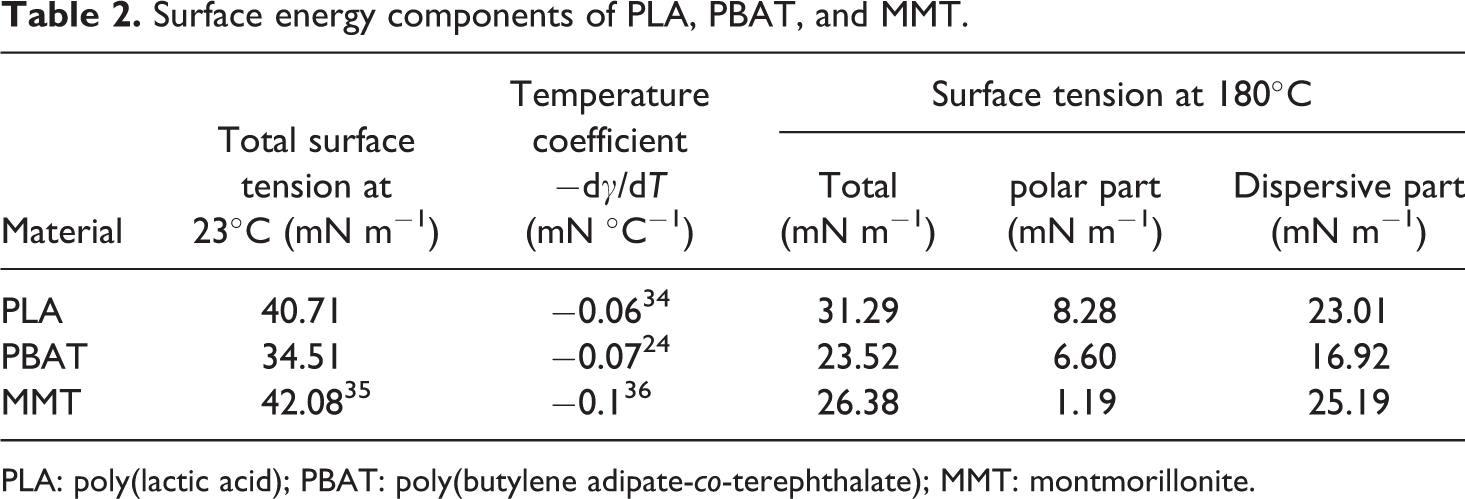
PLA: poly(lactic acid); PBAT: poly(butylene adipate-co-terephthalate); MMT: montmorillonite.
The interfacial tension of PLA-PBAT, PLA-MMT, and PBAT-MMT and their corresponding wetting coefficients were calculated according to equations (4), (5), and (6). The results indicated that MMT is located in the interface of PLA and PBAT, as presented in Table 3.
MMT localization predictions.
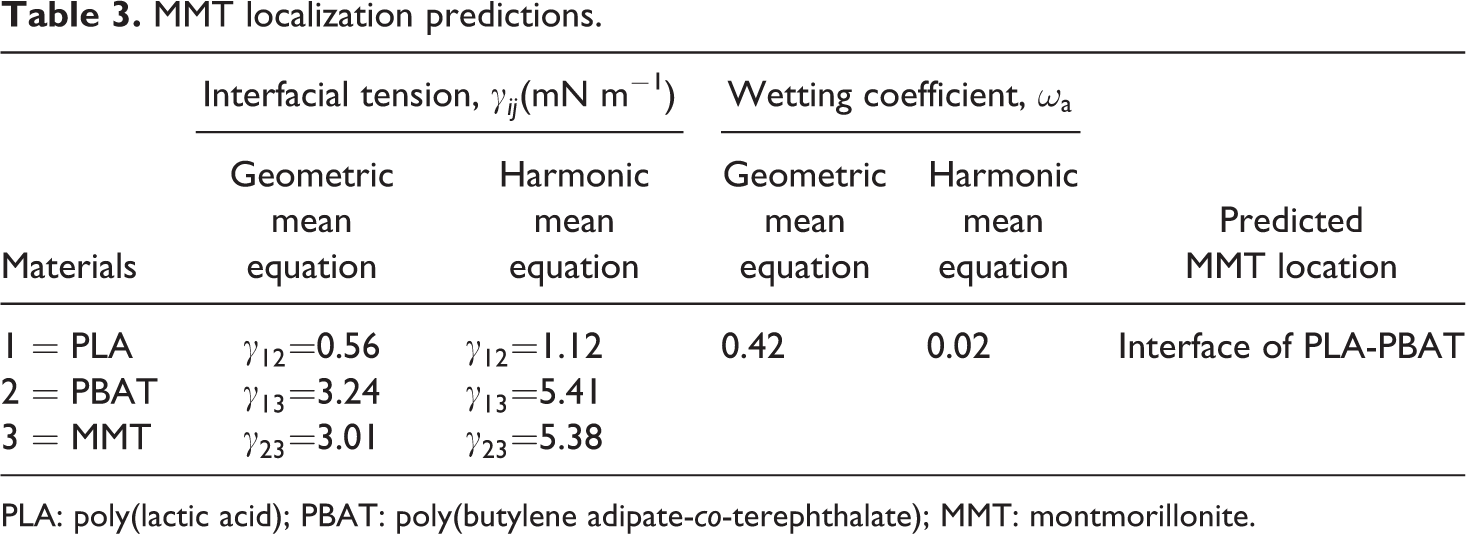
PLA: poly(lactic acid); PBAT: poly(butylene adipate-co-terephthalate); MMT: montmorillonite.
FTIR analysis showed the existence of esterification between MMT and PLA/PBAT, and the analysis of interfacial tensions confirms that MMT will be located on the interface of PLA and PBAT, which is conductive to stabilize phase morphology. All of this helps to improve compatibility between PLA and PBAT. Figure 3 explains the mechanism of the intercalation and reaction.
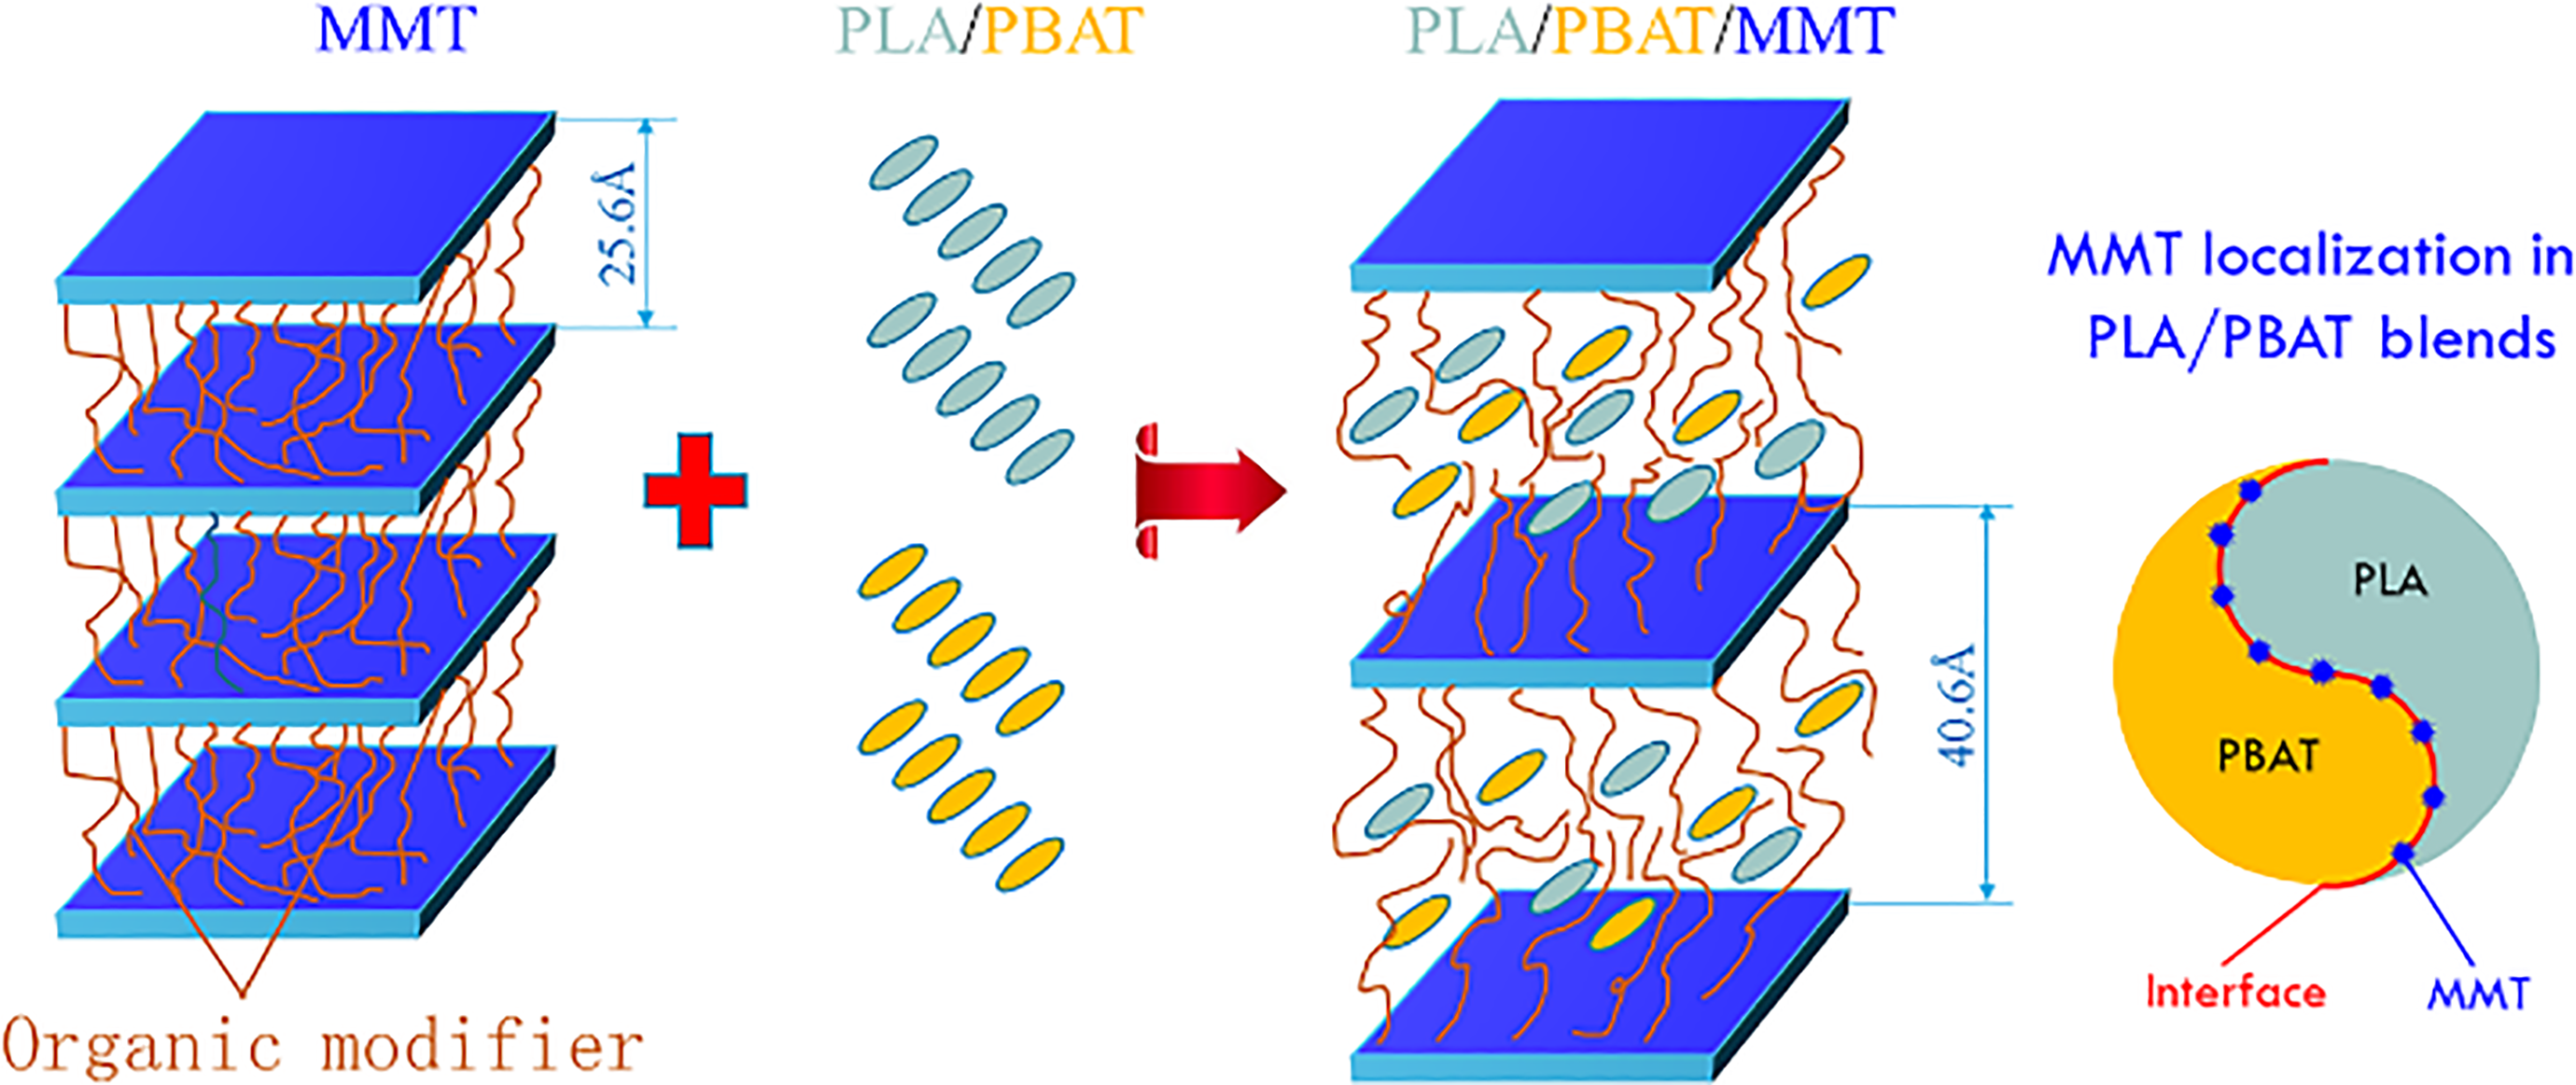
Mixing process and predicted localization of MMT in the blends.
Morphology analysis
Dil et al. 14 found that PBAT exhibits a one-way partial miscibility in the PLA-rich phase. This could explain why the compatibility between PLA and PBAT in Figure 4(a) is better than Figure 4(e), and the size of the dispersed phase of PBAT in Figure 4(a) is much smaller than the dispersed phase of PLA in Figure 4(e). Although, in Figure 4(a) and (e), voids spread all over the fractured interface, indicating significant phase separation and poor compatibility between PLA and PBAT. However, it is obvious that the phase boundaries were blurred when MMT was poured into PLA and PBAT blends and showed a closer bond between PLA and PBAT phase. From Figure 4(d) and (h), it is shown that MMT exhibits good dispersion in PLA/PBAT blends. As the FTIR analysis has confirmed the presence of an esterification reaction between MMT and PLA/PBAT, good dispersion of MMT in the blends helps to improve the interface bonding between PLA and PBAT.
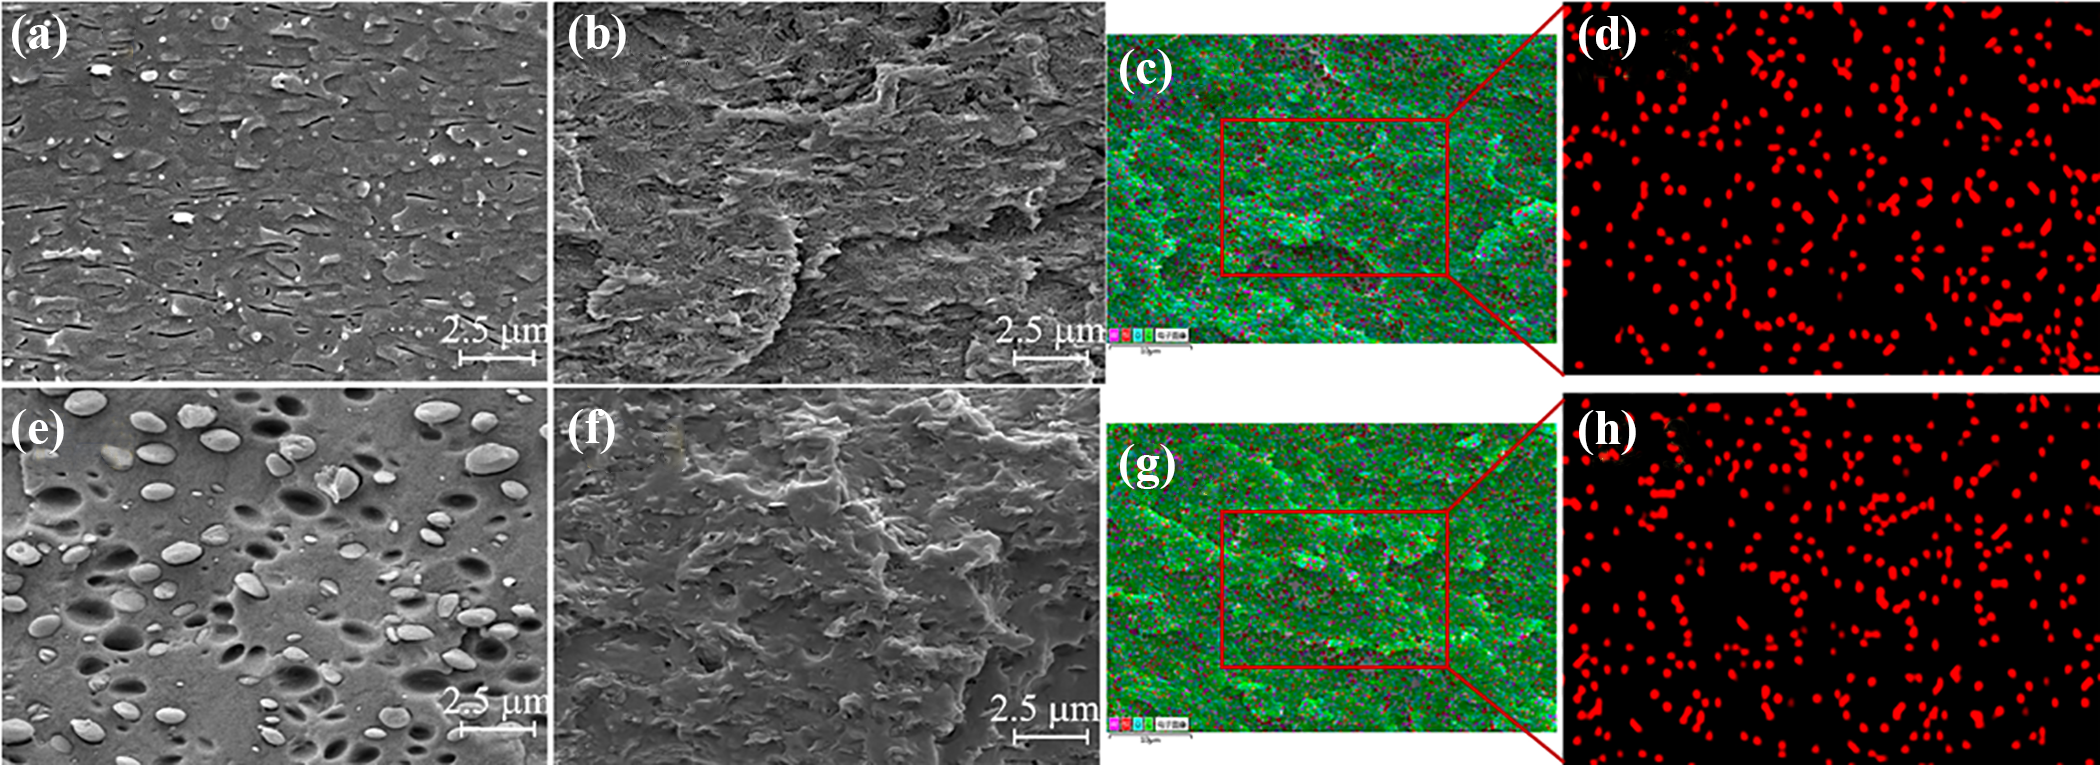
SEM images of (a): PLA70-PBAT30, (b): PLA70-PBAT30-MMT5, (e): PLA30-PBAT70, (f): PLA30-PBAT70-MMT5, (c): element (C, O, Si, Al) distribution of PLA70-PBAT30-MMT5, (g): element (C, O, Si, Al) distribution of PLA30-PBAT70-MMT5, (d): element (Si) distribution of PLA70-PBAT30-MMT5, (h): element (Si) distribution of PLA30-PBAT70-MMT5.
Figure 5 shows TEM images of MMT dispersed phase distribution in PLA/PBAT blends. From Figure 5, it is shown that MMT has been successfully intercalated by PLA and PBAT. The EDS analysis of silicon in Figure 4(d) and (h) also shows that MMT achieves good dispersion in PLA/PBAT blends, which helps to blur the phase interface and is beneficial to improve the compatibility between PLA and PBAT. Similarly, the XRD analysis showed that higher content of PBAT in the blends tends to promote the relative intercalation of MMT, with an increase in the proportion of PBAT in the PLA/PBAT nanocomposites, the proportion of intercalated MMT in the TEM image also inclined with the contents of PBAT increasing in the composites.
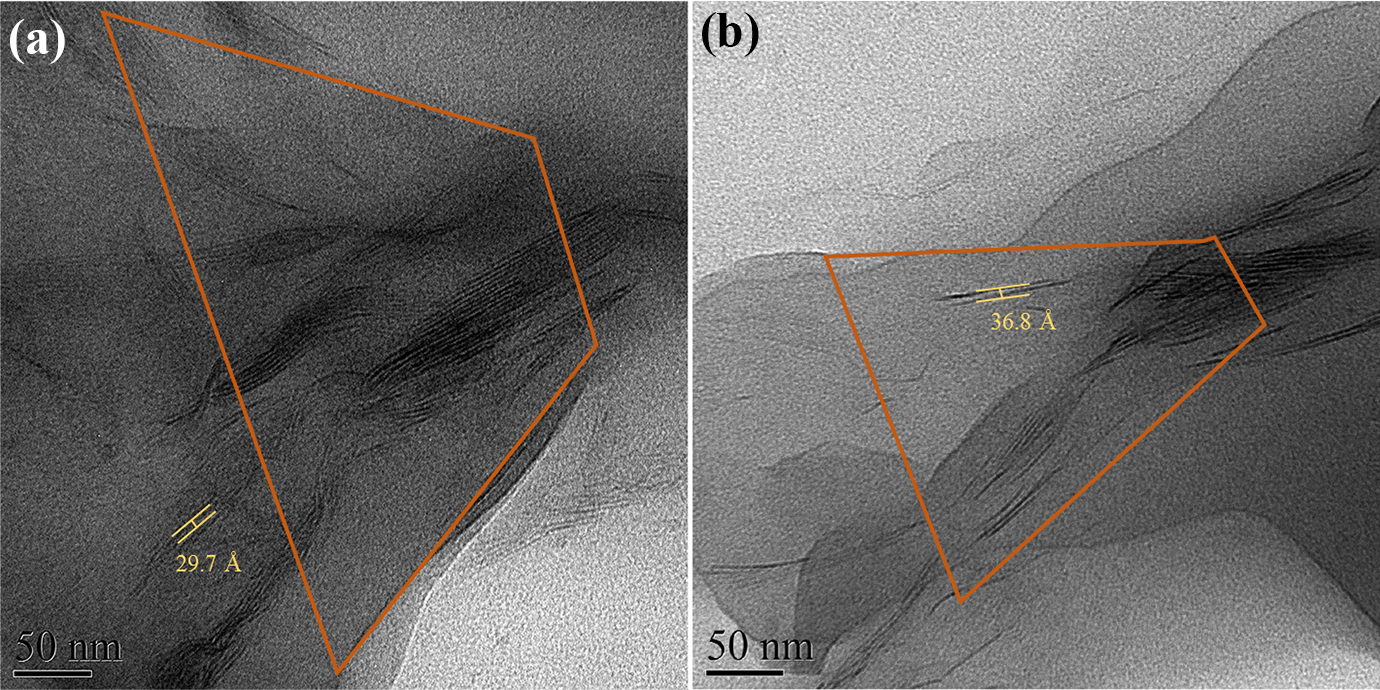
TEM images of (a) PLA70-PBAT30-MMT5, (b) PLA30-PBAT70-MMT5.
DSC analysis
Where Tg represents glass transition temperature, Tc represents cold crystallization temperature, Tm represents melting temperature, ΔHc is the cold crystallization enthalpy, ΔHm is the melting crystallization enthalpy, Xc means crystalline degree, and ΔH refers to 100% crystalline enthalpy of PLA (93.7 J g−1).
The crystallinity (Xc) of the blends is calculated according to the following formula:

The DSC curves of PLA/PBAT/MMT nanocomposites during the second heating progress are shown in Figure 6, and Table 4 summarizes the DSC results. Glass transition temperature (Tg) and melting temperature (Tm) of pure PLA are 62.6°C and 168.6°C, respectively, while PLA shows no significant cold crystallization temperature (Tc) for the slow crystallization rate of PLA with high molecular weight, which limits the development of crystalline domains upon cooling. 37
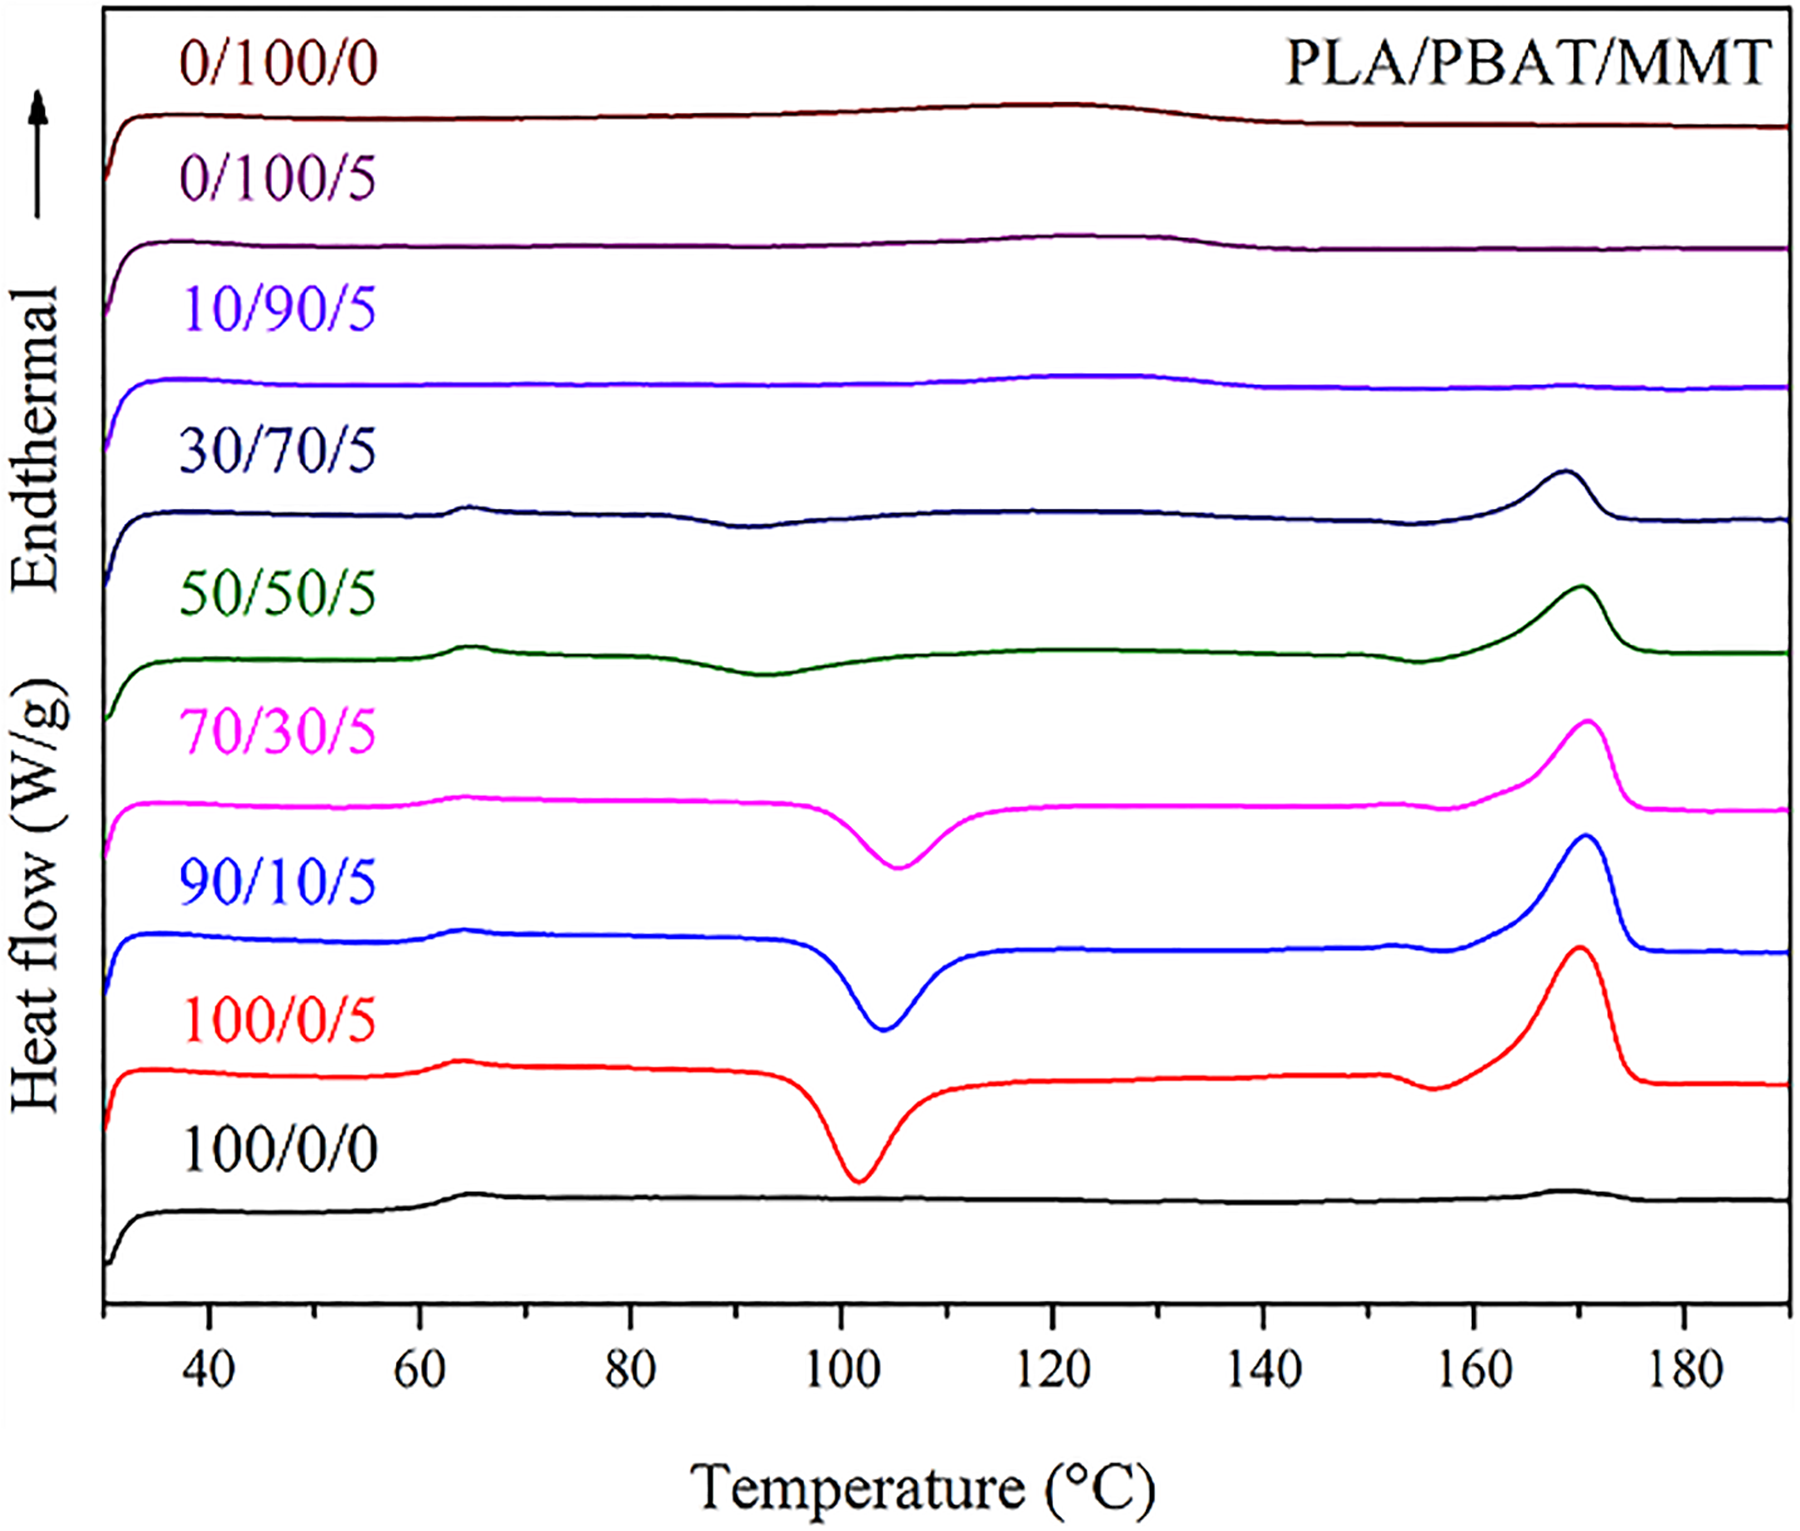
DSC thermograms of the second heating of PLA/PBAT/MMT nanocomposites with different weight fraction.
Parameters gained from DSC analysis.
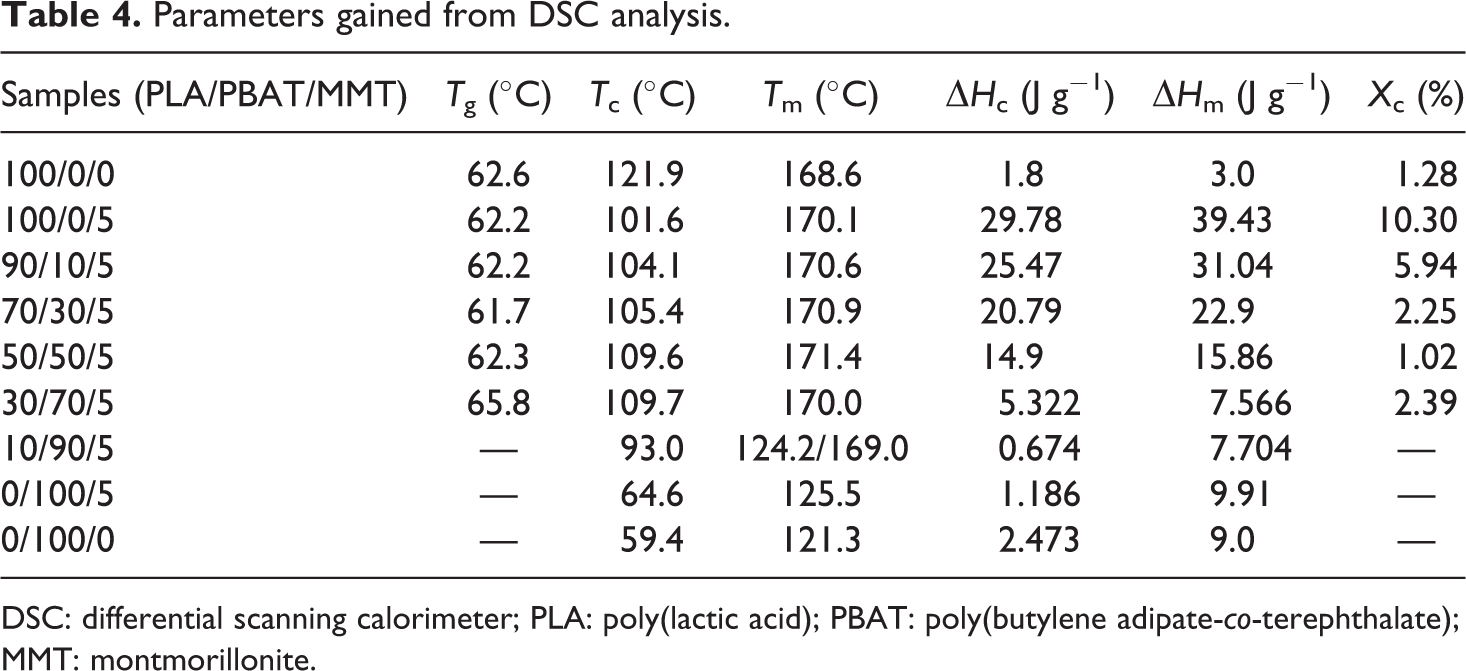
DSC: differential scanning calorimeter; PLA: poly(lactic acid); PBAT: poly(butylene adipate-co-terephthalate); MMT: montmorillonite.
The addition of MMT increased the crystallization of PLA owing to the increasing nucleation sites in the polymer matrix as an influence of heterogeneous nucleation effects of MMT. The increasing of Tm also verified the heterogeneous nucleation effects of MMT. For PBAT, the addition of MMT promoted Tm of PBAT from 121.3°C to 125.5°C. This is due to the hydrogen bonds between –OH groups of C20A and carbonyl groups of PBAT, which help to immobilize the polymer chain of PBAT and ultimately enhance Tm of PBAT. 38 However, the addition of MMT increased the Tg of PBAT. This is due to higher interaction force between MMT and PBAT, which in turn hinders the expansion of the nuclear. For the thermodynamic incompatibility of PLA and PBAT, the addition of PBAT hinders the mobility of PLA and contributes to the decline of crystallinity of PLA.
TGA analysis
The thermal stability of PLA, PBAT, and their nanocomposites was studied by TGA, as shown in Figure 7. The initial degradation temperature (Ti) of pure PLA and virgin PBAT was detected at 341.8°C and 377.7°C, respectively, and the final degradation temperature (Tf) was 359.4°C and 379.4°C as shown in Table 5. The presence of benzene ring in the PBAT molecular segment limits the movement of the PBAT molecular chain, thereby promoting the thermal stability of PBAT, thus PBAT exhibits a broad decomposition process than PLA, and we can use PBAT to improve the thermal stability of PLA.
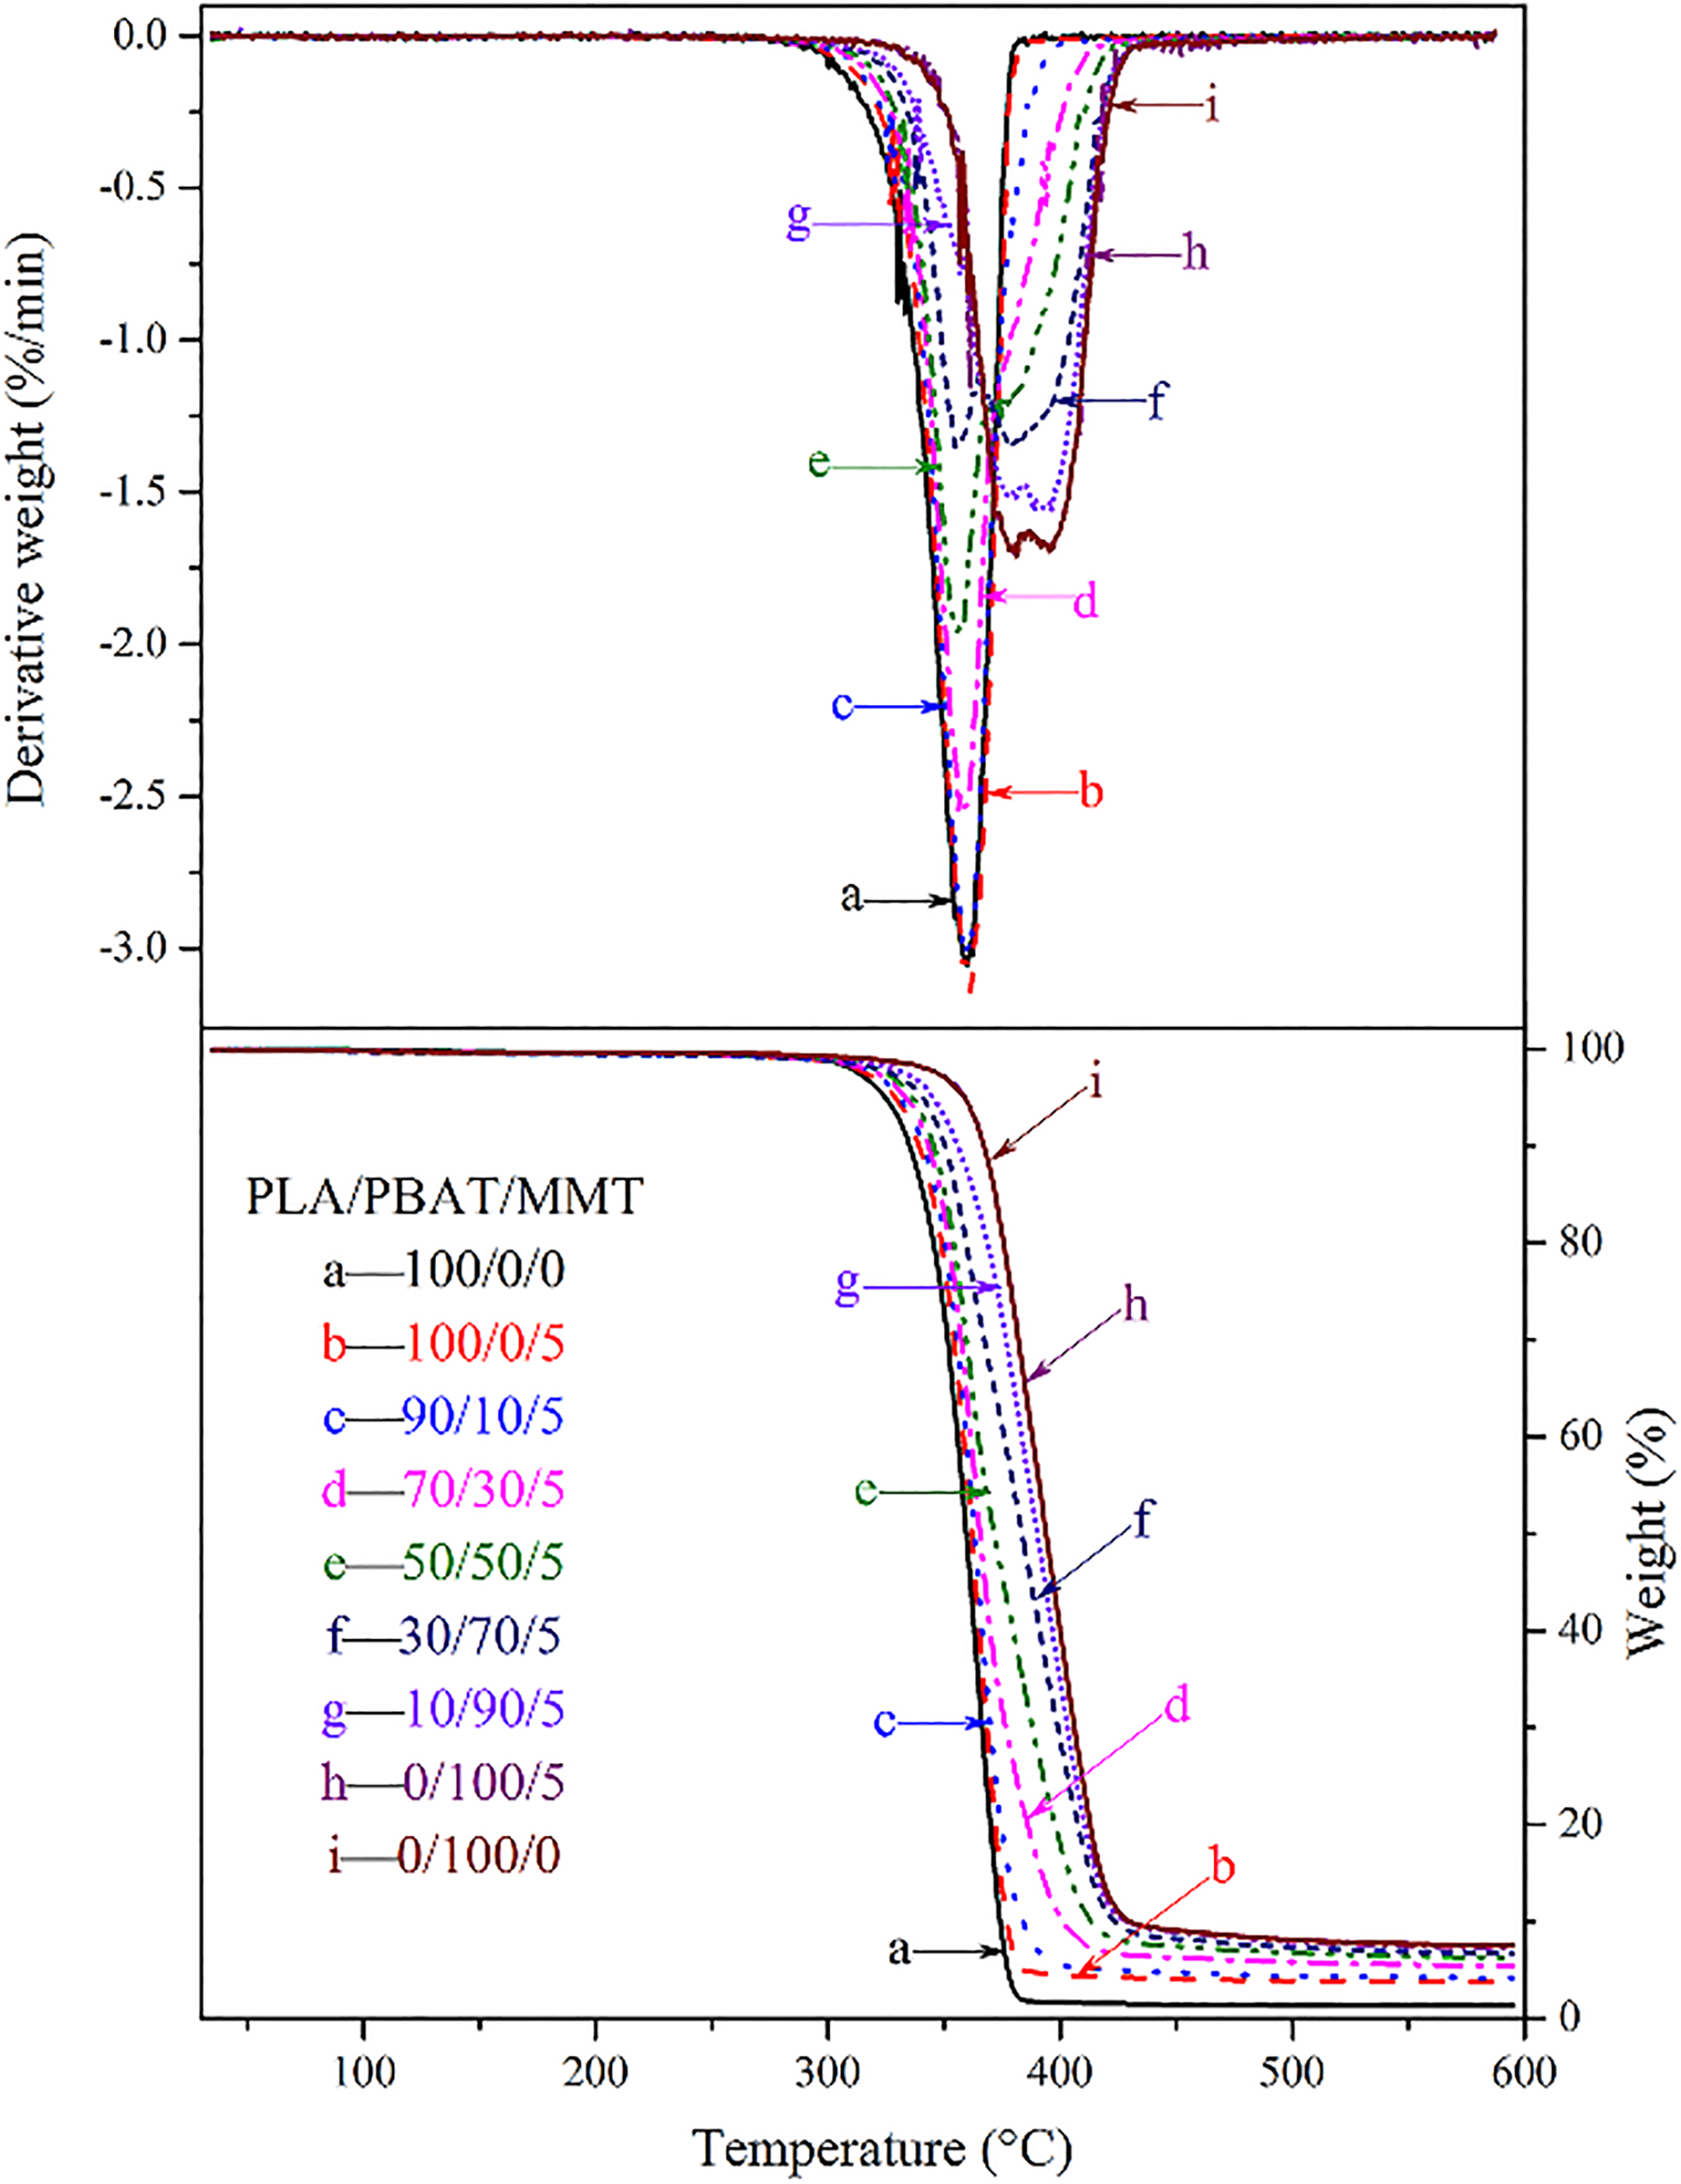
TG and DTG thermograms of PLA/PBAT/MMT nanocomposites with different weight fraction.
Parameters gained from TGA.
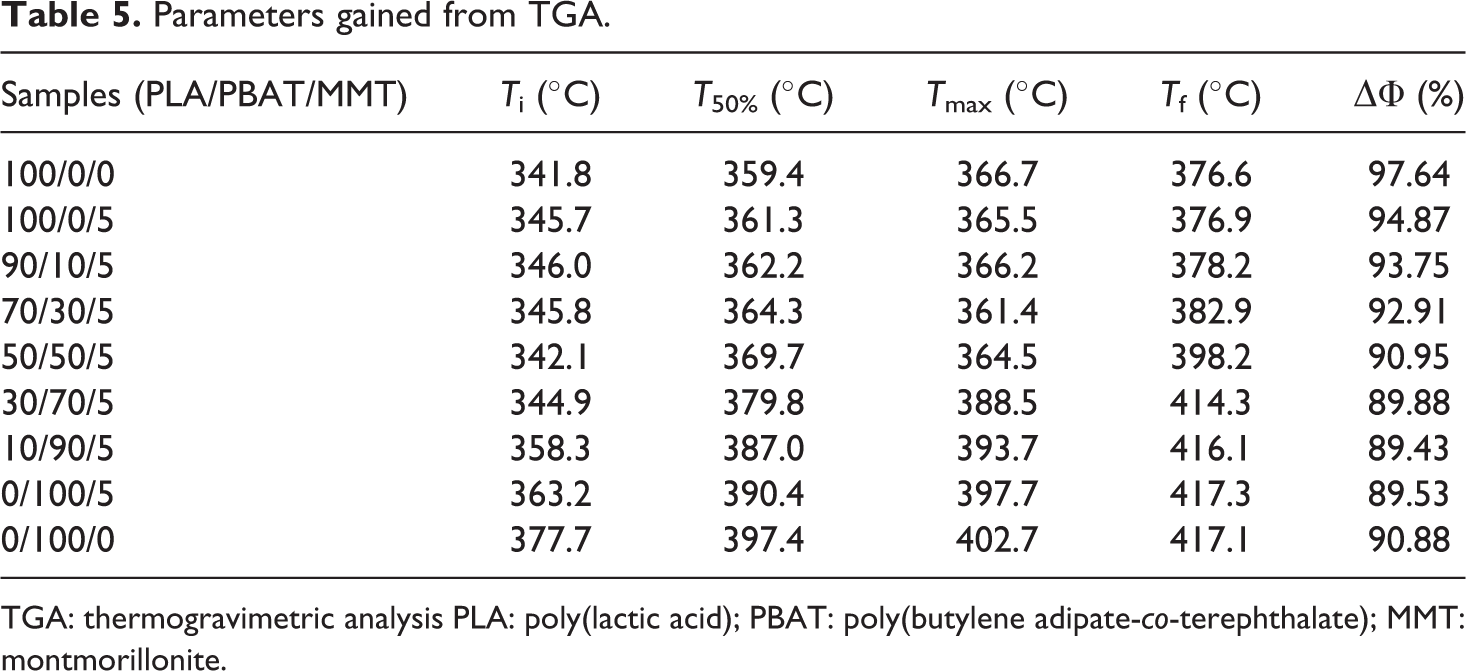
TGA: thermogravimetric analysis PLA: poly(lactic acid); PBAT: poly(butylene adipate-co-terephthalate); MMT: montmorillonite.
With the incorporation of MMT, Ti and T50% of PLA transferred to higher temperatures, indicating the thermal stability promotion of PLA. On the one hand, lamellar MMT in the blends hindered the transfer of heat, and on the other hand, chains of PLA are inserted into the MMT layer and will also limit the mobility of PLA chain. However, the addition of MMT reduced the thermal stability of PBAT. As the interfacial tension analysis clarifies, MMT has a better compatibility with PBAT, which means the carboxyl group of quaternary ammonium salt in MMT is more easier to combine with PBAT. This eventually accelerates the thermal decomposition process of PBAT. As for PLA/PBAT/MMT blends, Ti, T5%, and Tmax did not change greatly with the addition of PBAT when the weight contents of PLA were above 50%. The blends PLA/PBAT/MMT (30/70/5) showed a two-step decomposition process, with each peak closing to the corresponding virgin PLA and PBAT. This indicated the poor compatibility of PLA and PBAT, which was also verified by the DSC and resulted in the following mechanical analysis. That led to little influence of PLA on the PBAT-rich phase in the blends PLA/PBAT/MMT (10/90/5).
Mechanical analysis
Figure 8 shows the tensile strength and modulus of PLA/PBAT/MMT nanocomposites. In Figure 8(a), the tensile strength of both PLA and PBAT significantly increased with 5% of MMT addition. This means that MMT obtained a good dispersion in PLA and PBAT, and there exists a good compatibility between MMT and PLA or PBAT. As the FTIR spectrum shows, there exists a strong bond between MMT and single PLA or PBAT. However, it showed a strength decline when adding PBAT to PLA/MMT nanocomposites or adding PLA to PBAT/MMT nanocomposites. This is due to the phase separation of PLA and PBAT owing to their thermodynamics incompatibility nature, which neutralizes the enhancement of MMT. 39 In Figure 8(b), it is shown that tensile strength and tensile modulus of PLA/PBAT/MMT blends synchronously decline as the PBAT contents increase in the blends. This phenomenon is understandable as PBAT is essentially a super-tough elastomer owing to a rather low tensile strength and modulus.
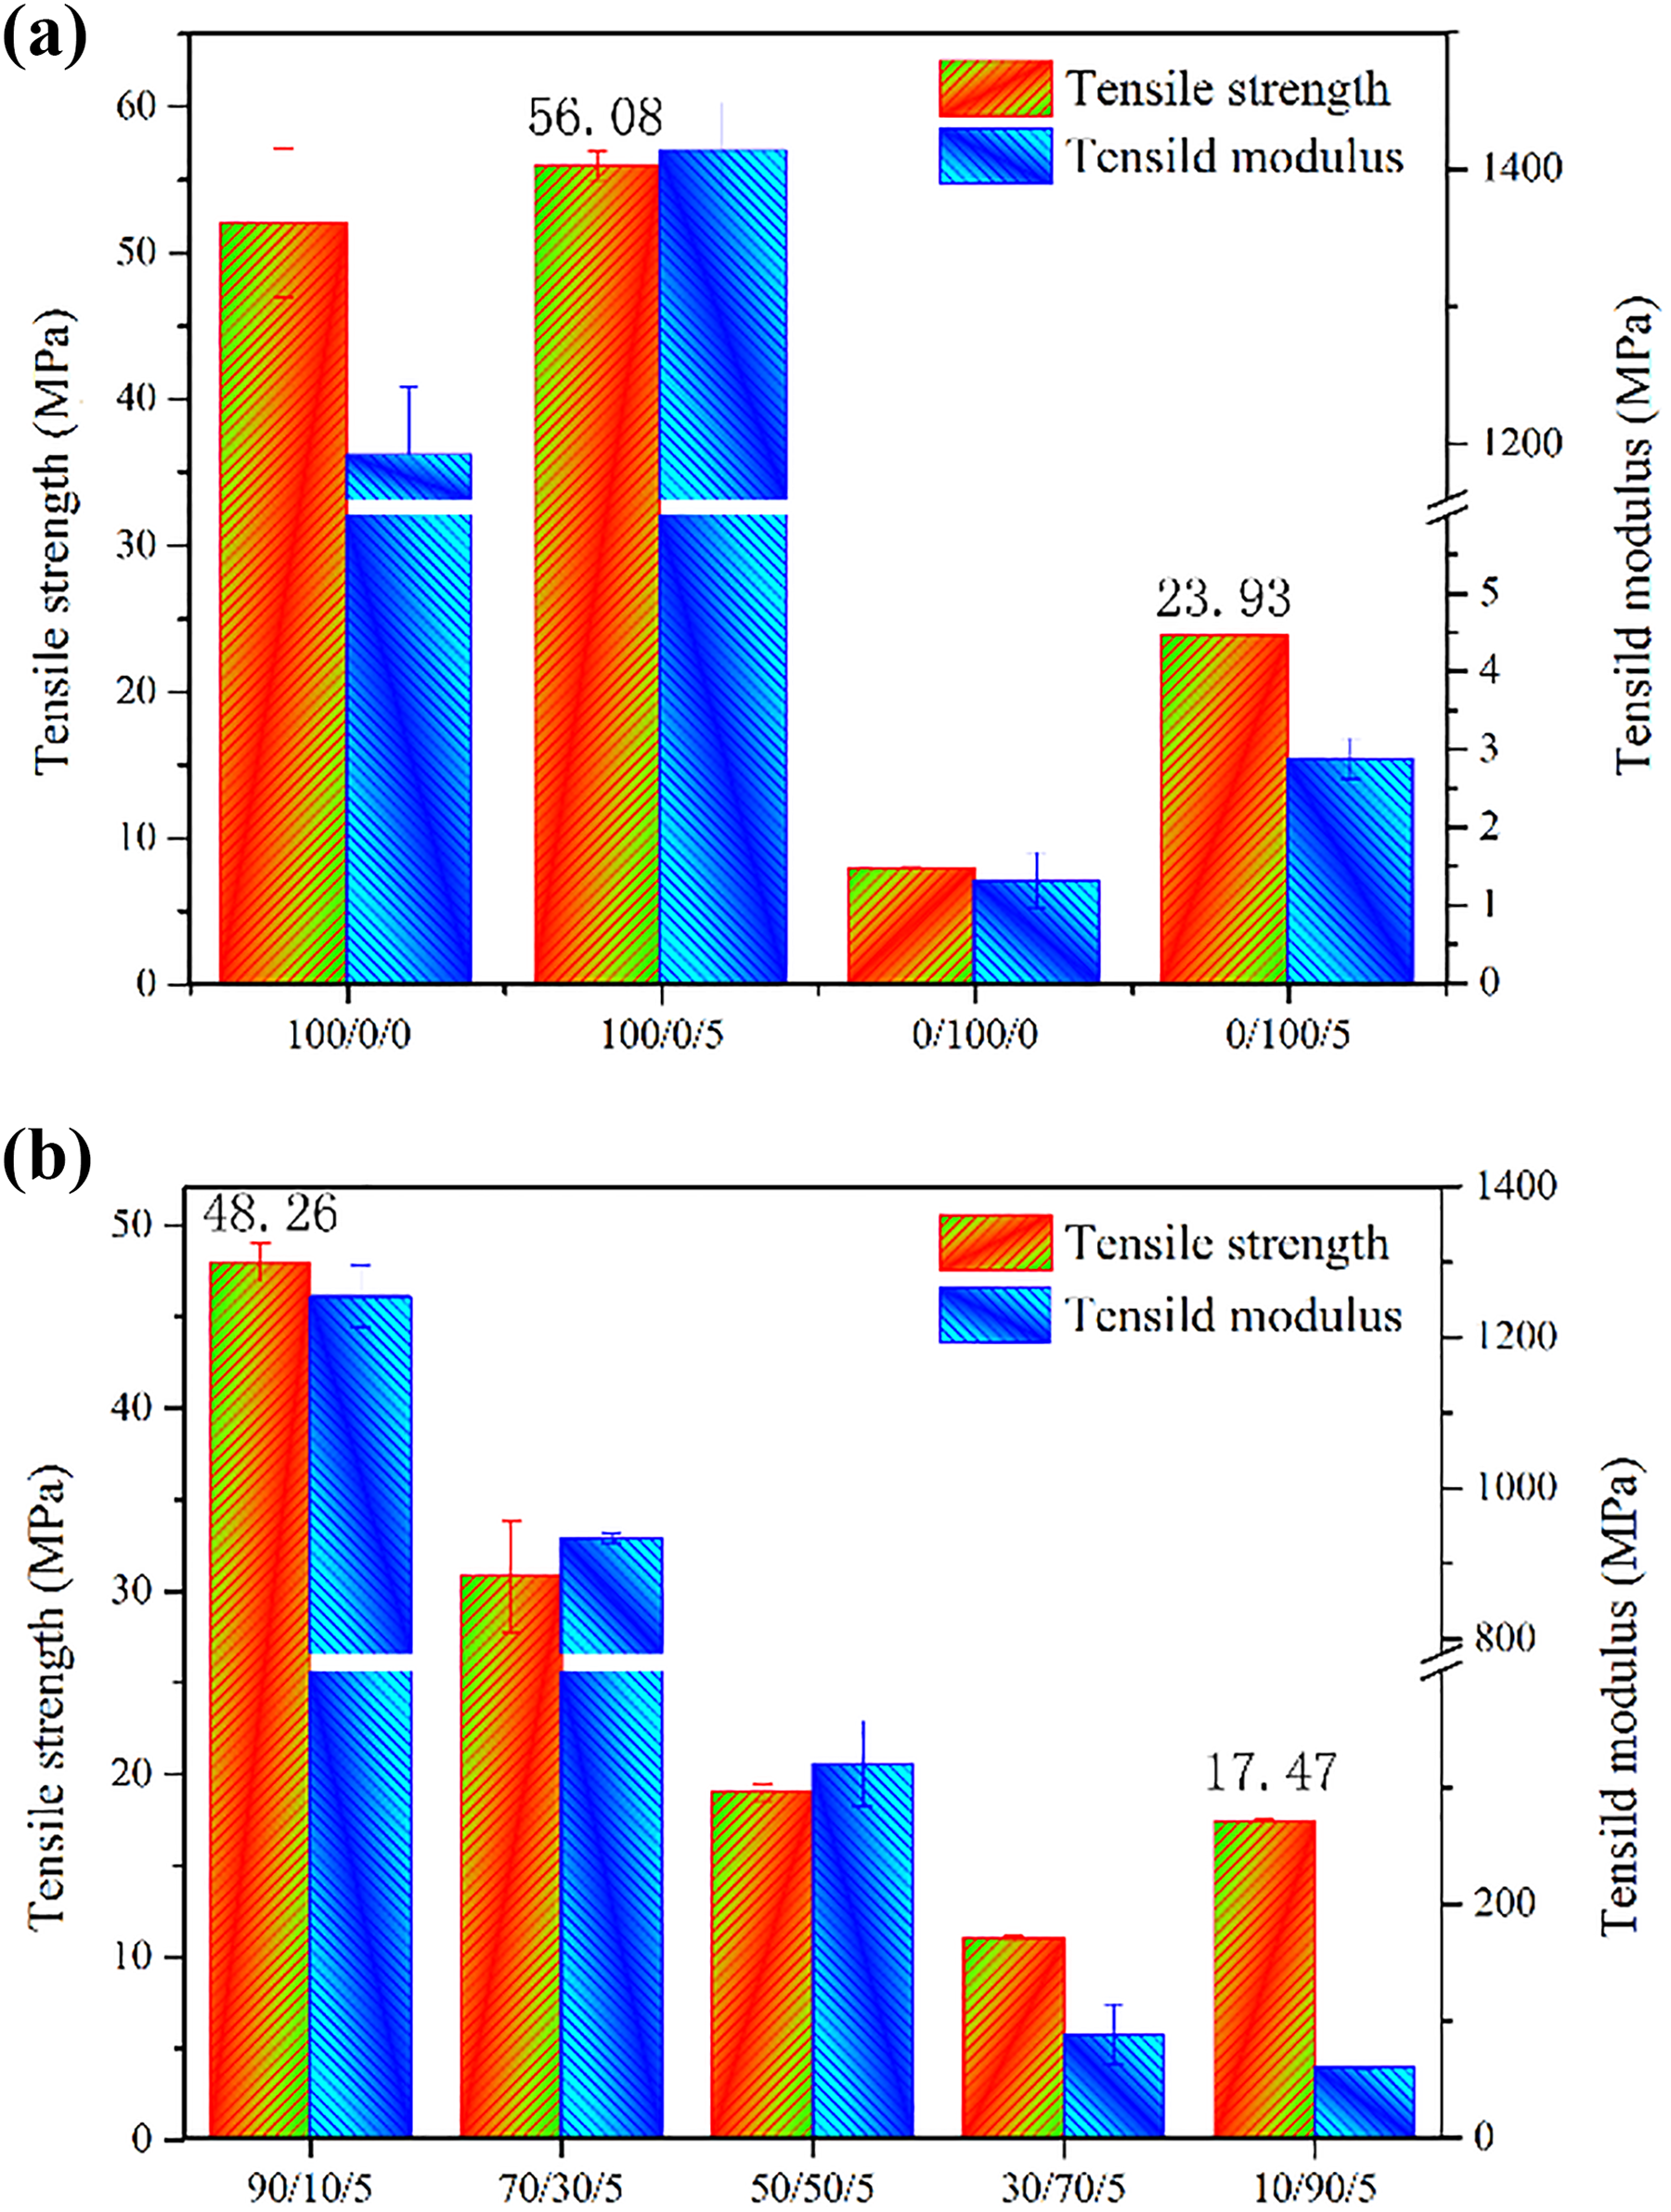
Tensile strength and modulus of PLA/PBAT/MMT nanocomposites with different weight fraction.
Figure 9 shows the elongation at break and impact strength of PLA/PBAT/MMT nanocomposites. In Figure 9(a), the addition of MMT improved the elongation at break and impact strength of PLA as the esterification reaction between MMT and PLA/PBAT increased the compatibility between PLA and PBAT. In Figure 9(b), it can be seen that the elongation at break of the PLA/PBAT/MMT blend increases as the PBAT content increases. That is understandable for the effect of PBAT as a flexibilizer owing good toughness, although it is incompatible with PLA. When the polymer is under forced deformation, holes develop in the interface of MMT and PLA and blunt the formulated cracks, which prevent the further expansion of the cracks. This could explain the rise of elongation at break. However, we do not see a significant effect of PBAT on the impact strength of the blends where PBAT accounts for less than 50 wt%. In addition, as their incompatibility, here, is not great, toughness increases when PLA occupies the matrix, and the toughness inclines sharply when PBAT occupies the matrix. 14
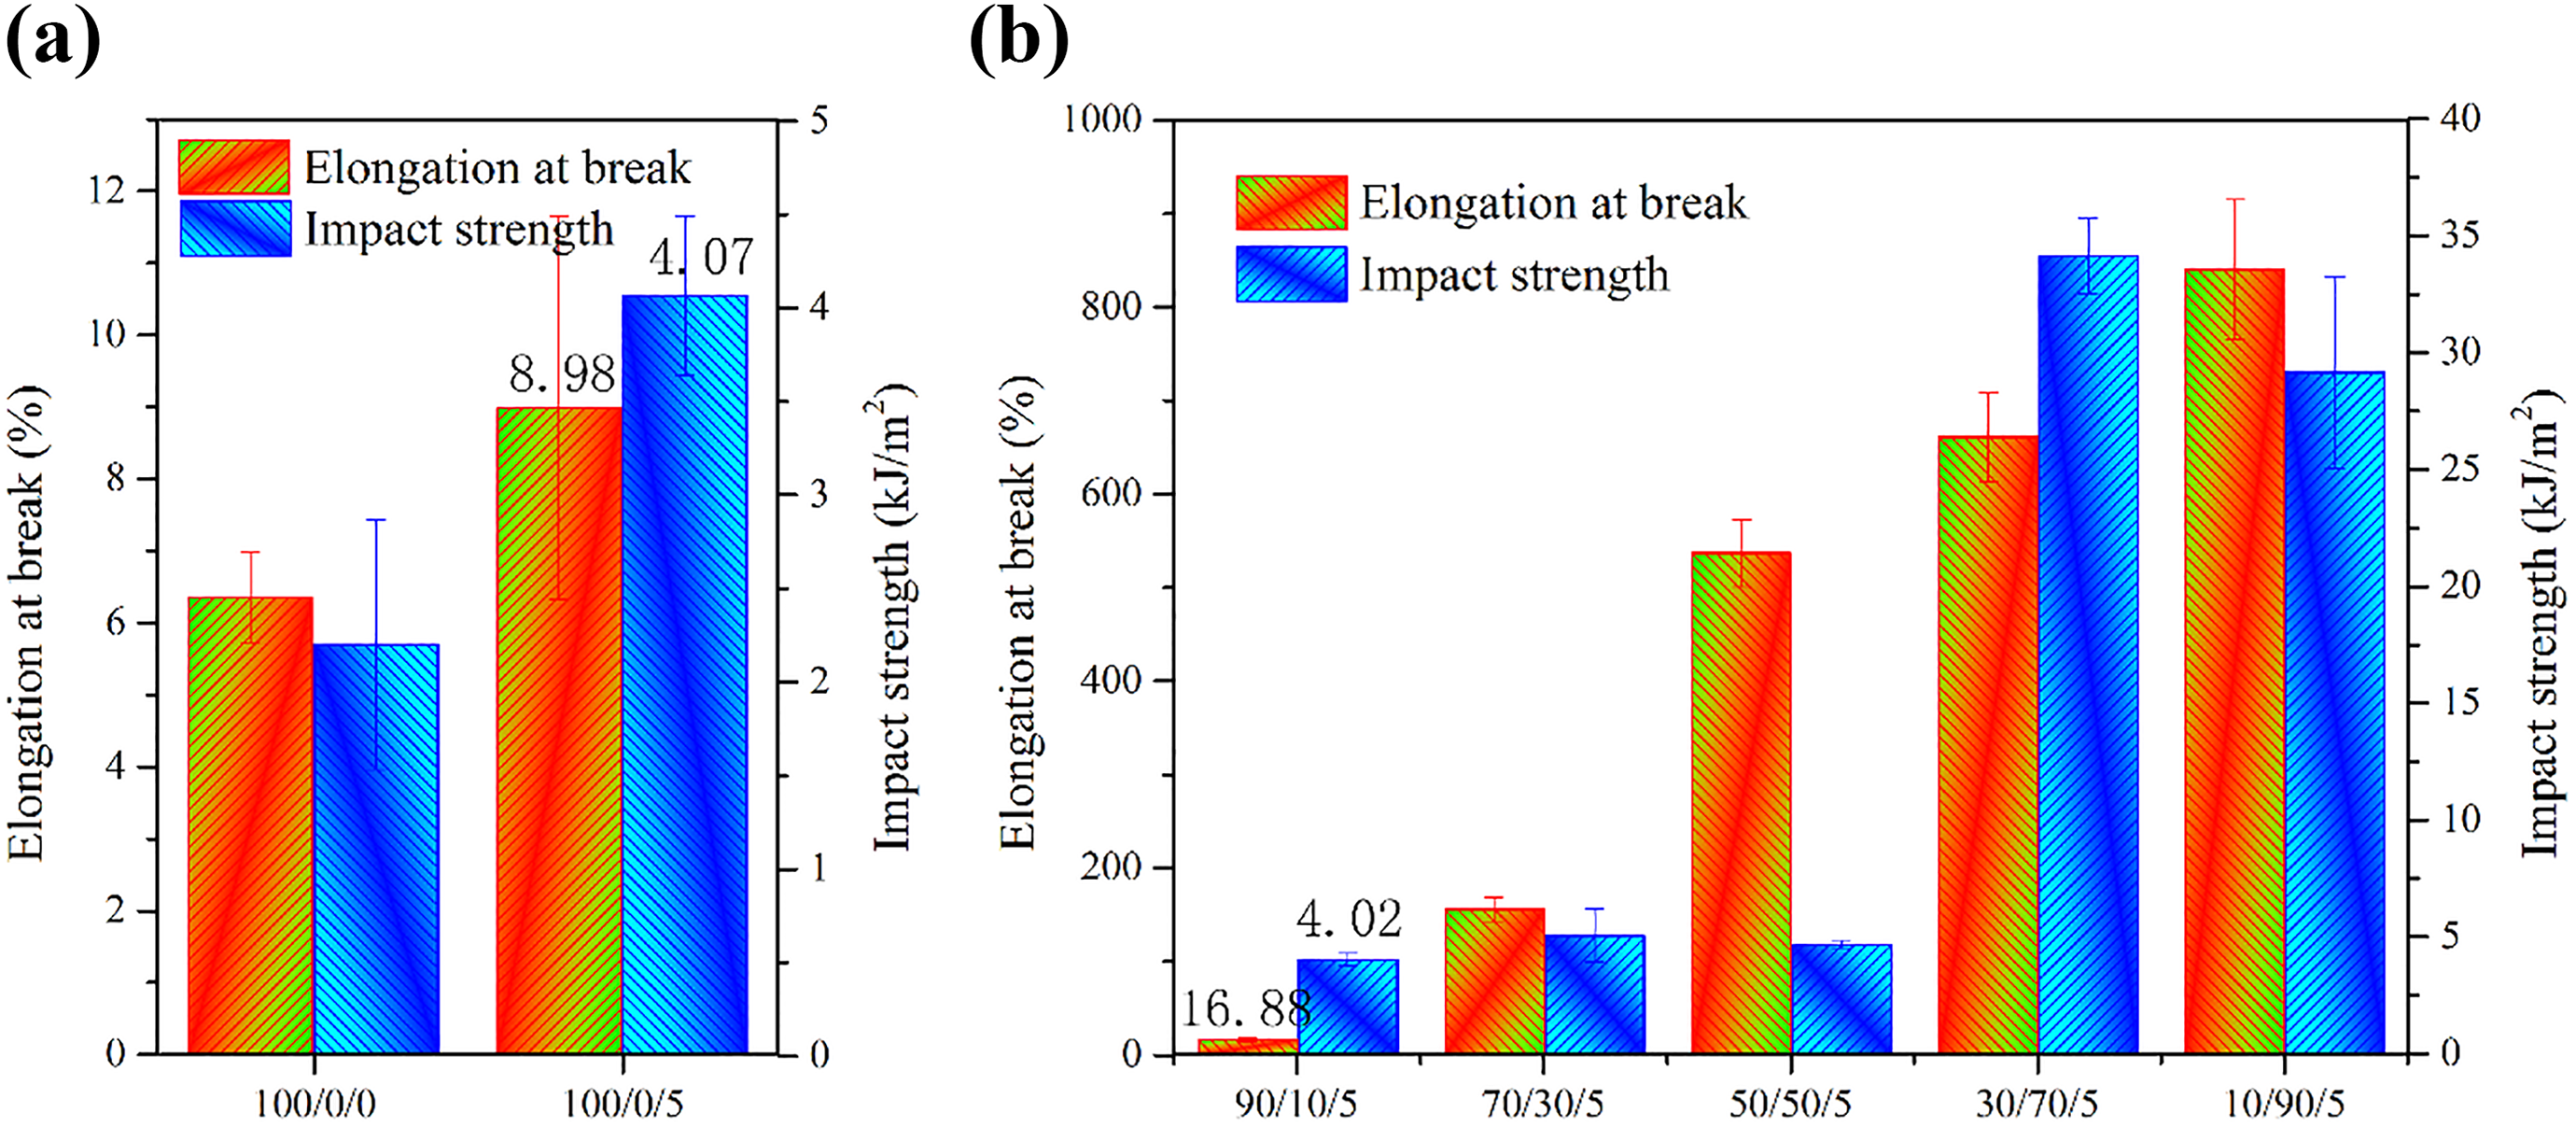
Impact strength of PLA/PBAT/MMT nanocomposites with different weight fraction. (The components 0/100/5 and 0/100/0 cannot be broken with Izod Impact Tester.)
Conclusions
PLA is a bio-based degradable material that owes favorable strength and modulus while lacking the necessary toughness. While PBAT is a degradable material, which possesses good toughness but especially low strength. In this article, the ternary system of PLA, PBAT, and MMT was prepared through melt blending, and their chemical structure, dispersion of MMT in the blends, MMT’s location on the blends, morphology, and thermal and physical properties were thoroughly studied. The FTIR spectrum reveals that there exist some possible reactions between MMT and PLA/PBAT. XRD patterns indicate that PLA and PBAT were successfully intercalated into MMT, finally, MMT achieves a good dispersion in the blends. In addition, XRD patterns manifest that MMT obtains better dispersion in PBAT than PLA. Furthermore, the analysis of surface tension illustrates that MMT will locate on the interface of PLA and PBAT and that was verified by the TEM images. DSC thermograms indicate that MMT greatly increases the crystallinity of PLA and PBAT. TGA indicates the increase of distortion temperature with the addition of MMT. Finally, tensile and impact tests were carried out to characterize their physical properties. The results show that the addition of MMT has a significant effect on improving the strength of both PLA and PBAT. Except that, the addition of PBAT increases the toughness of PLA greatly.
Footnotes
Acknowledgement
The authors sincerely acknowledge support from the National Nature Science Foundation of China.
Funding
The author(s) disclosed receipt of the following financial support for the research, authorship, and/or publication of this article: This work was supported by the National Nature Science Foundation of China (Grant Number 51873075).