
Abstract
A series of vertical fire suppression experiments on rigid polyurethane (RPU) and flexible polyurethane (FPU) with/without water spray were conducted in a standard chamber. A new video processing method was developed to determine the pyrolysis front position of wind-aided flame. Averaged flame height, carbon monoxide/hydrogen cyanide concentration, view factors, and extinguishing time were determined with operating pressure varying from 0.15 MPa to 0.4 MPa. The experimental study showed that water spray would suppress RPU/FPU fire mainly by fuel surface cooling. Furthermore, the perfect water spray pressure for RPU/FPU fire suppression was 0.3 MPa and the corresponding water application rate was 0.7511 mg/(cm2·s).
Introduction
Insulation material makes an important contribution to energy conservation and emissions reduction. So far, two kinds of thermal insulation material—thermoplastic and thermosetting material—are widely used as external insulation materials. Thermoplastic material1–6 including expandable polystyrene and expanded polystyrene is not only burning up fast but also burning down quickly for molten droplet dripping, which has been investigated by many papers. For example, Huang et al.,3–4 Zhang et al., 5 and An et al. 6 carried out a series of small-scale flame spread experiments to reveal flame spread characteristics of insulation material with different thicknesses or widths or inclined angles in the Tibetan plateau and Hefei. The results show that these variables have important effects on fire propagation. Thermosetting material (including rigid polyurethane (RPU)) fire was a facade fire, which spread very fast and was far worse. The fire hazard caused great threat to people’s life and society. 7 However, few persons studied the wind-aided flame spread of RPU and the main reason was that the wind-aided flame of RPU spread fast and the pyrolysis was not easy to determine. Therefore, the study of the upward flame spread was mainly focused on the polymethyl methacrylate (PMMA), wood, and corrugated cardboard.1,8–13 For example, Gollnera et al. 13 studied the upward flame spread over corrugated cardboard. The average flame height and the pyrolysis height were determined and the result best fitted the power law, which was xp/f = Atn, n = 1.5. Ma et al.14,15 investigated flame propagation characteristics over flexible polyurethane (FPU) foam at different widths, atmospheric pressures, inclined facade constructions, or external heat fluxes. Results show that average flame spreading velocity for FPU was found to correlate with pressure at various inclinations, and the downward flame spread of the FPU is an accelerating process when there is an external radiation condition. However, upward flame spread for RPU is still lacking, which is a widely applied thermal insulation material in China. To detect the pyrolysis front position from video recordings of RPU, a new processing method was developed.
In addition, the effect of the water spray was also studied in this article. Water spray was a key agent for fire suppression. A series of experiments on the fire suppression with water spray were studied.16–29 For instance, the extinguishment of a self-sustained burning vertical wood slabs by water spray was investigated by Tamanini. 21 Novozhilov 18 overviewed fire suppression studies. Yang 25 conducted FPU fire suppression by water spray and the critical water spray application rate was 7 mg/(cm2·s). Two different spray angles were used to extinguish vertical RPU fire by Zhao et al., 19 and they found that the RPU fire suppression effect with water spray angle being 30° was better than that with water spray angle being 0°. Afterward, Zhao et al. 20 tried to analyze water spray suppression performance against radiation-augmented RPU slab fires. Results showed that both the free burn and fire suppression experimental data indicate a linear dependence of burning rate on external radiant flux, and three ratios R1, R2, and R3 were raised to describe water spray control effect or efficiency.
In this article, wind-aided fire suppression experiments of rigid and FPU with and without water spray were conducted. A new method to determine the pyrolysis front position of wind-aided flame was proposed. The LaVision’s Particle Master system family was used to measure the velocity and droplet size of the water spray simultaneously. Toxic gas—hydrogen cyanide (HCN) concentration produced by RPU and FPU—was measured. In addition, averaged flame height, pyrolysis front position, view factors, and extinguishing time were measured or calculated in the test whether the water spray was applied or not.
Experimental apparatus
The experiments on interaction of water spray with RPU and FPU fires were conducted in a standard combustion room. Averaged flame height, pyrolysis front position, carbon monoxide (CO)/HCN concentration, view factors, and extinguishing time were obtained in the tests. The detailed experimental apparatus was shown in Figure 1.
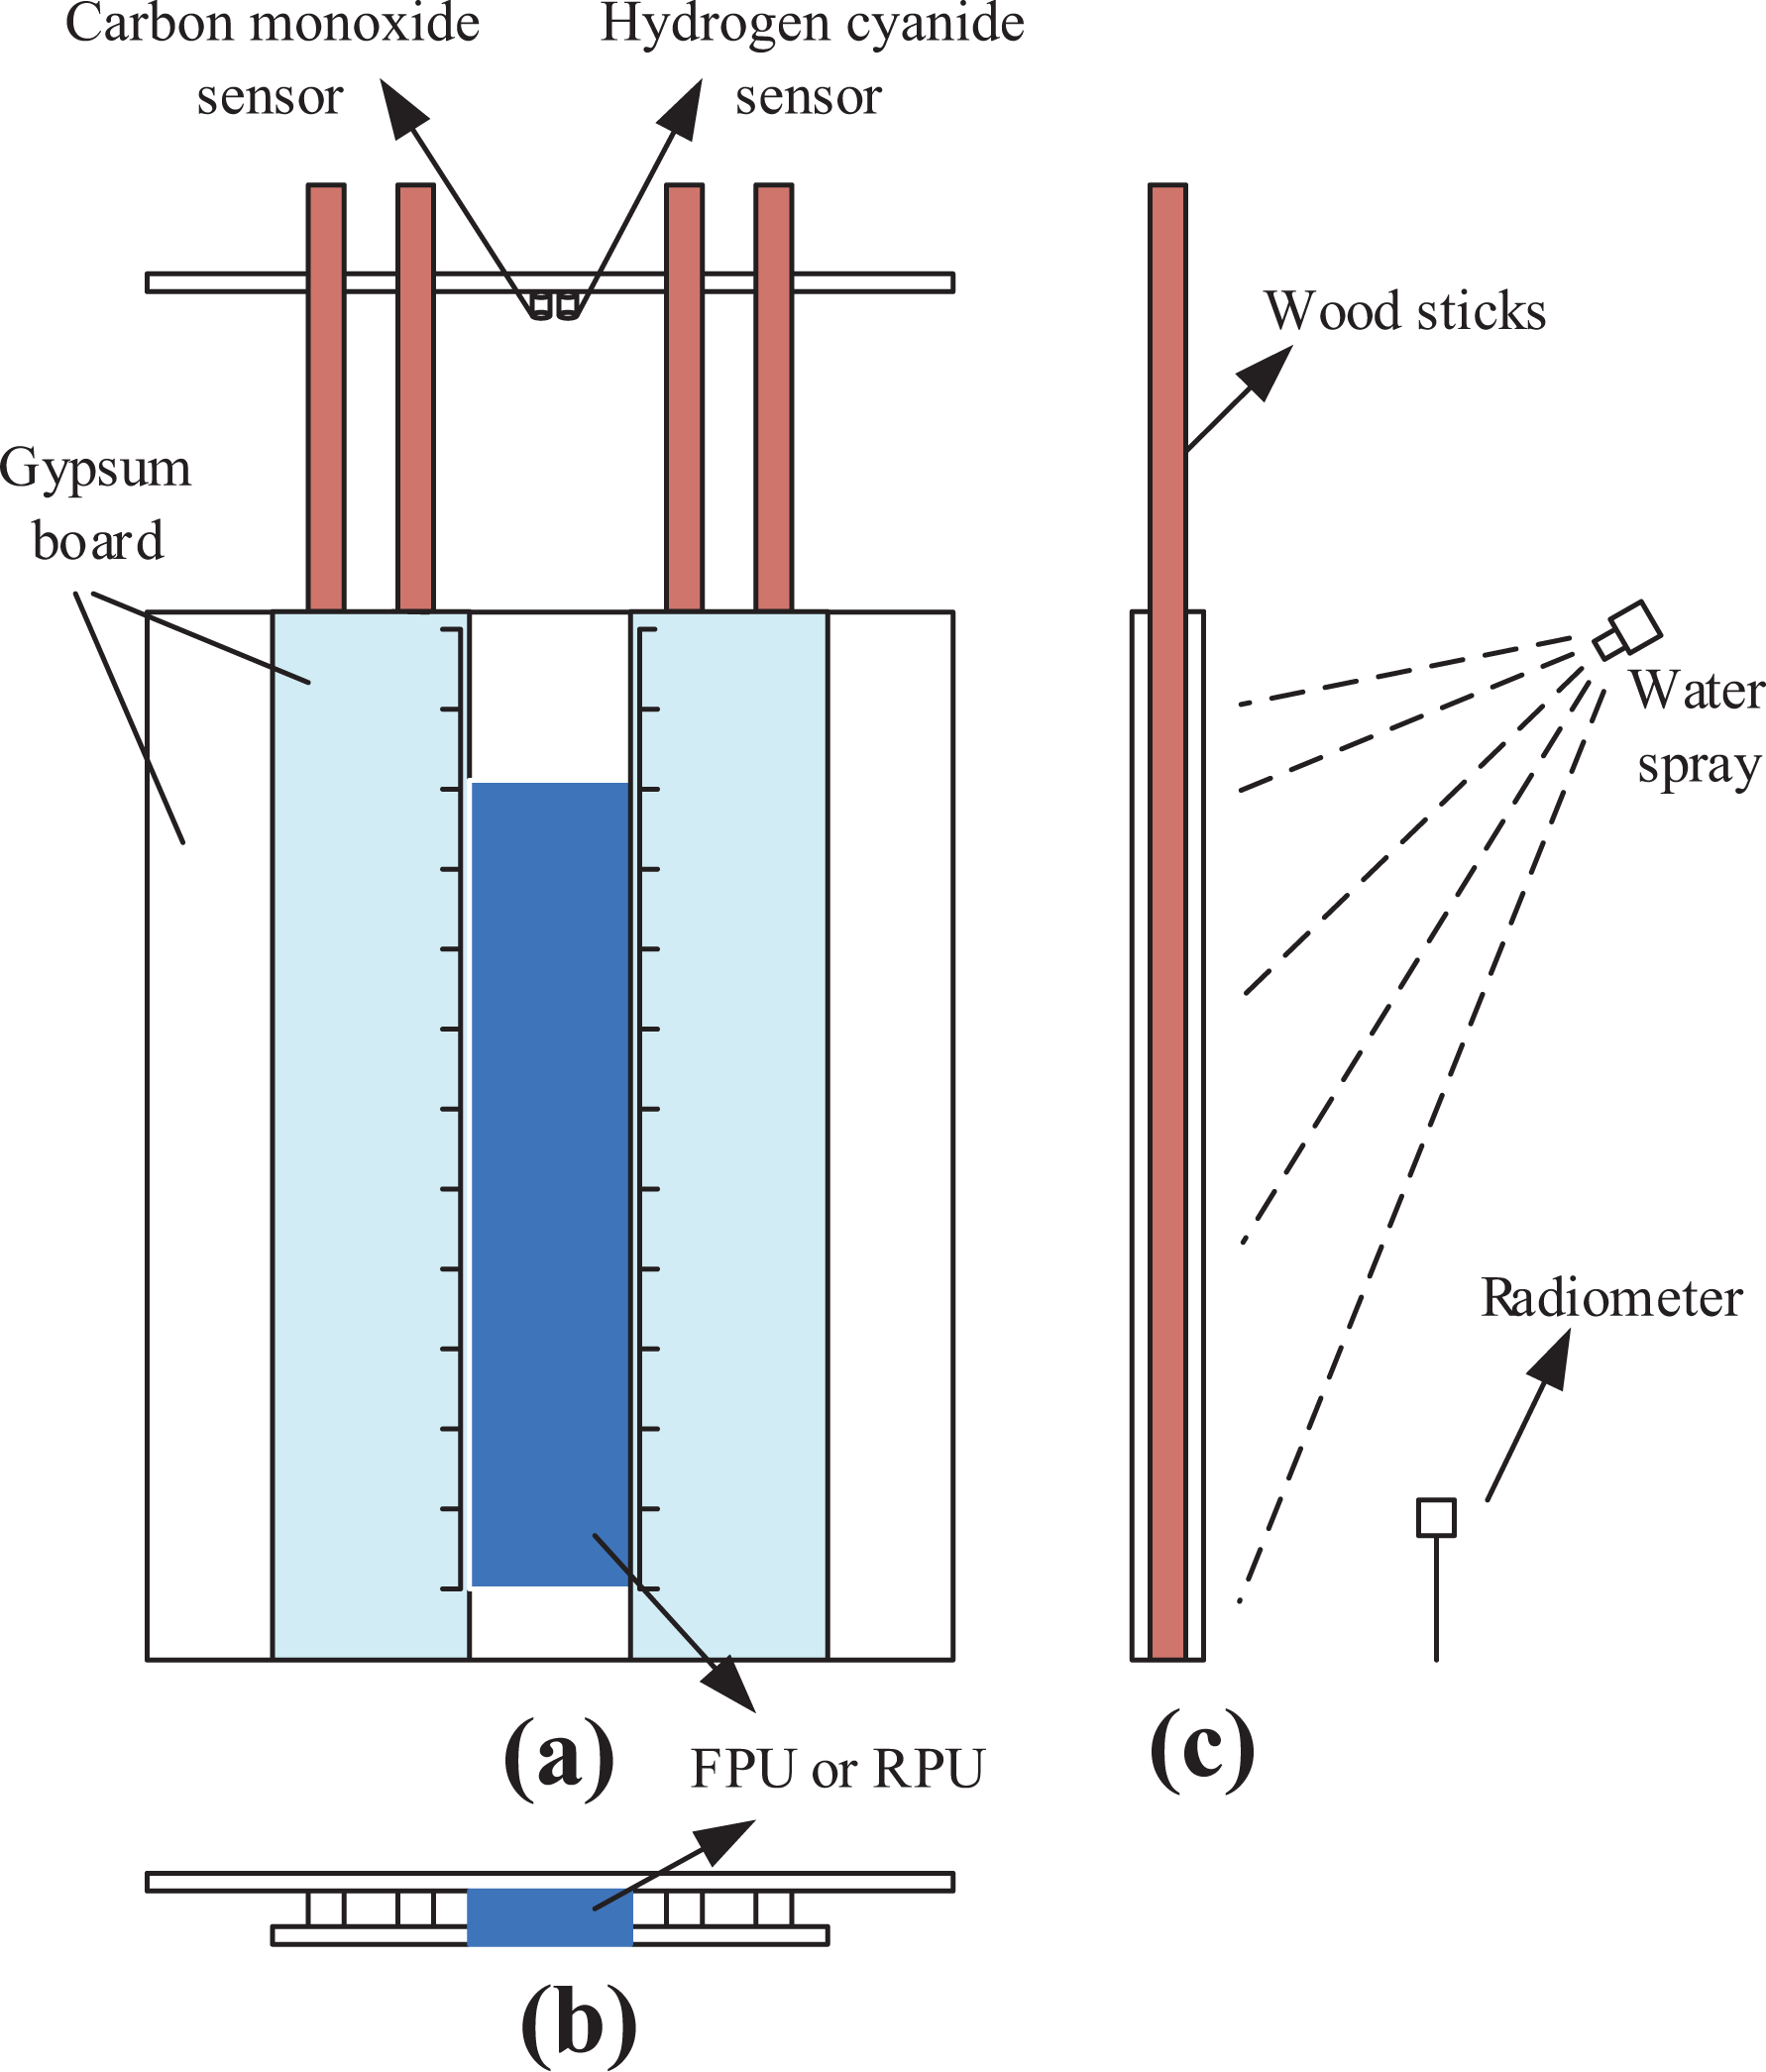
The experimental apparatus (a) front view, (b) top view, and (c) side view.
The surfaces tested were the front face of RPU and FPU slabs of dimensions 500 × 100 × 20 mm3. The slabs were mounted in a gypsum board frame, which consisted of a big gypsum board, two small gypsum boards, and four longer wood sticks. The gap between the big gypsum board and small gypsum board, which was supported by wood sticks, was stuck by foil. The gypsum board frame allowed only the front surfaces of the slabs to ignite and burn and was supported by a stainless steel.
Two synchronized digital camcorders recording at 25 fps were placed in front of the test apparatus to record flame height and pyrolysis front position, respectively. Two professional photography lights were positioned symmetrical on both sides of the frame to improve the quality of the recorded pictures of the charred surface. An optical filter before one camera was adopted to reduce the luminosity to measure flame height. The methods to obtain the flame height and pyrolysis front position were described in detail below.
CO sensor (CLE-0052-400) and HCN (CLE-0731-400) were both positioned at 106 cm height above the bottom of slabs to determine the CO concentration and HCN concentration produced by the samples. The reason we only used the two sensors was that their levels of sensitivities were higher than that of detectors. Normal detector had inspiratory phase, which would increase the response time. In addition, a radiometer used to measure incident heat flux was located 15 cm away from the surface of the materials and 5 cm height above the bottom of the samples.
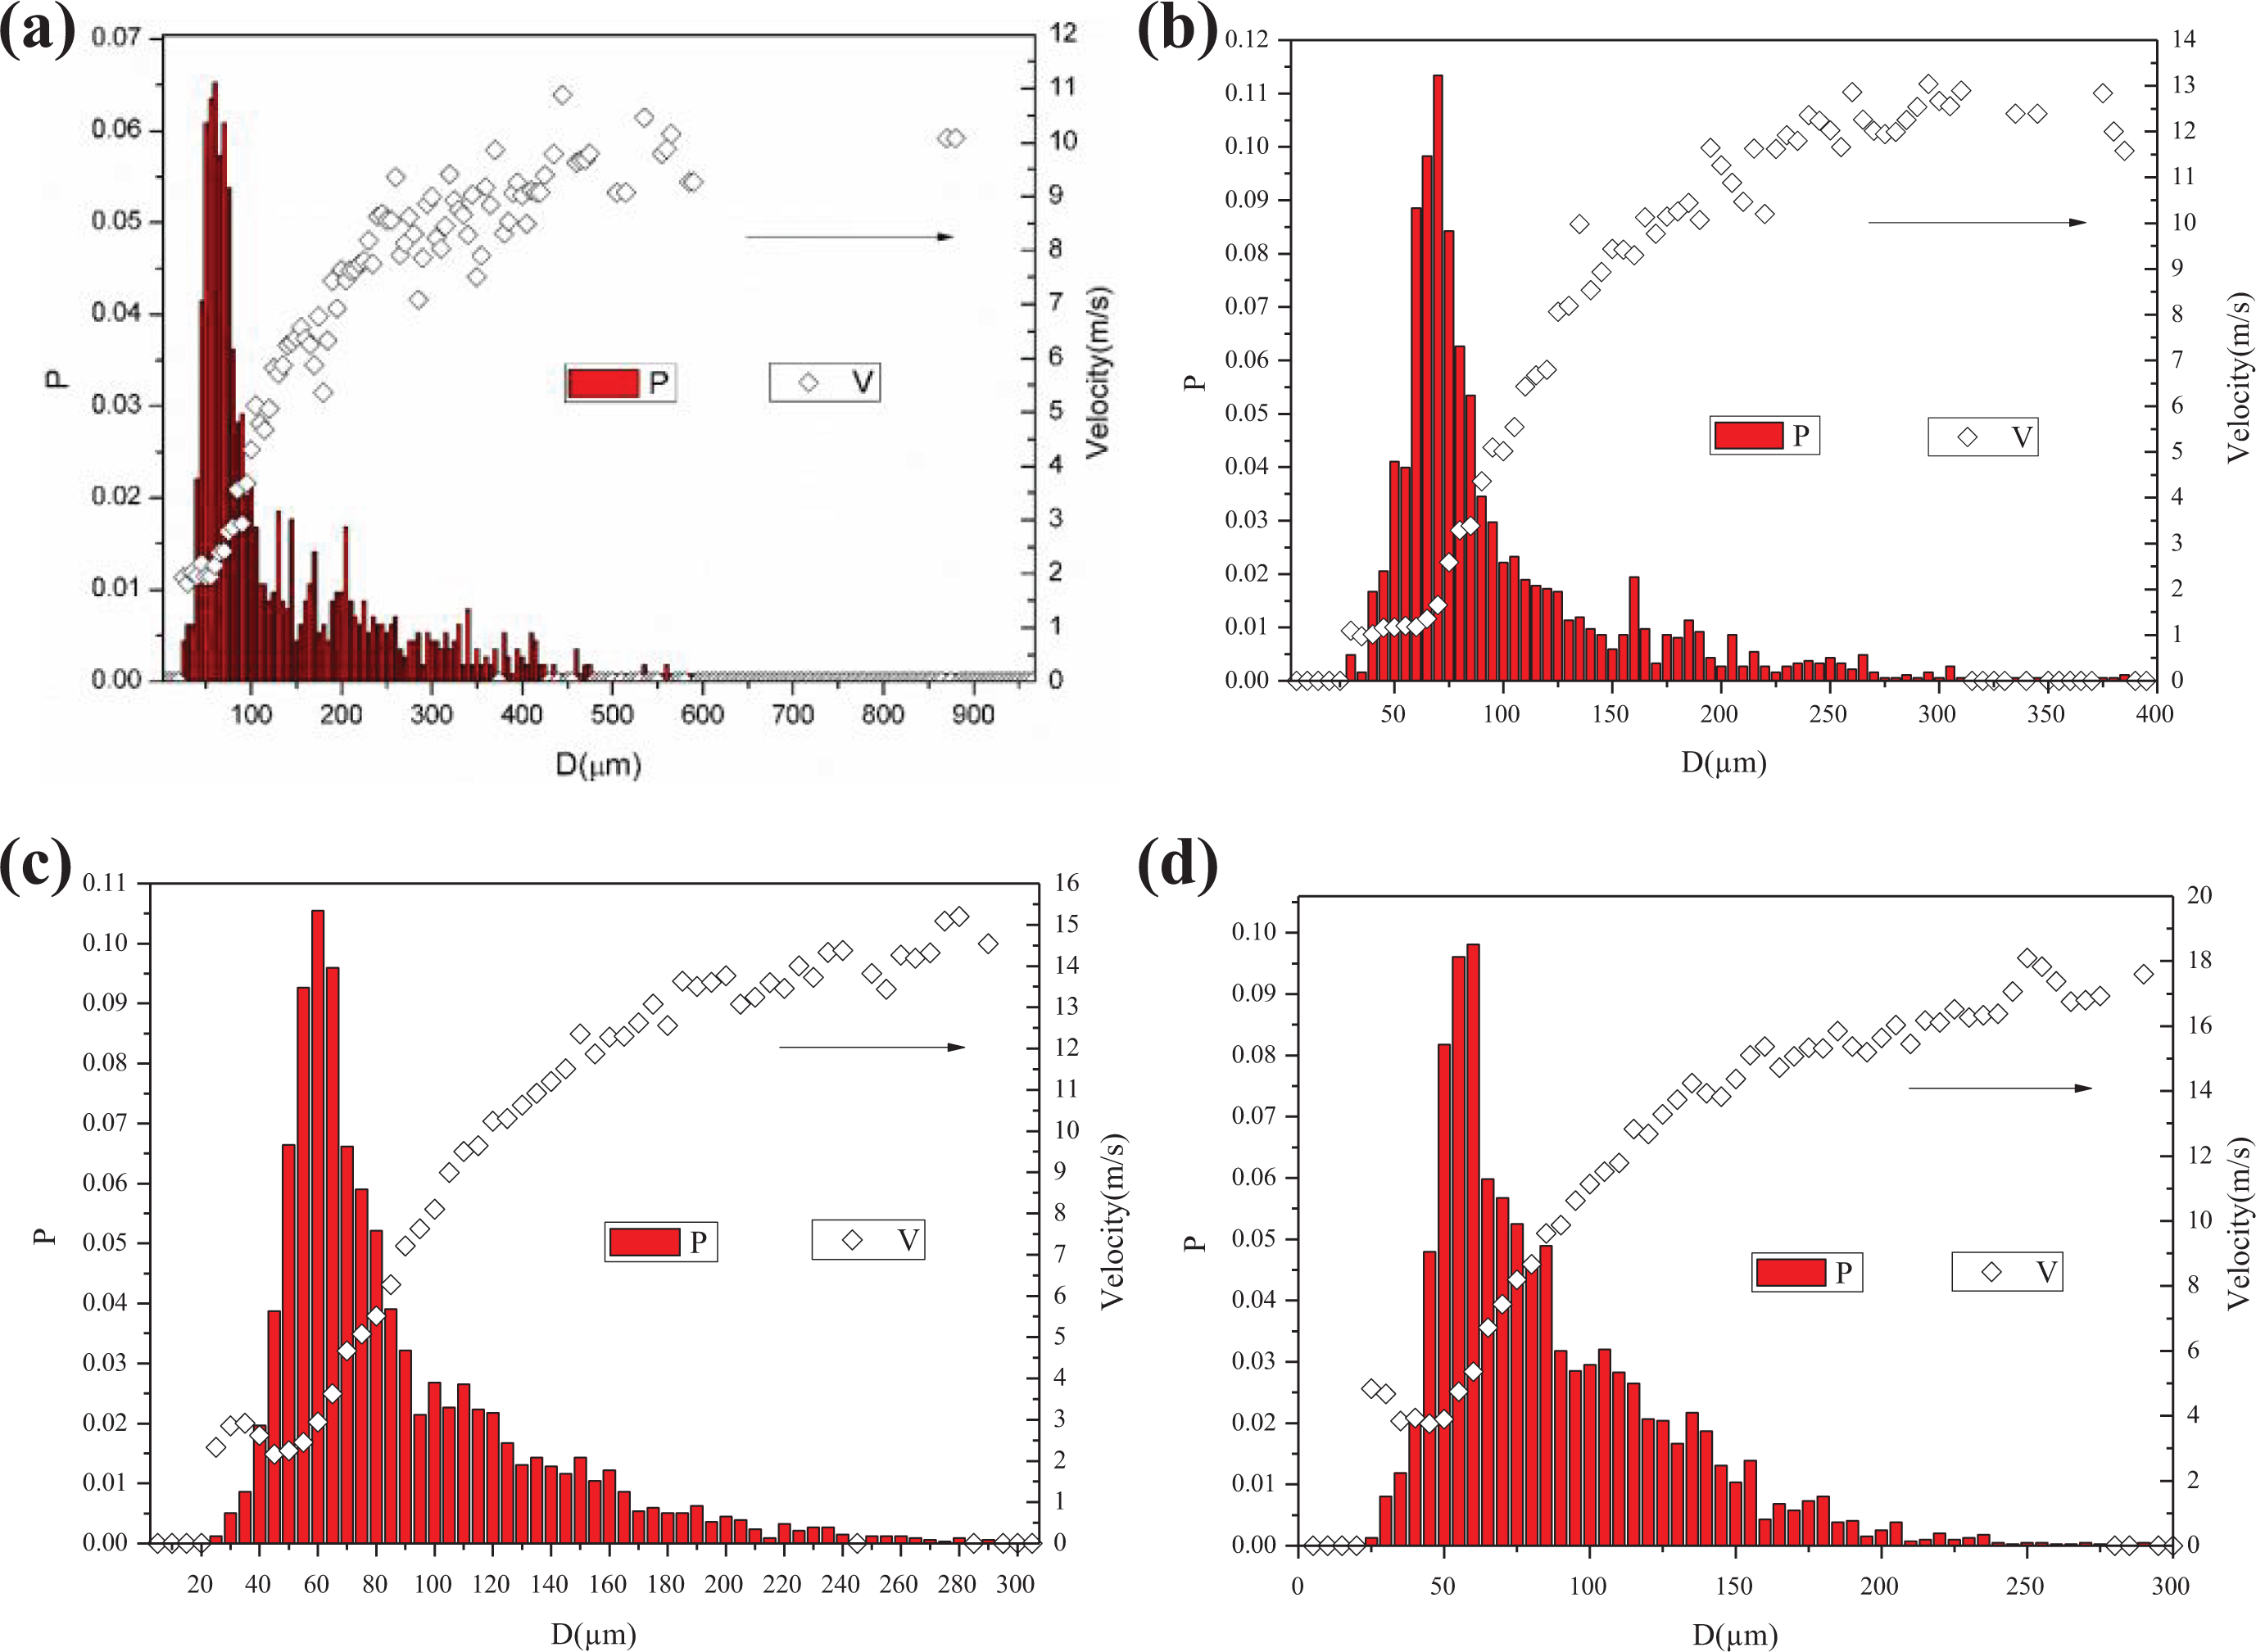
A single spray nozzle was used to generate water spray. The water spray nozzle located 71 cm from the samples’ surface in horizontal direction and 120 cm from the ground in vertical direction. The nozzle tip faced the sample center. The system operating pressure varied from 0.15 MPa to 0.4 MPa. The corresponding volume flux (measured using a micro-flow gauge) and spray cone angle were shown in Table 1.
Volume flux, spray cone angle, and water application rate.
Linear ignition was achieved by adding symmetrical propane burner, which could generate a gas flow rate of 250 ml/min. The ignition source was not removed immediately until 5 s after ignition.
Results and discussions
A series of vertical fire suppression experiments of RPU and FPU with and without water spray were conducted in standard combustion room. For each experiment, the sample was ignited at the bottom using the linear ignition and the ignition time was 5 s. For free burning, the vertical RPU fire spread fast firstly and at last self-extinguished and the FPU fire spread quickly and at last combusted completely. Water spray did not open until 10 s after ignition. Time zero was taken as the onset of flaming.
Water spray characteristics
Water spray was generated by a single atomizer. Operating pressure of the water spray used in these experiments varied from 0.15 MPa to 0.4 MPa. The bwtraceboundary function and polyfit function of MATLAB™ software were used to determine the spray cone angles under different spray pressures. 30 The corresponding volume flux and spray cone angle were shown in Table 1.
The characteristic parameter of the water spray, namely water spray droplet size and velocity, determined fire extinguishing ability. Water droplet size and velocity in these experiments were determined by LaVision’s Particle Master system family.
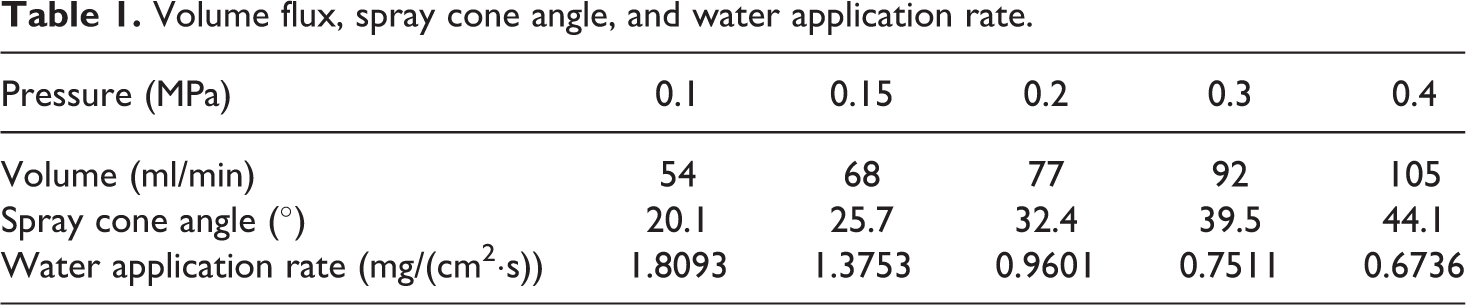
Various types of particle laden fluids with high spatial resolution were analyzed by the imaging system. Particle size and velocity were performed with versatile DaVis software. Imaging techniques of Shadowgraphy (backlight illumination) and interferometric Mie imaging were used in the image processing. Size and velocity of water spray droplet located 12 cm away from the nozzle tip were determined. Figure 2(a) showed droplet size and velocity distribution with various water spray pressures. As the spray pressure decreased, the droplet with large particle size gradually increased and the overall droplet velocity was relatively small. Water droplets size Sauter mean diameter D32 decreased with the pressure increasing, and water spray velocity increased when the pressure increased, as can be seen from Figure 3.
Droplet size and velocity distribution under various spray pressures (a) 0.1 MPa, (b) 0.2 MPa, (c) 0.3 MPa, and (d) 0.4 MPa.
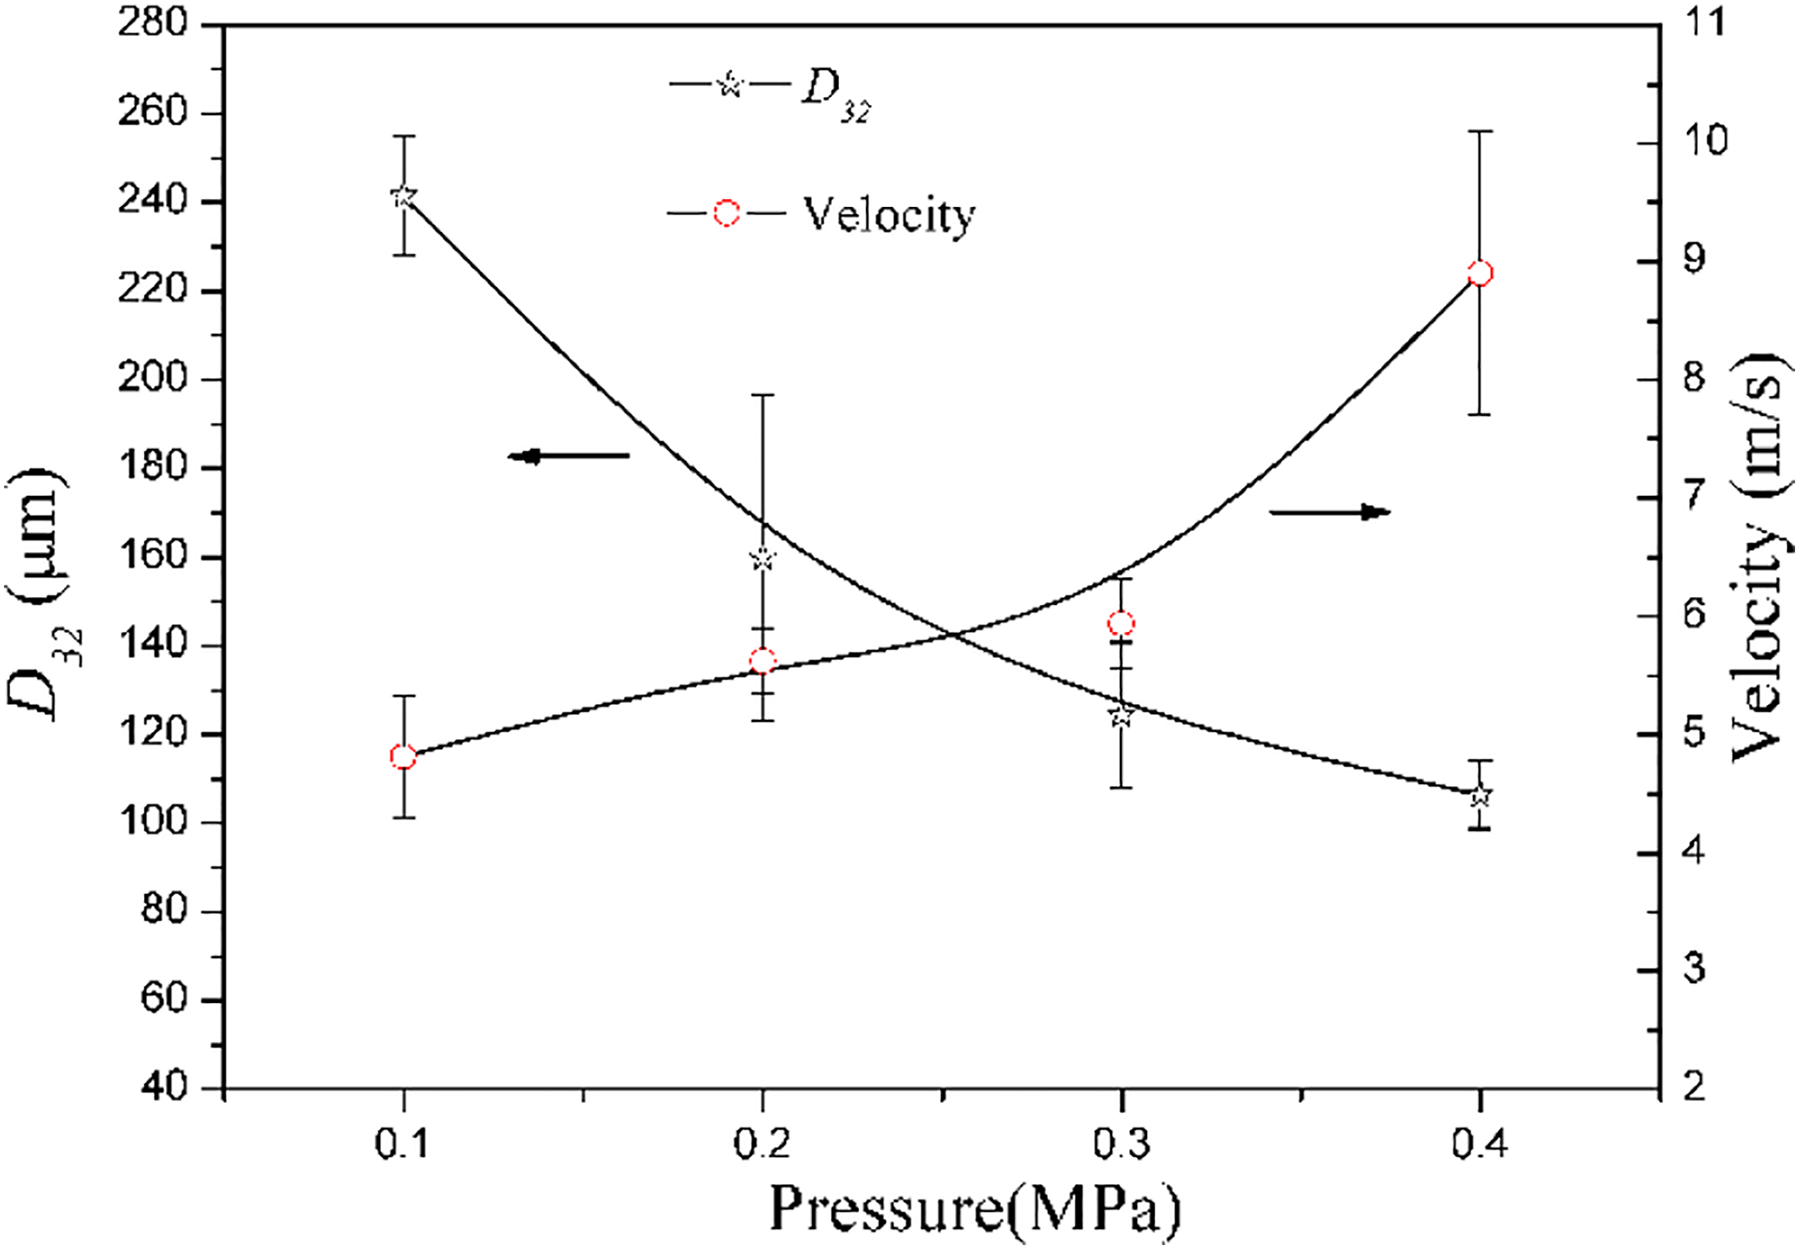
Water droplet size and velocity versus spray pressure.
Pyrolysis front and flame height
Method to judge the pyrolysis front height
The turbulent fluctuating nature of flames causes significant scatter, especially for RPU fires, which would lead to exposed pyrolysis zone. The following method was used to judge these quickly spreading pyrolysis fronts.
The dark region considered as pyrolysis zone was obvious when strong light opened (Figure 4(a)). To extract the black area, RGB image processing was involved. It was easy to know that all colors were composed of three colors—R (red), G (green), and B (blue). Each component had 256 (0–255) levels, where the level 0 was black and the level 255 was white. The original image was divided into three components in RGB color space. The R and G components were consistent with the original image by observing. The threshold level of 0.65 was used to express the dark region. For R and G image, if both of the RGB levels (0–255) were less than the threshold, the binary value was set to 1. At the same time, the remaining levels were all set to 0. The final binarization result of processed image was shown in Figure 4(a-B).
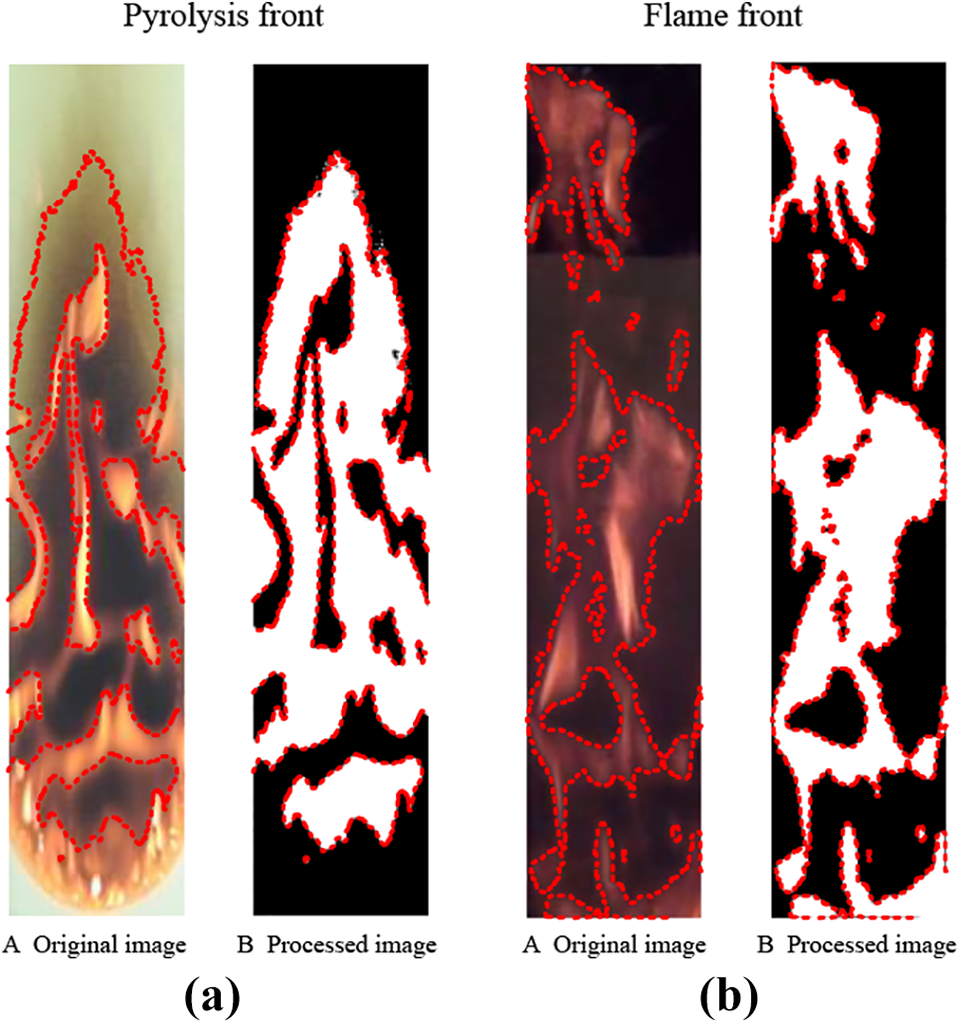
The original and processed image (a) pyrolysis front and (b) flame front.
In fact, not all of the camera recordings could show the pyrolysis zone accurately, because it may be blocked by the flame. Therefore, a frame picture was chosen to identify the pyrolysis front position with the RGB method first and then the pyrolysis front position of the next frame picture was also determined. If the latter pyrolysis front position value was higher than the former, the two values were both reserved. If the latter pyrolysis front position value was less than the former, the first value was retained and the second value should be removed. Then, the pyrolysis front position value of the third frame should be compared with the higher of the value as expressed before. Finally, a series of data, increasing gradually over the time, were found out.
Method to determine the flame height
There were many methods to determine the flame height,3–6 including by marking a ruler besides the combustible samples and the thresholds of video pictures by graying and binarizing to find the extent of the flame. In this article, RGB images were obtained to find out the extent of the flame.
An optical filter before the camera was used to reduce the luminosity. The original image was easy to be divided into RGB image. The R image was consistent with the original image by observing. The threshold level of 0.75 was used to express the red region. For R image, if the RGB levels (0–255) were bigger than the threshold, the binary value of 1 was given to these levels. At the same time, the remaining levels were all set to 0. The final binarization result was also shown in Figure 4(b-B). Every five frame images sequentially were tied together and averaged. That was, there would be a series of averaged flame heights every 0.2 s.
Flame height
Averaged flame heights of RPU and FPU with and without water spray were shown in Figure 5. It was easy to observe that there was a rapid flame spread stage (between the dotted lines) once the RPU and FPU were ignited. The flame spread stages was defined about 2 s for FPU and 6.5 s for RPU after the linear ignition being removed. The water spray was applied when the free burning time was 10 s (Figure 5, black solid line) for FPU and RPU. The averaged flame heights of FPU and RPU decreased immediately to a constant value once the water spray was applied. The lower the operating pressure, the higher the averaged flame height, as can be seen from Figure 5(a) and (b), respectively.
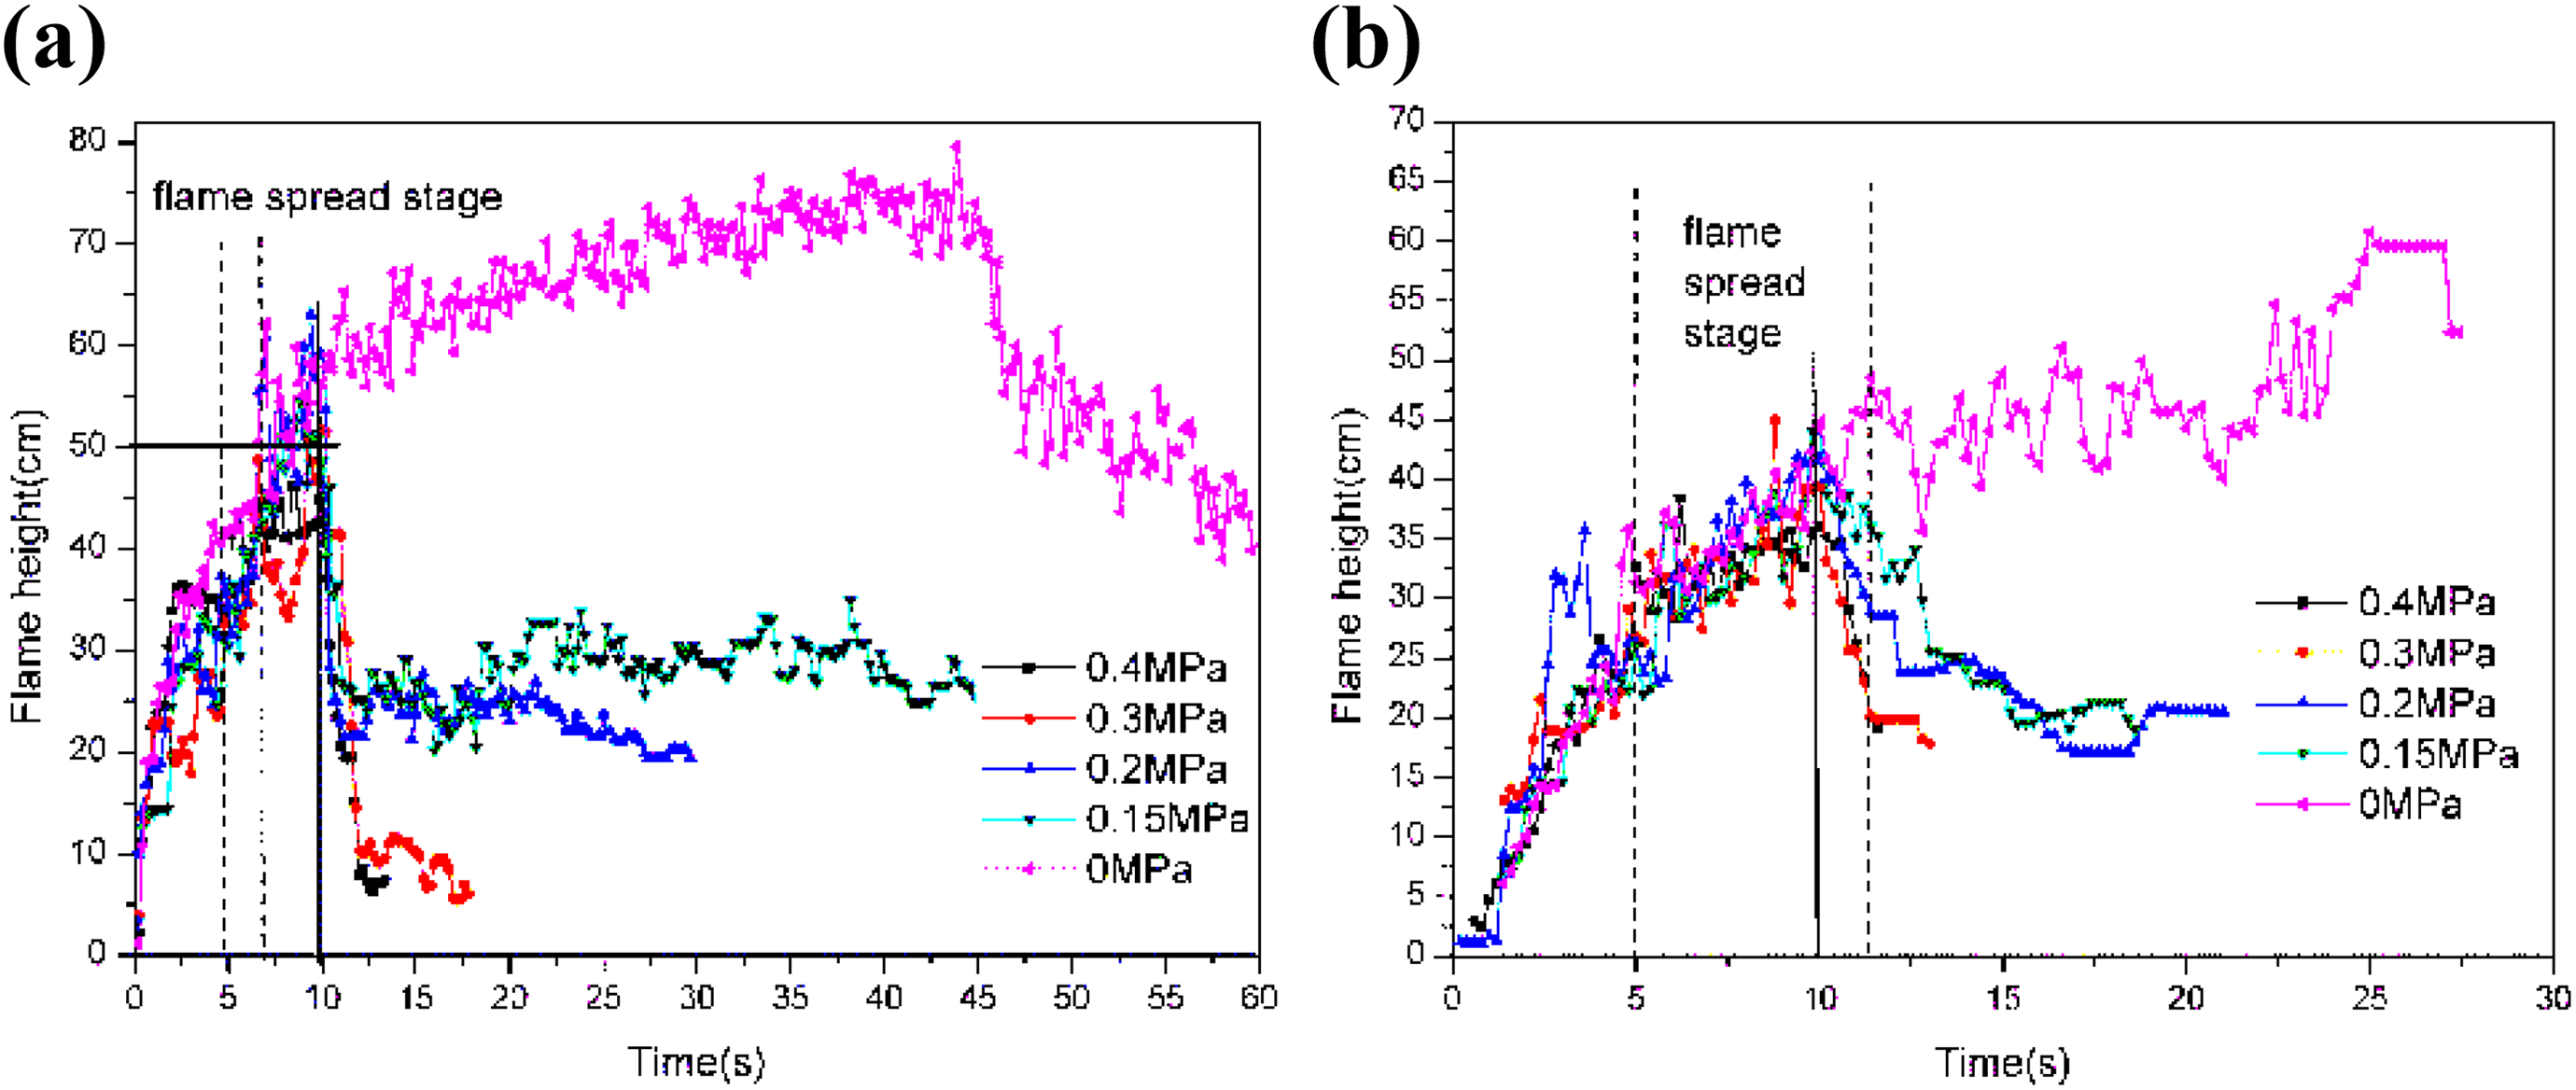
Flame height with and without water spray (a) FPU and (b) RPU.
Averaged flame height of the flame spread stages with double repeated experiment were illustrated in Figure 6. In general, xp and xf increased exponentially with time for upward flame spread. 10 From Figure 6(a) and (b), they can be seen that a power-law fit, xf = Atn, with n = 2.95 for FPU and n = 1.28 for RPU. The exponents were different from that of corrugated cardboard, PMMA, and wood, which were 1.5, 13 2, 31 and 1, 32 respectively. This suggest that FPU spread faster than PMMA, and RPU spread slower than corrugated cardboard but faster than wood.
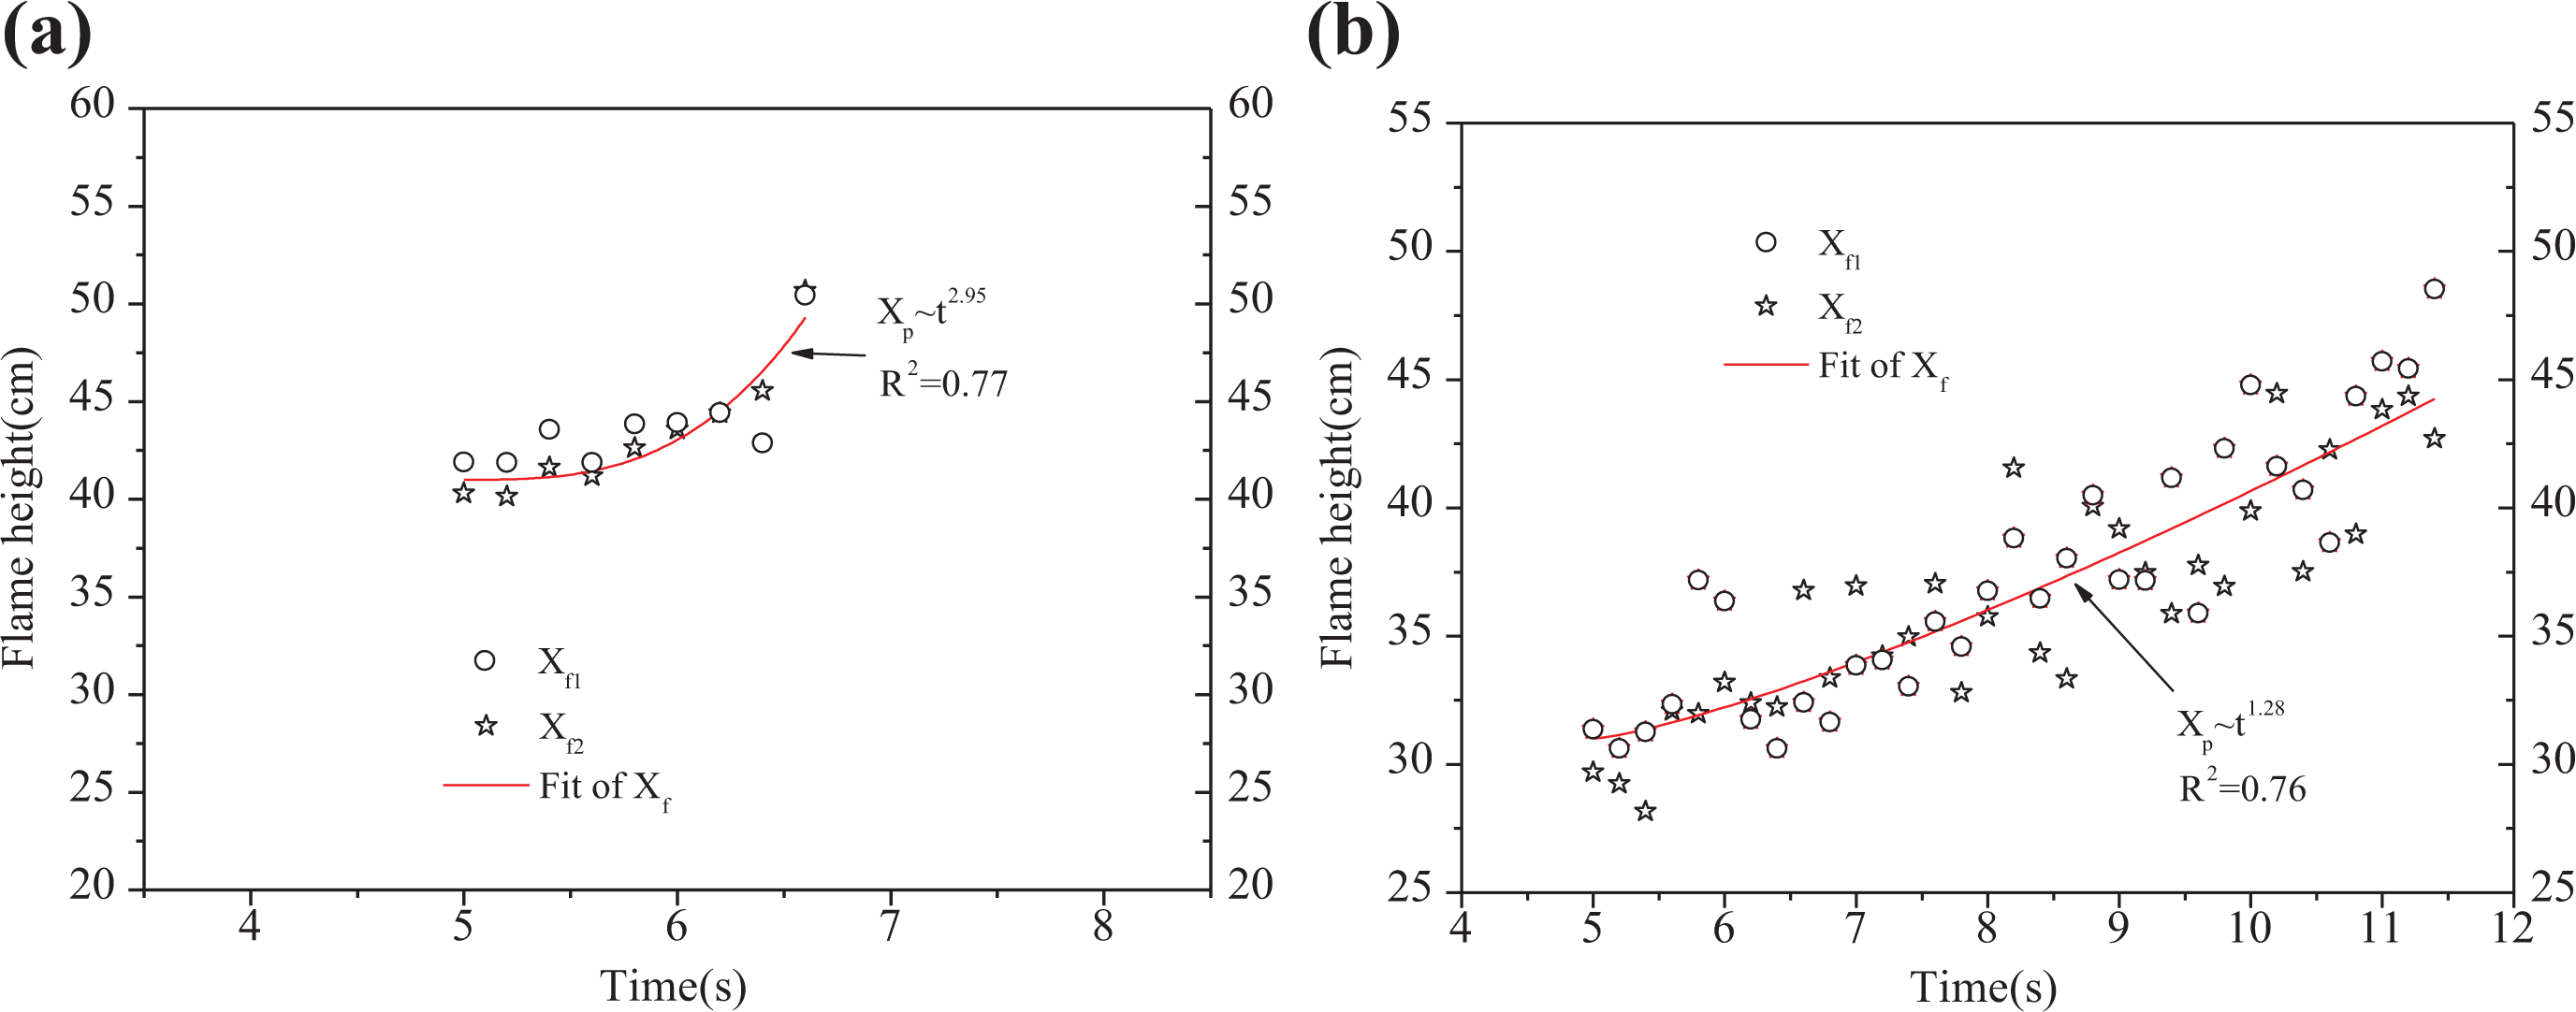
Flame height with non-spray (a) FPU and (b) RPU.
Pyrolysis front height
In this article, the pyrolysis front height of RPU was only determined, because FPU deformed easily. Pyrolysis front positions with double repeated experiment were shown in Figure 7. RPU material changed in color once charring occurred. The RGB image was used to determine the pyrolysis front. It could be seen that a power-law fit agreed best with data, xp = Btn, with n = 1.09, which was similar with wood fire. 32 The exponent of flame height was bigger than that of pyrolysis front for RPU. This suggest that flame height growth rate was larger than pyrolysis front growth rate, which leads to increase of preheating region. This is also the direct reason of fire self-extinguishment.
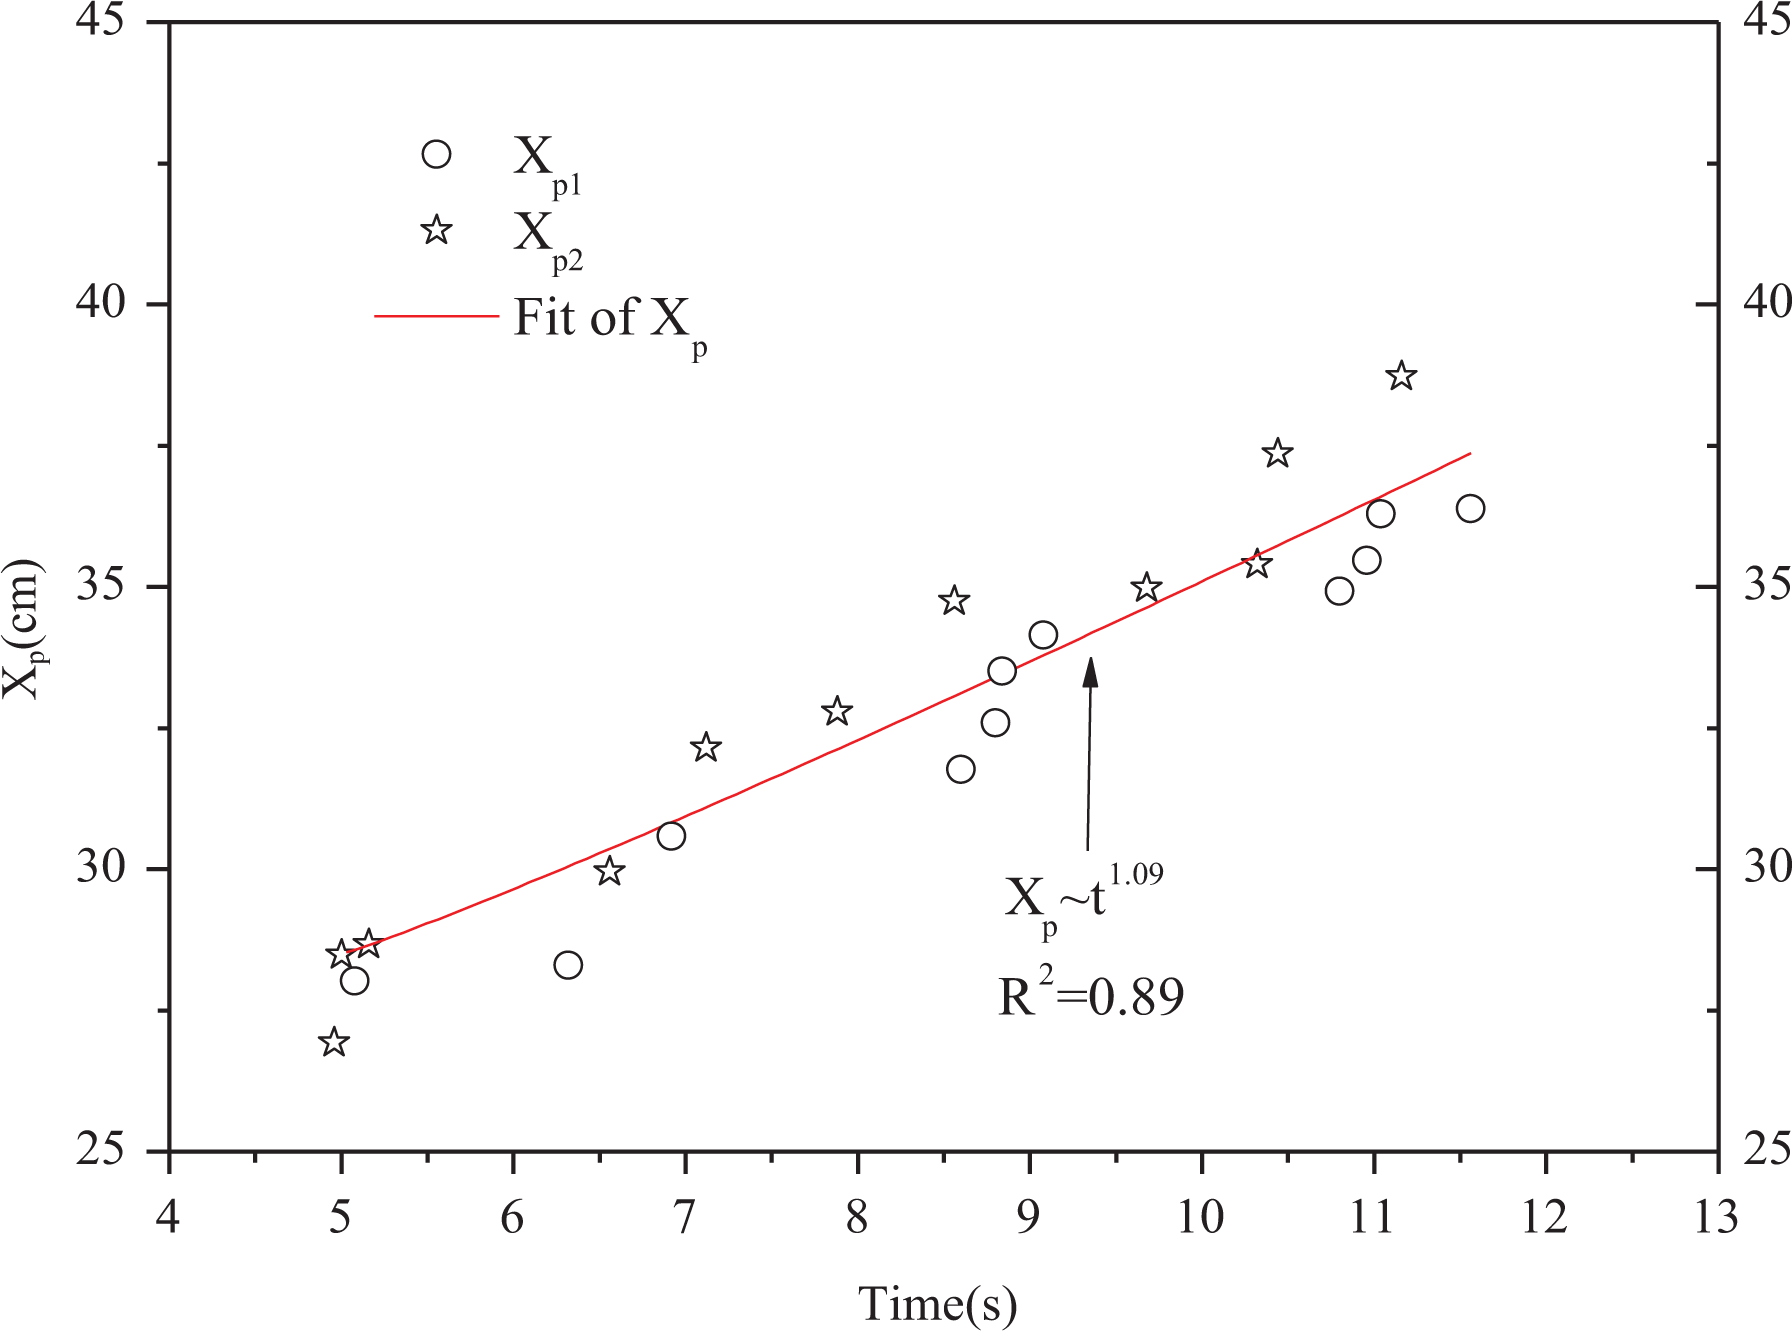
Pyrolysis front height of RPU with non-spray.
Toxic gases
Toxic smoke ingredient concentration is a significant parameter in the fire safety analysis. It has been revealed by previous studies that CO is the principle deadly toxic gas in fires. In this investigation, the HCN was chosen as a representative toxic besides CO, because the content of isocyanate and polyurethane included in RPU and FPU may produce HCN, which is highly toxic. The main components of RPU were polyurethane and isocyanate, respectively. The main components of FPU were polyurethane and polyol, respectively. With the increase in isocyanate, RPU was difficult to burn. On the contrary, with the increase in polyol, FPU was easy to burn.
Peak CO and HCN concentration were shown in Figure 8. Obviously, the peak CO concentration of RPU was higher than that of FPU with any water spray pressure (Figure 8(a)). When the water spray was applied to the sample, the peak CO concentration decreased immediately. With the pressure increased, the peak concentration decreased to a smallest value. Afterward, more CO would be produced due to the oxygen deficit.
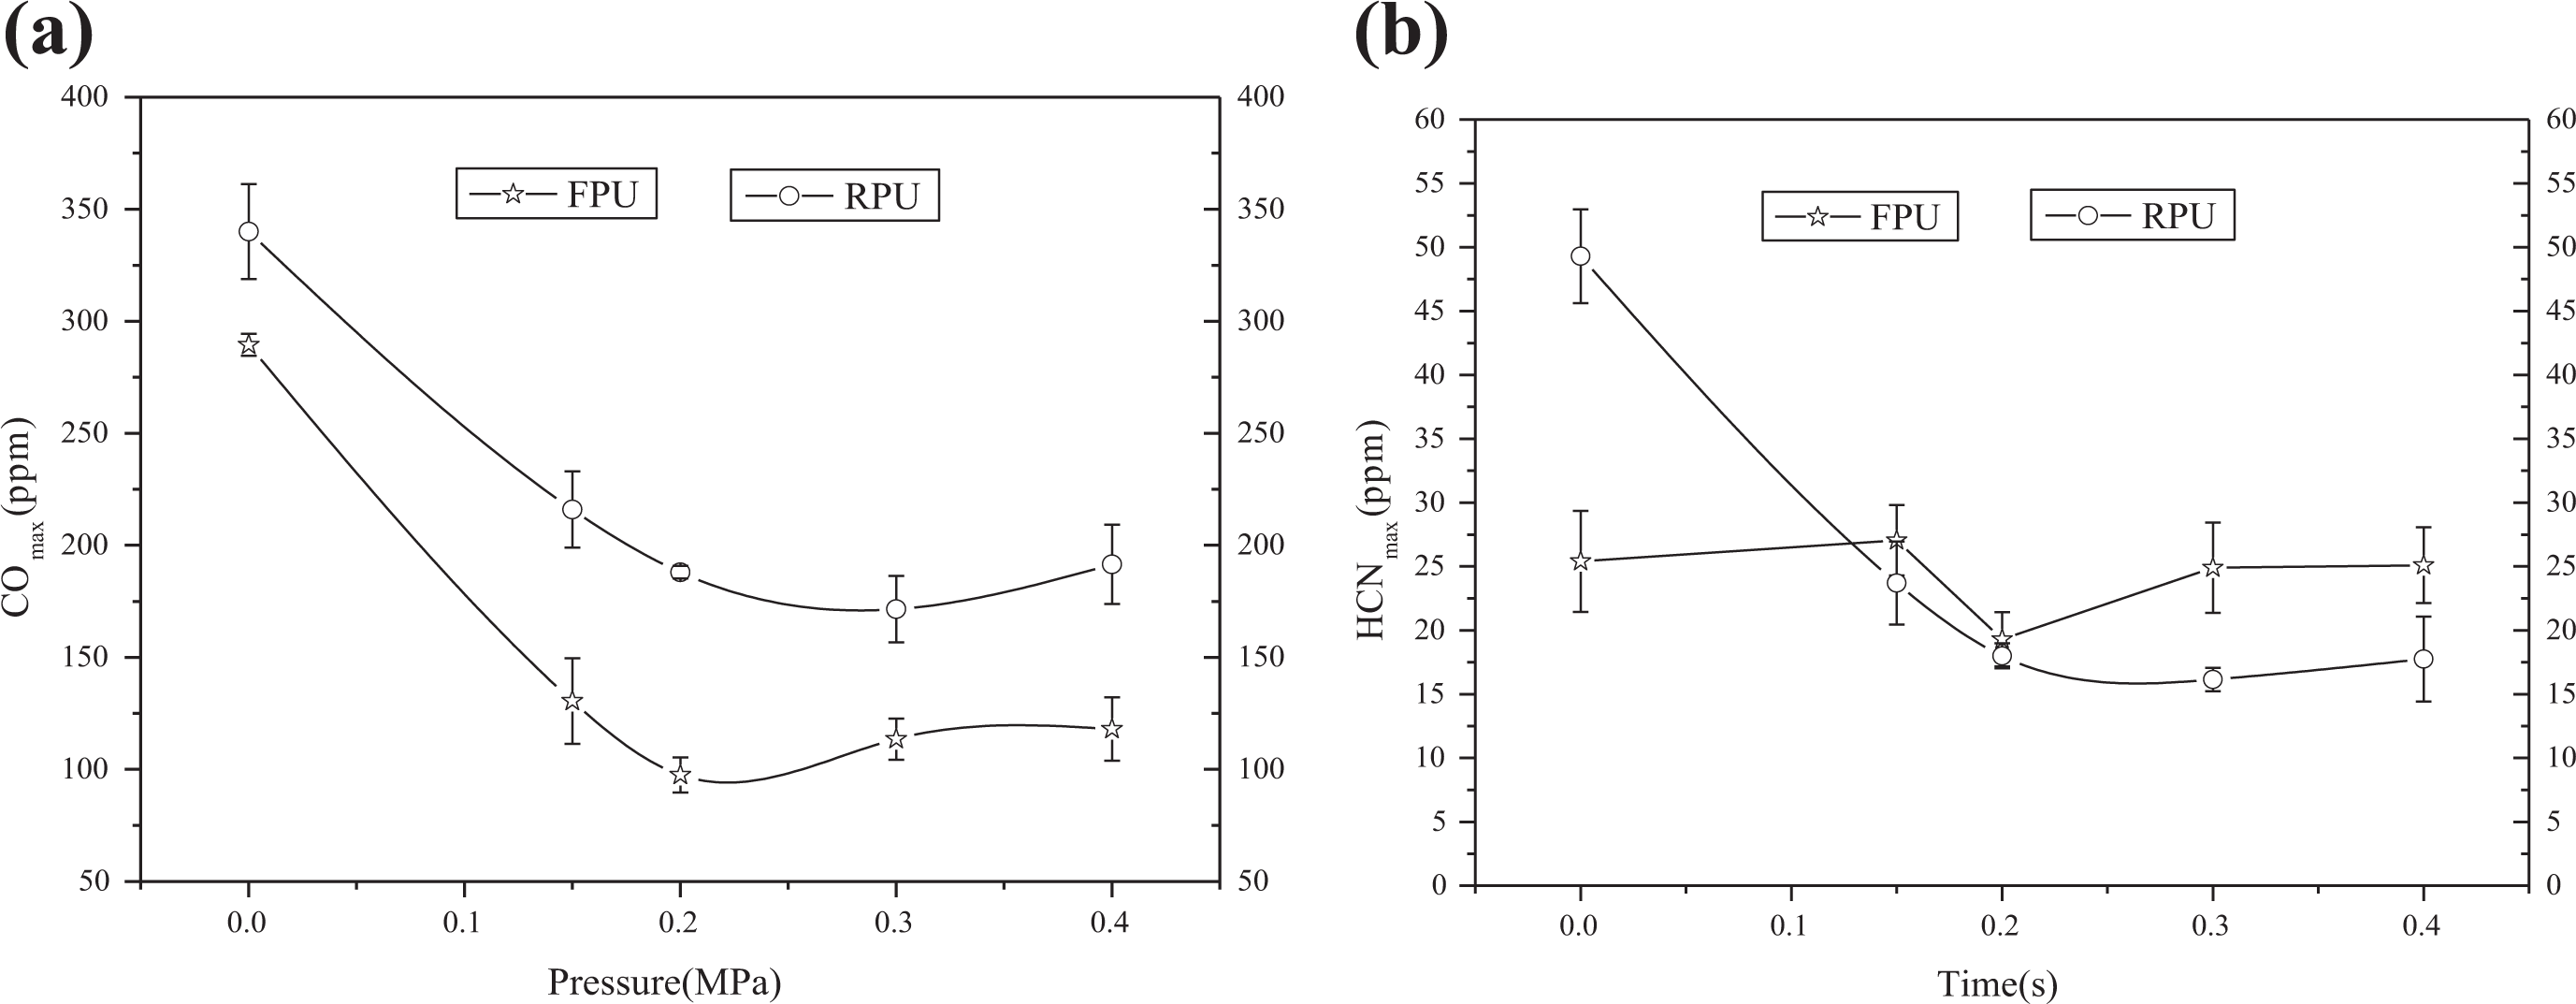
The maximum toxic gas concentration produced by FPU or RPU (a) carbon monoxide and (b) hydrogen cyanide.
As is shown in Figure 8(b), peak HCN concentration of RPU was remarkably similar to peak CO concentration for RPU. Peak HCN concentration of RPU was higher than that of FPU with non-water spray. Because the content of isocyanate was higher and the nitrogen content of isocyanate was also higher, which was about 32.5%. However, spray pressure had little effect on the peak HCN concentration for FPU.
Figure 9 gave the results of time-dependent accumulated CO and HCN concentration with various water spray pressures. More detailed accumulated data were displayed in Table 2. In conclusion, 0.3 MPa for FPU and RPU may be the best choice to suppress corresponding fire.
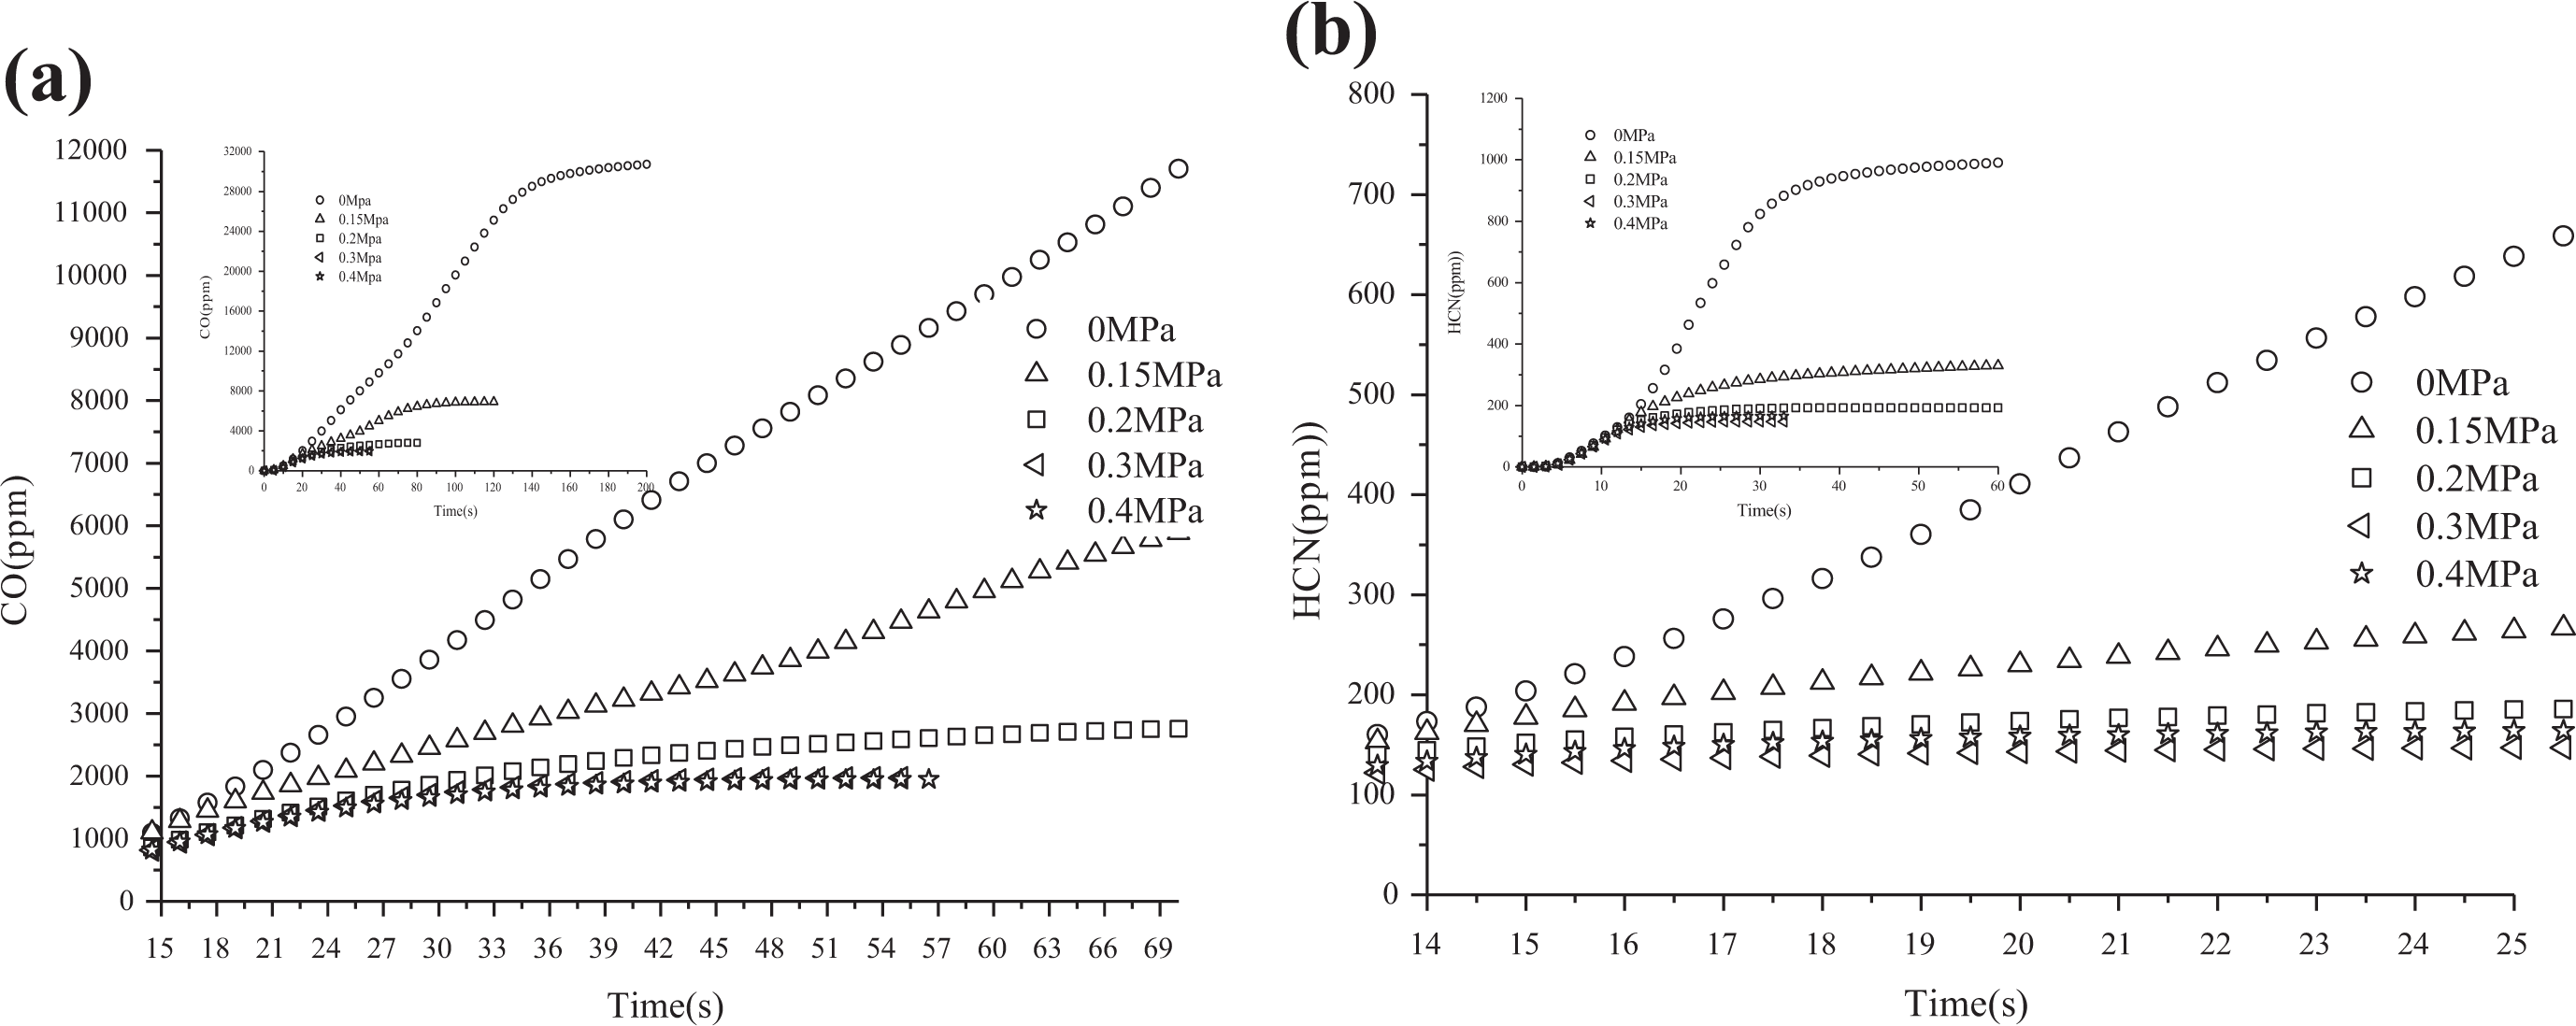
The accumulated toxic gases concentration (a) carbon monoxide produced by FPU and (b) hydrogen cyanide produced by RPU.
The accumulated CO and HCN concentration produced by FPU or RPU.
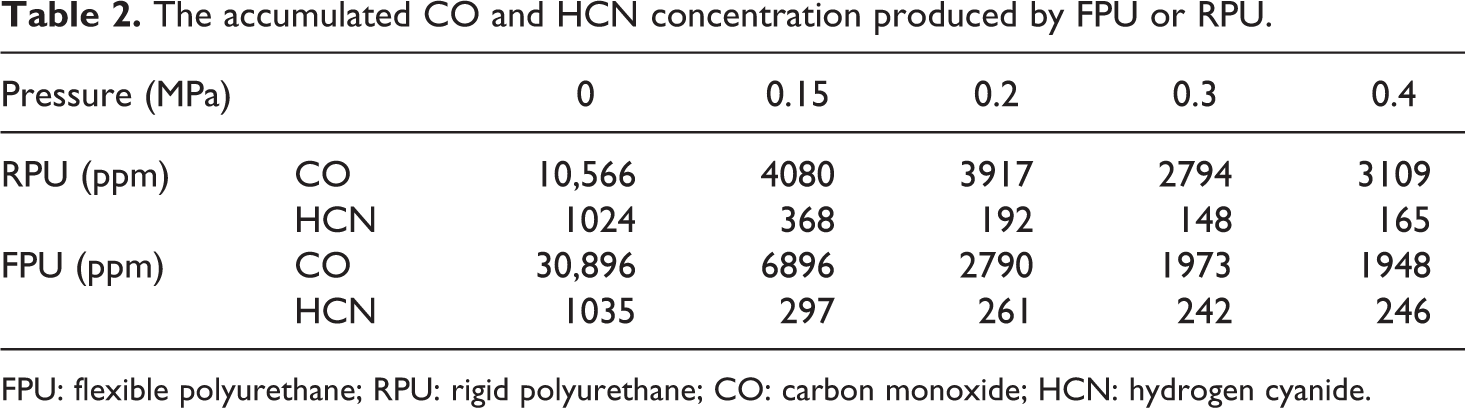
FPU: flexible polyurethane; RPU: rigid polyurethane; CO: carbon monoxide; HCN: hydrogen cyanide.
Thermal radiation
Thermal radiation is also an important parameter in a fire development, because radiation would have a major impact on the combustible materials around and self-support combustion.
Figure 10 maps the slope of radiation decreasing under different water spray pressures. The incident heat fluxes when the water sprays were not applied for RPU and FPU were about 200 and 160 W/m2, respectively. The incident heat flux decreased quickly once the water spray was applied. The higher the operating pressure, the more quickly the slope increased. The slopes of radiation decreasing when operating pressure were 0.15 and 0.2 MPa had no big change, but had a big change when water spray was 0.3 and 0.4 MPa. The higher the pressure, the higher power needed. Maybe the best water spray pressure for both RPU and FPU fire suppressions was 0.3 MPa.
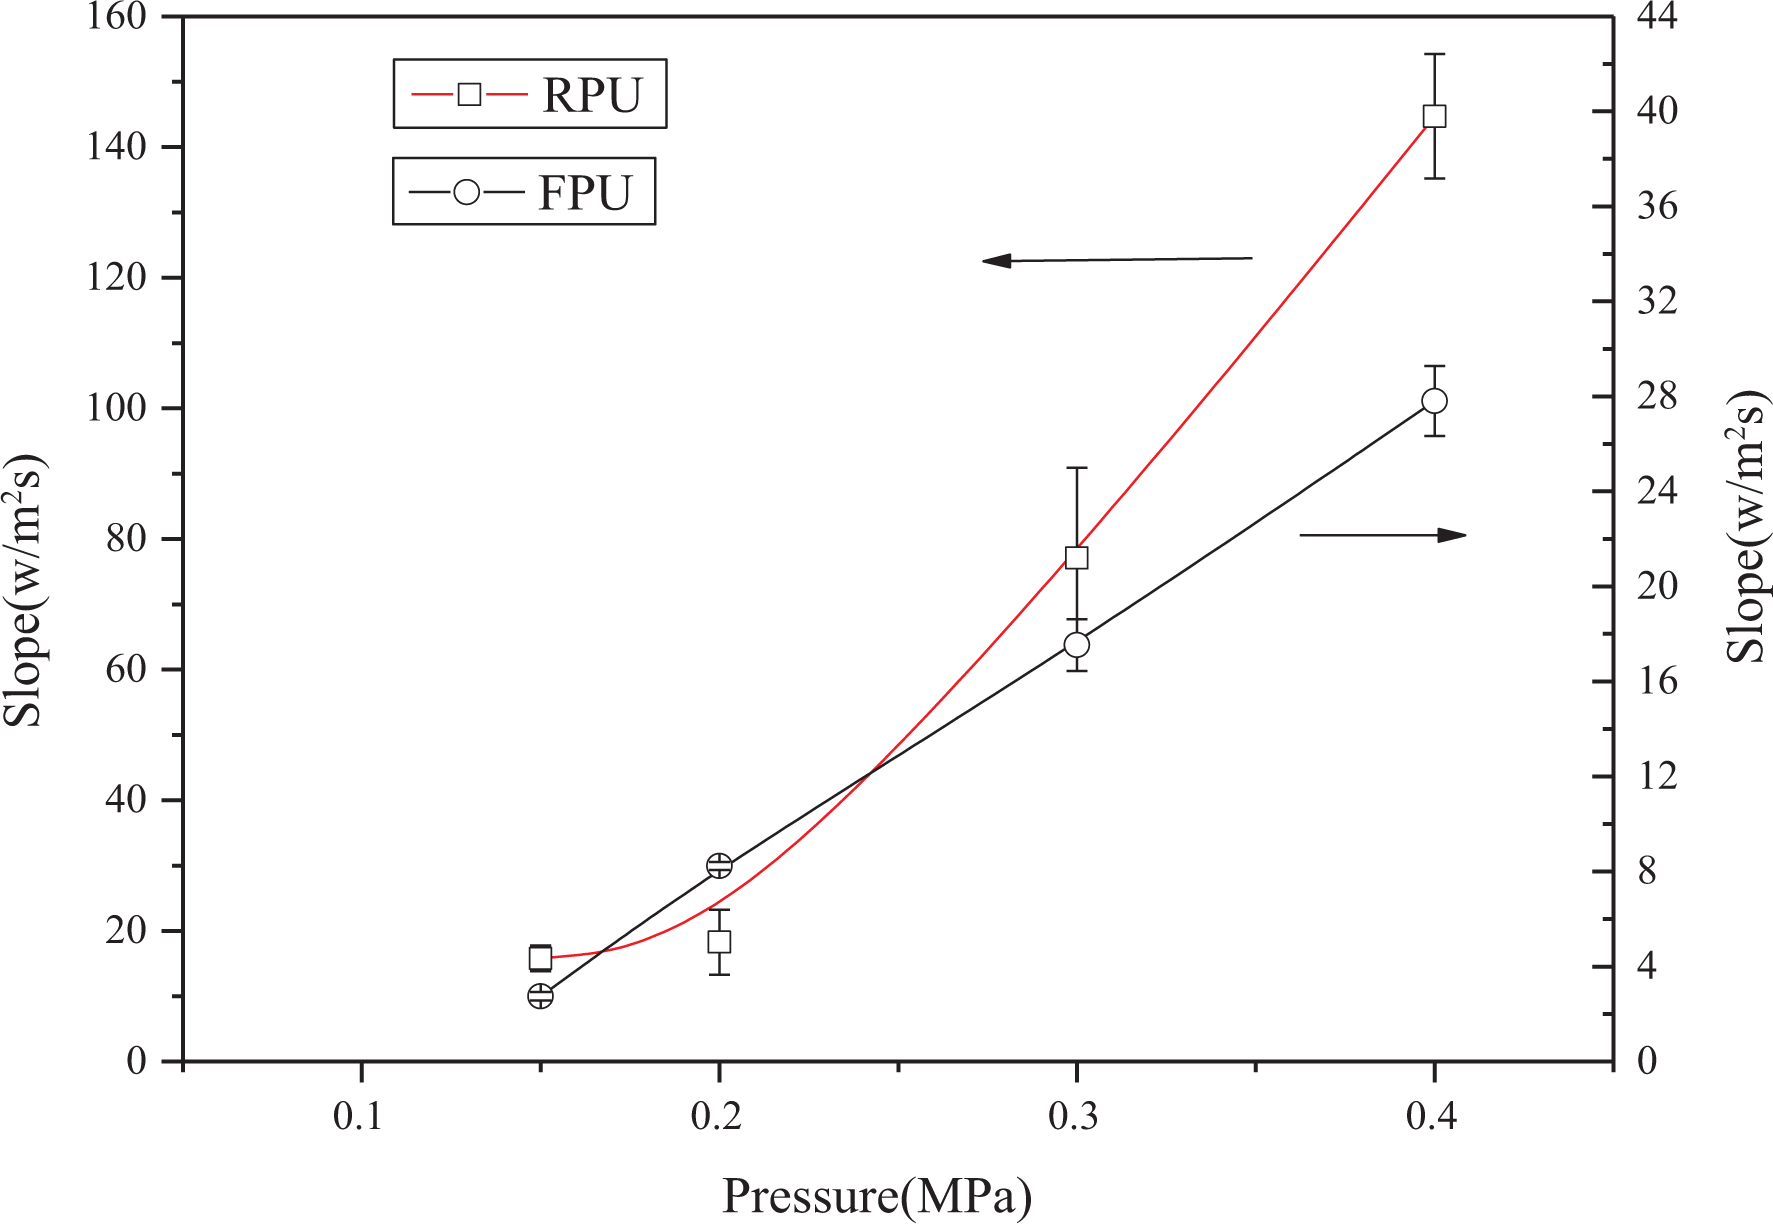
Slope of radiation decreasing when water spray was applied.
View factor Fij was defined as the percent of the radiation from surface i to surface j. Fij was an important parameter in the radiation transfer calculations respects.
Aj was the flame area. Ai was the surface area of radiometer. We assumed that Ai and Aj were diffuse surfaces, respectively. Ai was far less than Aj. The view factor Fij was calculated first. 32
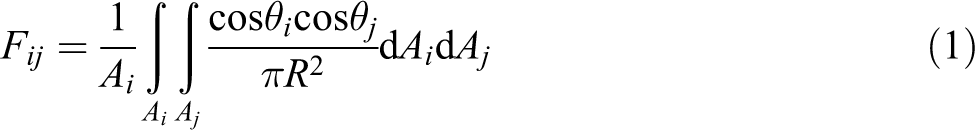
We assumed that the radiometer surface was parallel to the flame surface, so the θi, θj, R, and Ai were considered as regardless of the position, that was θi = θj = θ. Thus, the above equations could be simplified as follows.
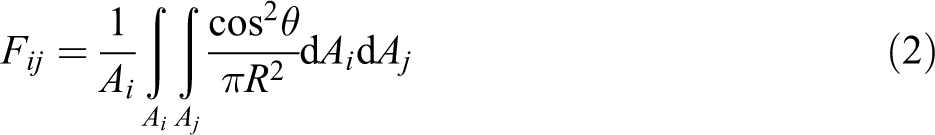
According to Figure 11, it was easy to obtain the following relationship: R2 = x2 + y2 + L2, cosθ = L/R. In this article, the width of sample was W = 10 cm, the height of flame was H, the height of sample was h = 50 cm, and L was the distance from the radiometer to the flame surface.
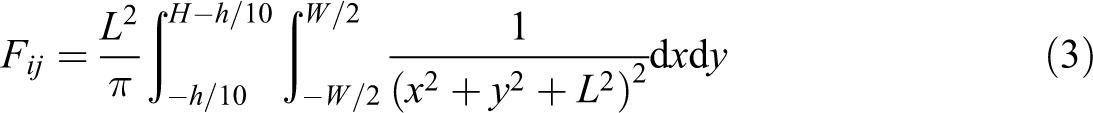
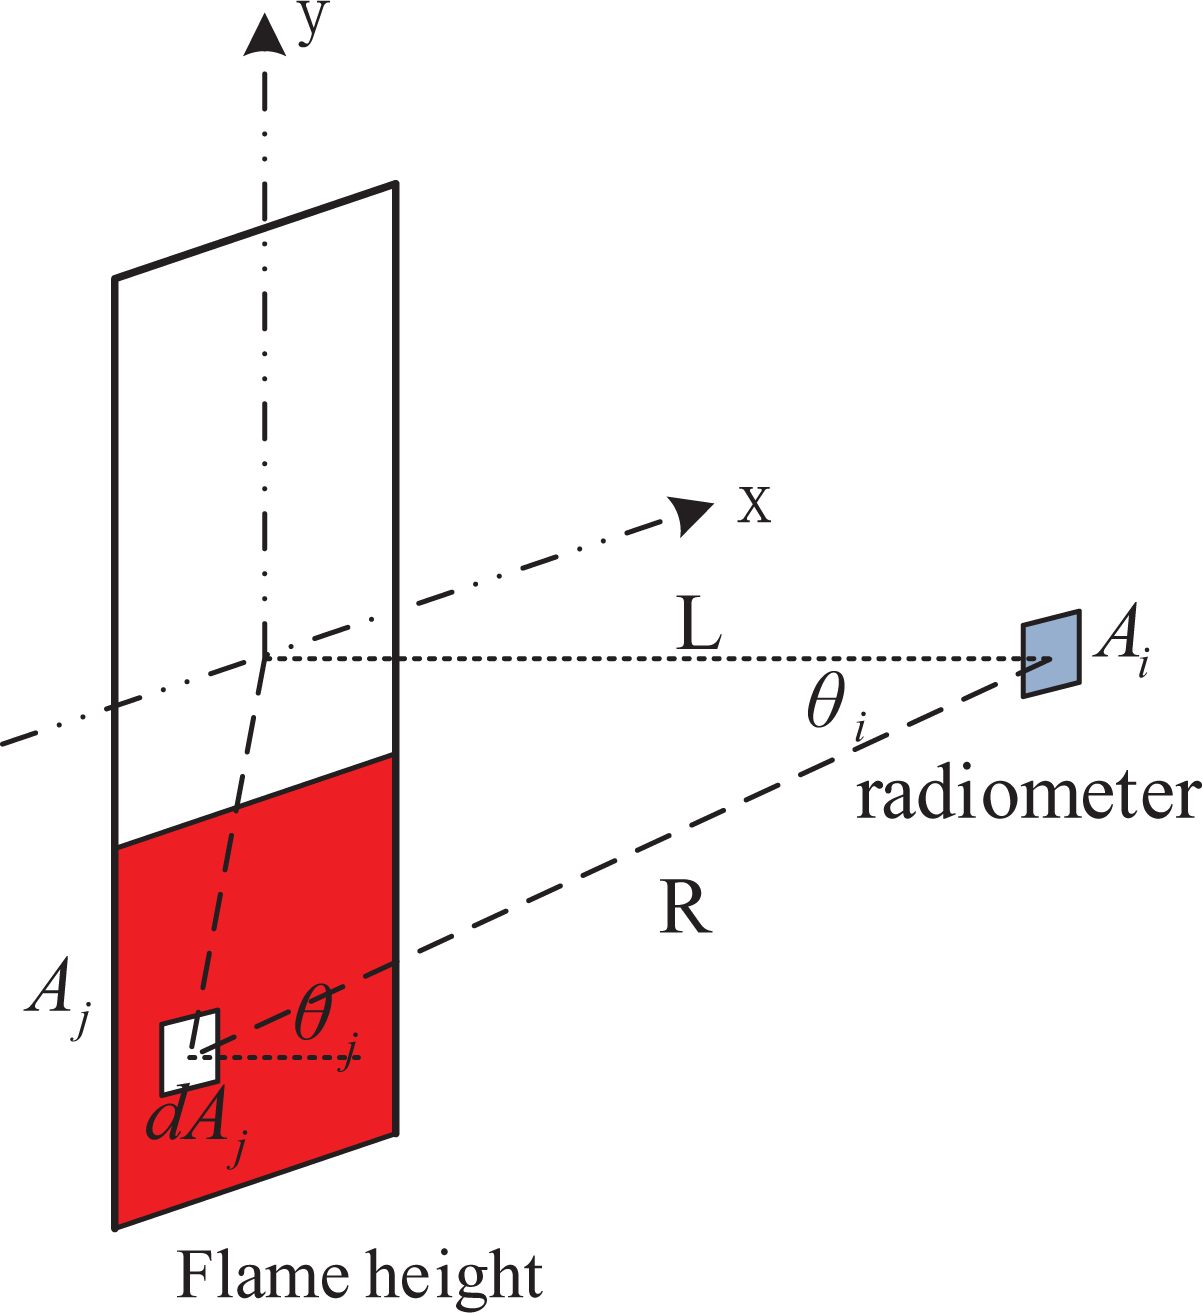
Sketch of calculating view factors.
Fji could be obtained by the interchangeable relationship AiFij = AjFji.
Fji and Fij for FPU and RPU with various water spray pressures were drawn in Figure 12. As shown in Figure 12(a), the higher the operating pressure, the lower the Fij was and the higher the Fji was. When the water spray pressure was more than 0.3 MPa, Fij and Fji may be considered as a constant, respectively. The trend of Figure 12(b) was likewise similar those of Figure 12(a). From the point of view factor, pressure being 0.3 MPa maybe a best choice to suppress the RPU and FPU fires.
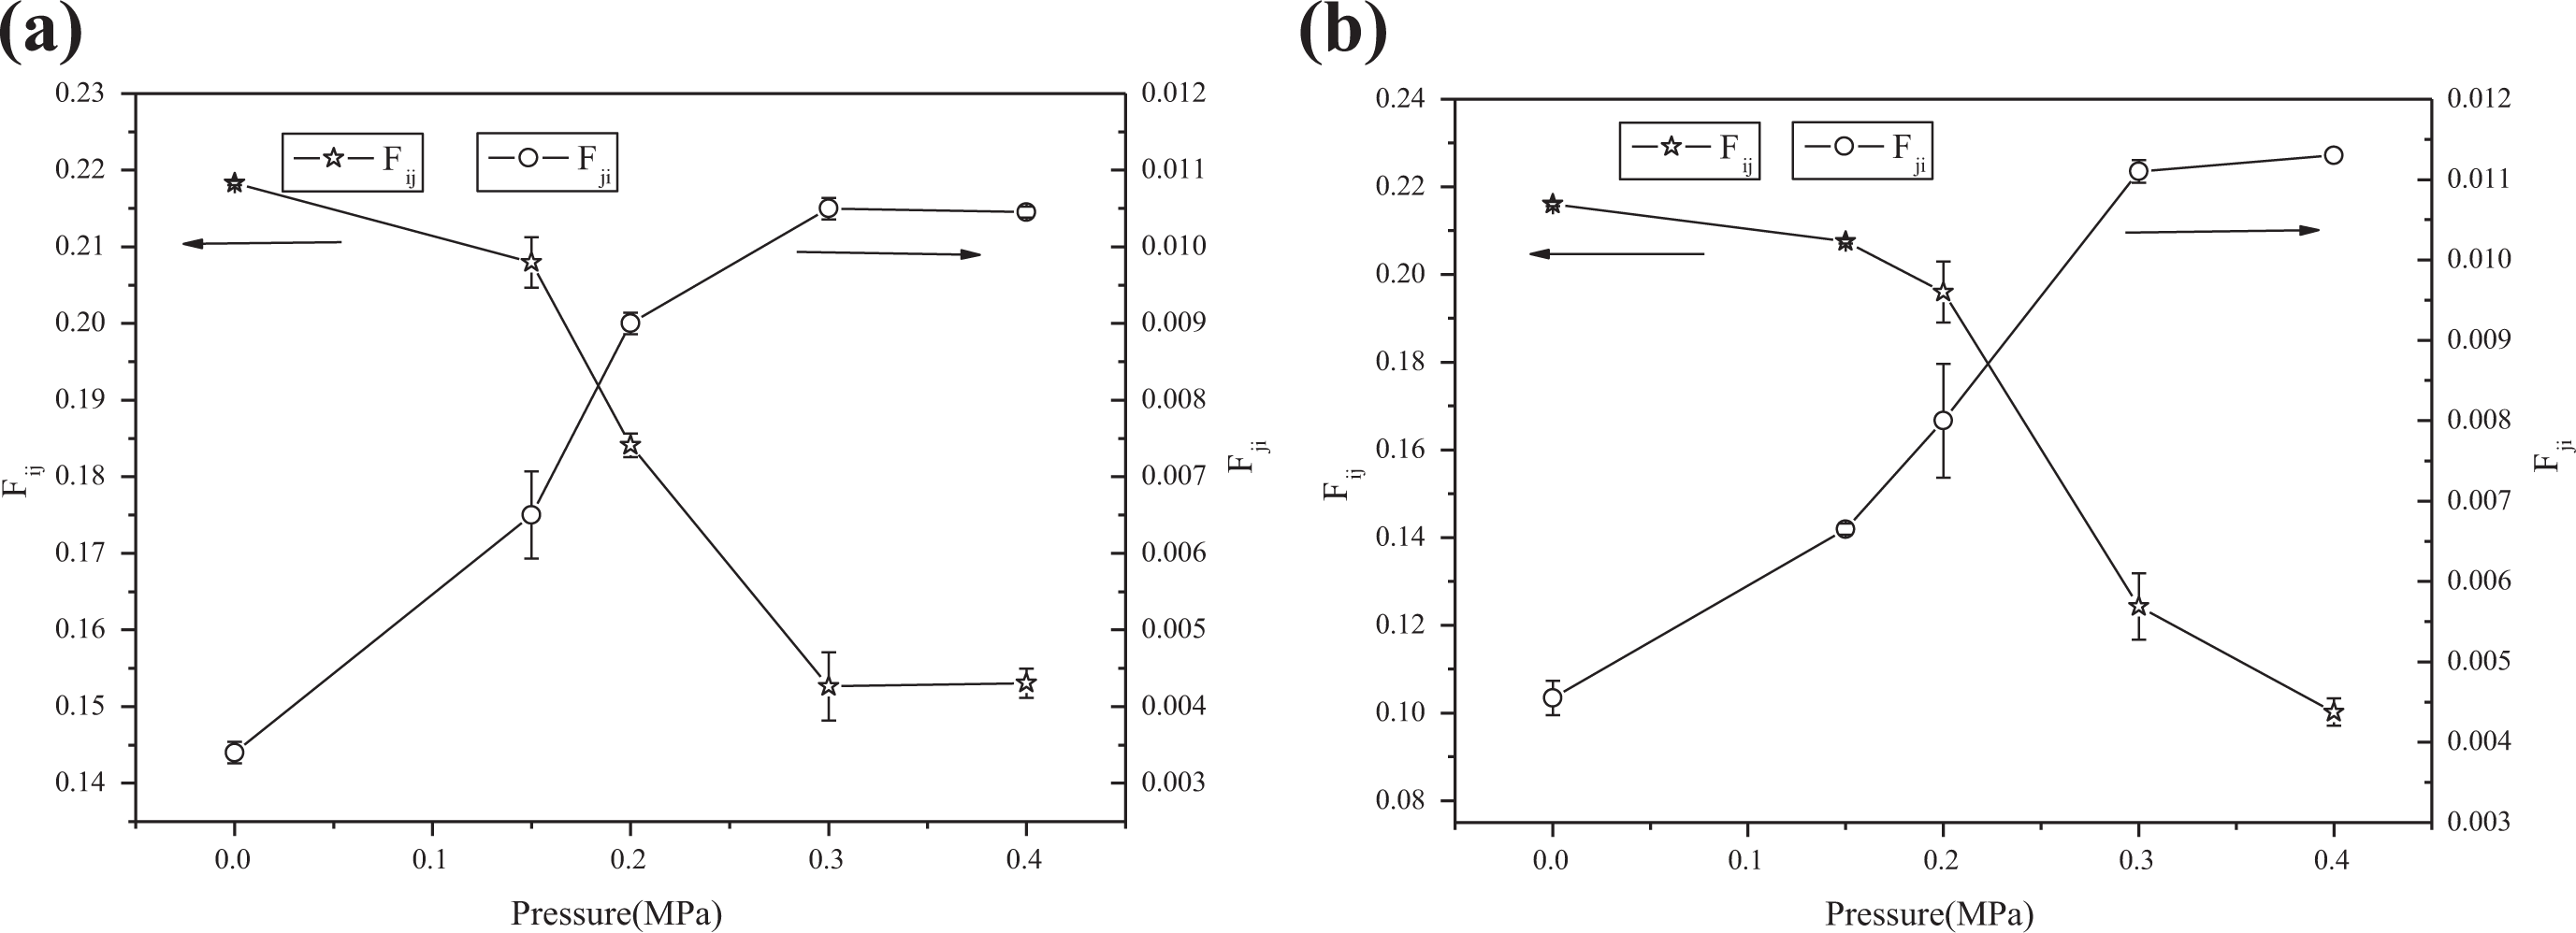
View factors Fji and Fij for (a) FPU versus pressure and (b) RPU versus pressure.
Extinguishing time
Figure 13 showed the extinguishing time of all the experiments. The extinguishing time was defined as the time from the water spray being opened to the flame extinguishing completely.
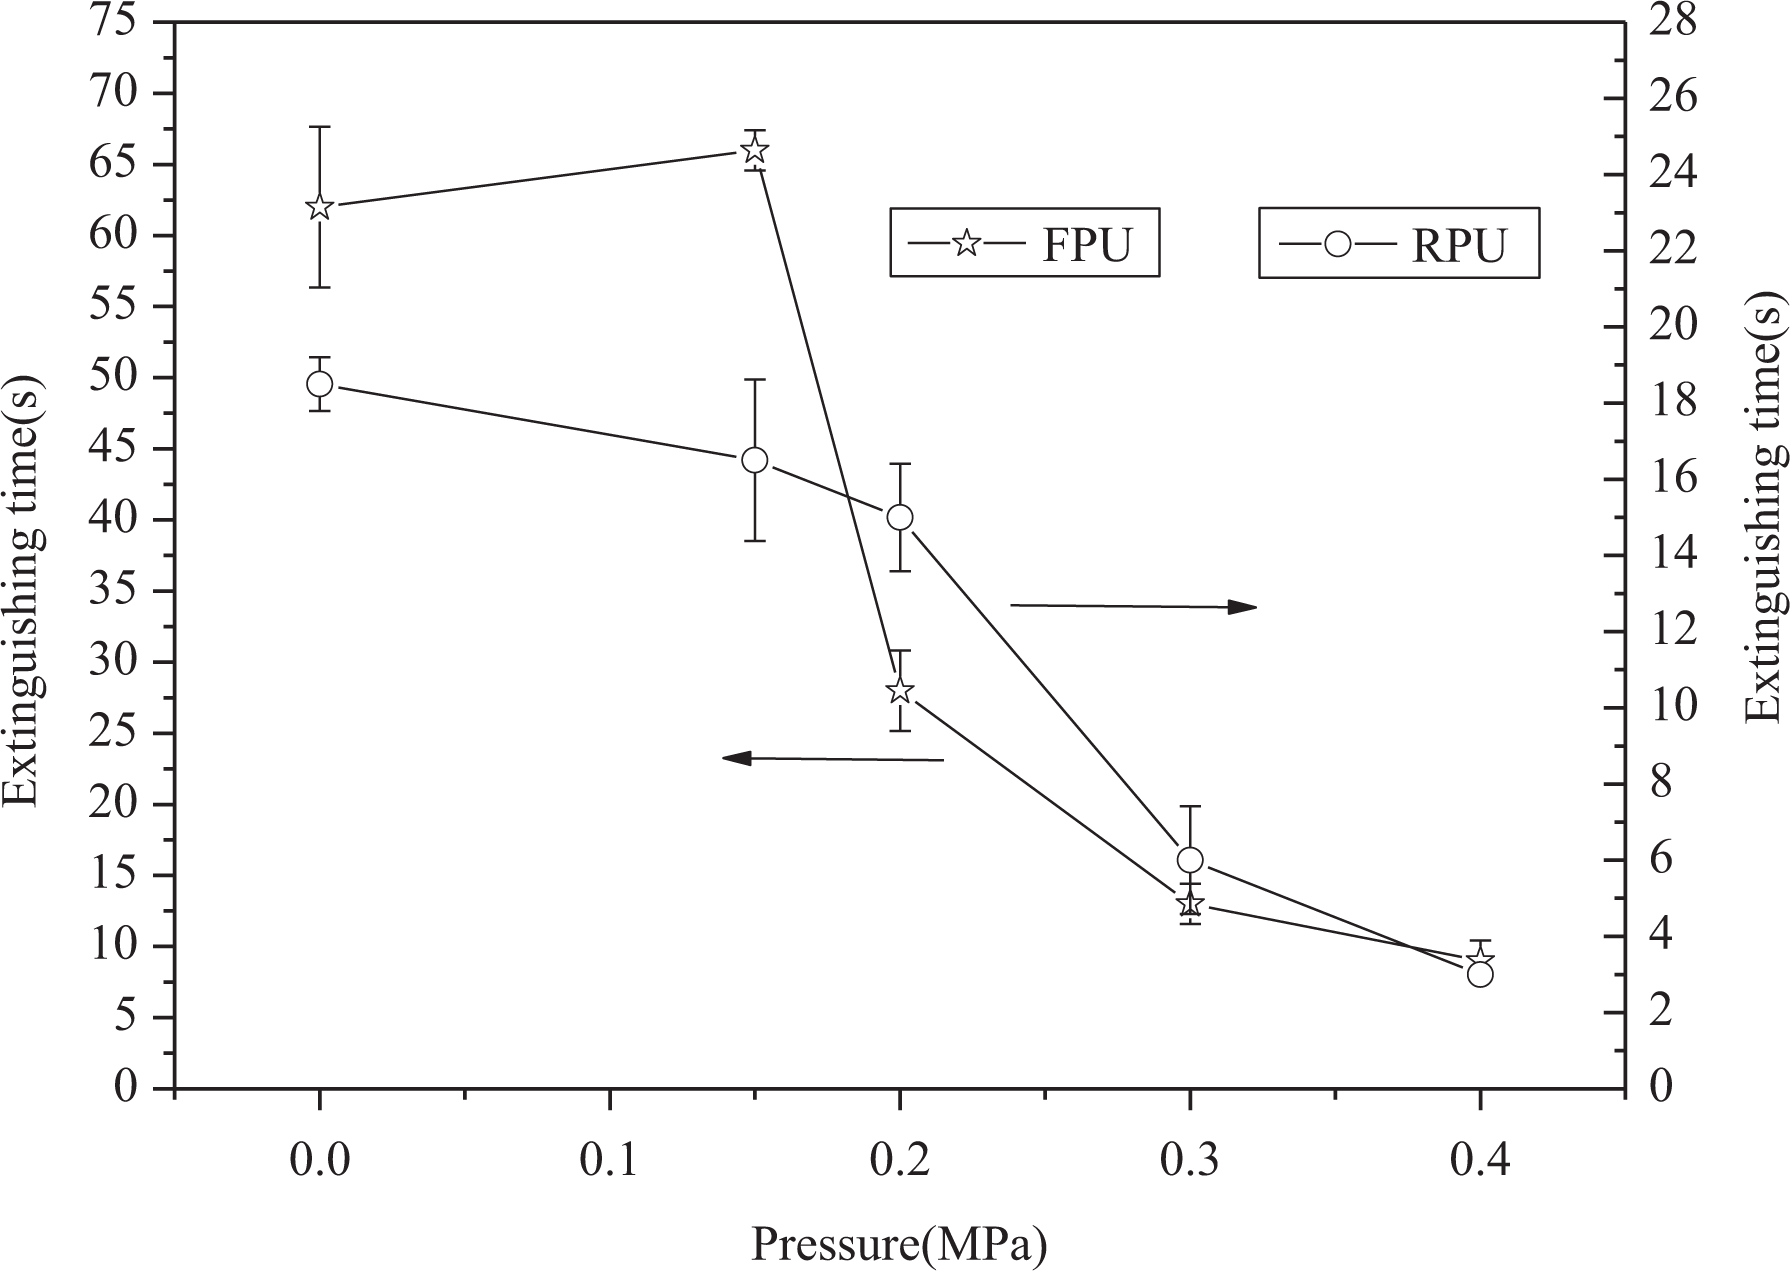
Extinguishment time of different water spray pressures.
The extinguishing time for FPU with different pressures were 62, 66, 28, 13, and 9 s, respectively, and were 18.5, 16.5, 15, 6, and 3 s for RPU, respectively. This suggested that the suppression effects on RPU and FPU fires were perfect when water spray pressure was 0.3 MPa.
In summary, the perfect water spray pressure was 0.3 MPa for both RPU and FPU. The corresponding water application rate was 0.7511 mg/(cm2·s). For FPU, the best water application rate of 0.7511 mg/(cm2·s) was lower than that of 7 mg/(cm2·s) found in the study by Yang. 25 The reason for the big difference maybe Yang made a full-scale experiment and it took a longer time to free burn before applying water spray. It follows that free-burning time was important for fire suppression before applying water spray. Therefore, dimensional analysis should be considered in the next work.
Analysis
If the residence time of water droplet is shorter than the heat-up time, the droplet diameter may not be reduced through vaporization. In this case, flame cooling could be ignored and surface cooling could be significant.
We assumed that the flame was a uniform hot gas zone, which could be described as an ideal gas law. Water droplets were seen as spheres and the effects of interactions among the droplets were neglected. For flame cooling, the convective heat transfer between the droplet and the flame can be expressed as equations (4) to (5). Water droplet motion equation in the flame can also be described as equation (6). 29


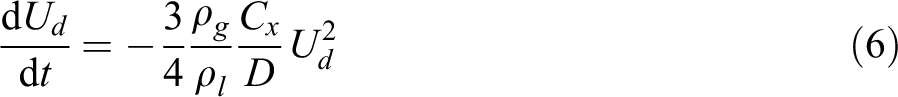
where Ud was droplet velocity and was a vector. ρl and ρg were water density and hot gas density, respectively. D was droplet diameter. g was acceleration of gravity. Vd and Ad were water droplet volume and surface area, respectively. Td and Tg were the droplet temperature and flame temperature, respectively. Cρg and Cρl were the specific heat of hot gas and liquid water, respectively. kg was the thermal conductivity gas. h was the convective heat transfer coefficient between the water droplet and the solid flame. Cx was correlated by Reynolds number.
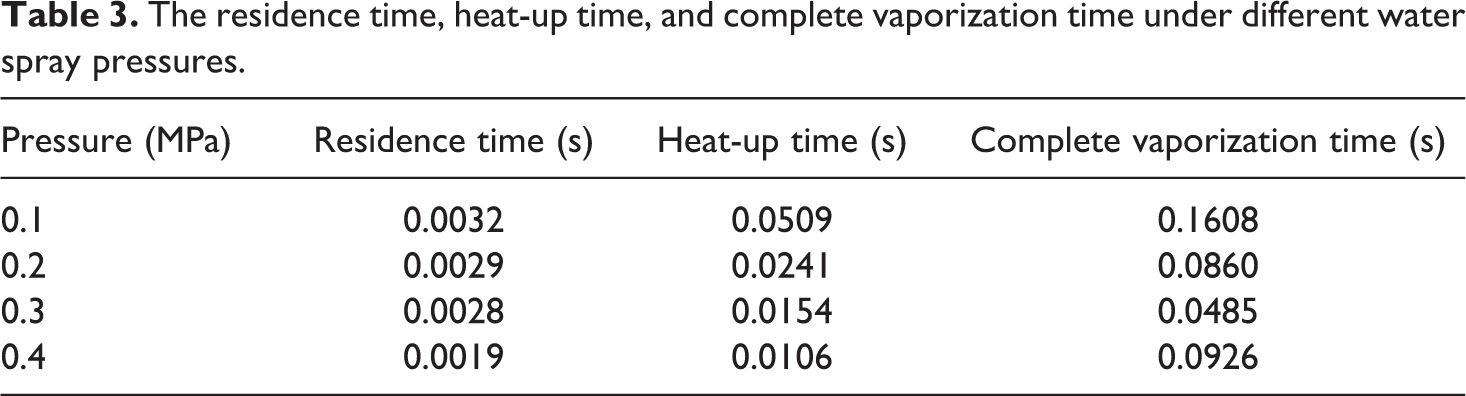
The above equations could be solved numerically using MATLAB™. Water droplet had an initial transient heating period when it was introduced into the flame zone. Take a droplet with 106 µm in diameter (0.4 MPa in Figure 3) as an example, it exposed to an ambient temperature of 1000 K, the droplet heat-up time was estimated to be 0.0106 s using equation (4). The droplet complete evaporation time was an order of 0.0926 s through equation (5). The flame thickness was assumed as the order of 1 cm based on visual observations. The droplet velocity was 8.9 m/s. The residence time of the droplet when water spray pressure being 0.4 MPa was of the order of 0.0019s assuming in horizontal direction using equation (6), which was less than the sum of the complete vaporization time and heat-up time. Therefore, the fuel surface cooling play an important role in extinguishing FPU/RPU fire in this investigation. The residence time, heat-up time, and complete vaporization time with various water spray pressures were shown in Table 3.
The residence time, heat-up time, and complete vaporization time under different water spray pressures.
Conclusions
A series of experiments on FPU and RPU fire suppression with and without water spray were conducted in the standard combustion room. Four different operating pressures, namely 0.15, 0.2, 0.3, and 0.4 MPa, were adopted to explore the fire suppression effect.
A new processing method was developed to determine the pyrolysis front position from video recordings. Results confirmed that water spray pressures impact on nearly the important fire parameters, including averaged flame height, CO/HCN concentration, view factors, and extinguishing time. When water spray was not applied, FPU could combust completely, while RPU self-extinguished after the surface fire occurred. The suppression effects of RPU and FPU fires were perfect when water spray pressure was 0.3 MPa (0.7511 mg/(cm2·s)). Both FPU and RPU fire extinguishments were due primarily to fuel surface cooling in these sets of experiments.
Footnotes
Acknowledgement
The authors thankfully acknowledge the supports.
Funding
The author(s) disclosed receipt of the following financial support for the research, authorship, and/or publication of this article: This work was funded by the Natural Science Foundation of Hebei Province (grant no. E2018209338), the National Key Research and Development Plan (grant no. 2016YFC0800100), and the National Natural Science Foundation of China (grant nos. 41675024 and 51802097).