
Abstract
In this study, an innovative route for secondary recycling (with zirconium oxide (ZrO2) reinforcement) has been proposed based on melt processing of high-density polyethylene (HDPE) in low-temperature bearing applications. Initially, secondary recycled HDPE, acrylonitrile butadiene styrene, and nylon 6 thermoplastic composites were investigated for melt flow index (MFI) according to ASTM D1238 standard. Based on the acceptable MFI, secondary recycled HDPE matrix was selected for second-stage processing on twin screw extrusion (TSE). The final process involves reinforcement of ZrO2 into HDPE matrix by TSE in 60:40 ratio (by weight %) for preparation of feedstock filament (for possible 3-D printing of bearings). The results of the study suggest that for processing of HDPE, 40% ZrO2 composite matrix, 50 r min−1 screw speed, 190°C barrel temperature, and 15 kg applied load are the best setting of TSE (for maximizing the tensile strength of feedstock filament). The results are also supported by wear properties, thermal stability, and morphological analysis (based on scanning electron microscopy and electron-dispersive X-ray analysis).
Introduction
Plastic recycling is the method of recovering and reprocessing the plastic solid waste into constructive goods. 1 Common plastics are nonbiodegradable, so recycling is a part of universal efforts to diminish plastic waste in the waste stream. 2 –4 The 3-D printing is one of the manufacturing processes that produces real/physical object from a digital design. There are various techniques for 3-D printing/additive manufacturing (AM). Among those, fused deposition modelling (FDM) is one of low-cost AM techniques, which prints parts by depositing materials layer by layer. 5,6 The 3-D printing has wide prospectives, especially in the field of recycling and waste management, where it is required to have a cleaner production of the useful parts without affecting the sustainability from chemical, mechanical, morphological, and thermal viewpoints. In the last decade, efforts were made for recycling of thermoplastics via AM route, especially with reinforcement of different metals/nonmetals/fibers and so on. 7,8 It has been reported that product sustainability largely affected by variations in printing parameter of FDM (like printing speed, material combination/composition, extrusion temperature, layer thickness, raster angle, infill density, number of perimeters, etc.). 9,10 Some studies have highlighted the use of optimization techniques, process hybridization, and printing style to reduce the porosity and improvement in mechanical, thermal stabilities, and solutions for chemical resistivity in different areas of application. 11,12 Waste disposal and recycling of packaging material and waste from electronic and electrical equipments are serious issues raised during the last two decades, which largely affects the developing countries. It has been reported that the waste from electronic and electrical equipment are expected to be increased as 145% and 98% in India and China, respectively, during 2013–2020. 13
The 3-D printing has the potential to be used as “cleaner production/zero waste manufacturing/recycling/processing” tool for fabrication of functional/nonfunctional prototypes with the provision of maintaining the sustainability aspect as compared to base material. 14,15 Some studies have reported solutions for sustainability issues in 3-D printed parts. 16 The reinforcement of metallic/nonmetallic material to the polymer for 3-D printing is also an interesting aspect to maintain thermal, electrical, mechanical, rheological, and chemical sustainability. Some studies have reported that the reinforcement of 25% graphene to the recycled acrylonitrile butadiene styrene (ABS) polymer via chemical and mechanical methods leads to better electrical and thermal conductivity. 17
HDPE is a nondegradable plastic that is commonly used in plastic bottles, corrosion-resistant piping, geomembranes, and plastic lumber. Its immense usage in daily life accounts for its major contribution to the plastic solid waste and, therefore, it can also be considered as a huge source of raw material for the recycling industry. HDPE is known for its large strength to density ratio. The density of HDPE can range from 0.93 g cm− 3 to 0.97 g cm− 3. 18,19 It is also hard and opaque and can withstand somewhat higher temperatures (120°C for short periods). HDPE, unlike polypropylene, cannot withstand normally required autoclaving conditions. 20,21 The ZrO2 as a reinforcement improves hardness, tensile strength, and forms a unique recycled material that is capable of withstanding high temperature with durability. ZrO2, sometimes known as zirconia (not to be confused with zircon), is a white crystalline oxide of zirconium. 22,23 Its most naturally occurring form, with a monoclinic crystalline structure, is the mineral baddeleyite. A dopant-stabilized cubic structured zirconia, cubic zirconia, is synthesized in various colors for use as a gemstone and a diamond simulant. Three phases are known: monoclinic below 1170°C, tetragonal between 1170°C and 2370°C, and cubic above 2370°C. 24,25 Some of the recent studies have suggested the potential use of nano- and microparticulates of ZrO2 for promising engineering applications. 26 –30
The literature review reveals that many studies have been reported on recycling and recovery aspect of polymers by reinforcement of metallic/ceramic/nonmetallic particle in 3-D printing applications. 31 –35 Some of the studies have highlighted the use of ZrO2 reinforcement in the thermoplastic matrix for improved material properties. But hitherto very little has been reported on the use of ZrO2 as a reinforcement in recycled HDPE thermoplastic matrix (as secondary recycling process) for possible 3-D printing of bearing (in low-temperature applications, for example, in toy cars). In the present study, an innovative route of recycling (based on melt processing) has been proposed for HDPE (as secondary recycling). The process involves reinforcement of ZrO2 into the HDPE matrix based on MFI in the first stage and the preparation of feedstock filament of FDM on twin screw extrusion (TSE) in the second stage for possible 3-D printing of bearings as a final product. In this study, the feedstock filament prepared up to the second stage was subjected to mechanical testing, scanning electron microscopy (SEM), electron-dispersive X-ray analysis, and differential scanning calorimetric (DSC) analysis for ensuring the recyclability of HDPE thermoplastics from sustainability viewpoint.
Materials and methods
The primary recycled thermoplastic materials (nylon 6, ABS, and HDPE) have been selected as the matrix material along with ZrO2 (size: 15 µm) as reinforcement in the first stage. Figure 1 shows the steps involved for recycling of the thermoplastic waste with the reinforcement of ZrO2 for preparations of feedstock filaments of FDM. The ZrO2 particulates were mechanical blended with thermoplastics and then fed to cryogenic ball milling setup (ball material: zirconia; ball size: 10 mm diameter, no. of balls: 2, duration: 5 min.) for uniform mixing and reducing grains size up to 50 µm. Further melt flow characterization of blended samples was performed for selection of right proportion of ZrO2 particles into thermoplastic waste for 3-D printing capabilities. It should be noted that the preferred MFI range (2.5–4.0 g/10 min) of the thermoplastic matrix does not require the change in hardware/software of 3-D printer. Further, the selected composition per MFI analysis was processed with TSE and subjected to mechanical, thermal, and morphological analysis for selection of the best set of parameters.
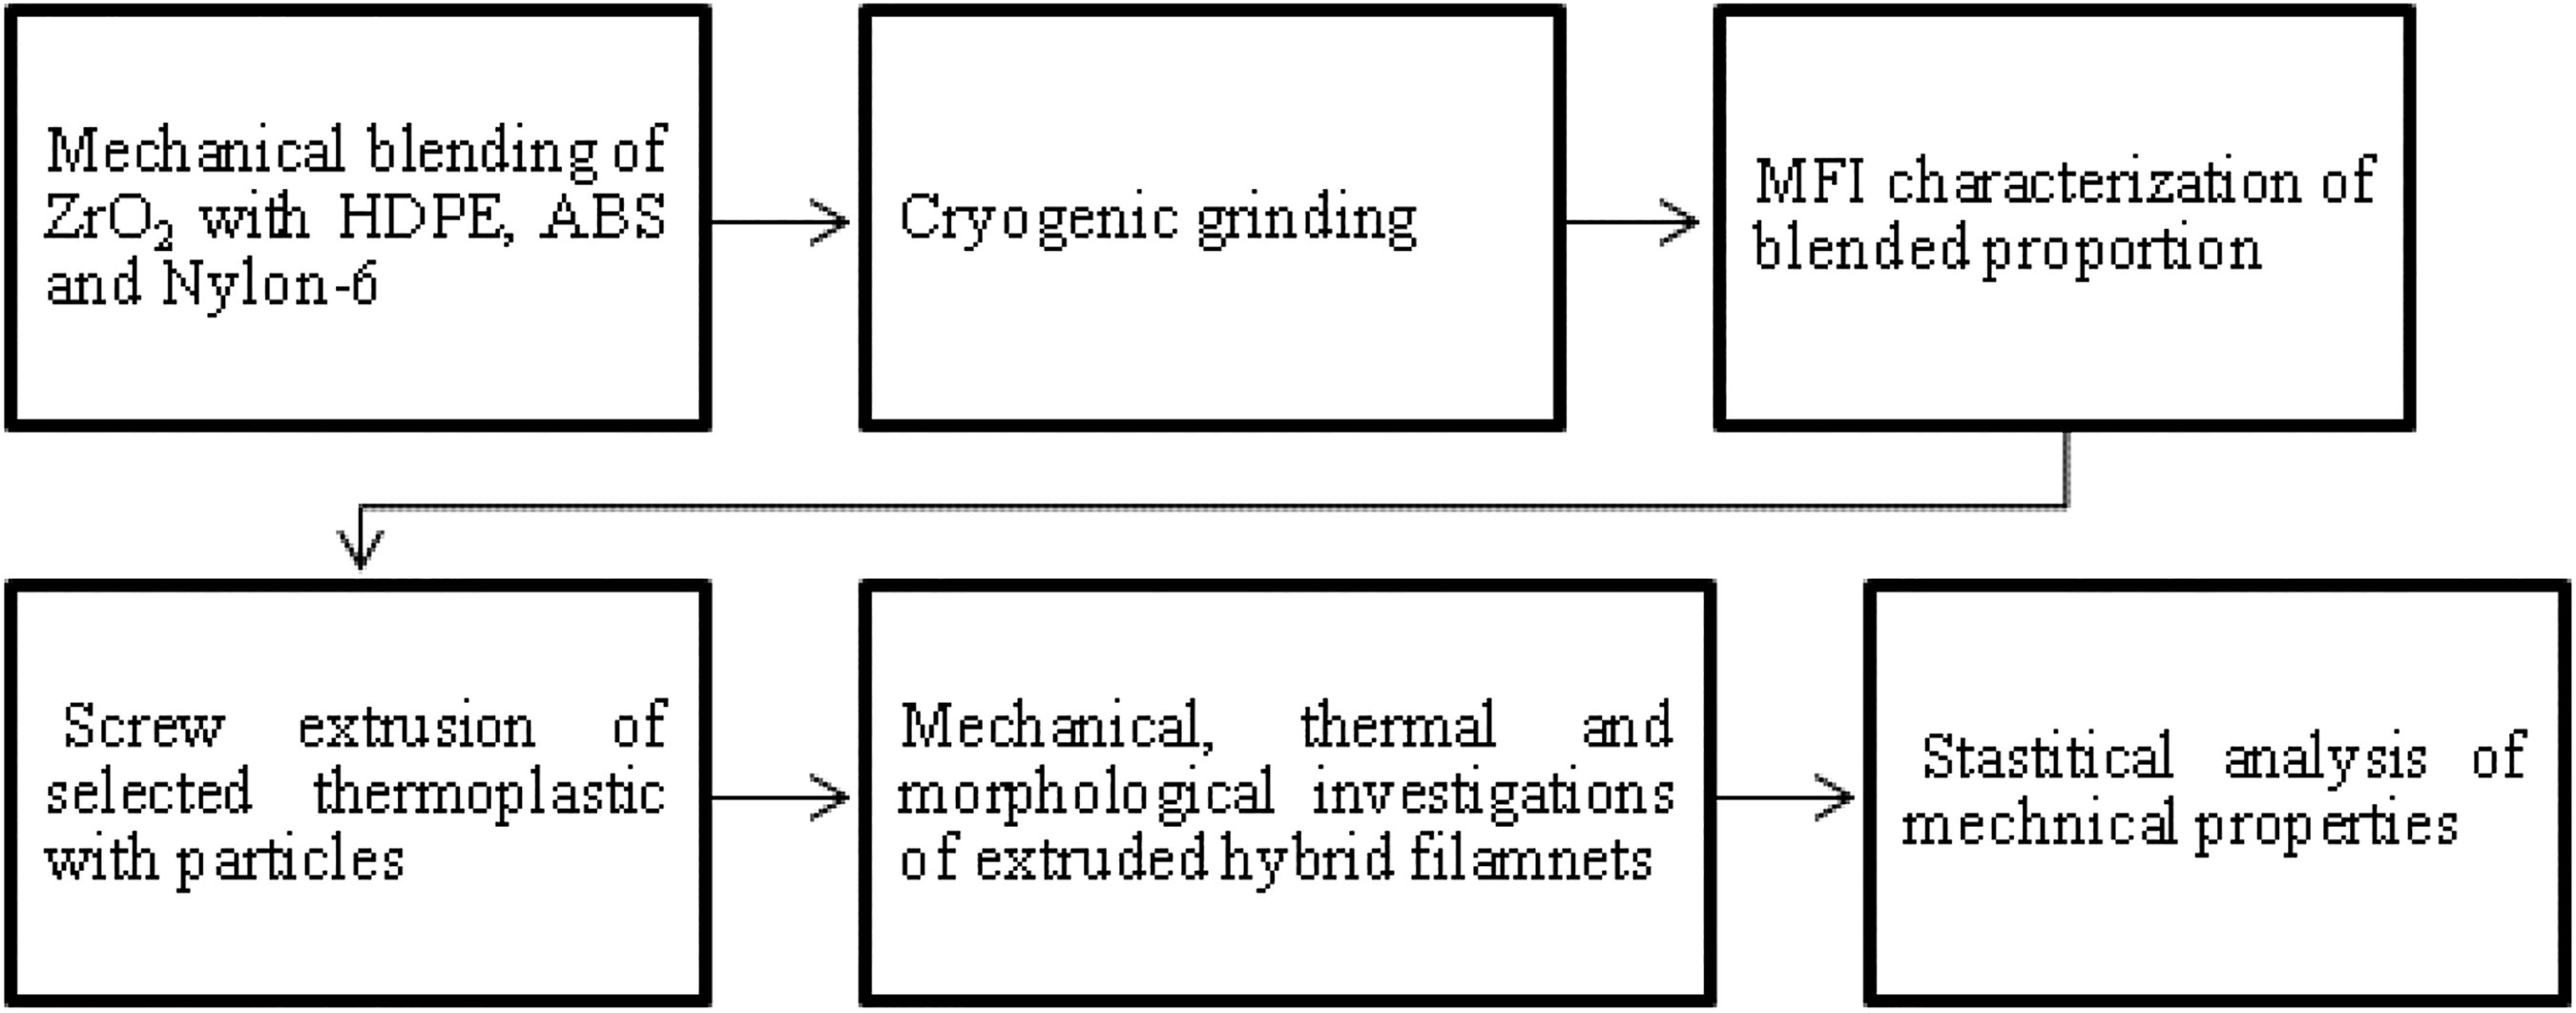
Steps involved for recycling of thermoplastic waste.
Experimentation
MFI investigations
The MFI is the flow rate of the melt of a thermoplastic polymer per unit time (usually measured as g/10 min). The MFI value of thermoplastic composite in 3-D printing ascertains the printing capability of thermoplastic. For example, if the thermoplastic composite allows the acceptable flow rate, then it will be able to 3-D print the functional prototypes without changing hardware/software of the 3-D printer. For the present study, ASTM D 1238 standard has been used for MFI characterization. Figure 2 shows the MFI experimental setup (Make: Shanta Engineering, Pune, Maharashtra, India).
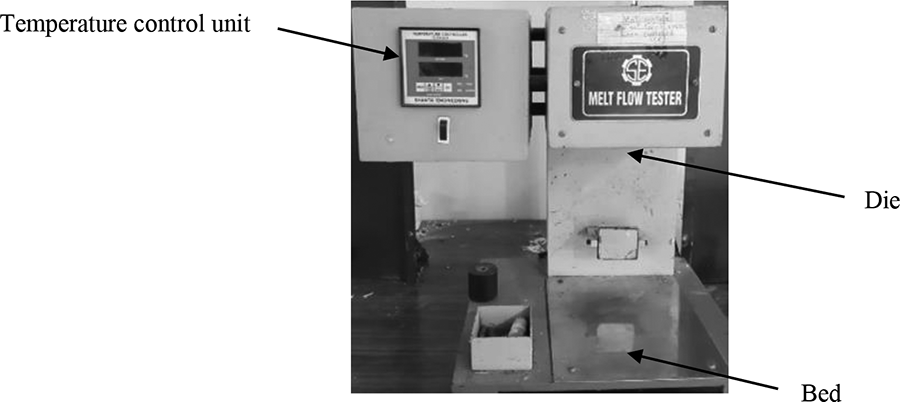
Experimental MFI setup.
In the first stage, the ZrO2 reinforced with ABS, nylon 6, and HDPE have resulted into the different MFI values at different proportions of ZrO2. It should be noted that the maximum possible reinforcement up to 50% ZrO2 has been observed for primary recycled HDPE (Table 1). Further, in the case of HDPE with 40% proportions of ZrO2, the MFI value of 3.6 g/10 min was observed (Table 1), which is acceptable for the available FDM setup. For ascertaining the rheological behavior based on MFI, for thermoplastic: ZrO2 as 60:40 per Table 1, SEM-based photomicrographs (Figure 3) were captured.
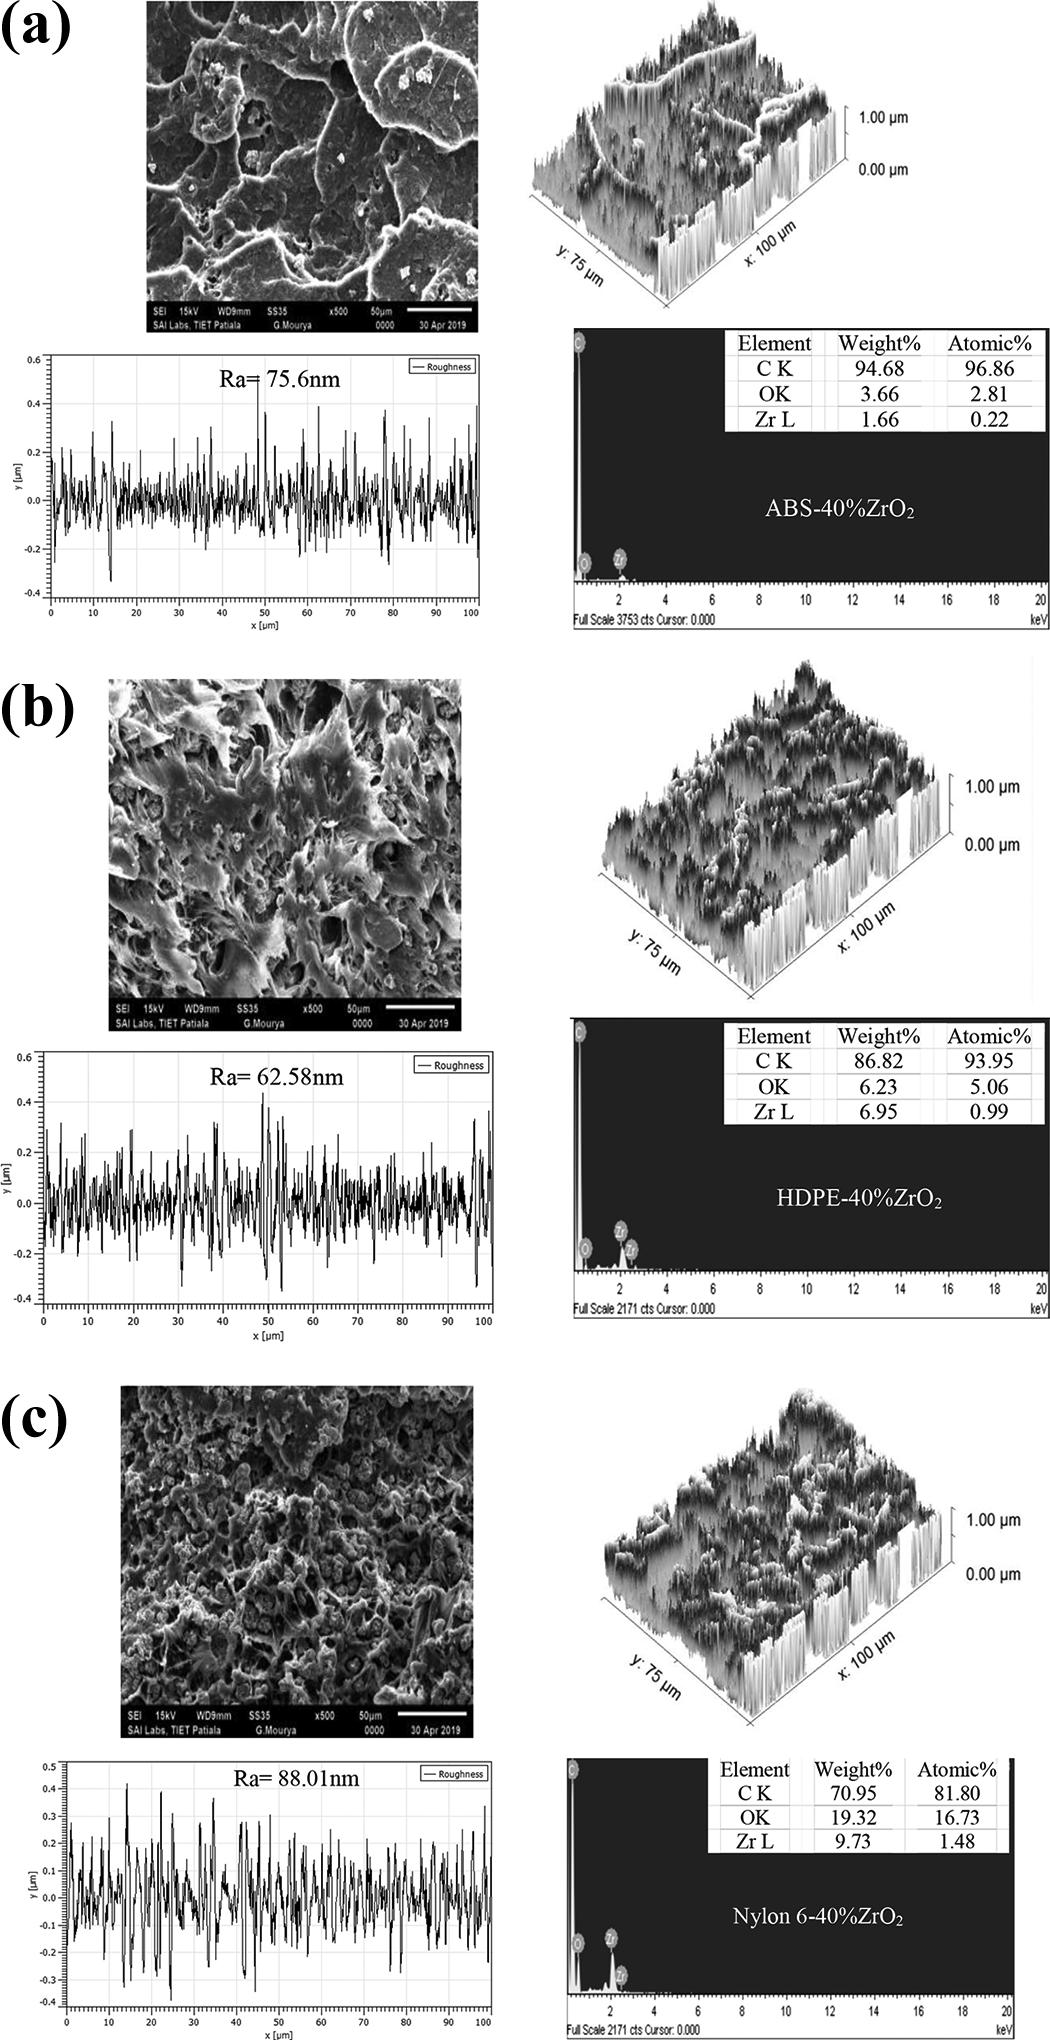
SEM-based photomicrographs (×500), rendered image of photo micrographs and Ra profile and EDAX analysis of (a) ABS-40% ZrO2, (b) HDPE-40% ZrO2, and (c) nylon-40% ZrO2.
Observed MFI value of secondary recycled polymers blended with ZrO2 in different proportions.
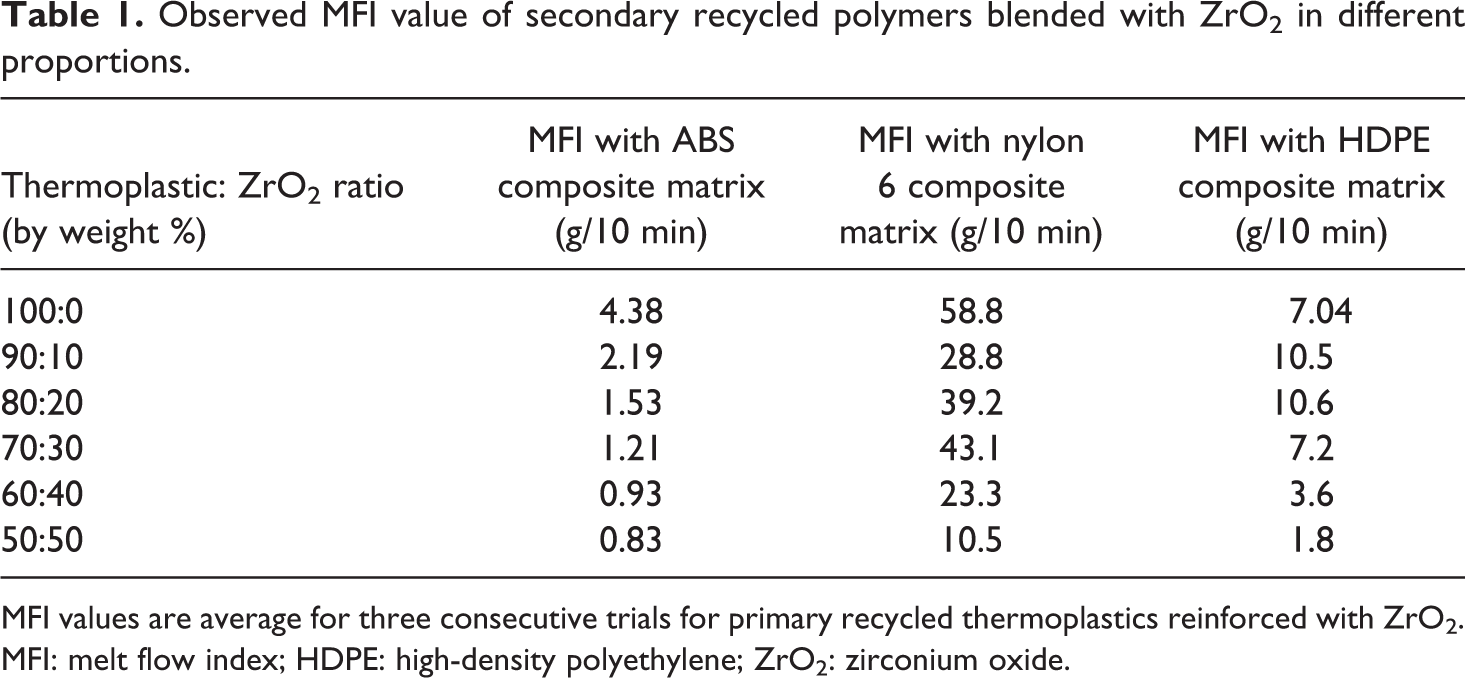
MFI values are average for three consecutive trials for primary recycled thermoplastics reinforced with ZrO2. MFI: melt flow index; HDPE: high-density polyethylene; ZrO2: zirconium oxide.
As observed from Figure 3, SEM images (at 500×) and rendered photomicrographs clearly show the formation of coarse grains for ABS composite, followed by fine grains for HDPE composite and finest for nylon 6 composite matrix. The observed surface roughness (Ra) value for HDPE composite matrix was minimum followed by ABS composite matrix and maximum for nylon 6 composite matrix. The coarse structure formation may be responsible for minimum MFI values in the ABS composite matrix.
Twin screw extrusion
In this study, the TSE is being used for two purposes: for uniform missing of ZrO2 into the matrix of thermoplastic and for preparation of feedstock filament for 3-D printing. For the present work, MiniCTW TSE (company: Thermo-Fisher; maximum barrel temperature: 300°C and maximum screw speed: 300 r min−1) was used in preparation of feedstock filaments. It should be noted that the strength of the filament is an important aspect for 3-D printing, which is greatly influenced by the variation of extrusion input process parameters, such as screw speed, barrel temperature, and applied load. TSE is used to prepare ZrO2 + HDPE-blended feedstock filaments of 1.75 ± 0.05 mm diameter. Design of experiment according to Taguchi L9 orthogonal array is prepared (see Table 2) and used for second-stage evaluation.
DOE per Taguchi L9 OA.
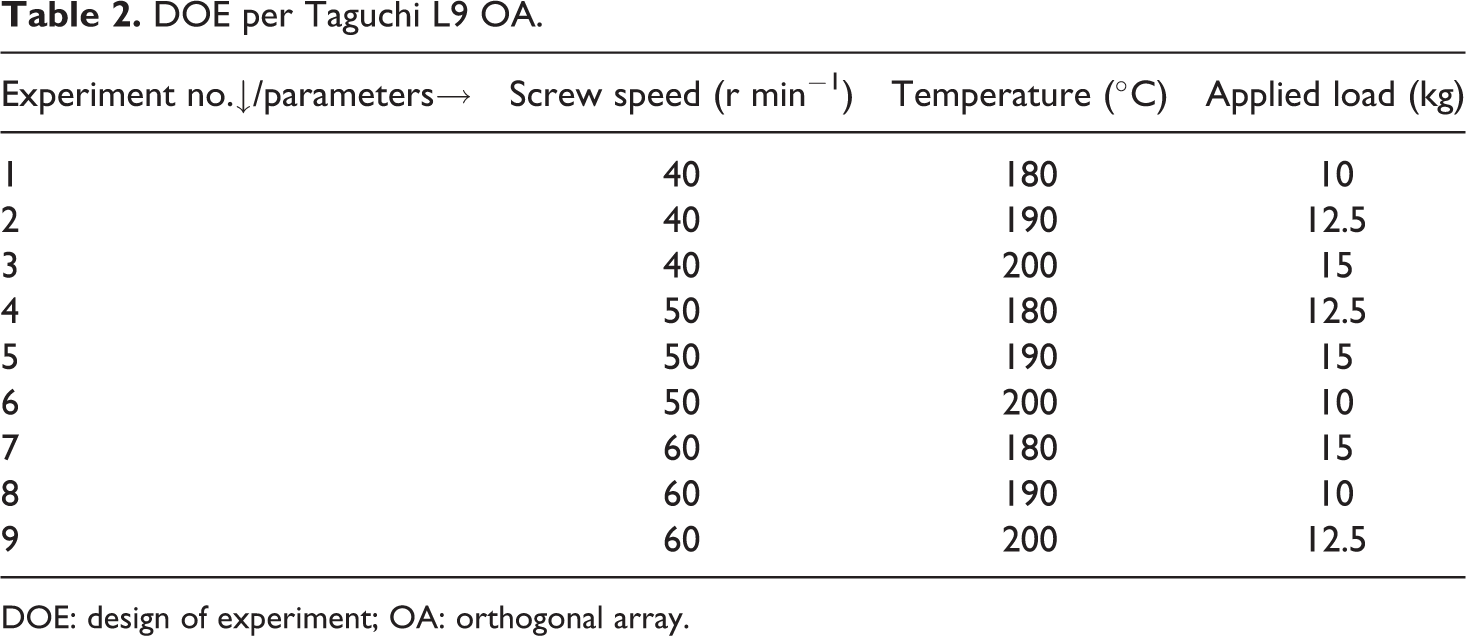
DOE: design of experiment; OA: orthogonal array.
Tensile testing
The ultimate tensile tester (Make: Shanta Engineering; capacity: 5000 N) has been used to test the tensile properties of the feedstock filament. The tensile test of feedstock filaments was performed at an elongation rate of 20 mm min−1. In this study, fracture tensile strength and ultimate tensile strength were considered.
Wear testing
A pin-on-disc tribometer (model: TR-20LE-PHM-400; maximum capacity: 200 N) was used to measure the wear rate (in micrometer) and coefficient of friction. The pin of ZrO2-reinforced thermoplastic was prepared by using the specimen hot mounting machine and then fed to tribometer for investigation of wear properties. In this study, the wear test was performed at a load of 2 kg with 477 r min−1 and 80-mm track diameter.
Differential scanning calorimeter
DSC is an apparatus of thermal testing, which determines the melting points, glass transition temperature, crystallinity, and so on of the thermoplastics or thermoplastic composites. In this study, DSC (Make: Mettler Toledo, maximum operating temperature: 600 C) analysis was considered for endothermic and exothermic reactions. The endothermic reaction was performed for 30–200°C at 10°C min−1 and exothermic reaction was performed between 200°C and 30°C at −10°C min−1. In this study, StarE analysis software (Make: Mettler Toledo) has been used to predict the analytics of the results.
Results and discussion
Tensile properties
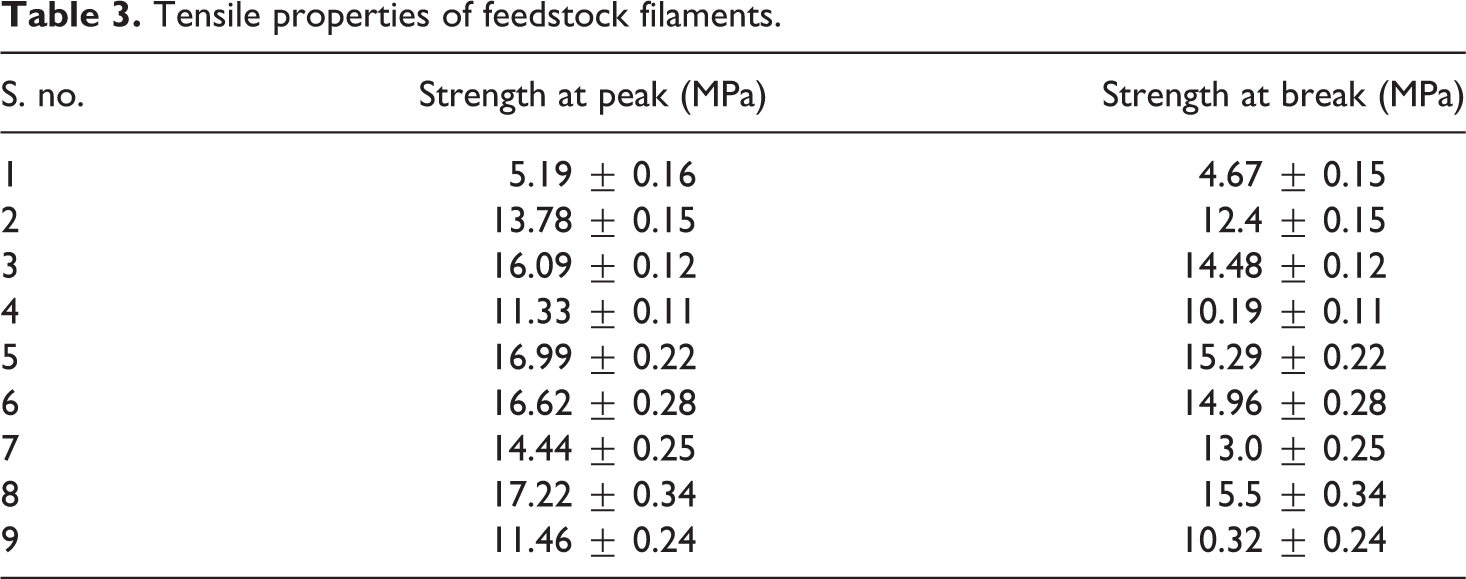
The feedstock filaments prepared on each set of parameters were further subjected to tensile testing for selection of optimum process parameters. Based on Table 2, Table 3 shows the tensile properties of feedstock filaments (represent the mean of three repetitions). It has been observed that maximum tensile strength was obtained in experiment no. 8 (parametric combination: 60 r min−1 screw speed, 190°C temperature, and 10 kg applied load) and minimum in experiment no. 1 (parametric combination: 40 r min−1 screw speed, 180°C temperature, and 10 kg applied load). This may due to the fact the high screw speed with an intermediate range of processing temperature and lowest applied load may have contributed for uniform mixing leading to maximum strength. Similarly, the low range of screw speed in case of sample 1 may be unable to provide adequate strength. Figure 4 shows the strength versus elongation curves for different filaments prepared. It should be noted that peak and break strength of primary recycled HDPE were observed as 22.33 ± 41 MPa and 20.10 ± 0.41 MPa, respectively (at 60 r min−1, 190°C, and 10 kg load).
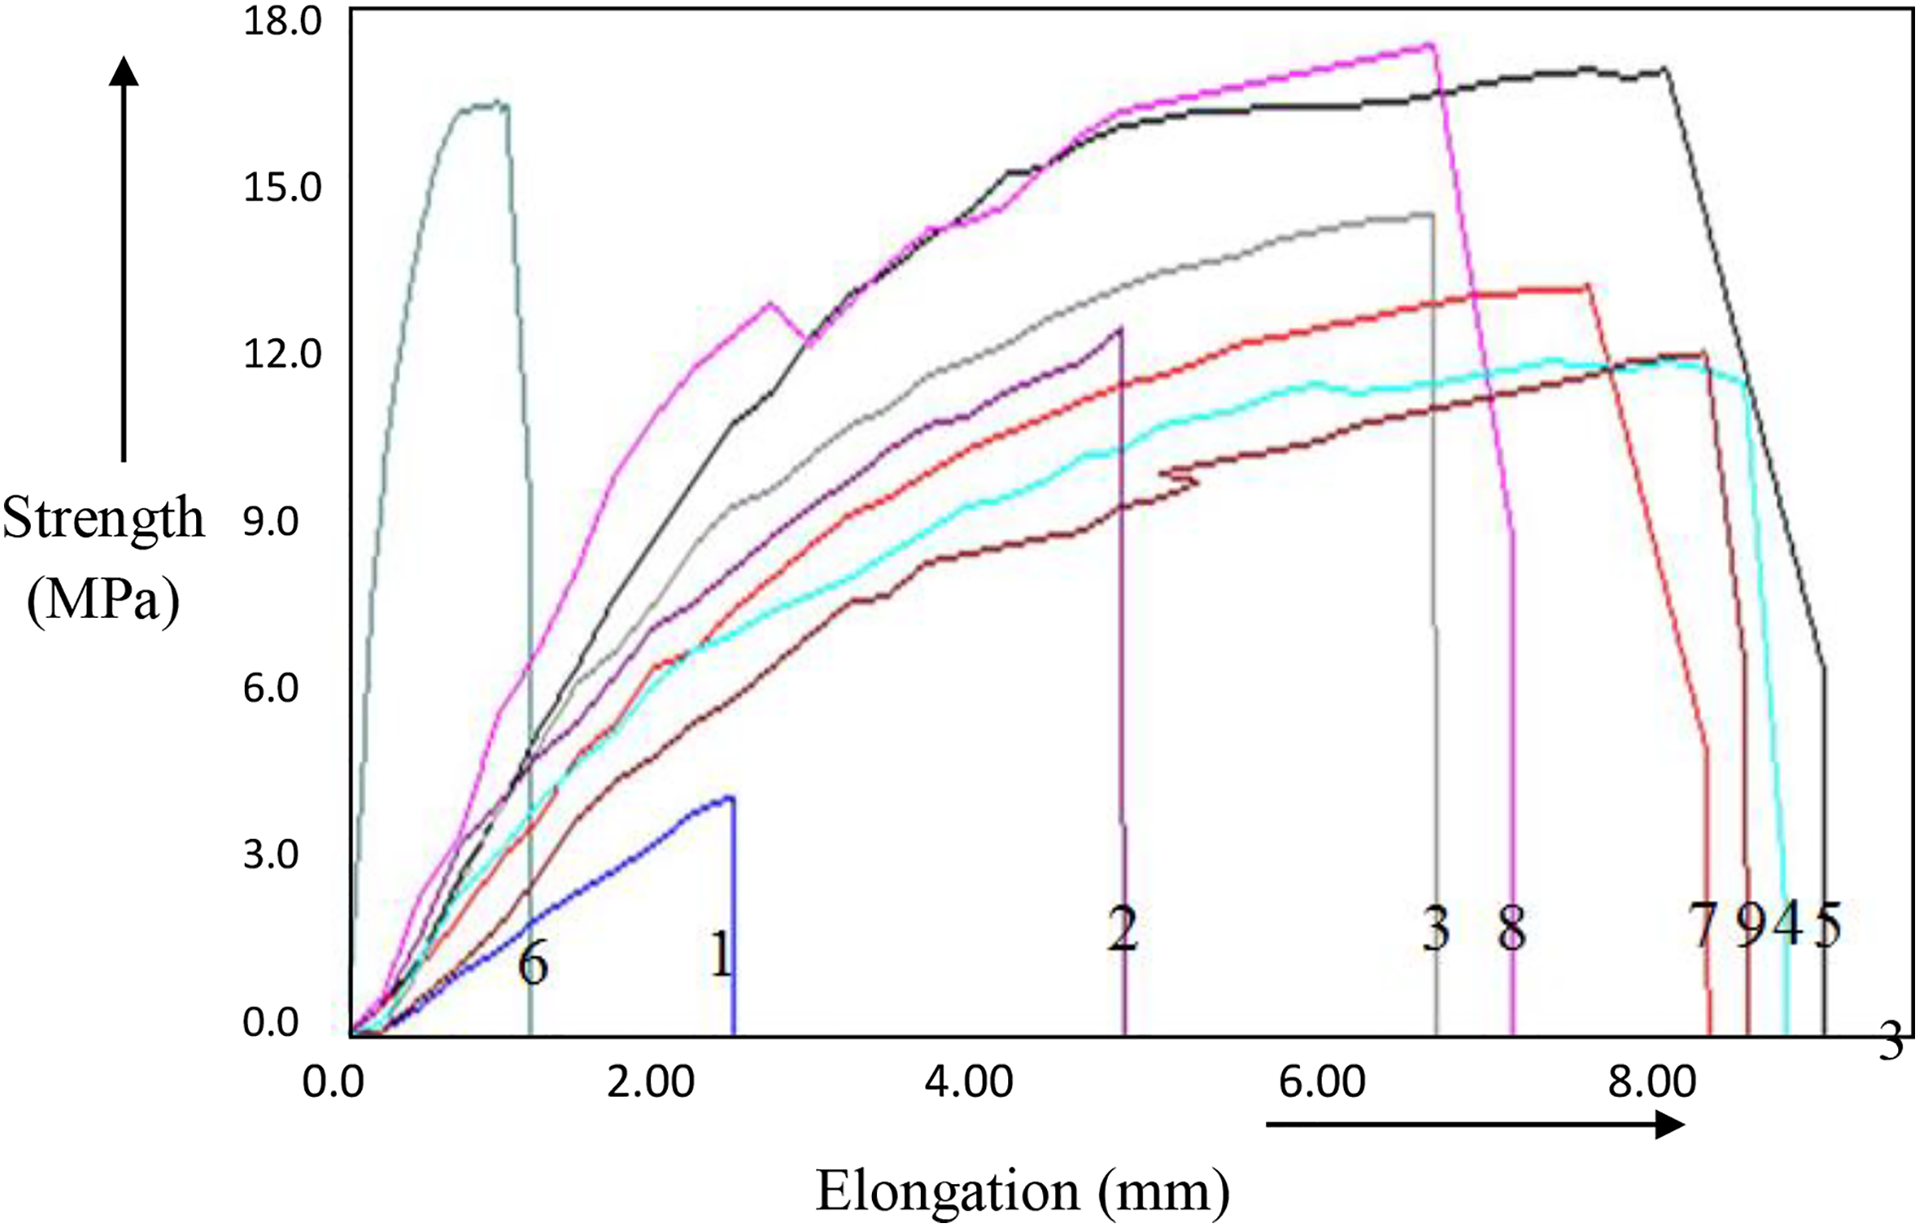
Strength versus elongation curves of different samples.
Tensile properties of feedstock filaments.
The signal-to-noise (SN) is the ratio of output expressed in terms of variation over input properties. It is the ratio of output of controllable factors (signal) to uncontrollable factors (noise), which proffered maximum possible values. Tensile strength is considered as those properties, which is preferred under “larger is better type case.” The SN ratio (η) is calculated:
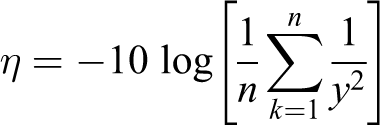
where n is the total no. of experiments having y as tensile strength at experiment no. k.
Based on Table 3, the SN ratios of each experiment have been calculated and analysis of variance (ANOVA) of SN ratios has been formulated (see Tables 4 and 5).
ANOVA for strength at peak.
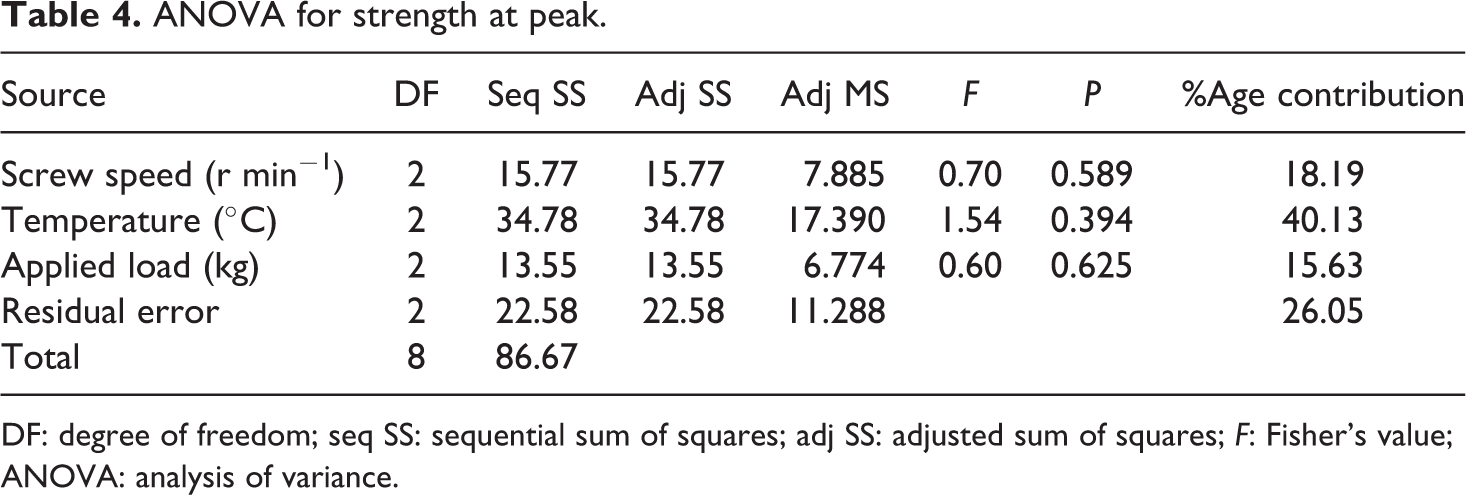
DF: degree of freedom; seq SS: sequential sum of squares; adj SS: adjusted sum of squares; F: Fisher’s value; ANOVA: analysis of variance.
ANOVA for strength at break.

DF: degree of freedom; seq SS: sequential sum of squares; adj SS: adjusted sum of squares; F: Fisher’s value; ANOVA: analysis of variance.
It has been observed that no single input process parameter is significant as the probability (P) value is greater than 0.05 (at 95% confidence level). Also, the percentage contribution of residual error was observed at 26.05% and 26.01% in strength at peak and strength at break, respectively. So, based on these observations, it is believed that there might be chances of interaction of input process parameters so that residual errors can be minimized.
Therefore, two-factor integration ANOVA has been conducted for peak strength. It has been suggested that model of experimentation according to outcomes of peak strength is significant as p value obtained is 0.0152 (lesser than 0.05) at 95% confidence level (see Table 6). The barrel temperature alone is the most significant factor as sum of squares value obtained is 29.08 and for interacting factors, AB is the most desirable as sum of square value obtained is 48.16. The residual error is found controlled for peak strength.
Two-factor interaction ANOVA for peak strength.
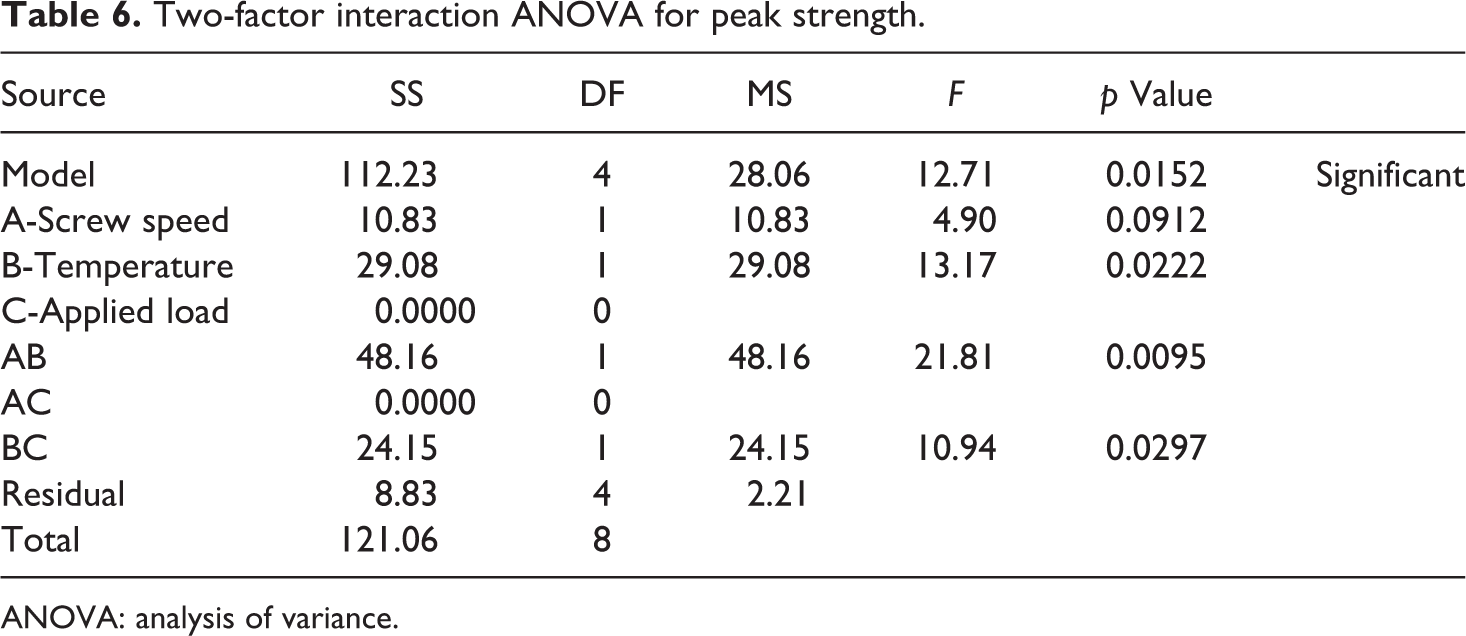
ANOVA: analysis of variance.
Table 7 presents the fit statistics of peak strength of feedstock filaments. For extrusion process, the calculated R 2 value is found to be 0.927 and adjusted R 2 is 0.8541 (nearer to 1), which shows that the process is statistically controlled.
Fit statistics for peak strength of feedstock filaments.
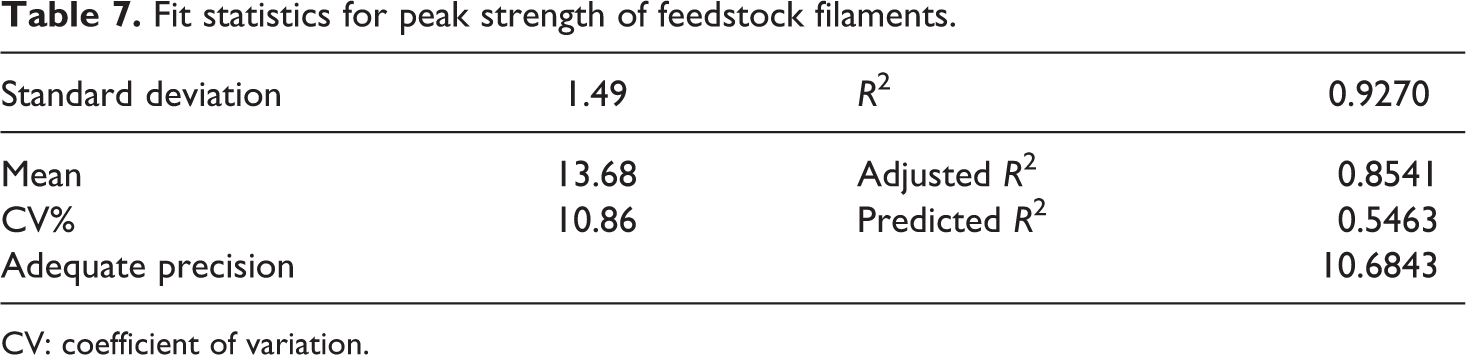
CV: coefficient of variation.
The graphical approach, as shown in Figure 5(a), has been taken to counter verify the results for investigations of statistics of the process for peak strength. As predicted from the normal plots of the residuals (normal % probability vs. extremely studentized residuals), all the points lie within the limit, which show that the results are varied under the control limit. Figure 5(b) shows the plot of predicted versus actual for peak strength. According to the data point shown, no large deviation of data has been observed.
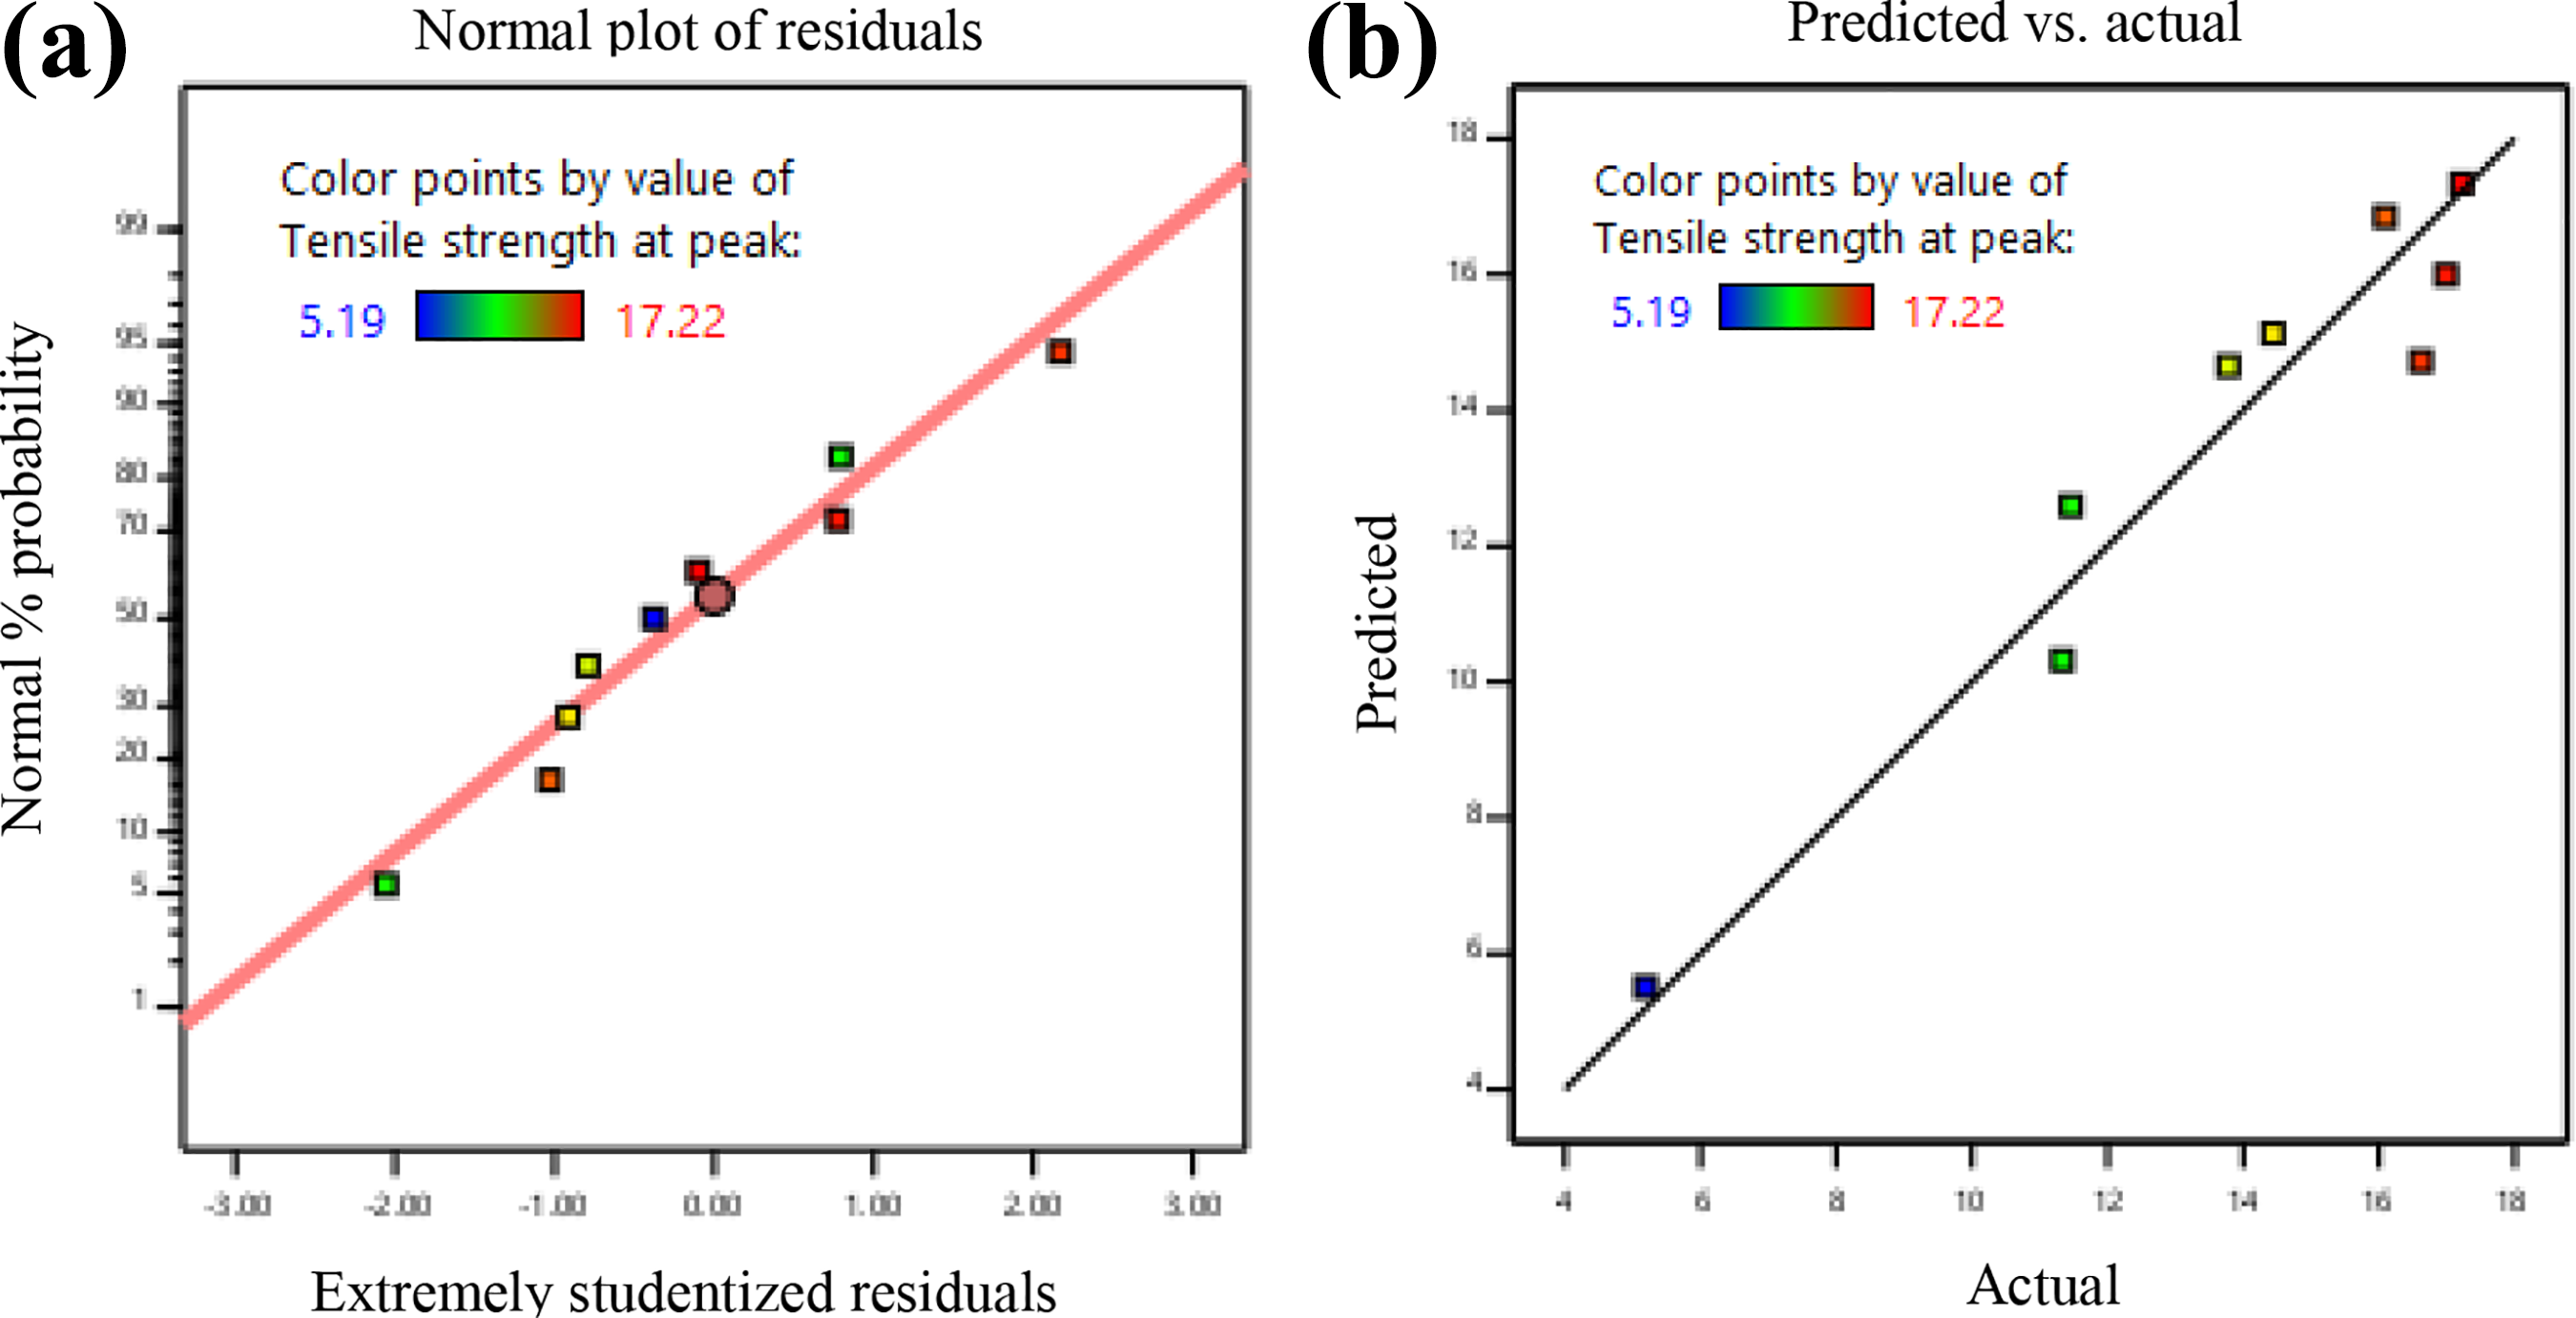
(a) Normal plot of residuals for peak strength and (b) predicted versus actual values for peak strength.
ANOVA has been conducted for break strength, suggesting that the model of experimentation per outcomes of peak strength is significant as the p value obtained is 0.0151 (lesser than 0.05) at 95% confidence level (see Table 8). The barrel temperature alone is the most significant factor as the sum of squares value obtained is 23.80 and for interacting factors, AB is the most desirable as the sum of square value obtained is 39.00. The residual error is found controlled for break strength.
Two-factor interaction ANOVA for break strength.
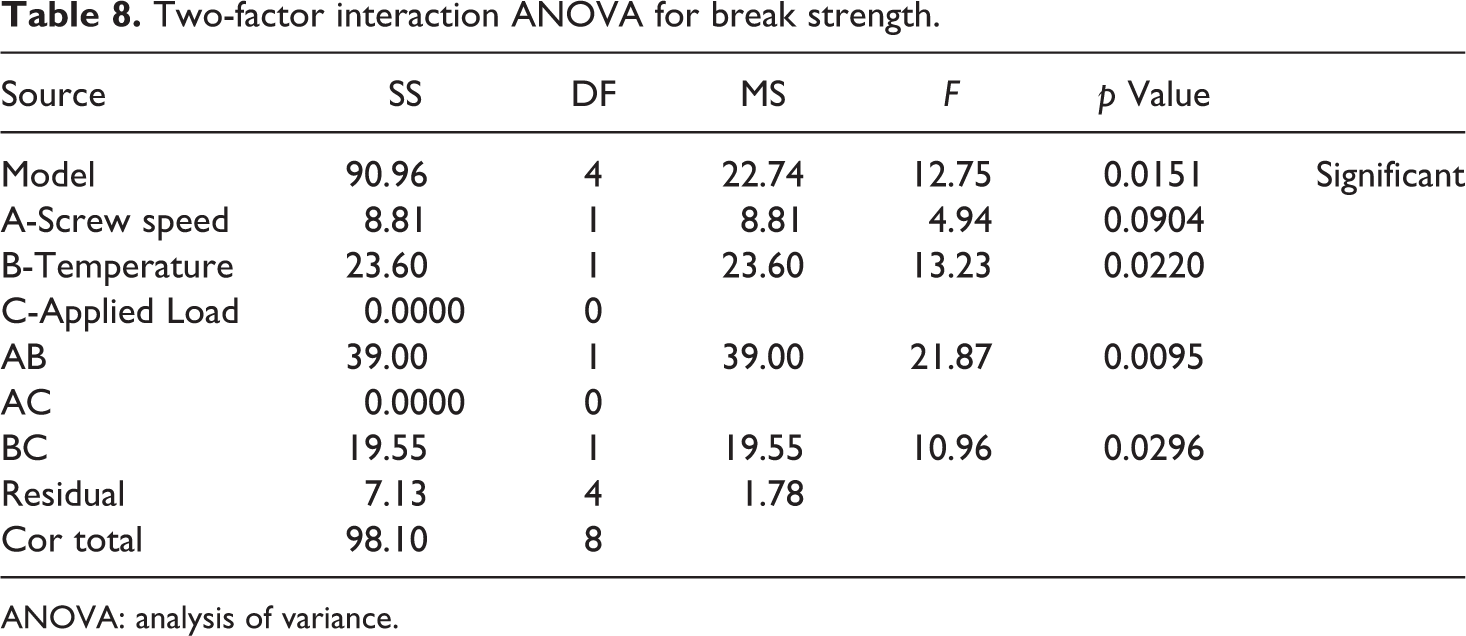
ANOVA: analysis of variance.
Table 9 presents the fit statistics of break strength of feedstock filaments. For the extrusion process, the calculated R 2 value is found to be 0.9273 and adjusted R 2 is 0.8546 (nearer to 1), which shows that the process is statistically controlled.
Fit statistics for break strength of feedstock filament.
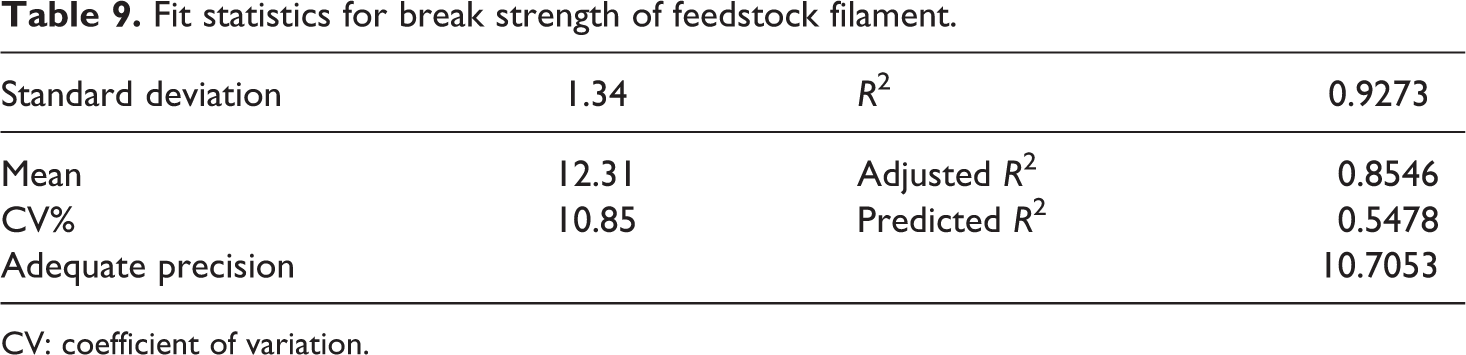
CV: coefficient of variation.
The graphical approach, as shown in Figure 6(a), has been used to counter verify the results for investigation of statistics of the process for break strength. As predicted from the normal plots of the residuals (normal % probability vs. extremely studentized residuals), all the points lie within the red line, which show that results are varied under the control limit. Figure 6(b) shows the plot of predicted vs. actual for break strength. According to the data points shown, no large deviation of data has been observed.
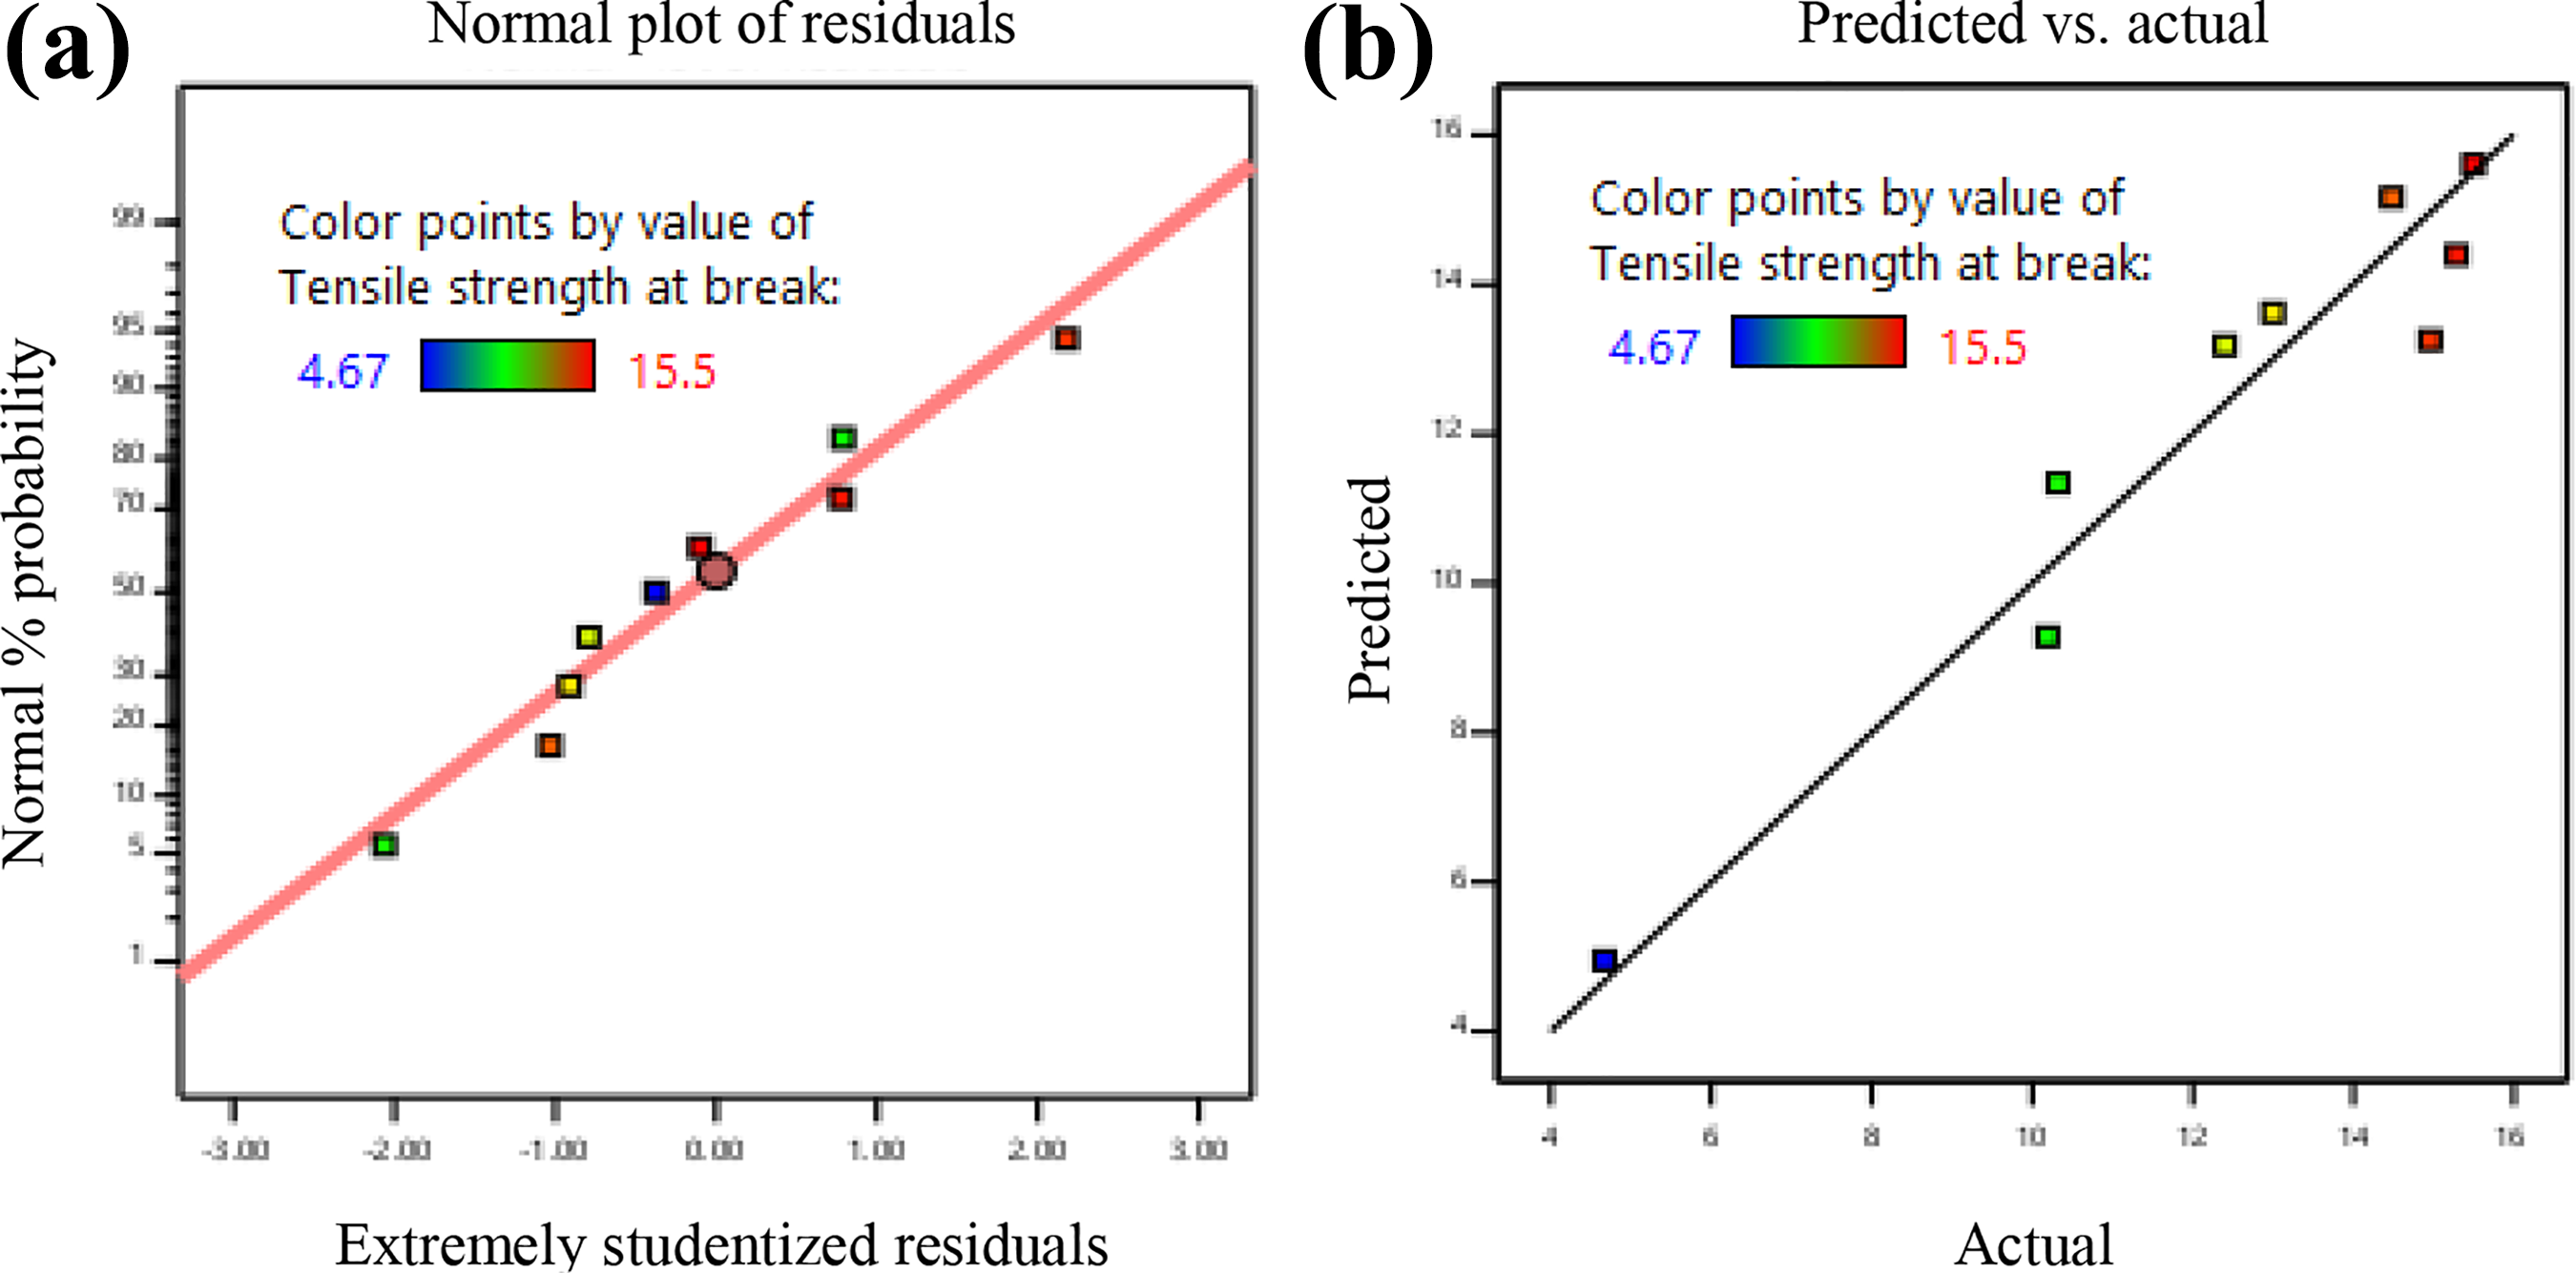
(a) Normal plot of residuals for break strength and (b) predicted versus actual values for break strength.
Further, the SN ratios (based on Table 3) for peak strength and break strength were normalized by considering the ‘Larger is better’ type case. The normalized SN ratios were then used for contour plots to decide the optimum set of extrusion parameters. Figure 7 shows the contour plots for the mean of SN ratios versus (a) screw speed; temperature (b) screw speed, applied load; and (c) applied load, screw speed.
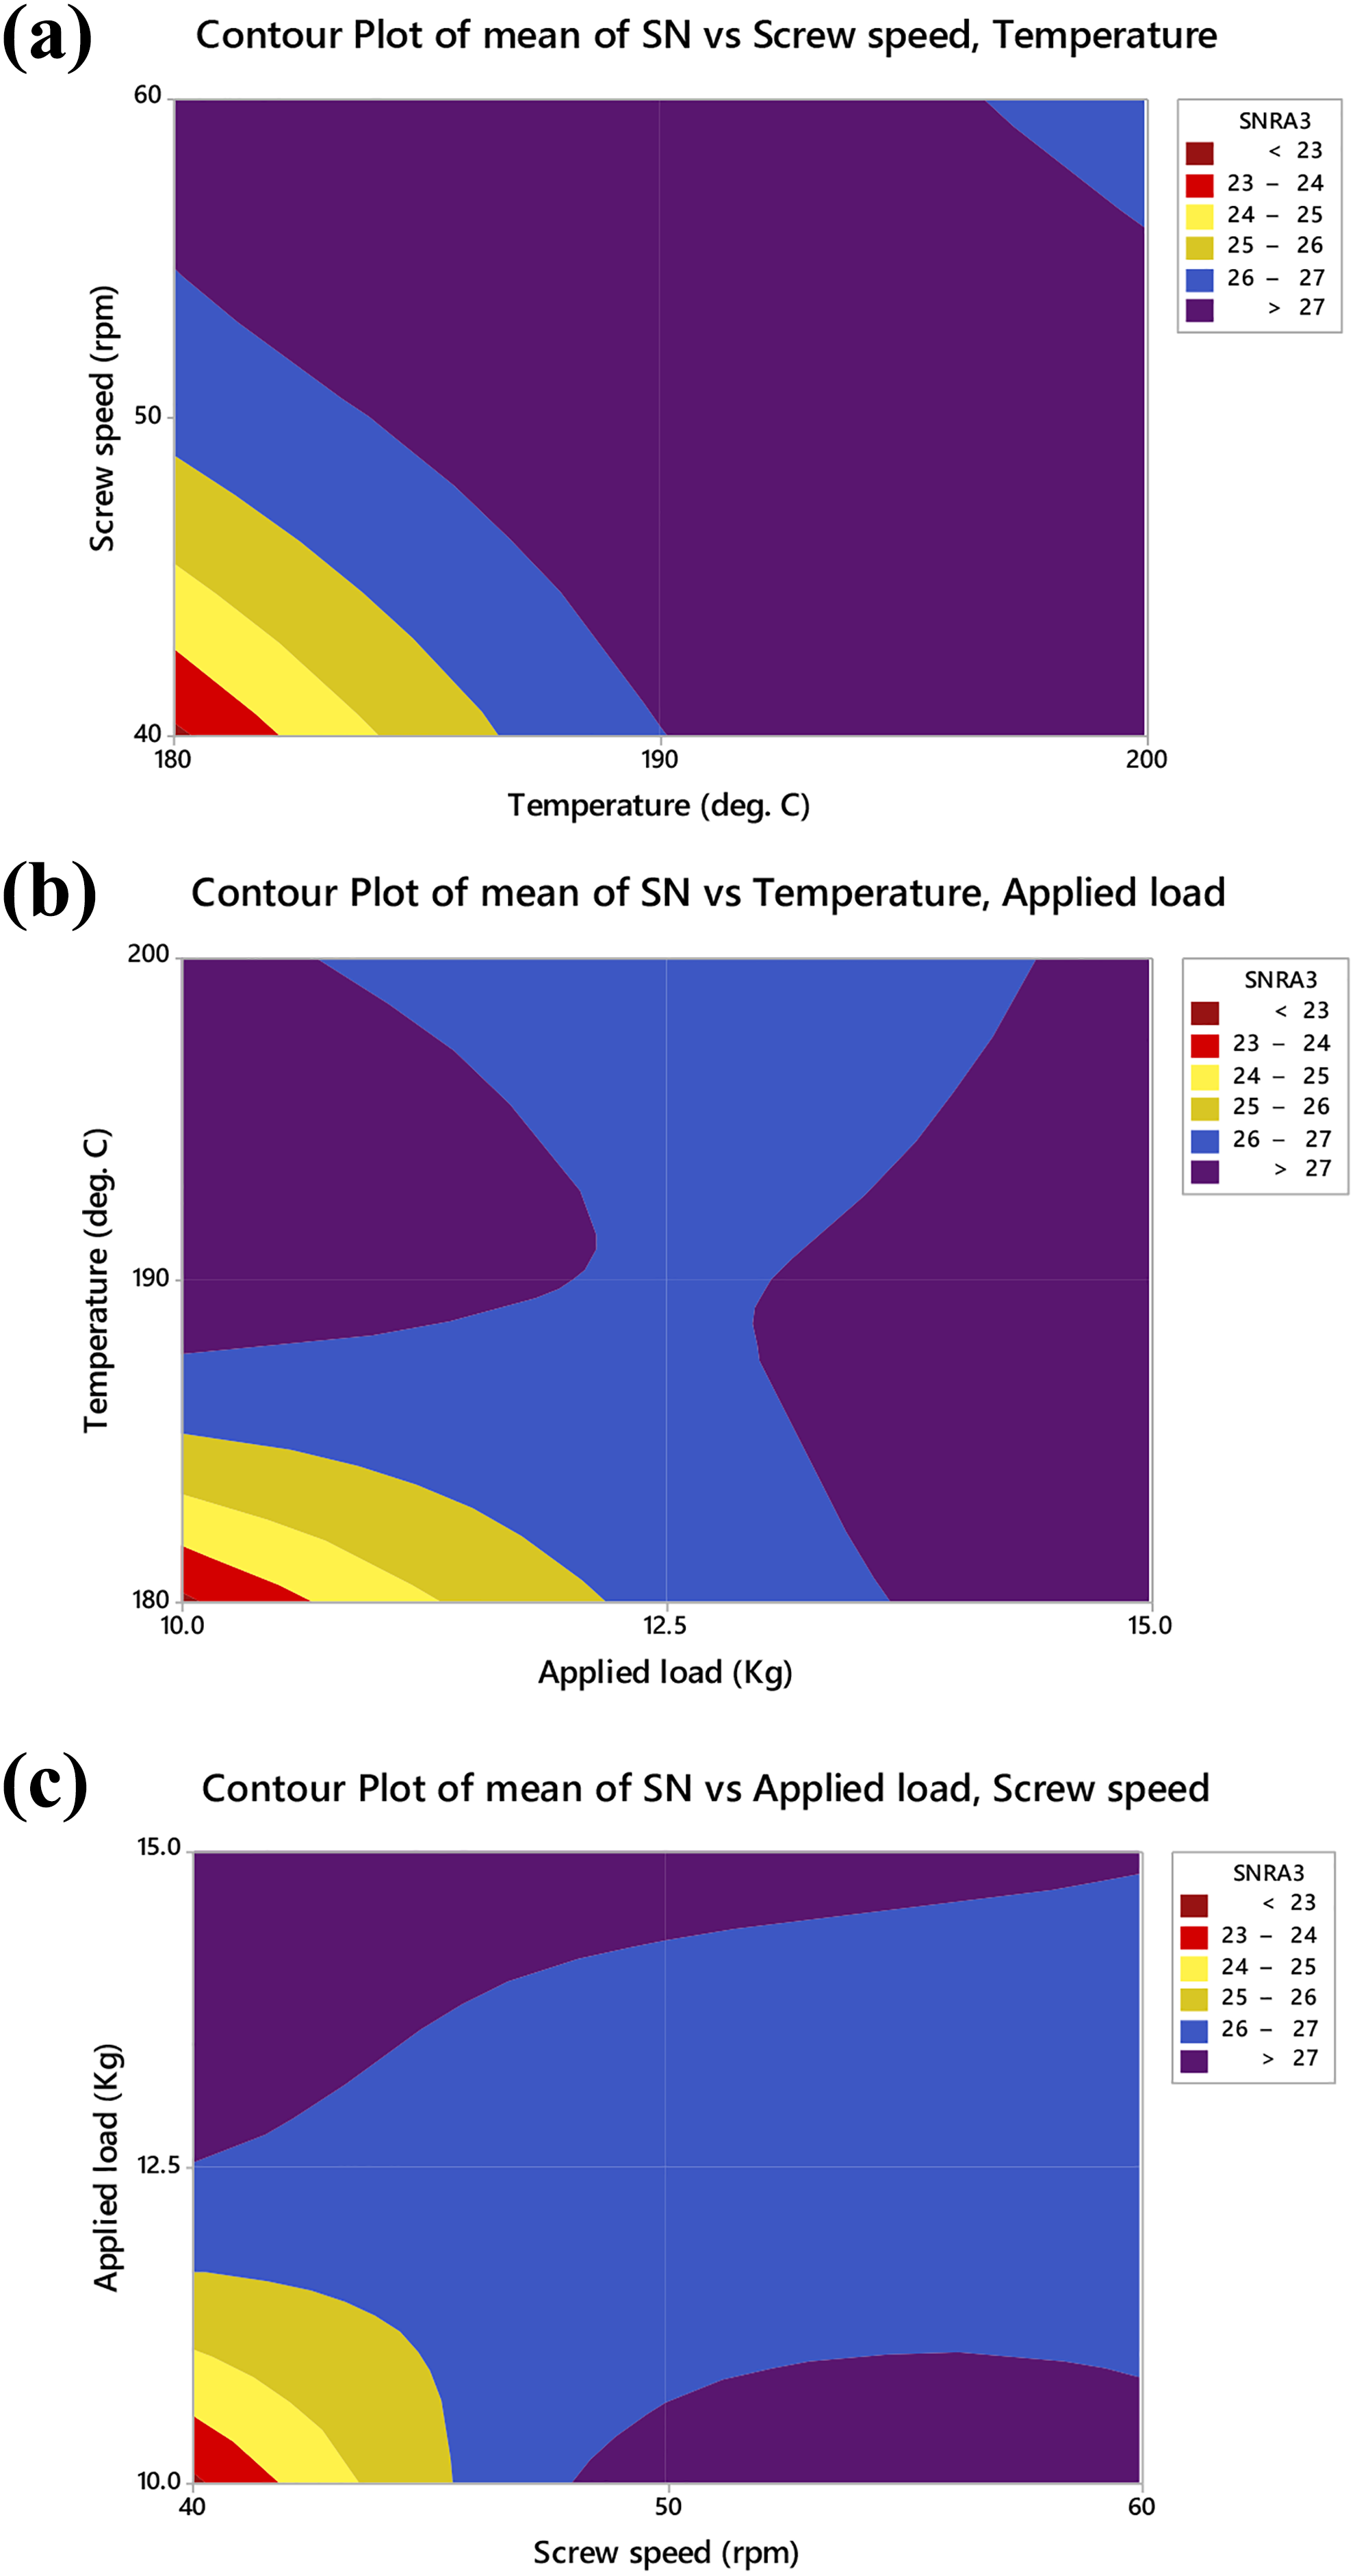
Contour plots for mean of SN ratios versus (a) screw speed, temperature; (b) screw speed, applied load; and (c) applied load, screw speed.
As observed from Figure 7(a), a better range for SN ratio is obtained with the combination of screw speed (50 r min−1) and barrel temperature (190°C). Similarly, the interaction of barrel temperature and applied load shows that the barrel temperature (190°C) and applied load (15 kg) resulted into the maximum contribution of SN ratios (see Figure 7(b)). Further, the connection made between the applied load and the screw speed as an output of SN ratio shows that the applied load (15 kg) and screw speed (50 r min−1) have resulted into maximum SN ratio (see Figure 7(c)). So, based on the SN analysis, the best setting of filament extrusion predicted for maximizing the tensile strength of feedstock is 50 r min−1 screw speed, 190°C barrel temperature, and 15 kg applied load.
Thermal analysis
Further, the samples of experiment no. 1 and experiment no. 8 (as per Table 2) have been thermally tested for critical analysis of changes in normalized heat capacity and melting points as an output of TSE process parameters. The results of DSC analysis suggested that normalized heat capacity of sample 8 (−63.9 J g−1) has been obtained more than sample 1 (−20.52 J g−1). So, it can be ascertained that sample 8 will take more energy for thermal deformation than sample 1. Also, the degradation of normalized heat capacity was recorded more in sample 1 (degraded from −20.52 J g−1 to −8.15 J g−1 in three repetitive thermal cycles), as compared to sample 8 (degraded from −63.59 J g−1 to −57.82 J g−1 in three repetitive thermal cycles). This means that the sample prepared at experimental condition 8 is more thermally stable as compared to the sample prepared at experimental condition 1. On the other hand, there is no major degradation of the melting point of samples (see Figure 8).
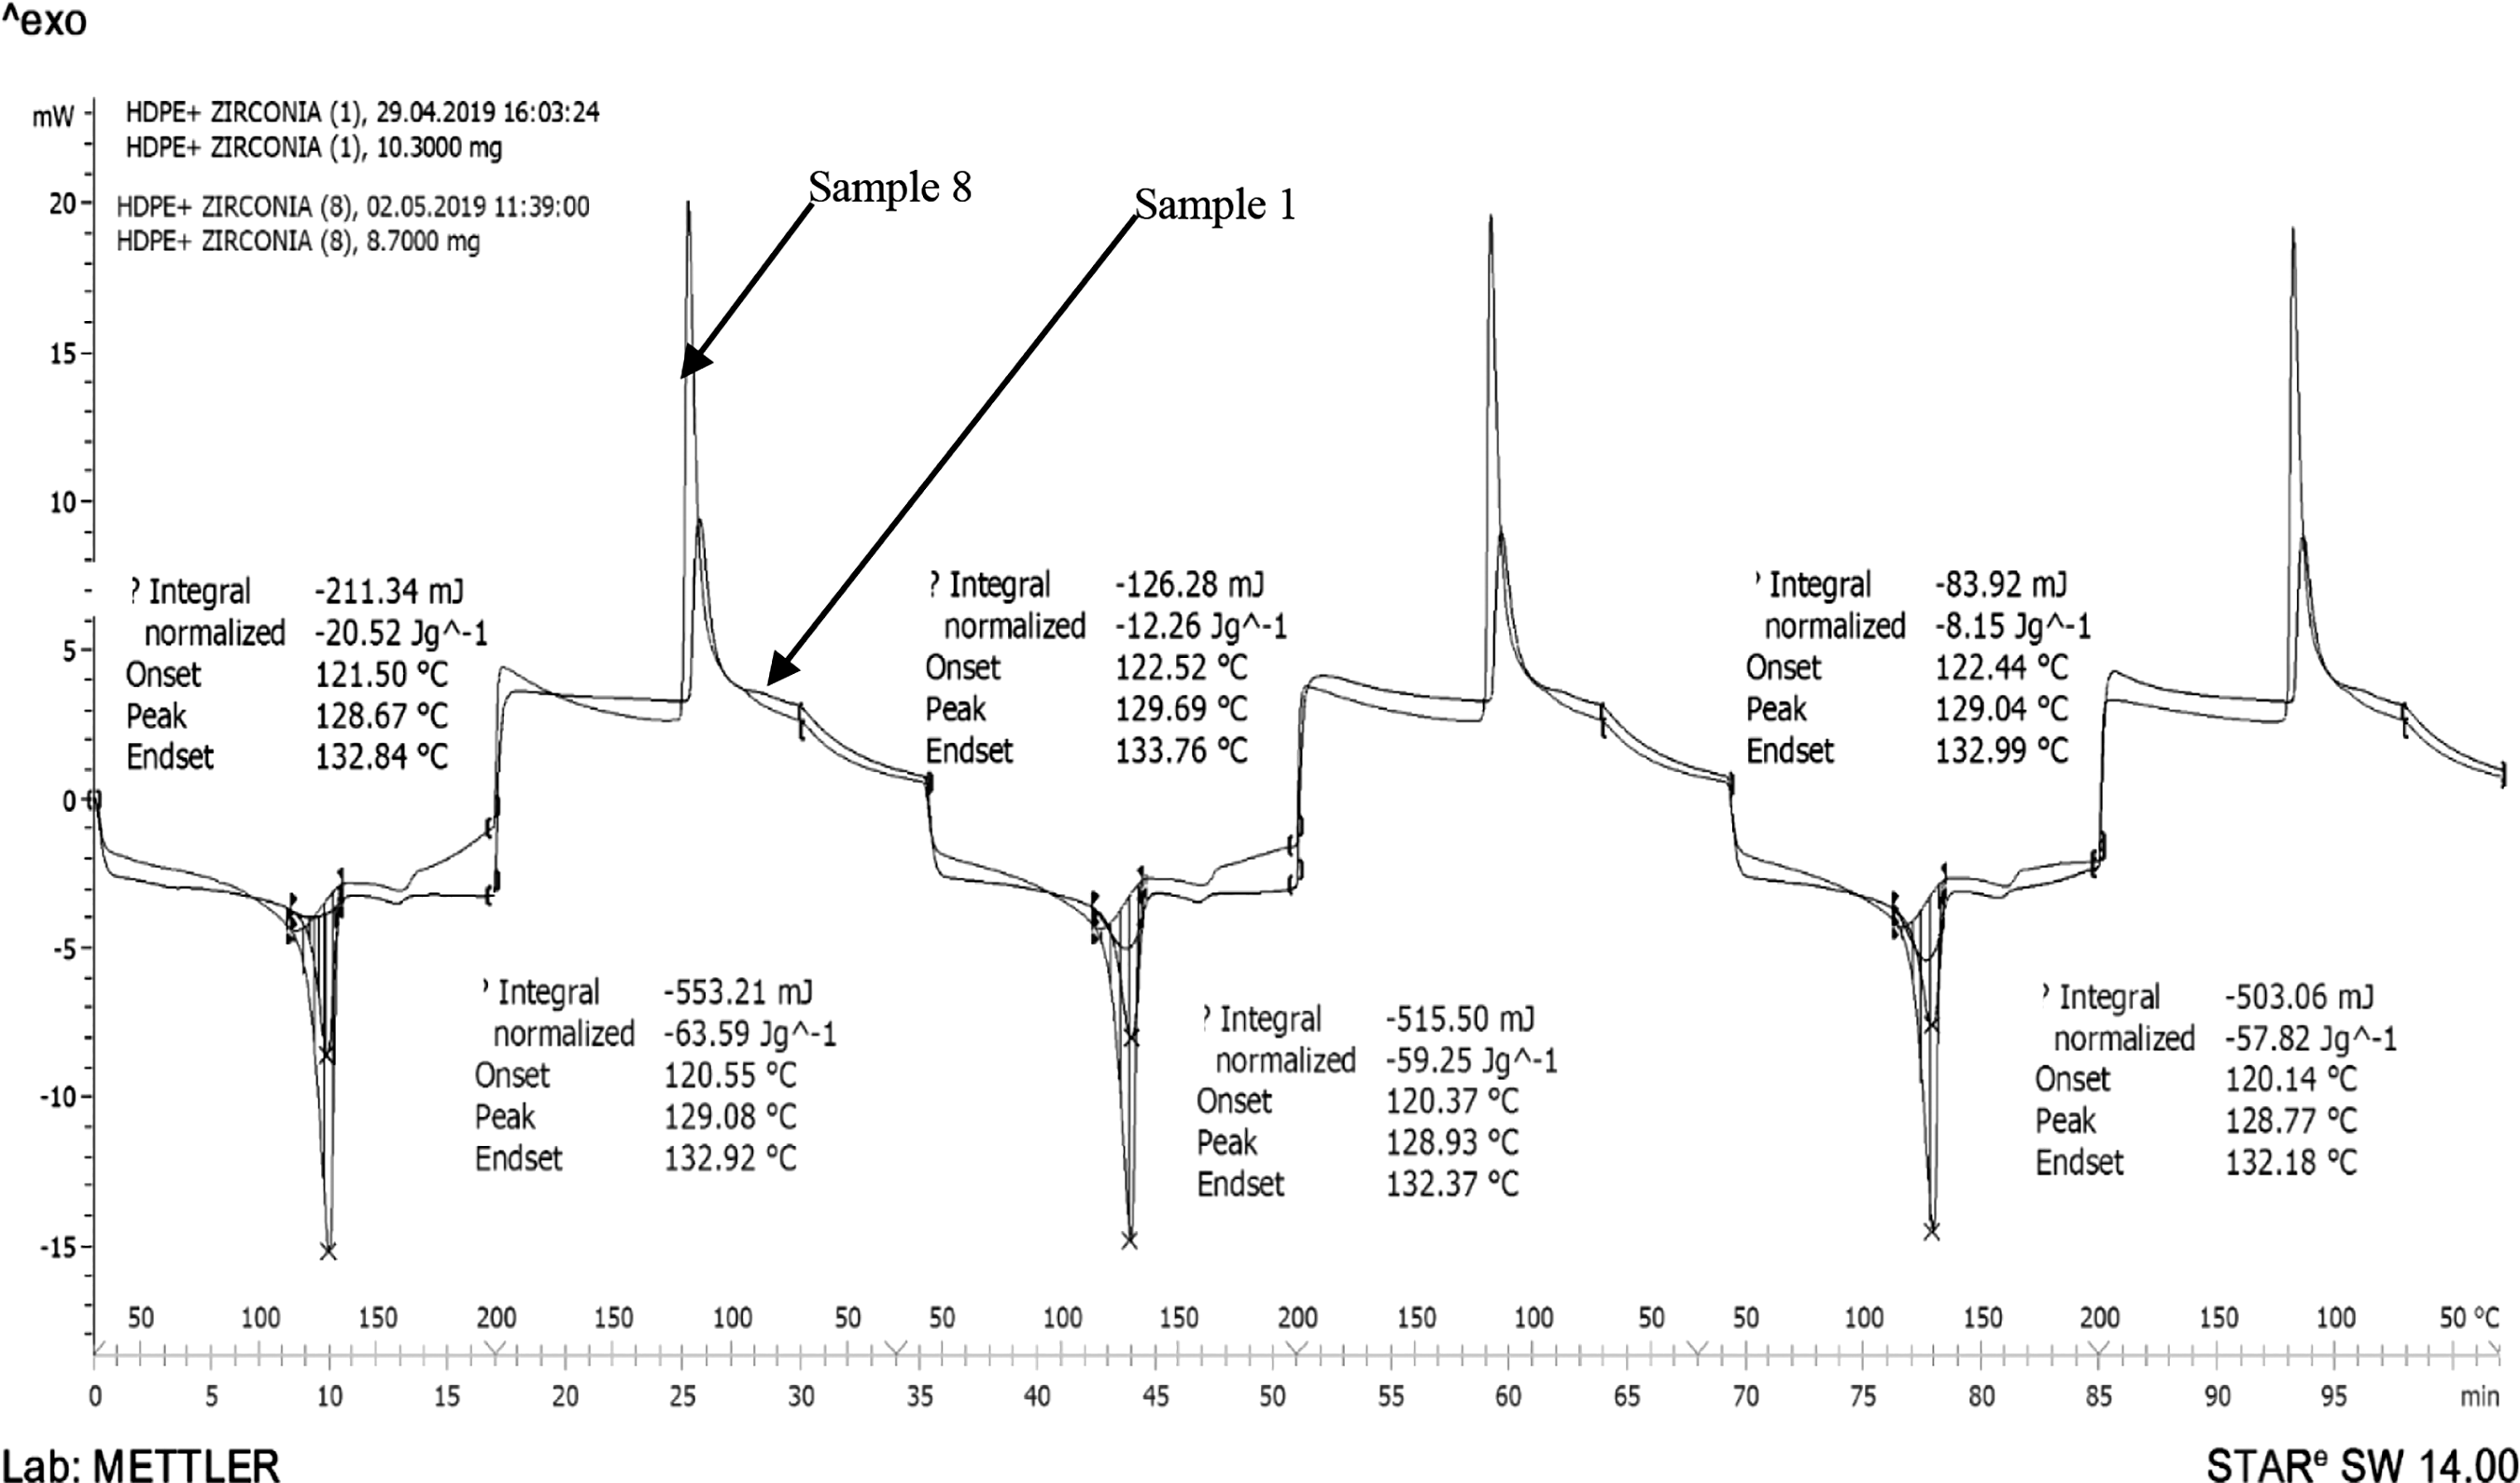
DSC curves of sample 1 and sample 8 (per Table 2).
Wear analysis
Figure 9 shows curves for wear rate and coefficient of friction of primary recycled HDPE and secondary recycled HDPE-40% ZrO2 obtained by wear analysis. It has been observed that the wear rate of primary recycled HDPE sample is more as compared to secondary recycled HDPE-40% ZrO2. The results of coefficient of friction obtained for recycled HDPE is 0.162, which is greater than samples of HDPE-40% ZrO2 (with the coefficient of friction 0.066). This low coefficient of friction for HDPE-40% ZrO2 shows that it can resist more wear environment as compared to primary recycled HDPE and made itself eligible for practical bearing applications.
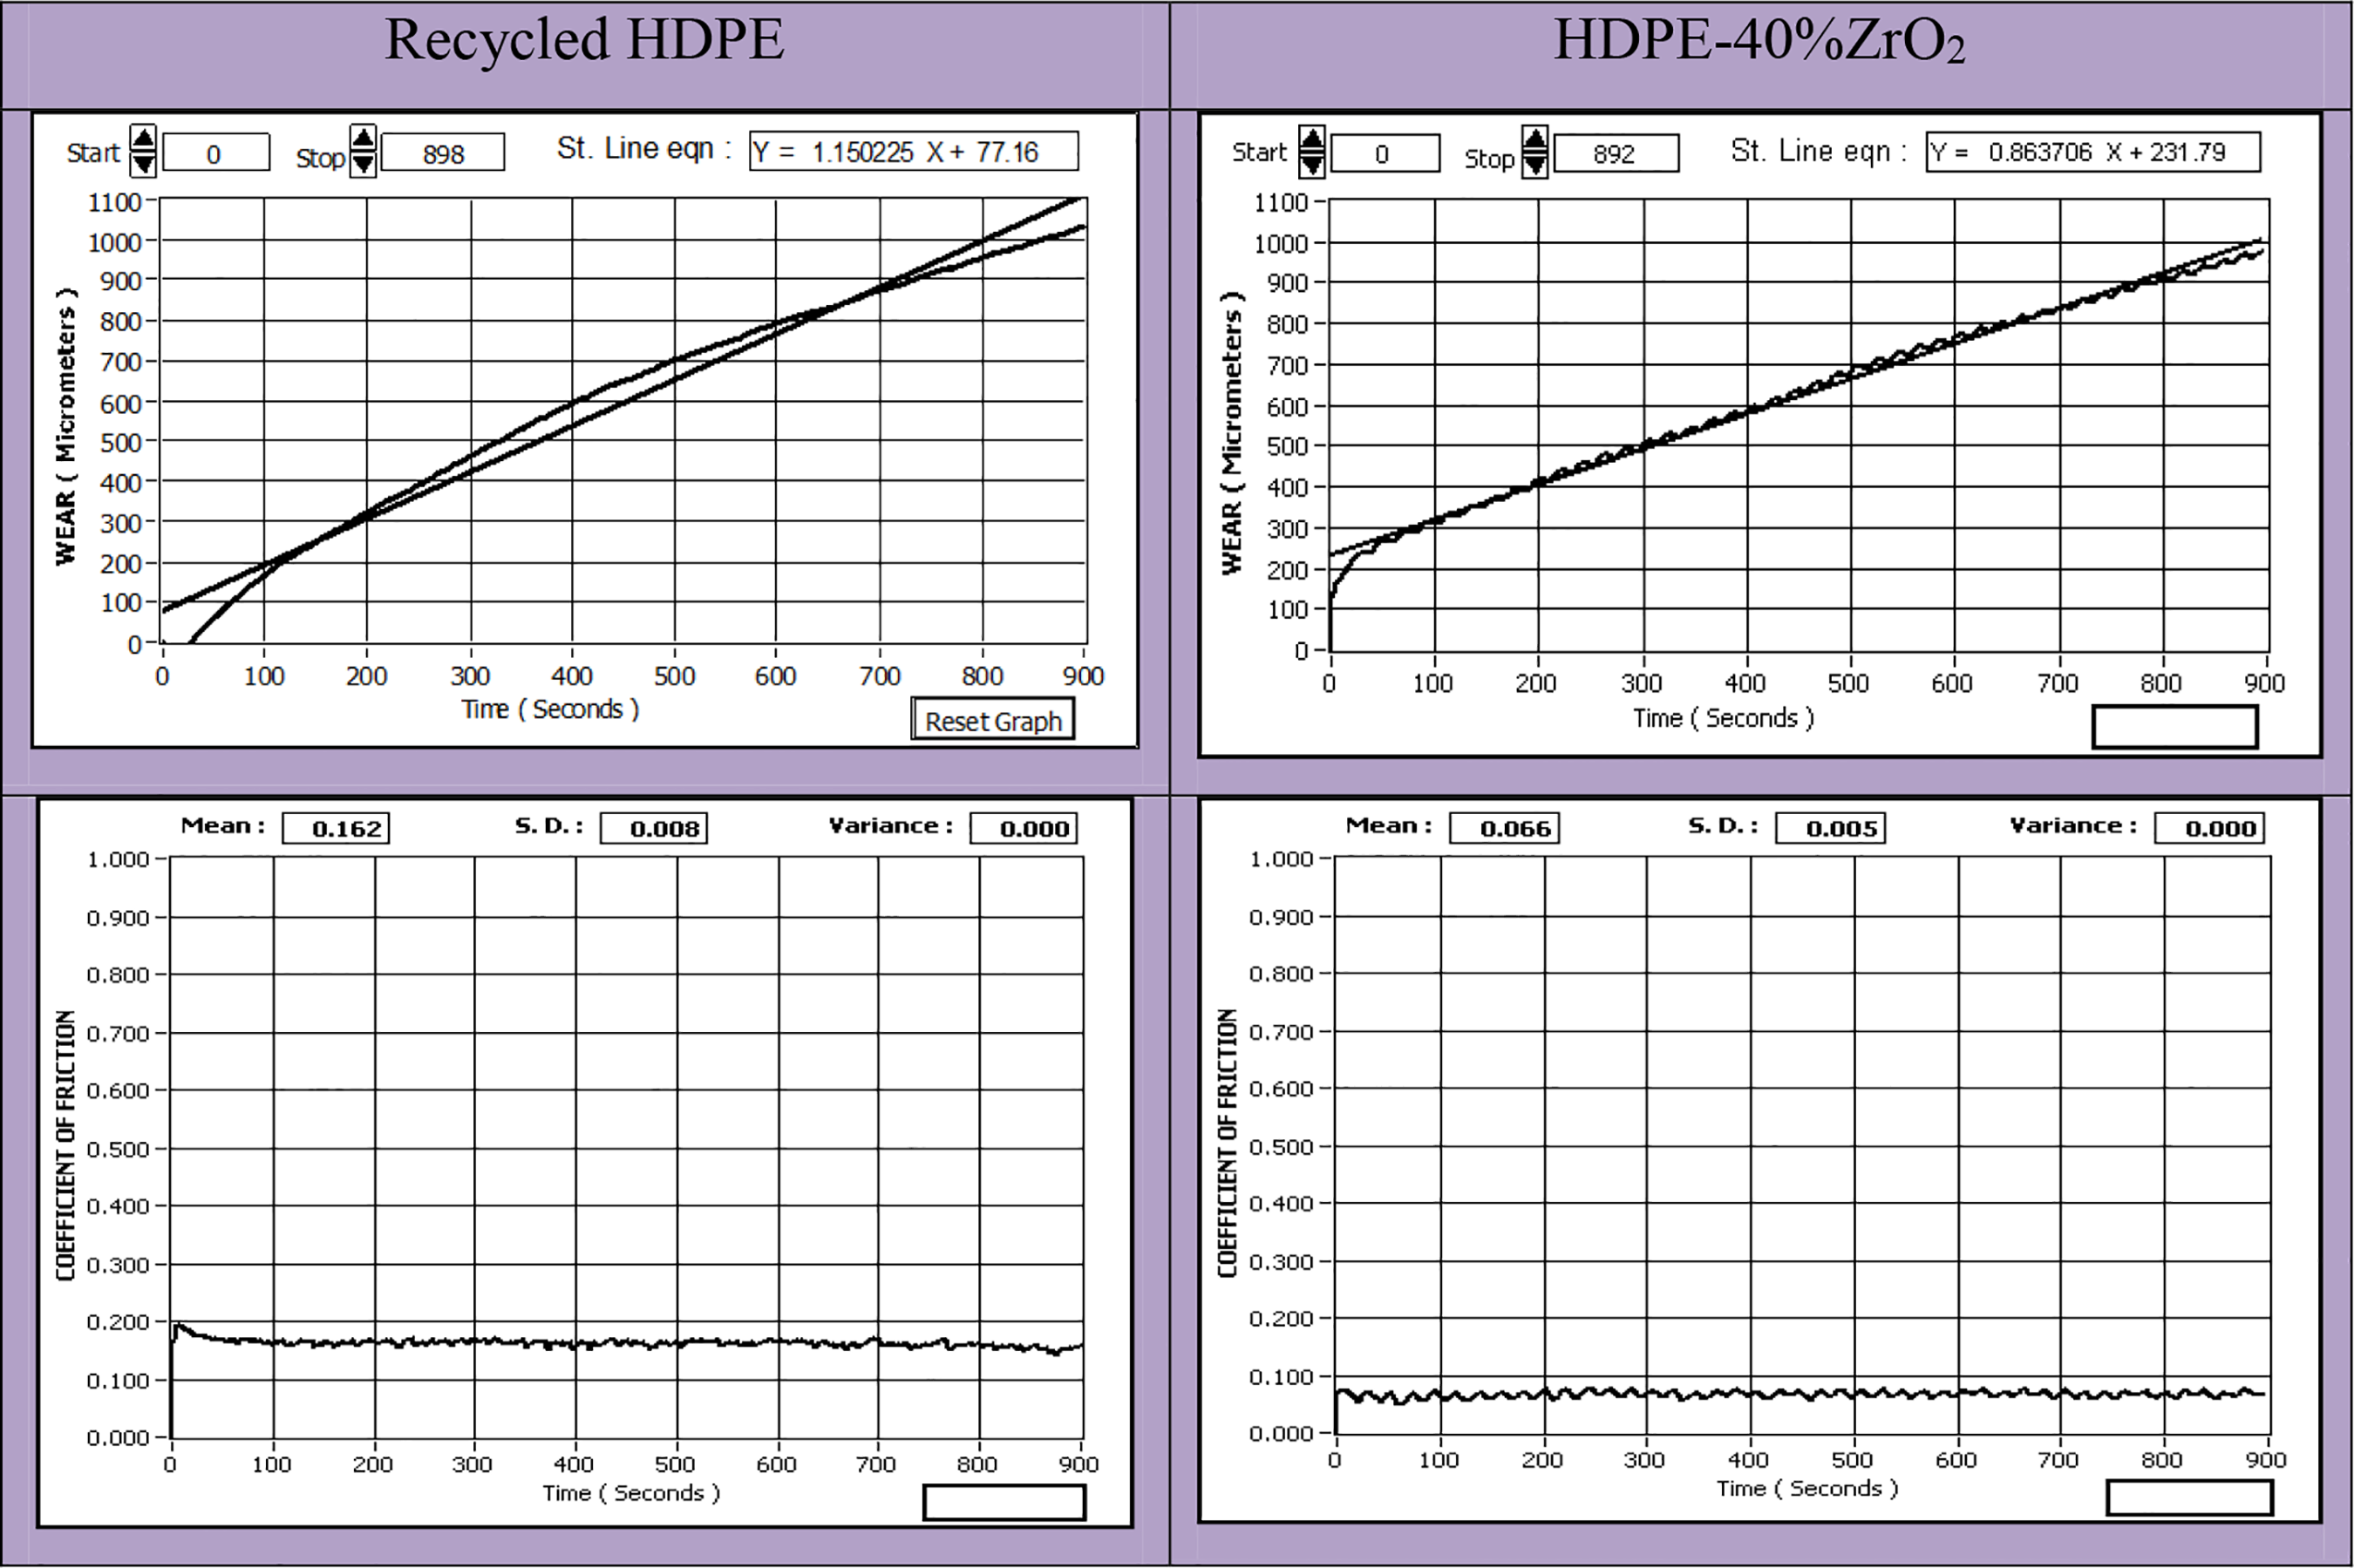
Curves for wear rate and coefficient of friction of HDPE and HDPE-40% ZrO2.
SEM analysis
Figure 10 shows the SEM micrographs obtained at 50×, 100×, and 1000× magnification. The SEM analysis has been conducted on the fractured surface of feedstock filaments after tensile testing. The SEM analysis has been conducted to investigate the dispersion of ZrO2 into the HDPE matrix. For HDPE-40% ZrO2 samples, the attachment of ZrO2 particles was observed better in HDPE matrix for sample 8 as compared to sample 1 (as per Table 2). This may be due to the fact that the optimum processing condition of TSE has resulted in a more uniform distribution of ZrO2 particles in sample 8.
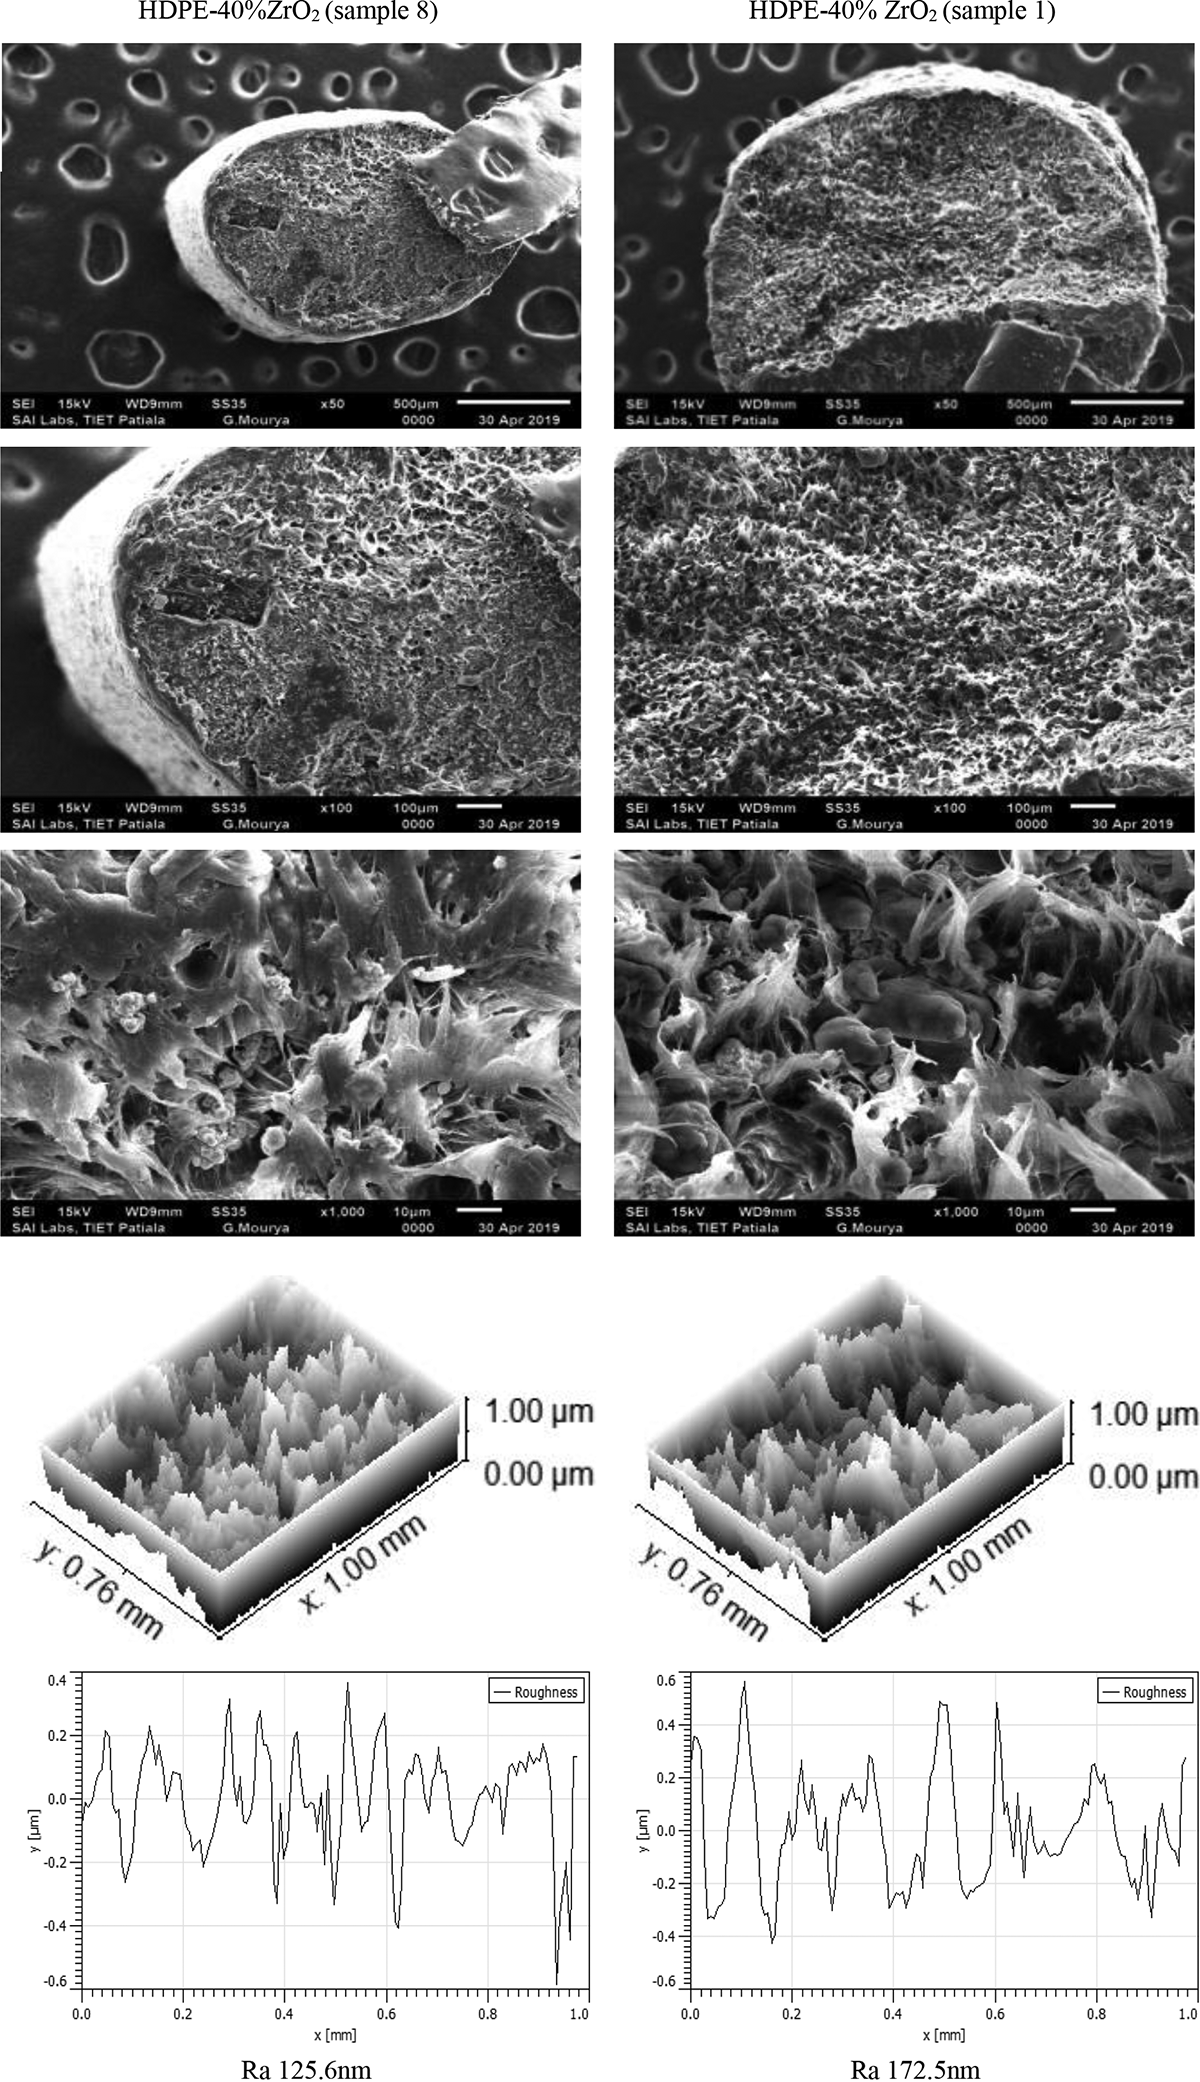
SEM micrographs and surface topology of samples 8 and 1 (per Table 2).
It should be noted that the Ra values (at 1000×) for sample 8 are lower than sample 1 (processed per processing conditions mentioned in Table 2), which also justifies better dispersion of reinforcement into the HDPE matrix.
Conclusions
The present study proposed an innovative route for preparation of feedstock filaments of 3-D printing for bearing applications. The following conclusions have been drawn from the present study: Based on two-factor interaction results, it has been ascertained that screw speed (50 r min−1), barrel temperature 190°C, and applied load (15 kg) are optimized settings for TSE (from feedstock filament tensile strength viewpoint) for secondary recycled HDPE-40% ZrO2 composite matrix. The degradation of normalized heat capacity was recorded more in sample 1 (degraded from −20.52 J g−1 to −8.15 J g−1 in three repetitive thermal cycles) as compared to sample 8 (degraded from −63.59 J g−1 to −57.82 J g−1 in three repetitive thermal cycles) per Table 2. This means that the sample prepared at experimental condition 8 is more thermally stable as compared to the sample prepared at experimental condition 1. On the other hand, no major degradation of the melting point of samples has been observed. It has been observed that the wear rate of primary recycled HDPE sample is more as compared to the sample made up of secondary recycled HDPE-40% ZrO2. The coefficient of friction obtained for primary recycled HDPE was higher than secondary recycled HDPE-40% ZrO2. This lower coefficient of friction for secondary recycled HDPE-40% ZrO2 shows that it can resist more wear environment as compared to primary recycled HDPE and made itself eligible for low-temperature bearing applications.
Footnotes
Acknowledgement
The authors are thankful to Manufacturing Research Lab (Production Engineering), Guru Nanak Dev Engineering College, Ludhiana, for technical support.
Funding
The author(s) disclosed receipt of the following financial support for the research, authorship, and/or publication of this article: The authors are thankful to AICTE New Delhi (Ref. No. 9-65/RIFD/MODROB/Policy-1/2016-17) for financial support.