
Abstract
Bionanocomposites of poly-3-hydroxybutyrate (PHB), polyethylene glycol (PEG), and organophilic vermiculite (VMT) clay were prepared at 95/5/3% and 90/10/3%and blends at 95/5% and 90/10% PHB/PEG in the form of films obtained via solution intercalation. The films were submitted to hydrolytic degradation according to the ASTM F1635-11. X-ray diffraction (XRD) analysis, mass loss, visual inspection, and Fourier transform infrared (FTIR) spectroscopy evaluated the properties of films. XRD analysis showed that the polymer chains were intercalated into the organoclay layers, and some degree of exfoliation was observed from this analysis. FTIR was performed to calculate the carbonyl index and to quantify the causing group of the degradation process. The visual inspection results showed that the film surfaces were whitened and brittle. This characteristic was more evident for the 90/10% PHB/PEG blend and 90/10/3% PHB/PEG/VMT composite. The addition of the organophilic VMT clay at 95/5/3% (PHB/PEG/VMT) displayed a larger mass loss; FTIR showed that degradation of pure PHB occurred in the amorphous regions and that the presence of PEG and VMT increased the polymer degradation, decreasing crystallinity.
Introduction
Polymers show a wide range of applications in diverse areas of society, as in biomedicine. Seeking to further widen their use, materials from renewable sources have been derived, such as biodegradable polymers. These biodegradable polymers may be derived from raw materials, such as corn, sugar cane, and cellulose, being synthesized by bacteria from small molecules. 1,2 The best-known and most important biodegradable polymers are aliphatic polyesters, polylactic acid (PLA), polyglycolic acid, polycaprolactone (PCL), and poly-3-hydroxybutyrate (PHB). 3
Attempting to make PHB more competitive and increase its use, some modifications have been accomplished to make its processing feasible, such as obtaining blends, composites, and bionanocomposites, representing alternative and effective ways to obtain a new material with desired and improved properties of biodegradable polymers. 4
In this sense, one of the major components used for the formation of bionanocomposites and polymeric blends is polyethylene glycol (PEG), which is a flexible and biocompatible polyester, widely used to modify hydrophobic polymers. 5 It is regarded as a nontoxic polymer, water- and organic solvent-soluble, and widely used in different pharmaceutical, food, and cosmetic formulations. 6 It is also noted that PEG has been widely used for the modification of biomedical materials, and its incorporation into the PHB matrix can improve hydrophilicity, degradability, and biocompatibility. 7 The incorporation of inorganic fillers, such as organophilic clays, has improved the performance of polymers, and they are widely used as an additive in the production of polymeric bionanocomposites, thus originating materials with greater mechanical strength and greater thermal stability. 4 Vermiculite (VMT), the filler used in this work in the production of bionanocomposites, is a mineral clay derived from the alteration of types of mica, which has the peculiarity of expanding itself when submitted to high temperatures, and this is the characteristic that impels its industrial value. 8 The clay used to improve matrix properties in this work was VMT, a clay abundant in Brazil, with reserves in some states, such as Piauí, Paraíba, Bahia, and Goiás. Similar to the many silicates, it shows a lamellar crystalline structure formed by the unitary cell of the mineral clay group; in the organophilization, the alkylammonium ions present an inclined arrangement within the interlamellar space, which may be influenced by the change in conformation through the C–C bond rotation. 9
The understanding and controlling of the degradation process of polymeric materials in different conditions and the effect of their degradation products are of fundamental importance. Some factors that may cause the degradation of a polymer may be related to the processing conditions and the environmental effects of the matrix, as well as the chemical structure of polymers and their components that influence degradation rate in addition to morphology, crystallinity, and others. Depending on the intended application of the polymer, the choice of the best test is necessary so that its degradation can be evaluated. 10 The ASTM F1635-11 is the specific standard used for the in vitro hydrolytic degradation tests, and it evaluates the behavior of biomaterials, in which the major chemical degradation mechanism in the human body is by hydrolysis that is the reaction of water with the polymer resulting in the chain cleavage. 11 This standard allows the quantification and monitoring of test conditions, such as temperature, pH, and degradation products. Other assays on in vitro biodegradation, cytotoxicity, and mechanical properties are required, in view of the possible applications of these materials in biomedical areas, for example, in dressings.
In this context, the aim of this article is to prepare pure PHB films, bionanocomposites (PHB/PEG/organophilic VMT clay), and blends (PHB/PEG) at different compositions through the solution intercalation method. The systems were evaluated by means of the hydrolytic degradation test, and their properties were analyzed through visual inspection, mass loss, and Fourier transform infrared (FTIR) spectroscopy. Through FTIR, the calculation of the carbonyl index was attained, which helped in the quantification of the causing group of the degradation process. The hydrolytic degradation test was chosen as it simulates body conditions, such as pH and temperature, and aims at biomedical applications. The topic of this work becomes strategic, as it can ally the biodegradability of PHB and PEG and the reinforcing effect of the chemically modified Brazilian clay. In addition, the systems used are little explored in the literature, especially in the area of biomaterials.
Experimental
Materials
PHB was provided by PHB Industrial S/A (Serrana, Brazil), and Pedra Lavrada Mining Co. (Paraíba, Brazil) provided the expanded VMT clay for developing this research. PEG 1500 P.A. used as a plasticizer and the solvent chloroform were acquired by Synth Ltd (Diadema, São Paulo, Brazil). The salt stearyl dimethyl ammonium chloride (Praepagen WB®) was acquired by Clariant (São Paulo, Brazil).
Chemical modification of the VMT clay
The organophilization of VMT clay was accomplished according to the procedures followed by Barbosa et al. 12 and Mesquita et al. 8
Processing the films—solution intercalation
PHB was previously sieved and dried in a drying oven at 70°C for 24 h before preparing the films by the solution intercalation method. After this time, PHB was added to the solvent so that the polymer was swollen. Then, the solution of PHB was submitted to mechanical stirring and heating at 80°C for 3 h. For the formation of pure PHB films (PHB-M), blends (BD-95%, BD-90%) with 5% or 10% of PEG, and bionanocomposites (BIO-95%, BIO-90%) with 3% of organophilic VMT clay, the aforementioned solutions were poured over marble plates and kept at rest until total evaporation of the solvent and formation of these films.
Hydrolytic degradation test
The hydrolytic degradation test of pure PHB films, blends, and bionanocomposites was carried out as per the ASTM F1635-11 (2010), by controlling the pH and temperature. The sample hydrolytic degradation was accomplished in a phosphate-buffered saline (PBS) solution (pH 7.4 ± 0.2). The films were put in triplicates in assay tubes with 10 ml of PBS solution and kept in shaking water bath at 37 ± 2°C. The test was carried out for a total period of 12 weeks, and in different time intervals (2nd, 4th, 6th, 8th, and 12th weeks), the films were removed from the controlled environment and weighted humid (Wh) and then dried in a drying oven at the temperature of 60°C. Later, the films were analyzed by visual inspection, mass loss, and FTIR before and after the degradation test. The results for the mass loss were attained by equation (1):

where M0 is mass (g) of the film before the degradation test and Mf is mass (g) of the film after the test period (weeks).
Visual inspection
The visual inspection was accomplished by means of records of images of the films before and after the removals in function of hydrolysis time aiming to follow up the films’ aspect in a macroscopic manner during degradation. The records of images were carried out with the help of an 8.0-megapixel digital camera.
X-ray diffraction analysis
A Shimadzu XRD 6000 X-ray diffractometer system was used to perform X-ray diffraction (XRD) analyses of the pure PHB film, organoclay, bionanocomposites, and blends. Scans were recorded in the range of 2θ = 1.5–30°.
FTIR analysis
The FTIR analyses were carried out on a Shimadzu IRAffinity-1 model spectrometer with a scanning rate of 4000 at 450 cm−1, from the Federal Institute of Piauí, Teresina, Brazil. To the spectra attained by FTIR, a mathematical treatment was applied known as deconvolution. This treatment was carried out aiming to improve the resolution of bands, and for that, the graphic Software Origin 8.0 was used in the Lorentzian function, applied specifically to the carbonyl bands (C=O), being the carbonyl band at 1722 cm−1 referring to the crystalline phase and at 1751 cm−1 related to the amorphous phase. The internal pattern band used as a reference (A0), for PHB, blends, and bionanocomposites corresponded to the deformation of the CH3 group at 1380 cm−1. Equation (2) shows the mathematical relationship involved in this calculation with the carbonyl index attained by the ratio between the area (At) of the carbonyl peak and the area of the reference band peak (A0). 13,14
The area (At) of interest in all spectra was the stretching region of carbonyl with the bands in the range from 1800 cm− 1 to 1700 cm− 1, considering the amorphous and crystalline fractions of the polymer. The calculation was accomplished considering the samples before and after the removals referring to the second and sixth weeks of the experiment. The results of mass loss and FTIR for the 8th and 12th weeks were not reported due to the brittle condition of the films after this period.
Results and discussion
Visual inspection
Figure 1 illustrates the visual aspect of films of PHB-M, BD-95%, BD-90%, BIO-95%, and BIO-90%, referring to the removals (2nd, 4th, 6th, 8th, and 12th weeks). In the systems, it can be observed that the surface was shown whitened all over its length after the removal periods. The opacity of films after degradation was also observed in studies of Fukushima et al. 15 , where the authors attested that this characteristic of degradation is caused by the hydrolysis process occurred in the polymeric matrix.
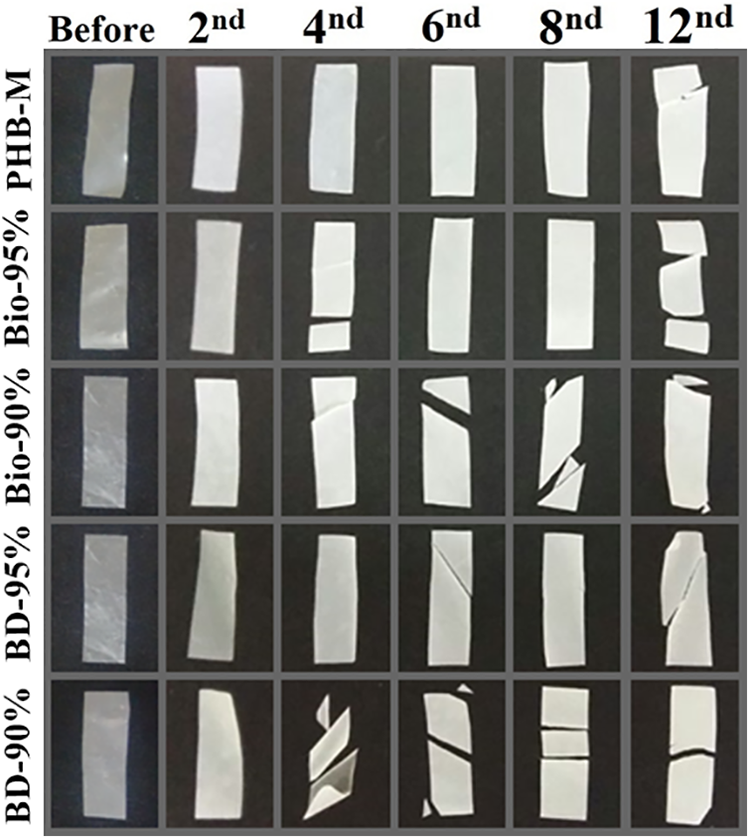
Photographic records of the films before and after each withdrawal (2nd, 4th, 6th, 8th, and 12th weeks) throughout the degradation test.
The visual analysis of the films also showed that, by the end of 12 weeks of test, some samples presented a greater brittleness. Roy et al. 16 observed the increase of brittleness of polymeric materials by the end of the degradation in hydrolysis studies of poly-L-lactic acid with modified clays as the filler. The PHB-M films did not show brittleness until the eighth week of the test, in comparison with the remainder composites. In the 12th week of degradation in the PBS solution, the PHB films showed an increase in their opacity and brittleness, becoming more breakable due to the deterioration of the films and the increase of the crystalline phase along the degradation process.
The BD-90% composite was seen to be more brittle, with a dim aspect all along the hydrolytic test; this behavior is suggested to be a consequence of the alterations in the polymers structure, due to hydrolysis and the incorporation of 10% of PEG. Visually, this composite degraded the most. According to Zhijiang et al. 17 , upon studying the PHB/PEG blends, the samples containing PEG were more susceptible to the degradation process because of their hydrophilic characteristic, which leads to a better water absorption and, consequently, to degradation. The BIO-90% composite was shown fragmented all over the test, because of the increase of the degradation time and thus acquiring a whitened color (dim), with fissures and a brittle aspect. The brittleness observed was caused by the increase of the porosity of materials, attributed to the incorporation of the clay and PEG, which possibly altered the hydrophilicity of the polymer resulting in a more degraded material. Sá et al. 18 when preparing films of PHB, PEG, and inorganic filler observed a similar behavior by the casting method, where the authors verified the presence of porosity in all systems by scanning electron microscopy. The dim visual aspect can also be explained by the samples refraction index because of water absorption. Cortázar et al. 19 found similar results for the hydrolytic degradation of PCL during 65 weeks.
Mass loss
Table 1 and Figure 2 show the results of mass loss of the pure PHB films, bionanocomposites, and the blends during 8 weeks under the hydrolytic degradation test. The expected result would be mass loss in all composites due to ester bonds of PHB undergoing hydrolysis reactions. In general, the composites showed significant mass losses, but in a nonlinear pattern with the time variation.
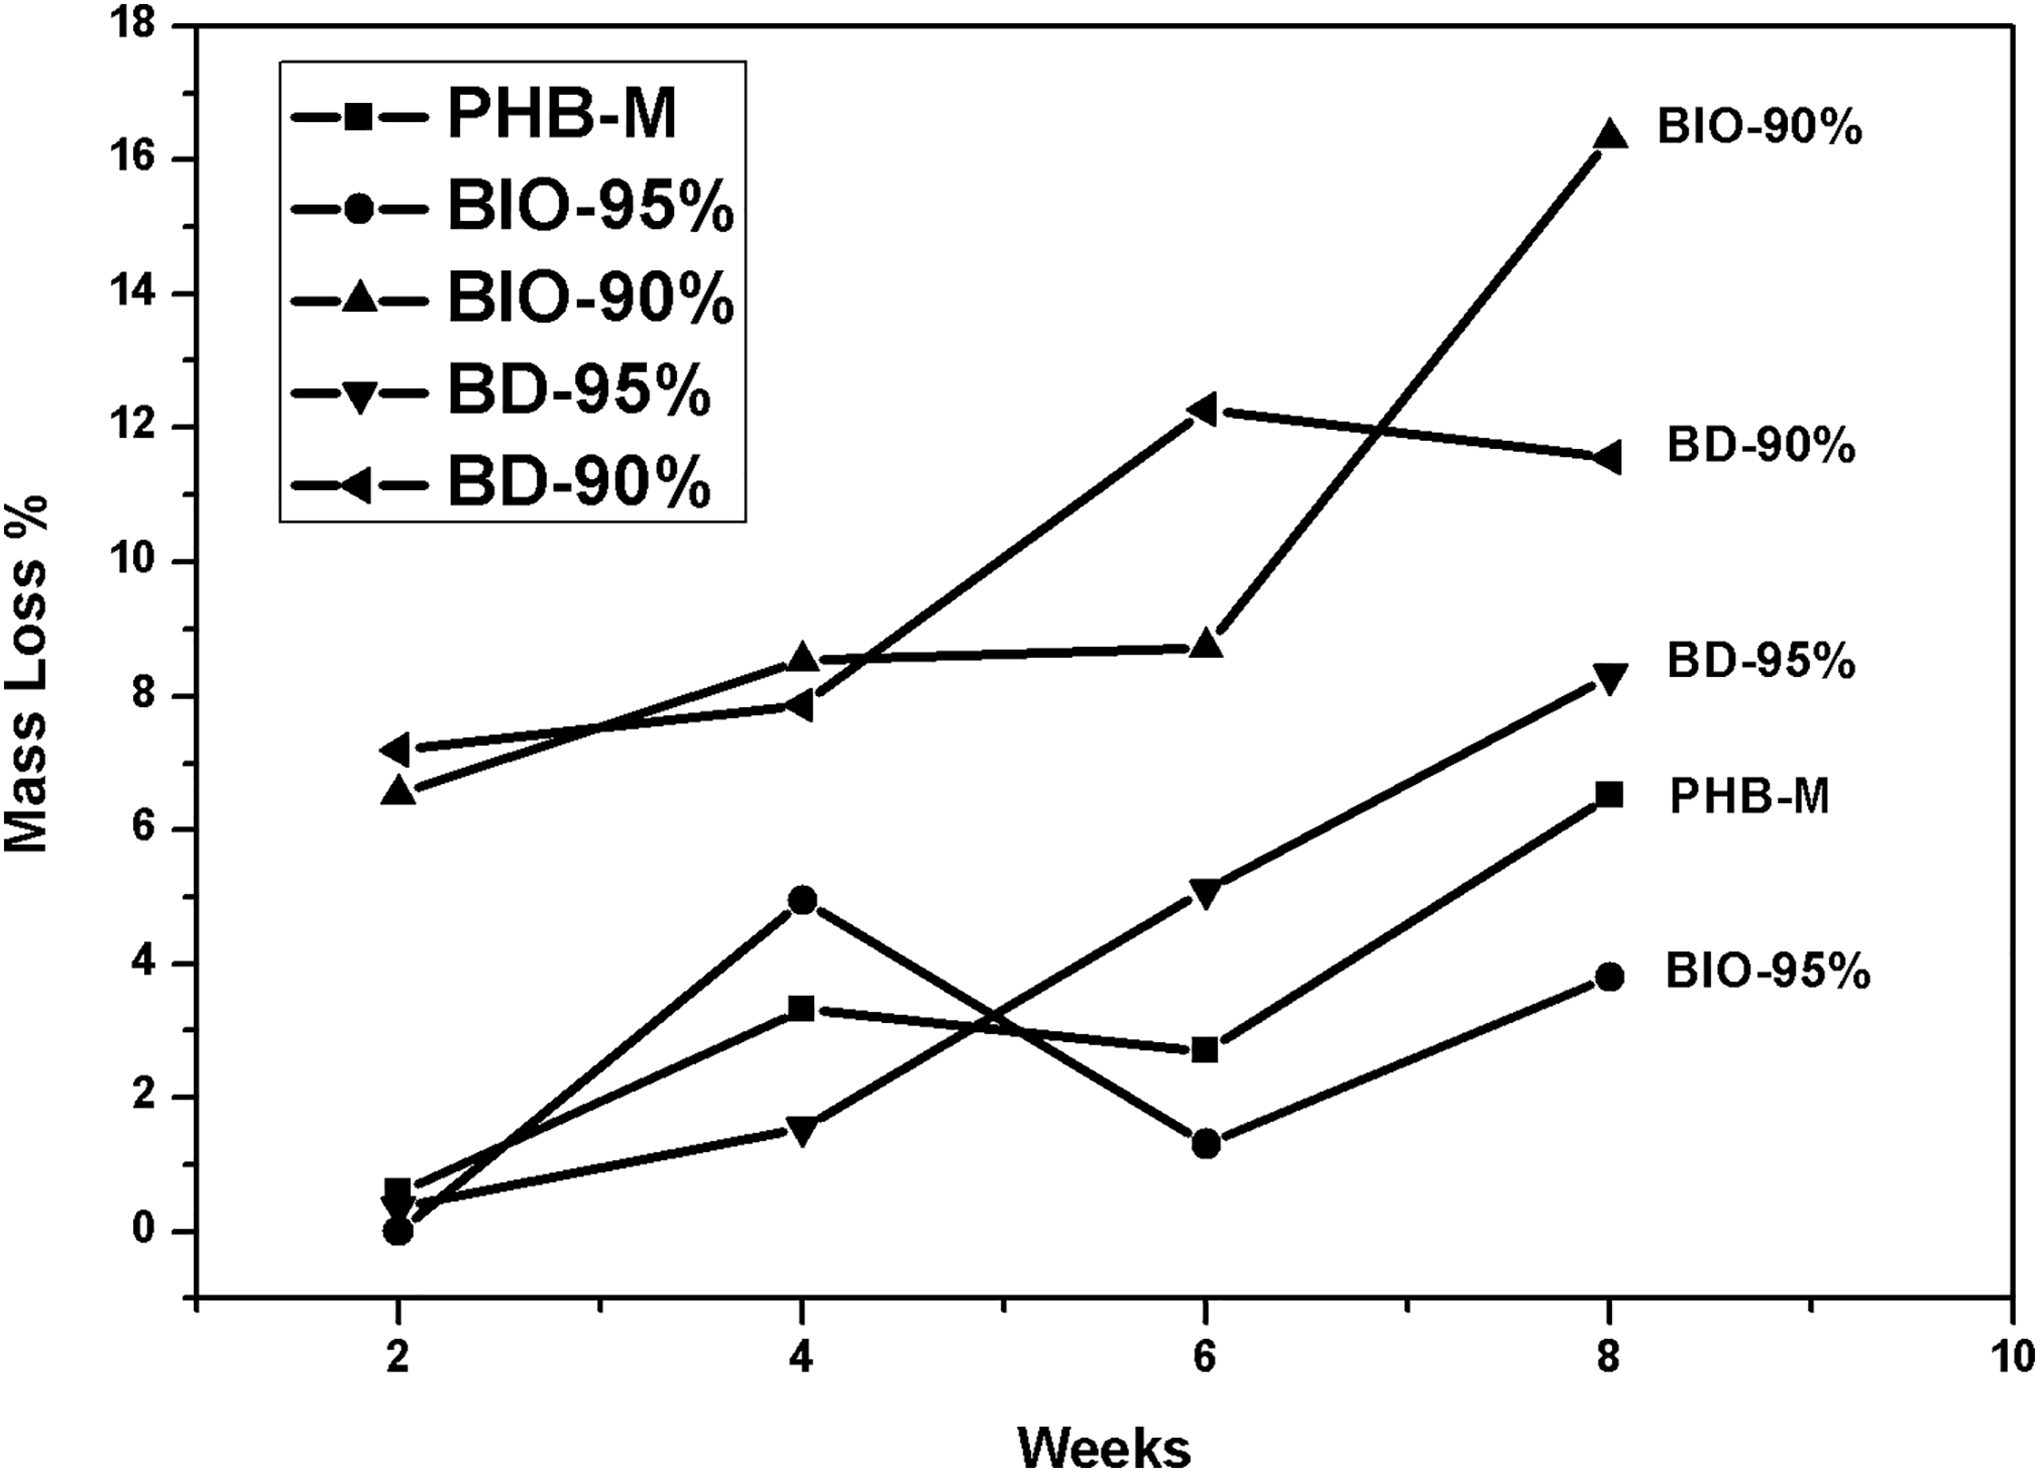
Percentage of mass loss of pure PHB films, bionanocomposites, and blends in function of the hydrolytic degradation test time.
Data of mass loss of pure PHB films, bionanocomposites, and blends.
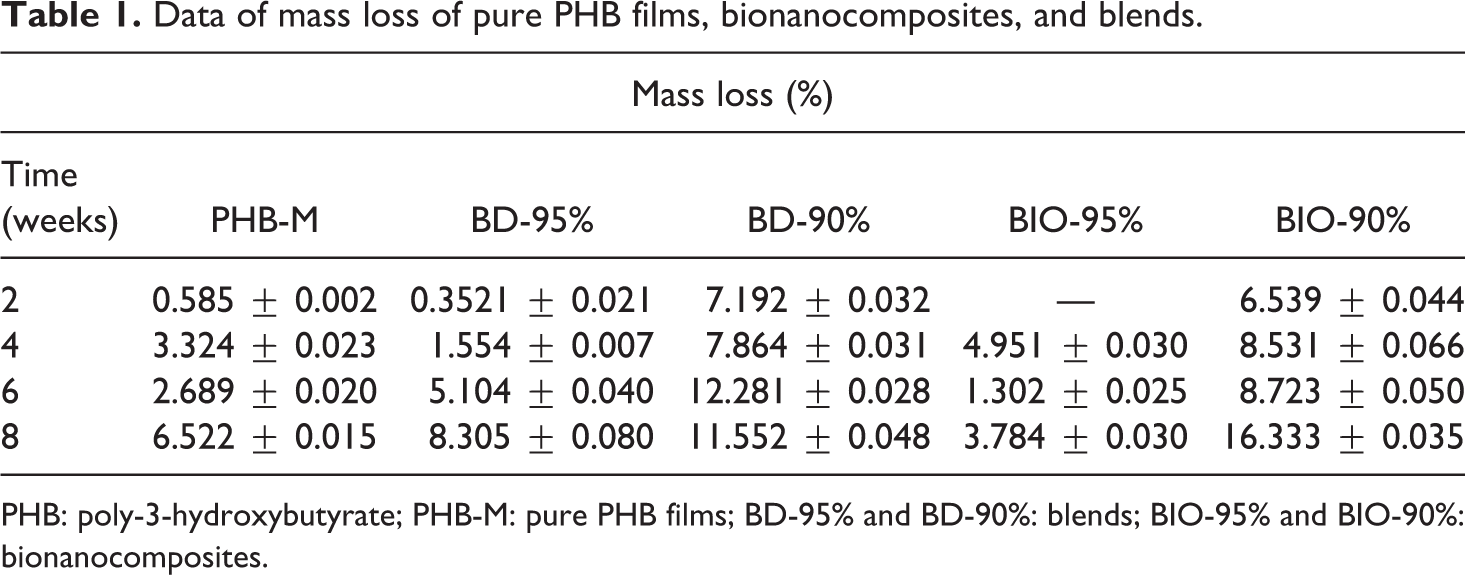
PHB: poly-3-hydroxybutyrate; PHB-M: pure PHB films; BD-95% and BD-90%: blends; BIO-95% and BIO-90%: bionanocomposites.
The variation in mass loss showed a tendency of distinct behavior among the composites: as observed in Figure 2, the loss mass of the pure PHB film increased in the first 2 weeks displaying a linear trend, and it presented a small decrease in the 6th week of the test. It is also possible to observe that the BD-95% blend is the only composite that showed a linear mass loss, that is, gradually increased the percentage of mass loss as time passed. As regards the BD-90%, it exhibited a more stable tendency, with an increase only from the fourth to the sixth week, maintaining the same percentage of mass loss until the end of the degradation.
With the increase of hydrolysis time, there was convergence between the blends BD-95% and BD-90%. This behavior was related to the addition of the plasticizer and to the characteristic of PEG in influencing permeability and solubility of the mixture. According to Zhao et al. 20 , the incorporation of PEG segments in the main chain disturbs the regularity of molecular chains, and the crystallinity of PHB apparently decreases. These factors may accelerate the hydrolysis process, as PEG makes the material hydrophilic attracting H–O–H bonds, which in turn cause the break of ester bonds of the PHB structure. 21,22
For the bionanocomposites, fluctuations of mass loss occurred. In the fourth week of the test, the BIO-95% composite showed a loss of 4.95% in average, larger than for the next removals. It is possible to observe that both exhibited distinct behaviors; BIO-95% did not show mass loss as the test began, whereas the BIO-90% composite lost approximately 6.50% of its mass in the second week of the test and approximately 17% in the eighth, with a percentage much higher than PHB-M and BIO-95%. Degradation was suggested to have been influenced by the addition of the organophilic VMT clay. According to Kmita et al. 23 , who evaluated the hydrolytic degradation in nanocomposites, the addition of clay promoted water penetration into the structure, resulting in a shortening of polymeric chains, which enabled the materials’ physical disintegration more quickly.
The fact may also be attributed to the presence of PEG, enabling thus the increase of water availability within the polymeric matrix. 20 Therefore, the composites with organophilic clay showed irregular and distinct behaviors. It was possible to observe that by the end of the test, the largest mass loss occurred for the BIO-90% composite, with an approximate value of 16%; such behavior referred to the catalytic effect of the clay that accelerated the material biodegradation, equally to the variation of mass loss. According to Hablot et al. 24 , the clay can work in two ways: delaying and accelerating the degradation effect.
By the end of the test, the majority of composites exhibited equivalent mass losses, around 6–16%. It is worth to point out that the increase of mass loss can also be related to the release of soluble oligomers; once the polymers were immersed into the PBS solution, water penetrated the chain and the samples underwent cleavage of the ester bond. 25
The films’ visual appearance corroborated with the mass loss, where the bionanocomposite BIO-90% and the blend BD-90% showed larger mass loss rates and more degraded appearance in their visual aspect.
It is important to highlight that some systems presented higher values of loss of mass in the fourth week of withdrawal when compared to the values observed in the sixth week of degradation. This behavior can be attributed to the deposition of saline crystals in the structure of the films, originating from the hydrolytic solution. Another possibility of this increase may be the formation of biofilms, which consists of a complex microbiological ecosystem formed by populations of bacteria, fungi, and/or protozoa in isolation or in combination that are adhered to a surface of the films, consequently increasing the values of mass loss. 26,27
X-ray diffraction
XRD analyses were carried out to evaluated structural modifications of the PHB by the addition of the organoclay and PEG. Figure 3 displayed the diffractograms of the organoclay, pure PHB film, bionanocomposites, and blends before the hydrolytic degradation test.
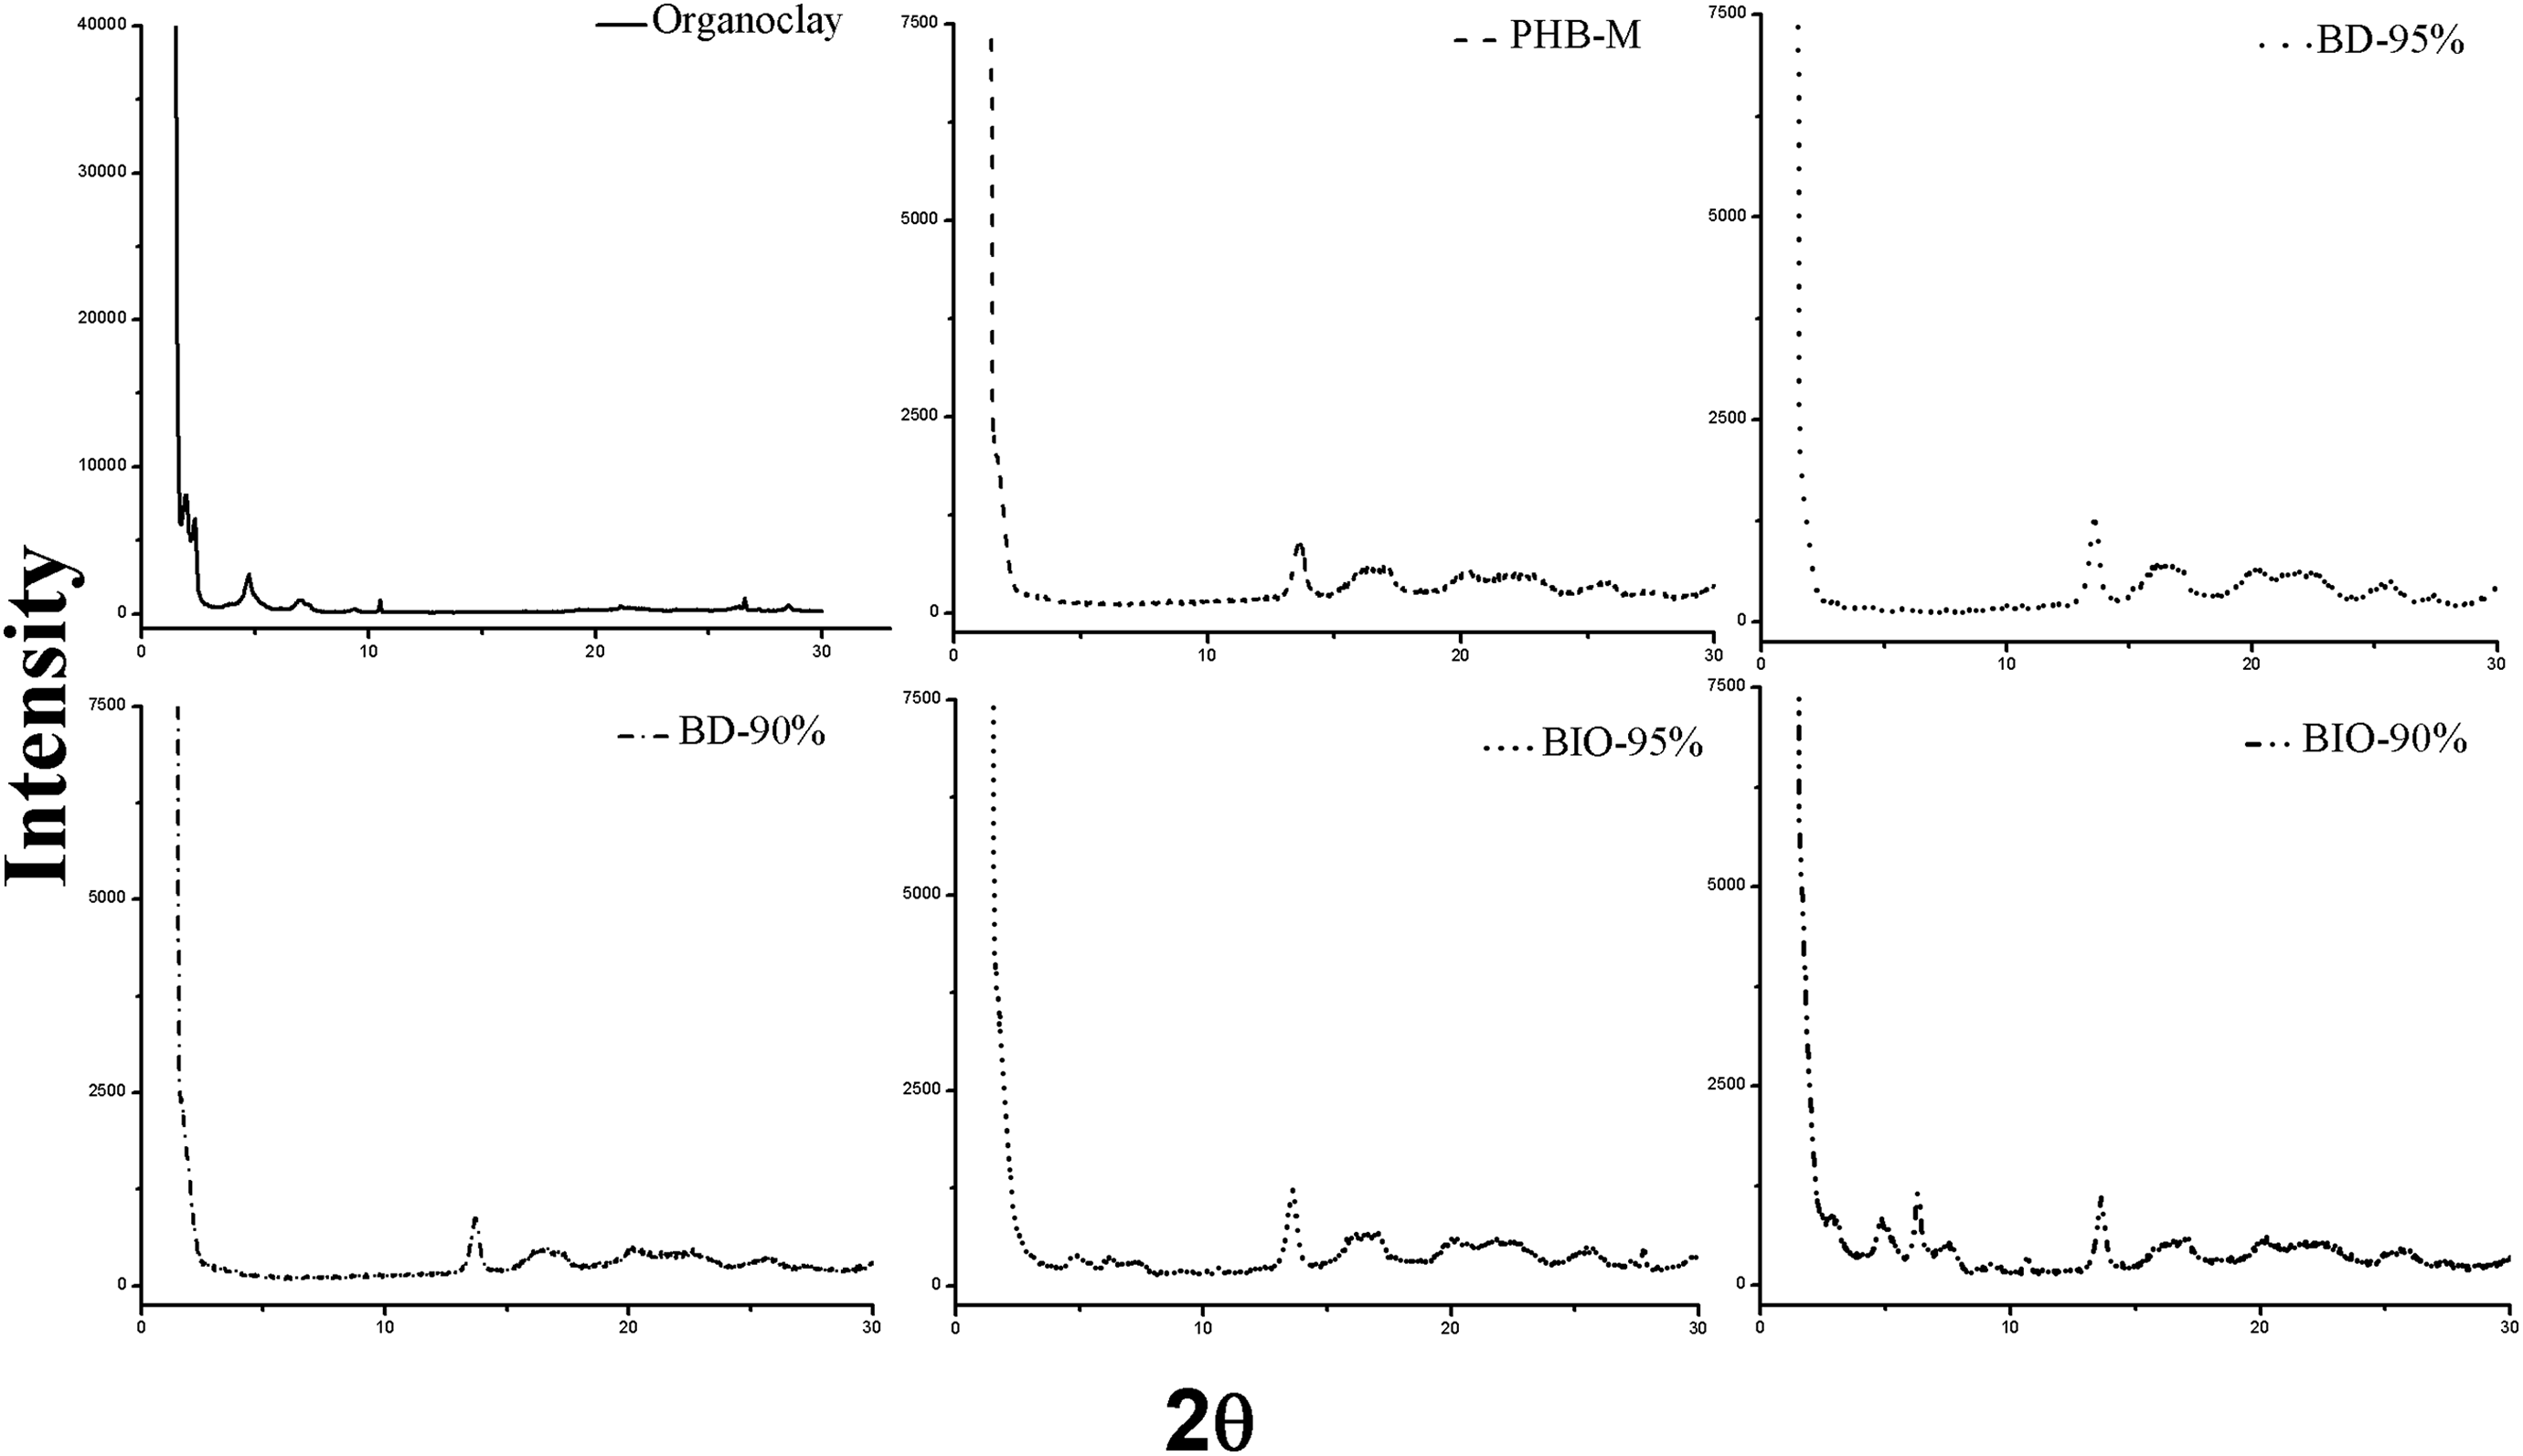
Diffractograms of the organoclay and the pure PHB film, bionanocomposites, and blends.
As it was expected, the diffractograms of the pure PHB showed the characteristic peaks. For the organoclay, there were perceived six peaks between 2θ angles of 2° and 10.55°, indicating the ammonium salt intercalation between the clay layers. In the diffractogram of the BIO-90%, there were noted five new peaks different to the displayed in the diffractogram of the pure PHB due to the organoclay presence. Those peaks were shifted to smaller 2θ angles in comparison with the organoclay peaks. Similarly, in the diffractogram of the bionanocomposite BIO 95%, there were noted four new peaks shifted to smaller 2θ angles with lower intensities than the organoclay peaks and the BIO 90% peaks. The decrease of the 2θ angles indicated an increase in the interlayer spaces of the clays because the polymer chains entered between the clay layers. Besides, the difference in peaks intensity revealed the destruction of the clays’ crystalline order because of the intercalation of polymer chains in the clay layers, and the disappearance of peaks revealed some degree of exfoliation. Finally, it was noted that high PEG content decreased the intercalation and exfoliation degree as the PHB chains were impeded to enter the organoclay layers. Crétois et al. 28 and Silva et al. 29 reported similar results.
Besides, the addition of PEG did not significantly affect the structure of the PHB as the diffractograms of the blends display similar peaks to the observed in the PHB diffractogram. Zhao et al. 20 when evaluating the diffractograms of PHB and PEG blends observed that the PHB peaks overlapped the characteristic peaks of the PEG between 19° and 23°. In the diffractograms of both blends (BD-95% and BD-90%), the peaks are slightly shifted to smaller angles, and Zhijiang et al. 17 reported a similar behavior for PHB and PEG films with PHB content of 85 and 80 wt%.
FTIR—Determining the carbonyl indices
PHB films
By means of the films spectra before and after the hydrolytic degradation test, the pure PHB carbonyl indices were calculated, as well as for bionanocomposites and blends, aiming to analyze the changes in the functional groups and in the molecular structure of the materials. Changes were observed such as an increase or a decrease in intensity of C=O bonds considering the samples before and in the removals referring to the second and sixth weeks of test.
Figure 4 shows the FTIR spectra after the mathematical treatment of pure PHB before and after the hydrolytic degradation test. By the end of the test (8th and 12th weeks), the samples were shown brittle due to the degradation process, preventing the mathematical treatment by the adjustment of the Lorentzian function and, consequently, interfering in the calculation of the carbonyl index for the pure PHB and also for the bionanocomposites, and blends. Faria and Franchetti 13 also described similar results of interference in the mathematical treatment by studying carbonyl indices of polypropylene/PHB blends.
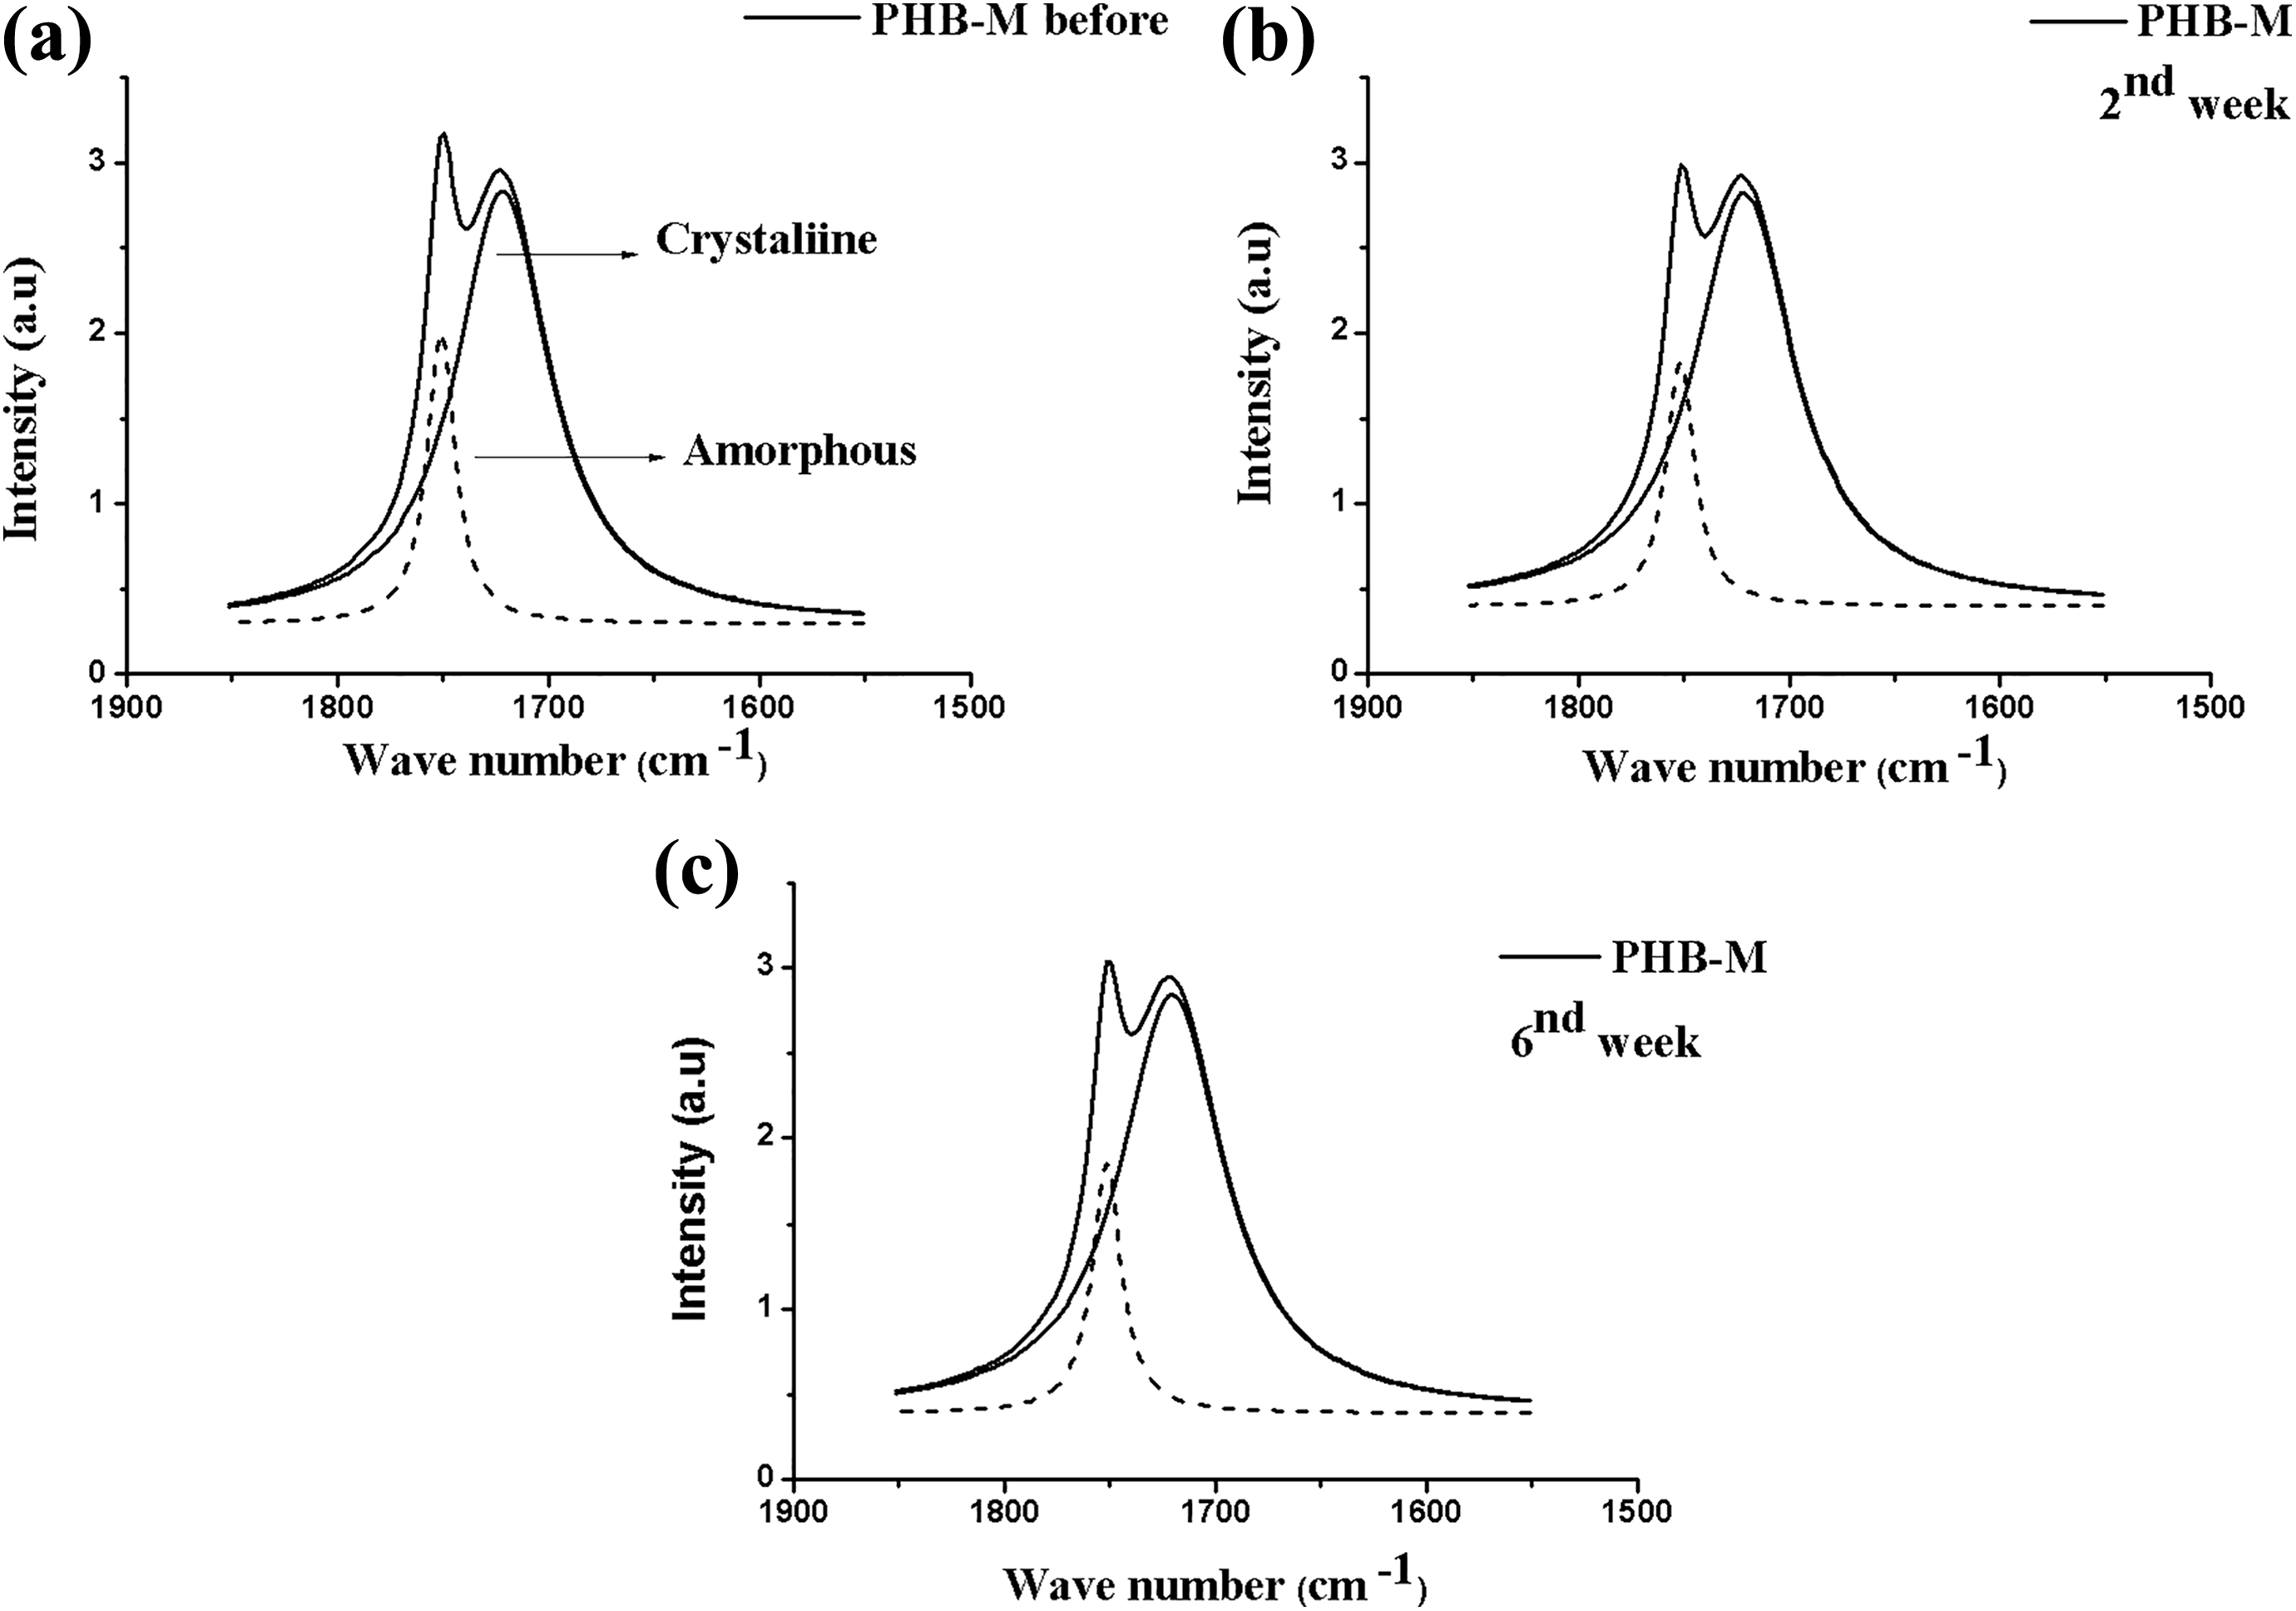
FTIR spectra after deconvolution for the PHB-M composite in the range of 1800–1650 cm−1 (carbonyl C=O band) before (a) and after the removal periods (b) second and (c) sixth weeks.
Table 2 presents the carbonyl indices for the PHB-M attained for the amorphous and crystalline regions before and after the hydrolytic degradation. Based upon these values, a significant increase of the crystalline phase carbonyl index was observed, and a discrete increase of the amorphous phase carbonyl index of the polymer was also observed after it was submitted to this test. Degradation for the pure polymer occurred preferably in the amorphous regions in consequence of the crystallinity increase, considering that there was a reduction in the intensity of the amorphous region peak at 1750 cm−1, which corroborates with the values of mass loss mentioned above.
PHB carbonyl indices of amorphous and crystalline phases, calculated before and after the removal periods, second and sixth weeks.
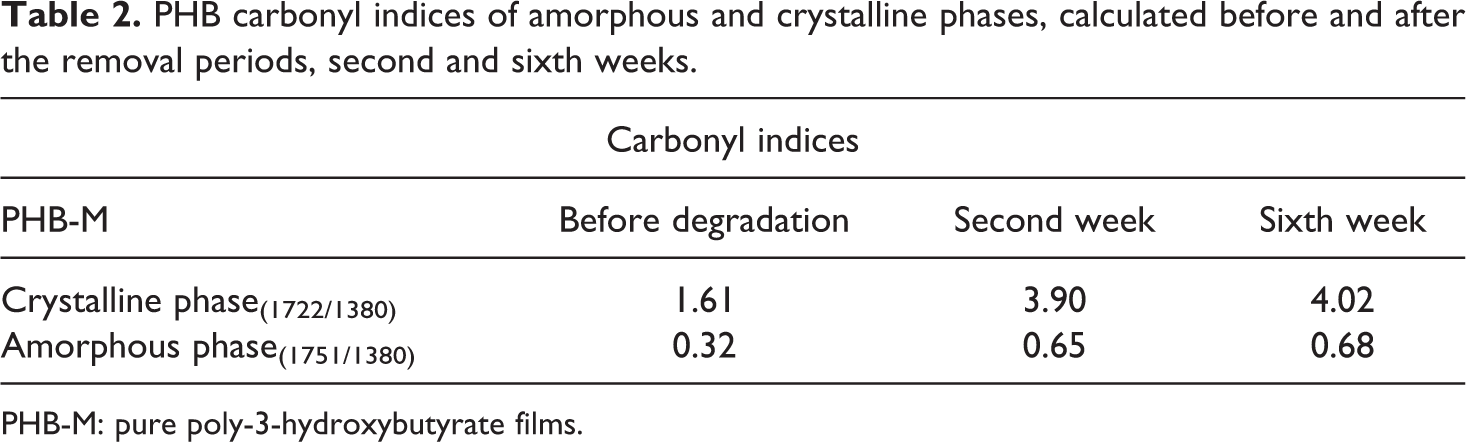
PHB-M: pure poly-3-hydroxybutyrate films.
According to Faria and Franchetti, 13 polymer degradation can occur because of the crystalline phase increase and consequent consumption of the chain in the amorphous phase. The consumption of the amorphous phase indicates a likely reorganization of the remainder chains and, therefore, increase of crystallinity (amorphous to crystalline). 20
PHB/PEG blends
Figure 5 exhibits the BD-95% blend spectra, and Table 3 shows the values of carbonyl indices for both phases. Initially, there was a change in the intensity of the C=O band of the crystalline and amorphous phases and, additionally, there was an intensity increase of the crystalline region peak of the blend in the second week of the test and as a consequence a carbonyl index increase. This behavior may evidence that, at first, degradation did not occur for that region, and it may be compared to the mass loss. Over 6 weeks of degradation, the carbonyl index showed reduction as compared to the second week of the test at approximately 20% and 23% for the crystalline and amorphous phases, respectively. Zhao et al. 20 , studying hydrolytic degradation of PHB/PEG and copolymers, observed that the PHB crystallinity apparently decreased after some weeks of degradation, once the introduction of PEG can increase water availability within the matrix, causing the materials’ degradation.
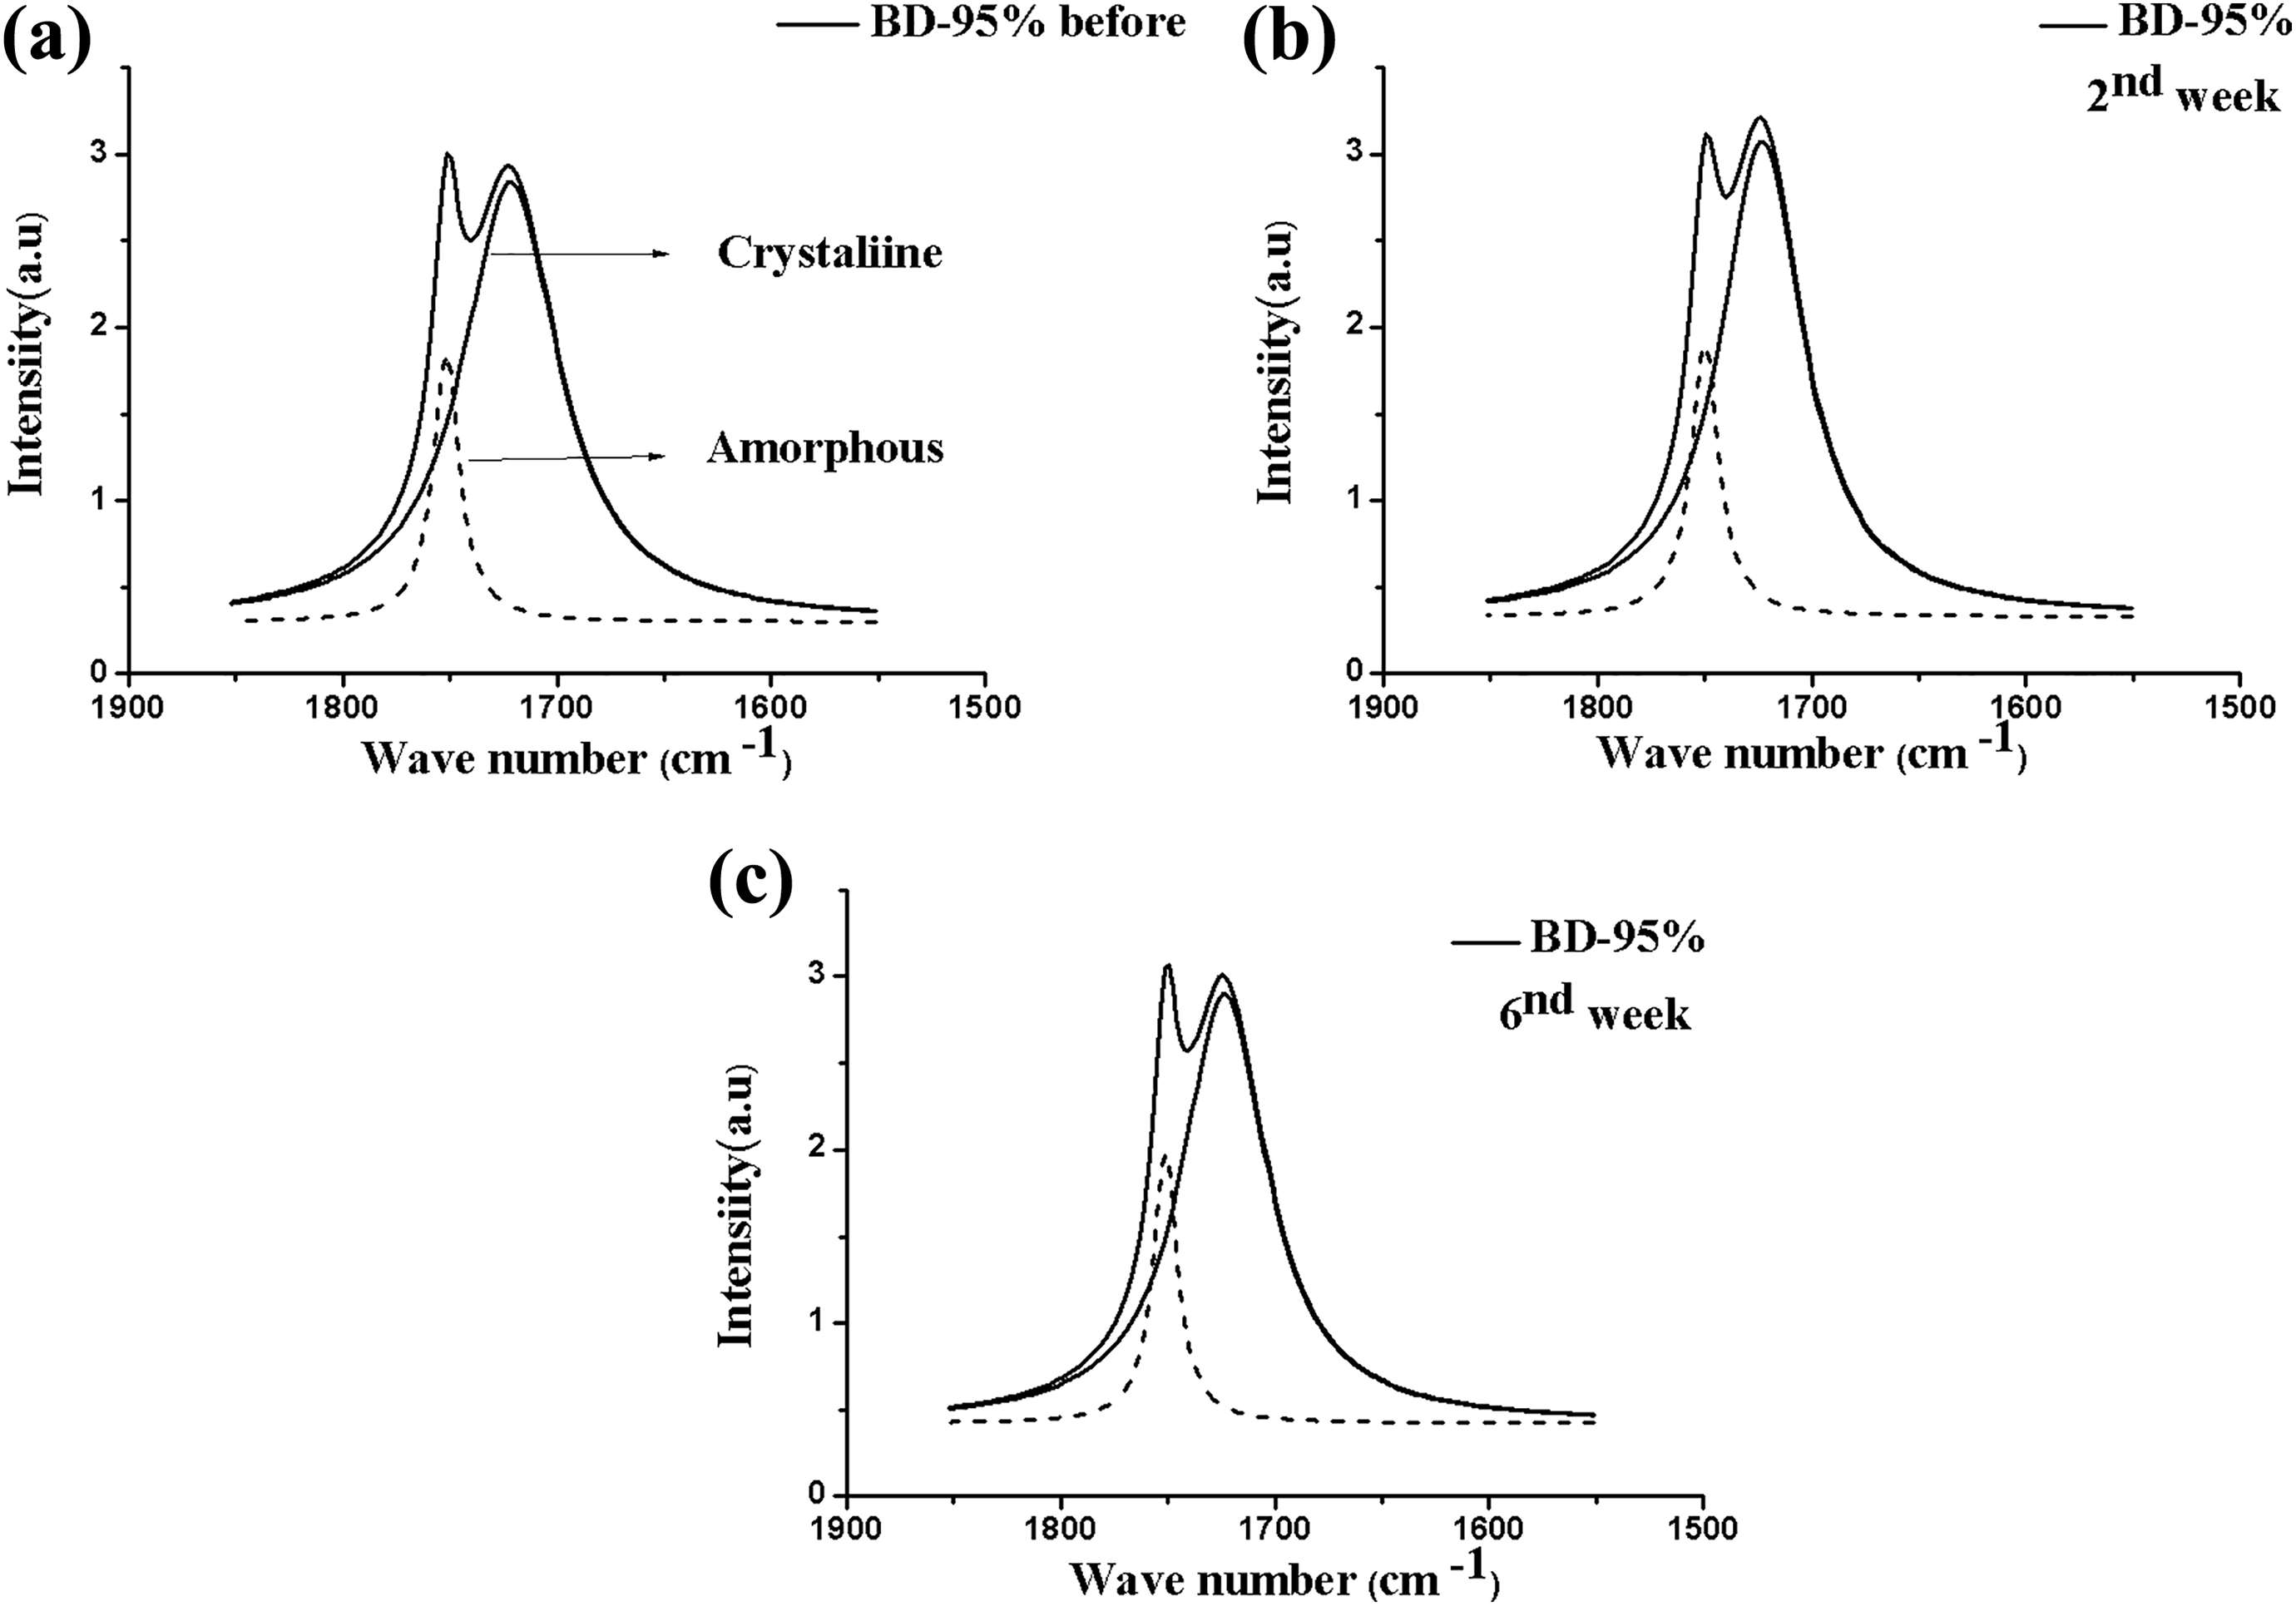
FTIR spectra after deconvolution for the BD-95% composite in the range 1800–1650 cm−1 (carbonyl C=O band), before (a) and after the removal periods (b) second and (c) sixth weeks.
Carbonyl indices of the BD-95% composite of amorphous and crystalline phases, calculated before and after the removal periods, second and sixth weeks.
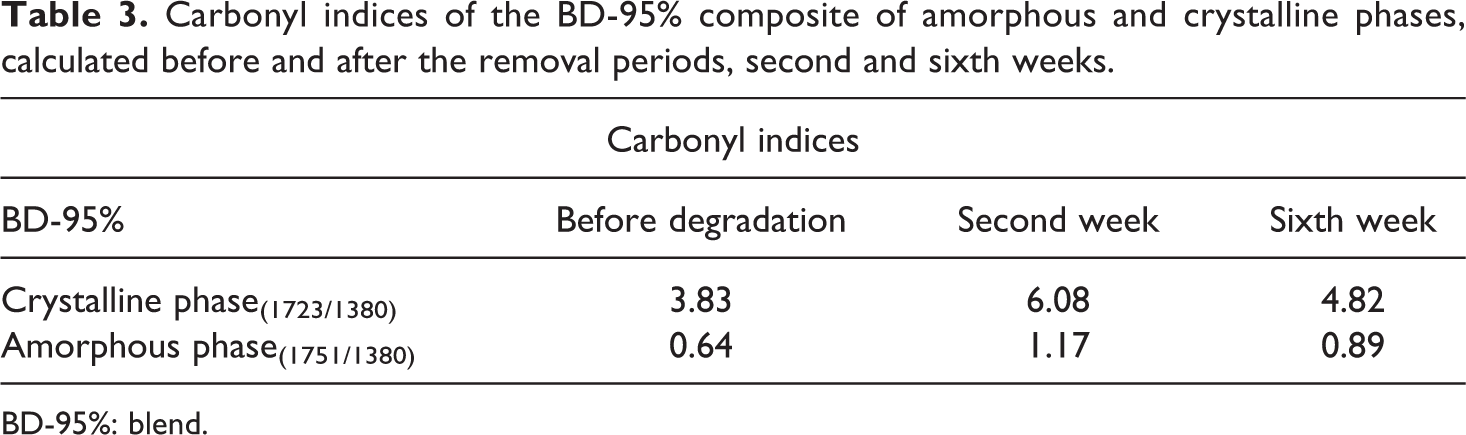
BD-95%: blend.
Figure 6 exhibits the FTIR spectra of the BD-90% blend before and after degradation. The increase of PEG in the BD-90% system is observed to have affected the polymers’ crystalline region and the peak intensity of this region. Zhijiang et al. 17 studying the behavior and the properties of PHB and PEG observed that the polymers’ crystallinity is affected by incorporating PEG in the polymeric matrix. The carbonyl indices shown in Table 4 demonstrated that there was degradation in both phases until the sixth week of test, indicating that degradation occurred in the polymers’ amorphous and crystalline regions. Based upon the previously shown mass loss values, the BD-90% composite exhibited larger degradation than the BD-95%, evidencing that the incorporation of the plasticizer increased the polymers degradability rate and, with that, accelerated the hydrolysis process. 20 Parra et al. 30 in studies of PHB/PEG blends observed that the addition of larger amounts of PEG increases the number of polar groups promoting interaction of these with water molecules, easing thus hydrolysis that precedes biodegradation.
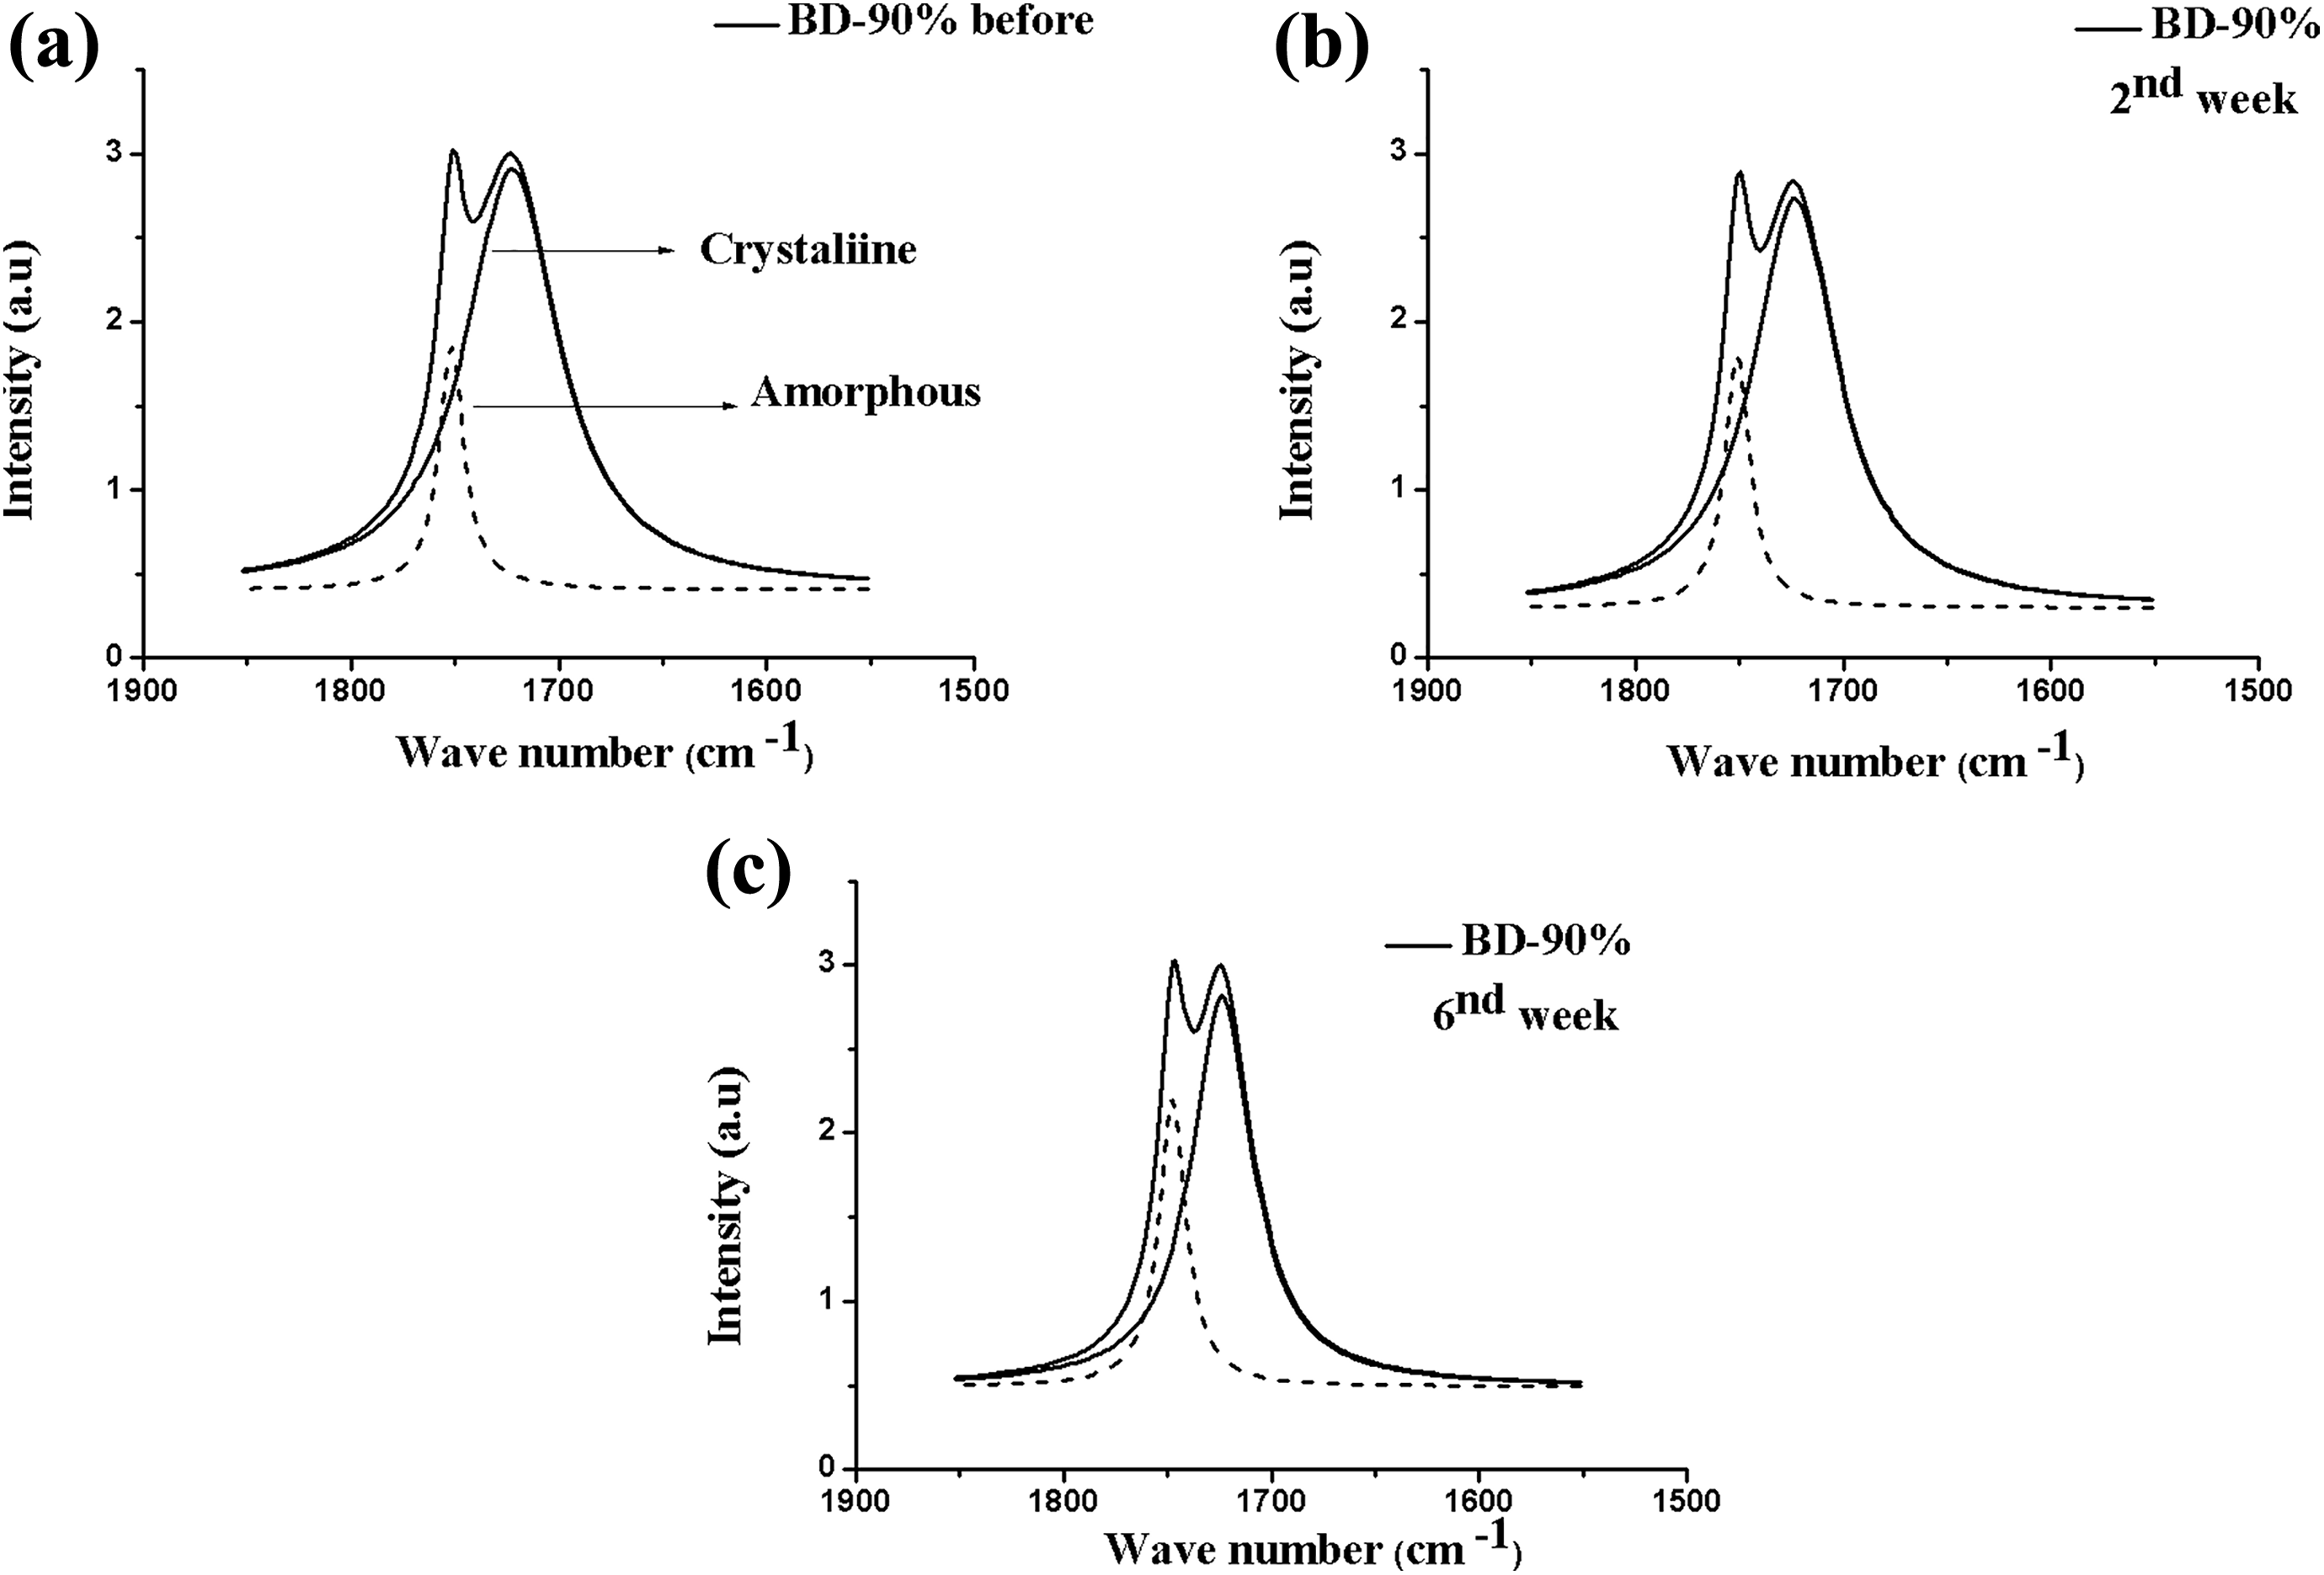
FTIR spectra after deconvolution for the BD-90% composite in the range of 1800–1650 cm−1 (carbonyl C=O band), before (a) and after the removal periods (b) second and (c) sixth weeks.
Carbonyl indices of the BD-90% composite of crystalline and amorphous phases, calculated before and after the removal periods, second and sixth weeks.
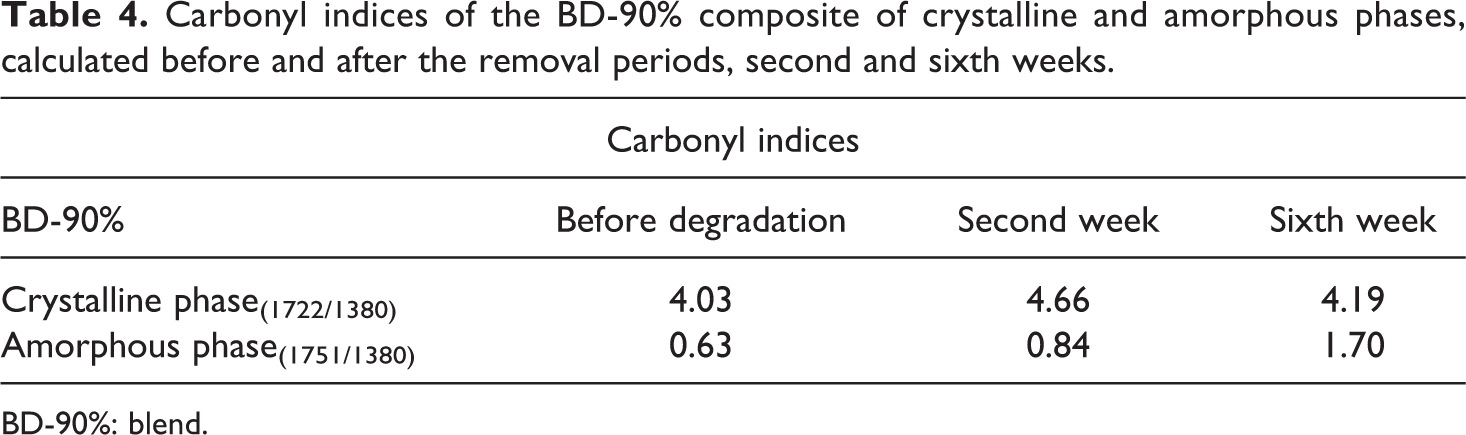
BD-90%: blend.
After the hydrolysis time, there were evidences that the addition of the plasticizer caused variation in crystallinity of the blends, when compared to the pure PHB, supposing that there was a greater mobility of polymeric chains and as a result the decrease of crystallinity. For the BD-90%, degradation occurred more proportionally between both phases; such behavior evidences that hydrophilia was increased with the addition of PEG, also affecting crystallinity and likely enabling hydrolysis of ester bonds. Spyros et al. 31 explained that crystallinity might affect the total degradation rate due to changes of characteristics of the amorphous/crystalline interface, as well as the characteristics of the film surface, such as its hydrophobicity. Faria and Franchetti 13 also attained similar results studying carbonyl indices of blends with PHB, where they verified that degradation is proportional in both phases, although it would result from microbial attacks that reduced that index.
PHB/PEG/VMT bionanocomposites
Figure 7 shows the FTIR spectra for the BIO-95% composite before and after the hydrolytic degradation test. The band referring to the carbonyl in the crystalline region was shown widened and less intense. The carbonyl indices presented in Table 5 showed that inserting the clay together with PEG into the polymeric matrix altered the materials’ crystallinity, resulting in a reduction of the polymers’ amorphous and crystalline phase indices, over the degradation time. Kmita et al. 23 studying hydrolytic degradation in PLA nanocomposites and natural clay proved that the addition of charge enabled an increase in water penetration into the polymeric structure; therefore, degradation occurred not only on the surface, but also within the polymers matrix, causing a greater degradation of the materials.
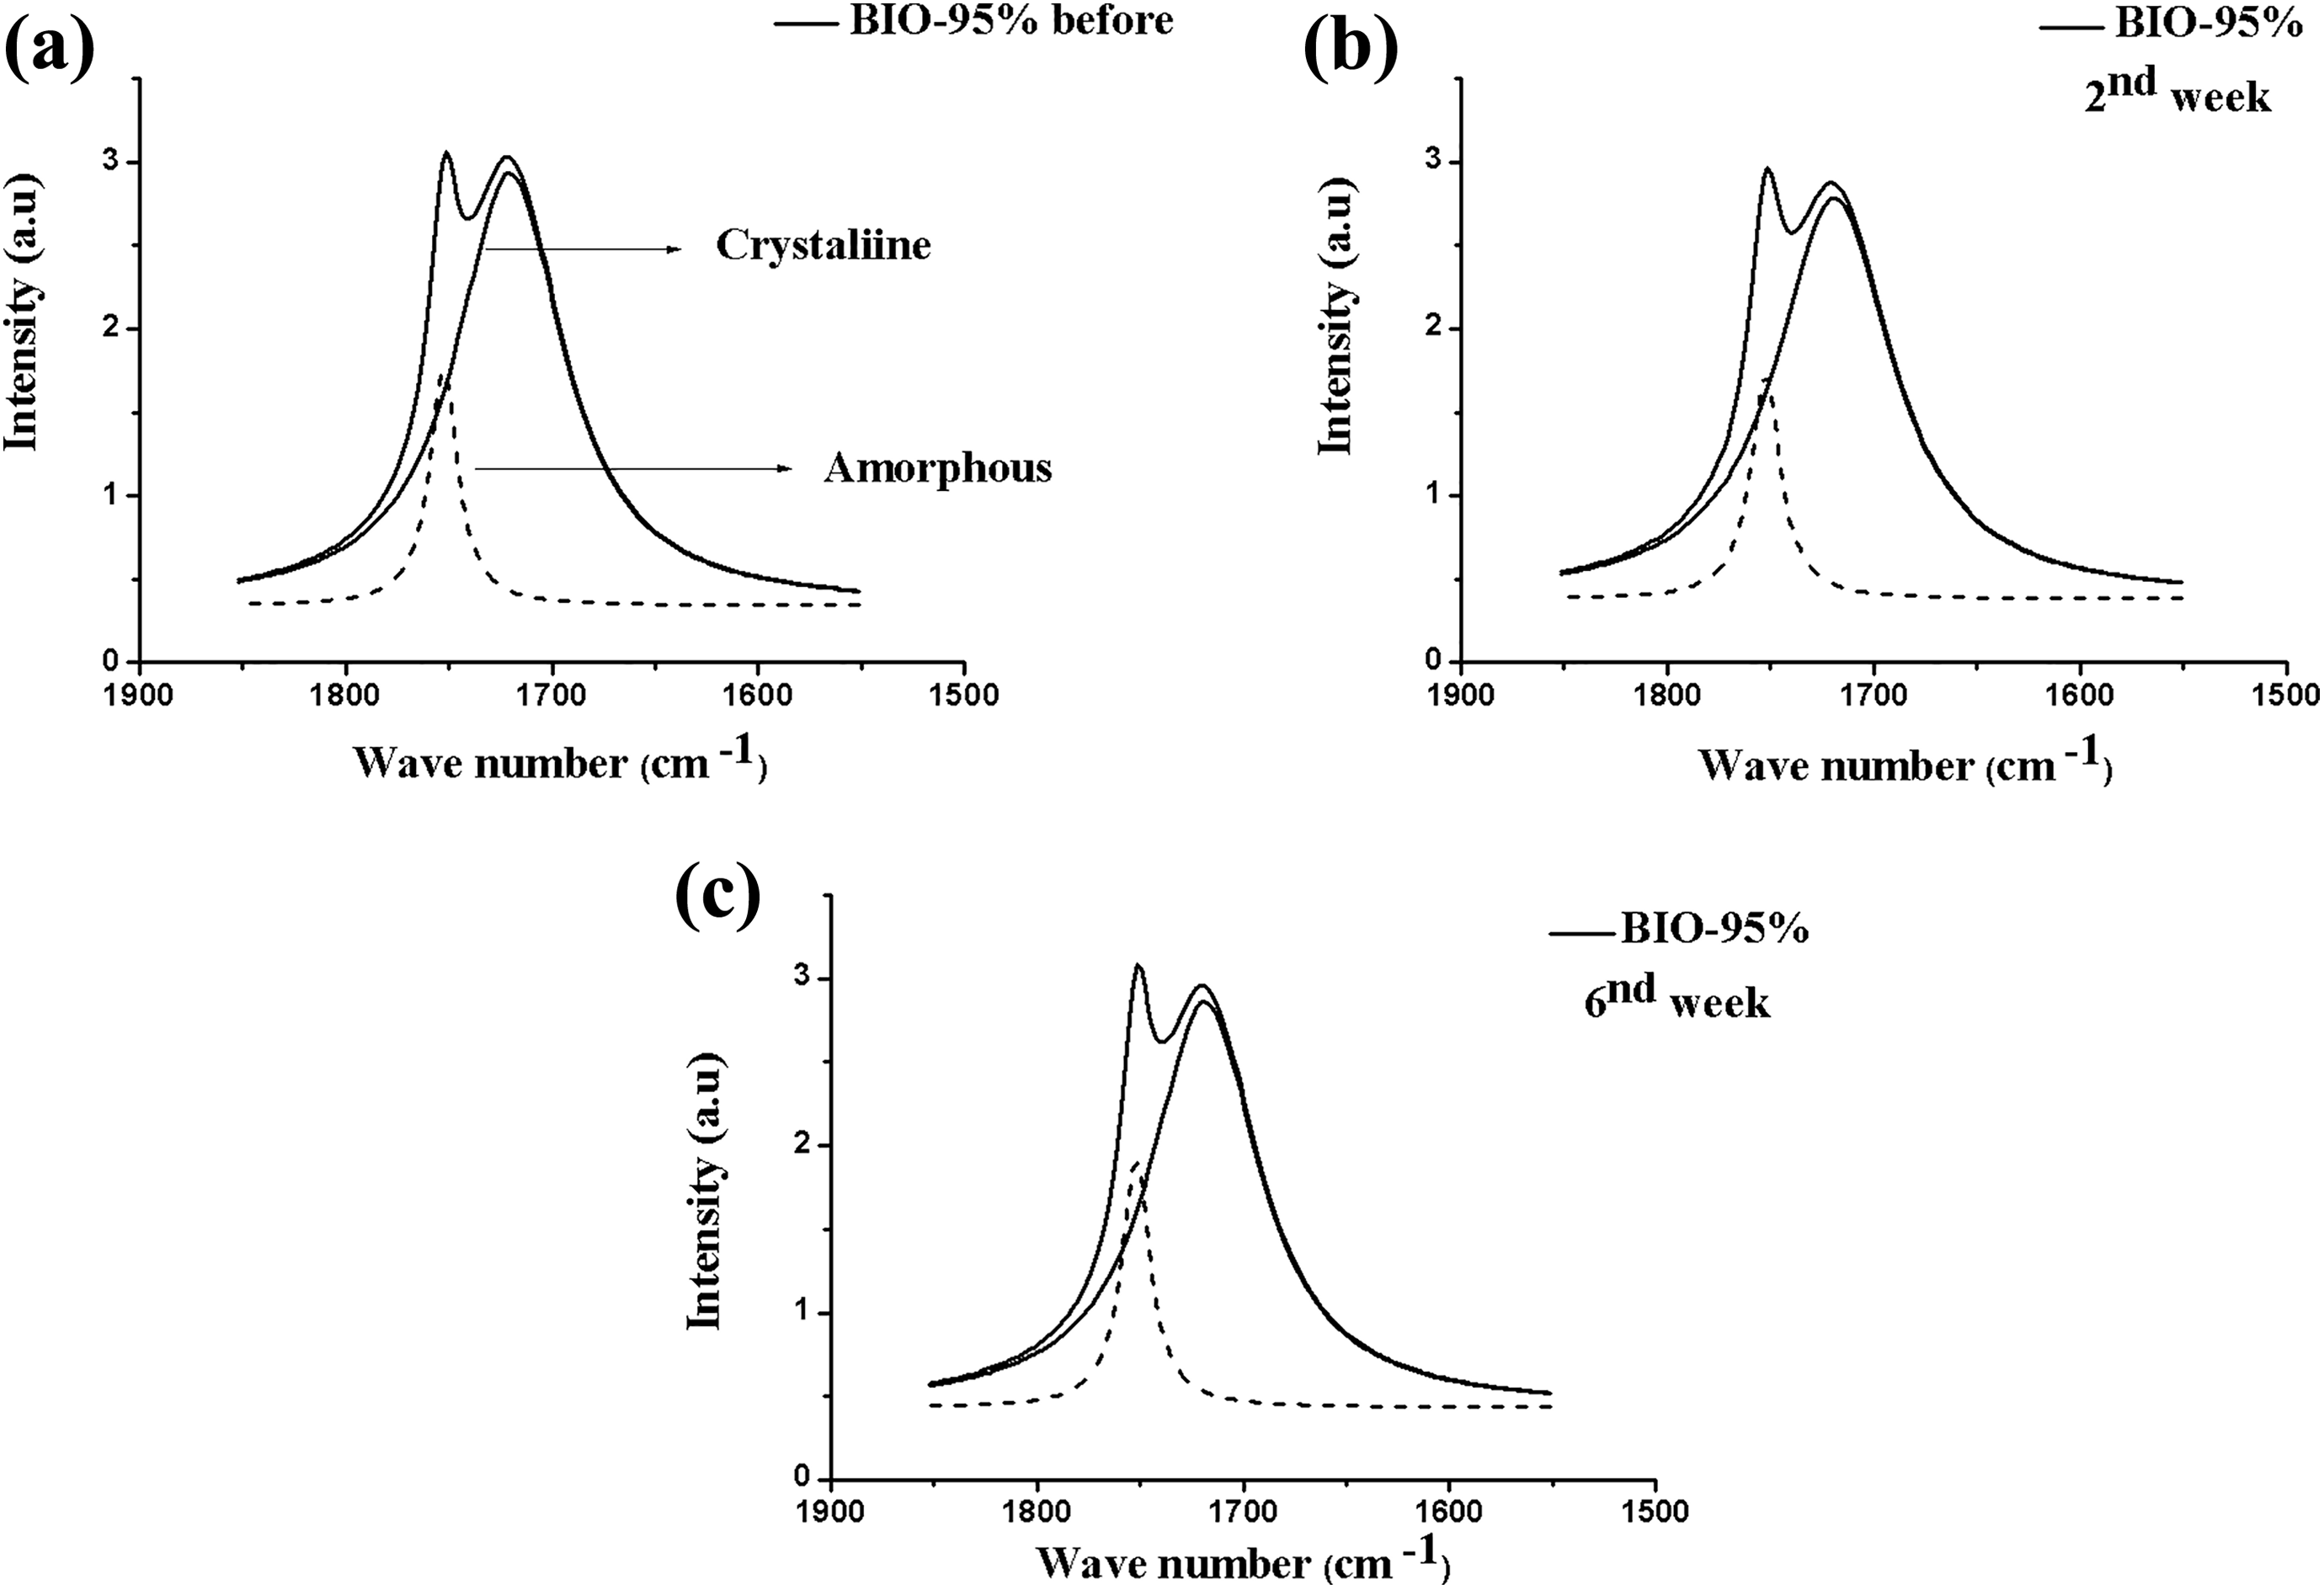
FTIR spectra after deconvolution for the BIO-95% composite in the range 1800–1650 cm−1 (carbonyl C=O band), before (a) and after the removal periods (b) second and (c) sixth weeks.
Carbonyl indices of the BIO-95% composite of amorphous and crystalline phases, calculated before and after the removal periods, second and sixth weeks.
BIO-95%: bionanocomposite.
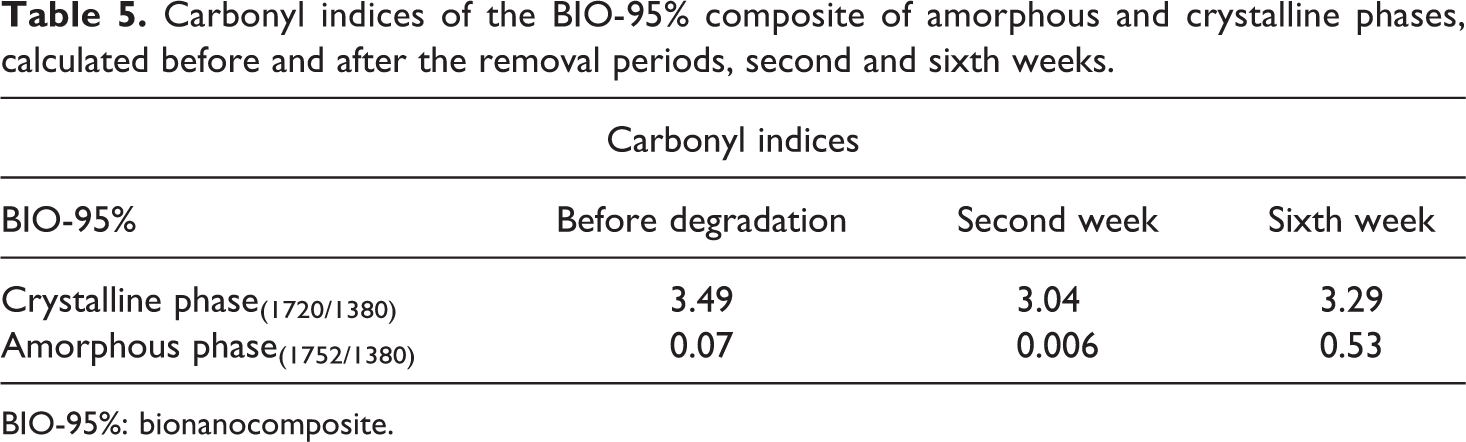
Figure 8 exhibits the FTIR spectra of the BIO-90% composite before and after the removal periods, and Table 6 shows the respective carbonyl indices. With 10% of PEG and the insertion of the organophilic clay, one could observe a proportional change for the indices of PHB amorphous and crystalline phases. Determining the carbonyl index evidenced a decrease of more than 55% of the amorphous phase as regards the beginning of the test and a proportional reduction of the crystalline phase. The inclusion of PEG and clay caused an increase of hydrolysis, easing thus water penetration and cleavage of the ester bond. 25
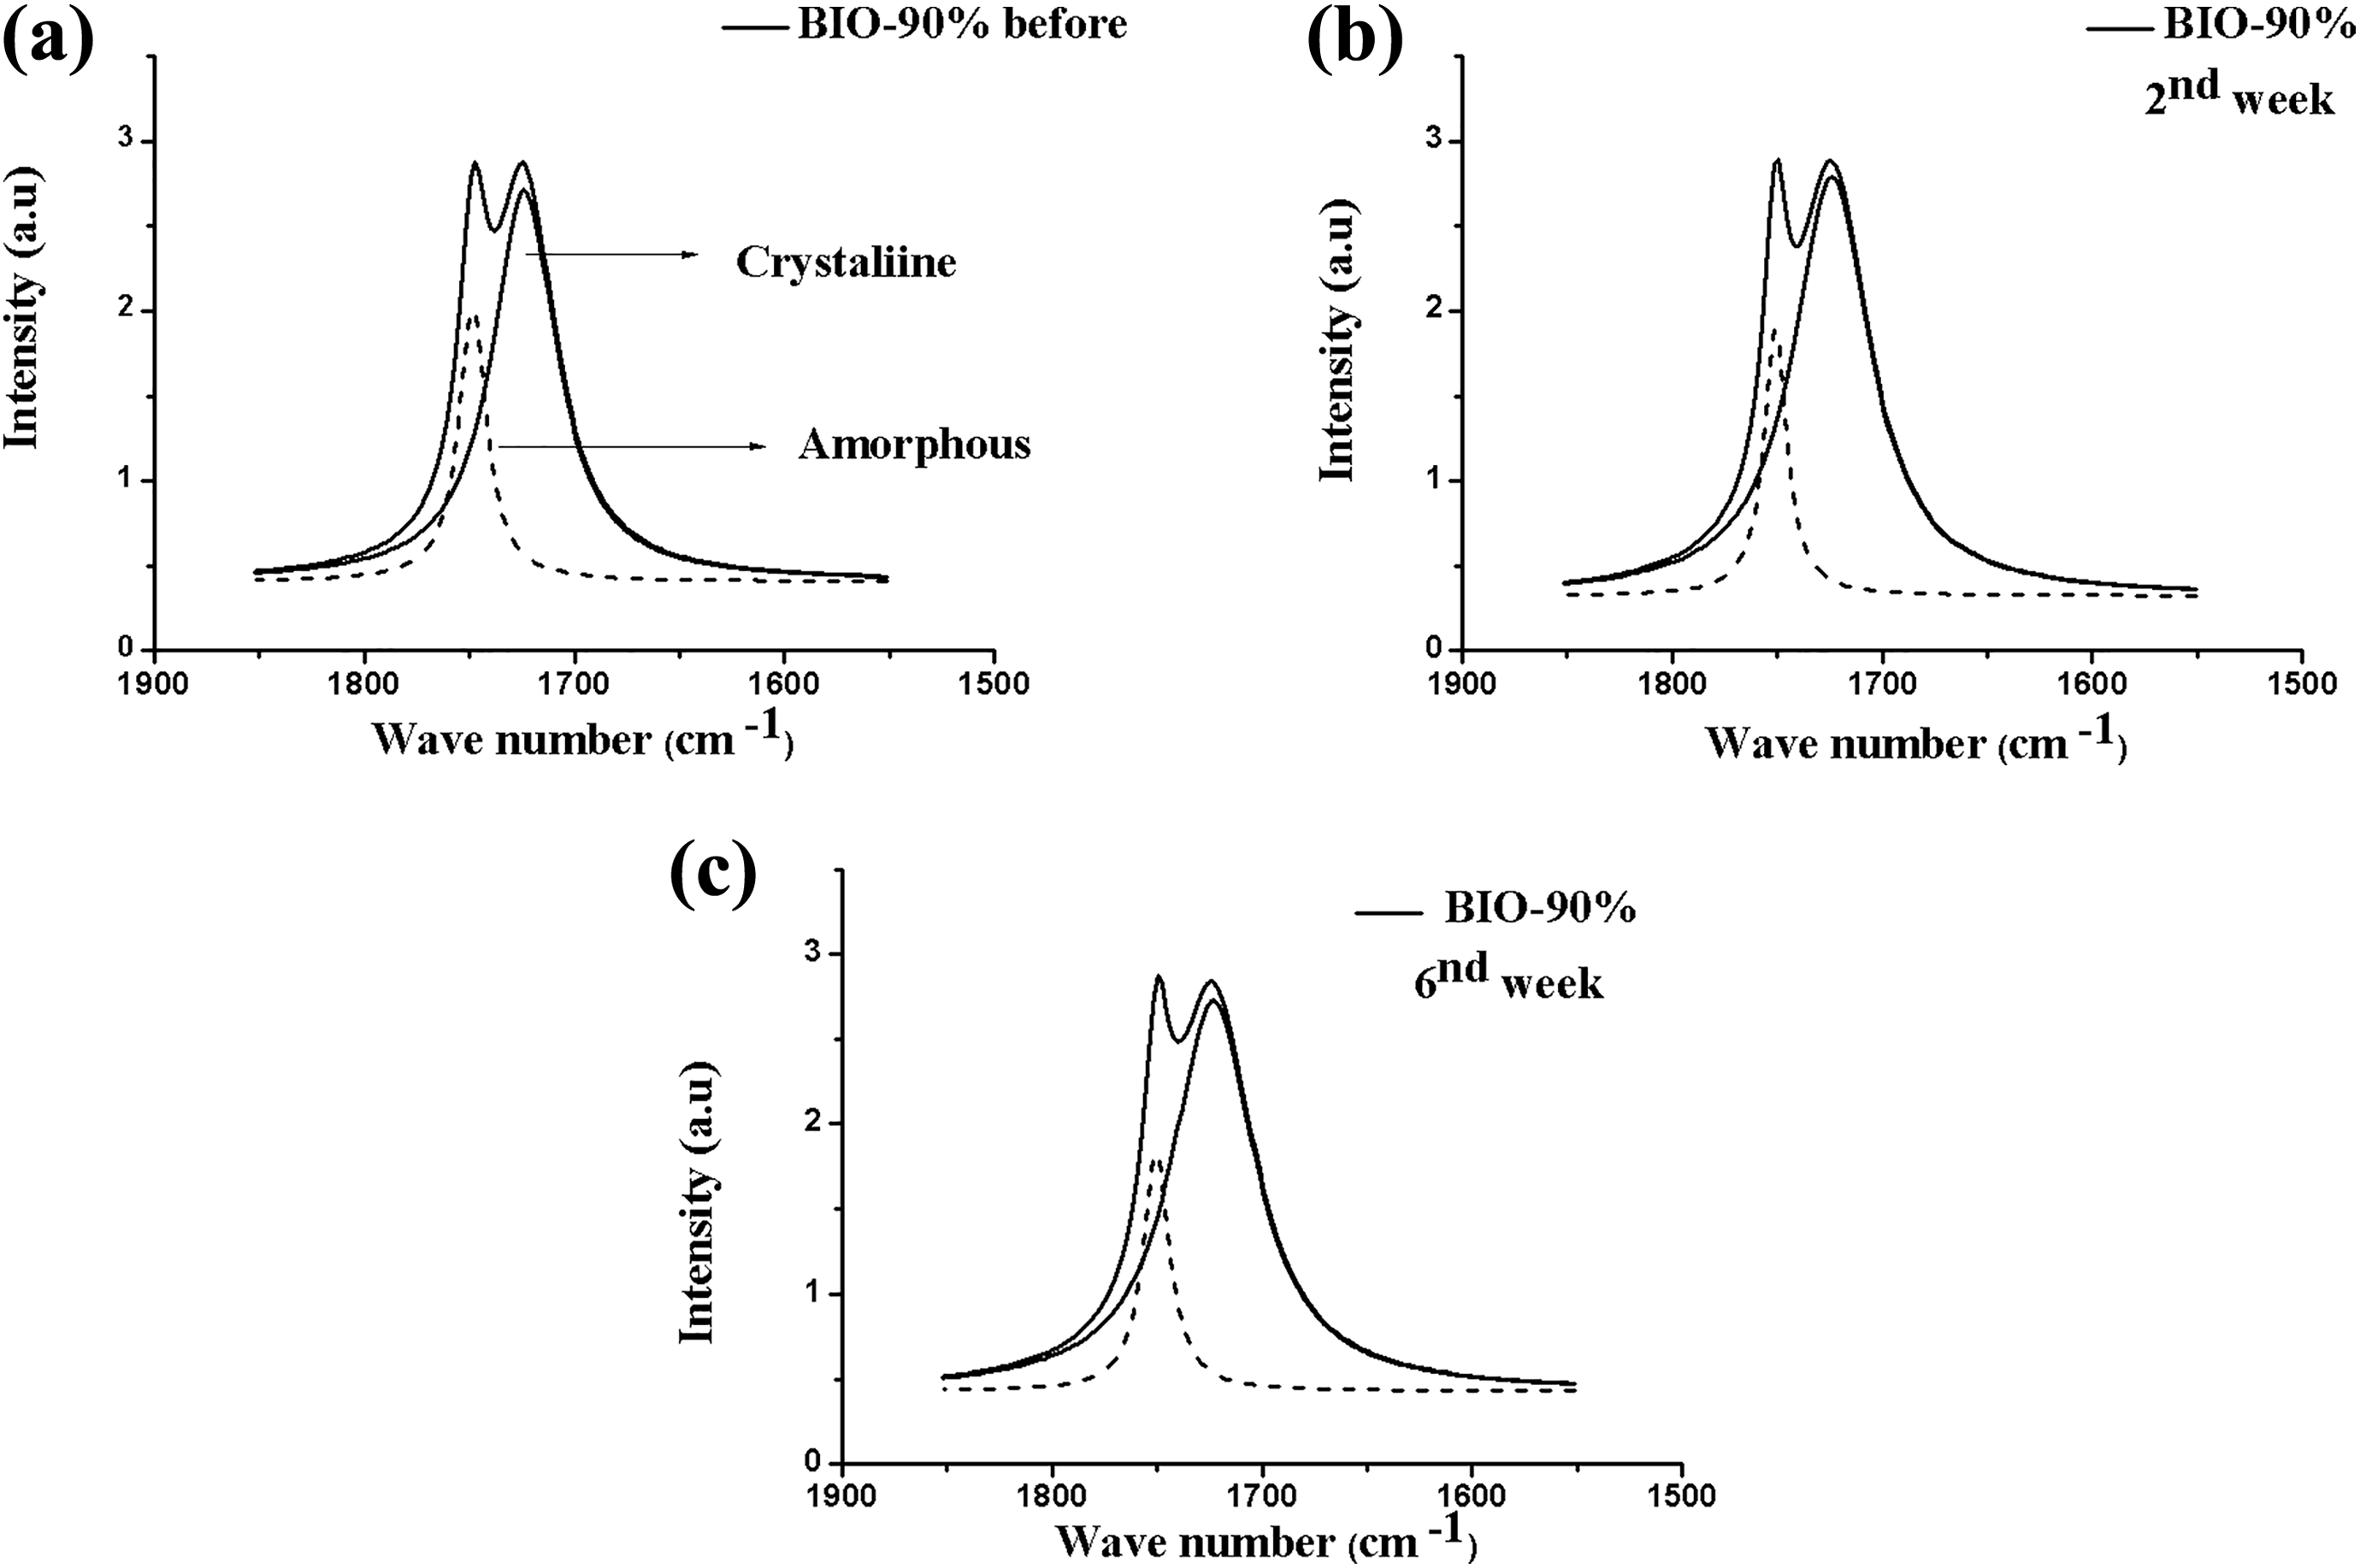
FTIR spectra after deconvolution for the BIO-90% composite in the range 1800–1650 cm−1 (carbonyl C=O band), before (a) and after the removal periods (b) sixth and (c) sixth weeks.
Carbonyl indices of the BIO-90% composite of amorphous and crystalline phases, calculated before and after the removal periods, second and sixth weeks.

BIO-90%: bionanocomposite.
Hydrolytic degradation occurred through the reduction of the carbonyl of the polymers’ ester group in the amorphous or crystalline region. With the results attained, one could observe that for the pure PHB the degradation process occurred preferably in the amorphous regions, due to its greater disorganization, also evidenced by the increase of the crystalline phase index. For the BD-90% blend, the inclusion of PEG improved the polymers’ degradability in both phases, amorphous and crystalline, whereas for the bionanocomposites, the inclusion of PEG and organophilic VMT clay during degradation caused a reduction in the polymers’ amorphous and crystalline phases, and BIO-90% exhibited a proportional reduction of the carbonyl index over the degradation weeks, suggesting that the composite reduced crystallinity and increased the polymers’ hydrophilicity, contributing to hydrolysis of ester bonds.
Several studies of PHB biodegradation have found that their degradation rate is inversely related to their degree of crystallinity, as microbial enzymes further degrade the amorphous phase of the polymer. However, there are studies with enzymes of Pseudomonas lemoignei that show the indiscriminate degradation of both phases, amorphous and crystalline; in this case, the enzymatic attack would occur both in the amorphous interlamellar material and in the crystalline lamellae of PHB. 31
In the literature, works relating the evaluation of biodegradation behavior of the carbonyl index values have not yet been reported; therefore, this study is of most importance and will be able to help in future research regarding the theme.
Conclusions
PHB and PEG blends and PHB, PEG, and organoclay bionanocomposites were developed by the solution intercalation method. In the bionanocomposites, it was observed by XRD analysis that the polymer chains were intercalated into the organoclay layers, and some degree of exfoliation was also observed. Additionally, the PEG addition did not significantly affect the structure of the PHB. In the visual inspection, the BD-90% and BIO-90% systems were shown more brittle over the test, suggesting that this behavior is a consequence of the hydrolysis mechanism and that the inclusion of 10% PEG caused a weak interaction of the components. The addition of the organophilic VMT clay also influenced the results of degradation, and the BIO-90% bionanocomposite exhibited the largest mass loss over the weeks of tests and values higher than those of the PHB-M and BIO-95% composites. The result of the carbonyl index showed that the BIO-90% composite had a proportional reduction for the polymers amorphous and crystalline phases, showing that the introduction of PEG and the organophilic VMT clay favored the degradation process. In a general way, the addition of PEG and the organophilic VMT clay affected the regularity of the chain and increased the PHB polymers’ hydrolytic degradation, acquiring desired degradation characteristics for a possible application in biomaterials. Other assays on in vitro biodegradation, cytotoxicity, and mechanical properties are required, in view of the possible applications of these materials in biomedical areas, for example, in dressings.
Footnotes
Funding
The author(s) disclosed receipt of the following financial support for the research, authorship, and/or publication of this article: The authors acknowledge the financial support from CNPq (Processes: 422023/2018-3; 309708/2018-4 and 308446/2018-6) and FAPEPI and are grateful to CNPq for the fellowships on behalf of Alves and Barbosa.