
Abstract
Thickness swelling (TS) is a vital hydration property to test the suitableness of a material to be used in the built environment. These materials are made of randomly oriented natural or mineral fibers mixed with cementitious binders, such as magnesium oxide (MgO), gypsum, and Portland cement. Since they have high moisture absorption property due to the random orientation of fibers and are manufactured with different process parameters, it is essential to develop a prediction model to reduce the development cost and time. In this article, TS of rice straw-based MgO slabs was measured and predicted for three different fiber lengths, density, the thickness of the tiles, and the ratio of the mixture. Fully connected cascade (FCC) architecture of artificial neural network (ANN) and reduced error pruning tree (REPTree) algorithm of decision tree methods were used as expert systems for prediction. The best architectures were identified from the 109 experimental datasets of in-house developed slabs of commercial sizes. The proposed board absorbed more water than the commercial boards. However, the FCC and REPTree predicted the TS with an accuracy of 95% and 89%, respectively. The prediction model with FCC may be utilized as a reference for developing new building materials based on natural fibers with cementitious binders.
Keywords
Introduction
The usage of natural fibers in developing green building materials is increasing due to their availability, biodegradability, and recyclability. 1 It is anticipated that the materials used in the built environment provide good acoustical and lighting characteristics. Hence, they are made of mineral binders, such as MgO, cement, and gypsum by reinforcing of fibrous and porous materials to provide lightweight, excellent fire resistance while offering good mechanical stability. 2 Although most natural fibers are cement inhibitors, researchers are continuously experimenting with using natural fiber to develop green building materials. 3 The high moisture absorption properties of lignocellulose fibers are challenging in the development of natural fiber-based slabs. 4 The continuous exposure of natural fiber slabs to moisture will make them deteriorate faster, resulting in reduced mechanical strength with discoloration. 5
Moreover, the mechanical and other thermophysical properties are dependent on manufacturing variables, such as mixing ratio of the binder with fiber, the percentage of water absorption (WA), the thickness of the slab, the density of the tile, the porosity of the slab, and fiber’s length, width, and thickness. 6,7 Since the process variables control the quality of the product, to reduce time and cost, various modeling techniques are used. A plethora of mathematical models is available to predict the mechanical properties of conventional building materials. 8 –10 However, for the natural fiber products, expert systems predict better than the mathematical models due to the assumptions made in developing mathematical models. 9,11,12
For instance, the compressive strength of various recycled aggregate concrete was predicted using artificial neural network (ANN). 13 They identified that the 6-input, 18-node hidden layer and 1-output architecture yielded the best result based on high regression values and minimum mean square error. Similarly, the compressive strength of high-performance concrete blended with nano silica and copper slag was predicted using ANN and regression analysis and concluded that the ANN has superior accuracy. 10 Moreover, the mechanical strengths of various cementitious materials were predicted using ANN, multilinear regression, and adaptive neuro-fuzzy systems. 14,15
To our knowledge, the natural fiber-reinforced mineral slabs were not predicted for mechanical properties. Hence, the polymer-based fiber-reinforced materials were predicted using various expert systems. 11,12,15 –17 For instance, the efficient manufacturing process based on the modulus of elasticity and the ultimate strain was predicted using ANN. 16
Apart from these techniques, decision tree (DT) technique was used by many researchers due to the simple architecture it offers over other expert systems. 18 –22 Although the WA property has a significant impact on compressive strength of the material, 13 very few literature are available to predict the WA and TS prediction. 11 –13,17,22,23 Since the thermoplastic materials do not have an open molecular structure, they tend to absorb less moisture. 12 However, to the best of our knowledge, WA properties of thermoplastic composite materials were only predicted using various expert systems. 10,16 The WA of the thermoplastic matrix is mainly dependent on the percentage of fiber-reinforced with a polymer. 11 Since the mineral-based slabs are generally porous which tend to absorb more moisture and primarily used in building applications over thermoplastics, it is necessary to predict the WA and thickness swelling (TS) of mineral-based slabs.
In this work, slabs made with rice straw-reinforced with MgO were manufactured, and they were experimentally tested for WA and TS and created 109 datasets. Two expert systems: (1) fully connected cascade (FCC) architecture of ANN and (2) REPTree architecture of DT were developed using Waikato Environment for Knowledge Analysis (WEKA) software to predict the TS, as it is the indicator of WA in the field. A suitable FCC architecture and REPTree were identified using correlation coefficient (R) value and root mean square error (RMSE). The results of a chosen architecture were compared for their accuracy. Further, the discrepancy ratio (DR) was used to measure the quality of prediction.
Materials and methods
Materials
The materials used for this investigation were manually cut fresh rice straw of IR20 breed, MgO, and water. The rice straw was collected from the farmlands located on the banks of Cauvery river at Bhavani, Tamil Nadu, India. As this variety of rice is widely cultivated in the state of Tamil Nadu, it is available throughout the year. Since MgO is a natural inhibitor of fungal growth and offers good fire-retardant properties, MgO was chosen as a binder. The properties of rice straw and MgO are given in Tables 1 and 2.
Properties of rice straw. 24
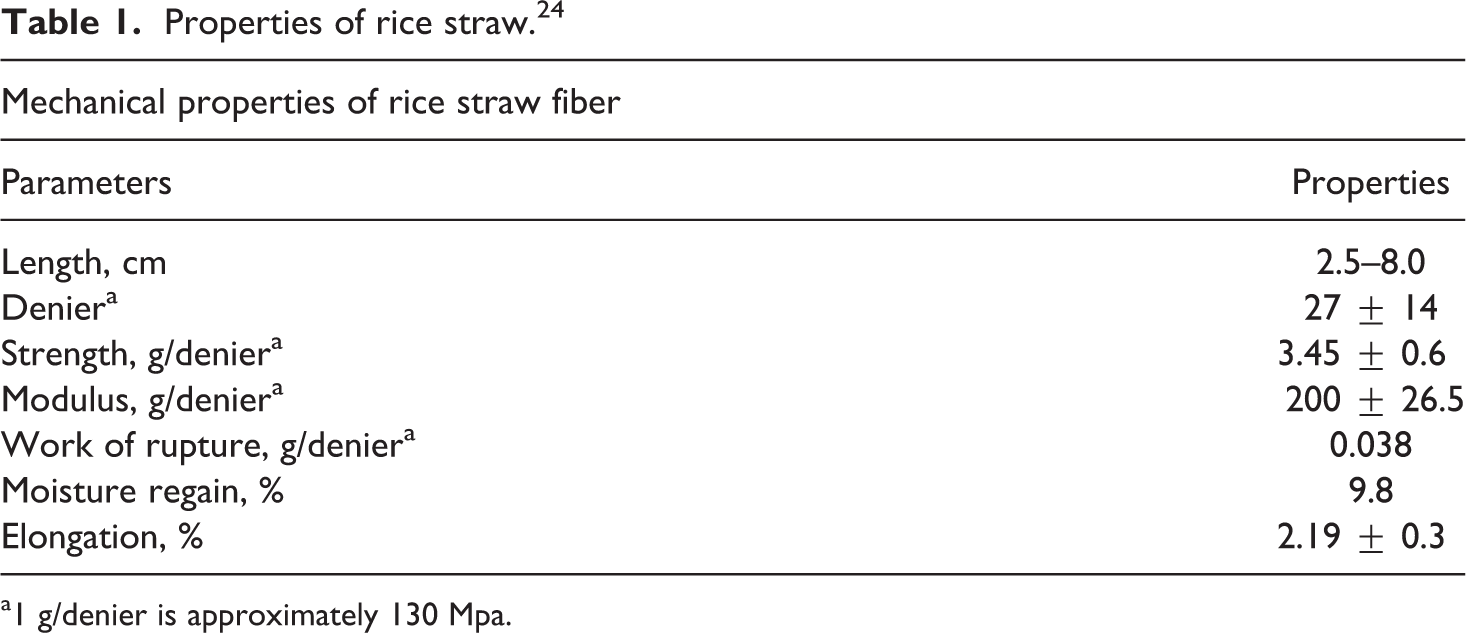
a1 g/denier is approximately 130 Mpa.
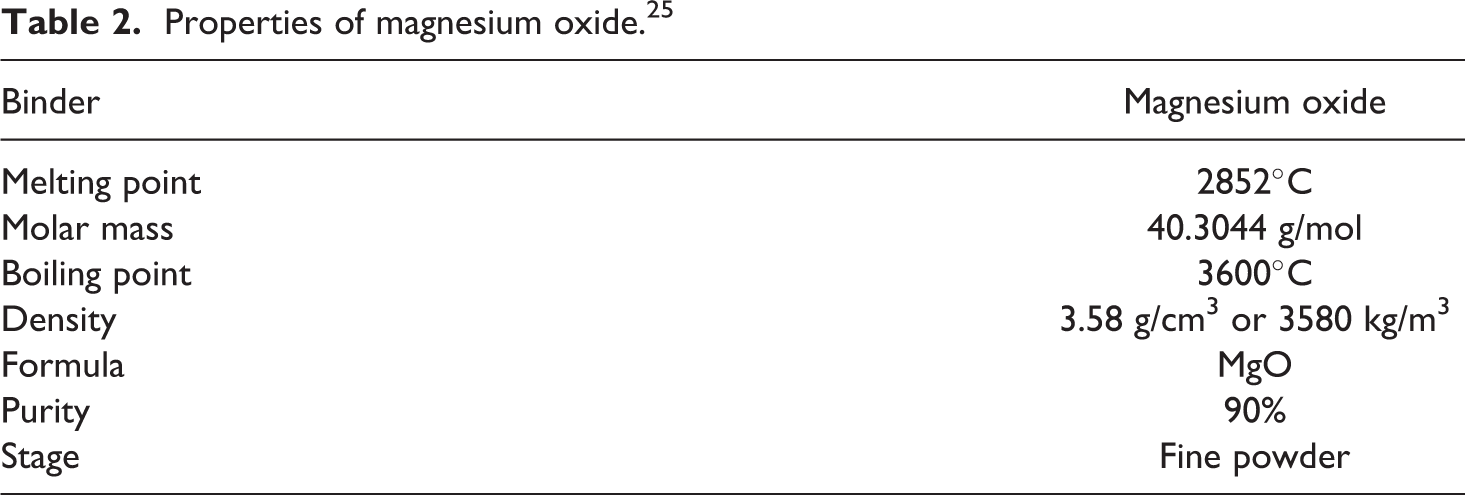
Properties of magnesium oxide. 25
Slab preparation
The rice straw was sun-dried for 5 days and was cut into three lengths in the range of 10–20 mm, 20–40 mm, and 40–60 mm. Since it is believed that the cellulose content in the straw is affecting the bonding, it is essential to remove from the straw to have better bonding between binder material and straw. 26 Therefore, the cut straw was subjected to hydrolysis process by immersing it in hot water at 70°C for 5 h to remove the excess cellulose and dust particles from the straw. The fibers were taken out of the water bath and left it for 1 h in the sun to remove the excess water absorbed by the straw. The pulverized MgO was mixed with the wet straw. Although the dampness of wet straw was enough to prepare the sample, a known quantity of additional water was sprinkled when needed. The prepared wet material was handlaid in a wooden mold having a dimension of 1220 × 1200 mm2, which was subjected to a pressure ranging from 20 bars to 50 bars for 12 h. Due to manufacturing limitations, the slabs were removed from the mold and sun-dried for 14 days to reach the saturation weight. The proposed manufacturing process is shown in Figure 1. The boards were prepared for three mixing ratios of rice straw and MgO which were 1:1, 1:2, and 1:3, and the final products are depicted in Figure 2. For each composition, three fiber lengths were used, and three different thickness of 20, 30, and 40 mm slabs were manufactured. The thickness of the board was dependent on the pressure exerted on the mold and material composition.
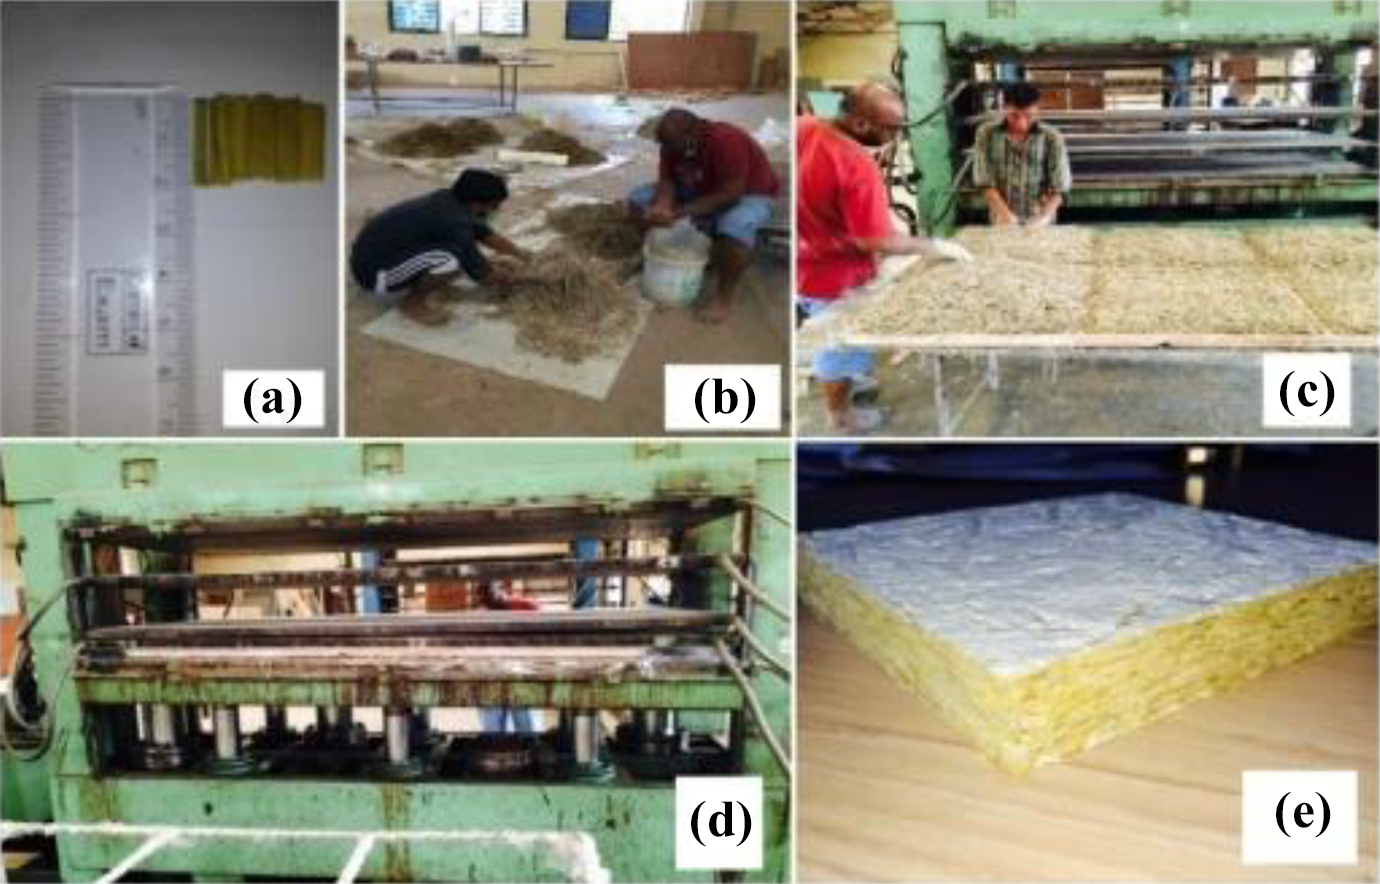
The board preparation method, (a) Rice straw cut for required length, (b) straw mixed with mineral, (c) the mixed sample placed in a mold, (d) mold placed in compression machine, pressed, and (e) final product.
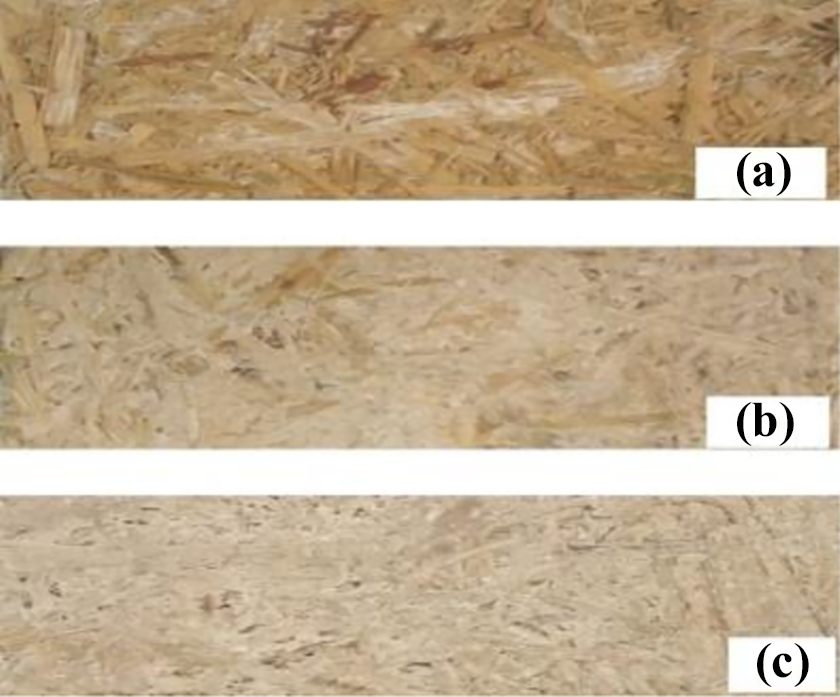
Final finished products with different mixing ratio (a) 1:1, (b) 1:2, and (c) 1:3 for 10-20mm fiber length.
Experimental testing of hydration properties
The samples were cut with a dimension of 150 × 100 mm2, as suggested by ATSM D 1037 standard, and the five samples were used initially and tested for WA and swelling properties. The sample was immersed in a water tray, their weight and the variability of thickness were measured at an interval of 2 h by removing the sample out of the water tray and left for 10 min, as mentioned in the standard.
The maximum WA and TS by the sample were calculated using equations (1) and (2), as given in ASTM D-1037:


Where w i and w f are initial and final weights. T i and T f are the initial and final thicknesses of the sample.
Proposed expert systems
In this investigation, ANN and DT methods were tested to predict the TSs. Since ANN has the potential to learn from nonlinear and multivariable process parameters, 16 it was chosen as one of the expert systems in this work. FCC architecture was used because it is 100 times powerful than the conventional single-hidden layer (SHL) architecture. 27 In FCC, many SHLs are connected in series with common inputs, as shown in Figure 3. However, the output of each SHL is given as one of the inputs to the successive SHLs. In this work, two SHLs were connected serially and the first SHL1 predicted WA which was fed as one of the inputs to the second SHL2, as shown in Figure 3. Further, best SHL architecture was identified and it was used to predict the TS.
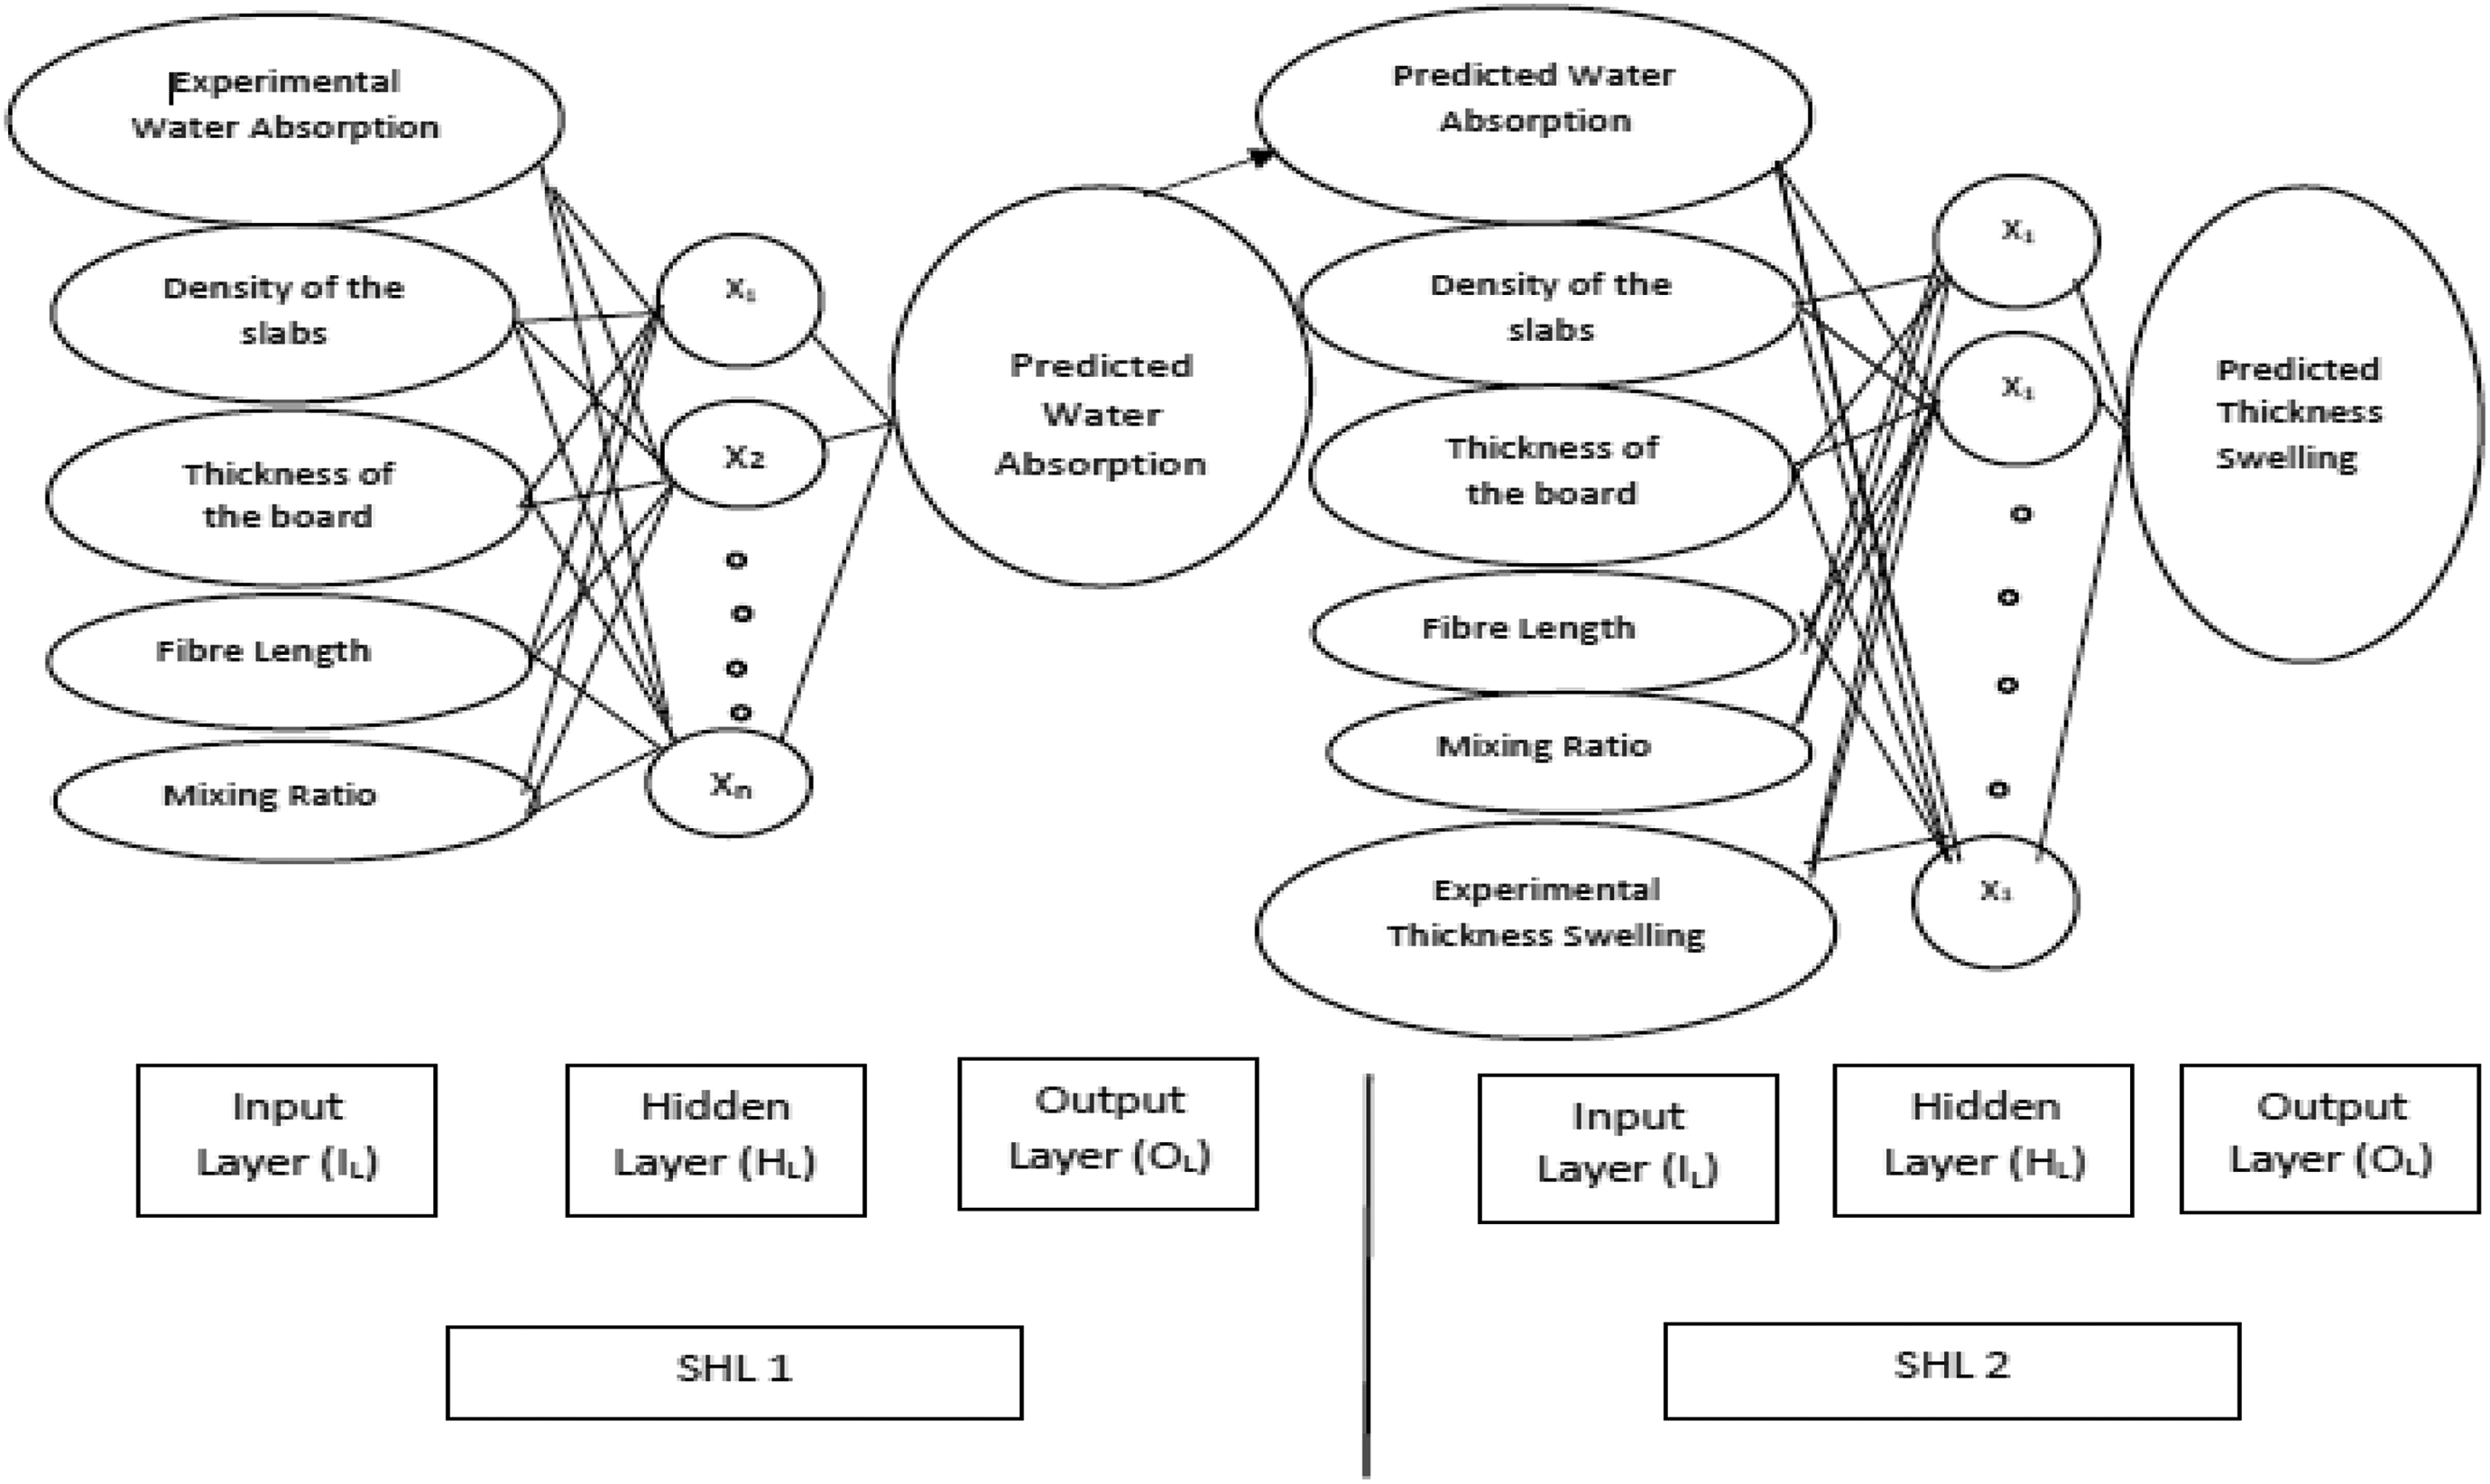
Proposed FCC ANN model.
Similarly, DT method was chosen due to its intelligibility, ease of implementation, and offer superior accuracy over other algorithms. 19 The major problem of using DT is that it may result in a large tree structure and challenging to comprehend the results. 19 To overcome this problem, various pruning methods were implemented, such as J48, REPTree, PART, JRip, and Ridor algorithms of which reduced error pruning tree (REPTree) algorithm is found to be more efficient due to high accuracy with a simple tree structure. 20 In a similar way to FFC, the best architecture for REPTree was identified and the TS was predicted.
Dataset
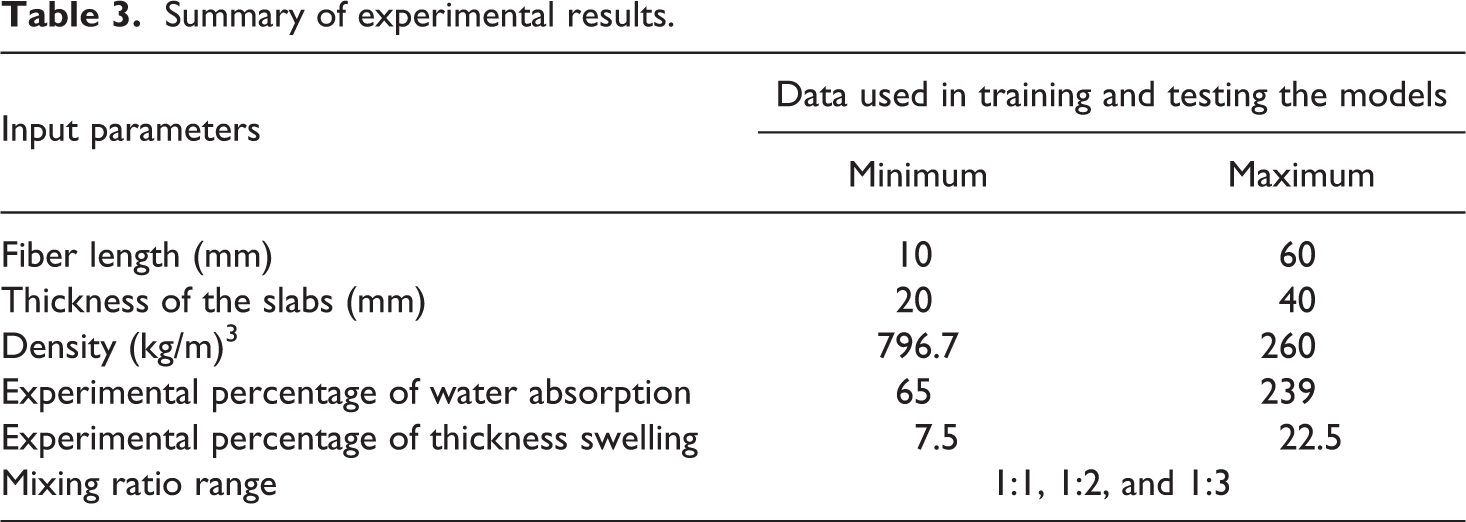
In this study, 109 experimental datasets were generated, as prescribed by ASTM D 1027 standards. A summary of result with minimum and maximum values is shown in Table 3. Although the WA and TS are directly proportional, in the field conditions, TS alone can be measured. However, in the product development stages, both WA and TS were measured as functions of fiber length, the thickness of the slab, density, and mixing ratio of the slab. Therefore, these four independent functions were given as primary input to both models. Out of 109 test data, 70% was used for training and the rest 30% were used for testing.
Summary of experimental results.
Evaluation of proposed predictive models
The R and RMSE were used as stopping criteria from identifying the best architecture, that is, the number of nodes in the hidden layer in the FCC and the minimum number of total instances in the leaf in REPTree. The correlation between datasets and prediction was always higher than 0.9, which means that the datasets used in this work are valid. The coefficient of determination (R 2) was calculated using the equation derived from the regression line drawn between the predicted and actual data. The R 2 was used as a tool to predict the accuracy of the expert systems. In addition to R, R 2, and RMSE, the maximum mean absolute error (MAE) was also used as a performance indicator. All the calculation results were automatically provided. The equations for all the statistical tools used are given in equations (3) to (6). In addition to the statistical tools, DR was used to calculate the quality of prediction (i.e. overestimation or underestimation), 18 as given in equation (7):
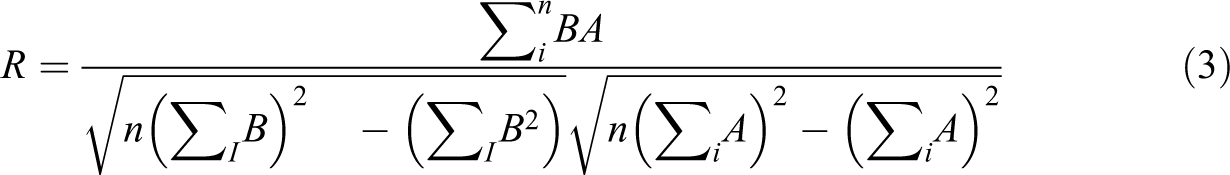
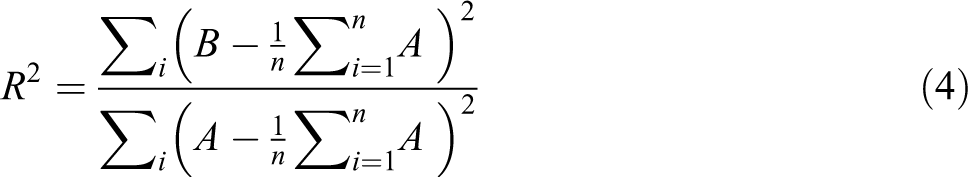
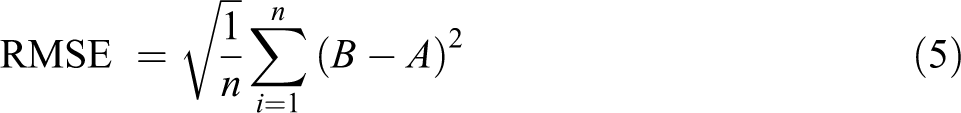
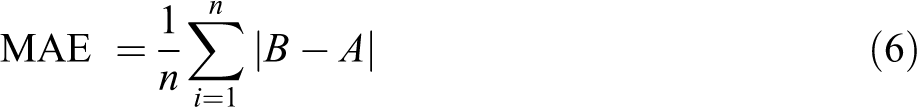

Where A is the predicted value of TS, B is the experimental value of TS, n is the total number of datasets, PTS is the predicted TS, and ATS is the actual TS.
Results and discussion
Hydration properties
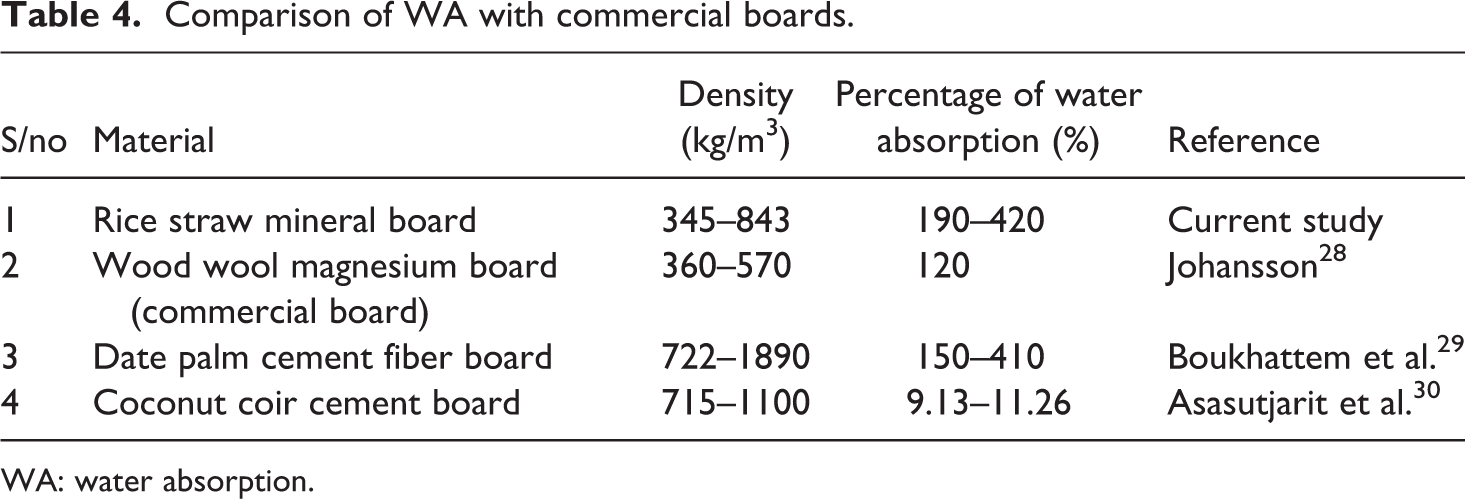
The hydration properties of mineral slabs were assessed by measuring the WA and swelling. As anticipated, both WA and swelling reduced for increasing density, as shown in Figure 4. Although the fiber length and mixture ratio have a significant impact on these properties, the result of 10- 20mm long fiber and 1:3 mixture ratio with varying thickness is provided here. In the result, slabs with densities of 345, 526, and 843 kg/m3 correspond to 40, 30, and 20mm thickness. Since the slabs were prepared without additives, the WA and swelling are higher than the commercially available slabs, as shown in Table 4. This may be due to the hydrophilic nature of the RS, which tend to absorb more water as compared to wood wool slabs. Although the slabs offered good mechanical strength, the aspect ratio and the thickness of RS are higher than the wood wool; it may have absorbed more water.
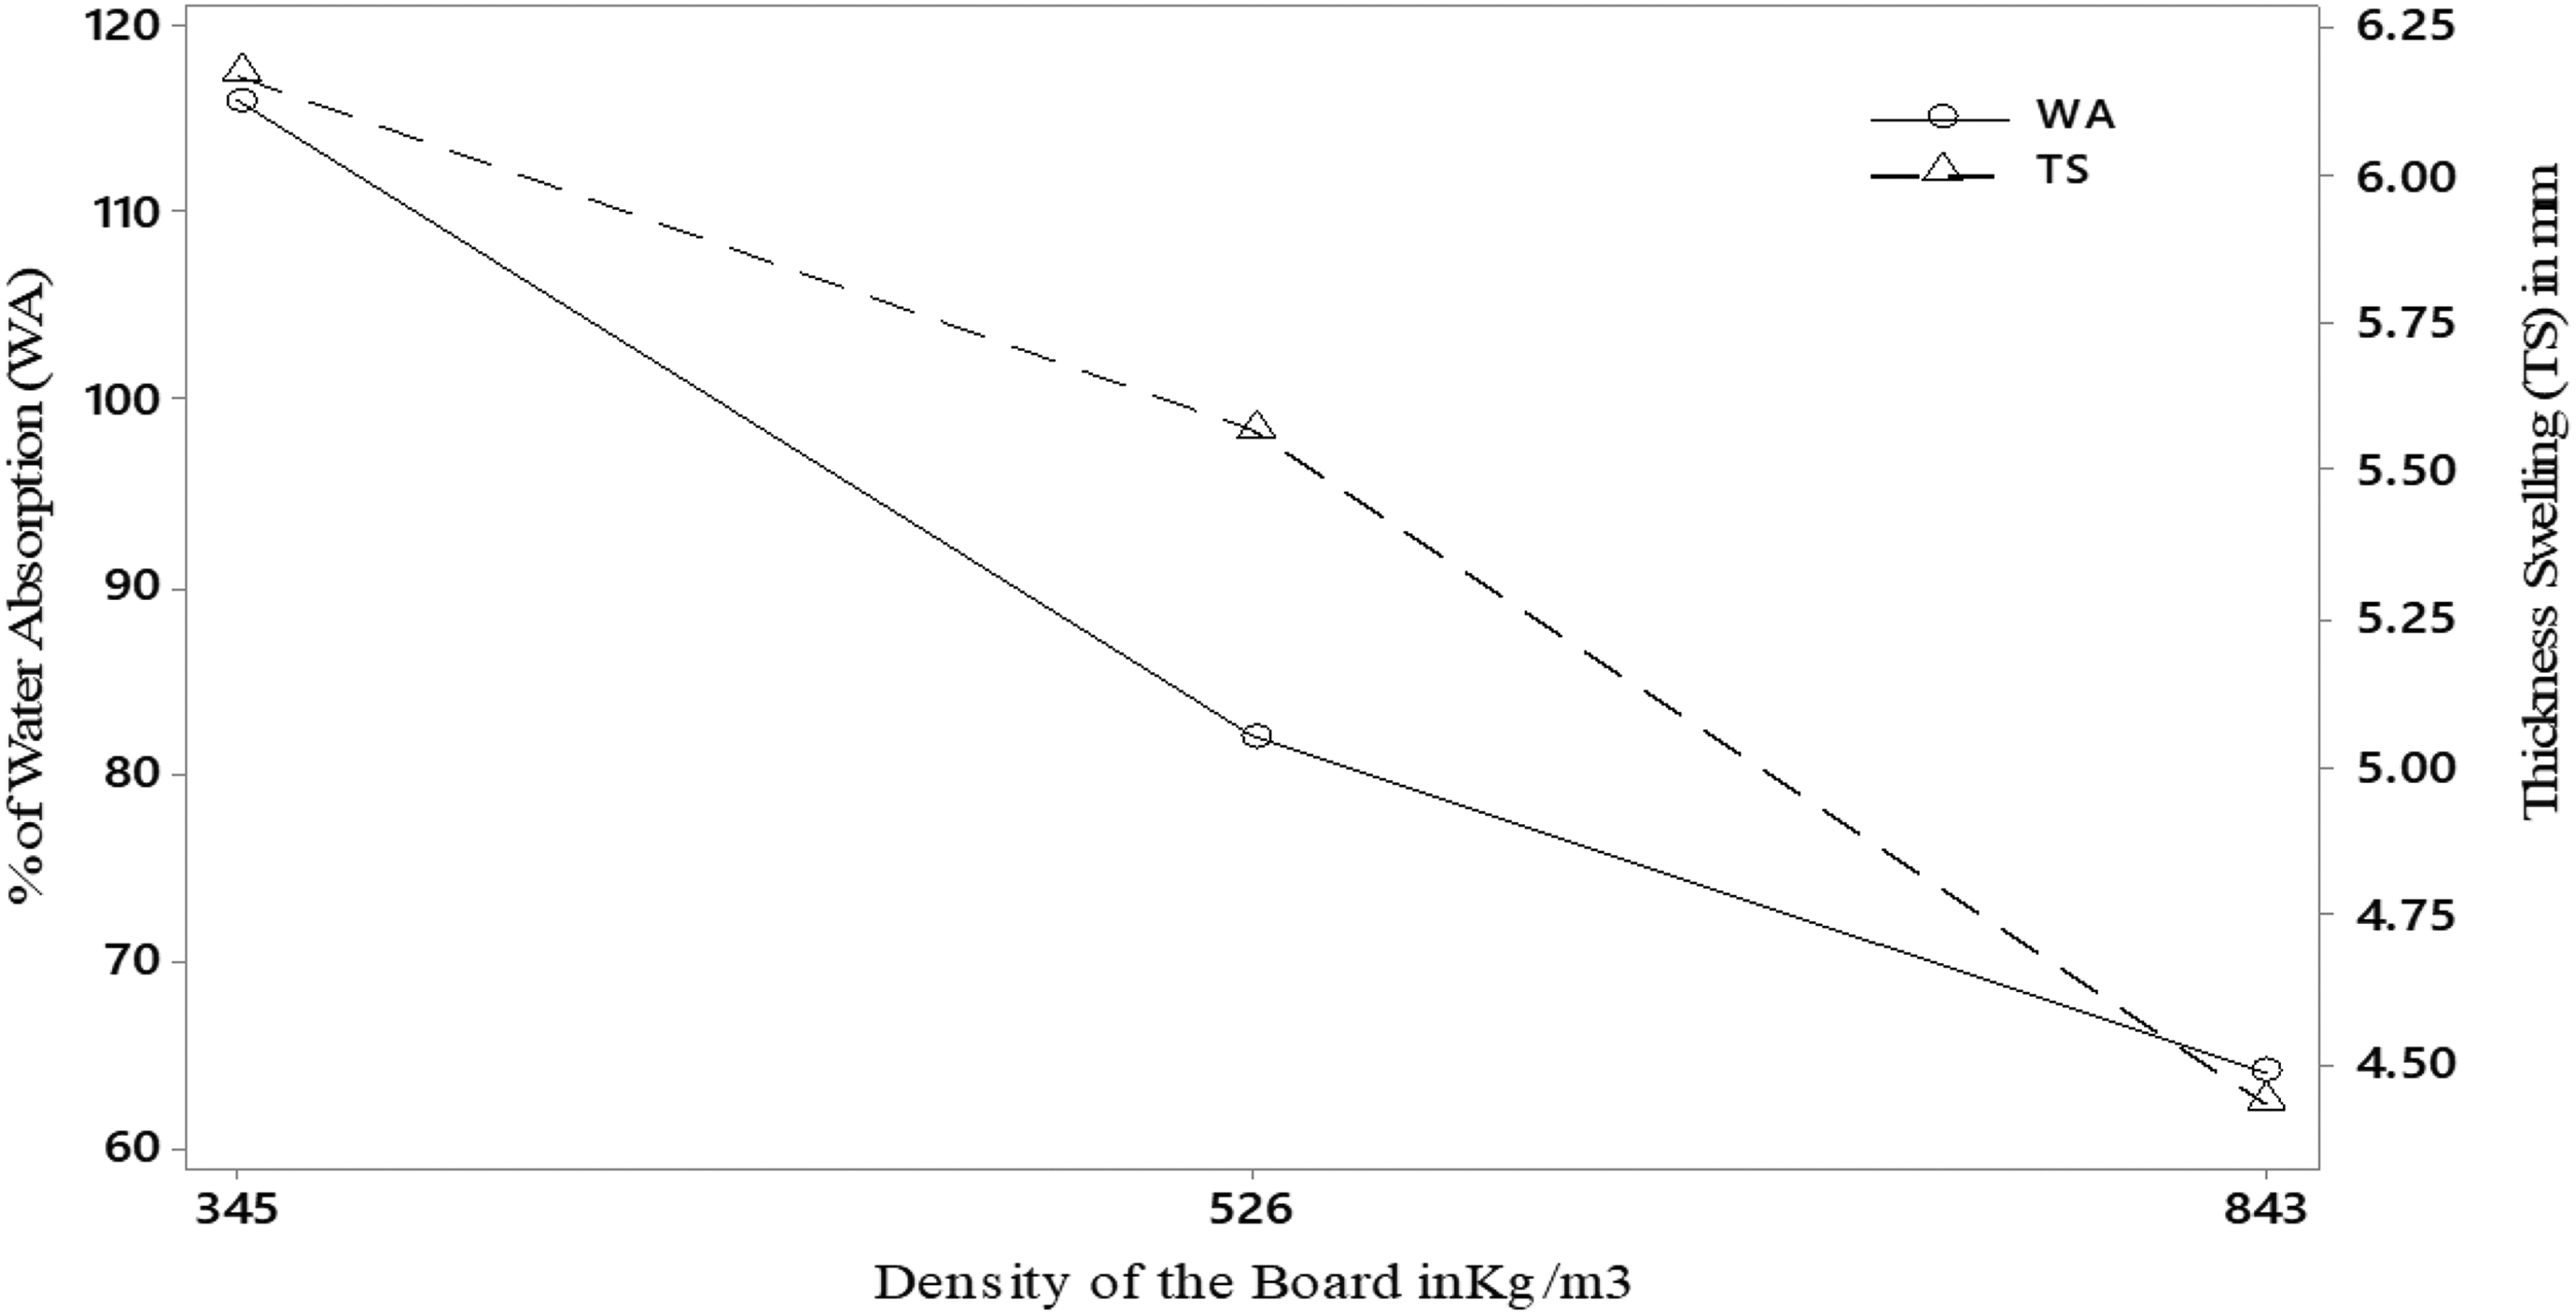
Effect of water absorption and swelling for varying density.
Comparison of WA with commercial boards.
WA: water absorption.
FCC selection of a suitable architecture
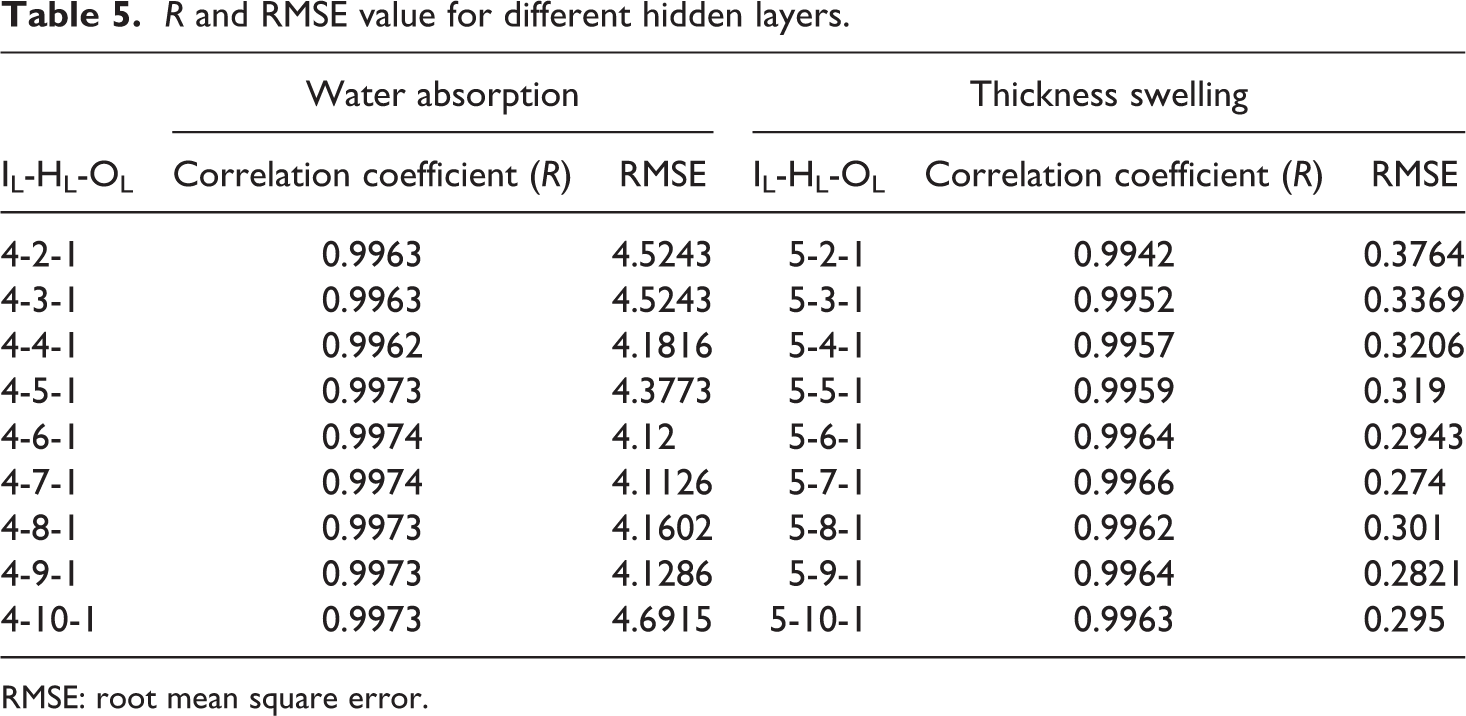
To our knowledge, the prediction of TS for mineral-based random-oriented natural fiber composites is not available in the open literature. Therefore, it is essential to develop a suitable architecture for developing expert systems. As part of this research, FCC was chosen as one of the expert systems and it is required to identify efficient architecture with the number of nodes in each SHL. For four inputs and one output, the number of neurons in the hidden layer was varied from 2 to 10 to predict the best architecture for WA. Subsequently, for five input and one output architecture, the number of nodes in the hidden layer was varied from 2 to 10 to predict TS. Since the main objective was to predict the using FCC, in the second SHL of FCC, the predicted WA in the first SHL was given as an additional input. The statistical tools R and RMSE were used to identify the best architecture. The SHL results with the varying number of neurons are given in Table 5. It is found that for 500 default epochs of WEKA with seven neurons, the hidden layer yielded the best result of 0.9974 R and 4.1126 RMSE for WA and 0.9966 R and 0.274 RSME for TS.
R and RMSE value for different hidden layers.
RMSE: root mean square error.
Performance analysis
Subsequent to the selection of appropriate architecture, the number of epochs is selected for the best convergence of the results. The same R and RMSE tools were used to find out the best epoch from the values between 100 and 1200 with an interval of 100, as shown in Figure 5. The R value was very high initially and steep decrease at 300 epochs and again increased steeply and stayed constant up to 500 epochs; further, it increased at 600 epochs and stayed constant at 900 epochs, while RMSE exponentially decreased from 300 to 1200 epochs. The point where the R and RMSE crossover was considered as the best epoch, which has the R-value of 0.9974 and RMSE of 4.1126. Additionally, the computational time taken for each epoch was considered to identify the best epochs. The 500 epochs consumed less time as compared to others, as shown in Figure 6. Therefore, in this work with FCC, 500 epochs were used for predicting the TS.
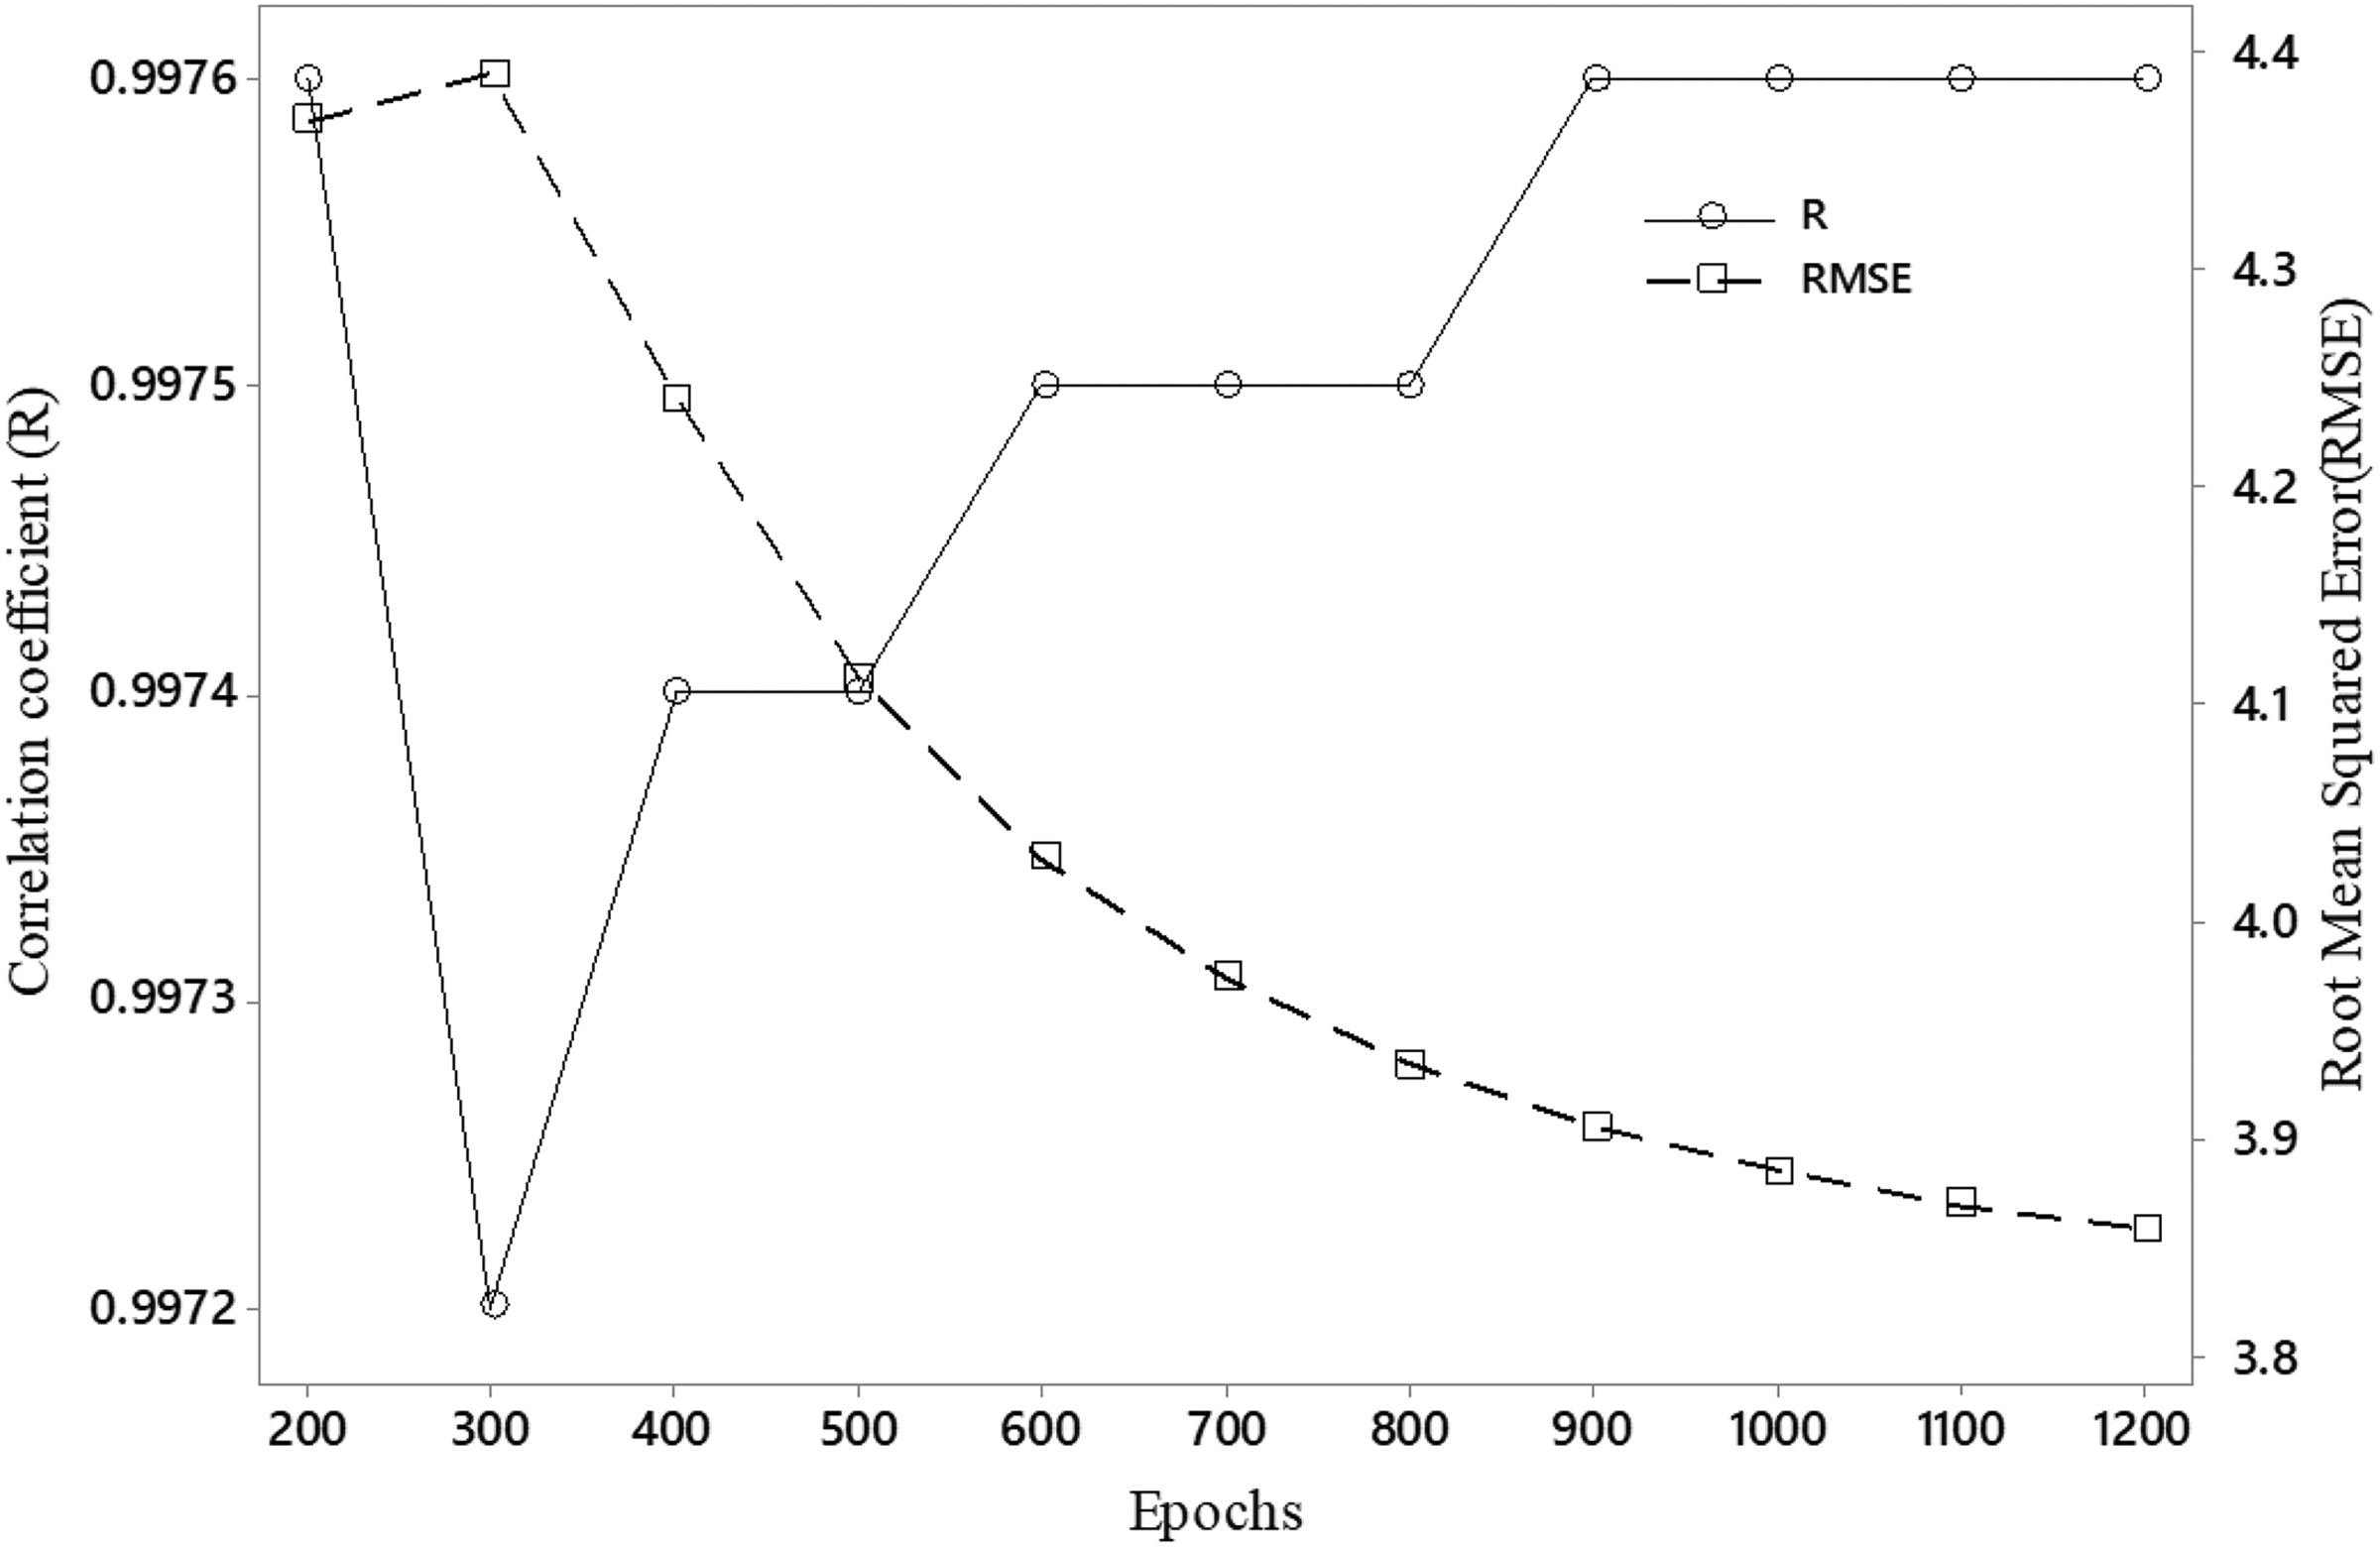
R and RMSE values for different epoch values for 4-7-1 ANN structure model.
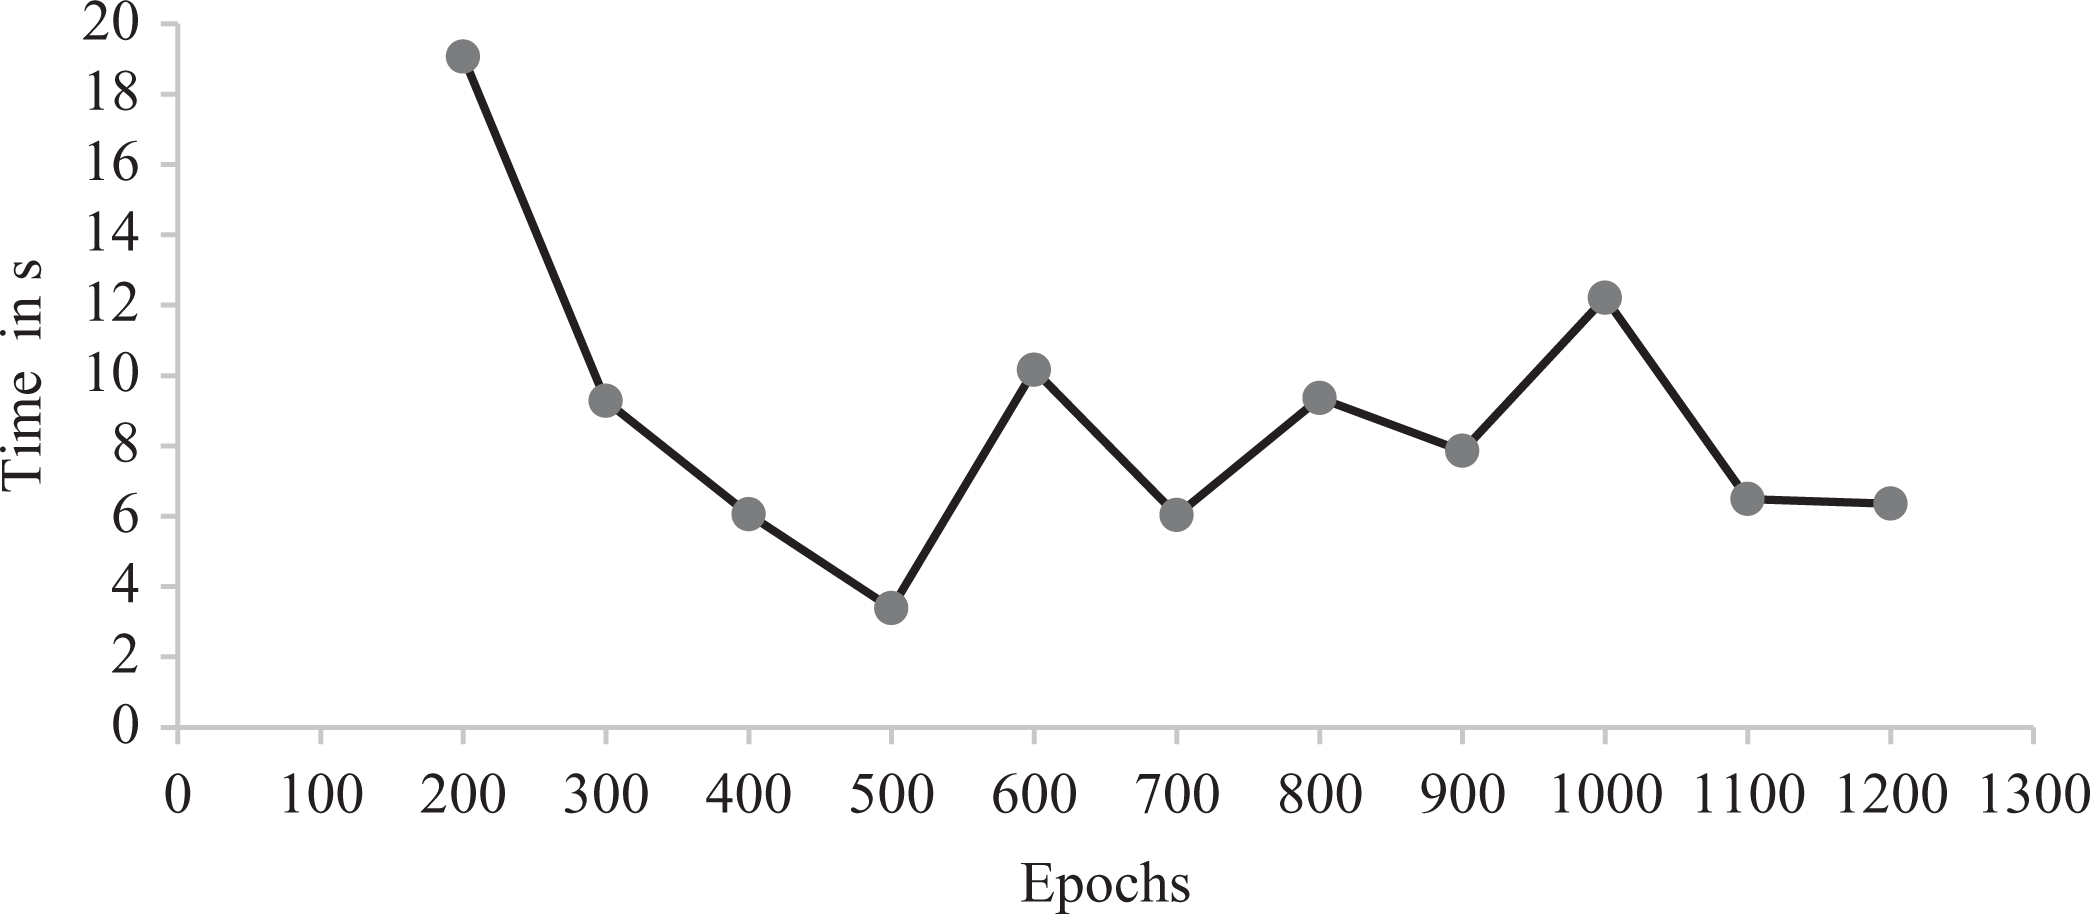
Time versus epochs of 4-7-1 ANN structure model.
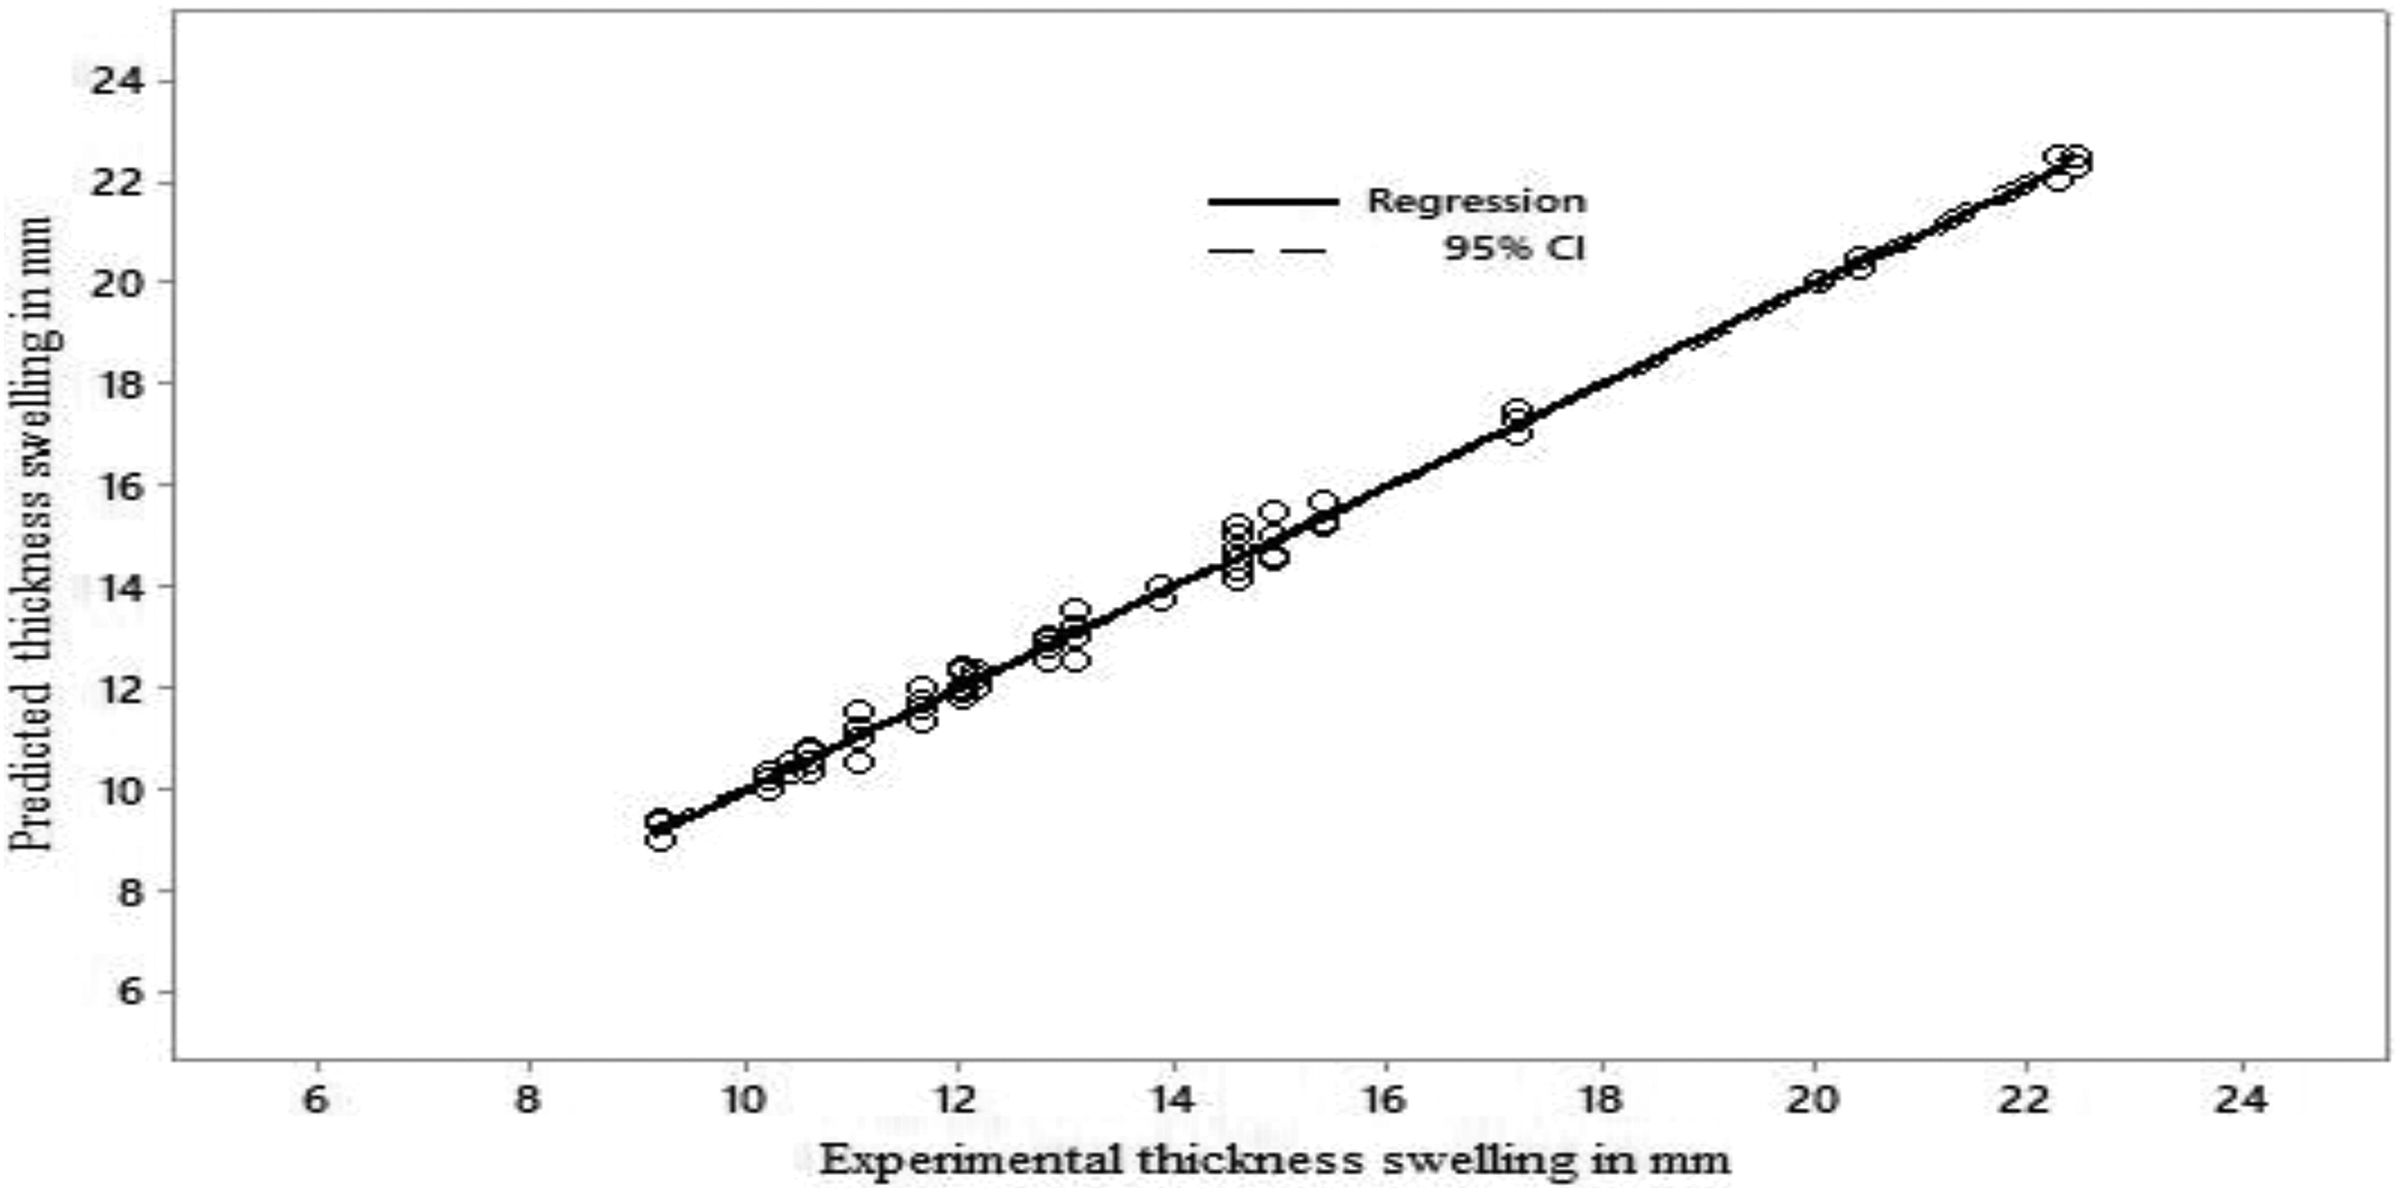
Since the objective was to predict the TS, the results of first SHL to predict the WA are not provided. For training of the FCC model, 76 datasets were used and formed a linear relationship between actual and prediction values, as shown in Figure 7. The R 2 value was determined from the regression equation, which was 0.9949 with the maximum MAE of 0.11 and the maximum RMSE value of 0.10. It means that in training, the FCC predicted with 99% accuracy. In both training and testing, the predicted value was within 95% confidence level, as highlighted in Figures 7 and 8. In the testing stage, the model generated values of 0.15 and 0.18 for maximum MAE and maximum RMSE, respectively.
Actual versus predicated thickness swelling value for ANN training model.
Actual versus predicated thickness swelling value for ANN testing model.
Decision tree
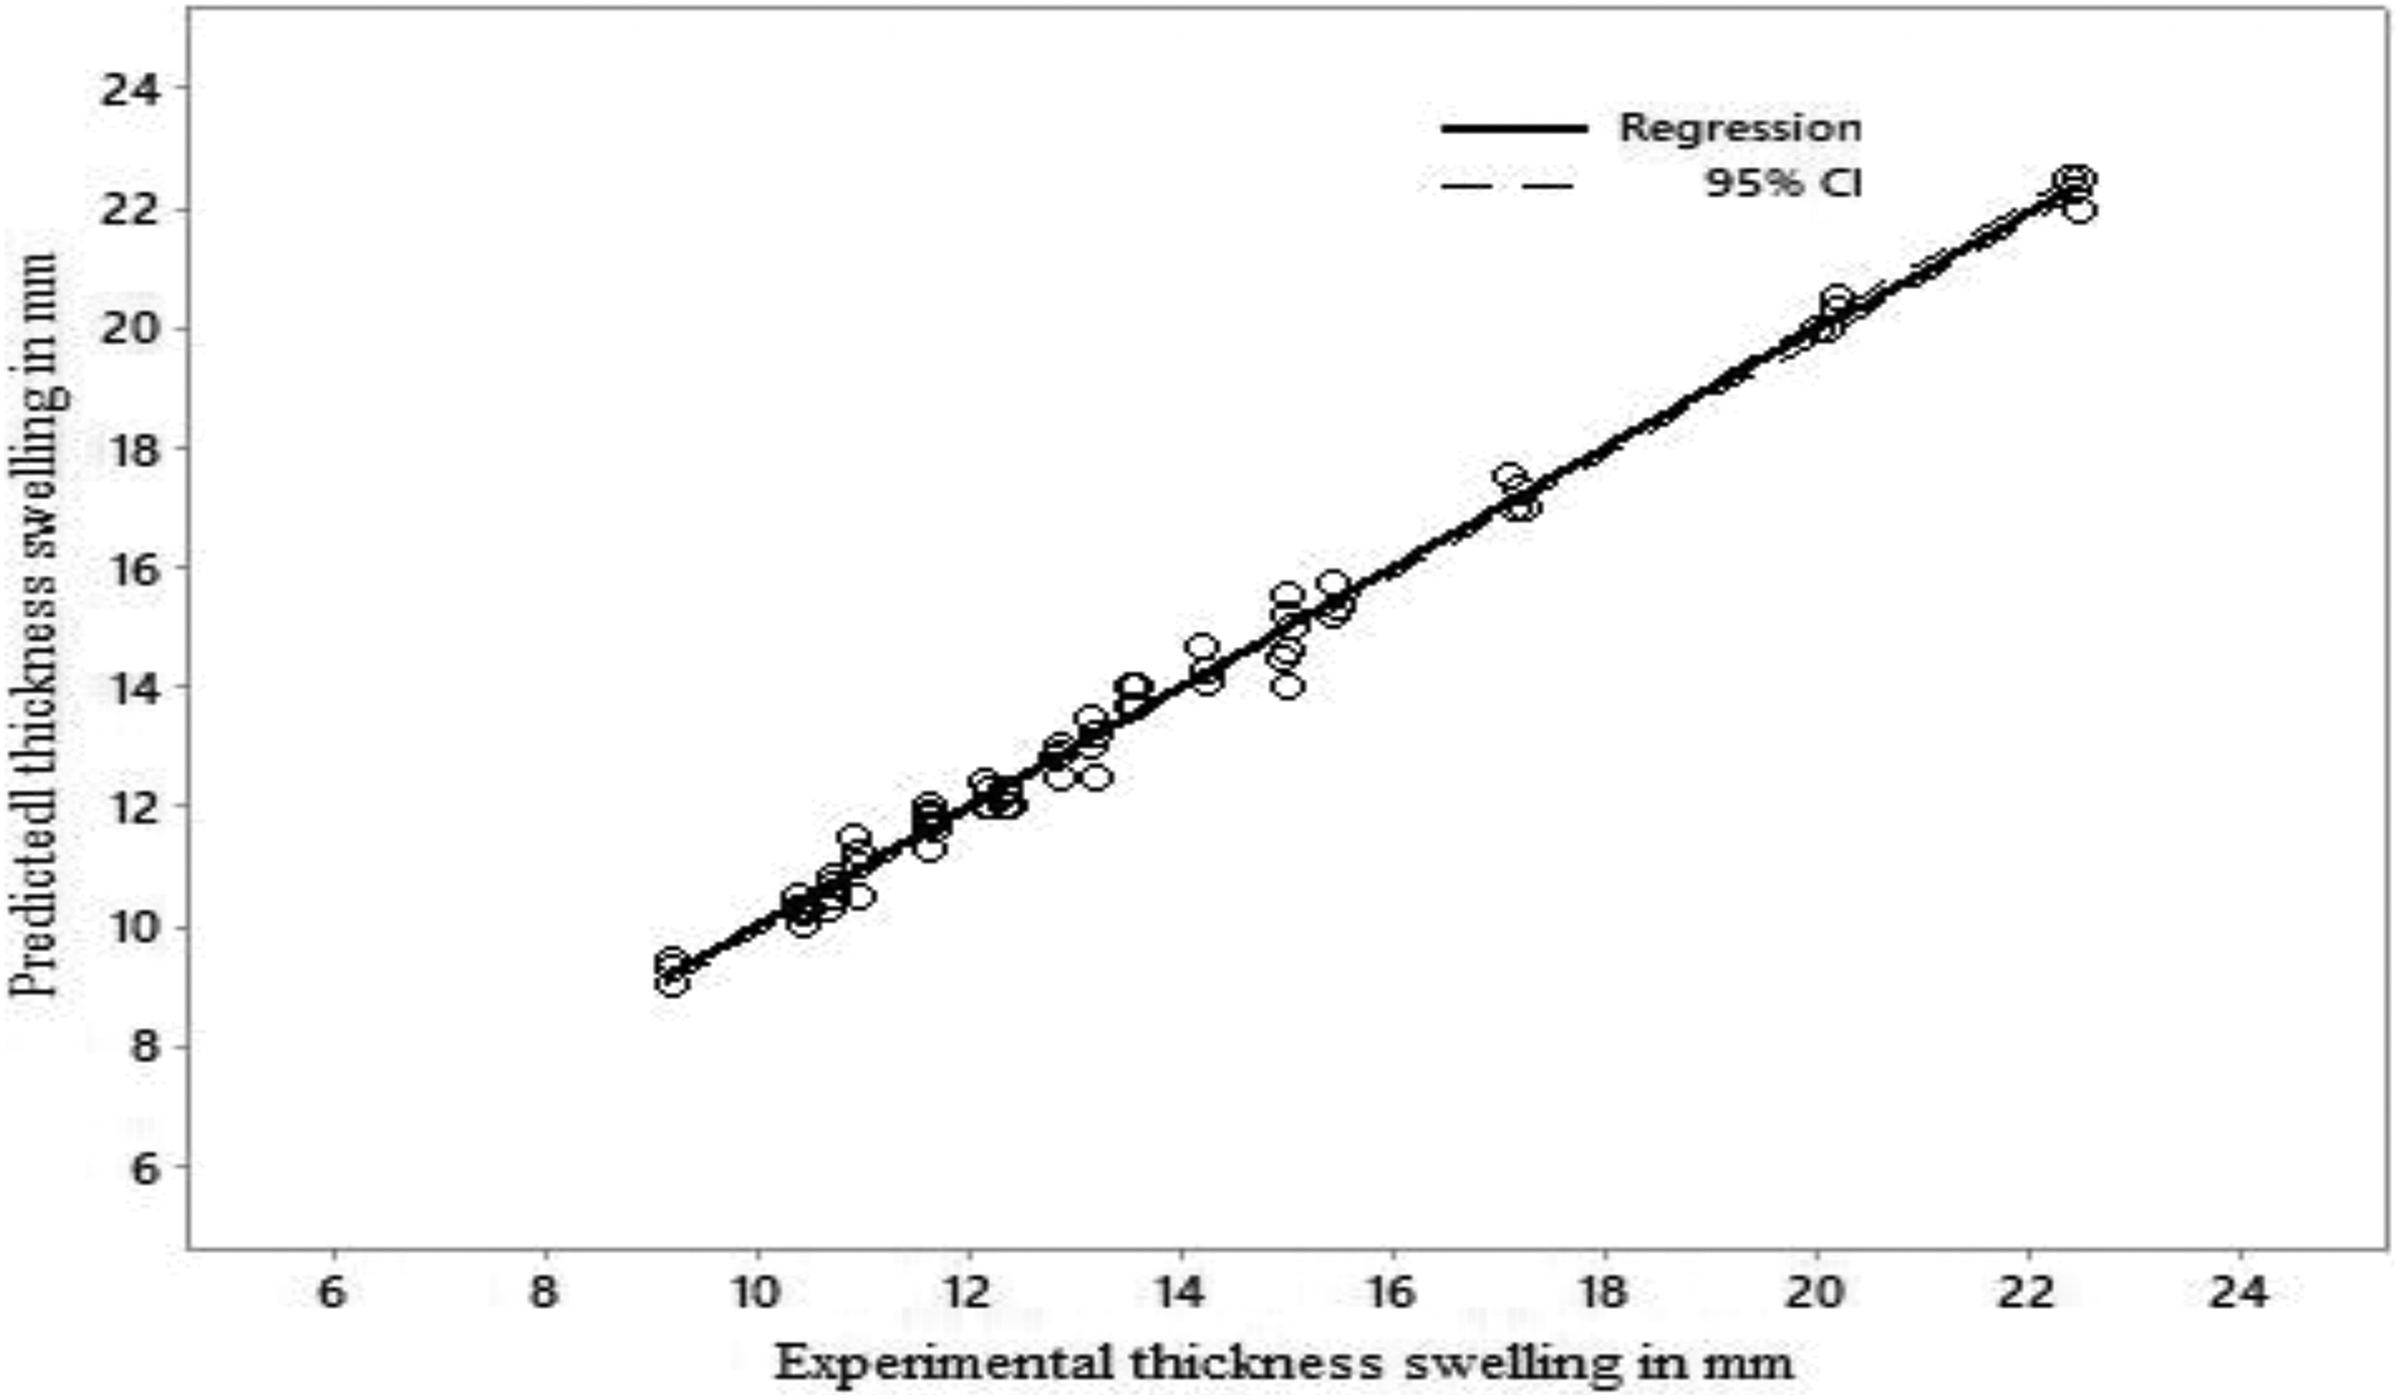
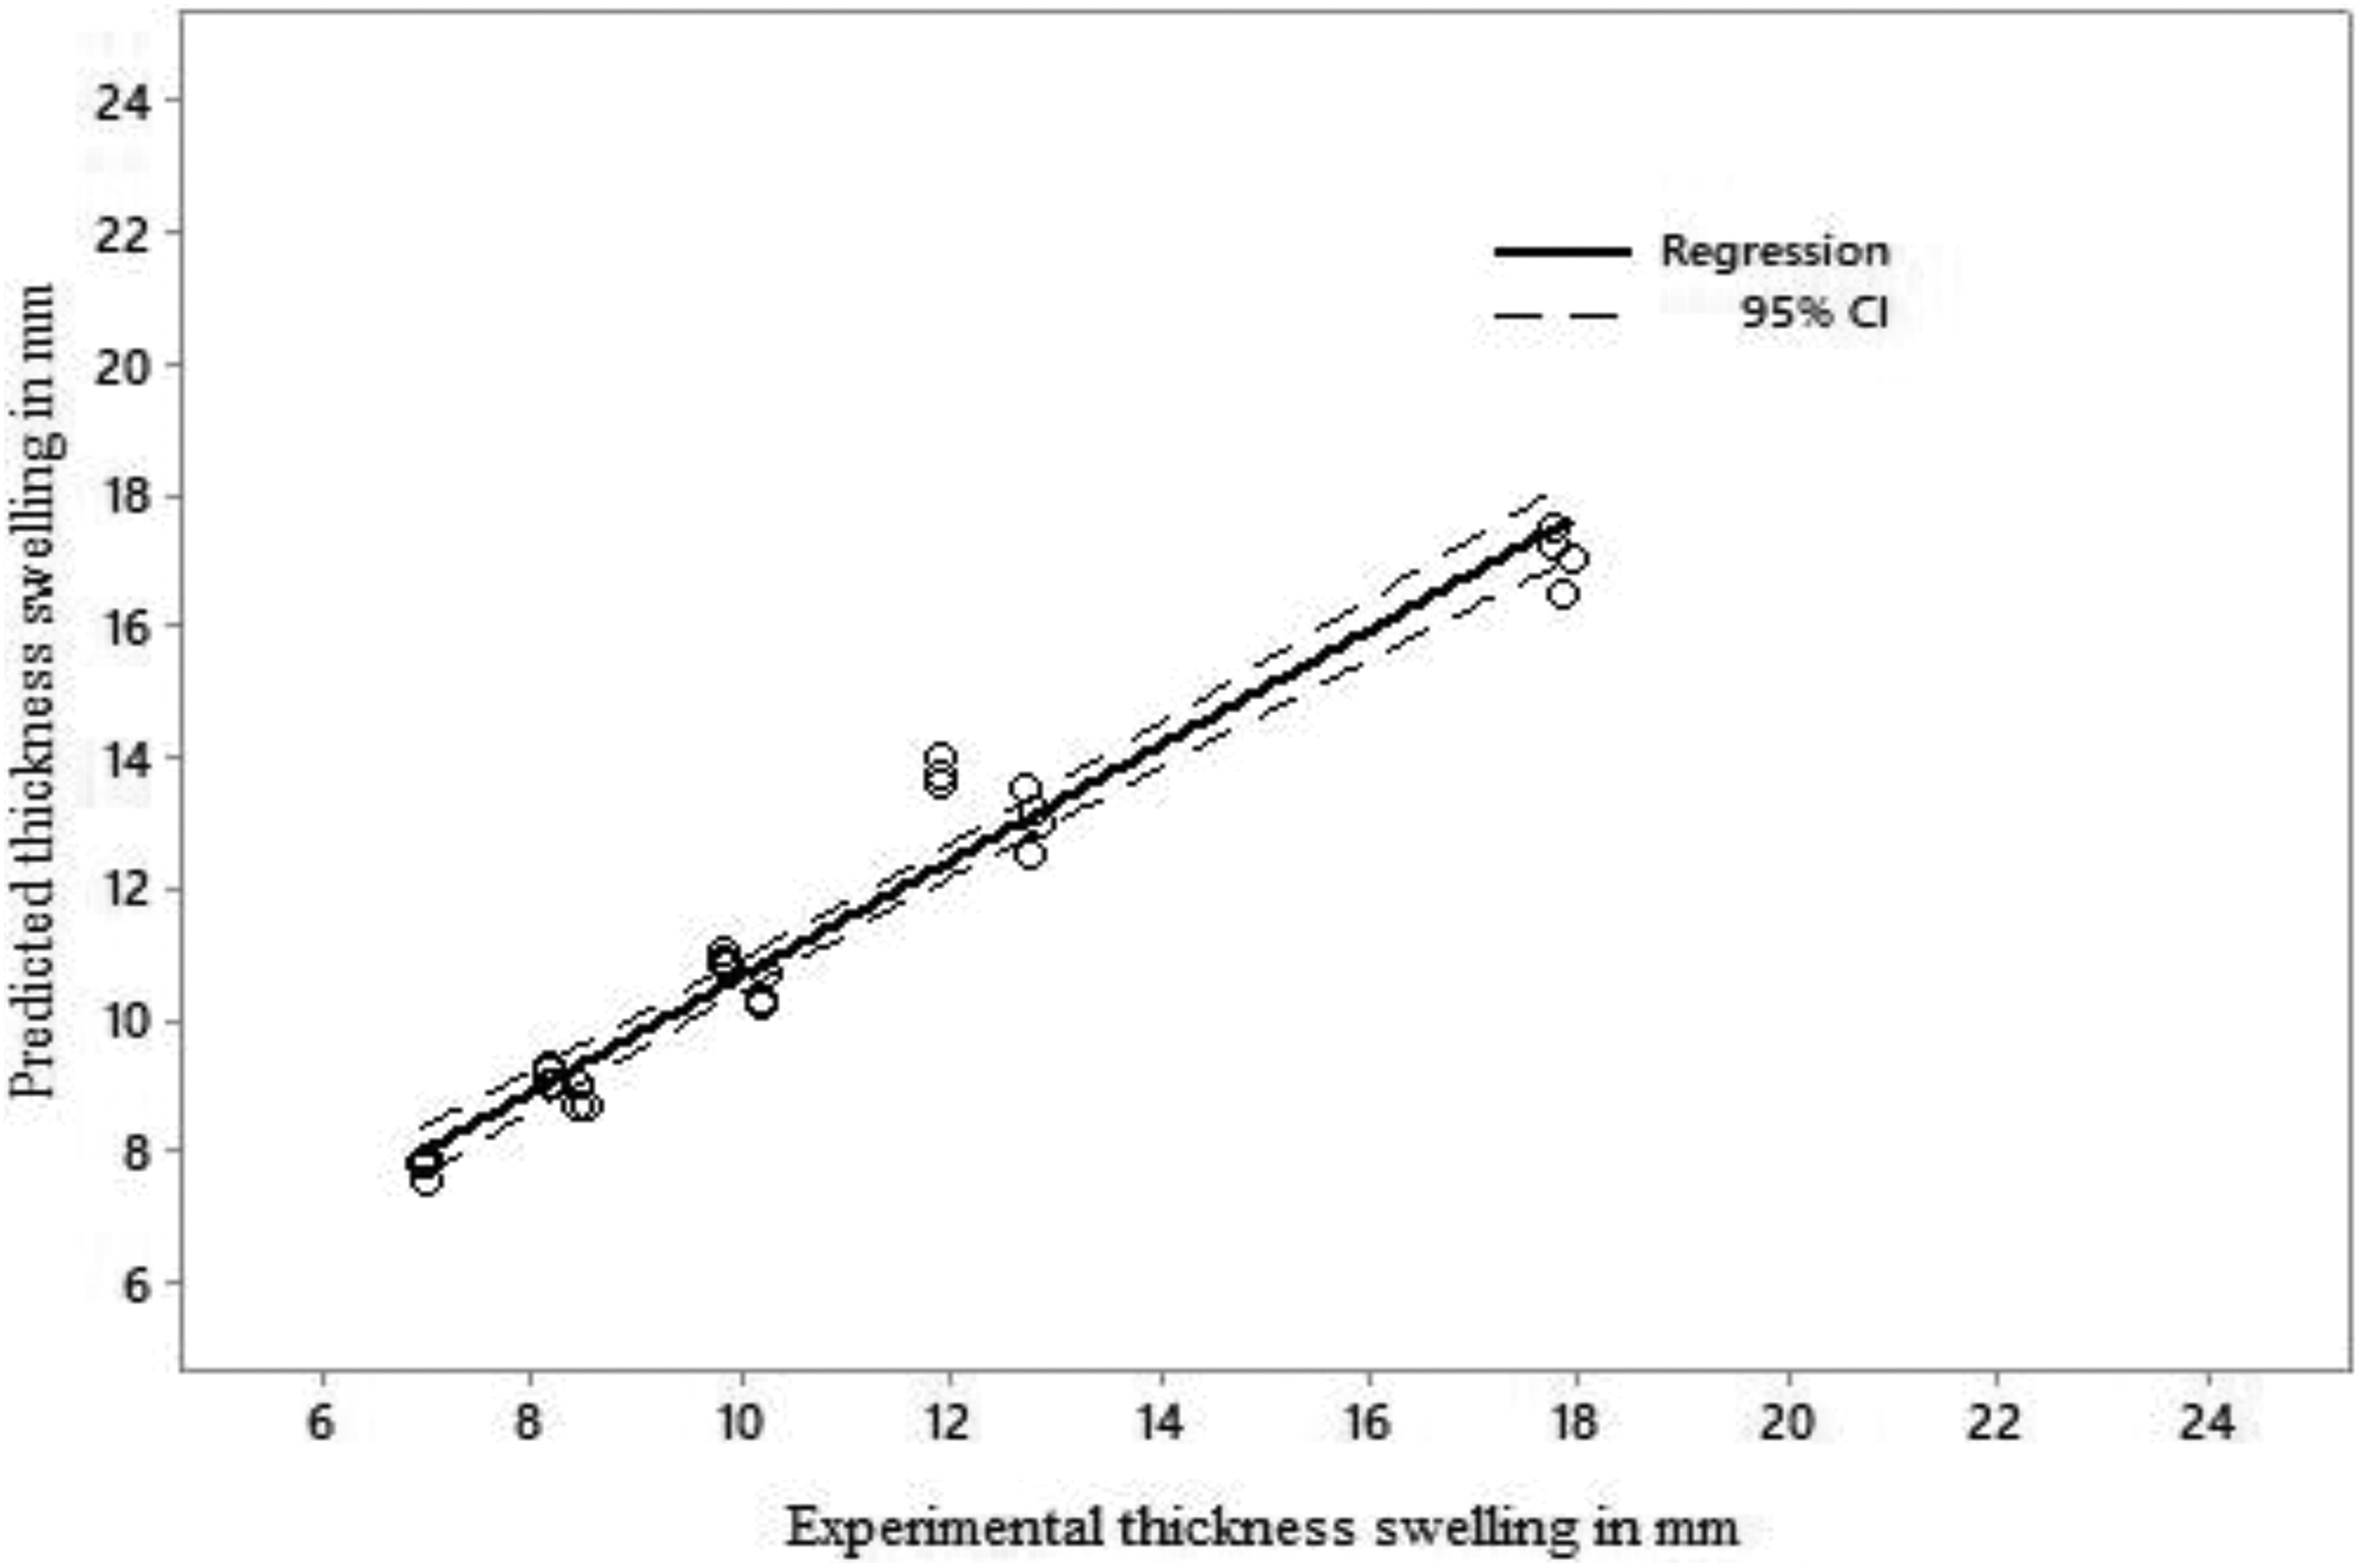
As discussed in the “Introduction” section, there are many algorithms used to prune the tree. However, in this work, REPTree method was adopted due to the flexibility it offers to set the minimum number of instances in the leaf to 2 and the number of folds for pruning to 1. Therefore, to identify the suitable tree architecture, the number of folds for pruning and instances in leaf varied from 1 to 3 and 2 to 9, respectively. In a similar way to FCC, R and RMSE were used as stopping criteria along with the size of the tree, as shown in Table 6. The 2–7 combination found to be a better architecture with a maximum R of 0.9974 and a minimum RMSE of 0.241 with a tree size of 33 nodes. In REPTree model, the TS was directly predicted from the same input variables used in FCC and predicted with an accuracy of 99% in training stage, as shown in Figure 9, whereas the prediction in the testing stage was 89%, as shown in Figure 10. The reason for the significant reduction in prediction may be due to the number of input variables used was not sufficient. 18
R and RMSE value for different leaf and folds of pruning.
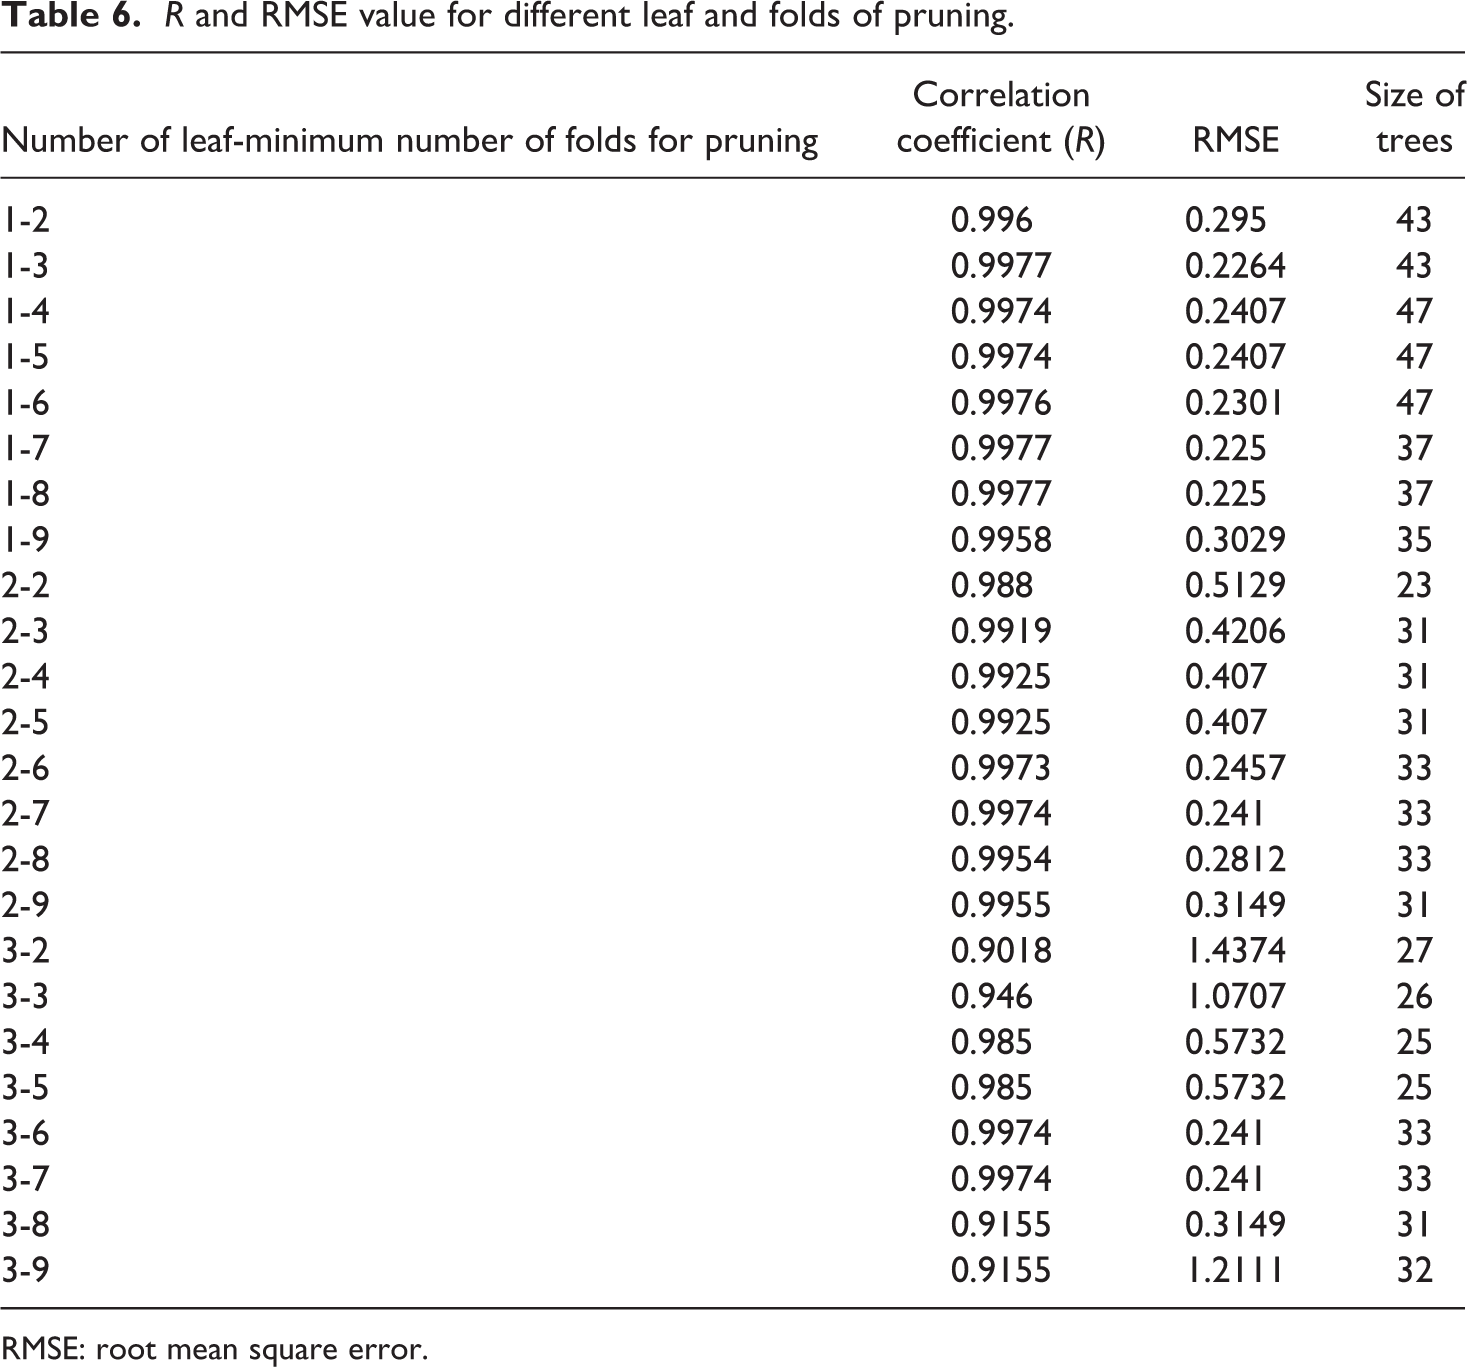
RMSE: root mean square error.
Actual versus predicated thickness swelling value for REPTree training model.
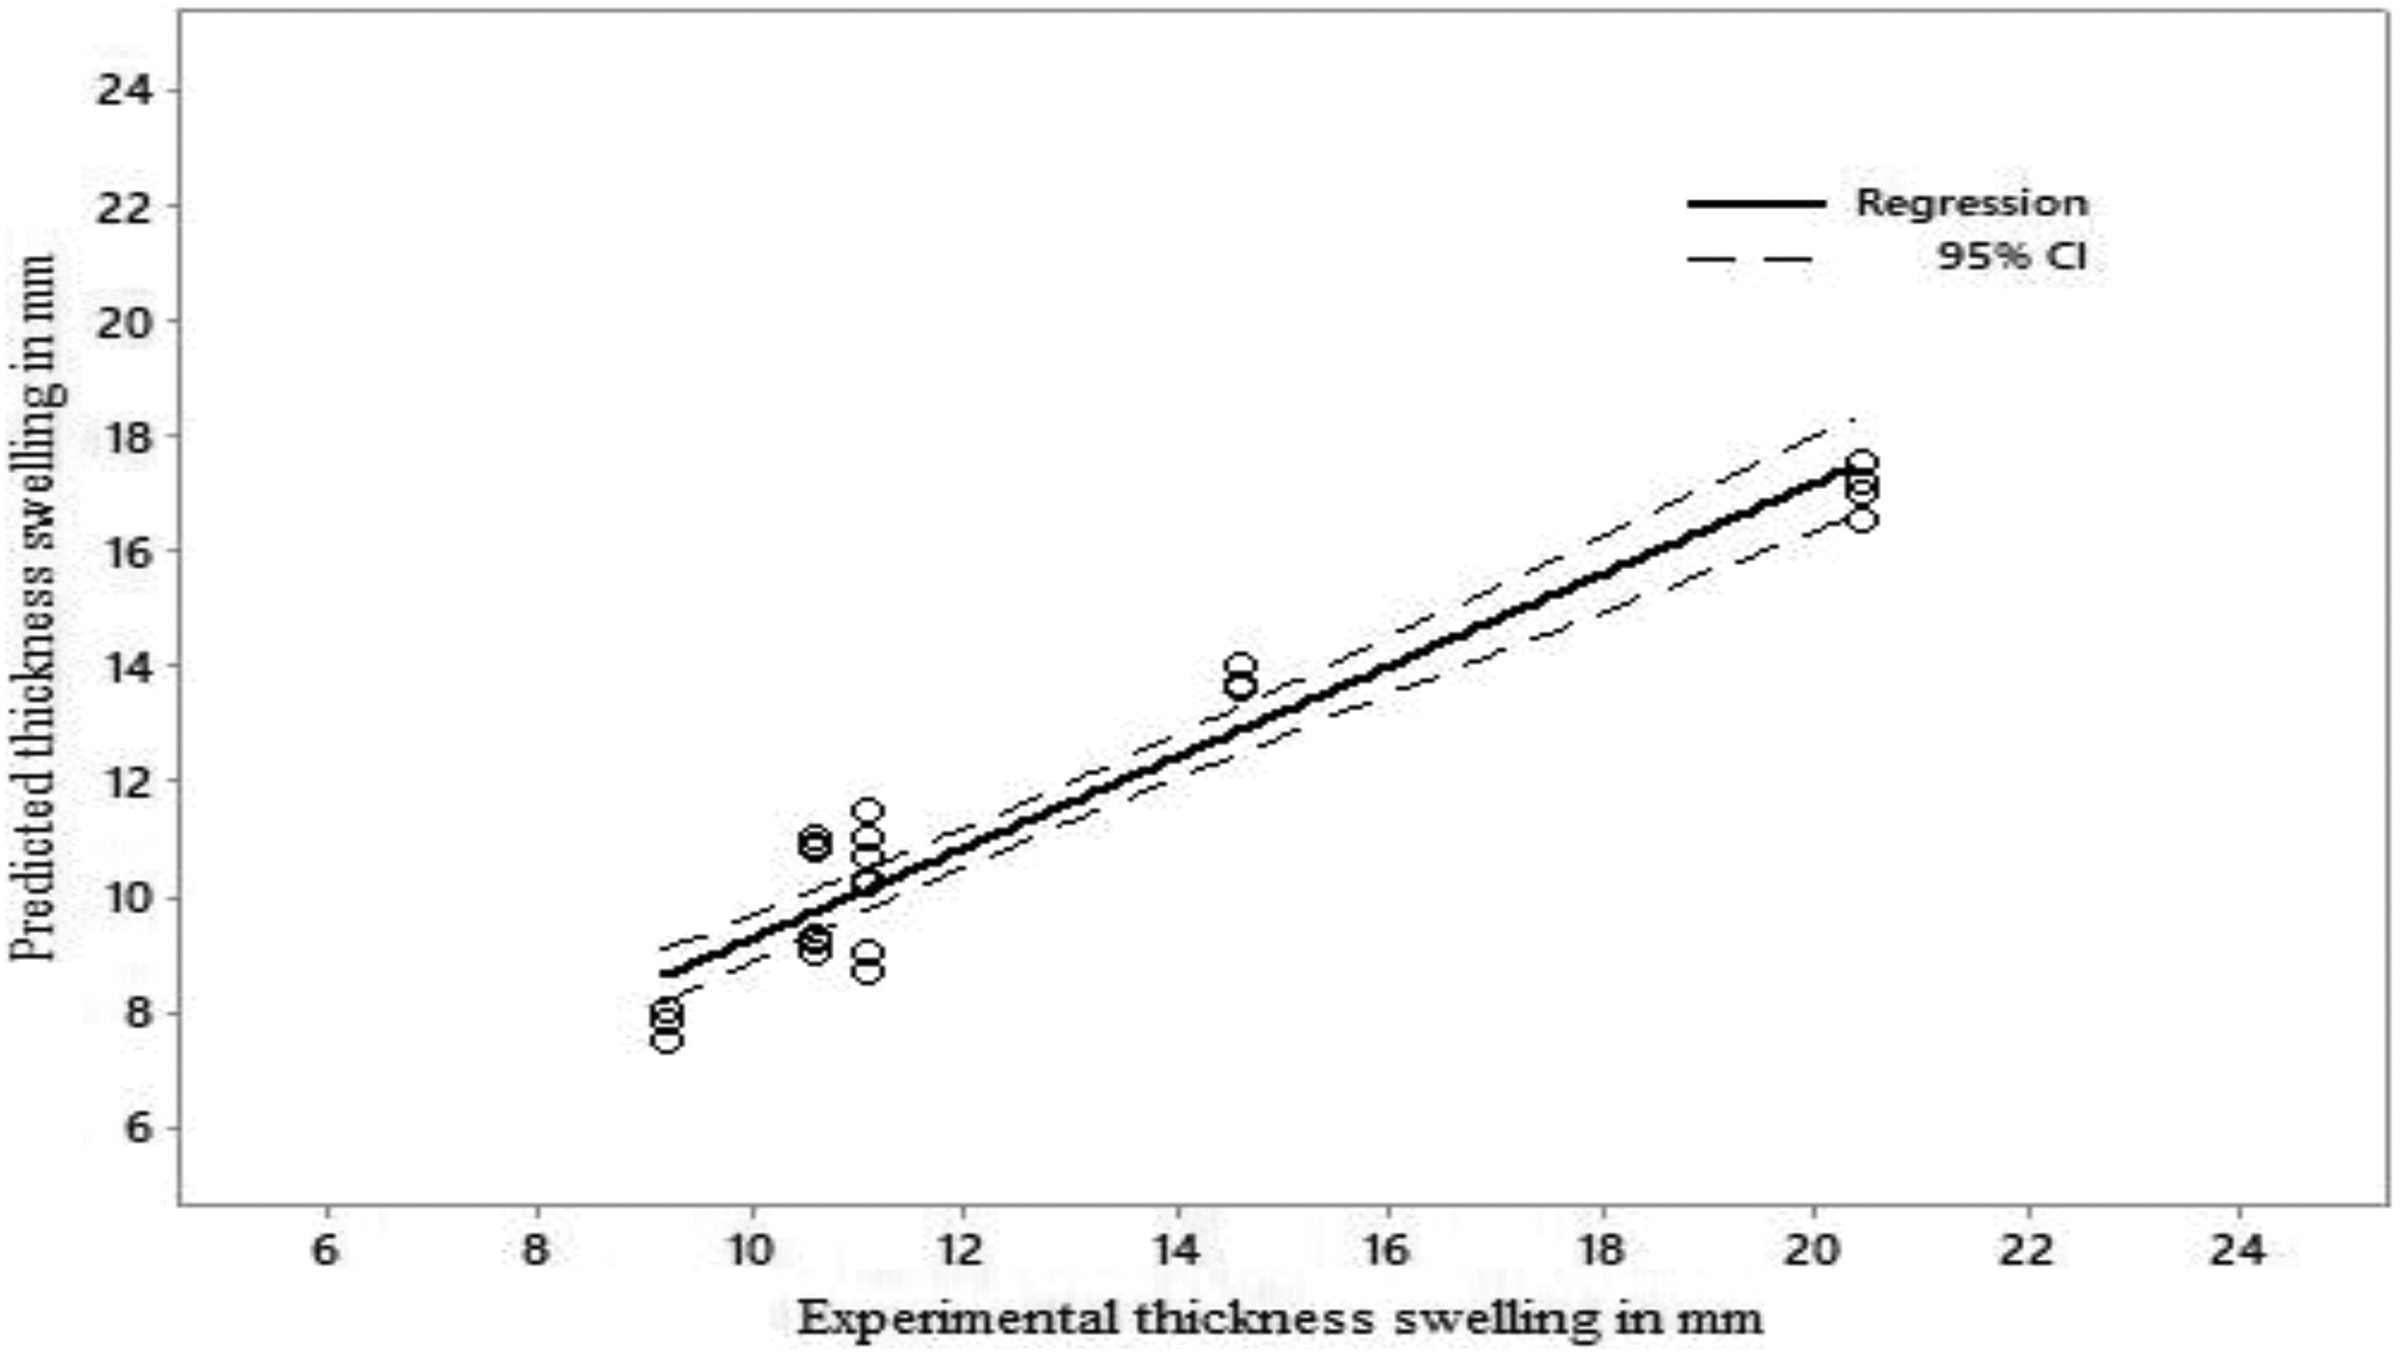
Actual versus predicated thickness swelling value for REPTree testing model.
Discrepancy ratio test
The test for over- and underprediction was carried out using the DR ratio test, as expressed by equation (7). 18 The DR value tends to be zero for the perfect match of prediction with the experimental value. If the DR value is on the positive side, it can be considered as overestimation, whereas for underestimation, the values are in negative. In this work, the accuracy was set for DR values between −0.5 and +0.5. For FCC, the DR values greater than 0.5 are 11% and 6% for training and testing, respectively, whereas the DR values less than −0.5 are 4% and 6% for training and testing, respectively, as shown in Figure 11. It means that the testing stage has an equal distribution between over- and underprediction. This may be due to the selection of process variables used as input to the FCC. The problem can be overcome by adding all the process variables, such as mold pressure, releasing time, and fiber aspect ratio.
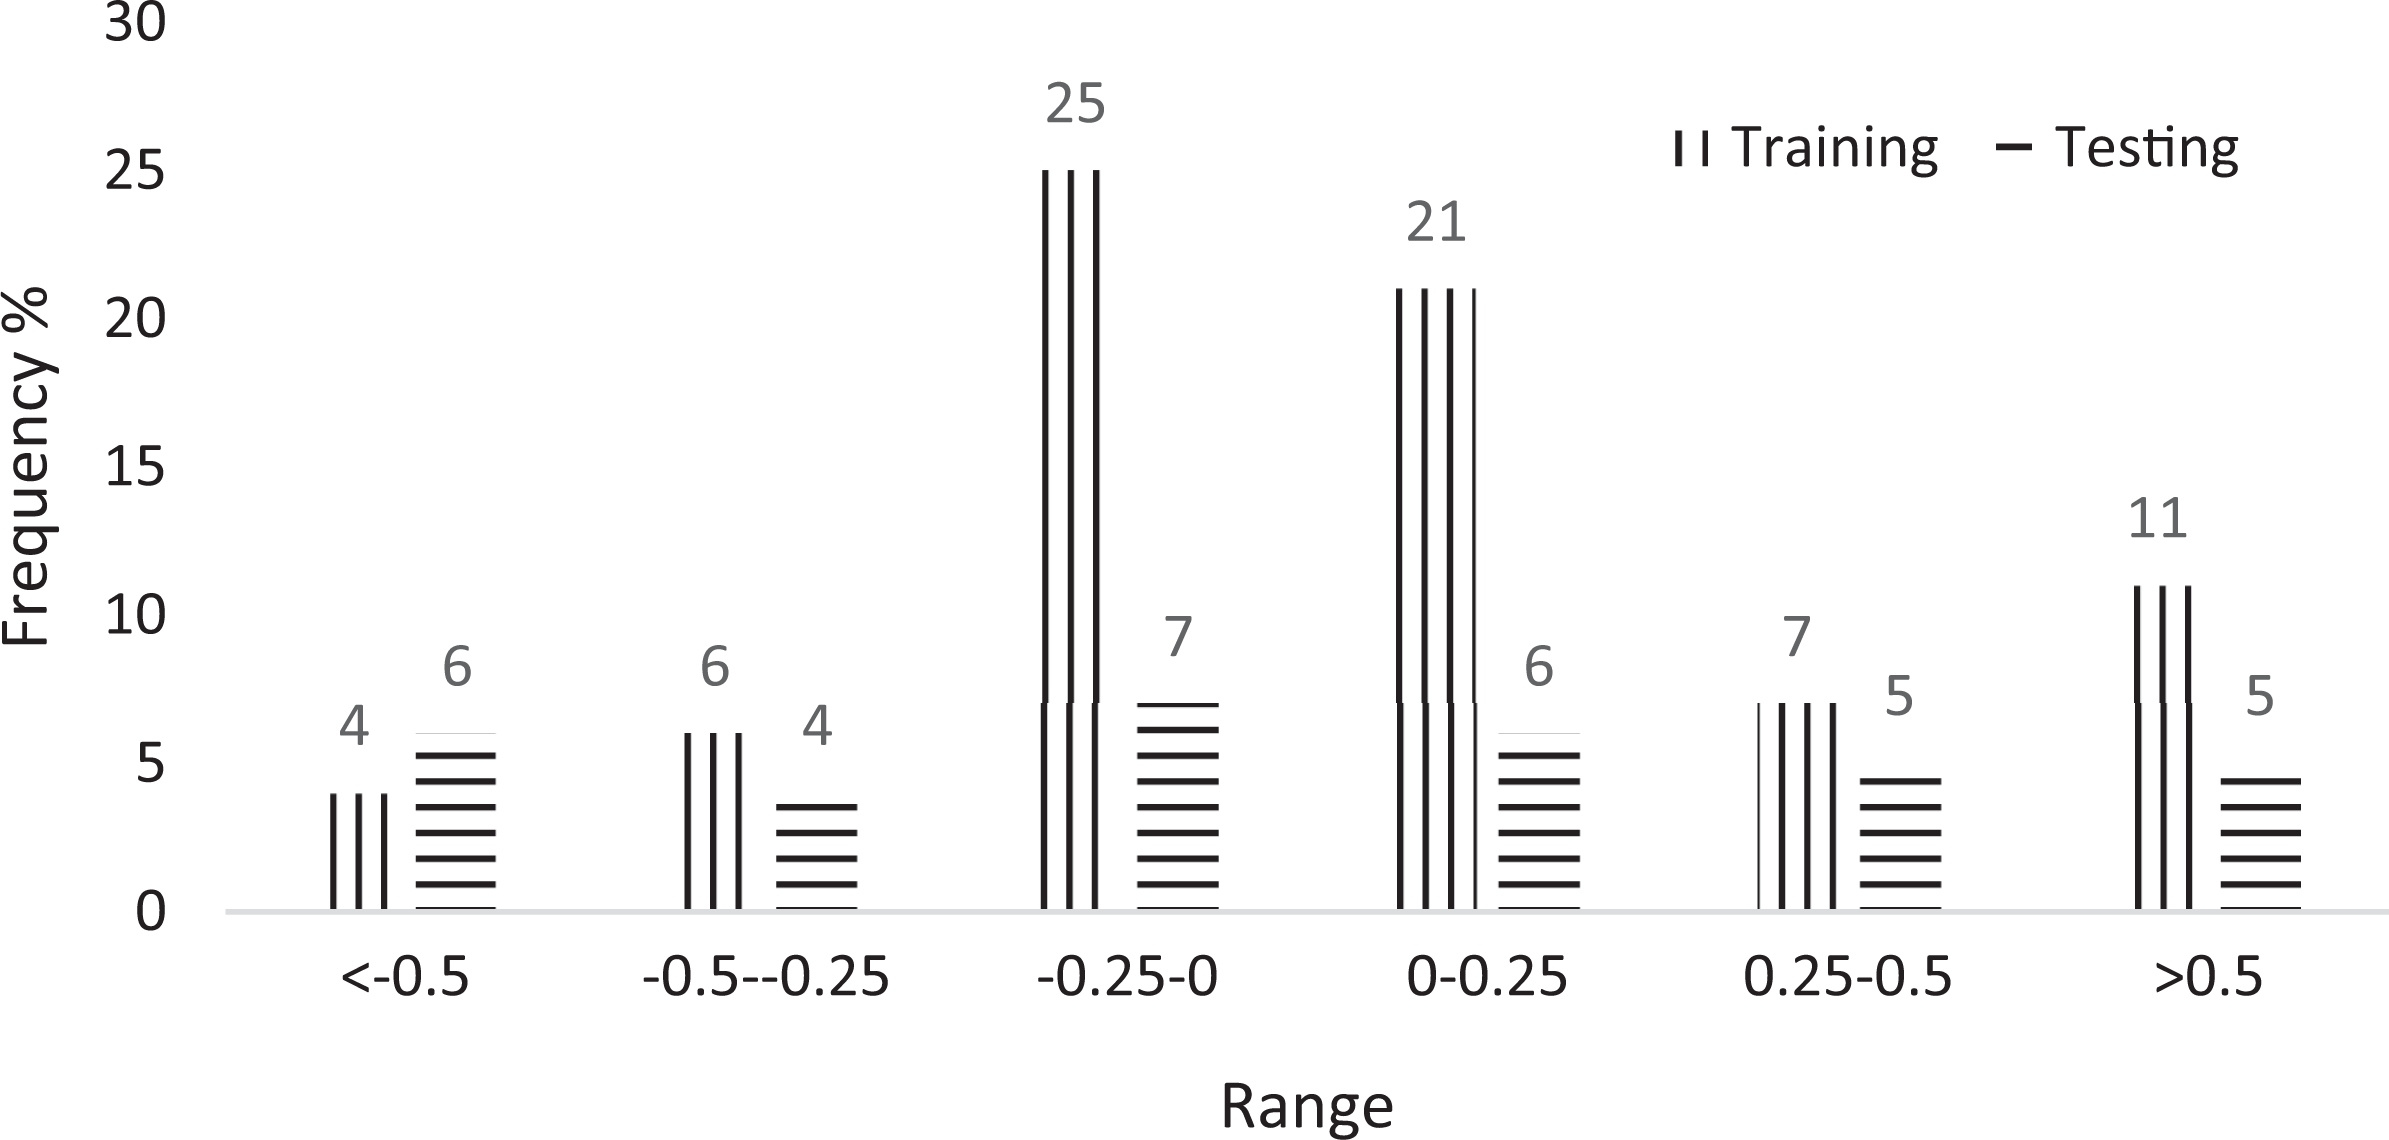
DR value for the model developed based on the ANN model.
In a similar way to FCC, REPTree model was also tested with DR values, and the results of over- and underestimation are shown in Figure 12. The DR values for over- and underprediction follow the pattern of FCC.
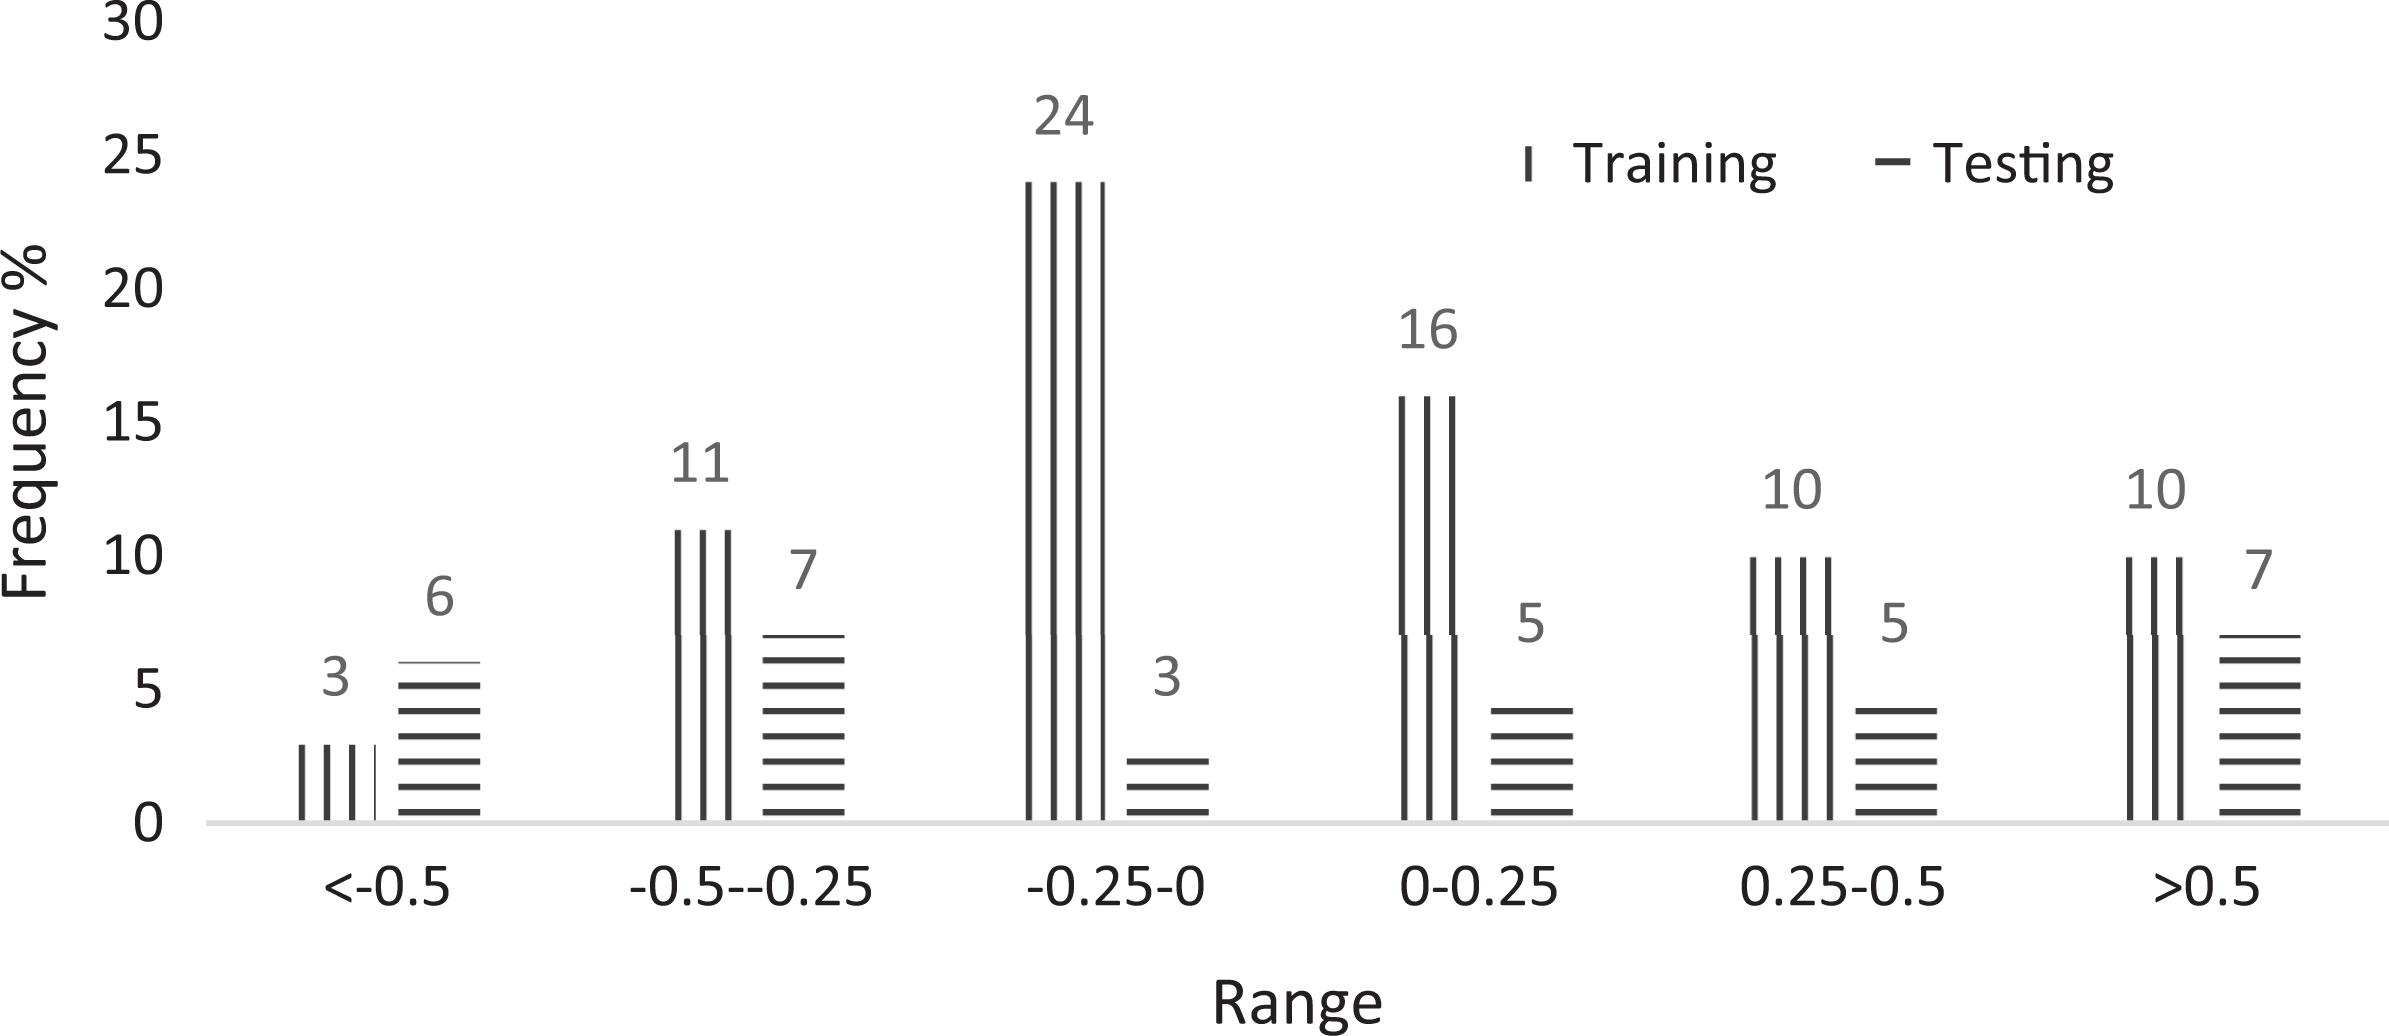
DR value for the model developed based on REPTree model.
Conclusion
The hydration properties of RS-based mineral slabs were experimentally tested as per ASTM D1037 which created 109 datasets. The FCC and REPTree were used as expert systems to predict the TS from the datasets. Based on the experiments and prediction, the following conclusions are made: The RS slabs manufactured by excluding additives absorbed more water than the commercial slabs. This problem can be overcome by painting the surface with inexpensive hydrophobic paints, such as silicone and siloxane, which may not increase the weight of the boards. Since the boards offered equivalent mechanical properties, the usage of additives may corrode the screws and can be excluded. The FCC and REPTree models produced 95% and 89% accuracy, respectively. The FCC has produced a better prediction than the REPTree. However, the accuracy is still lower than the other models that predicted mechanical properties. The testing stage of DR showed an equal distribution between under- and overprediction, which indicates that the number of process parameters should be increased in the input stage. Moreover, it is also essential to establish the most and least significant process variable affecting TS.
Based on our results, FCC may be used as a tool to predict the TS of natural fiber-based cementitious slabs to reduce the development cost and time. However, for other cementitious products, the datasets need to be created.
Footnotes
Authors’ Note
Dr. Senthilkumar Krishnasamy is now affiliated to Department for Automobile Engineering, SNS College of Technology, Coimbatore, Tamil Nadu, India.
Funding
The author(s) received no financial support for the research, authorship, and/or publication of this article.