
Abstract
Multiscale modelling and simulations, based on molecular dynamics (MD) and object-oriented finite element method (OOFEM), are two important simulation tools to predict property enhancement of polymer nanocomposites for designing armor-type components in requisite applications. In this study, MD simulation software (Materials Studio) is used to develop 0.5%, 1%, 2%, 3%, and 4% (by weight) single-layer graphene (SLGR)-reinforced thermoplastic polyurethane (TPU) nanocomposites to find out their mechanical properties (mainly elastic moduli and Poisson’s ratio) using constant strain method. OOFEM simulation software (OOF2) is used for mechanical characterization of 0.5%, 3%, and 4% (by weight) SLGR-reinforced TPU nanocomposites from scanning electron microscopy–generated microstructures. Properties obtained from both the simulations are compared with experimental results to know the nanoreinforcement effect in atomic level as well as in microlevel in the nanocomposites. It is observed that the results based on OOF2 simulation are closer to the experimental results compared with the results obtained from MD simulation in this multiscale modelling and simulation study.
Keywords
Introduction
Nanoscale composites, or nanocomposites, are composite materials in which the matrix material is reinforced by one or more separate nanomaterials that are of dimensions in the nanometer range. When compared with conventional composite materials, nanocomposites exhibit better physical and mechanical properties with a high reinforcement efficiency. 1,2
Novoselov et al. showed that, in the last two decades, graphene has been found to be a promising reinforcement material to replace carbon nanotube (CNT), carbon, and Kevlar® fiber, presently used in protection technology. 3 –5 Geim and Novoselov showed that a graphene sheet is a two-dimensional (2D) structure consisting of carbon atoms bonded by sp2 hybridized electrons. 6 The carbon atoms are arranged in a hexagonal pattern with the shortest distance of 1.42 Å between atoms with a bond angle 120°, and the neighboring layers are separated by the vander Waals distance (0.335 nm; the thickness of graphene is assumed to be 0.335 nm). 7 Ghosh et al. conducted experimental studies on single-layer graphene (SLGR) and showed that SLGR can present a high thermal conductivity of 4600 W (mK)−1. 8,9 Liu et al. 10 observed that graphene-based polymer composites form a new class of lightweight super-strong functional materials in structural applications. In recent times, researchers have focused on using different polymer matrices for making nanocomposites. Thermoplastic elastomer (TPE) is one of the most important developments in the area of matrix material for nanocomposites application in polymer science and technology. TPE is found to be a good candidate for broad industrial application area including footwear, automotive, sporting goods, and medical devices in the form of sheets, films, or profiles. 11 TPE may be classified into two groups: (1) block copolymer and (2) blends. Block copolymers are subdivided into two groups: (a) styrene block copolymers such as styrene butadiene styrene (SBS), styrere-isoprene-styrene (SIS), and styrene ethylene butylene styrene (SEBS) and (b) multiblock copolymers or engineering block elastomers such as thermoplastic polyurethane (TPU), polyester, and polyamide. Blends may be olefin type or other materials.
Lee et al. 12 observed that TPEs are linear block copolymers with glassy plastic and rubbery microdomains with good tribological properties, higher load-bearing capacity, superior impact resistance, and better weight reduction. Pach et al. 13 showed that TPEs are the new special type of polymer-based matrix material for the ballistic resistance application. Khan et al. 14 examined that TPUs are the most versatile plastic materials with very high ductility and good stress–strain recovery when stretched or compressed beyond the elastic limit. Therefore, the addition of graphene layer into TPUs can produce a next-generation composite material for use in protection-type structural applications. Traditional experimental works are costly and lengthy process to characterize polymer nanocomposites at the initial stage. Therefore, multiscale modelling and simulations are the available tools to characterize nanocomposite from nanolevel to bulk level. Nanoscale continuum modelling methods are divided into three categories: (a) unit cell (UC) method, (b) representative volume element (RVE) method, and (c) image-based object-oriented finite element method (OOFEM). OOFEM is a public domain finite element analysis software created at the National Institute of Standards and Technology (NIST) to investigate nanocomposite materials. In 1990, object-oriented finite element analysis tools were developed in NIST. There are three versions of OOFEM available, namely OOF1, OOF2, and OOF3D. Dong and Bhattacharyya 15 applied OOF2 for predicting properties of polypropylene/organoclay nanocomposites using scanning electron microscopy (SEM) and transmission electron microscopy images. Bakshi et al. 16 utilized OOF2 to compute the thermal conductivity of plasma-sprayed Al–12 wt% Si containing 10 wt% multiwall CNTs. Sharma et al. 17 examined thermal conductivity, thermal expansion coefficient, and modulus of elasticity for the interpenetrating phase composites of Ni/Al2O3 using OOFEM. Patel et al. 18 used OOF2 to study the structure–property relationships of AlN–TiN composites. It is found that compressive stresses are associated with the microstructure, and these stresses are largest at the interface of the AlN–TiN phases. Patel et al. 19 worked to predict the thermal and mechanical properties of Al–MgO composites. Bheemreddy et al. 20 studied the failure behavior of a continuous fiber-reinforced ceramic matrix composite using OOF2. A multiscale modelling framework is developed for evaluating damage at the microlevel. A finite element mesh of the microstructure was generated using an object-oriented finite element analysis tool. Patel et al. 21 determined mechanical properties of bulk metallic glasses using OOF2 software. The determined modulus of elasticity from OOF2 was compared with the available experimental results from nanoindentation test. Sharma et al. 22 used OOFEM to investigate the thermal expansion behavior of SiC-reinforced aluminum matrix composites. Hussein and Chandrashekhara 23 presented to simulate and validate thermo-oxidation shrinkage and cracking damage of a high-temperature polymer composite. The microscale shrinkage deformation and cracking damage are simulated and validated using OOF2 and OOF3D simulations. For nanoscale atomistic modelling and simulations, molecular dynamic (MD) simulation is the best tool to characterize polymer nanocomposites. MD modelling and simulations of graphene-reinforced nanocomposite are mainly divided into three types: (a) packing modelling, (b) stacking modelling, and (c) interfacial modelling. In the nanolevel, the mechanical properties of graphene-reinforced nanocomposite system is characterized using packing model while considering the effect of weight fractions. Recently, some researchers have worked on the enhancement of various properties using MD modelling and simulations, for example, Sharma et al., 24 –26 Chawla and Sharma, 27 –29 and Li et al. 30,31 used MD to predict the mechanical, thermal, and tribological properties of polymer nanocomposites. The above studies confirmed the promising role of nanoscale reinforcement by SLGR in TPE. These studies motivated the present authors to investigate the effect of different graphene weight percentages on enhanced properties of TPE nanocomposites. Previous pioneer research works of polymer nanocomposites are based on an experimental work. 32 –36 To the best of the authors’ knowledge, this will be the first investigation on the effect of nanoreinforcement (i.e. weight fraction) in graphene-reinforced TPE nanocomposites using MD simulation method, OOFEM, and experimental method with comparisons.
Materials and methods
MD simulation method
MD simulation of SLGR
To build the crystal model of graphene, the model from the material database of Materials Studio software (Materials Studio 2017) is imported. Several graphene supercells are developed from 1*1 (2 atom) supercell crystal to study mechanical properties of the graphene atomic structure. Previous graphene structures of C200, C288, C392, and C512 types have been considered for this work and are shown in Figure 1(a) to (d), respectively. The dimensions of C288 type supercell are a = 30 Å, b = 30 Å, and c = 60 Å, with lattice angles of α = β = 90° and γ = 120°. In this study, all the graphene sheets used have the same aspect ratio of 1:1.
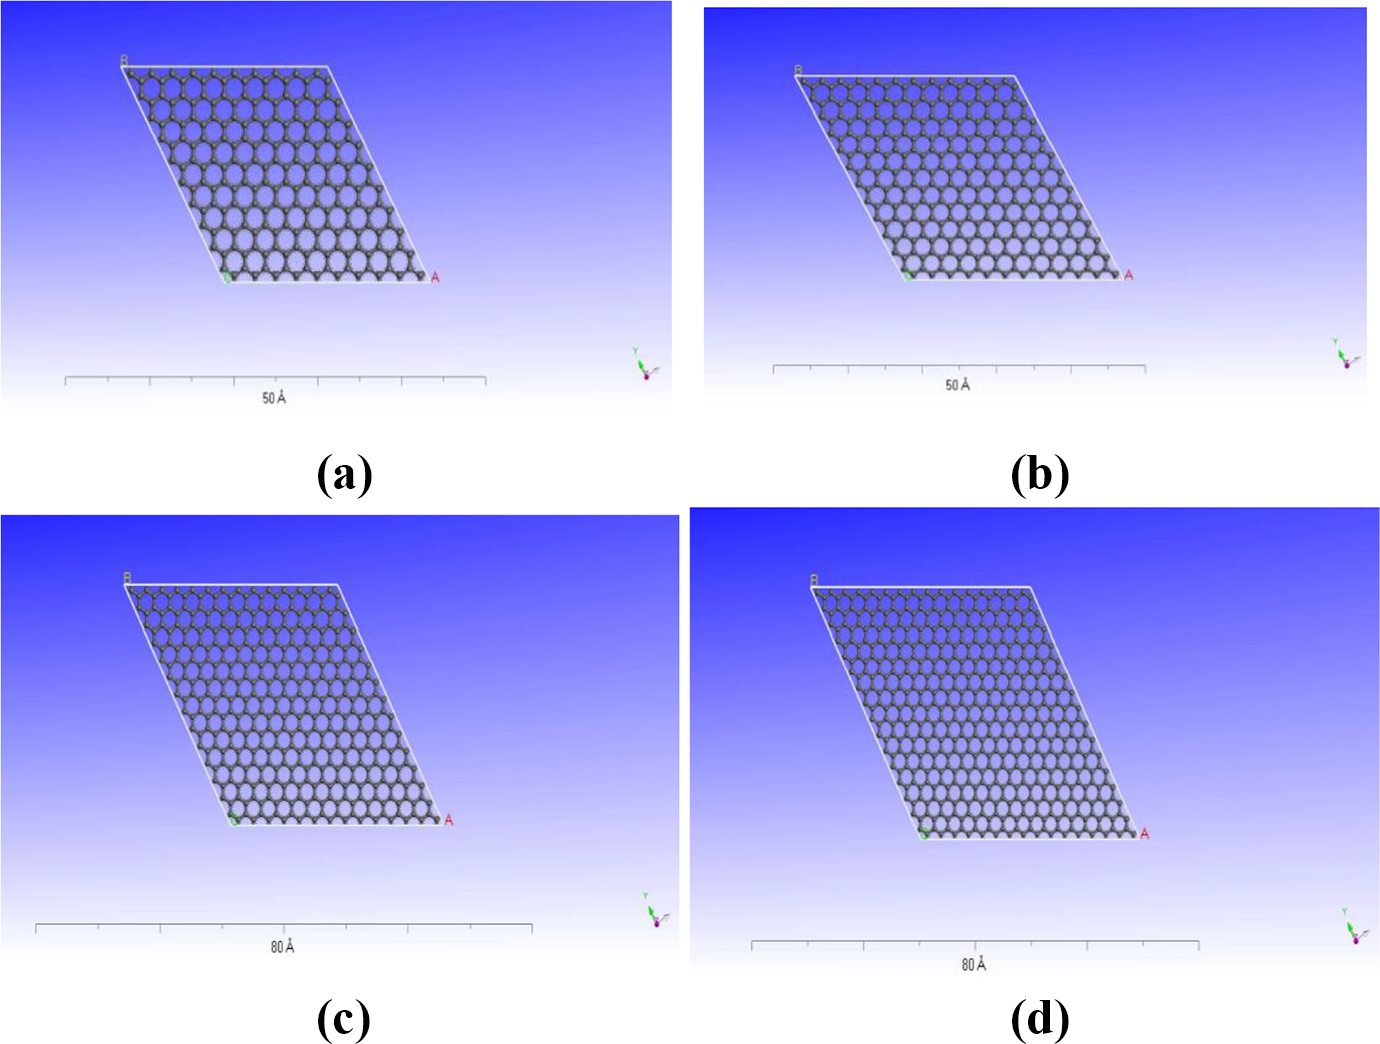
Effect of atomic supercells sizes of graphene: (a) 10 × 10 (200 atoms) supercells, (b) 12 × 12 (288 atoms) supercells, (c) 14 × 14 (392 atoms) supercells, and (d) 16 × 16 (512 atoms) supercells.
In order to maintain a supercell structure in the most stable condition within the crystal, energy minimization method is employed. This is followed by a dynamic system equilibration under Canonical ensemble (NVT) for a predetermined dynamic time. Dynamic time for simulated atomic structures is proportional to the number of atoms included in each supercell. A dynamic step of 0.1 femtosecond (fs) and a 100 kcal/mol energy deviation are kept constant for all graphene-conducted simulations. The atomistic structure with stress-free configuration was obtained by performing an isobaric–isothermal (NPT) ensemble with time increments at 1 fs for 100 picoseconds (ps; the total iteration steps are 100,000) until the potential energy reached a stable value. The final structure so derived had a density of 2.24 g/cc. It was found experimentally that perfectly stacked and aligned graphene sheets have a density close to that of crystalline graphite (2.267 g/cc). In this simulation, COMPASS force field was used.
MD simulation of TPU
The model of TPU repeat unit is made using the Materials Studio software as shown in Figure 2. The number of repeat units (n) is so selected that one can look at the different effects of size and chain length on the bulk properties. To estimate the density of the material for an infinite chain length, different amorphous polyurethane models were placed in a cubic periodic box using the Amorphous Cell module of the software.
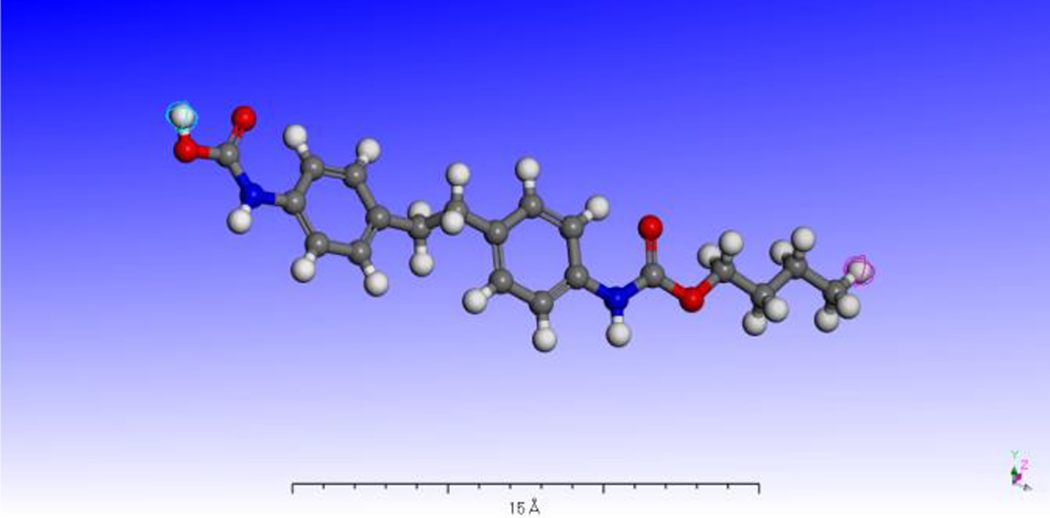
Three-dimensional model of repeated unit for thermoplastic polyurethane in Materials Studio.
The amorphous polyurethane bulk models were generated at a very low initial density of 0.35 g/cm3. At the end of the equilibrations, the density of the polyurethane samples was stabilized at an average density of 0.95 g/cm3 as shown in Figure 3.
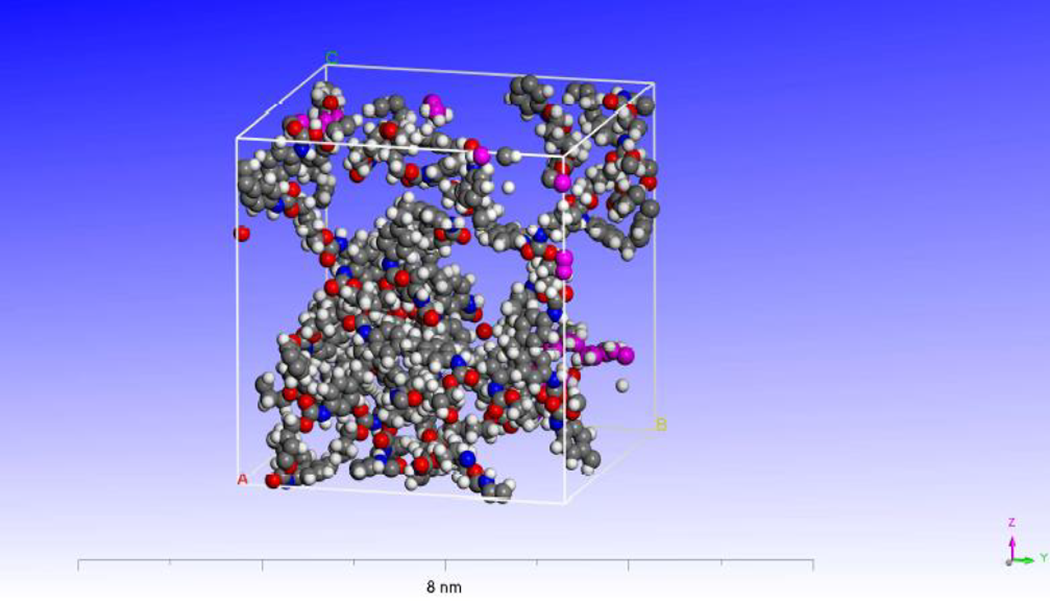
Crystal structure of polyurethane model in Materials Studio.
The equilibrated molecular structure of TPU with minimized energy was accomplished by sequentially performing the NVT ensembles in the MD simulation, with a time increment of 1 fs. The NVT ensemble was conducted to supply enough kinetic energy to the TPU molecules so that a homogeneous molecular structure within the simulation box could be achieved. A strategy called “anneal dynamics” was carried out to find the global minimum. To get an equilibrium molecular model, the TPU full atomic model is heated to 600 K with a 25 K increment (100,000-fs run with a 0.1-fs time step for each 25 K), followed by cooling down process to room temperature (glass temperature of TPU is −27°C and melting temperature of TPU is 194.8°C). The structure was allowed to relax in an NPT ensemble at a temperature of 300 K and a pressure of 1.0 atm for a duration of 500 ps with a time step of 1 fs to achieve an accurate and stable stress-free structure. Subsequently, the NPT ensemble was performed for 500 ps for all the amorphous polyurethane models to achieve a stress-free state. The NPT dynamics allows for relaxation of the cell parameters and angles in order to obtain a reasonable equilibrated structure finally. In the NPT dynamic run, the density increases gradually by reducing the lattice parameter of the UC but keeping the axes (α = β = γ = 90°) orthogonal to each other. It is important to note that the density observed from the equilibration phase may differ from experimental density of TPU (1.00–1.12 g/cm3). In order to investigate the mechanical properties of the TPU chains on a molecular level, the simulated structures were subjected to a constant-strain field under the Forcite module using COMPASS force field.
MD simulation of graphene-reinforced TPU (Gr/TPU) nanocomposite
The amorphous module packing option in the Materials Studio is used to construct a dispersion model of Gr/TPU UC containing 0.5%, 1%, 2%, 3%, and 4% of graphene by weight. The spacing between graphene and polyurethane matrix is less than 3 Å for all the cases. Periodic boundary condition is applied in all directions of the dispersion model UCs. These UCs were first optimized geometrically using the smart algorithm that is a combination of steepest descent, conjugate gradient, and Newton–Raphson method in order to achieve the stable initial structural configuration. During geometry optimization, an energy convergence tolerance of 1.0 e−4 kcal/mol and a force convergence tolerance of 0.0001 kcal/mol/Å are applied for obtaining the global minimum energy configuration for the model. The composite unit is first equilibrated at an NVT ensemble for 100 ps, followed by thermal annealing procedure at a constant volume, where the system is heated to 600 K, equilibrated at 600 K for 20 ps, and then cooled to 300 K. In the NVT ensemble, the graphene sheet was fixed at its original position throughout the simulation. The reason behind this is to relax the chains of the polymer structure to an equilibrated structure without changing the graphene structure. The NVT ensemble was conducted at 300 K for 100 ps, the purpose of which was to supply enough kinetic energy to the polymer molecules so that a homogeneous molecular structure within the simulation box could be achieved. Subsequently, the NPT ensemble was maintained at 1 atm in order to achieve a stress-free state. The structure was allowed to relax at in an NPT ensemble at a temperature of 300 K and a pressure of 1.0 atm for a duration of 100 ps with a time step of 1 fs to attain an accurate and stable structure. This is done before calculating the mechanical properties of the system (0.5% Gr/TPU) as shown in Figure 4. This stage generates a profile of density, volume, energy, pressure, and temperature, versus time at 300 K for final equilibrated structures. These quantities fluctuate initially around their averages but gradually become constant over time, thus confirming the most stable configuration with a minimum initial stress of the molecular structure. The objective was to equilibrate the internal pressure of the system to obtain a stable volume.
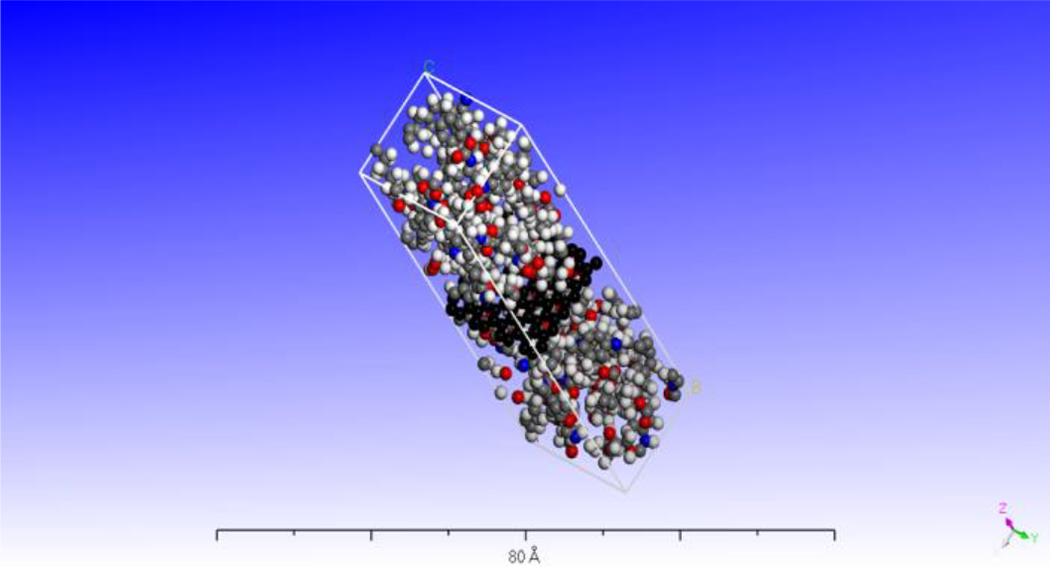
Crystal structure of 0.5% Gr/TPU nanocomposite model in Materials Studio.
In the equilibrium stage, the graphene atoms were constrained in such a way that all the dynamic run applied in the z-direction had no effect on bulk graphene structure. The density was gradually increased by reducing the lattice parameter of the dispersion model UC by adjusting the cell dimension in the z-direction while keeping the axes (α = β = γ = 90°) orthogonal to each other. The nonconstrained polymer parts were compressed in such a way that the density of the nanocomposites increased nearly to the estimated experimental values of 1.3 g/cc.
Object-oriented finite element method
There are three finite element modelling and simulation methods available to characterize nanocomposites, namely (i) RVE method, (ii) UC method, and (iii) OOFEM. There are some limitations in RVE and UC methods for the nanocomposites, for example, complex geometrical shape of the reinforcement and assembly of all units in nanocomposites. On the other hand, open-source image-based finite element software OOF was developed by NIST to characterize material properties using the SEM-generated microstructure of the nanocomposites. OOF can easily characterize the elastic deformation. However, for the plastic deformation simulation, the meshes of nanocomposites are imported into the Abaqus software (Abaqus 6.19) and the elastoplastic analysis is conducted. There are three versions of OOFEM available, namely OOF1, OOF2, and OOF3D. Here OOF2 version has been used in which the image segmentation utilizes pixel selection to assign the material properties of TPU matrix and graphene. The finite element mesh is created based on a skeleton feature in OOF2. The displacements on the left boundary of OOF models are fully constrained in this work. The tensile properties are predicted by calculating the resulting stresses obtained from sums of the boundary forces acting on the right boundary subjected to different strains.
Experimental method
1,4-Butanediol (BD) and polyol (1,2-EDO) were purchased from R.N.R. Scientific Co., Kolkata, West Bengal, India; 4,4′-Diphenylmethane diisocyanate (4,4′-MDI) was purchased from Sigma-Aldrich (>98.0% purity, CAS Number: 101-68-8, Product Number: 33428, Batch Number: BCBT8693) and used without any further purification. Graphene powders were purchased from Nano Partech, Chandigarh, India. Solvent solution (N-N-dimethylacetamide (DMAc)) was purchased from Patel Chem De Drugs, West Bengal, India. Catalyst (dibutyltin dilaurate (DBTL)) was purchased from Thermo Fisher Scientific, Heysham, Lancashire, UK. Polyurethane polymer matrices were prepared with the help of three major chemicals within solvent solution (DMAc) in the presence of the catalyst (DBTL). The three major chemical solutions are as follows: (i) 4,4′-MDI (the curing agent), (ii) 1,2-EDO, and (iii) change extender (1,4-BDO). Then, SLGR powder was added into the solution. Then, ultrasonication of the solutions was done by probe-type ultrasonicator (BANDELIN SONOPULS HD 2070) for 15 min with a frequency of 20 KHz. The resulting Gr/TPU solutions were heated in Acculab® hot plate in the presence of catalyst (DBTL) and left to dry under vacuum condition. TPU nanocomposites containing SLGR with the loading ratios from 0.5 wt% to 4 wt% were prepared using solution blending methods. Methanol (Sigma-Aldrich; 99.9% purity) and ethanol (Sigma-Aldrich; 99.5% purity) were used for cleaning the glassware. Finally, the cured solutions were left to dry in air at a room temperature on aluminum foil. The tensile samples were prepared by cutting the cured material as per the American Society for Testing and Materials (ASTM) D412 Standard for tensile testing and SEM study. Hot-pressed composite samples having a thickness of 1.9 mm were used for tensile testing, and the samples were stored under ambient conditions before the tests were carried out.
Results and discussions
Strength and deformation of the nanocomposites based on MD simulation
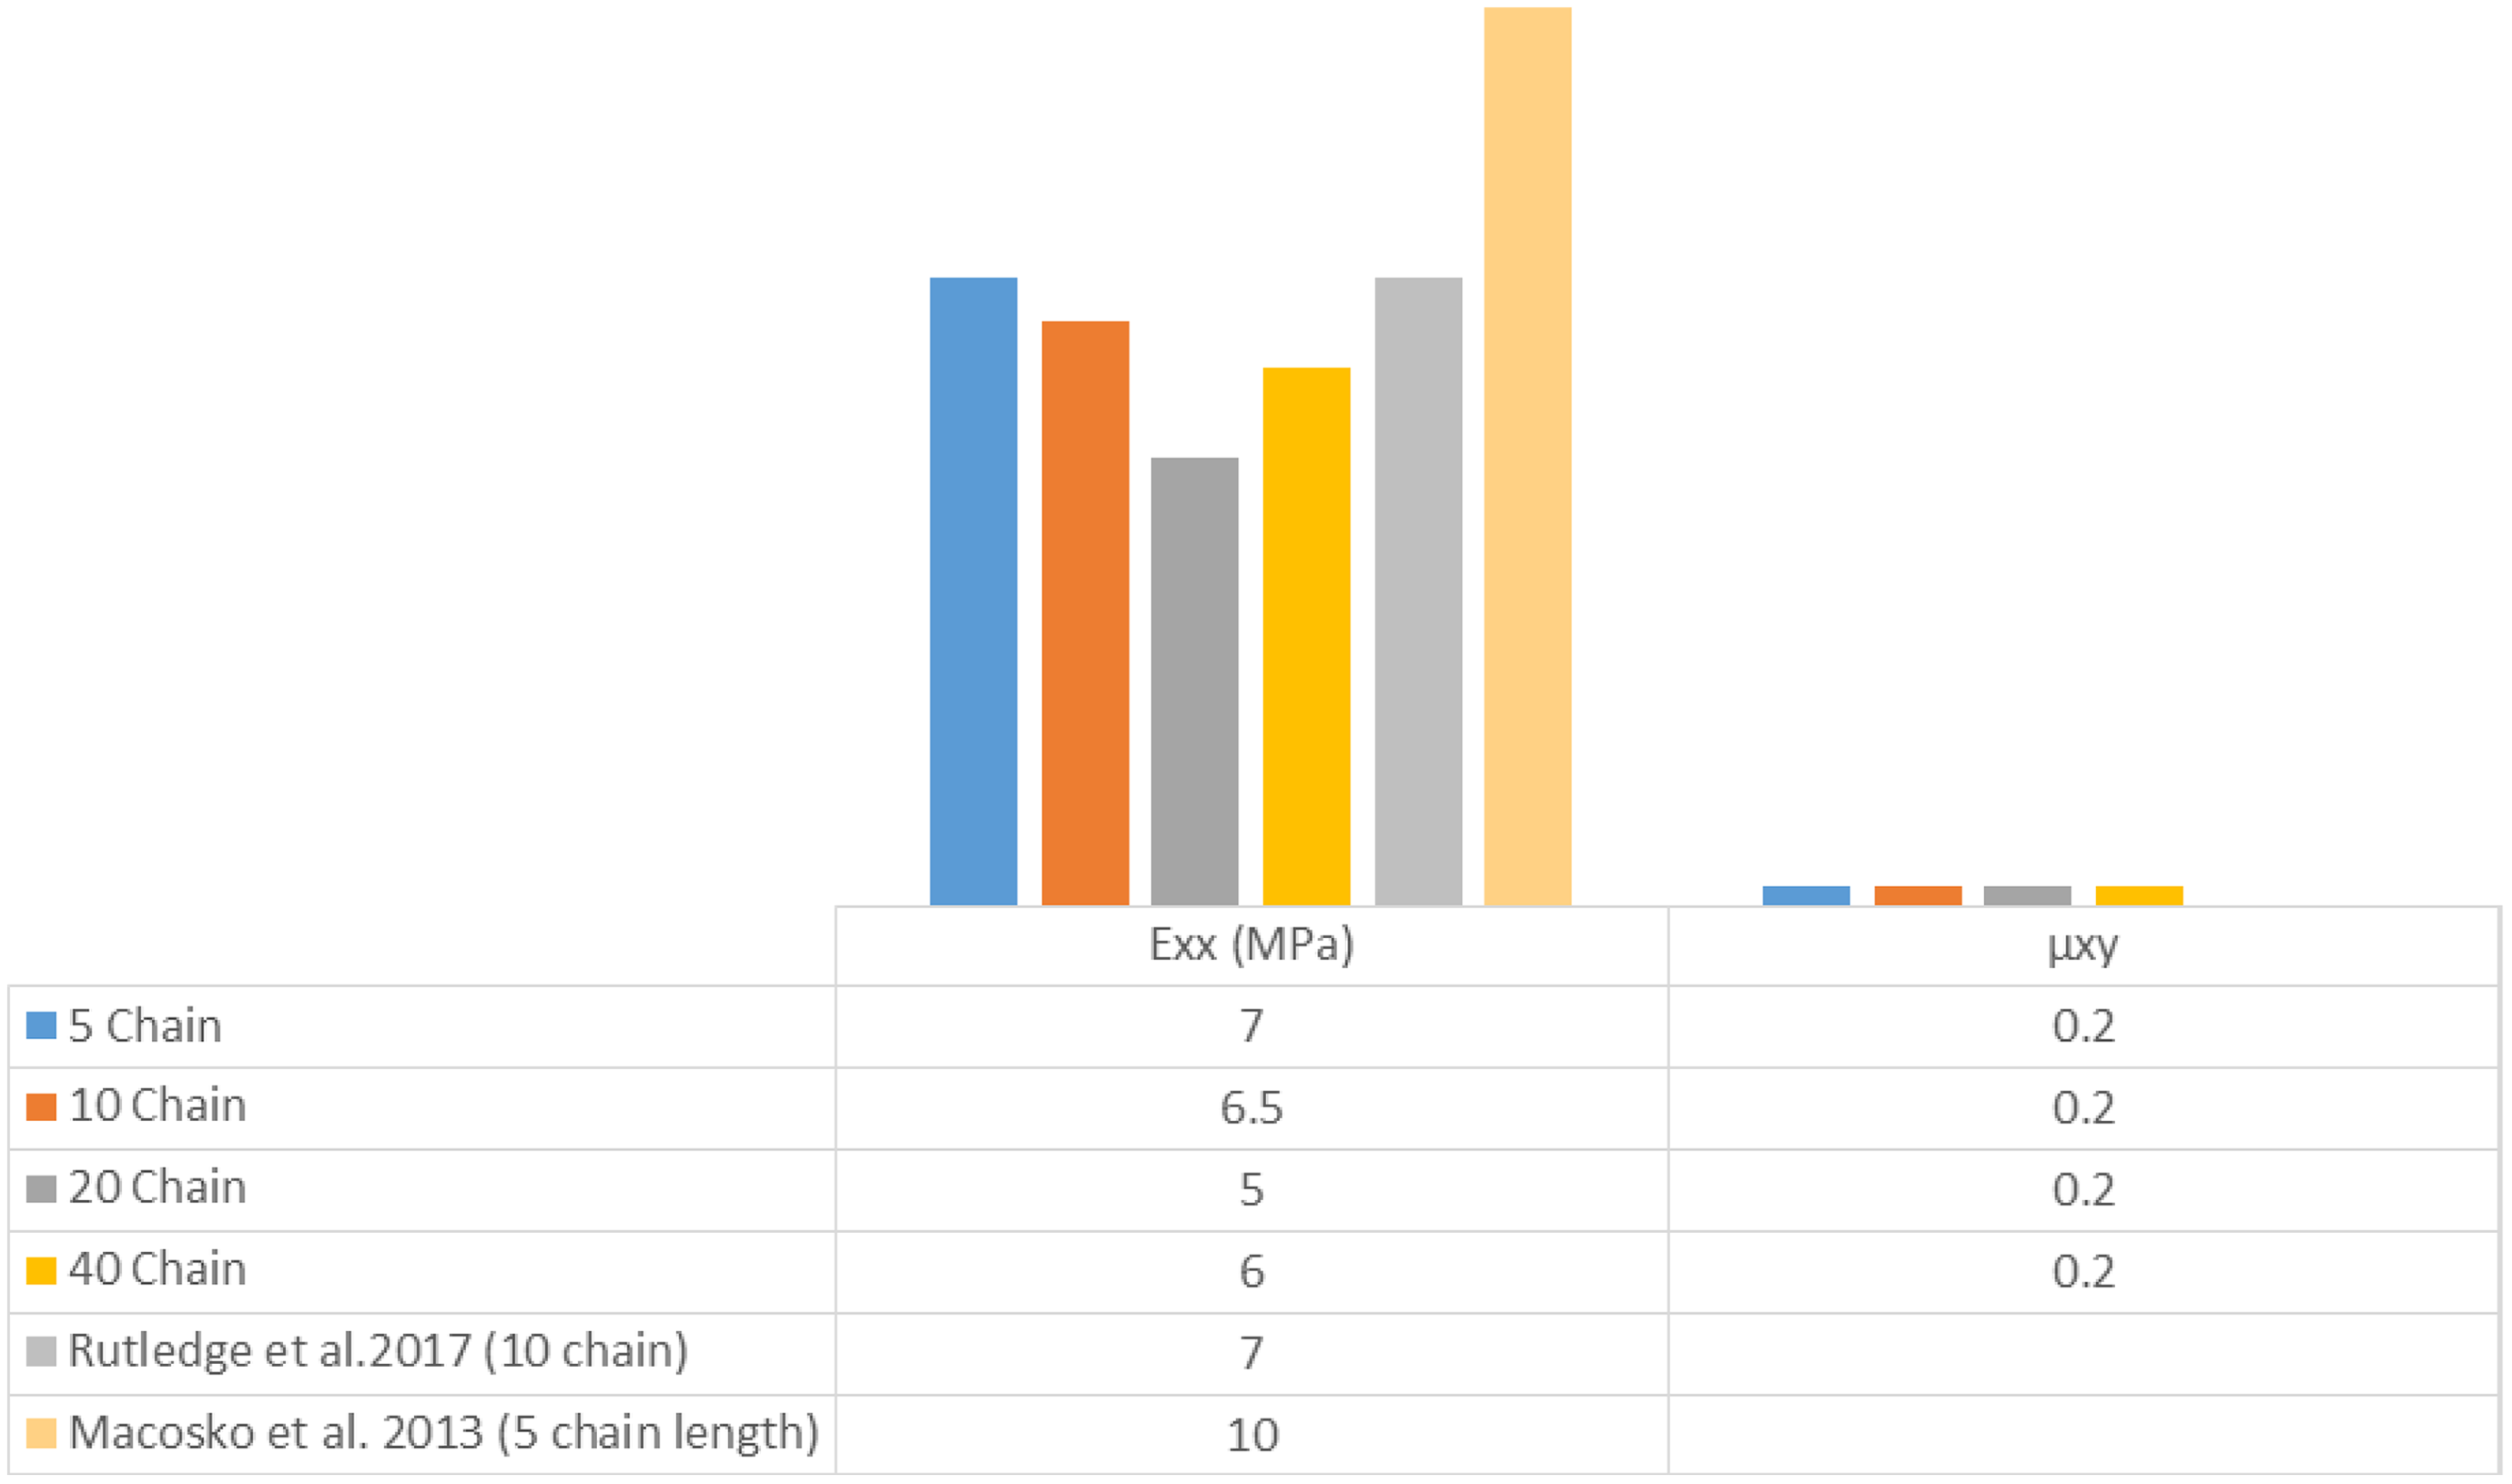
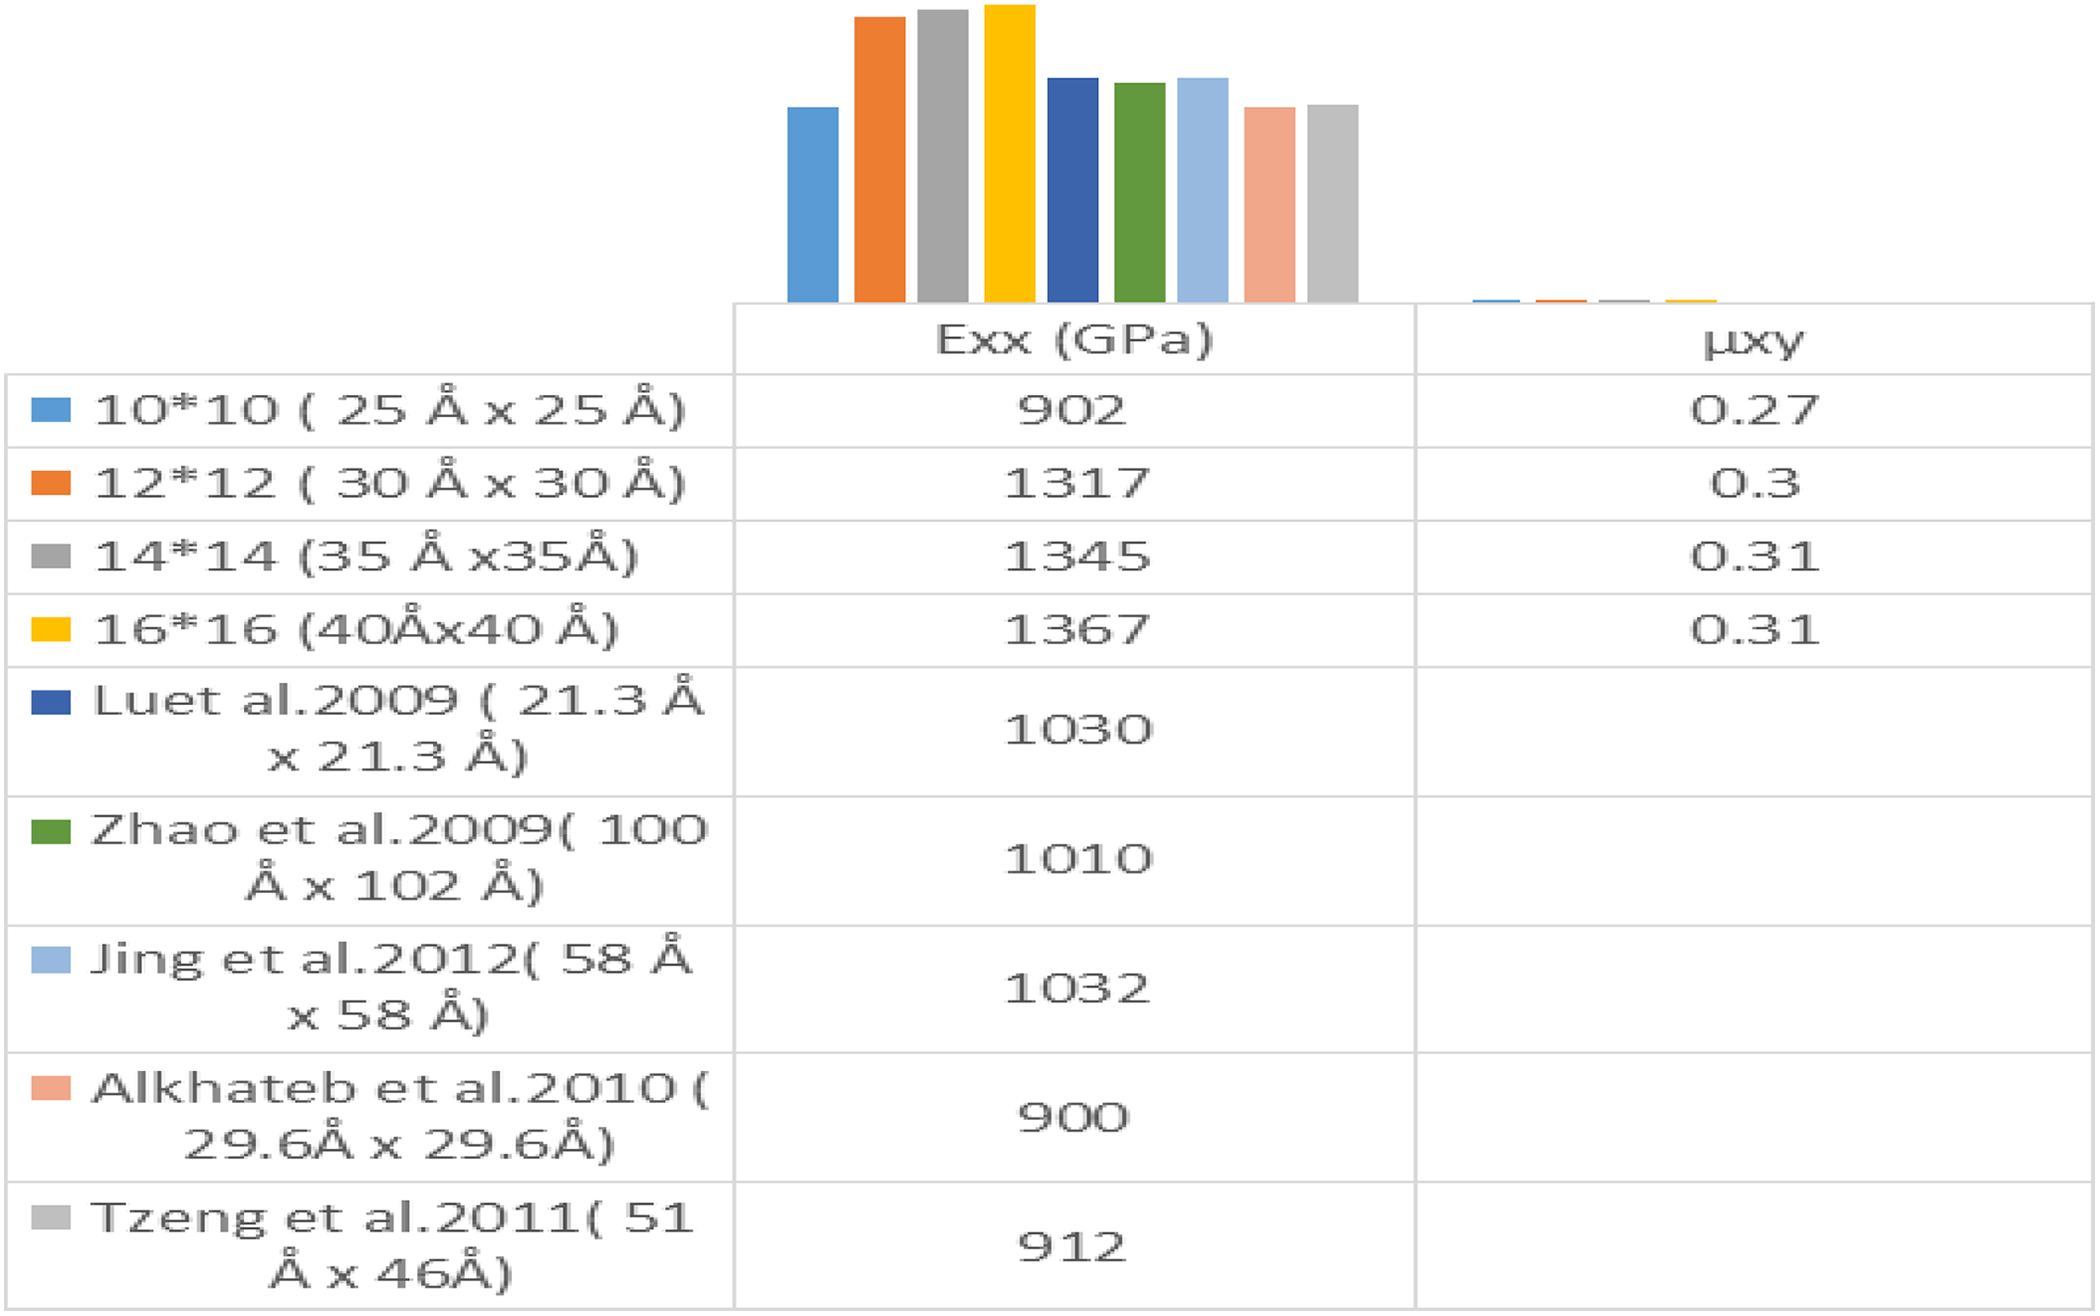
In this work, once the system is equilibrated, it was subjected to a uniaxial (+x) deformation of 0.01 Å. This was done in order to obtain a stress–strain response of the nanocomposite system using the Forcite module of MD to calculate the Young’s modulus and the shear modulus as shown in Table 1. The values of longitudinal modulus and transverse Young’s modulus (Exx and Eyy, respectively), Poisson’s ratio (µxy), shear modulus (Gyz), and bulk modulus (Kyz) for different supercell sizes are calculated as shown in Figure 5. Exx is observed to have higher values compared with Eyy confirming the anisotropic behavior of graphene, but Exx values are seen to be sensitive to the supercell size. Figure 5 shows the size dependence of the Young’s modulus (Exx). When there is an increase in graphene size (length) from 25 Å to 30 Å, Exx increases from 0.9 to 1.3 TPa, but this value remained constant at 1.3 TPa with a further increase in length. Simulation results in the form of properties of polyurethane such as Exx, Eyy, µxy, Gyz, and Kyz for different chain lengths are shown in Figure 6. It is interesting to note that due to an increase in the chain length, Exx value gets reduced. This is due to the increase in the number of atoms in the chain length, resulting in higher deformation of the chain. Corresponding shear moduli also exhibit a decreasing trend in general. Poisson’s ratio seems to have no bearing on the change in chain length. However, bulk modulus shows an increasing trend. For any small applied strain, the average stress developed in the system by the MD simulations can be interpreted using the Virial stress. The Virial stress components (σij) can be calculated from the Virial expression as shown below:
Effect of supercell sizes on elastic properties of SLGR obtained by MD simulations. SLGR: single-layer grapheme; MD: molecular dynamics.
Effect of chain length on elastic properties of TPU.
where Vol is the volume of the simulation box, mi is the mass of ith atom, vi is the velocity of ith atom, N is the total number of atoms, rij is the distance between ith and jth atoms, and fij T is the force exerted on the jth atom by the ith atom. The developed stress in the system due to applied unidirectional strain is represented as an average of all the principal stresses, that is, the hydrostatic stress. After every applied deformation, the hydrostatic stress is calculated in order to smoothen the stress–strain response. The Young’s modulus is also obtained from the slope of the linear region of the stress–strain curve as shown in Figure 7.
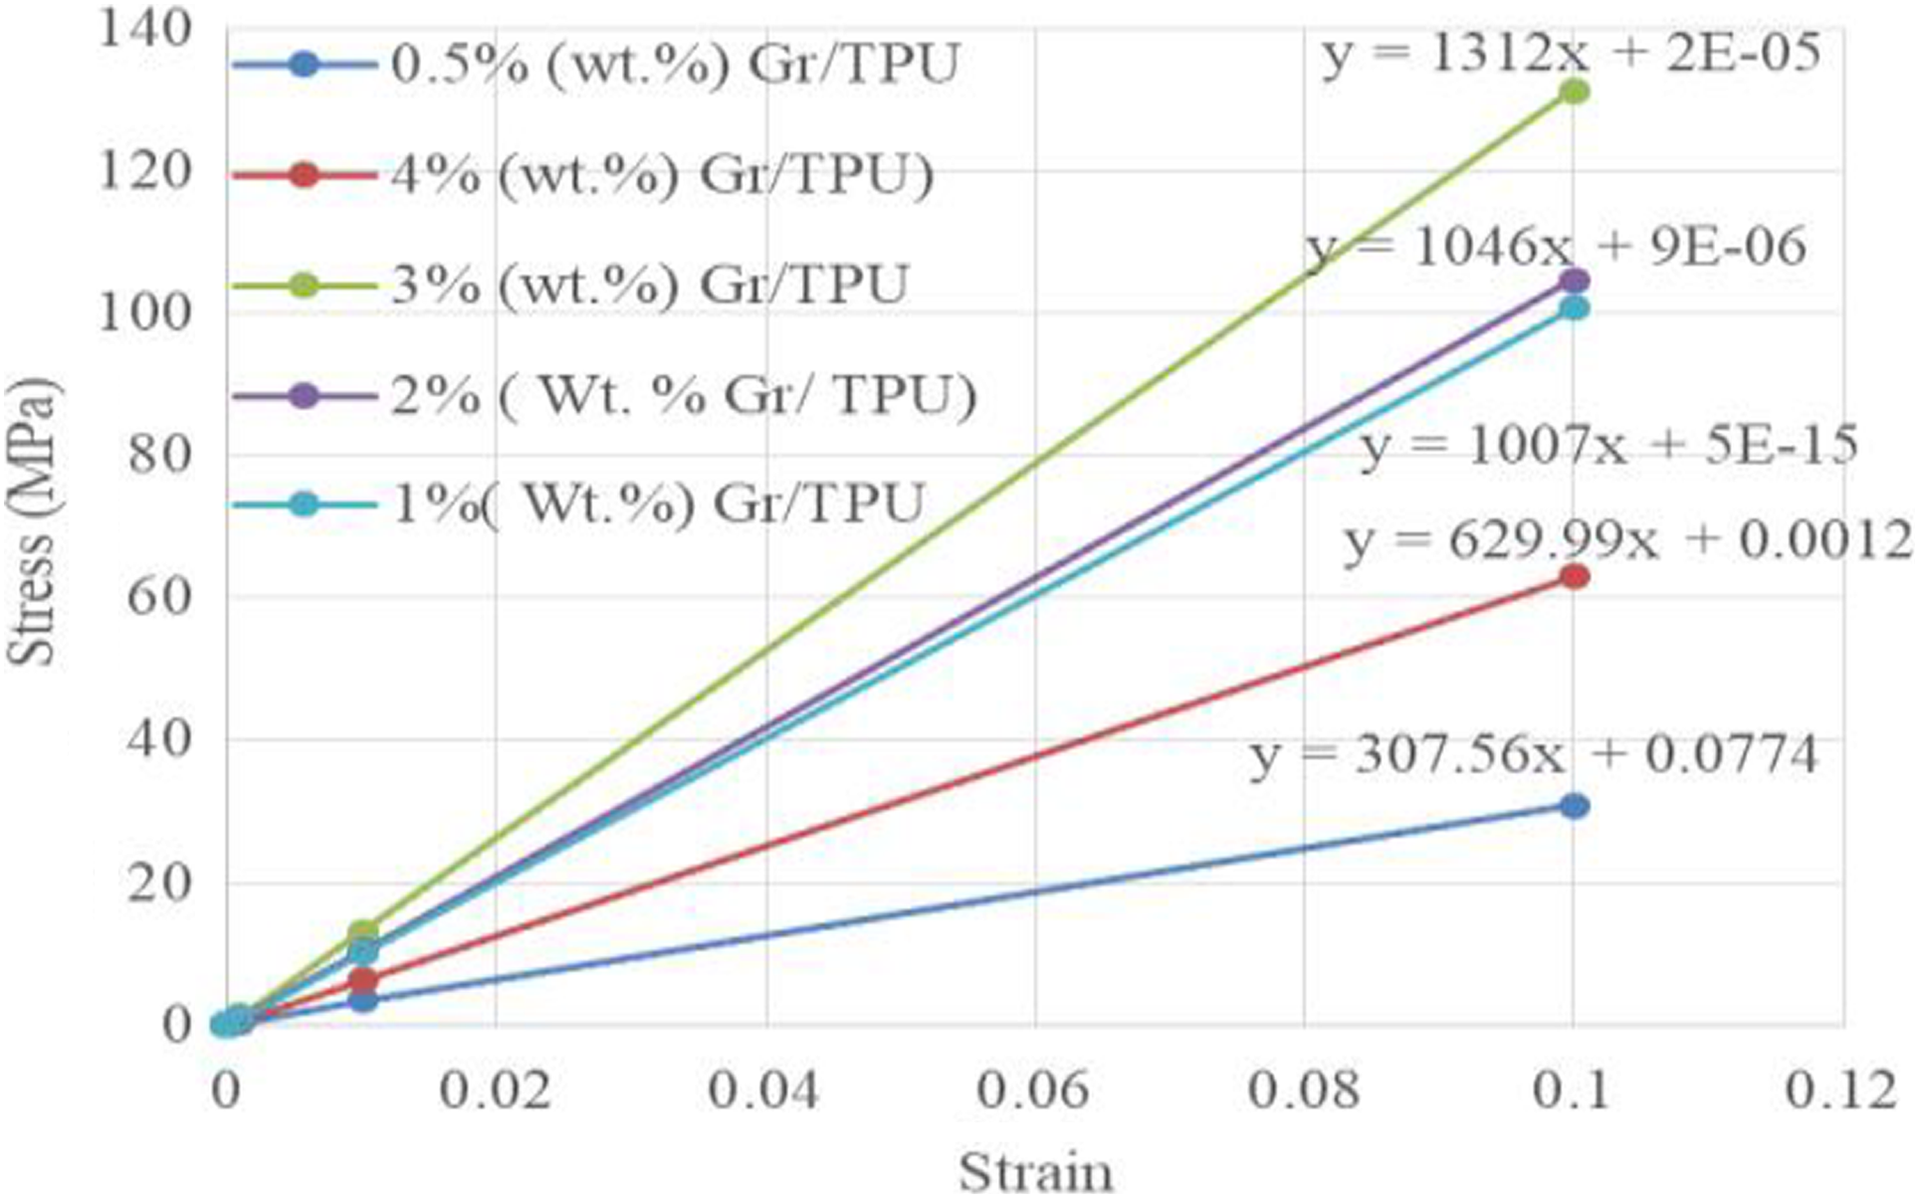
Stress–stain diagram of different wt% Gr/TPU nanocomposite based on MD.
Strength and deformation of the nanocomposite based on OOFEM simulation
OOFEM was used to investigate the mechanical behavior of 0.5%, 3%, and 4% (wt%) Gr/TPU nanocomposites. OOF2-based simulation was conducted after obtaining SEM (JSM-6390LV; JEOL, JAPAN)-generated micrographs which are shown in Figure 8(a) to (c), respectively. SEM was used to investigate the morphology of the dispersion state and agglomeration of the graphene particles in TPU matrix. According to morphological studies with SEM micrographs of the nanocomposites, formations of large agglomerates were observed for high weight percentage of graphene due to the weak interfacial adhesion between graphene and TPU. In addition, micrographs from SEM helped to get information on the effect of an increasing weight percentage of graphene on the mechanical properties of the Gr/TPU nanocomposites. Initially, the small distribution of graphene in TPU matrix shows homogenous dispersions of graphene as shown in Figure 8(a). It was found that further addition of graphene to the TPU matrix created larger agglomerations compared with the initial graphene as observed from the micrographs in Figures 8(b) and 6(c), respectively. The graphene particle sizes were observed to be 0.48, 3.02, and 6.78 μm from the micrographs for the 0.5%, 3%, and 4% graphene (by weight), respectively. The volume fractions of graphene within nanocomposite were nearly 7%, 20%, and 36%, respectively, which were obtained from the SEM micrographs; 2D modelling of SEM microstructure using OOF2 software involves many steps, namely import microstructure, pixel selection, skeleton formation, mesh generation, equation formation and boundary, and solve and analysis.
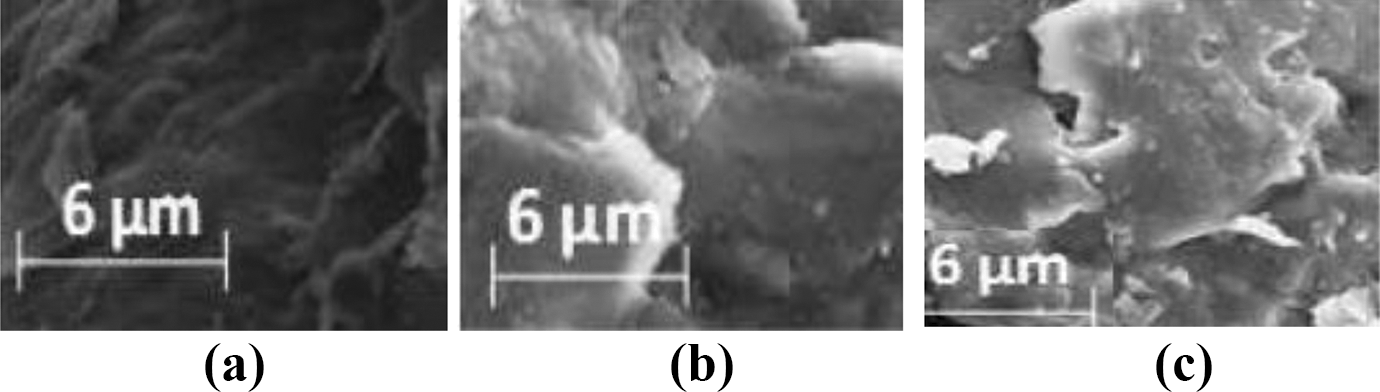
Captured SEM micrographs of Gr/TPU nanocomposites. (a) 0.5% Gr/TPU, (b) 3% Gr/TPU, and (c) 4% Gr/TPU.
After creating a microstructure, the OOF2 software is assigned materials to each pixel in the microstructure. In this research work, two materials, graphene and polyurethane, were created and assigned to the pixels in the corresponding pixel groups. Then, the material properties were added for the constituents (for TPU, density = 0.96g/cc, Young’s modulus = 0.02 × 10⁹ Pa, Poisson ratio = 0.22; and for graphene, density = 2.267g/cc, Young’s modulus = 13 × 1012 Pa, Poisson ratio = 0.146). The effects of the properties of interface were not considered in this work. Now, meshes were generated on the skeleton and refined as shown in Figure 9.
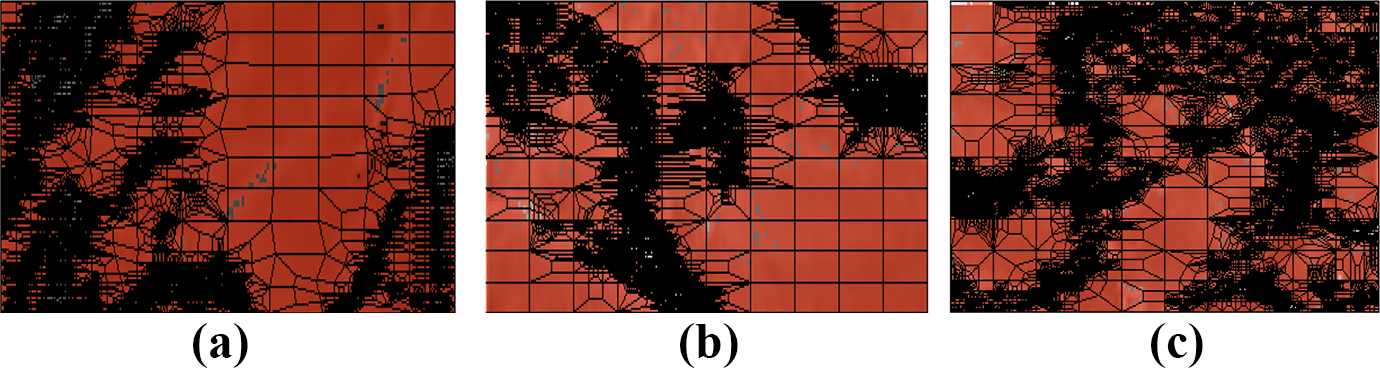
Formation of mesh after skeleton. (a) 0.5% Gr/TPU, (b) 3% Gr/TPU, and (c) 4% Gr/TPU. Gr/TPU: graphene-reinforced thermoplastic polyurethane.
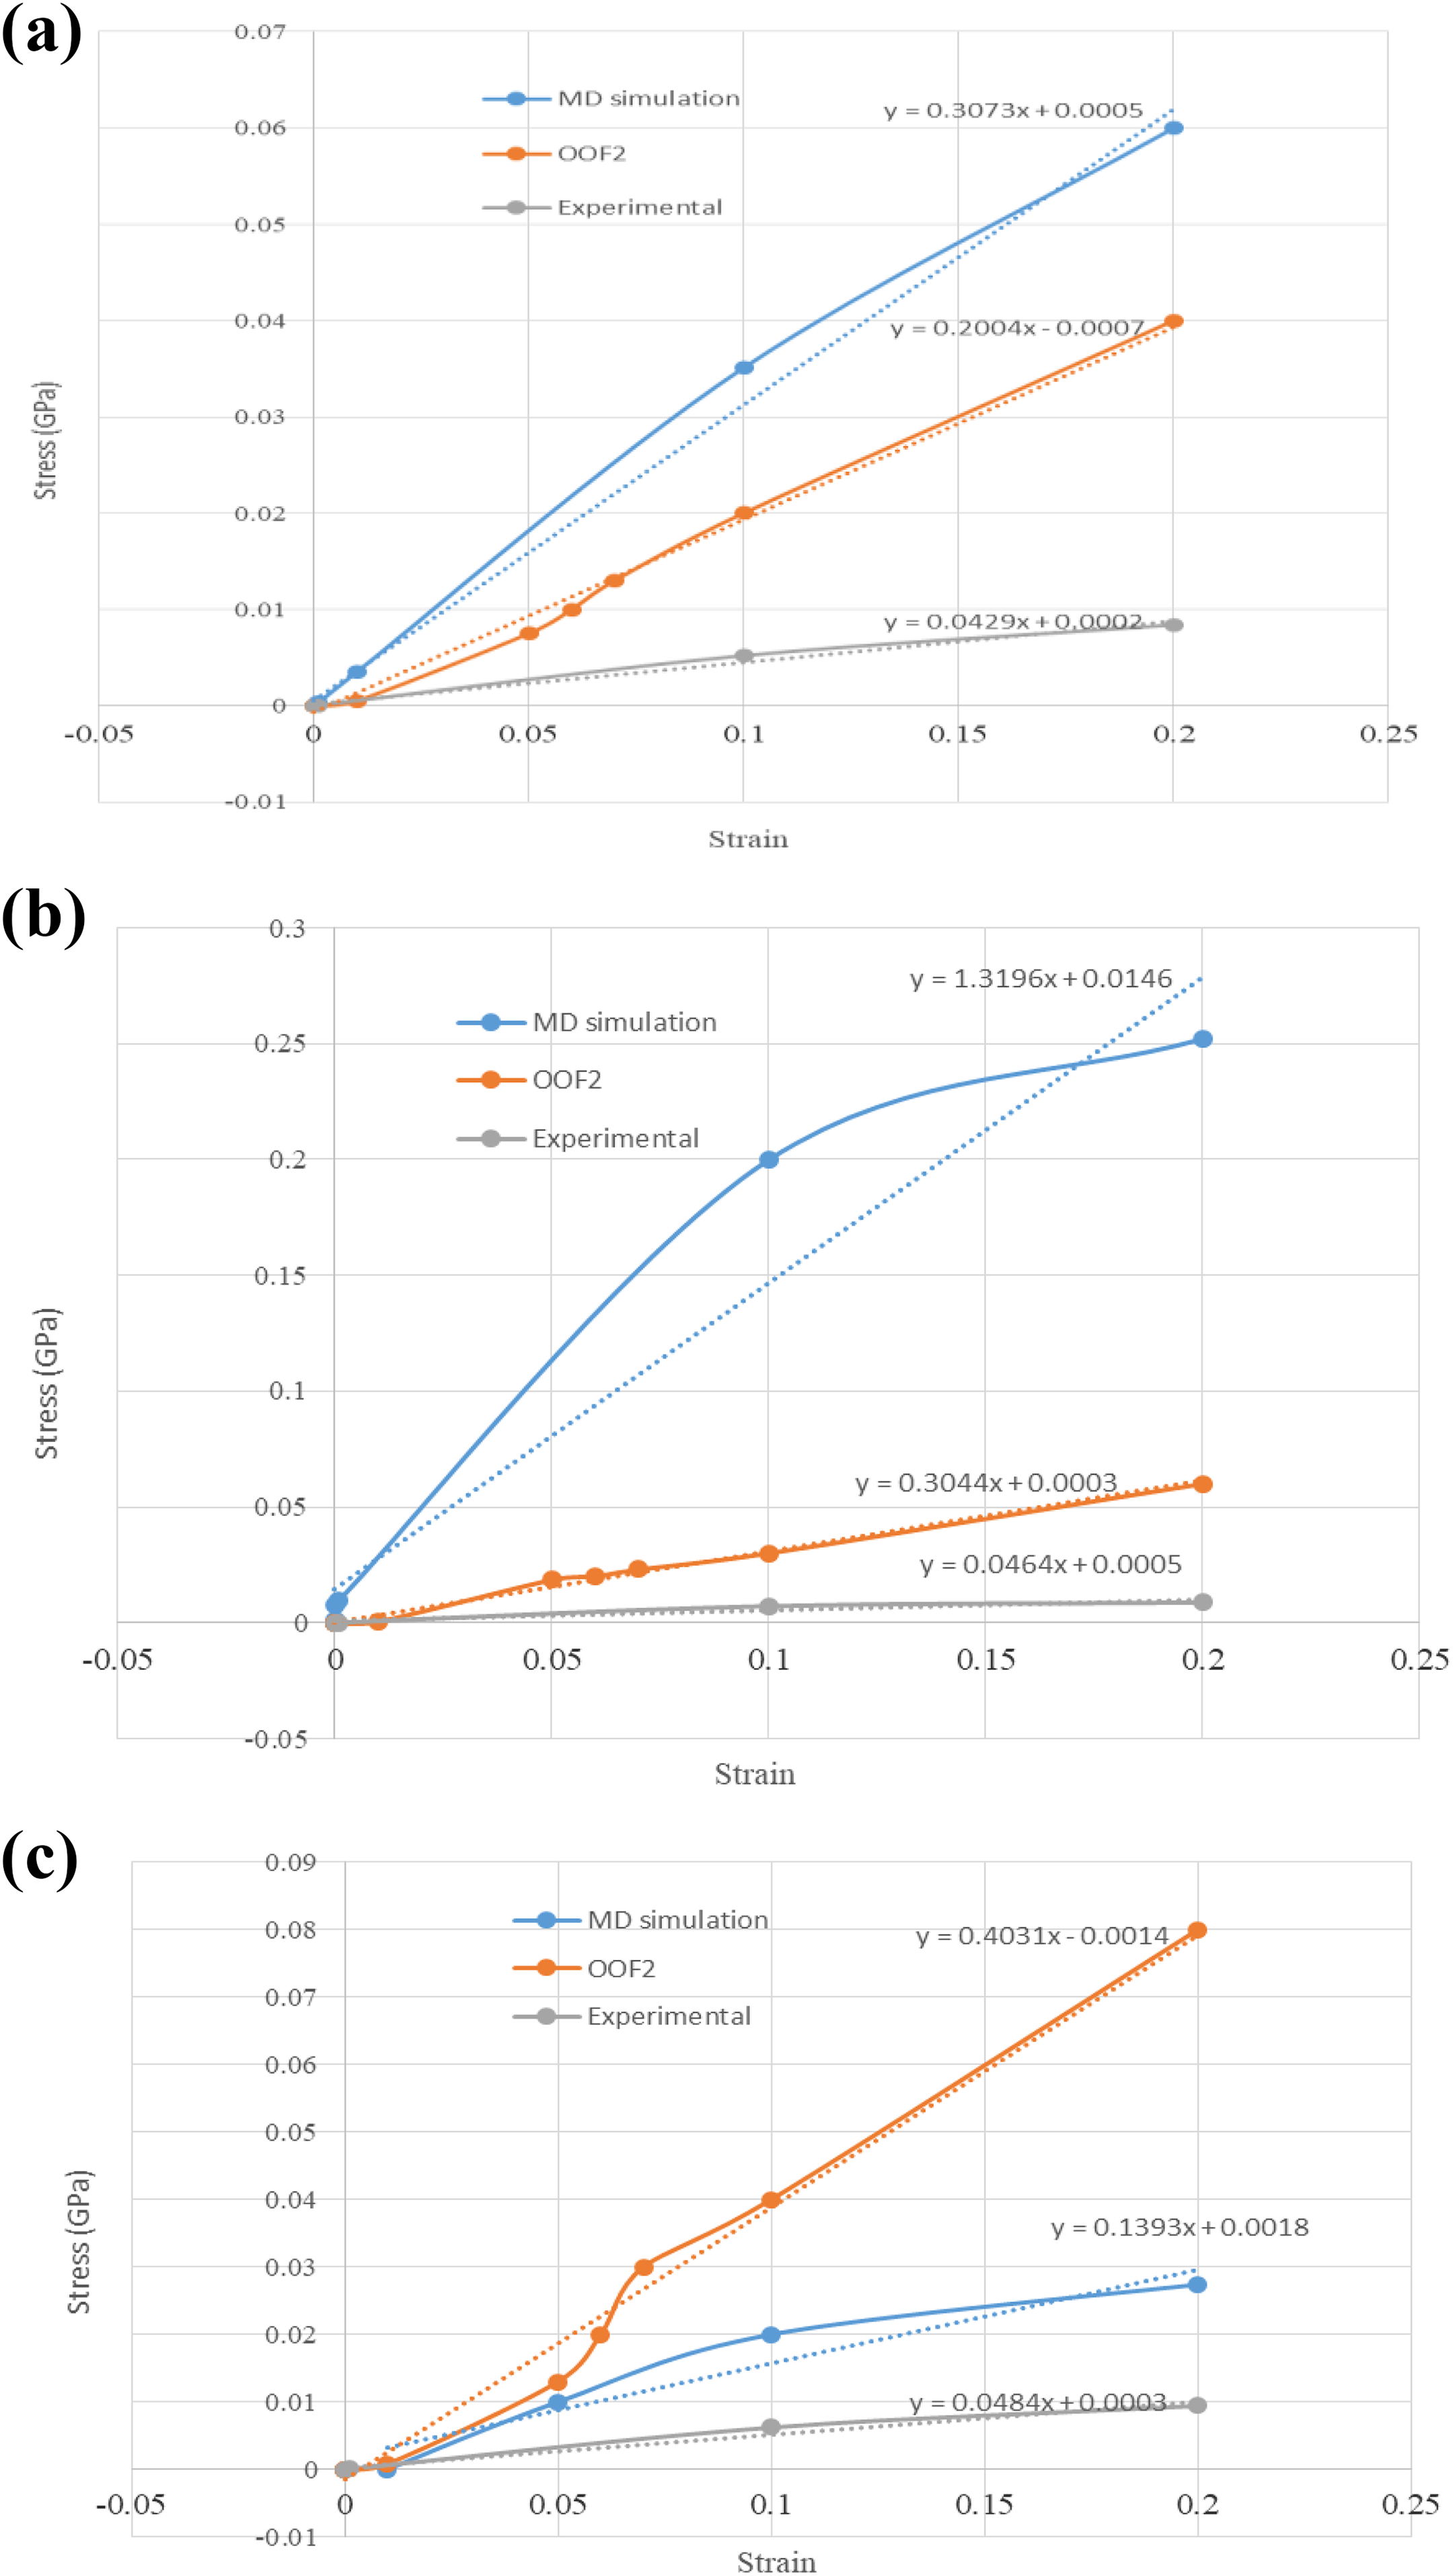
Strain was applied to the system in the x-direction, so the bottom of the 2D microstructure had to be clamped by imposing no displacement boundary condition in the x- and y-directions. This boundary condition is of Dirichlet type. Then, stresses were solved along the xx-direction by setting the flux quantity as stress, and the component was taken along the xx-direction as shown in Figure 10. This helped to generate the stress–strain curve from OOF2 along the xx direction. The longitudinal Young’s moduli (Exx) of 0.5%, 3%, and 4% (wt%) Gr/TPU nanocomposites were obtained from the slope of the linear region of the stress–strain curve as shown in Figure 11(a) to (c), respectively.
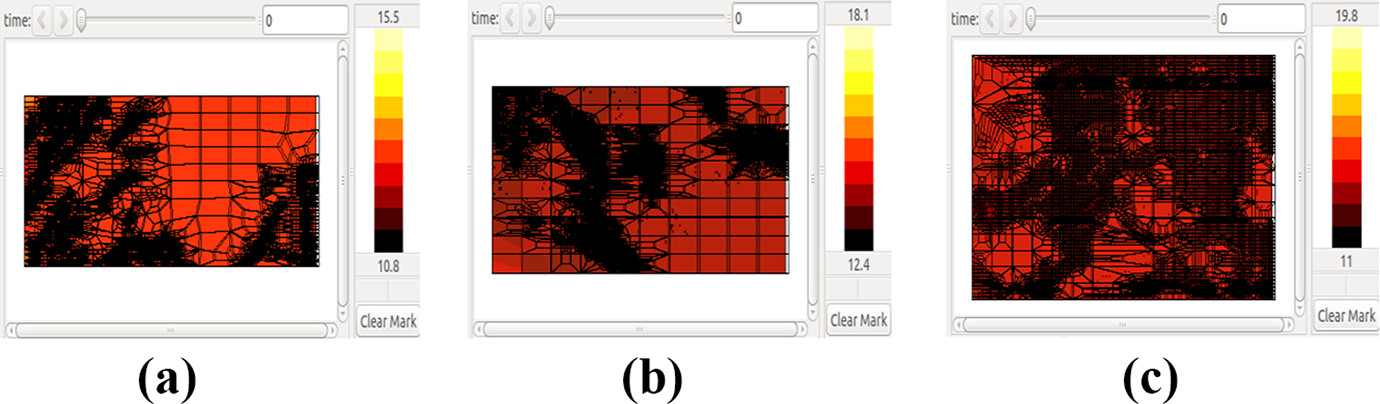
Plot display (stress) within OOF2. (a) 0.5% Gr/TPU, (b) 3% Gr/TPU, (c) 4% Gr/TPU. Gr/TPU: graphene-reinforced thermoplastic polyurethane.
Validation between simulation methods with experimental method.
Strength and deformation of the nanocomposite based on experiment
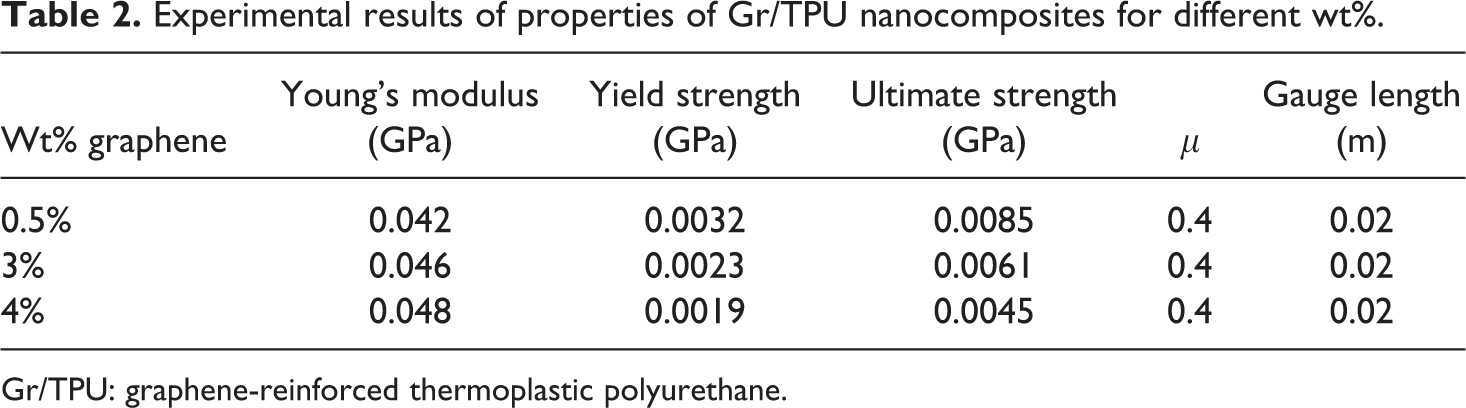
In this study, the tensile tests were carried out on Instron 8801 (Instron, United Kingdom) at 25°C, on the specimens prepared as per the ASTM Standard D412-15a. 37 The nominal dimensions of the ASTM D412 specimens are shown in Figure 12. A 1 kN load cell was used, and the crosshead speed was chosen as 50 mm/min. The gauge length of the specimen was 0.02 m, and the strain rate became nearly 0.04/s. The testing process required specific grips, load cell, and extensometer. The extensometer had the capability to measure the small elongation in micrometer range. The system being interfaced with a computer, output from the device was recorded in a text file including the load and elongation data. Elongation is typically measured by the extensometer in volts and converted into millimeters. Mechanical properties are determined from the stress versus strain plot from the three different weight percentages of nanocomposite (0.5%, 3%, and 4%) specimens as shown in Table 2. The results in Table 2 indicate an increase in Young’s modulus and decrease in yield strength and ultimate tensile strength (UTS) due to the presence of more graphene in the Gr/TPU nanocomposite. This fact may be attributed to the following reason. TPU consists of hard and soft segments. There is a chance of molecular rearrangement during deformation with respect to the axis along which strain is applied. Such rearrangements may be restricted or inhibited in the presence of more graphene. This triggers a reduction in soft segment crystallinity on the one hand and an increase in the hard segment noncrystallinity on the other hand. This effect together causes lesser deformation or elongation of the nanocomposite, leading to its higher Young’s modulus value, and can also contribute to the reduction of tensile strength.
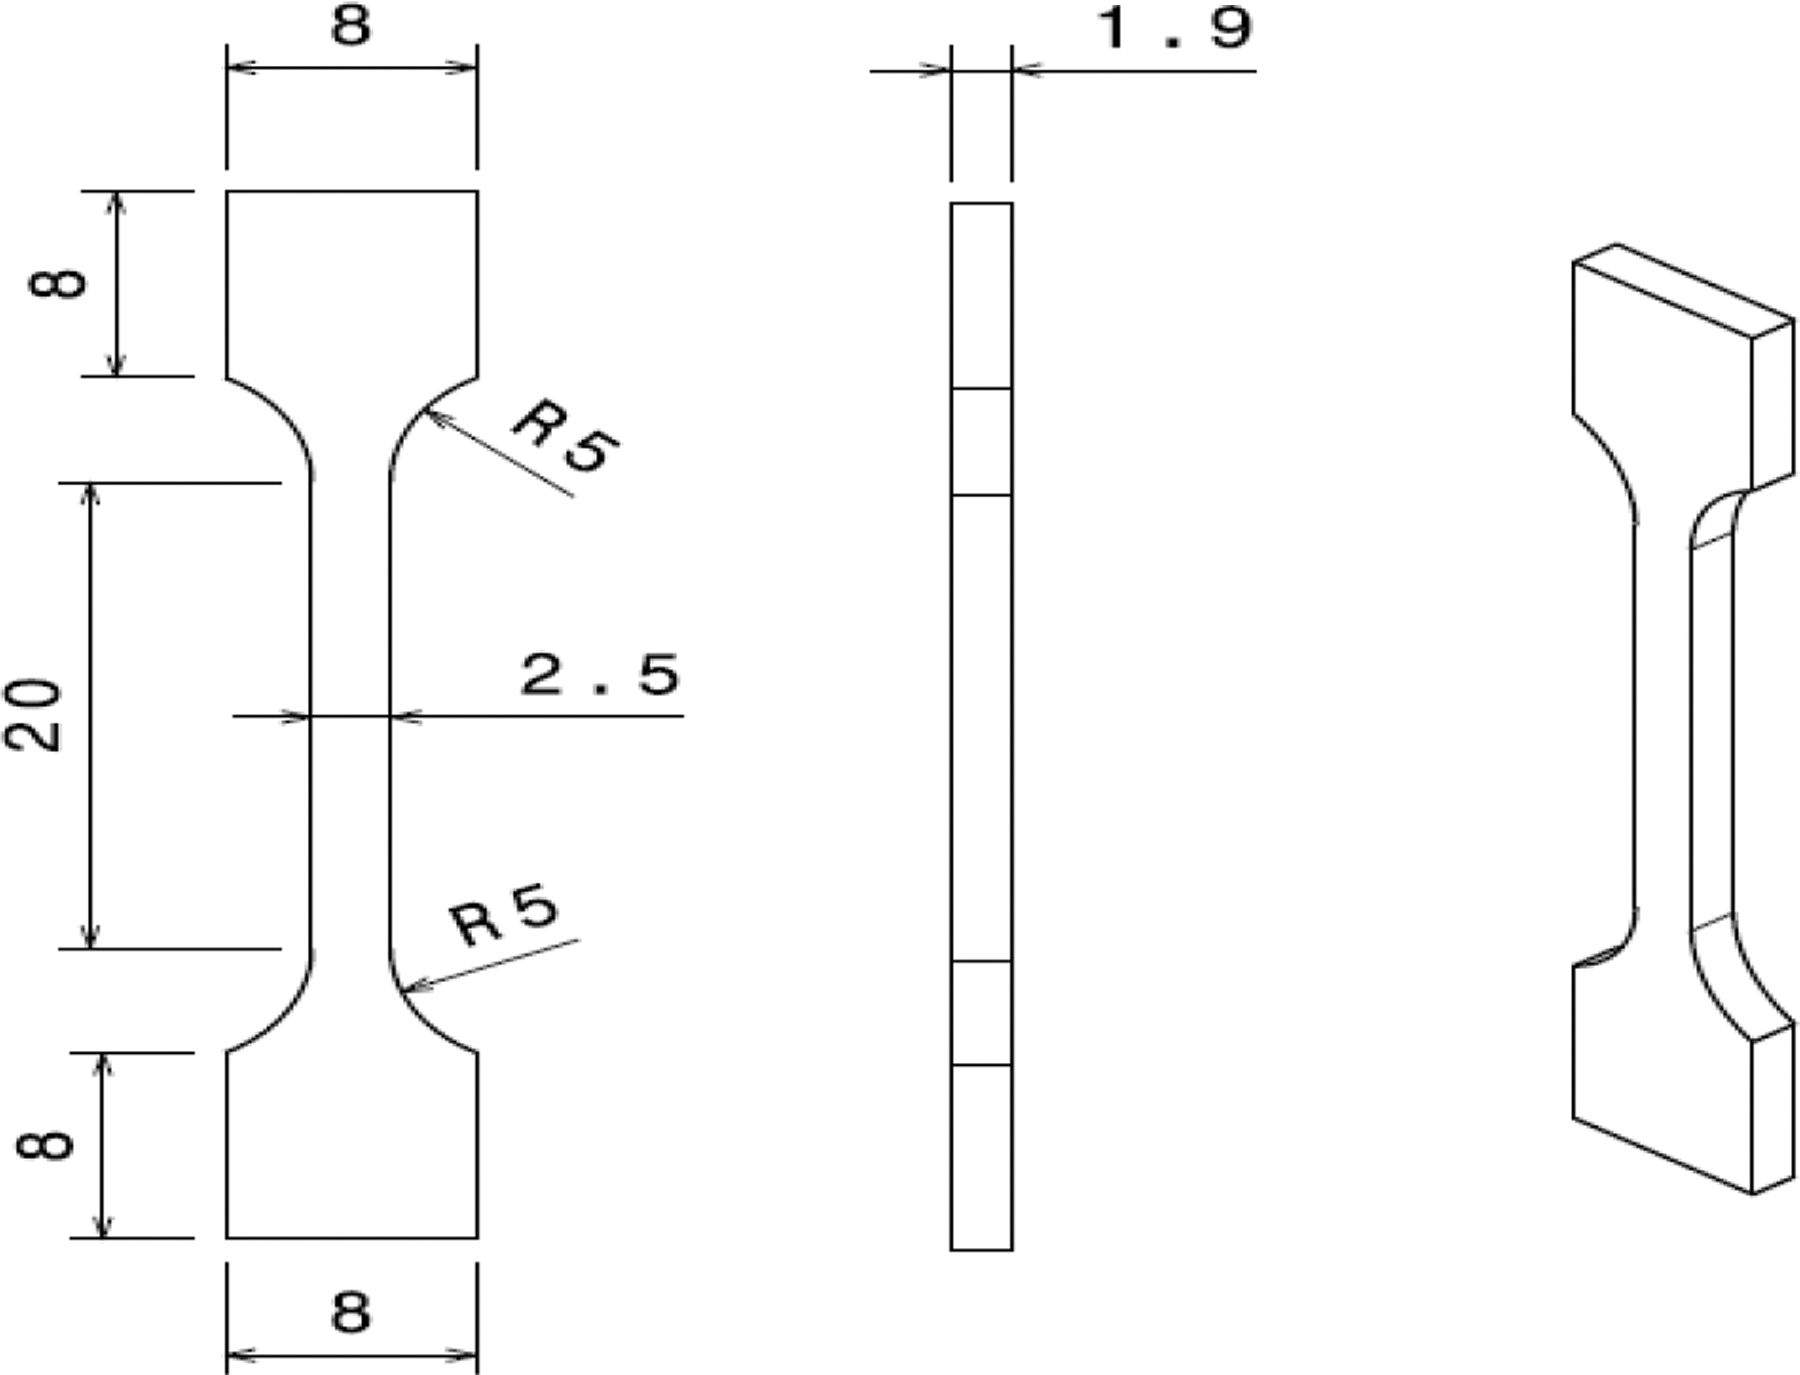
Dimensions of the dog bone (ASTM D412) specimen (all dimensions in mm).
MD simulation results of properties of Gr/TPU nanocomposites for different wt%.
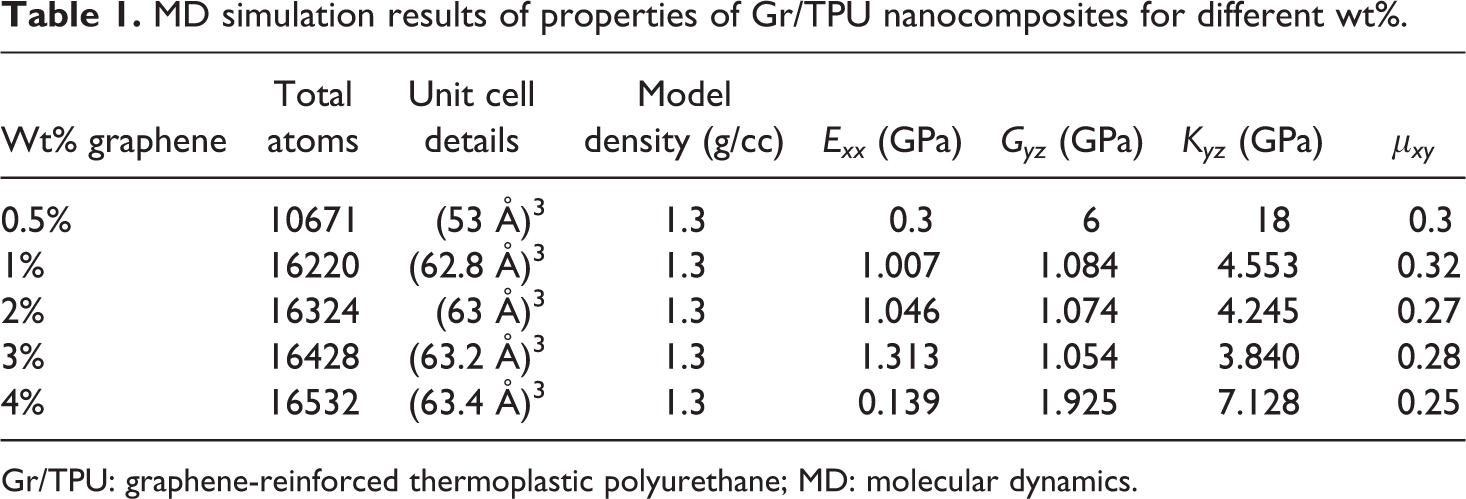
Gr/TPU: graphene-reinforced thermoplastic polyurethane; MD: molecular dynamics.
Experimental results of properties of Gr/TPU nanocomposites for different wt%.
Gr/TPU: graphene-reinforced thermoplastic polyurethane.
Validation of simulation and experimental methods
Multiscale modelling and simulation is a different length and time simulation tool that helps to validate experimental results of the mechanical properties enhanced by graphene-reinforced nanocomposite. 38,39
To validate the numerical approach, first, calculated properties from developed models are compared with the previous simulation values and previous experimental results. To validate the computational model, first, the perfect solid–liquid–gel system model was analyzed through tensile loading. The stress–strain curve along the zigzag orientation is used for the evaluation of Young’s modulus (Exx) at 300 K. The obtained results of graphene (as shown in Figure 5) are in good agreement with those obtained from other MD simulations 40 –43 and also from other experimental studies. 44,45 In the second case, the TPU results are compared. The obtained Young’s modulus of TPU (as shown in Figure 6) is in good agreement with the previous MD simulation values 46,47 and experimental results. 48 It is seen that due to a further increase in graphene weight content above 3% in MD simulation, Young’s modulus got decreased due to the agglomeration of graphene sheets within nanocomposite. These types of behavior were found in the previous studies. 49 –53 OOFEM gives much better result compared with MD simulation because OOF2 can capture real distribution, shape, and size of graphene particles within TPU matrix. The results of Young’s modulus for 0.5%, 3%, and 4% (wt.%) Gr/TPU nanocomposites are shown in Figure 11(a) to (c), respectively.
Conclusions
Multiscale modelling and simulation–based study deals with the influence of nanoreinforcement effect from atomic level to microlevel in the nanocomposites. Experimental works based on tensile tests show an increase in Young’s modulus and decrease in yield strength and UTS due to the presence of more graphene in the Gr/TPU nanocomposites. Further, property enhancement of Gr/TPU nanocomposites can be achieved by a morphological control of graphene. According to morphological studies with SEM micrographs of nanocomposites, formations of large agglomerates are observed for high percentages of graphene. It is seen that there is a big gap between MD simulation results and experimental results due to factors such as the presence of defects or impurities in the material. But there is a lesser difference in results obtained from object-oriented finite element and experimental work, because object-oriented finite element (OOF2) had capability to develop model from actual microstructure. This difference may be further reduced if interphase properties and isostrain condition of matrix and reinforcement are included in OOF2 modelling.
Footnotes
Acknowledgements
The authors would like to thank Professor Stephen A Langer, NIST, for his kind help in OOF2 installation and advices in modelling. Special thanks to Dr Kollal Khan and Dr Mithilesh Dixit, NIT, Durgapur, India, for their kind advice on simulation. The authors acknowledge helps of Professor Sankar Kumar, University Polytechnic, BIT, Mesra, Ranchi, India, for allowing to use Central Instrumentation Facility for microstructural characterization and material processing.
Funding
The author(s) received no financial support for the research, authorship, and/or publication of this article.