
Abstract
The natural fiber–reinforced polymer composites gaining substantial importance in recent years due to their unique properties compared to synthetic composites. In India (especially northeastern part), cultivars and industries mostly focus on pineapple fruits, leaving leaf to mainly compost or burn and decay as an agro waste. In this article, pineapple leaf–based (variety type Kew or Giant Kew from Silchar, Assam, India) short fiber–reinforced polymer composites as a function of fiber composition and composite thickness on mechanical properties are analyzed. In this regard, short pineapple leaf fibers (≈ 1 mm to 2 mm) as reinforcement + epoxy resin (Lapox (L12) resin + K6 hardener) as matrix material are used for composites. Subsequently, six different fiber compositions (as 0, 1, 5, 10, 15, and 20 wt%) with composite specimen’s thickness (as 3 and 5 mm) are prepaid. Later, mechanical properties like tensile strength, flexural strength, and toughness and hardness values for each of the composite specimens are evaluated. The result shows that the addition of short fiber can improve the mechanical properties and found in all the cases composites with 10% of reinforcement + at 5-mm thickness show better performance than the other combinations.
Introduction
Pineapple (commonly named as Ananas Comosus) is an extensively cultivated crop in India at an estimated area of 89,000 hectares of 2011 census. It is widely grown in the entire northeastern region of India such as Assam, Tripura, Meghalaya, Manipur, and West Bengal with small-scale cultivation in other states of India such as Gujarat, Karnataka, Kerala, and so on. 1 The common varieties that are grown in the northeastern states are Kew and Queen. Unlike many of the fruit-bearing plants, the pineapple plant bears fruit only once in their lifetime, beyond which the plants are left to die and decay as an agro waste. Hence, instead of letting the plant to decay as an agro waste they can be utilized for some potential uses by the extraction of fiber from the leaves. The fiber extracted from the leaves can be utilized in myriad of applications such as fabric, automobile, furniture, and sports industry as an alternative to synthetic fiber. 2 The chemical composition of pineapple leaf (Kew type) consists of holocellulose (70–82%), lignin (5–12%), and ash (1.1%). 3 Due to the high cellulose content and high degree of crystalline, pineapple leaves fibers are chosen as reinforcement material in the present study. 4
Also synthetic fibers such as glass fibers are high in density, costly, nonbiodegradable, and cause health-related issues. These disadvantages could be overcome by replacing synthetic fibers with natural fibers which are low in density, readily available at low cost, and biodegradable. 5,6 Various natural fibers such as flax, 4 jute, 7 coir, 8 coconut, 9 sisal and banana, 10 bamboo, bagasse, lantana-camara, 11 oil palm fibers, 12 wood, 13 and rice husk 14 were used as a reinforcement material in the preparation of composites materials, and their detail physical and mechanical properties were evaluated and compared with other synthetic fibers. Similarly, research was also being carried out on the long fiber (Mauritius and Queen type) pineapple composites with their physical and mechanical properties such as Devi et al. 15 explored the mechanical behavior of pineapple leaf–based long fibers (PALFs) polyester composites as function of fiber loading, fiber length, and fiber surface modification. As a result, tensile and impact properties of PALF-polyester composite found increased with the increment of fiber content, but for flexural strength, lower fiber content gave better properties. Luo and Netravali 16 studied the mechanical and thermal properties of unidirectional, biodegradable, environmental friendly “green composite” made from pineapple leaf–based (long fiber) polymer composites as function of fiber content. The results show that properties were getting improved in longitudinal direction while lower in transverse direction. Further, scanning electron microscope (SEM) and thermo gravimetric analysis were performed for same composites to analyze the thermal properties and found that the presence of pineapple fiber does not have any effect on the thermal properties while increment in the properties in SEM. Arib et al. 17 have presented the mechanical properties evaluation of pineapple leaf fiber–based polymer composites as a function of volume fraction. The results revealed that flexural and tensile strength increased slightly by increasing the fiber percentage from 2.6% to 16.2%. Similarly, decrement of flexural and tensile strength properties was also found due to the increment of fiber content in the composites. Mohamed et al. 18 studied the physical and mechanical characterization of three different types of pineapple leaf–based fibers from popular cultivars (Josapine, Sarawak, and Moris Gajah). As a result, from the thermal stability point of view, Sarawak cultivar-based pineapple leaf fibers gave better results, while from the physical and mechanical properties viewpoint, Josapine cultivar-based pineapple leaf fibers gave better properties. The work also concluded that extraction method plays a very important role in getting the better properties. Chollakup et al. 19 studied the mechanical properties of pineapple leaf fiber + polyolefins-based composites with varying the fiber content from 0% to 25%. The results showed that mechanical properties (tensile + flexural) were improved by increasing the fiber content, and optimal properties were obtained at 15% of fiber content compared to the other combination. Further, dispersions of fiber in the matrix material were studied via SEM and found homogenous distribution of fiber in the matrix. Siregar et al. 20 explored the effect of alkali treatment and compatibilizing agent (2 and 4 wt%) on the tensile properties of PALF-reinforced high-impact polystyrene (HIPS) composite. The result shows that chemical modification via alkali treatment and compatibilizing agent has improved the tensile strength and tensile modulus of the PALF/HIPS composites. Vinod and Sudev 21 explored the application of PALF as reinforcement and investigated the effect of fiber orientation on the flexural properties of PALF-based polymer composites. From the result, it was observed that the orientation of the fiber greatly influences the flexural properties of reinforced composites and higher flexural strength was obtained for inclined orientation of fiber compared to the unidirectional and bidirectional fibers. Kasim et al. 22 discussed the effect of pineapple leaf fiber on the mechanical properties. Four samples with 30, 40, 50, and 60 wt% were prepared using the compression molding technique. The results show that void percentage and interfacial bonding between pineapple leaf fiber and polypropylene affected the mechanical properties of the composites, and tensile, hardness, and density values of 30 wt% have shown better results compared to the other combinations. Siva and John Paul 23 had shown the utilization of PALF and their mechanical properties extraction. Different alkali methods with varying concentration were utilized during the sample preparation. Result revealed that long fiber of pineapple leaf–based polymer composites with 10% concentration shows better results compared to the untreated fibers. Odusote and Oyewo 24 investigated the mechanical properties of pineapple leaf fiber–reinforced thermoset composites for knee glass fiber–reinforced prosthetic socket. Work used long pineapple fibers as reinforcement materials with epoxy and polyester as matrix materials. As a result, long fiber pineapple leaf epoxy composites gave better and superior mechanical properties than glass fiber polyester composites. Durga Srimanth et al. 25 discussed the comparative experimental investigation of various natural fiber–based polymer composites and their mechanical properties extraction. Three different types of natural fibers such as jute, pineapple leaf long fiber, and jute and polyester as resin. They found that the mechanical properties of all the three composites greatly increased via increasing of fiber content and also found comparable and acceptable results with that of ANSYS 16.0 software. Reddy et al. 26 have studied the mechanical properties of jute and pineapple leaf long fibers polyester and epoxy resin matrices. Later, the results obtained are compared with glass fiber–reinforced polymer composites. As a result, the mechanical properties of jute and pineapple leaf–based fiber were providing better and acceptable properties compared to the glass fiber composites. Also, they found that the properties of composites increase with increases in fiber content.
Survey of the abovementioned literature reveals that most of the studies were on the long fiber pineapple leaf–based polymer composites. However, to the best of our knowledge, no literature was reported on short fiber pineapple leaf–based polymer composites. Therefore, in the present study, pineapple leaf–based (variety type Kew or Giant Kew from Silchar, Assam, India) short fiber–reinforced polymer (PLSFRP) composites and their detailed mechanical properties evaluation are discussed. The potential of the short fiber composites to be utilized in various applications can only be determined based on their excellence in specific properties. In this regard, short pineapple leaf fibers (SPALFs; ≈ 1 mm to 2 mm) as reinforcement + epoxy resin (Lapox (L12) resin + K6 hardener) as matrix materials and six different fiber compositions (i.e. 0, 1, 5, 10, 15, and 20 wt%) with composite specimen’s thickness (as 3 and 5 mm) are prepared. Later, mechanical properties like tensile strength, flexural strength, toughness, and hardness values for each of the composite specimens are evaluated.
Materials and method
Material preparation
Extraction of pineapple fiber/filler
The pineapple leaves (Katlichera, Kew, or Giant Kew variety) sourced from the Cachar district of Assam are soaked in water for a period of 2 weeks to allow for bacterial fermentation to take place. Due to bacterial action, the top and bottom portions of the leaves decay and become soft and gummy. The top gummy portion is then scrapped out with the aid of a blunt object, and the central fiber portion is extracted. Utmost care is taken to ensure that excess bacterial fermentation does not takes place as it may lead to decomposition of the central fiber portion which may lower the strength of the fiber. The extracted long fiber is then cut into short fibers of approximately 1–2 mm length, and the soluble impurities present in the fibers are removed by rinsing the fibers in ethanol and acetone. The fibers are then dried in furnace at 100°C for removing the moisture content which may alter the properties of the fibers if present. The sequence of steps involved in the extraction of pineapple leaf fiber is illustrated in Figure 1.
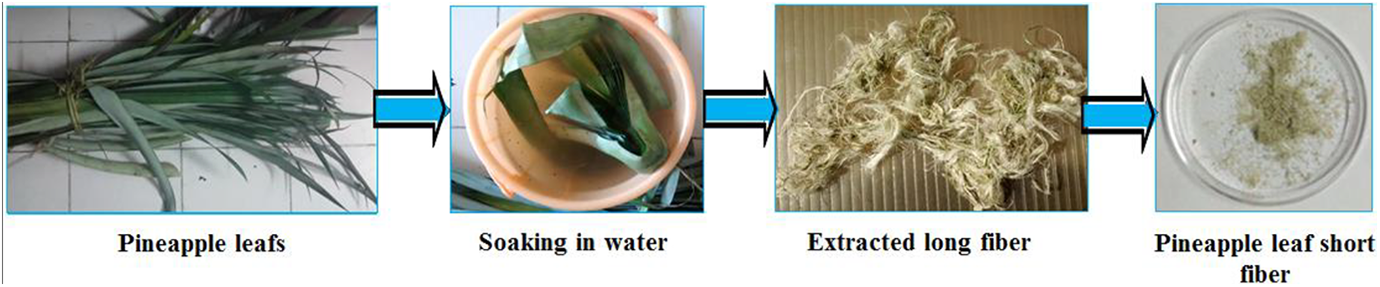
Extraction of short fiber from pineapple leaf.
Composite fabrication
Composites of three different compositions (0, 1, 5, 10, 15, and 20 wt%) were prepared by mixing SPALFs (≈ 1 mm to 2 mm) with Lapox (L12) resin and K6 hardener. For proper curing of the composite, the resin and hardener were mixed in the ratio of 10:1 by weight. Initially, the exact ratio by weight of filler and resin was taken and mixed using a mechanical stirrer for a period of 45 min to ensure homogenous mixing of filler with the resin. Next, the mixture is kept inside the vacuum deaerator until the air trapped inside the mixture is completely removed. Once the trapped bubbles are removed, the hardener is added to the filler–resin mixture and hand stirred once again and kept in degasser for not more than 15 min, beyond which the viscosity increases (pot life) making it difficult to handle. The different dimensions of molds were prepared as per the American Society for Testing and Materials (ASTM) standards. Then, a mixture of epoxy resin + different percentages of fiber content is poured into the different dimensions of the molds to get the final PLSFRP composites specimens. The sequence of steps involved in the fabrication of PLSFRP composites is illustrated in Figure 2.
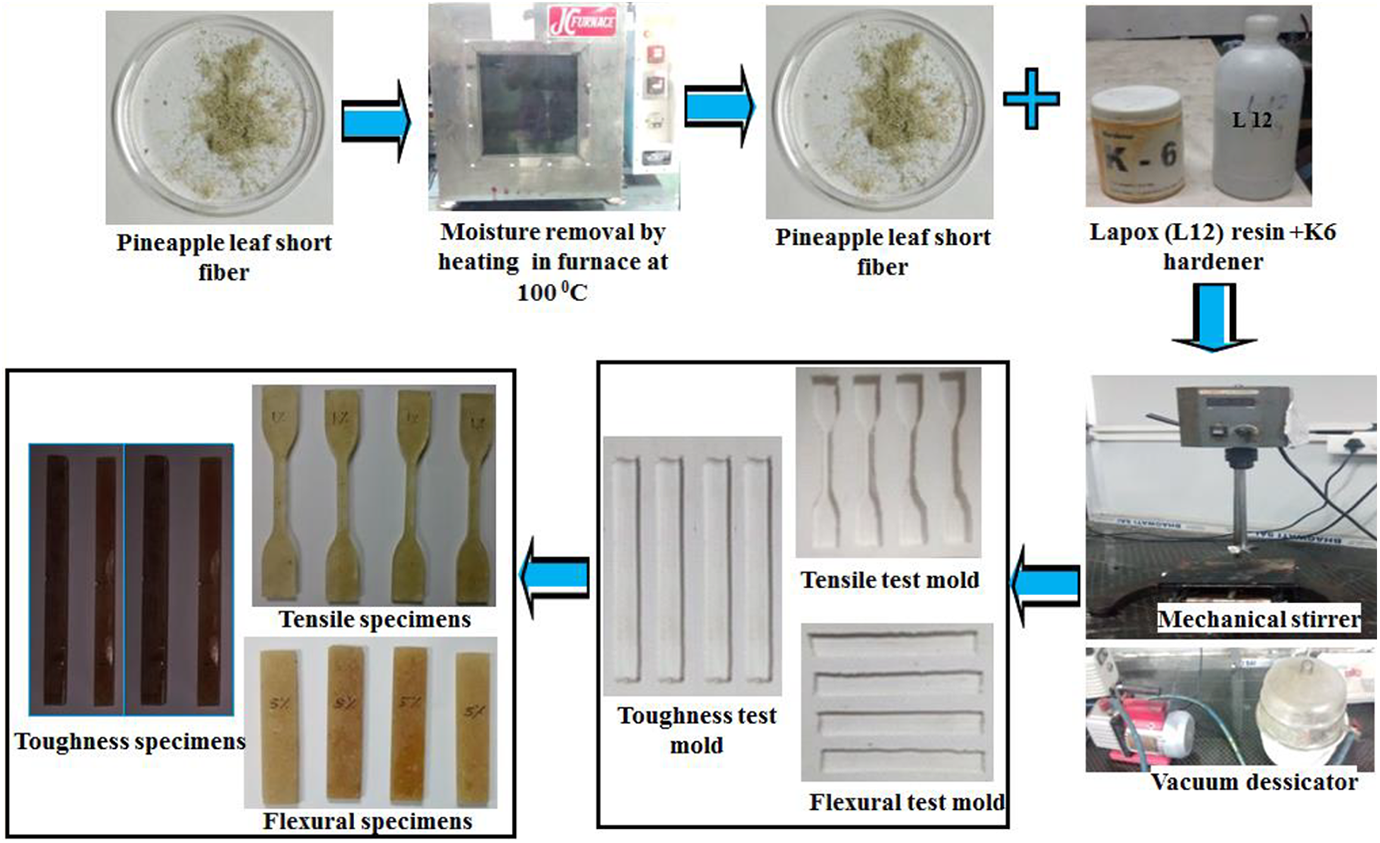
Fabrication of pineapple leaf–based PLSFRP composites.
Mechanical testing
Tensile test
The ability of the material to sustain the applied load without breaking is termed as tensile strength. The tensile strength of PLSFRP composites (type-IV) was determined by the ASTM D638-02 standard at a strain rate of 1 mm/min. During the testing, the specimens, that is, PLSFRP composites (type-IV), were clamped between the jaws and gradually tensile force is applied on the specimen via movement of the jaws. Later, this force was noted with respect to the change in gauge length. 10 The tensile test was done on universal testing machine (Instron 5969 model with 50 kN, Instron India Pvt Ltd, Tamil Nadu, India). The tensile specimens with 0, 1, 5, 10, 15, and 20% of reinforcement were tested three times and average values of the tensile strength for each specimen were taken for the analysis. The tensile test specimens of various percentages of reinforcements and experimental setup are shown in Figure 3(a) to (c).
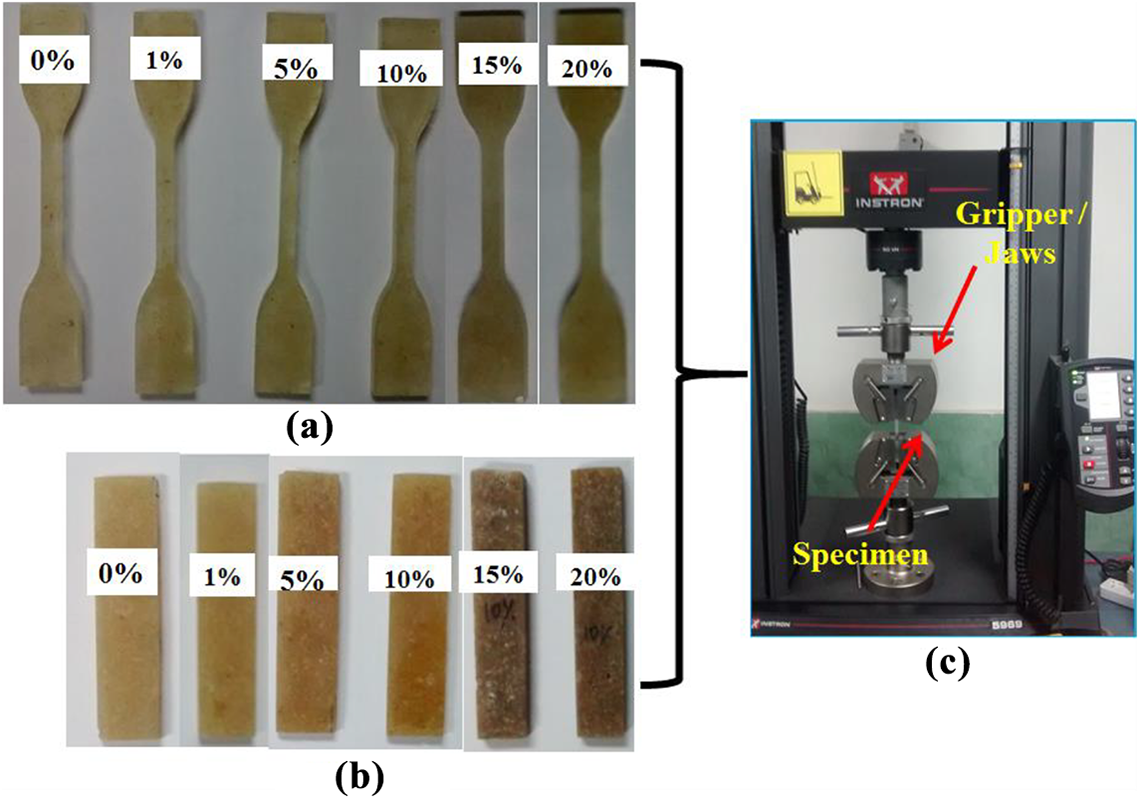
(a) Tensile test specimens of PLSFRP composites, (b) flexural test specimens of PLSFRP composites, and (c) experimental setup.
Flexural test
The ability of the material to bend due to the application of load is termed as flexural strength. It measured the force required to bend the beam. Mainly, flexural test imposes the tensile stress on convex side and compressive stress on concave side of the specimen, which leads to shear stress along the center line. Flexural specimens were made as per ASTM D790-03 standard with the specimen dimension of 127 × 12.7 × 3.2 mm3 and support span of 50 mm. 10 The flexural test was performed on universal testing machine (Instron 5969 model with 50 kN). During the testing, flexural of PLSFRP composite specimens with 0, 1, 5, 10, 15, and 20% of reinforcement was kept between two supports at a distance of 50 mm and load was applied at the center at a rate of 5 mm/min until the specimen breaks or fractures. The flexural specimens were tested three times and average values of the flexural strength for each specimen were taken for the analysis. The flexural test specimens and experimental setup are shown in Figure 3(b) to (c). Later, maximum load at the failure of the specimen was used for the determination of flexural stress.
Toughness test
The toughness can be defined as the ability of the material to withstand suddenly applied load without breaking. The toughness of the PLSFRP composites specimen is tested via Izod impact test (with a capacity of 300 J). The toughness specimens were made as per ASTM D6110 standard with a dimension of 125 × 12.7 × 10 mm3. During the testing, PLSFRP composite specimens with 0, 1, 5, 10, 15, and 20% of reinforcement were kept vertically and the pendulum was blown from one side which hits with some kinetic energy. The energy absorbed by the material before it breaks is recorded on the scale which was used to calculate the toughness. 10 With the same loading condition and with the same percentage of reinforcement of the PLSFRP composite specimens, tests were performed three times and average values of energy absorbed by each specimen were recorded. The different Izode impact testing specimens and experimental setup are shown in Figure 4(a) and (b). At last, average value of energy absorbed by each specimen were employed in determining the toughness of each specimen.
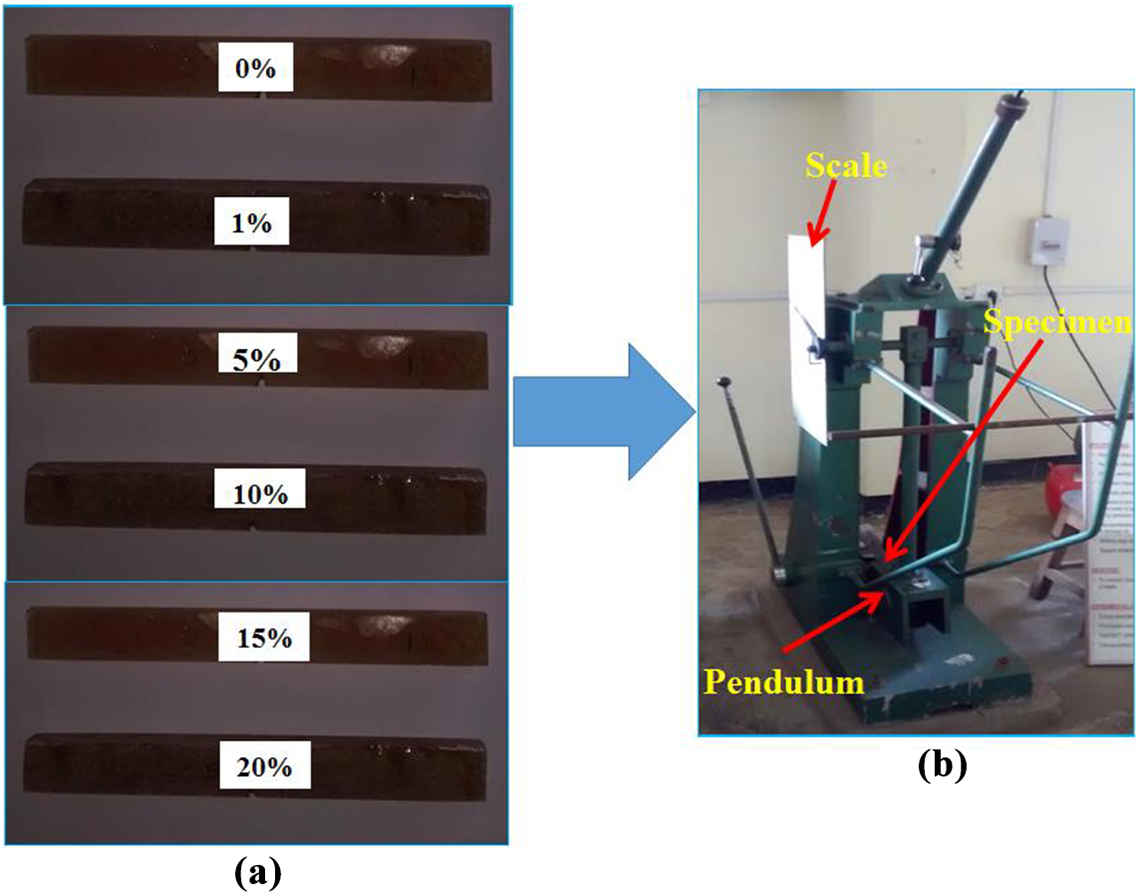
(a) Izode test specimens of PLSFRP composites and (b) experimental setup.
Hardness test
The ability of the material to resist indentation or penetration without breaking is termed as hardness. It measures the permanent depth of indentation produced by a force/load on an indenter. The hardness test was performed on digital Rockwell hardness testing machine (with depth of throat as 135 mm) manufactured by BIE (Hyderabad, Telangana, India). The specimens used for hardness test were the same as tensile strength. During the test, PLSFRP composite specimens with 0, 1, 5, 10, 15, and 20% of reinforcement were kept horizontally on the bed and indentation force was applied via ball indenter. After holding the indentation force for a specified dwell time, the final depth of indentation is measured and Rockwell hardness value was calculated. 10 With the same loading condition and with the same percentage of reinforcement of the PLSFRP composite specimens, tests were performed three times and average Rockwell hardness values of each specimen were recorded. The different hardness testing specimens and experimental setup are shown in Figure 5(a) and (b).
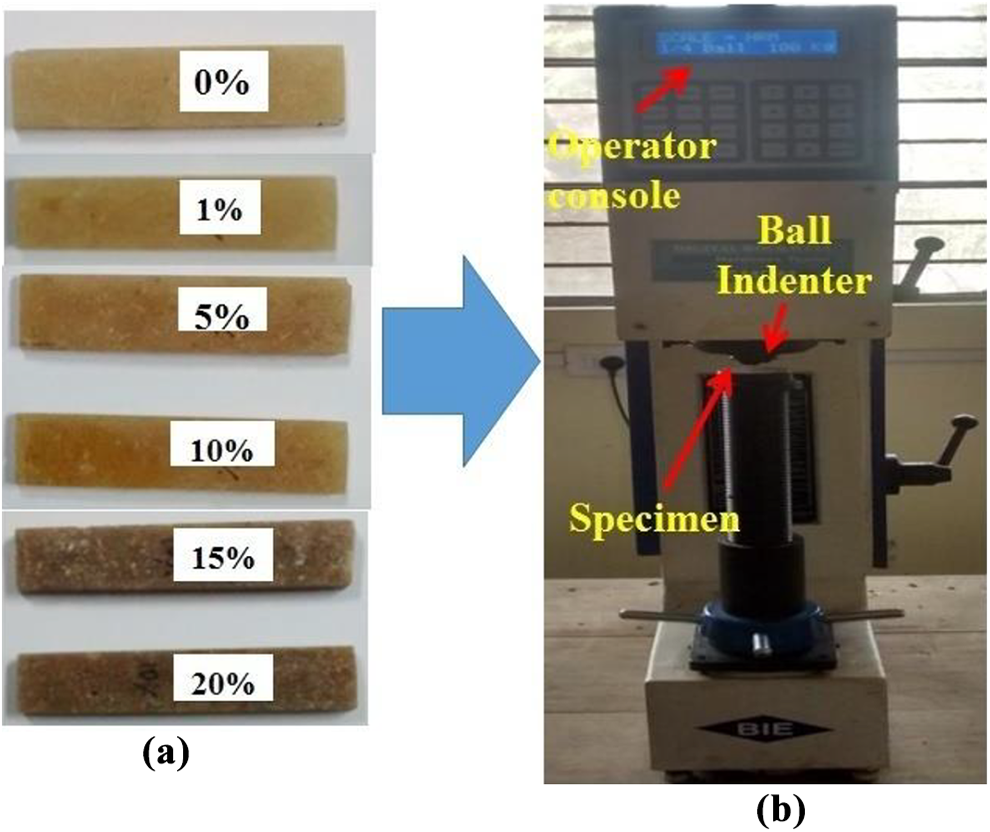
(a) Hardness test specimens of PLSFRP composites and (b) experimental setup.
Results and discussion
Tensile properties
The tensile strengths of PLSFRP composites specimens with 0, 1, 5, 10, 15, and 20% of reinforcement are determined from the break load and cross-sectional area of the 3-mm and 5-mm thickness specimen. The tensile properties of the PLSFRP composites both 3-mm and 5-mm specimens are tabulated in Tables 1 and 2, respectively. The sample load versus displacement curve for PLSFRP (10 wt% + 3 and 5 mm thick) composite is shown in Figures 6(a) and 7(a). It is seen that load is directly proportional to the displacement till the specimen get fractures. Similarly, stress versus strain curve generated from universal testing machine (UTM) for PLSFRP (10 wt% + 3 and 5 mm thick) composite is shown in Figures 6(b) and 7(b). It shows that, in both the cases, PLSFRP composite (with 10 wt% + 3 and 5 mm thick) specimens reach its yield strength, and it starts to behave as a brittle material that initiates it to break.
Mechanical properties for 3 mm thickness of PLSFRP composites.
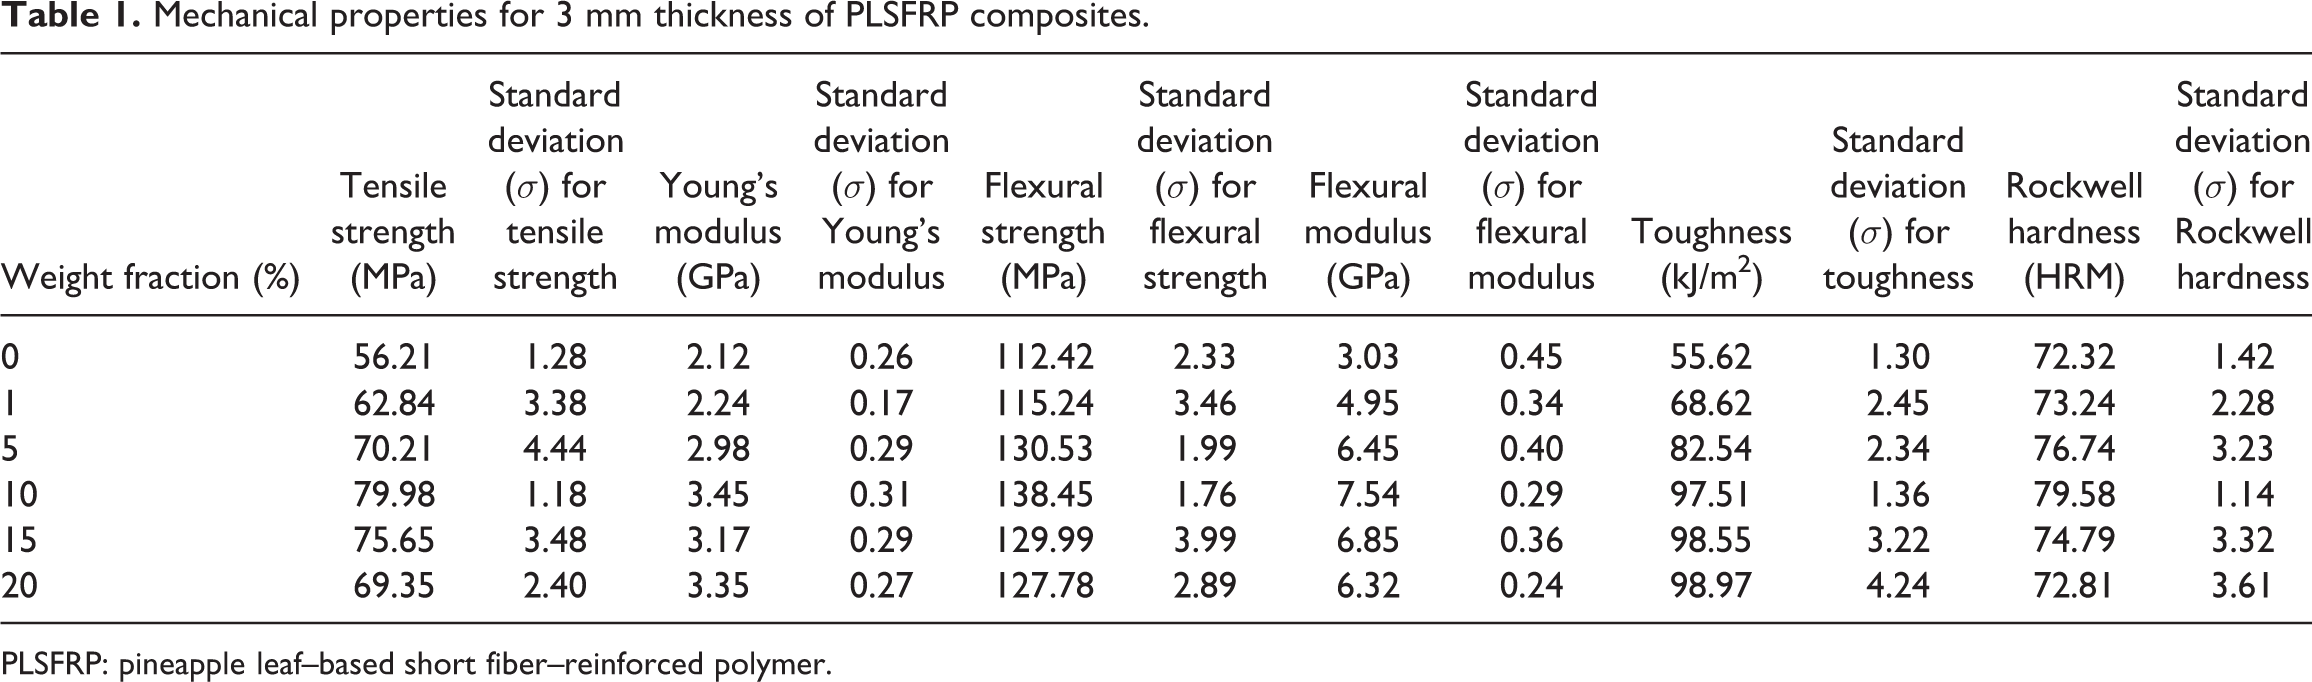
PLSFRP: pineapple leaf–based short fiber–reinforced polymer.
Mechanical properties for 5 mm thickness of PLSFRP composites.
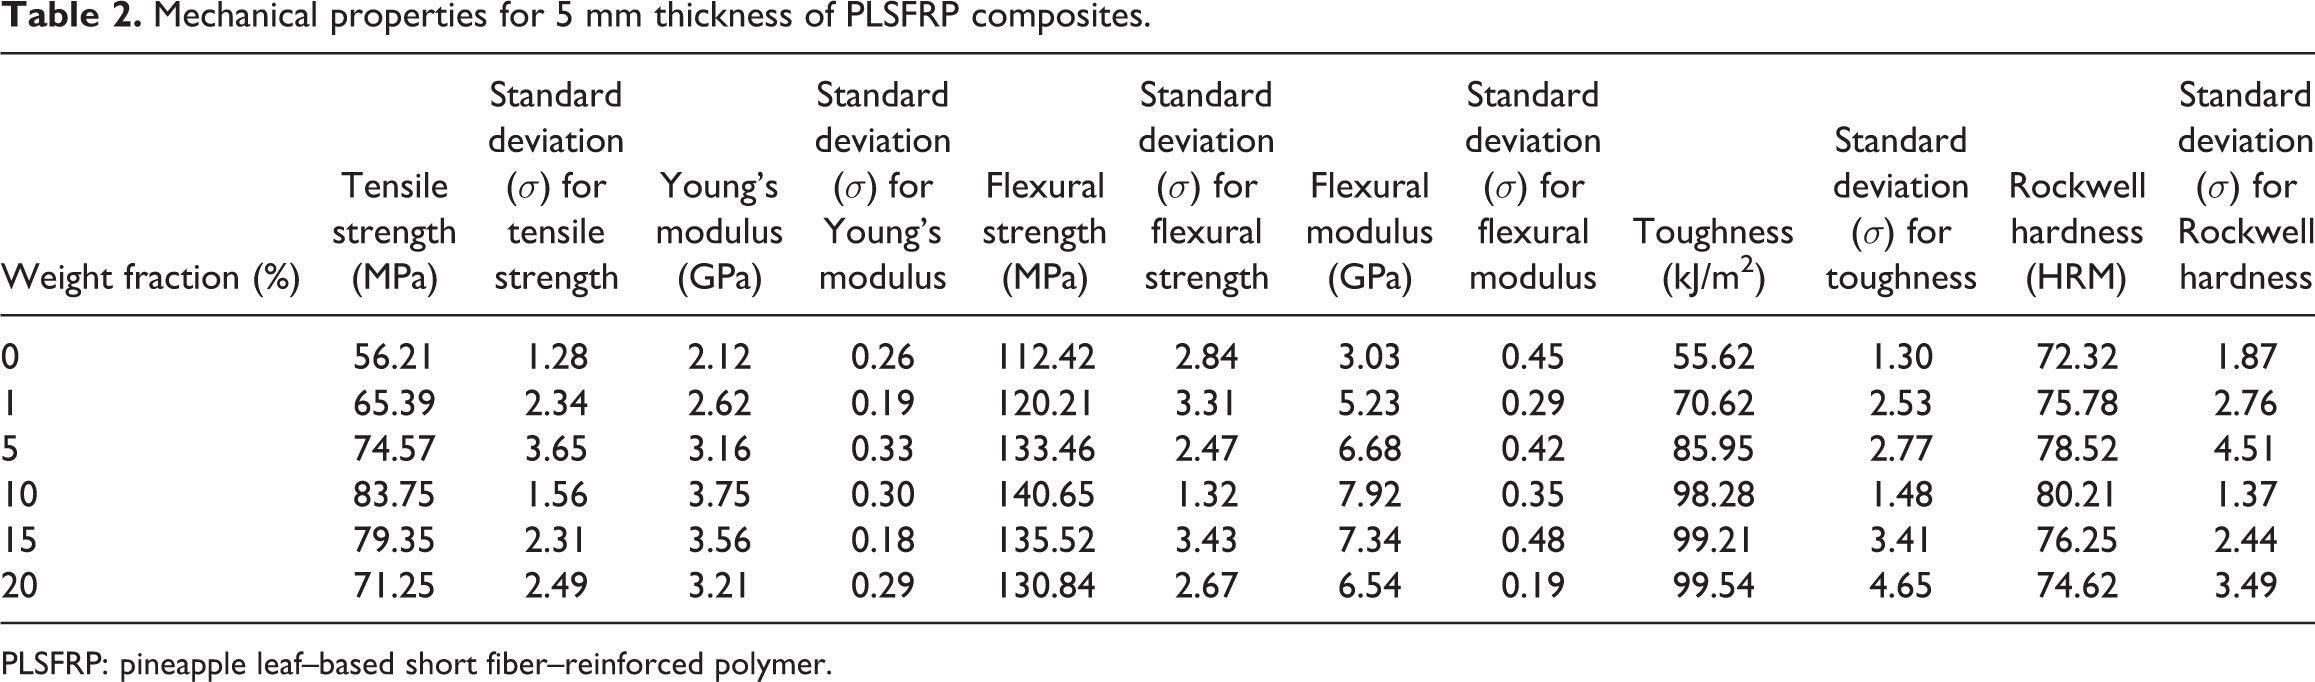
PLSFRP: pineapple leaf–based short fiber–reinforced polymer.
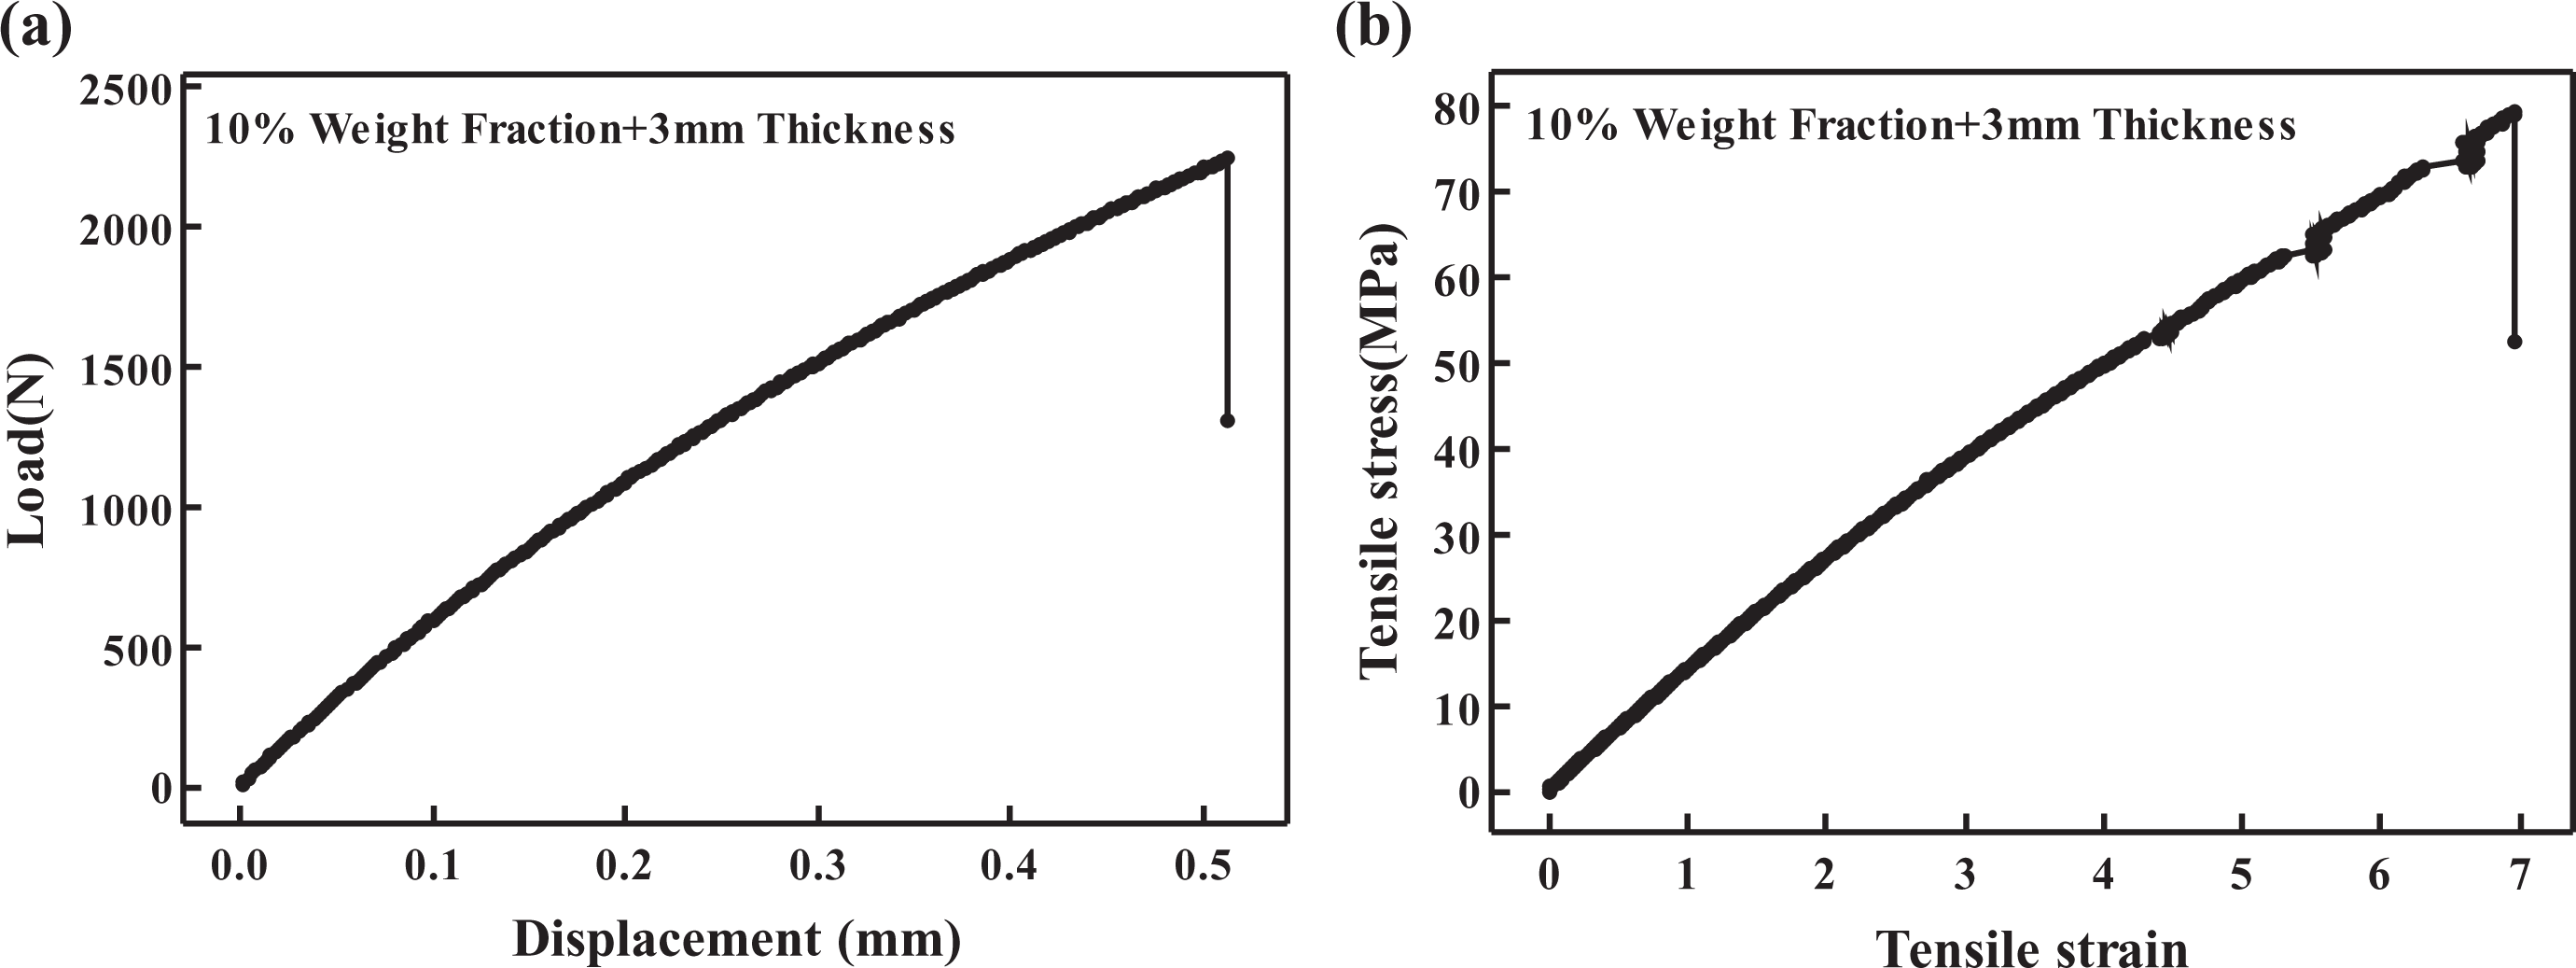
(a) Load versus displacement curve of PLSFRP (10 wt% + 3 mm thick) composite and (b) stress versus strain graph of PLSFRP (10 wt% + 3 mm thick) composite.
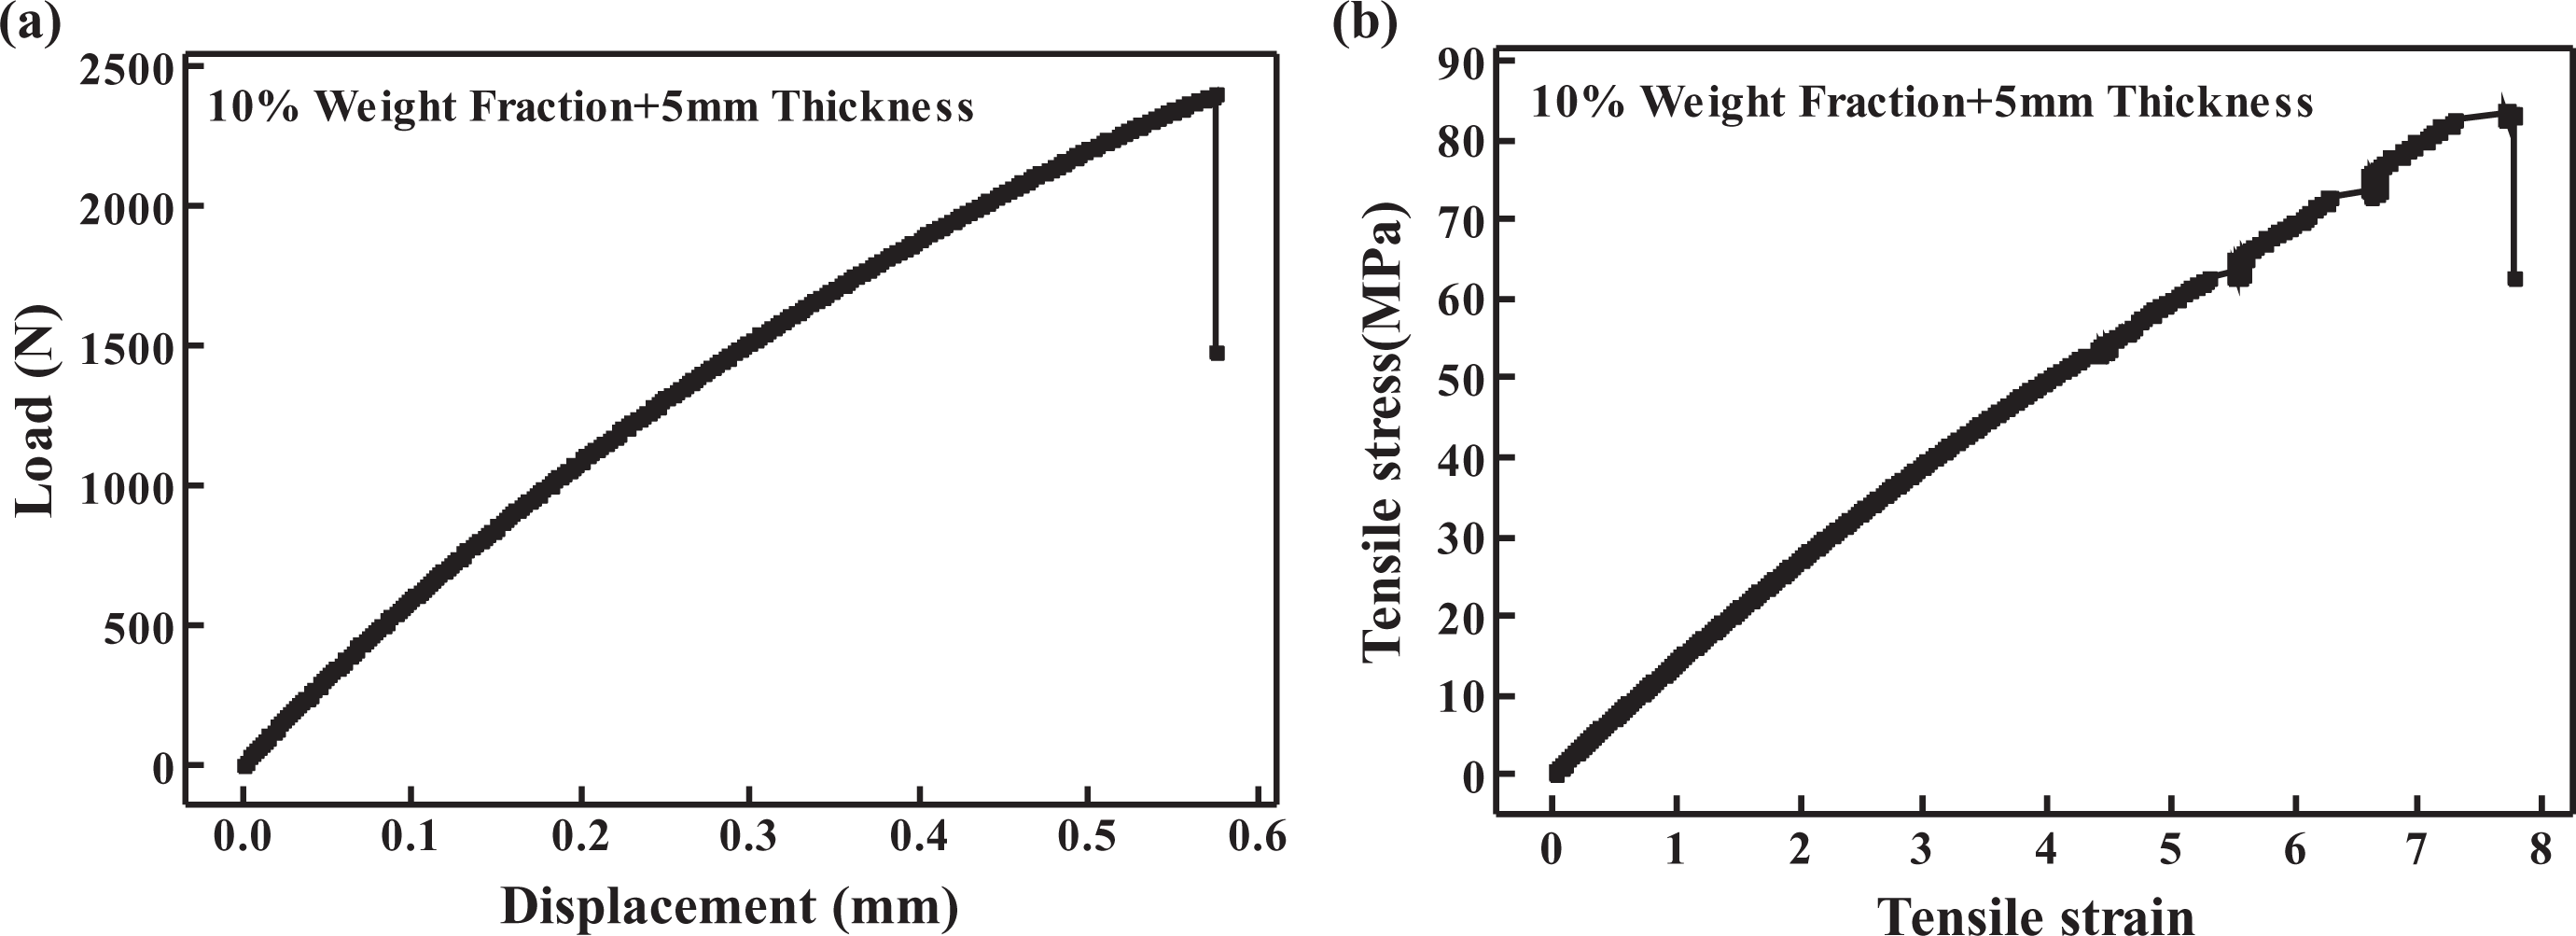
(a) Load versus displacement curve of PLSFRP (10 wt% + 5 mm thick) composite and (b) stress versus strain graph of PLSFRP (10 wt% + 5 mm thick) composite.
Additionally, the tabulated data (Tables 1 and 2) are used to plot the graph as shown in Figures 8(a) and (b) and 9(a) and (b). It is observed from the graph (Figure 8(a)) that tensile strength of PLSFRP composite specimens is increased with increase in fiber content up to 10% and then it is decreasing trend. This increment in the strength with increase in fiber percentage may be due to strong interfacial bonding between the fibers and the matrix materials and there is a proper transmission and distribution of the applied stress by epoxy resin results in higher strength. 7 The similar results are obtained compared to the laminated and long fiber composites, where the strength of the composite increases with increase in fiber percentage. 16 Also, another comparison of results in the literature obtained the same trend of results in the case of aramid fabric/polyethersulfone composites 27 where tensile strength of the composites specimen gets increased due to the increase in fiber percentage (%) reinforcement. Furthermore, with increase in the percentage of fibers, the chances that the randomly oriented fibers are getting aligned in the loading direction increase and the fibers act as laminates resulting in increase in strength. 10 In spite of the abovementioned results, Figure 8(a) shows that maximum value of tensile strength for 3-mm-thick and 5-mm-thick specimens at 10% is 79.98 and 83.75 MPa, respectively. The highest value of tensile strength is found at higher percentage (%) of fiber content, that is, at 10%, and higher thickness, that is, at 5 mm, in the PLSFRP composites. Further, increment in the percentage of fiber content decreases the tensile strength due to the poor interfacial adhesion between fibers and matrix. Also, found that, due to augmentation in micro space development in the composite specimen in both cases. However, composite specimen with higher thickness (i.e. 5 mm) gives better tensile strength compared to lower thickness.
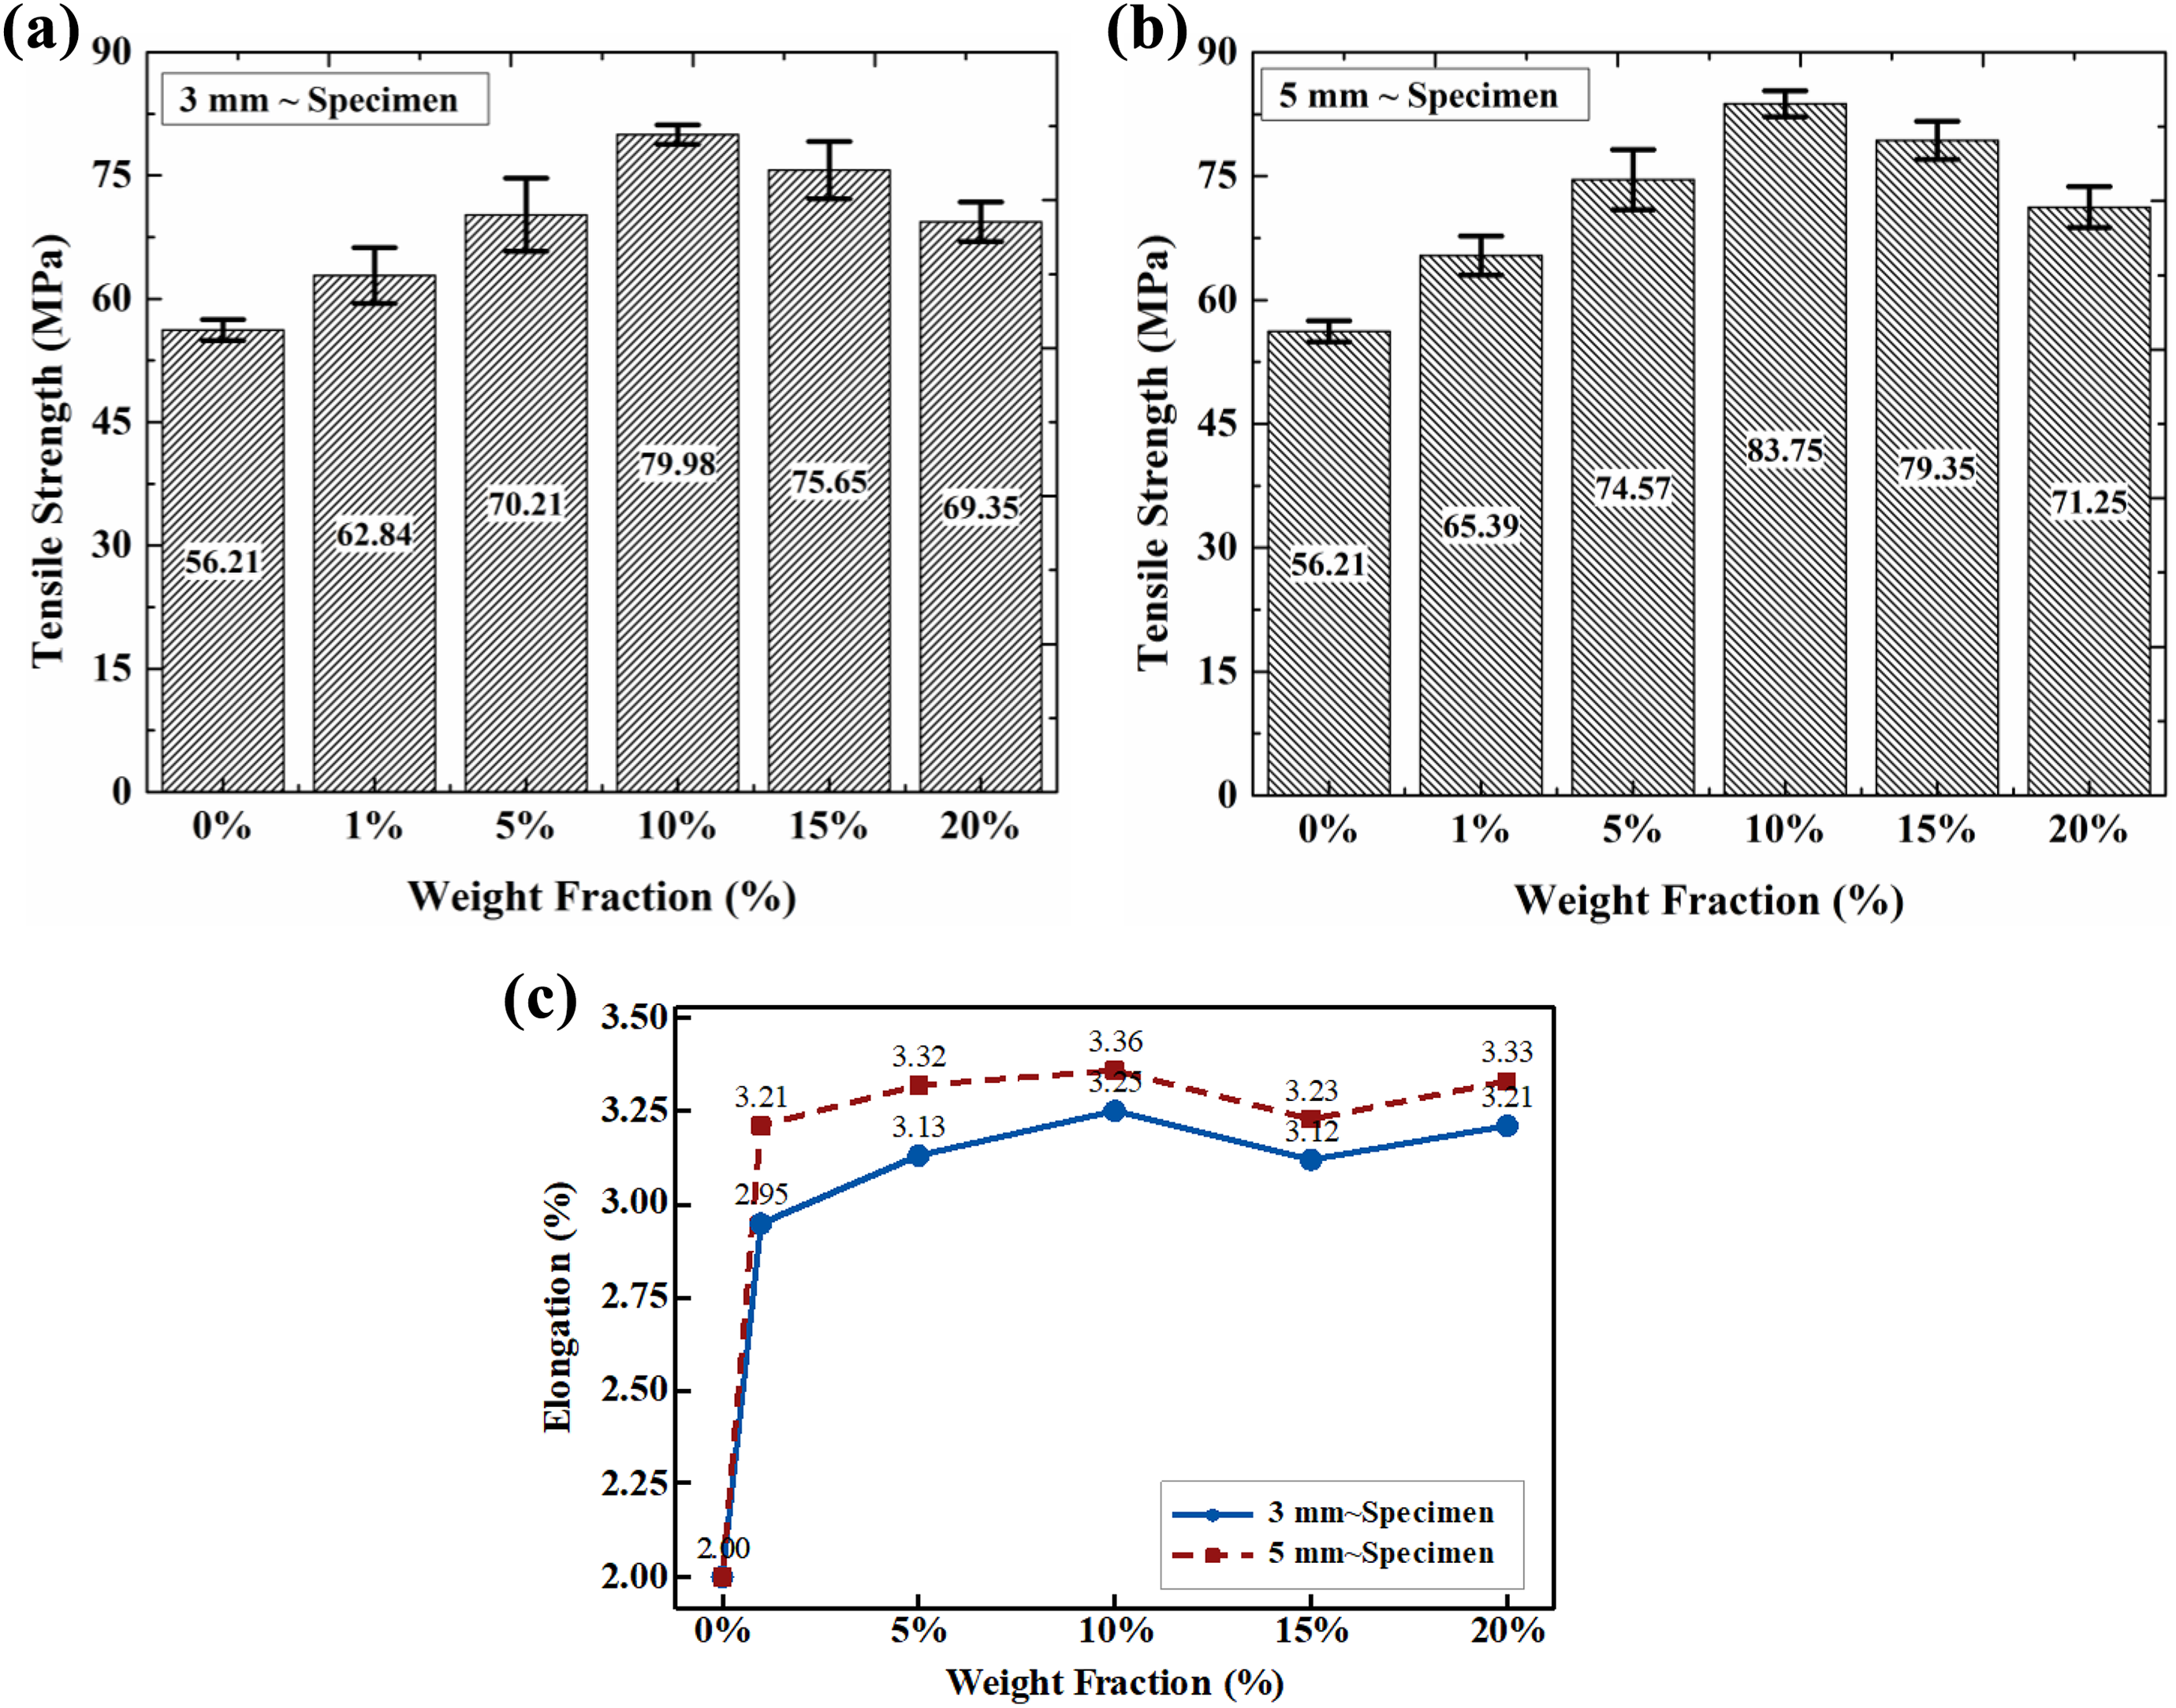
(a) Tensile strength versus weight fraction (%) of (3 mm thick) PLSFRP composites, (b) tensile strength versus weight fraction (%) of (5 mm thick) PLSFRP composites, and (c) elongation (%) versus weight fraction (%) of PLSFRP composites.
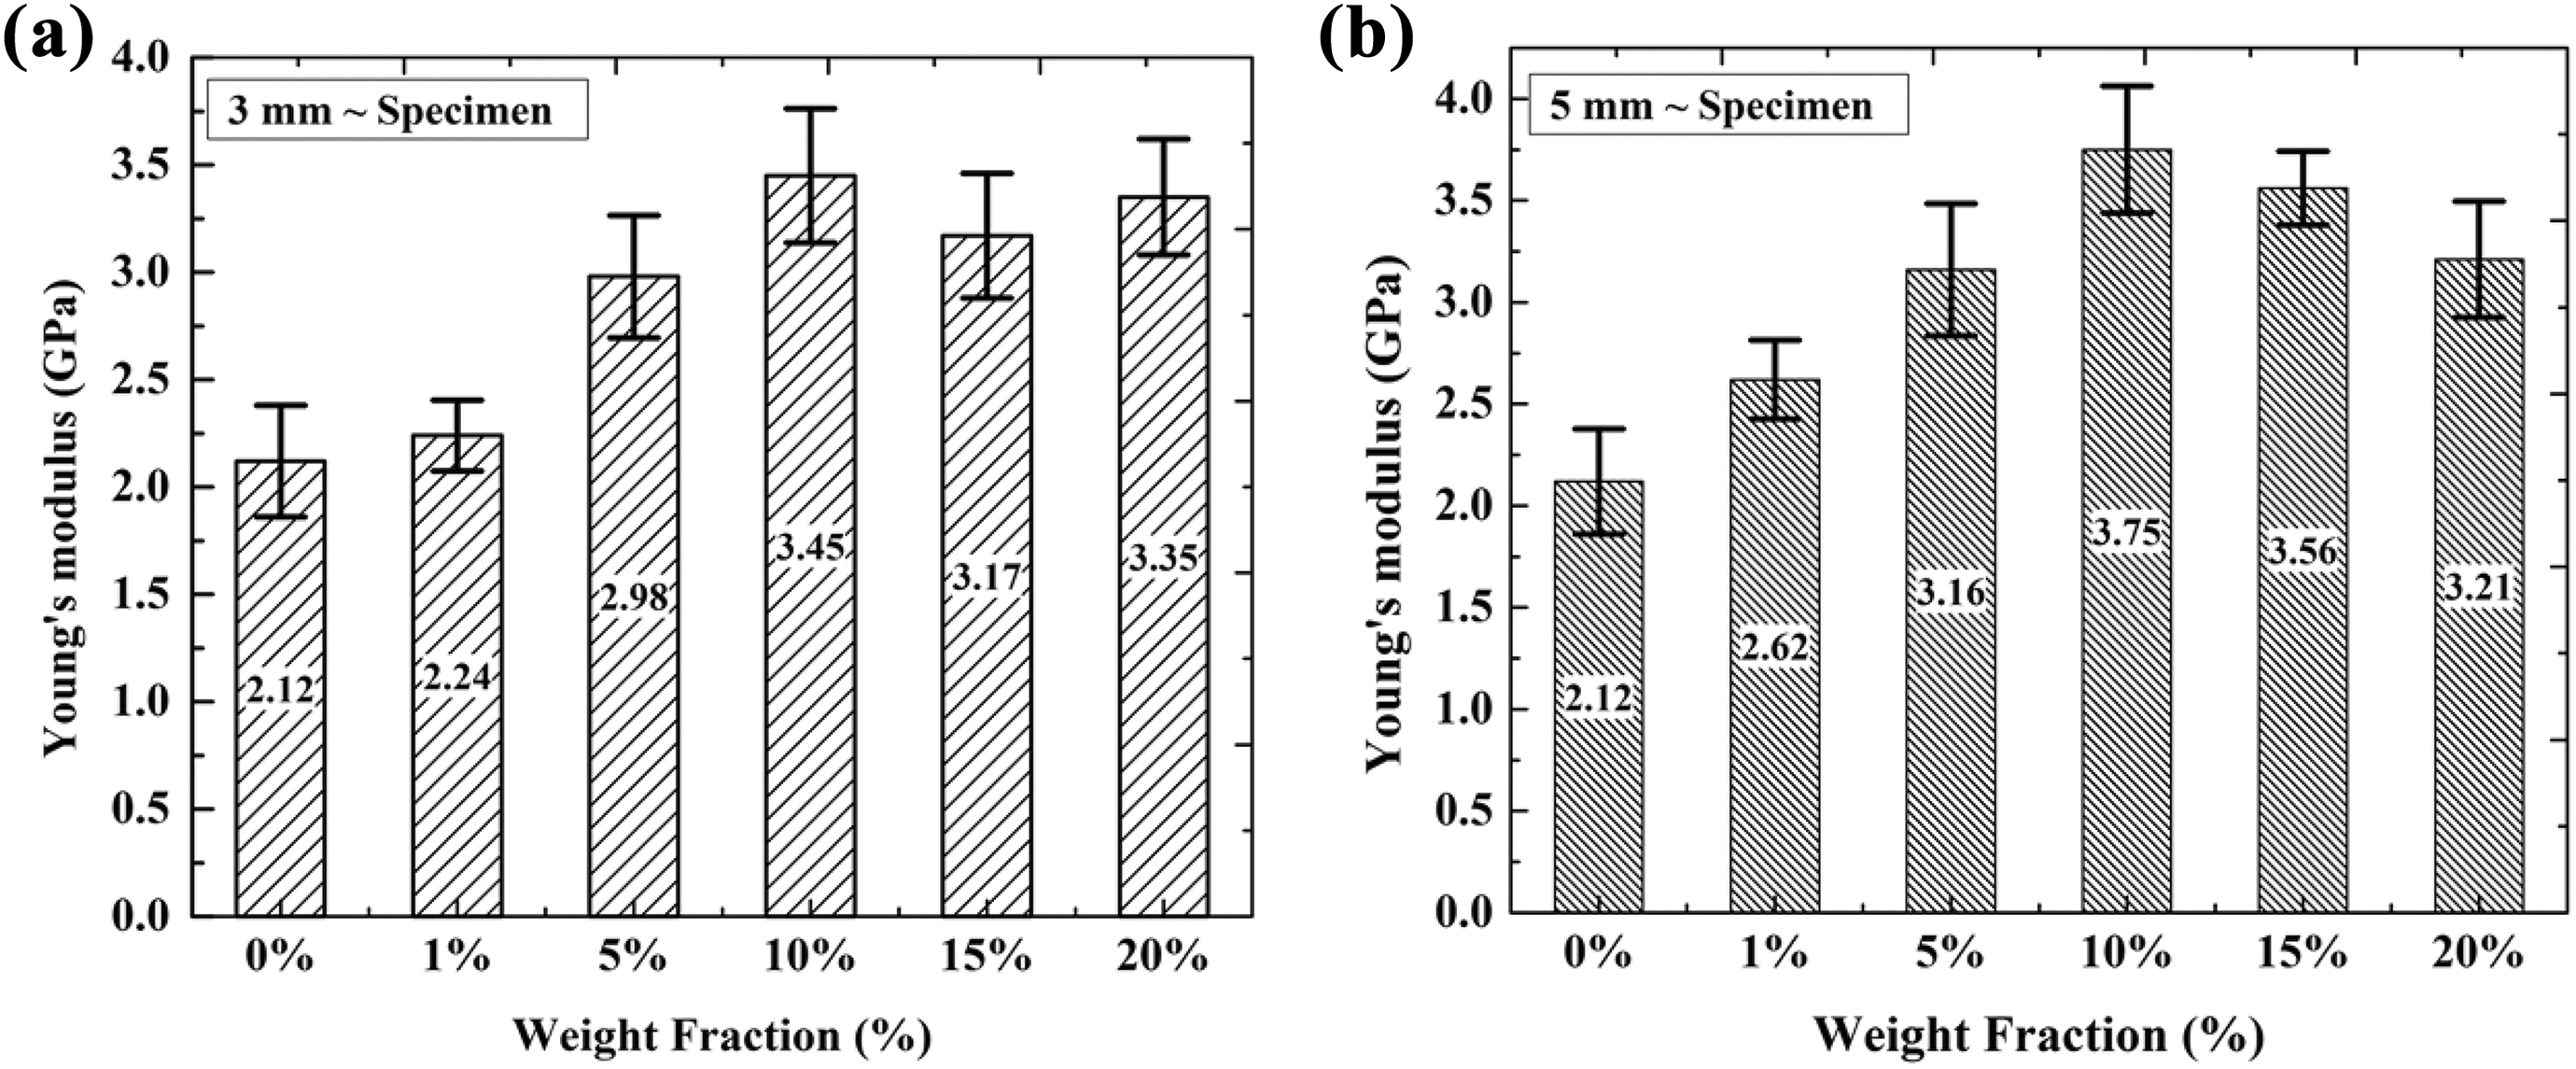
Young’s modulus versus weight fraction (%) of (a) 3-mm-thick PLSFRP composites and (b) 5-mm-thick PLSFRP composites.
On the other hand, graph of elongation versus weight fraction is shown in Figure 8(b). It is observed that elongation percentage (%) at break in both cases increases from 2.0 to 3.25 for 3-mm specimen and 2.0 to 3.32 for 5-mm specimen when the percentage of fiber from 0% to 10%, thereafter, decreases in elongation percentage from 3.20 to 3.12 for 3-mm specimen and 3.56 to 3.21 for 5-mm specimen when percentage of fiber from 15% to 20%. This increment of elongation percentage up to 10% fiber reinforcement and then decrement of elongation percentage after 10% fiber content indicate the increment and decrement in the elasticity of the composites. 12 The plot between Young’s modulus and weight fraction (Figure 9(a) and (b)) indicates that with increase in fiber percentage (%), the Young’s modulus increases in both cases (i.e. 3-mm and 5-mm thickness specimens) which reveals that the material becomes more elastic in nature, that is, the composite specimen with higher percentage (%) of reinforcement withstands more tensile force. As a result, it is clear that an addition of fiber percentage content increases the tensile properties of composites and improves its tendency to withstand more tensile force. The composite specimen with 10% fiber content and higher thickness, that is, 5 mm, is recommended for real applications as it provides better tensile properties and withstands more tensile force.
Flexural properties
The flexural strengths of PLSFRP composite specimens with 0, 1, 5, 10, 15, and 20% of reinforcement are measured for 3-mm and 5-mm specimens with UTM machine and are tabulated in Tables 1 and 2, respectively. Also, tabulated data of flexural strength and modulus of PLSFRP composites for (0, 1, 5, 10, 15, and 20%) fiber compositions are shown in Figures 10(a) and (b) and 11(a) and (b).
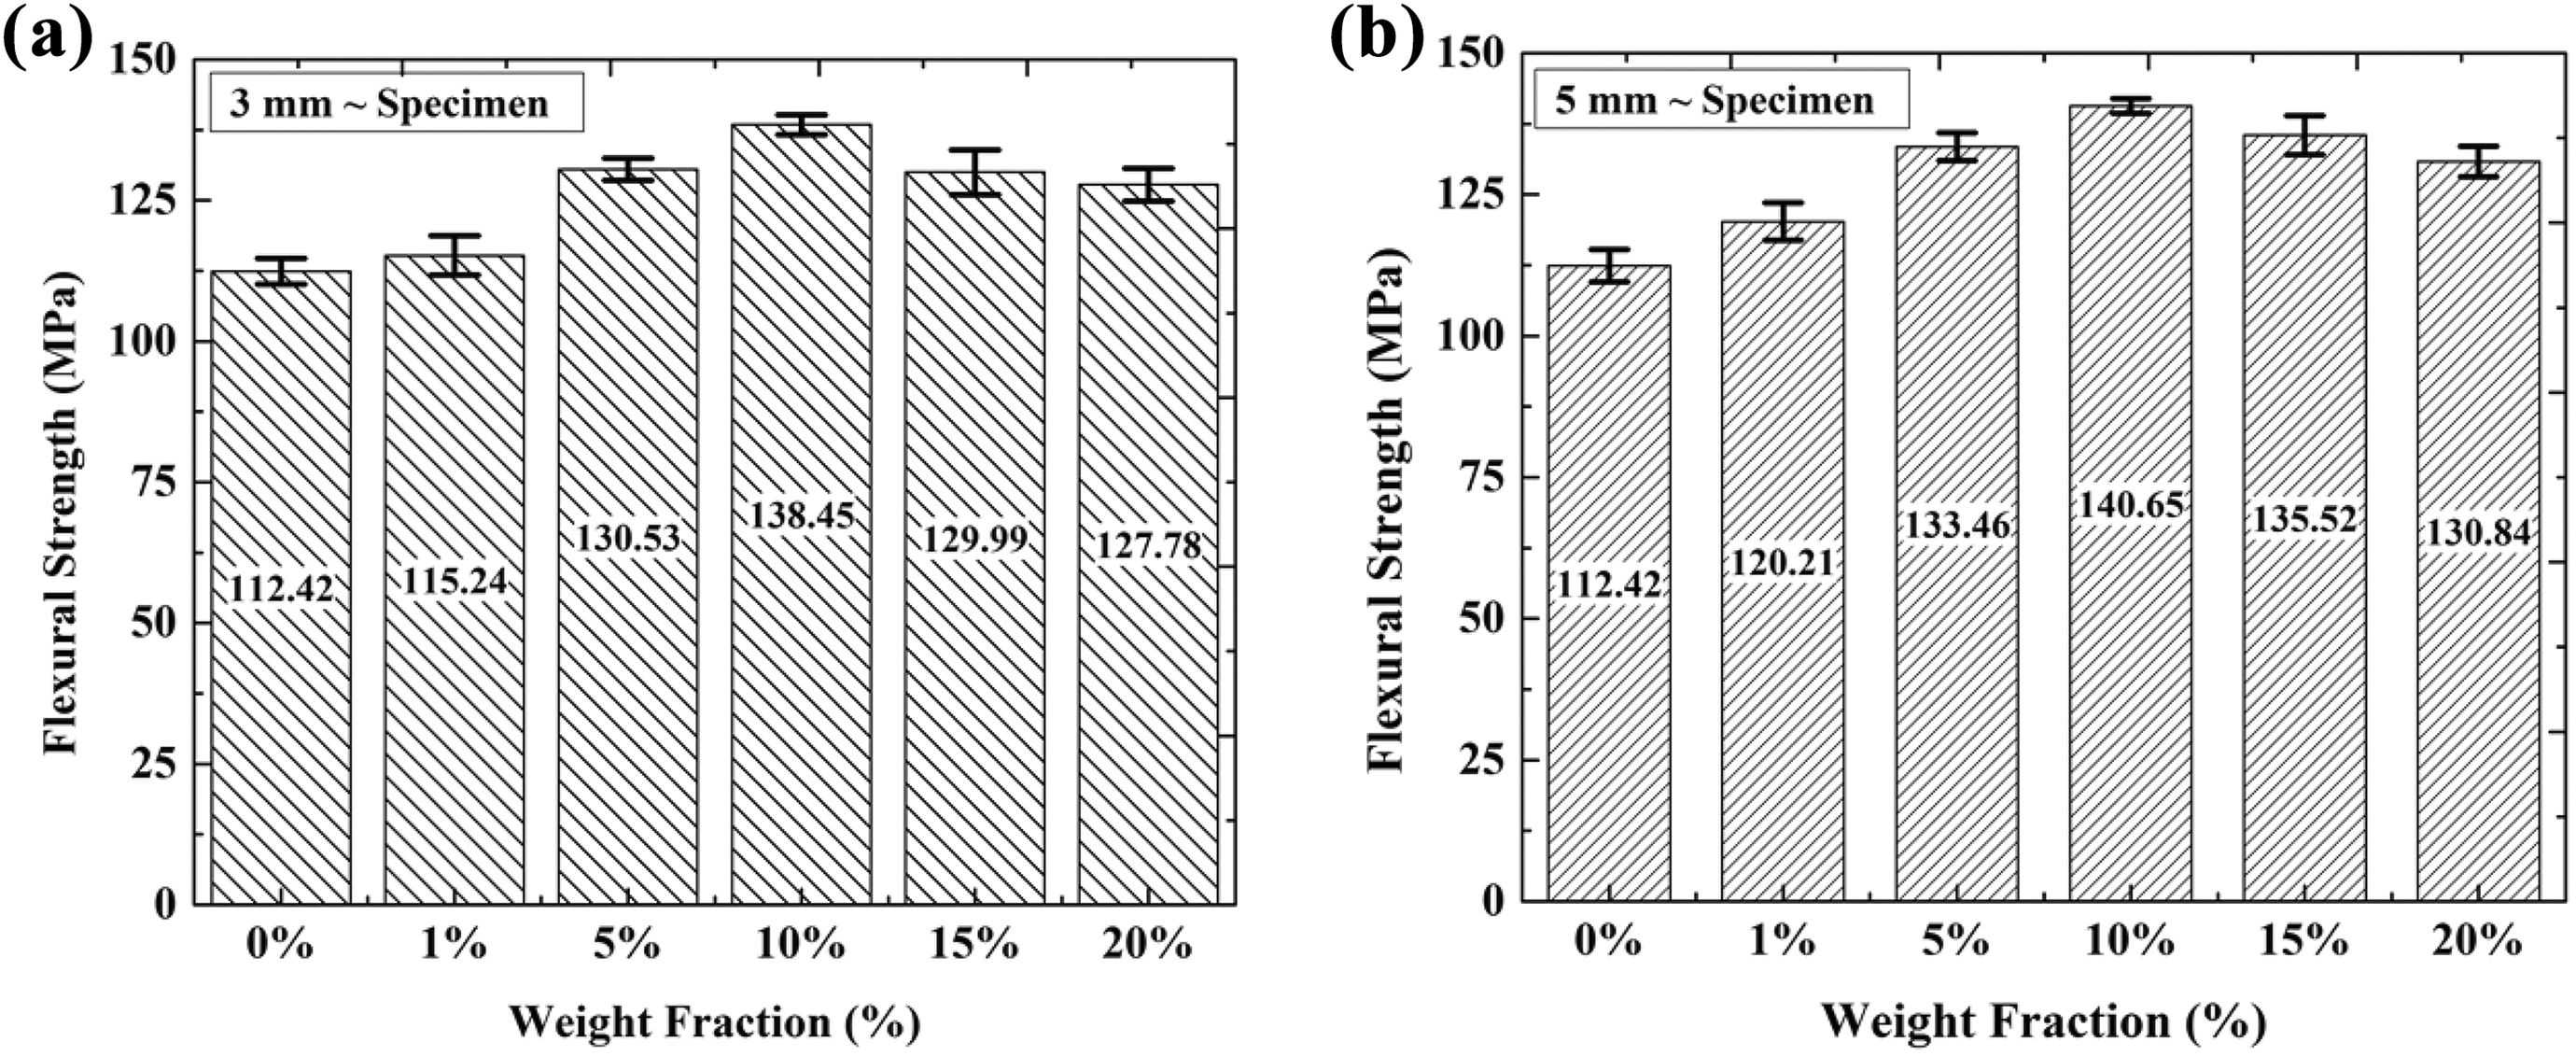
Flexural strength versus weight fraction (%) of (a) 3-mm-thick PLSFRP composites and (b) 5-mm-thick PLSFRP composites.
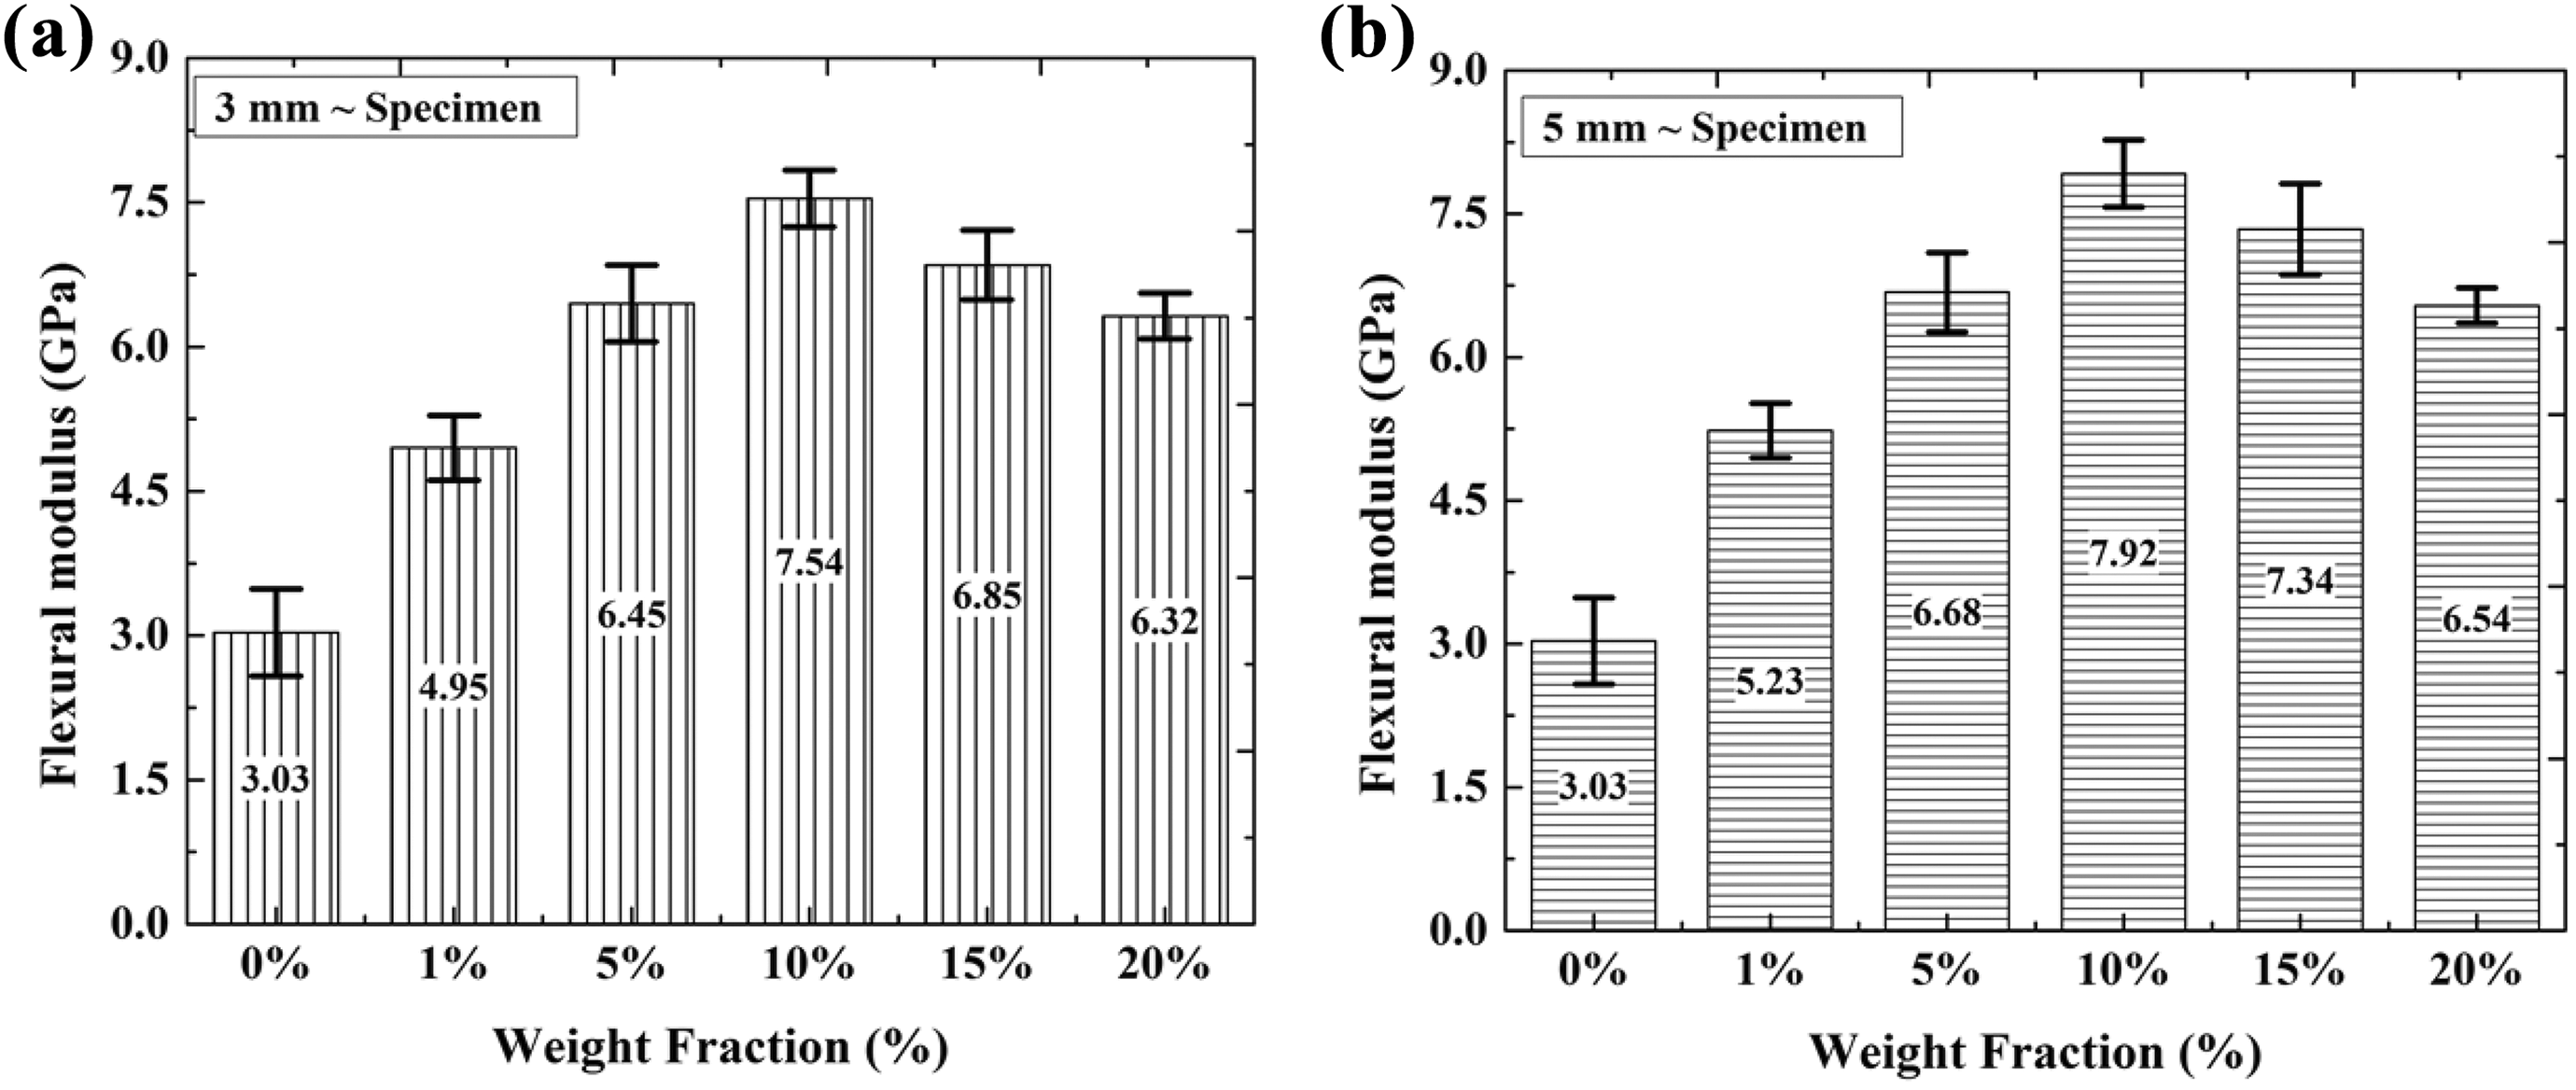
Flexural modulus versus weight fraction (%) of (a) 3-mm-thick PLSFRP composites and (b) 5-mm-thick PLSFRP composites.
It is observed from Figure 10(a) and (b) that, similar pattern as tensile strength, flexural strength increases with increase in volume fraction of pineapple short fibers up to 10% and decreases with further increase in volume fraction of pineapple short fibers. This is because of the inability of matrix to bear and transfer bending load transferred by fibers. This is also because, during the application of gradual load, it is evenly distributed between fibers and epoxy in the composite and starts to fractures when the load exceeds its limits. The maximum value of flexural strength for 3-mm-thick and 5-mm-thick specimens at 10% volume fraction of pineapple short fibers is 138.45 and 140.65 MPa, respectively. Furthermore, flexural strength variation with specimen thickness is due to better bonding and stress transformation in 5-mm-thick specimens compared to the 3-mm-thick specimens.
In spite of the abovementioned results, from Figure 11(a) and (b), it is observed that with increase in volume fraction of fibers, the flexural modulus increases in both cases (i.e. 3-mm and 5-mm thickness specimens), which reveals that the composite material becomes maximum elastic in nature, that is, the composite specimen with higher percentage (%) of reinforcement withstands more bending load. Thus, it is clear that an addition of fiber percentage (%) content increases the flexural properties of composites and improves its tendency to withstand load-bearing capacity and its ability to withstand bending of the composites. 28 The composite specimen with volume fraction of 10% fibers and higher thickness, that is, 5 mm, is recommended for real applications as it provides better flexural properties.
Toughness properties
The amount of energy absorbed by the material up to fracture point is termed as toughness. The toughness of PLSFRP composite (3 and 5 mm) specimens with 0, 1, 5, 10, 15, and 20% of reinforcement computed from Charpy tests is tabulated in Tables 1 and 2, respectively. Also, tabulated data of toughness values of PLSFRP composites for 0, 1, 5, 10, 15, and 20% fiber compositions and for 3- and 5-mm composite specimens are shown in Figure 12(a) and (b). The values in the plot (Figure 12(a) and (b)) indicate that the toughness or impact strength of composite specimen shows little different trend as compared to the tensile and flexural results. The maximum value of impact strength for 3-mm-thick and 5-mm-thick specimens at 20% volume fraction of pineapple short fibers are 98.57 and 99.54 kJ/m2, respectively.
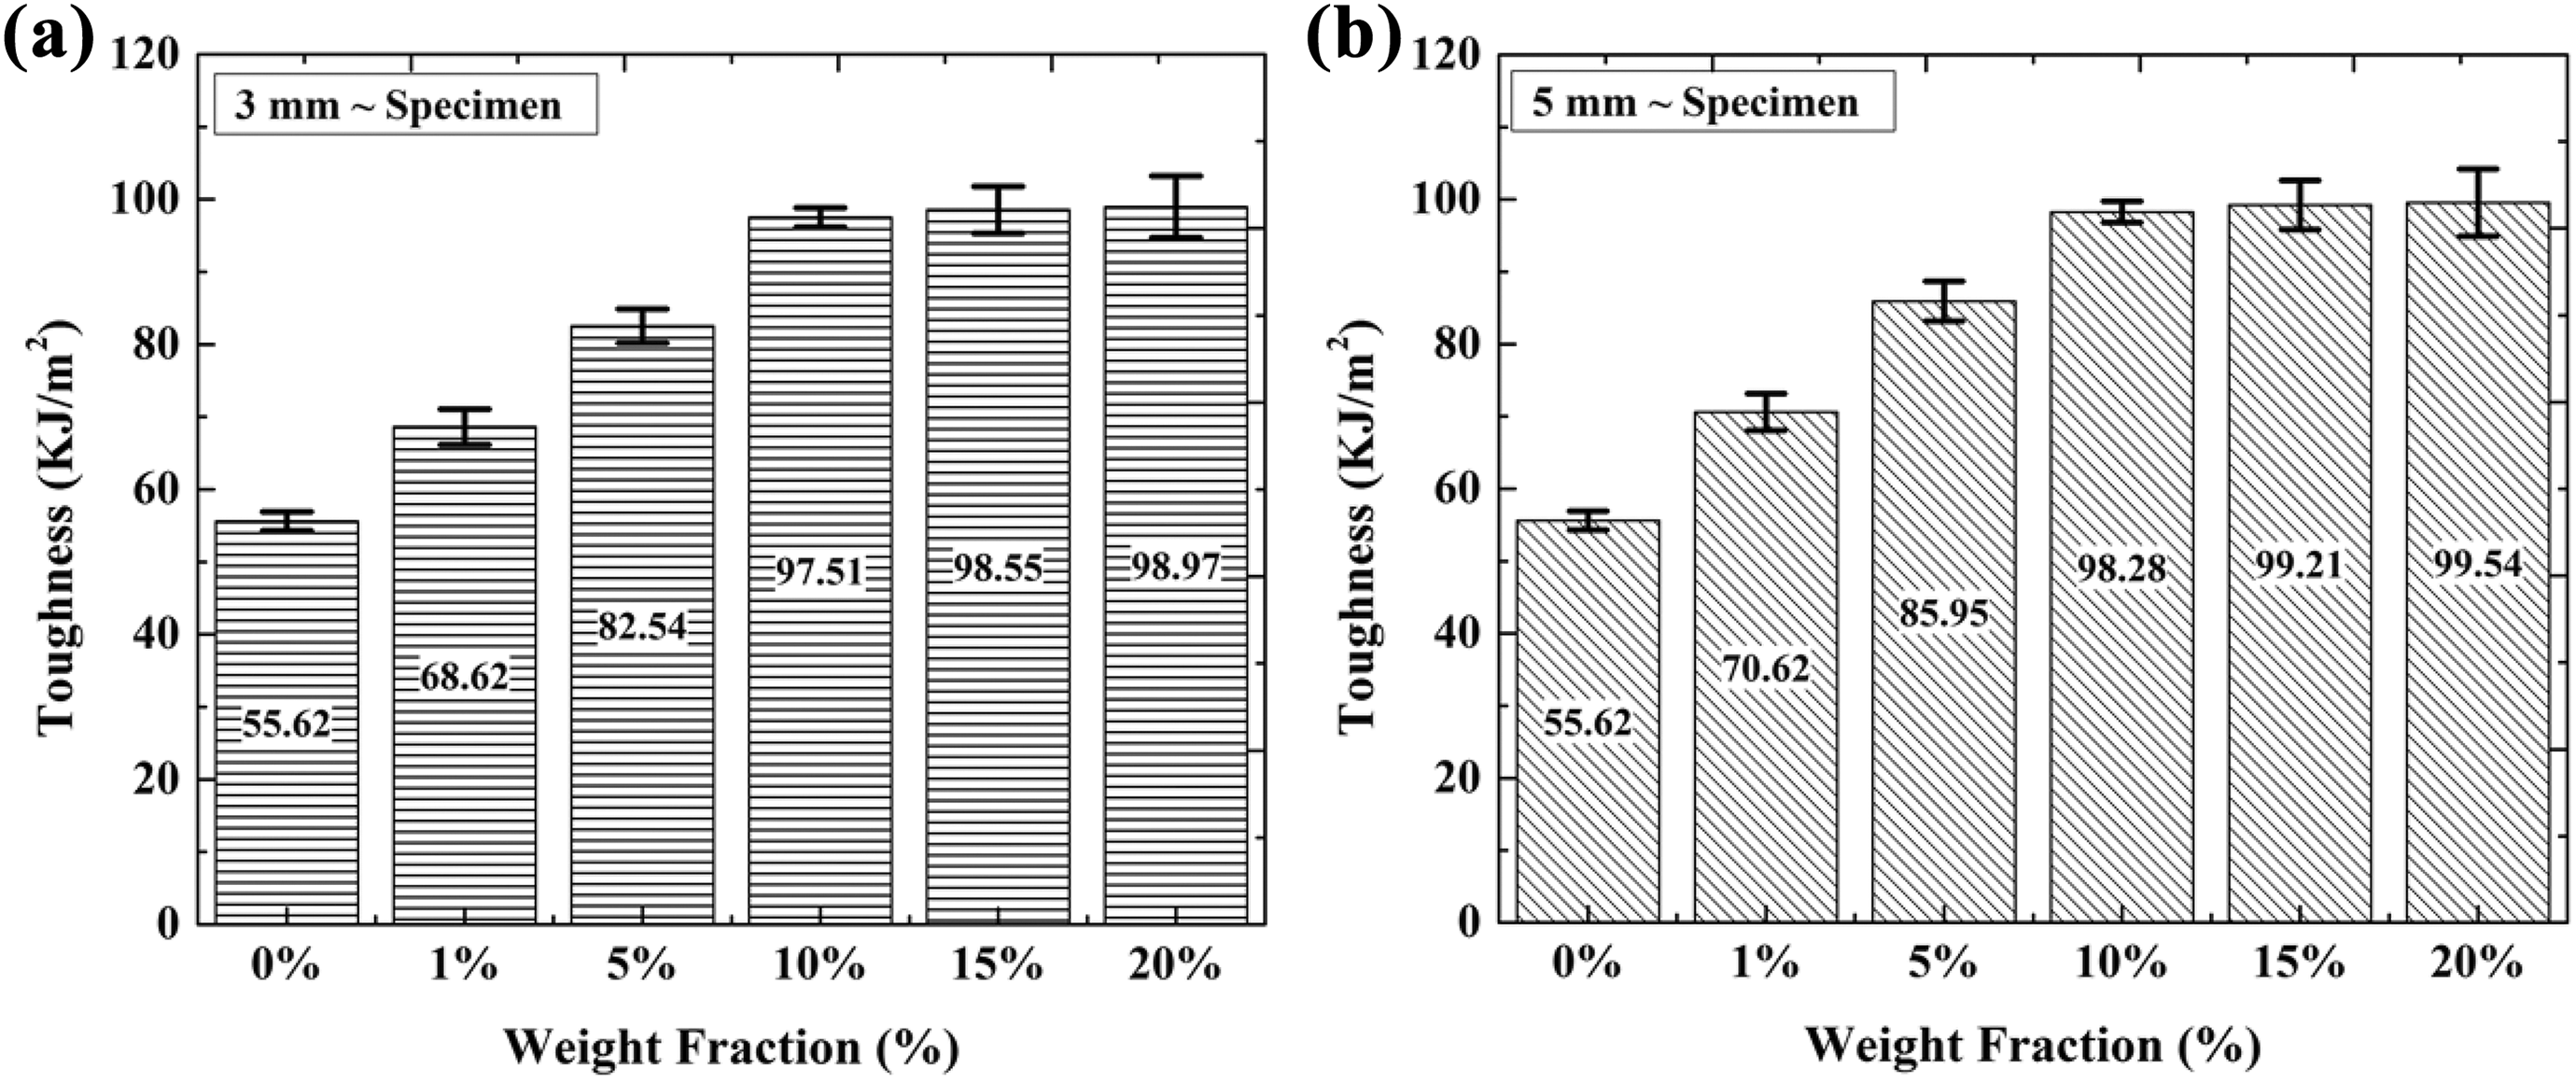
Toughness versus weight fraction (%) of (a) 3-mm-thick PLSFRP composites and (b) 5-mm-thick PLSFRP composites.
Furthermore, the impact strength of the PLSFRP composites is increasing with increase in volume fraction of pineapple leaf–based short fibers and with increase in the specimen thickness. This is due to the fact that, when an impact or sudden load is applied, the fibers act as supporting member to the matrix material, that is, good coupling between the interlaced fibers bundles results in increase in the energy absorption capacity as can be seen in Figure 12(a) and (b). Strong adhesion between the fiber and matrix is also responsible for good resistance to crack propagation during the impact test. 27 Moreover, the toughness of the material is directly proportional to the tensile strength, that is, higher the tensile strength higher will be the toughness. As the toughness values get higher with increase in the percentage (%) of reinforcements as similar to the tensile results. Hence, toughness results are acceptable. Based on the observation, composite specimen with higher volume fraction, that is, in the present case, 20% fiber content and higher thickness, that is, 5 mm, is recommended for the real application, and it provides better impact properties as well as bears larger impact loads.
Hardness properties
The hardness of a material is its resistance to plastic deformation by indentation. The hardness test was performed using digital Rockwell hardness testing machine with a minor load of 10 kg, 1/12″ diameter steel ball, and “M” as a hardness scale. The minor load is applied prior to major load to ensure that the hardness is measured at some thickness within the composite and not on the surface which might have some scratch marks and voids present. The hardness test performed for PLSFRP composite (3 and 5 mm) specimens with 0, 1, 5, 10, 15, and 20% of reinforcement is measured with Rockwell hardness testing machine and tabulated in Tables 1 and 2. Also, tabulated data of hardness values of PLSFRP composites for 0, 1, 5, 10, 15, and 20% fiber compositions and for 3- and 5-mm composite specimens are shown in Figure 13(a) and (b). The graph shows (Figure 13) an incremental pattern with increase in the fiber reinforcement. The maximum value of hardness values for 3-mm-thick and 5-mm-thick specimens at 10% volume fraction of pineapple short fibers is 79.58 and 80.21 HRM, respectively. The increase in hardness with addition of more fibers is due to the fact that increase in the hardness increases the fiber loading and also increases the modulus of the composites which in turns increases the fiber hardness. Furthermore, the hardness of the material is directly proportional to the tensile strength, that is, higher the tensile strength higher will be hardness. As the hardness values get higher with increase in the percentage (%) of reinforcements as similar to the tensile results. Hence, hardness results are acceptable. 29 Based on the observation, composite specimen with higher volume fraction, that is, in the present case, 10% fiber content and higher thickness, that is, 5 mm, is recommended for real applications as it provides better hardness properties as well as material support for machinability.
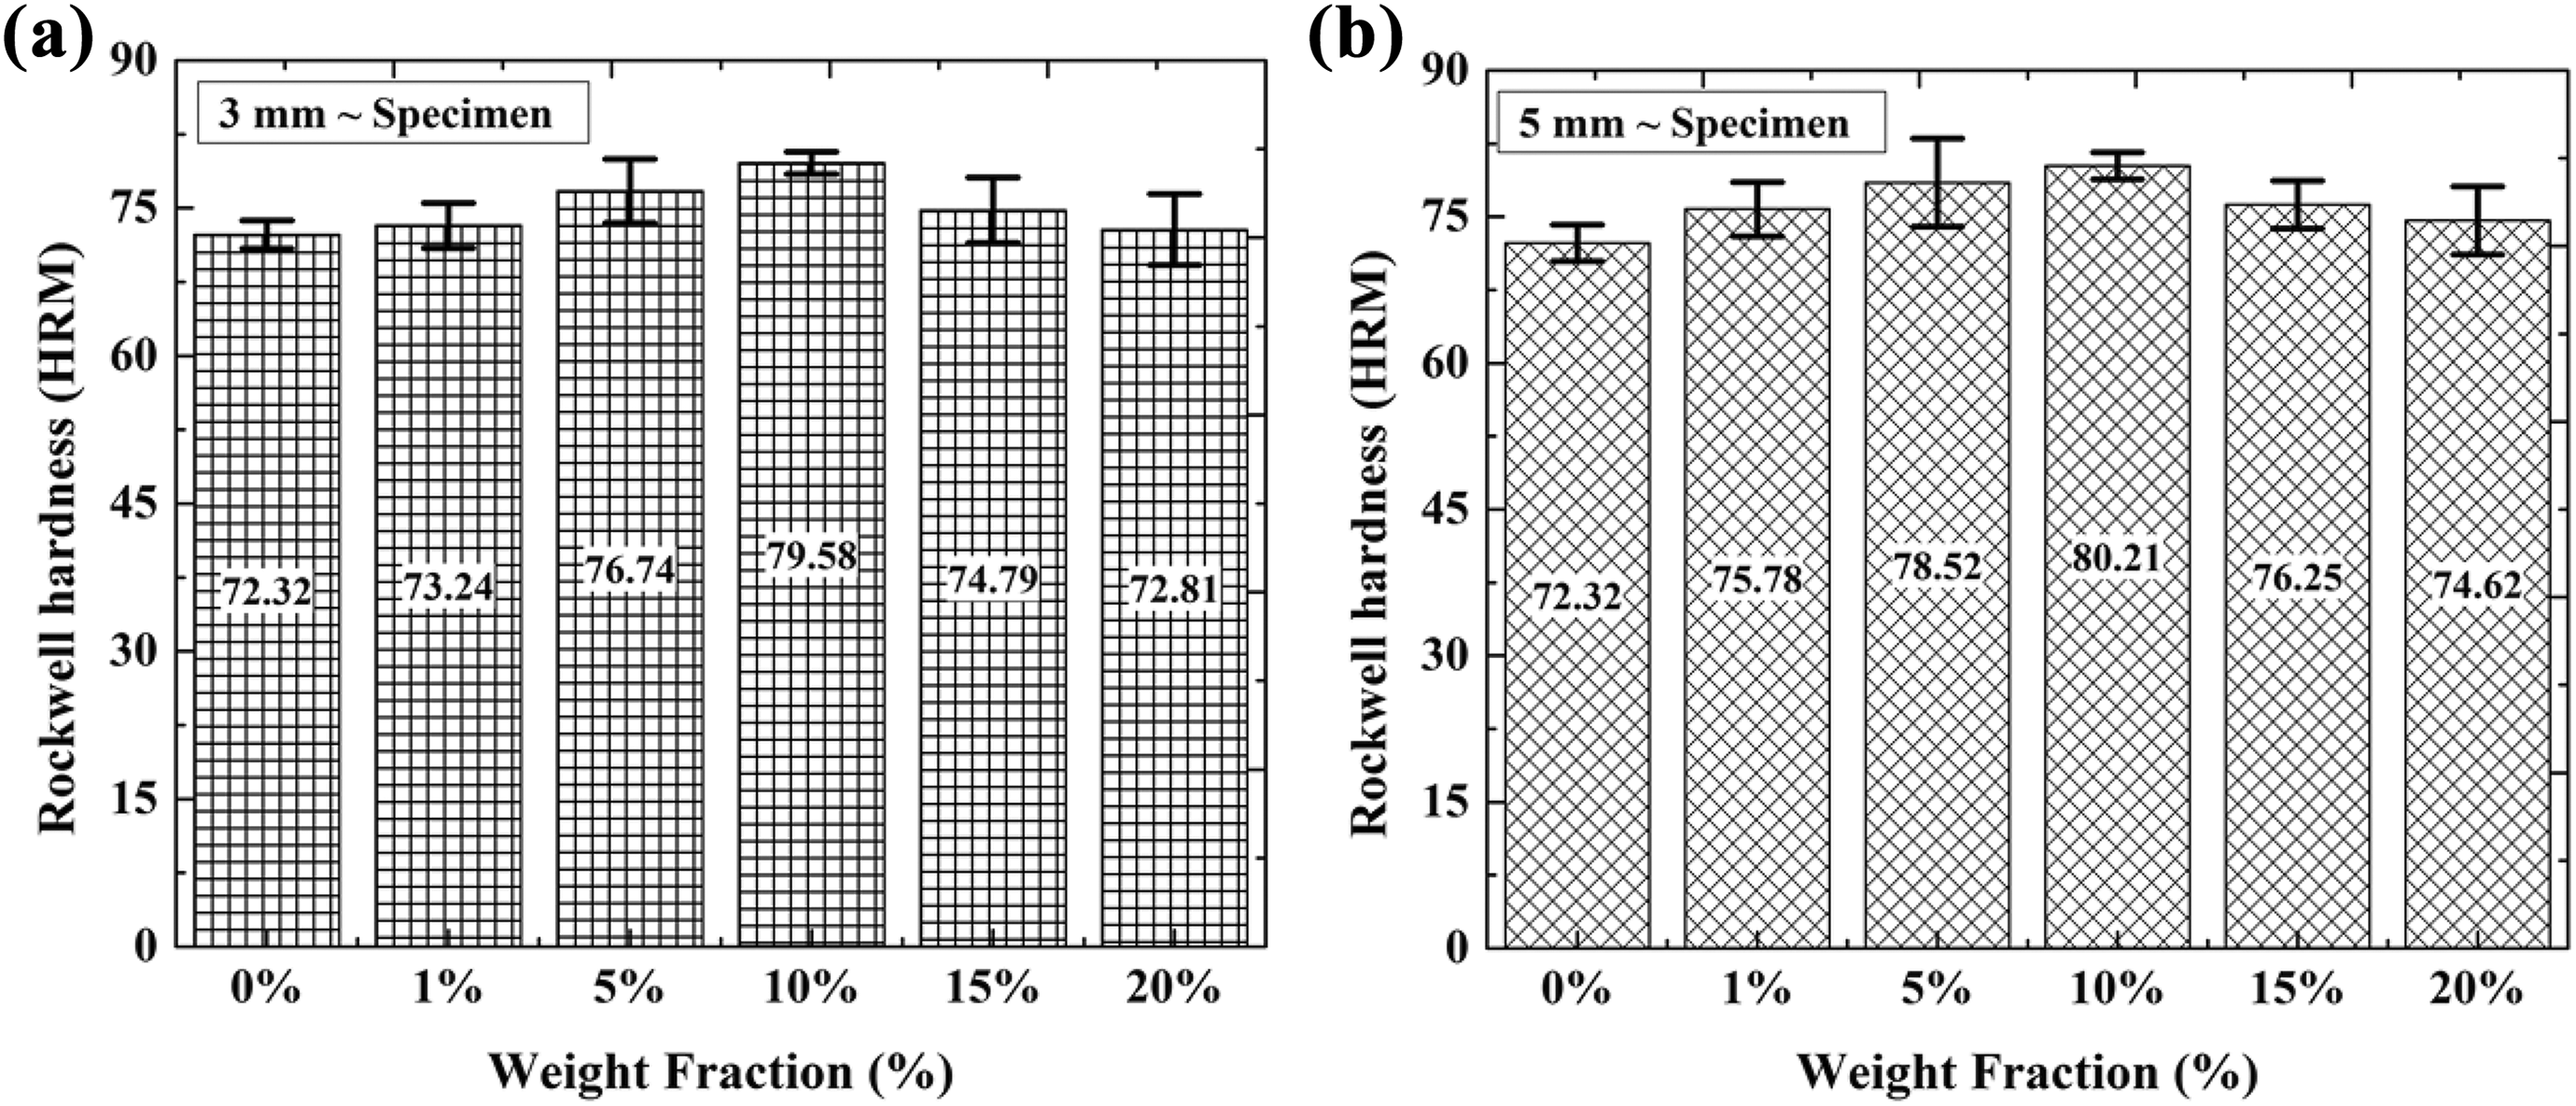
Rockwell hardness versus weight fraction (%) of (a) 3-mm-thick PLSFRP composites and (b) 5-mm-thick PLSFRP composites.
Conclusions
The mechanical properties of PLSFRP composites as a function of fiber composition and composite thickness are studied in the present work. Subsequently, six different fiber compositions (i.e. 0, 1, 5, 10, 15, and 20 wt%) with composite specimen’s thickness (as 3 and 5 mm) are prepared by hand layup process and tested according to the ASTM standards. From the obtained results, following conclusions are drawn.
Maximum tensile strength of 83.75 MPa and flexural strength of 140.65 MPa are observed for the 10% reinforcement with 5-mm thickness composites. This shows that higher percentage of filler composites provides better performance on the tensile and flexural strength and withstands up to 130–140 MPa. The hardness value of PLSFRP composites found to be increased due to the increase in filler percentage content. This reflects better for machinability. The maximum hardness value for PLSFRP composites obtained to be 80.21 HRM for 10% reinforcement to 72.32 HRM for 0% reinforcement. Better toughness of 99.54 kJ/m2 is obtained for 20% PLSFRP composites. This reflects higher capacity of impact force under applications. Also, thickness of the composite specimen plays an important role in increasing the mechanical properties and found that higher thickness provides better results in the PLSFRP composites. It is recommended that 5 mm with 10% PLSFRP composites is used for real application.
Based on the abovementioned observation, the PLSFRP composites with higher fiber percentage and higher thickness are showing better performance than the epoxy-based polymer composites. Hence, it is concluded that PLSFRP composites can be suitable for medium load application such as chair, table, building roof, automotive body panels and packaging materials, and so on.
Footnotes
Acknowledgement
The authors would like to thank Dr Sudipta Halder, Assistant Professor, Department of Mechanical Engineering, NIT Silchar, for providing the necessary resources in material development laboratory, material characterization laboratory, and material testing laboratory at NIT Silchar.
Funding
The author(s) received no financial support for the research, authorship, and/or publication of this article.