
Abstract
This work investigates the mechanical, fracture toughness, and thermomechanical peculiarity of a novel functionally graded materials (FGMs)–based glass fiber–filled polyamide 66 (PA66) composites. FGMs-based PA66 are fabricated through a particularly designed mold and a punch. Punch is a rotating element of the mold and rotates at 1800 r/min for two min for the fabrication of FGMs. Gradation of fibers takes place in FGMs toward the periphery of the punch cavity due to the centrifugal force. Neat PA66 and homogeneous composites are also fabricated through the same mold for comparative study. Punch remains stationary during the fabrication of neat PA66 and homogeneous composites. PA66 granules filled with 15 wt% and 30 wt% of glass fibers are used to manufacture FGMs and homogeneous composites. Ignition loss test, hardness measurement, and scanning electron microscope (SEM) analysis are used to verify the gradation of glass fibers within FGMs. Result analysis concluded that FGMs performed better as compared to neat PA66 and homogeneous composites. FGMs-based thermoplastic composites have full scope to fabricate polymer gears used in low load applications. This manufacturing route shows a promising potential for fabrication of FGMs-based thermoplastics which otherwise is difficult to manufacture because of their high solidification rate at room temperature.
Keywords
Introduction
The application of polymer composites is increasing in recent years to the structural components. Polymer composites having high strength are used as metal substitutes due to their low weight and cost. Fatigue life is one of the important criteria to select polymer composites in structural components. 1 The application of polymer composites is very significant in automobile industry. 2,3 Short glass fiber–filled thermoplastics are used to fabricate complex parts using injection molding because it is appropriate for cost-saving manufacturing. 4 Manufacturing of composite parts with short fiber–reinforced thermoplastics permits interesting processing conditions as compared to thermosetting compounds. It is possible to use the same processing techniques as for unfilled thermoplastics, leading to shorter molding cycles and easier recycling. 5 Short glass fiber–reinforced PA66 are a class of thermoplastic engineering materials. It has growing commercial importance due to its noteworthy thermomechanical properties and ease of manufacturing. 6 Glass fiber reinforcement in polyamide 66 (PA66) leads to a substantial increase in the fracture toughness and impact strength. 7 Frihi et al. 8 found that glass fibers promote a nucleating effect that significantly increases the crystallinity ratio and crystallization kinetics of the PA66 matrix in the composites. PA66 is a hygroscopic thermoplastic material. Maximum water absorption of PA66 can reach up to 2.5% w/w. PA66 is related to the polar amide groups around which water molecules can become coordinated. 9 Ghasemi et al. 10 investigated the effect of PA6 on the mechanical and thermal properties of post-industrial waste PA6 and found that the crystallinity level and crystallization rate and of PA6 (recycled or virgin) become lower due to the presence of PA66. It is also observed from the dynamic mechanical analysis (DMA) that glass fiber–reinforced post-industrial waste PA6 had a faster storage modulus buildup in the absence of PA66, immediately after injection molding. The flexural modulus of PA increases with increase in the reinforcement of short glass fiber. 11 Pan et al. 12 observed that mechanical properties of short glass fiber–filled PA composite increases with the addition of graphene nanosheets. Fatigue and fracture study has been done extensively for the short glass fiber–reinforced PA. 13 –18 Analytical analysis for the fracture of functionally graded materials (FGMs) has been done by researchers. 19 –22 Tribological performance of short glass fiber–reinforced PA66 has also been investigated by the researchers. 23 –26
In last few decades, researchers focus to develop FGMs that can overtake conventional materials. FGMs are the combination of matrix and the reinforcements. Physical and mechanical properties of FGMs can be tailored to meet the functionality for a particular application. FGMs have a wide range of applications such as automotive, biomechanical, civil, aerospace, mechanical, and naval engineering. 27 FGMs initially originated in 1984 in Japan with a particular aim to produce a material which can withstand high thermal barrier. 28 Funabashi and Jang are the key researchers who have done the early research in polymer-based FGM manufacturing. 29,30 Thermal and electrical properties of FGMs are investigated by Funabashi whereas Jang investigated the effect of process parameters on the gradation of filler in the epoxy composites. Effect of process parameters on the gradation of polymer matrix–based FGMs is also investigated by Chand et al. 31 –33 Siddhartha et al. studied the mechanical and wear characterization of fillers-filled FGMs. 34 –36 They found that homogeneous composites performed inferior as compared to their FGMs counterparts. Wear and mechanical characteristics of fillers-filled polymer-based FGMs are also investigated by Singh and Siddhartha. 37,38
Fibers and fillers-filled thermosetting base FGMs has been fabricated by the researchers. However, to the best of author’s knowledge, thermoplastic-based FGMs have not been fabricated so far. The focus of this study is to fabricate glass fiber–filled PA66-based FGMs and compare their mechanical, thermomechanical, and fracture peculiarities with the unfilled PA66 and glass fiber–filled homogeneous PA66 composites.
Philosophy of manufacturing
Thermoplastic materials are used to fabricate polymer gears. Thermoplastic-based FGMs have strong potential to be used in polymer gear applications. An increase in the temperature at the surface of gear tooth increases the wear in polymer gears as these gears are very sensitive to temperature. Fiber-reinforced gears provide a better performance than the neat gears. It happens because fibers increase the hardness and thermal properties of the gear teeth that lead to a reduction in wear and surface temperature of gear teeth. Commercial gears are available with a homogeneous distrbution of the fibers. However, FGM gears have high concentration of fibers in the tooth region and base circle region of gears that increases the hardness and thermal conductivity of the polymer gear tooth. Fibers have higher thermal conductivity in comparison to the thermoplastic materials. Thus, the presence of fibers causes a lower surface temperature and less wear of the gear tooth. The selection of polymer gear material depends on some key factors such as mechanical, thermomechanical, and fracture toughness. This leads to the development of thermoplastic composite materials having excellent mechanical, thermomechanical properties, and fracture toughness. Therefore, thermoplastic-based FGMs are fabricated and examined to verify whether these aspects are achieved.
Experimental details
Fabrication of the injection mold
An injection mold is a primary requirement for the production of thermoplastic components. In this work, an injection mold is designed and developed to fabricate homogeneous composites and FGMs. The importance of injection mold is increased for the fabrication of an innovative component. The Pro-E software (Creo R2.0) is used to design the mold. A pictorial view of the mold design is shown in Figure 1. Steel C45 material is used for each plate of the mold. Punch is the backbone of the fabricated injection mold. It provides the novelty in the present work. FGMs sample fabrication has become possible due to the function of punch. Punch is the rotating member of the mold. Die steel H13 material is used to fabricate the punch. A cavity with 14 mm diameter and 120 mm length is formed at the center (along with the axis) of the punch by a milling operation. This cavity is used to prepare the thermoplastic samples. Punch is shown in Figure 2. For FGMs fabrication, the punch is required to rotate at very high speed (for gradation), and it must be stopped after a fixed interval of time to open the mold. Here, a servomotor with a controller is used into the mold to make it possible. A Panasonic (Mumbai, India) servomotor is employed into the mold. A pictorial view of the mold with servomotor is shown in Figure 3. Servomotor is supplied by the company, Lubi Electronics, Gandhinagar, Gujarat, India. Mold is fabricated at Precision Moulds & Plastic Components, Ghaziabad, Uttar Pradesh, India.
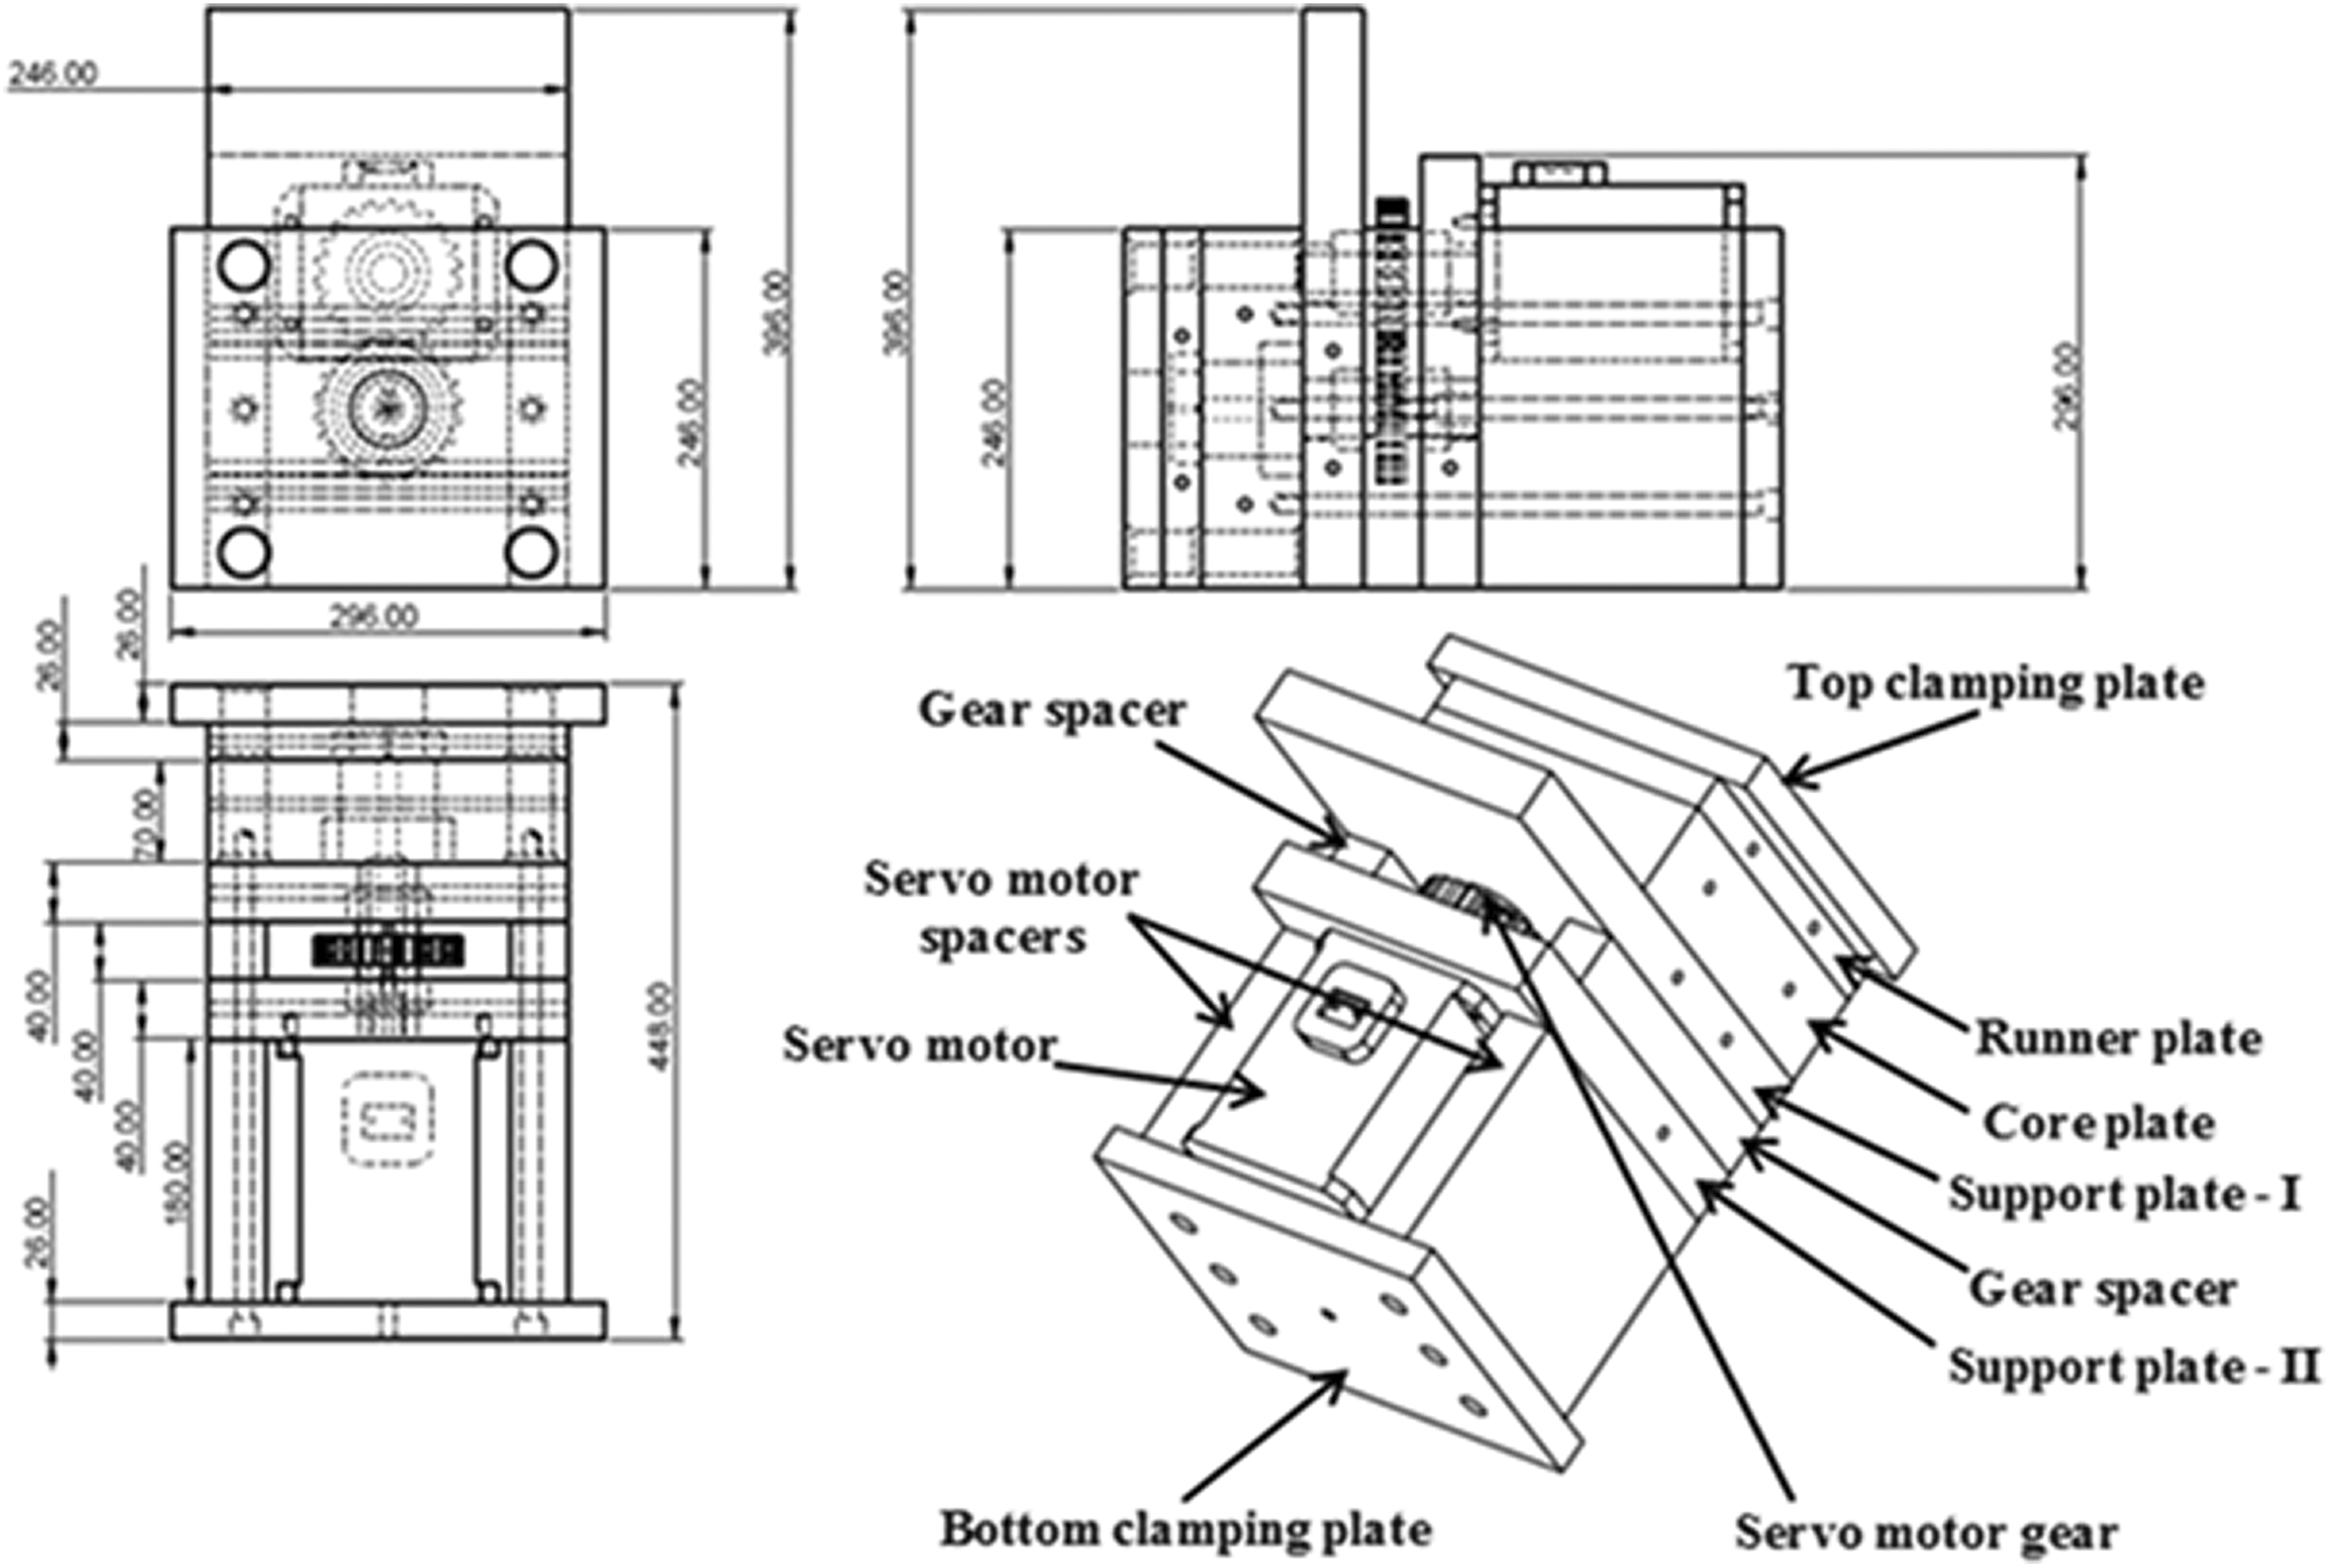
Pictorial view of the mold design on Pro-E Software.
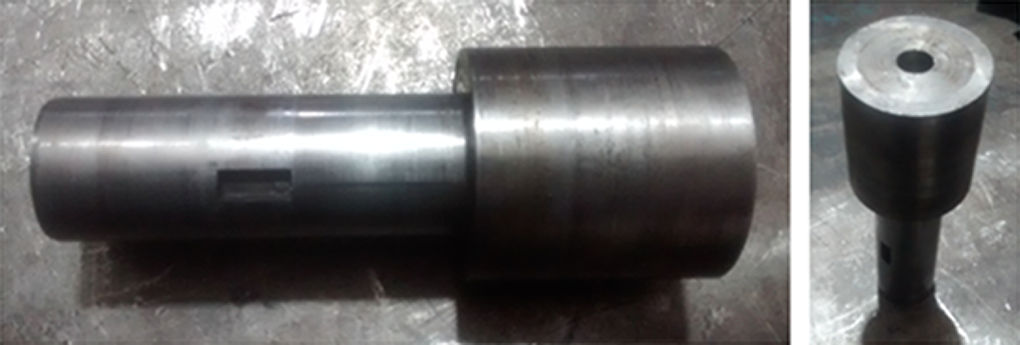
Pictorial view of the punch.
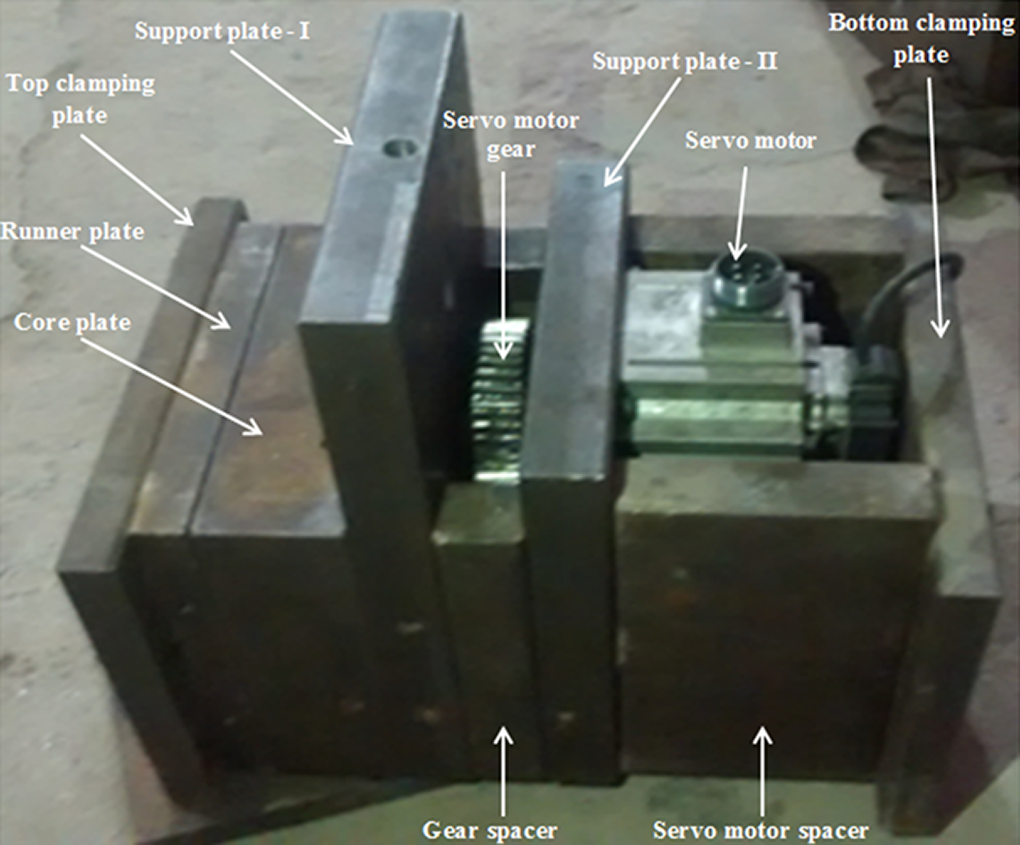
Pictorial view of the fabricated mold.
Fabrication of the specimens
PA66 granules reinforced with glass fibers are used for the fabrication of FGMs. Proportions of 15 wt% and 30 wt% glass fiber–reinforced PA66 granules are used to fabricate FGMs. PA66 granules are preheated in the dryer at 90°C for 3 h before injection molding to remove the moisture content. The injection pressure of 7 MPa and barrel temperatures of 190°C, 200°C, and 210°C at three zones are used for the neat PA66 fabrication. Barrel temperatures of 210°C, 220°C, 230°C and 220°C, 230°C, 240°C are used for the fabrication of 15% and 30% glass fiber–filled polymer samples, respectively. Punch is rotated for 2 min at 1800 r/min after filling the molten material into the punch cavity to fabricate FGMs specimen. PA66 matrix–based homogeneous composites are also prepared for same weight percentage of glass fiber. Punch is kept stationary for homogeneous composite(s) fabrication. The neat PA66 sample is fabricated for comparative study. The designated density and diameter of the glass fiber are 2.54 g/cc and 10 µm, respectively. The density of PA66 is 1.14 g/cm3. Fabricated samples are shown in Figure 4.
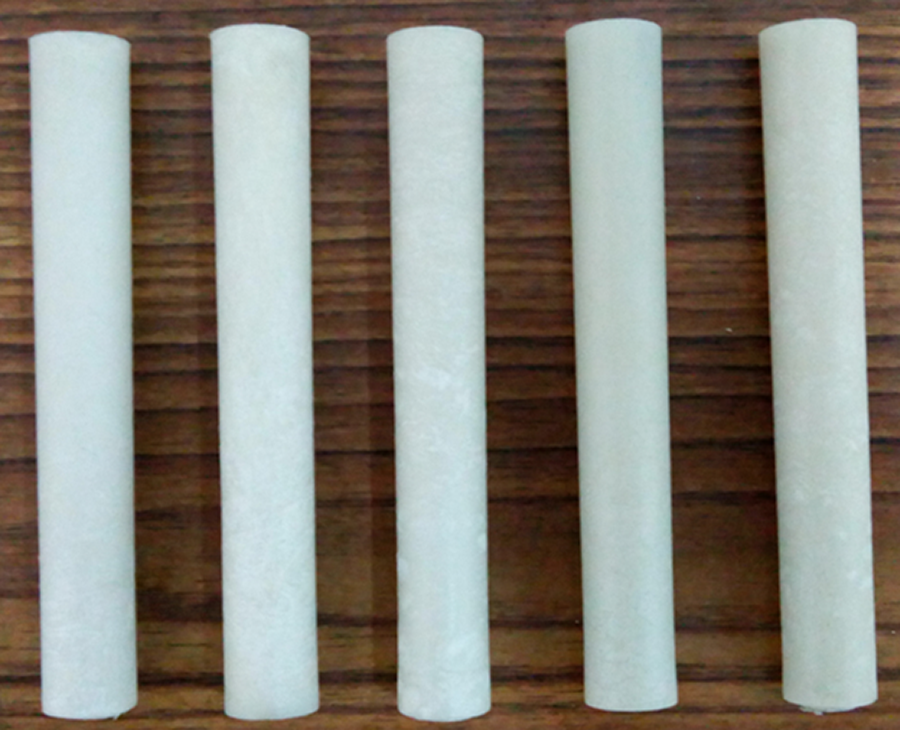
Pictorial view of fabricated samples (a) unfilled PA66, (b) homogeneous composite filled with 15 wt% glass fiber, (c) FGM filled with 15 wt% glass fiber, (d) homogeneous composite filled with 30 wt% glass fiber, and (e) FGM filled with 30 wt% glass fiber.
Methodology to verify the gradation in FGMs specimen
The gradation of fibers in FGMs samples is verified using three techniques, that is, scanning electron (SEM) analysis, hardness test, and ignition loss method. The SEM analysis of homogeneous and FGMs samples is carried out on a LEO SEM (Chennai, India) machine to understand the distribution of fibers. A sample having a diameter of 13 mm and thickness of 4 mm is used for SEM analysis. SEM images are taken at four different locations on the surface of 30 wt% glass fiber–reinforced homogeneous composite and FGM as shown in Figure 5. These four locations are identified from core to periphery, that is, location R0 (approximately 0 mm), location R2 (approximately 2 mm), location R4 (approximately 4 mm), and location R6 (approximately 6 mm). A low-speed precession saw is used to cut the samples for SEM analysis. These samples are rubbed on an emery paper (320 grit size) and then a gold coating is applied before SEM analysis.
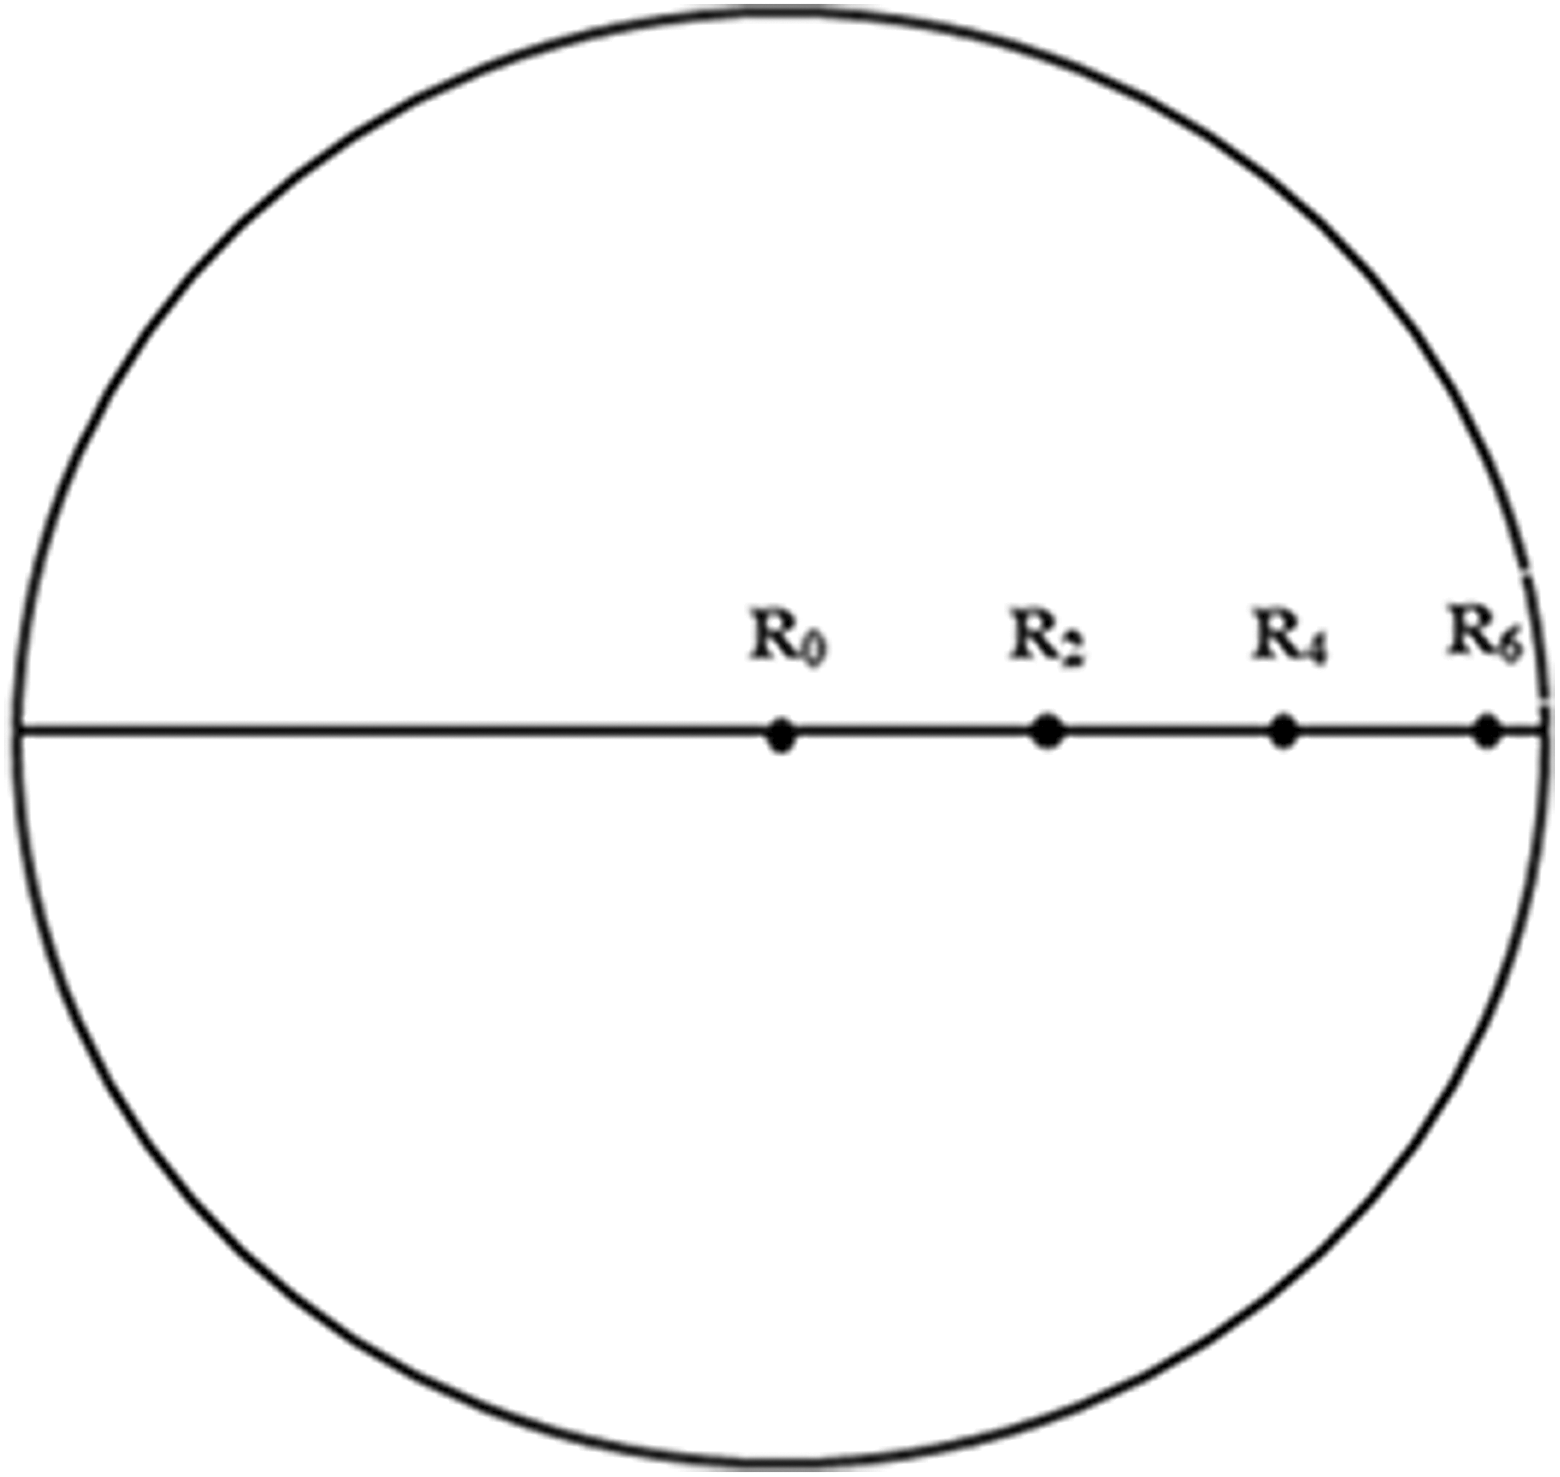
Representation of locations for SEM and hardness test.
A digital durometer is used to measure the hardness of each sample as per ASTM D2240 standard. Each sample has a diameter of 13 mm and thickness of 6 mm. Hardness is measured at four different locations as shown in Figure 5. Hardness value at each location is measured five times and an average of all five values is taken. Again, samples for hardness test are cut using low-speed precession saw.
Samples for ignition loss test are prepared by step turning of homogeneous composites and FGMs using lathe machine as per ASTM D2584 standard. Actual diameter of the specimen is 13 mm, whereas step diameters are taken as 4 mm, 8 mm, and 12 mm, as shown in Figure 6. A length of 20 mm is cut for each step diameter of homogeneous composites and FGMs to be used for ignition loss test. These cut samples are burnt in an electric muffle furnace at the temperature of 565°C ± 28°C using crucible. The weight of the remaining glass fibers is measured on an electronic weighing machine. Ignition loss test for each homogeneous composites and FGMs is carried out using three samples and the average of all three values is taken. Ignition loss of homogeneous and FGMs specimens is calculated as follows

where W1 is the weight of the sample in grams and W2 is the weight of residue in grams.
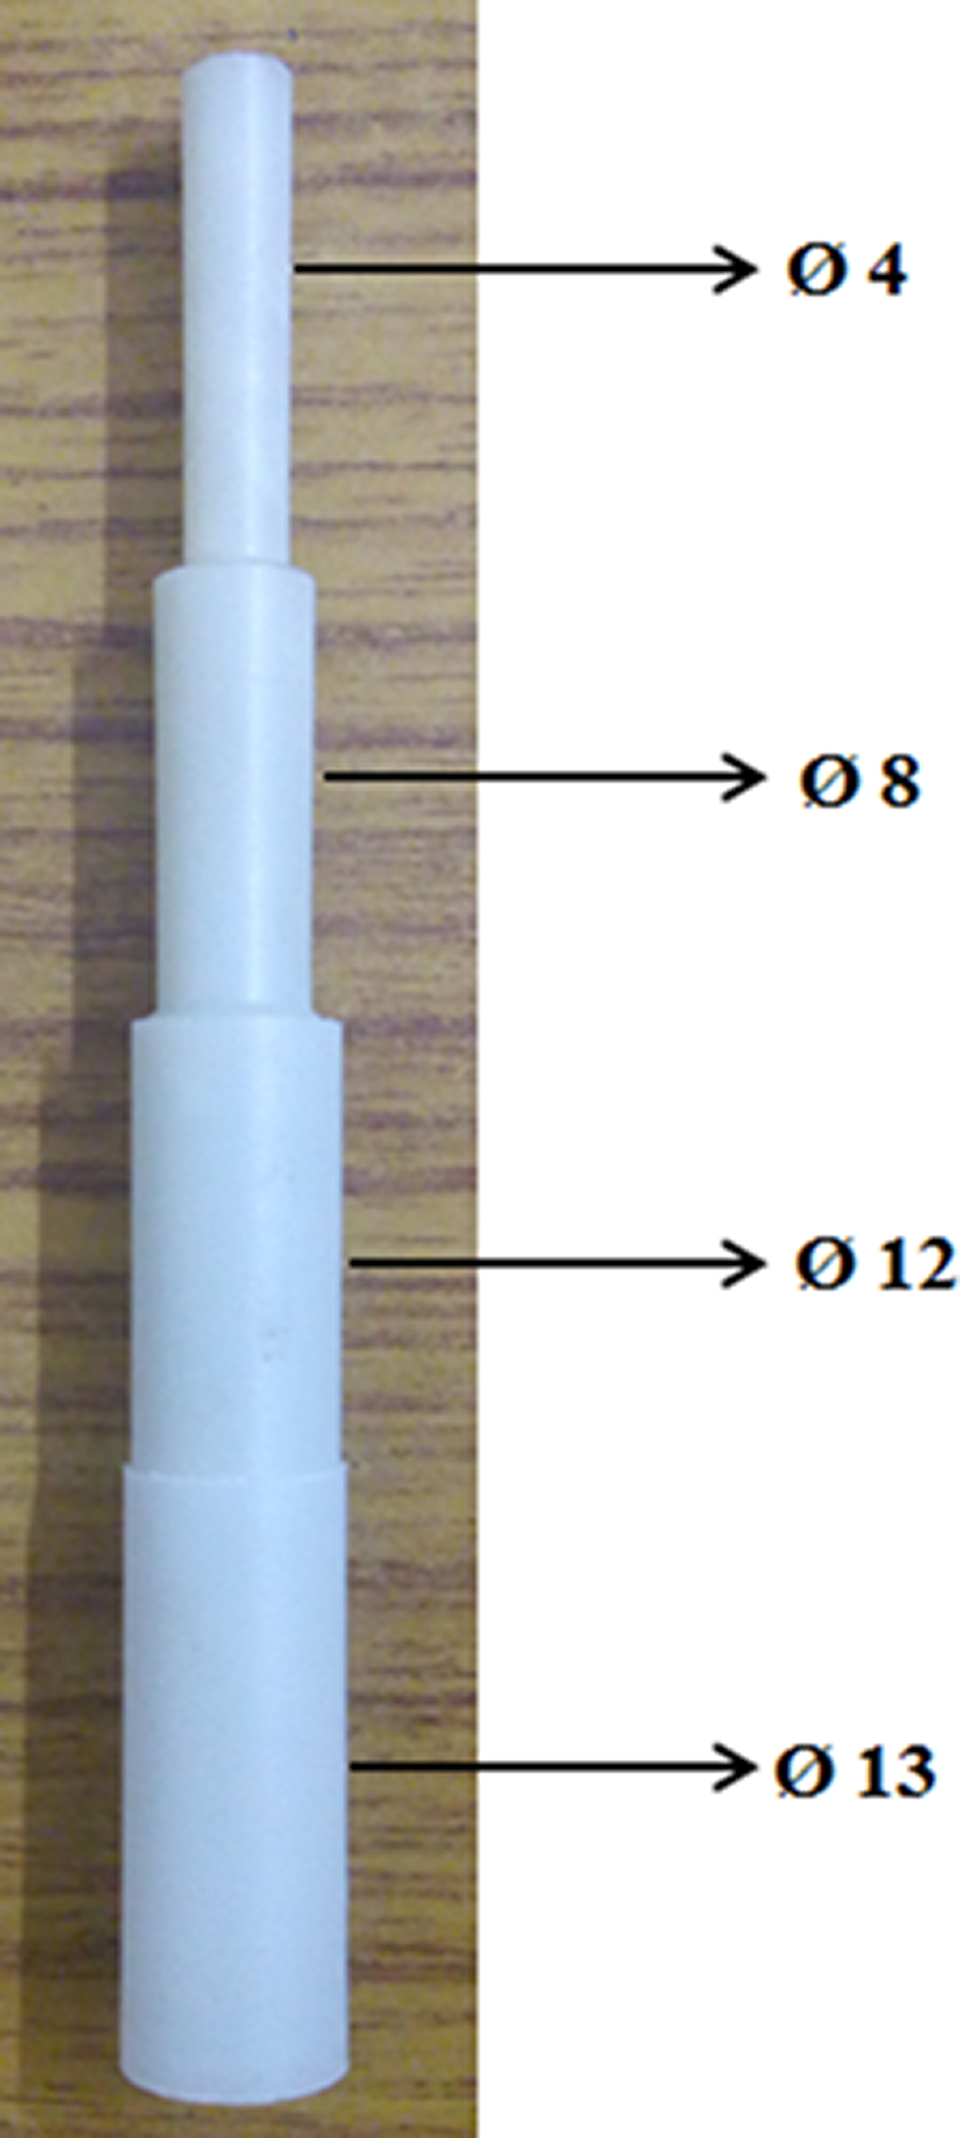
Photographic view of specimen prepared for ignition loss test.
Physical, thermomechanical, and fracture characterization
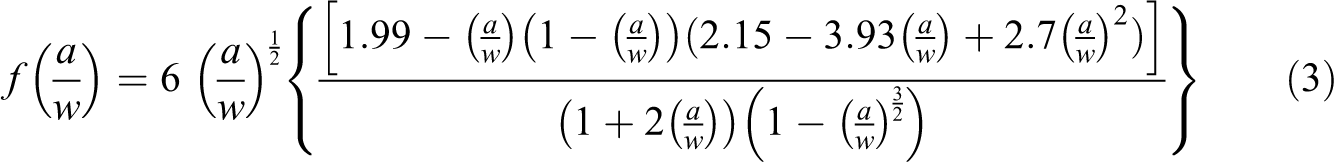
The physical characterization helps to measure the densities and void fraction of the fabricated specimens. Theoretical density of the specimen is measured using the formula given by Agarwal and Broutman. 39 Experimental density is measured by the principle of water displacement. Universal testing machine (UTM), Hounsfield H25KS (Shanghai, China), is used for mechanical characterization of the specimen. The tensile strength of specimen is obtained as per ASTM D3039 standard. The displacement rate of the head for the tensile test was 2 mm/min. Flexure strength is measured as per ASTM D7264 standard with a test speed of 1 mm/min. The compression test is carried out as per ASTM D695 standard. Test speed of 1.6 mm/min is used for the compression test. Fracture toughness (KIC) is evaluated as per ASTM D5045 with a crosshead rate of 10 mm/min. Fracture toughness is measured by three-point-single end notch bend (SENB) test (Figure 7). A diamond cutter was used for providing different crack length in the middle of the specimen for fracture analysis. Crack length for each composite composition is taken as 1 mm, 2 mm, 3 mm, and 4 mm. The fracture toughness is calculated using equations (2) and (3).

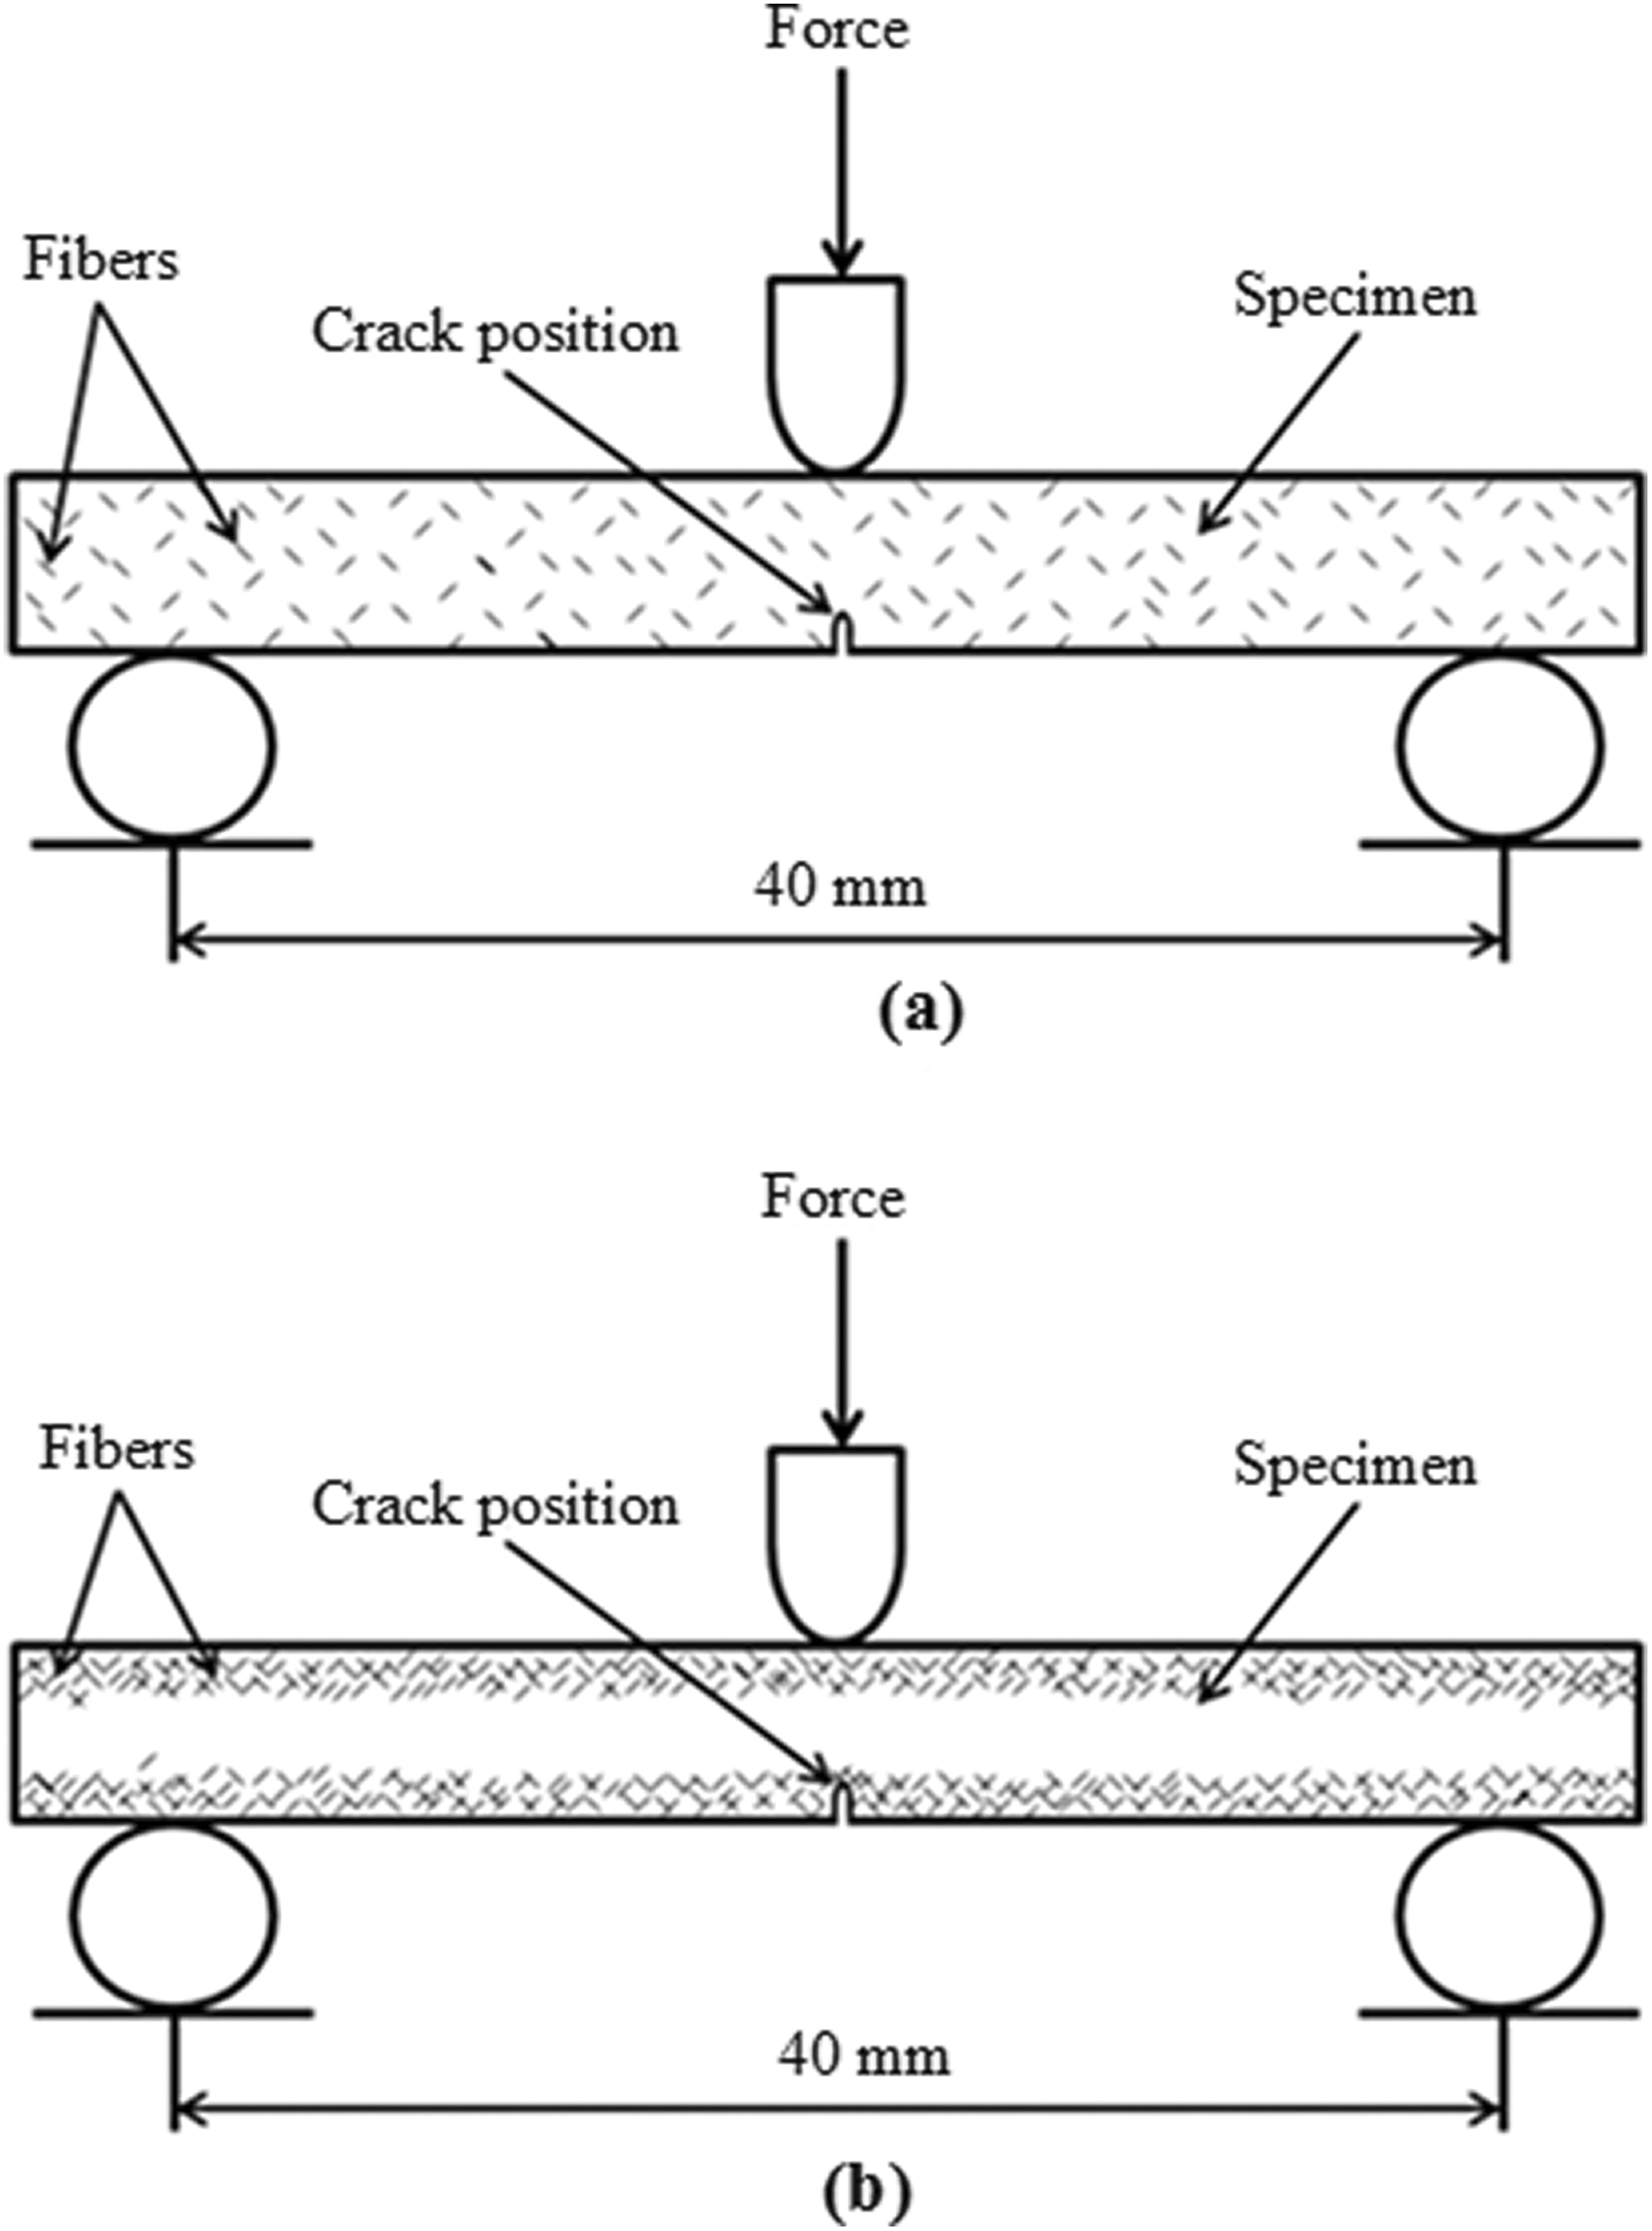
Configuration for fracture testing (a) homogeneous composites and (b) FGMs.
Cylindrical shaped samples are prepared by a diamond cutter and used for mechanical, fracture, and thermomechanical characterization. A schematic diagram of the sample preparation is shown in Figure 8. DMA is carried out as per ASTM D5023 standard using a dynamic mechanical analyzer supplied by PerkinElmer (Thane, India). A temperature range of 25–150°C with a constant frequency of 1 Hz is used for DMA. The thermal conductivity of specimens is measured as per ISO 22007-2 standard using a Hot Disk TPS 500 (New Delhi, India).
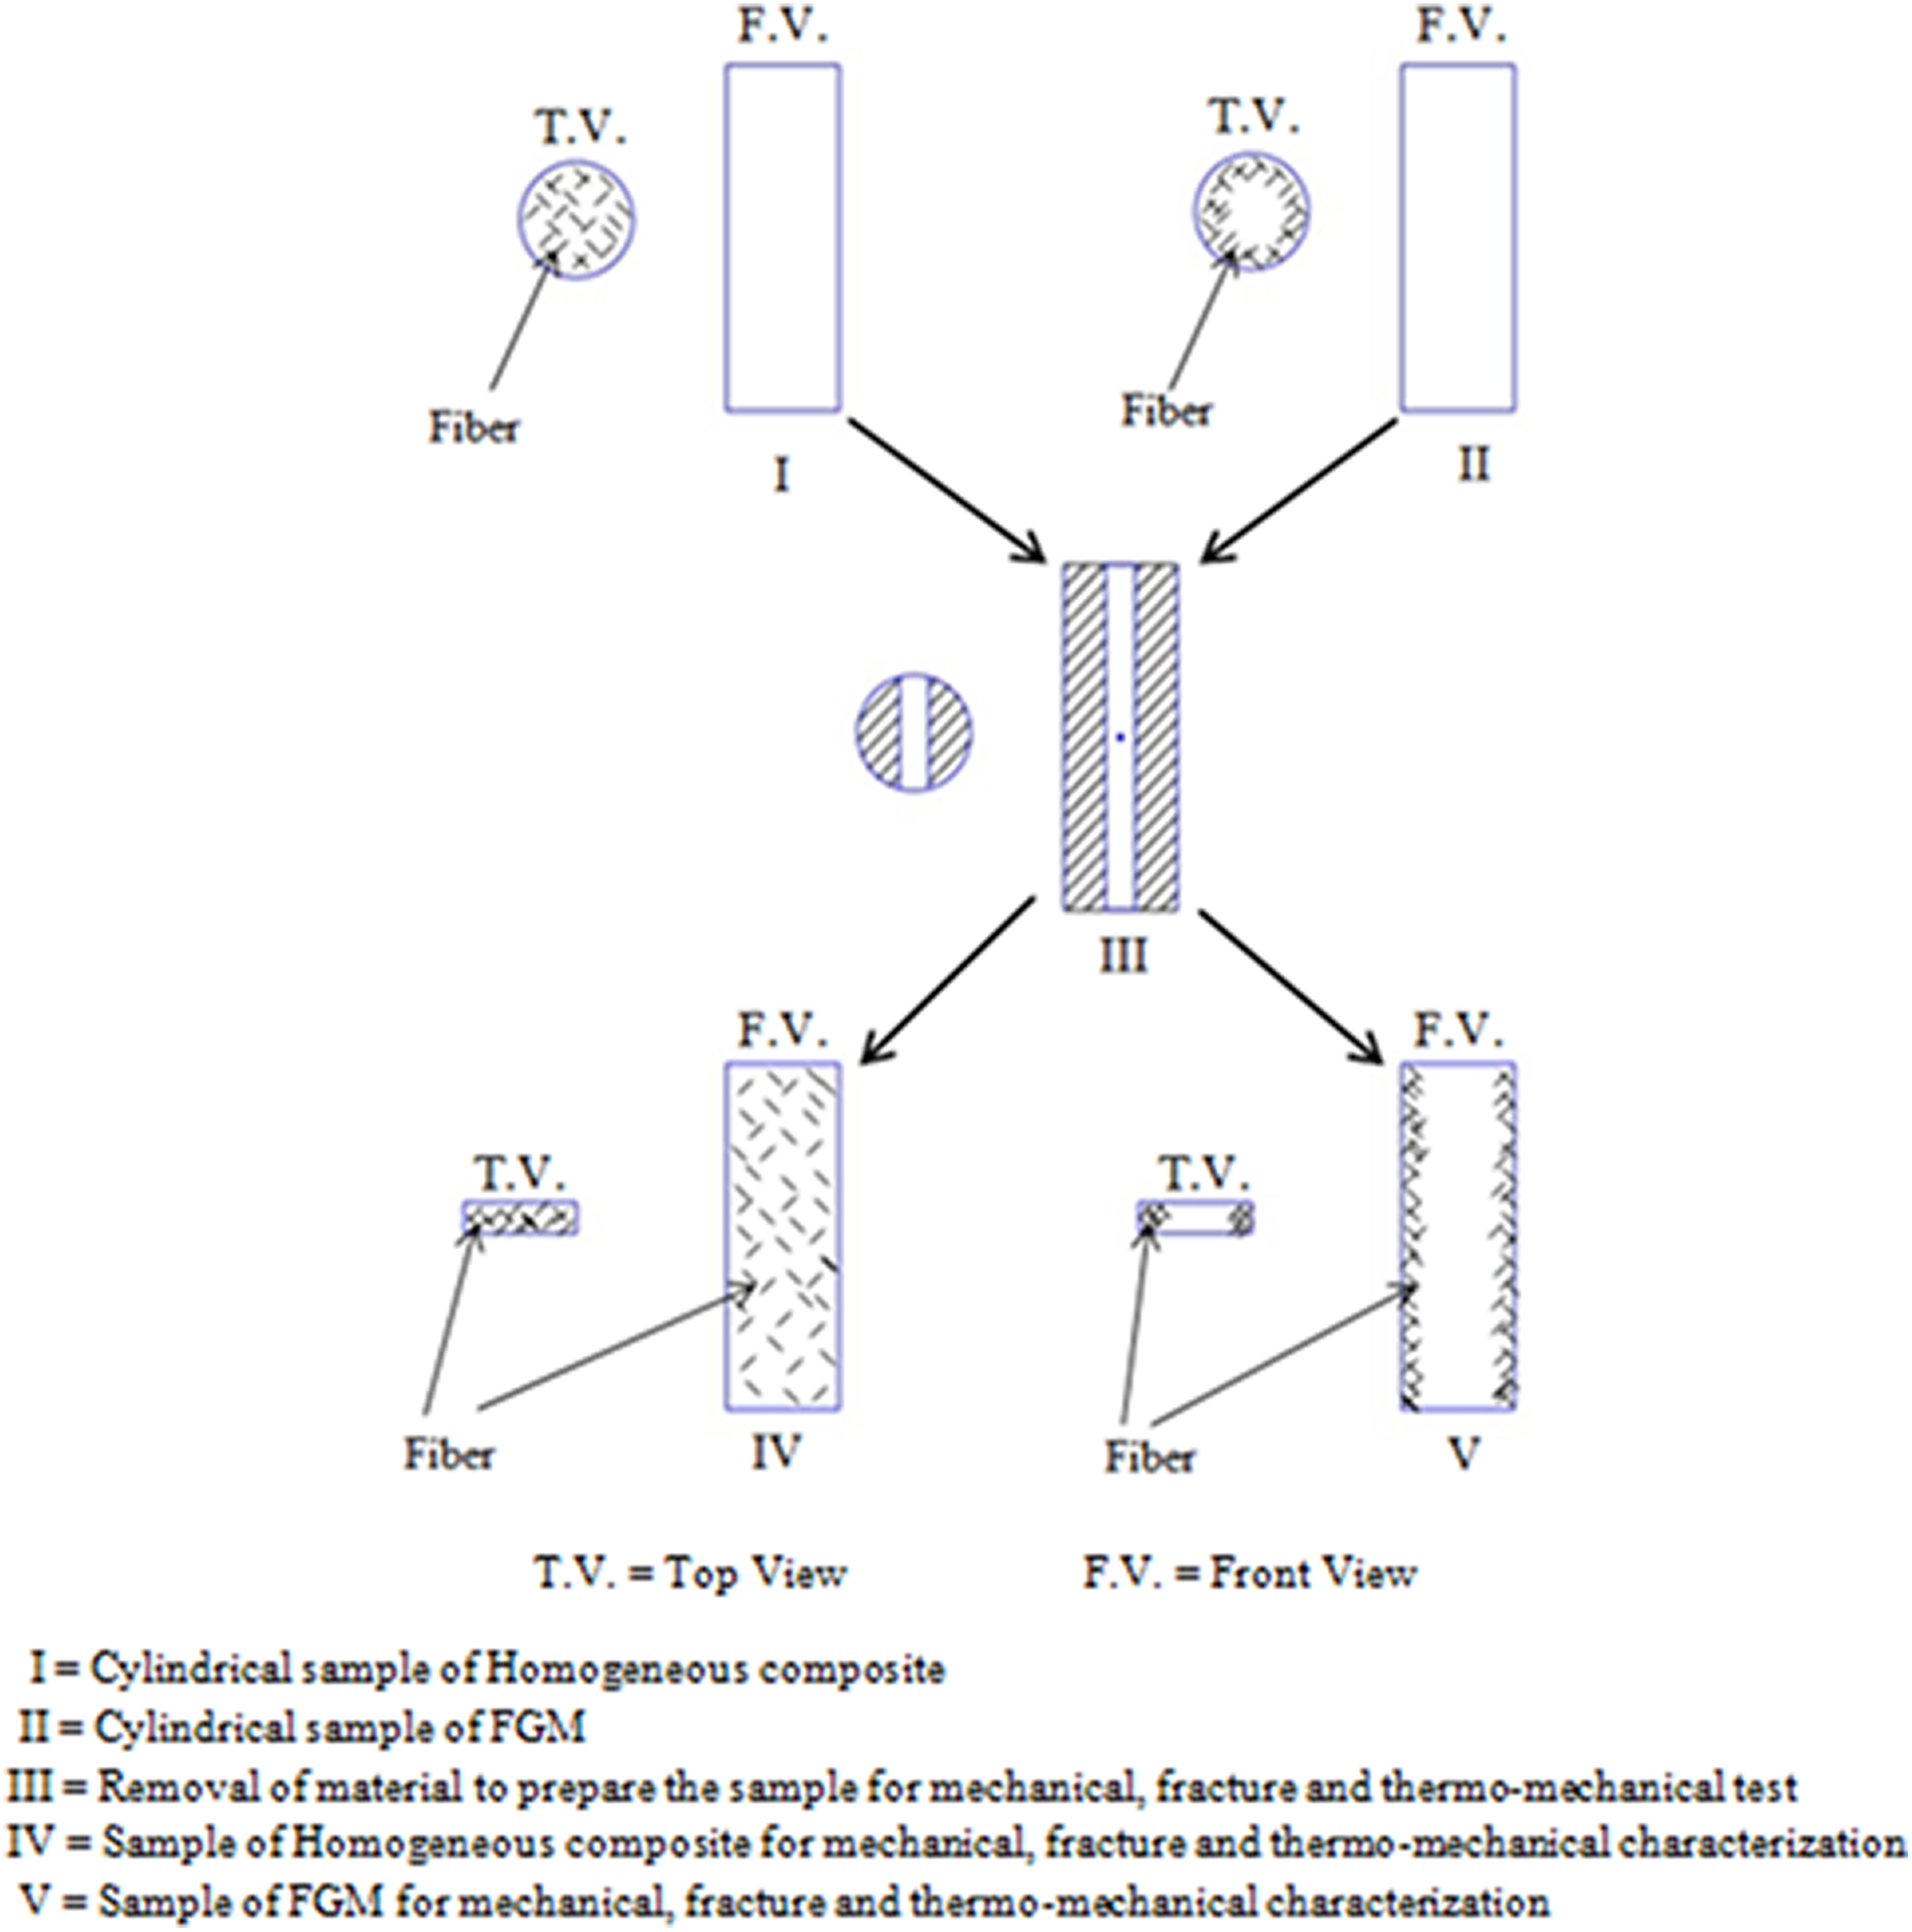
Schematic diagram of the sample preparation for mechanical, fracture, and thermomechanical characterization.
Results and discussion
Experimental verification of gradation in FGMs specimen by SEM analysis
The gradation of the fiber in FGMs is evident in SEM images. Figure 9 shows the SEM images of FGM for all four locations. It is observed from SEM images in Figure 9 that fibers flow toward the periphery due to the action of centrifugal force. As evident from Figure 9(a) that less number of fibers is observed at the center (location R0) of FGM. An appreciable conglomeration of fibers takes place at the periphery (in the vicinity of location R6) due to centrifugal force as observed from Figure 9(d). The concentration of fibers is found to be more around location R4 as compared to location R2 as shown in Figure 9(c) and (b), respectively. Variation of placement of fibers from the core to the periphery of FGM authenticates that significant continuous gradation takes place owing to this manufacturing route. SEM analysis is also done for 30 wt% glass fiber–reinforced homogeneous composite at the same locations as FGM. Figure 10 shows the SEM images of homogeneous composites. Almost even amount of fibers is observed in all four zones of homogeneous composites as shown in Figure 10.
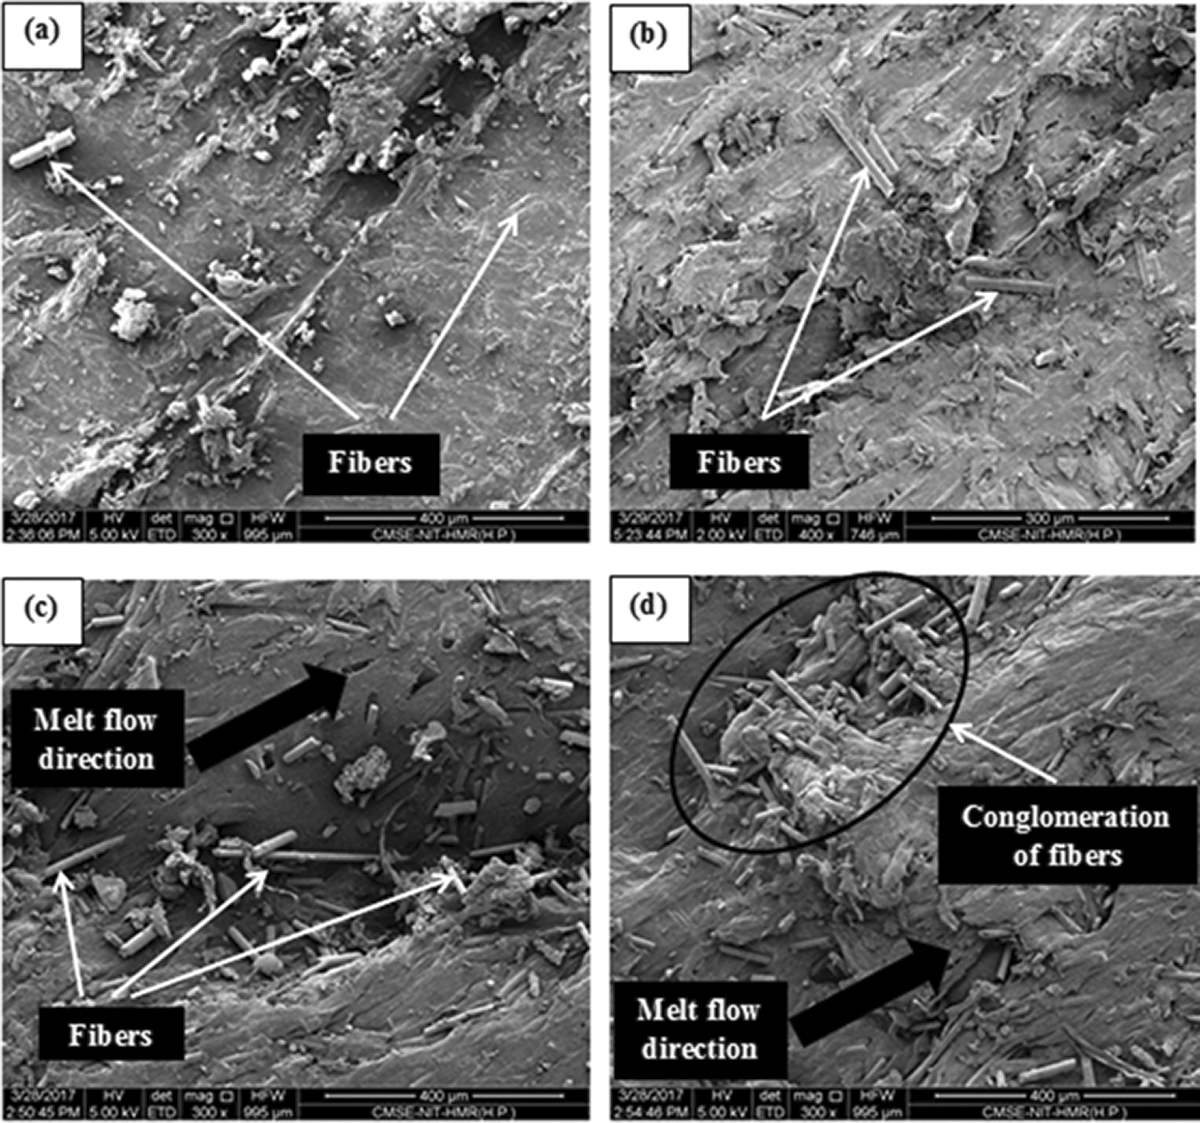
SEM image of 30 wt% glass fiber–reinforced FGM (a) zone R0 (approximately 0 mm), (b) zone R2 (approximately 2 mm), (c) zone R4 (approximately 4 mm), and (d) zone R6 (approximately 6 mm).
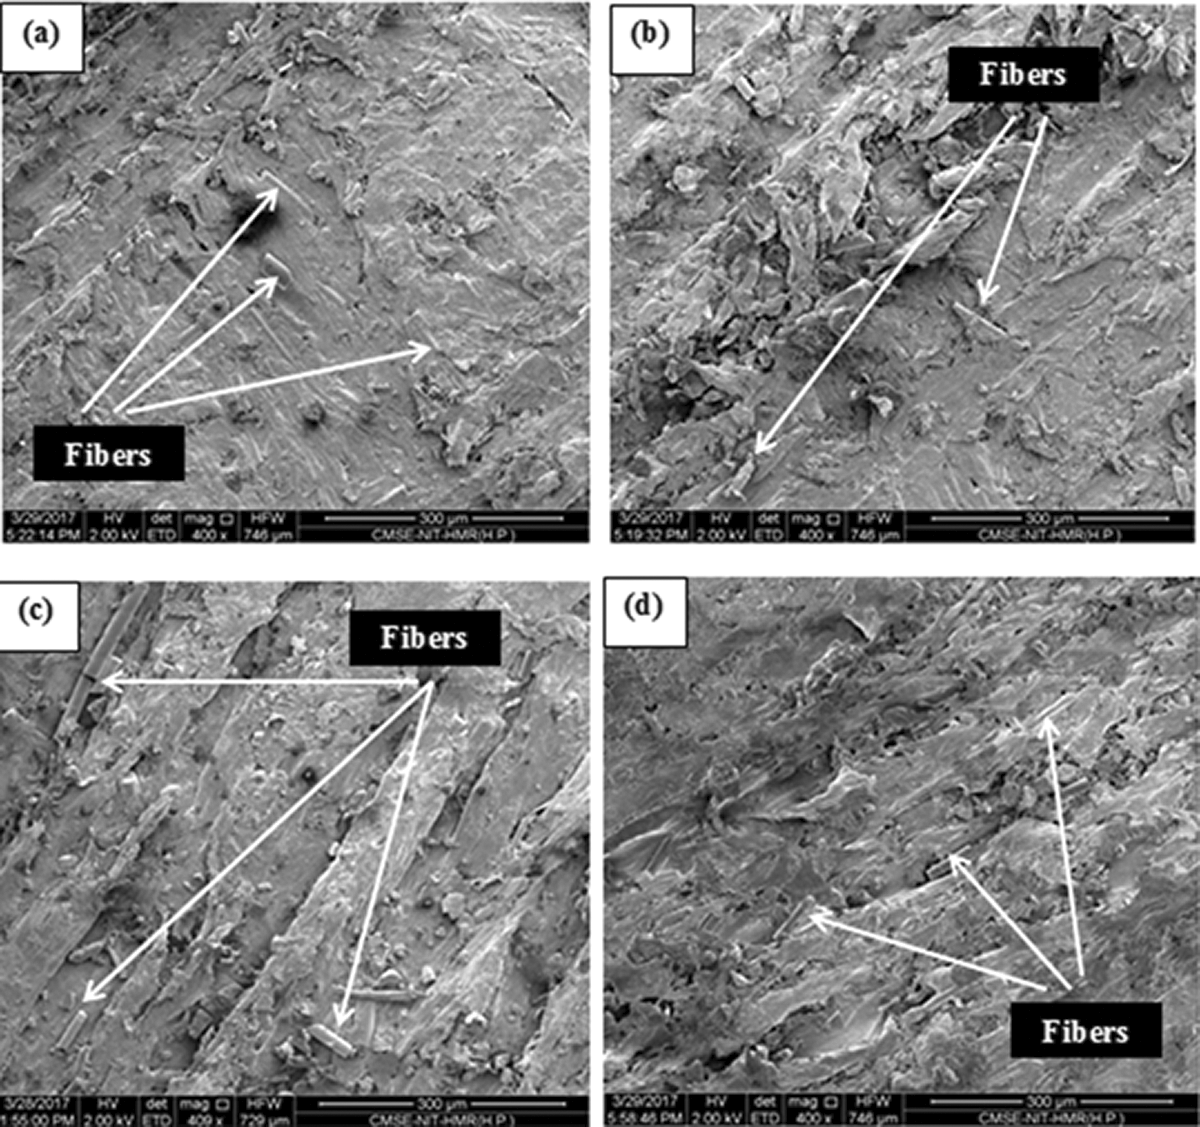
SEM image of 30 wt.% glass fiber–reinforced homogeneous composite (a) zone R0 (approximately 0 mm), (b) zone R2 (approximately 2 mm), (c) zone R4 (approximately 4 mm), and (d) zone R6 (approximately 6 mm).
Experimental verification of gradation in FGMs specimen by hardness measurement
The gradation of the fiber in FGMs is also verified by the hardness measurement. Hardness values at four different locations are shown in Table 1. It is observed from Table 1 that hardness increases from the center to the periphery of FGMs. Increase in the hardness in the radial direction (core to periphery) of FGMs supports the observation of SEM tests. The hardness of 30 wt% glass fiber–reinforced FGM is found to be high as compared to 15 wt% glass fiber–reinforced FGM in all four zones as shown in Table 1.
Hardness of FGMs for four different zones.
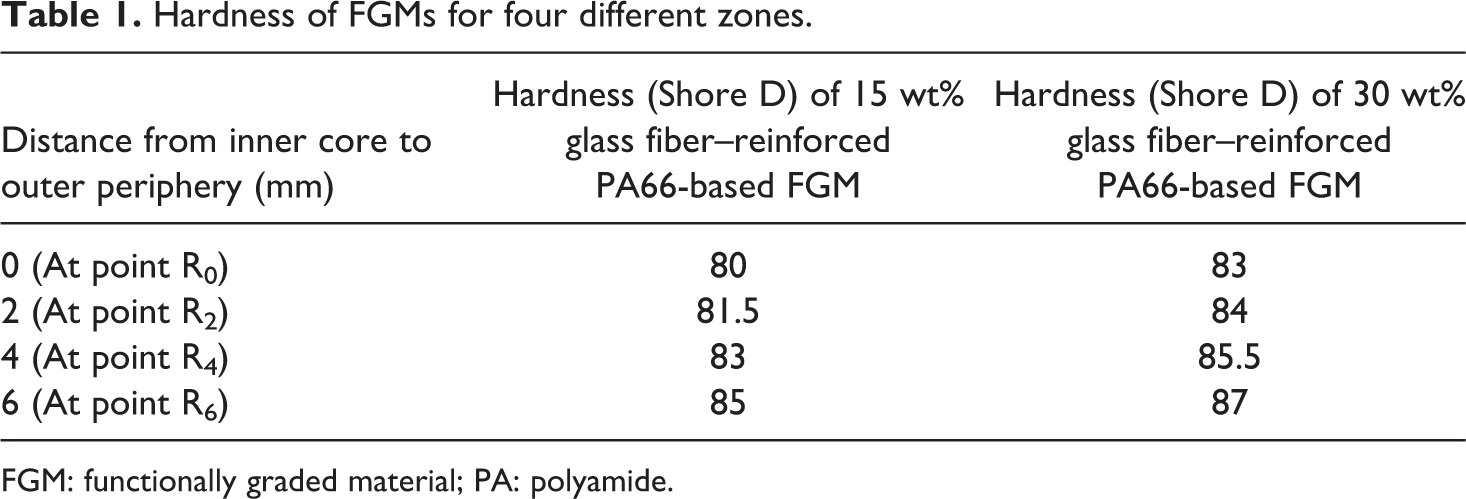
FGM: functionally graded material; PA: polyamide.
Hardness is also measured for homogeneous composites at same four locations as FGMs. The hardness of homogeneous composites is shown in Table 2. Variation in the hardness values is only (0–1) Shore D for homogeneous composites in all four zones. Homogeneous composite reinforced with 30 wt% glass fiber has a higher hardness as compared to 15 wt% glass fiber–reinforced homogeneous composites. Unfilled PA66 has exhibited a hardness of 77 Shore D. Unfilled PA66 has minimum hardness while 30 wt% glass fiber–reinforced FGM has maximum hardness among all the fabricated composites.
Hardness of homogeneous composites for four different zones.
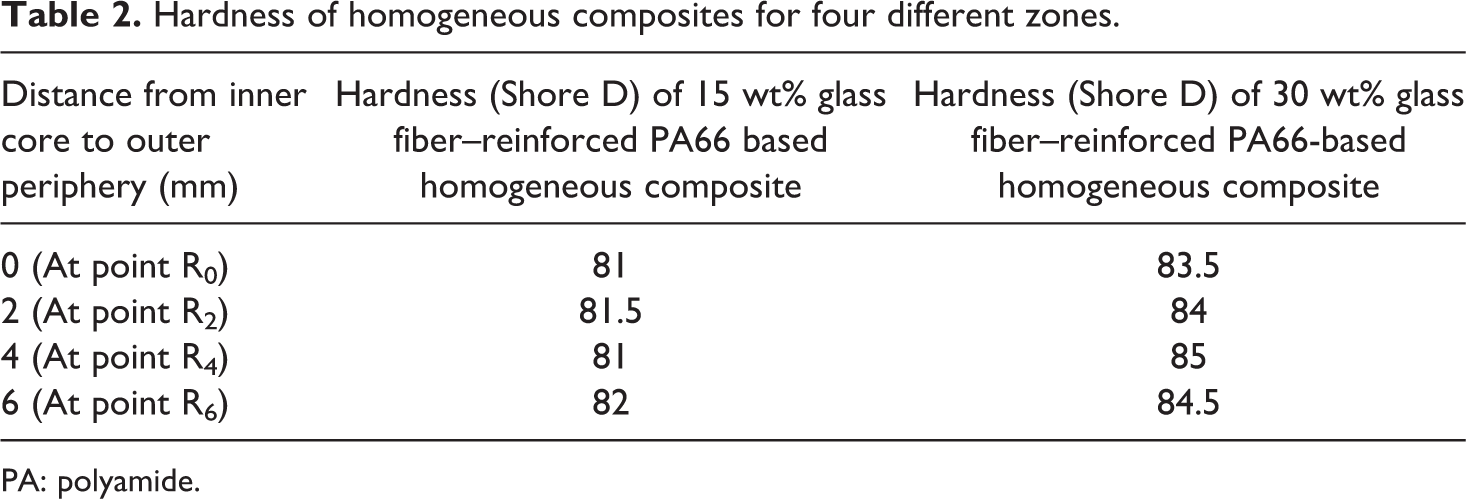
PA: polyamide.
Experimental verification of gradation in FGMs specimen by ignition loss test
Ignition loss of FGMs and homogeneous composites in weight percent is shown in Figure 11. Ignition loss is less in 30 wt% glass fiber–filled specimens as compared to 15 wt% glass fiber–filled specimens due to the high amount of fibers in the matrix. Almost similar amount of ignition loss is observed at each step diameter of 15 and 30 wt% glass fiber–filled homogeneous composites as shown in Figure 11. Even distribution of glass fibers is observed in homogeneous composites. The variation of 0.5% to 1% in ignition loss for homogeneous composites is observed between two consecutive step diameter. Ignition loss decreases reasonably in FGMs with an increase in step diameter as evident from Figure 11. Gradation of the fibers in FGMs is the reason for this phenomena. Ignition loss increases from specimen diameter, that is, 13 mm to 12 mm step diameter by 2.44% and 2.99% for 15 wt% and 30 wt% glass fiber–reinforced FGMs, respectively. Ignition loss further increases from 12 mm to 8 mm diameter by 4.65% and 7.59%, respectively. Ignition loss for 15 wt% and 30 wt% glass fiber–reinforced FGMs increases to 4.55% and 2.03% for the step diameter of 4 mm. Homogeneous composites have less ignition loss as compared to FGMs at the core region (4-mm step diameter) as evident from the Figure 11. It happens because core region in FGMs become matrix rich region due to the gradation of the fibers toward periphery.
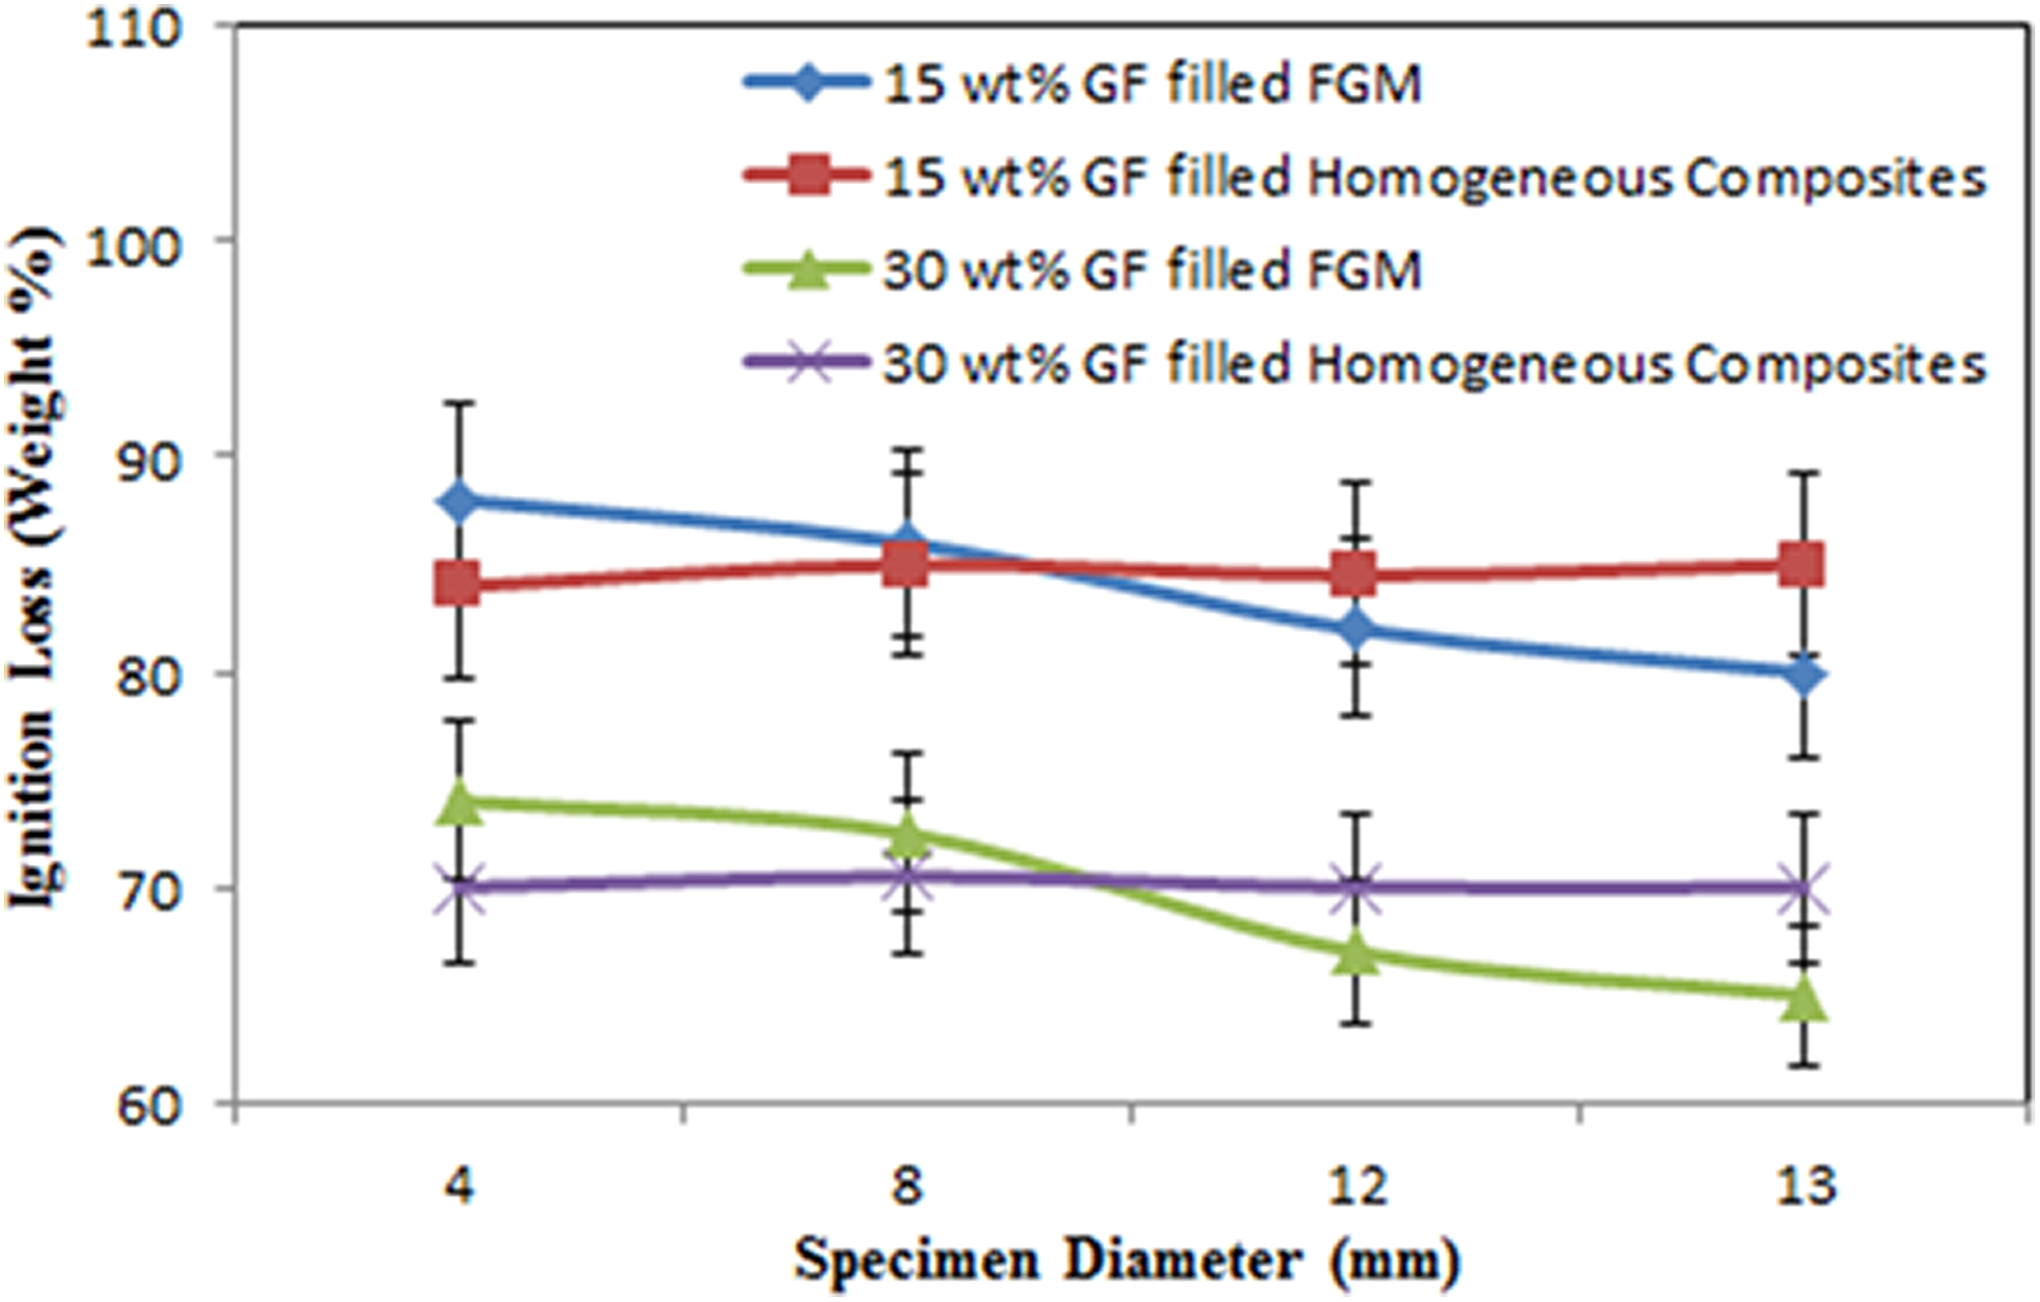
Ignition loss in FGMs and homogeneous composites.
Density and void fraction of FGMs and homogeneous composites
The density of FGMs and homogeneous composites is shown in Table 3. The porosities of composites are evaluated from the difference between the expected and the observed density of each sample. The variations of porosity level in FGMs and homogeneous composites are also presented in Table 3. The last column indicates the void fraction of the composites as the fiber content increases the void fraction of both FGMs and homogeneous composites increases. FGMs and homogeneous composites reinforced with 30 wt% of glass fiber have high void fraction as compared to reinforcement of 15 wt% of glass fiber. 40 Void fraction in homogeneous composites is higher than FGMs. Voids may form in homogeneous composites due to restrained volume shrinkage of the core region by already solidified periphery portion. 41 In FGMs fabrication, samples are rotated at a speed of 1800 r/min for 2 min. Therefore, bubbles are thrown toward periphery surface due to centrifugal force where they collapsed; hence, the void fraction reduces automatically.
Theoretical and experimental density of homogeneous composites and FGMs.
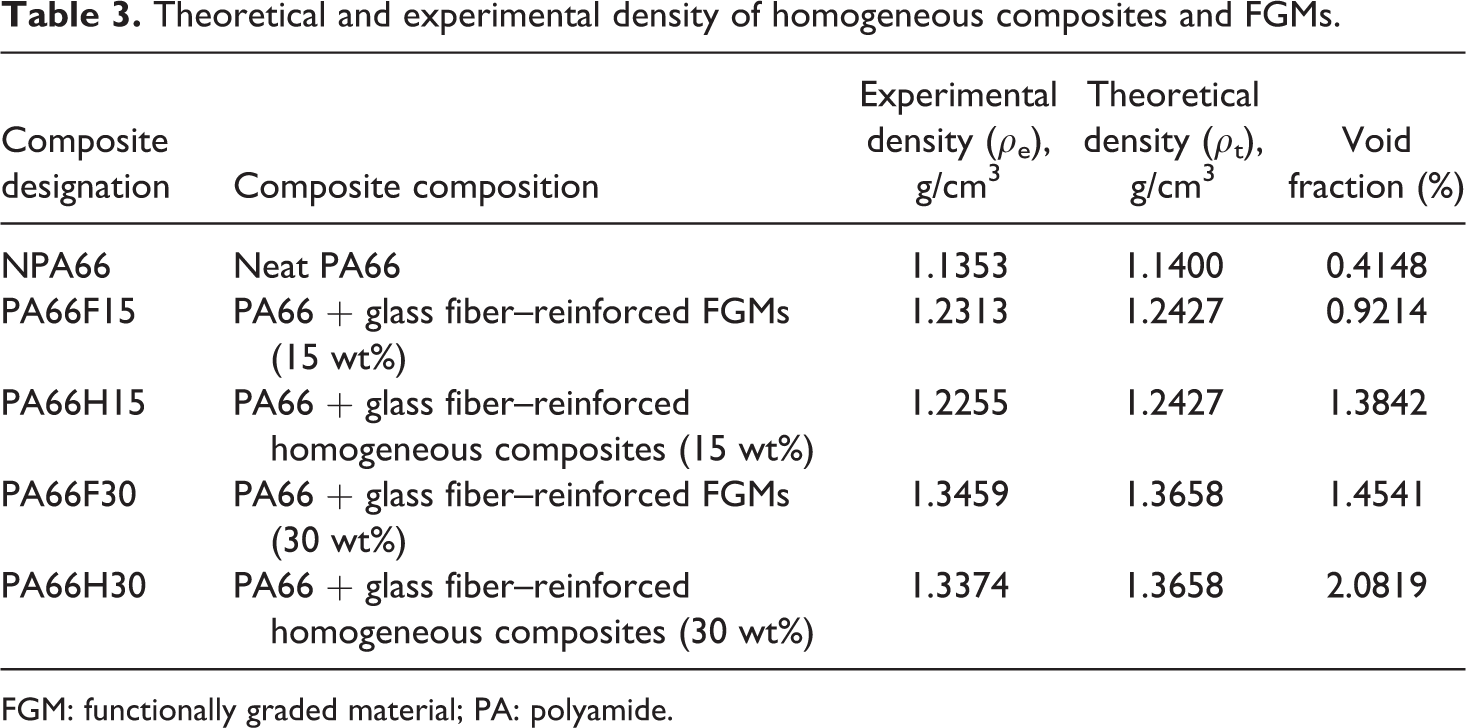
FGM: functionally graded material; PA: polyamide.
Mechanical peculiarities of FGMs and homogeneous composites
The tensile strength of FGMs and homogeneous composites is presented in Figure 12. It is observed that tensile strength noticeably increases with the reinforcement of the glass fibers. FGMs and homogeneous composites reinforced with 30 wt% of glass fiber have high tensile strength as compared to the 15 wt% of glass fiber reinforcement. The tensile strength increases by 64% and 81% for FGMs and homogeneous composites, respectively, at 15 wt% of glass fiber reinforcement. However, at 30 wt% of glass fiber reinforcement, the tensile strength of FGMs and homogeneous composites increases with 98% and 124%, respectively. The tensile strength of homogeneous composites is higher than FGMs. Glass fibers in the FGMs accumulate at the outer periphery due to centrifugal casting, and the center portion of FGMs becomes a matrix-rich region. Hence, the tensile stresses from the matrix to glass fibers cannot transfer properly within FGMs resulting in less tensile strength. 42
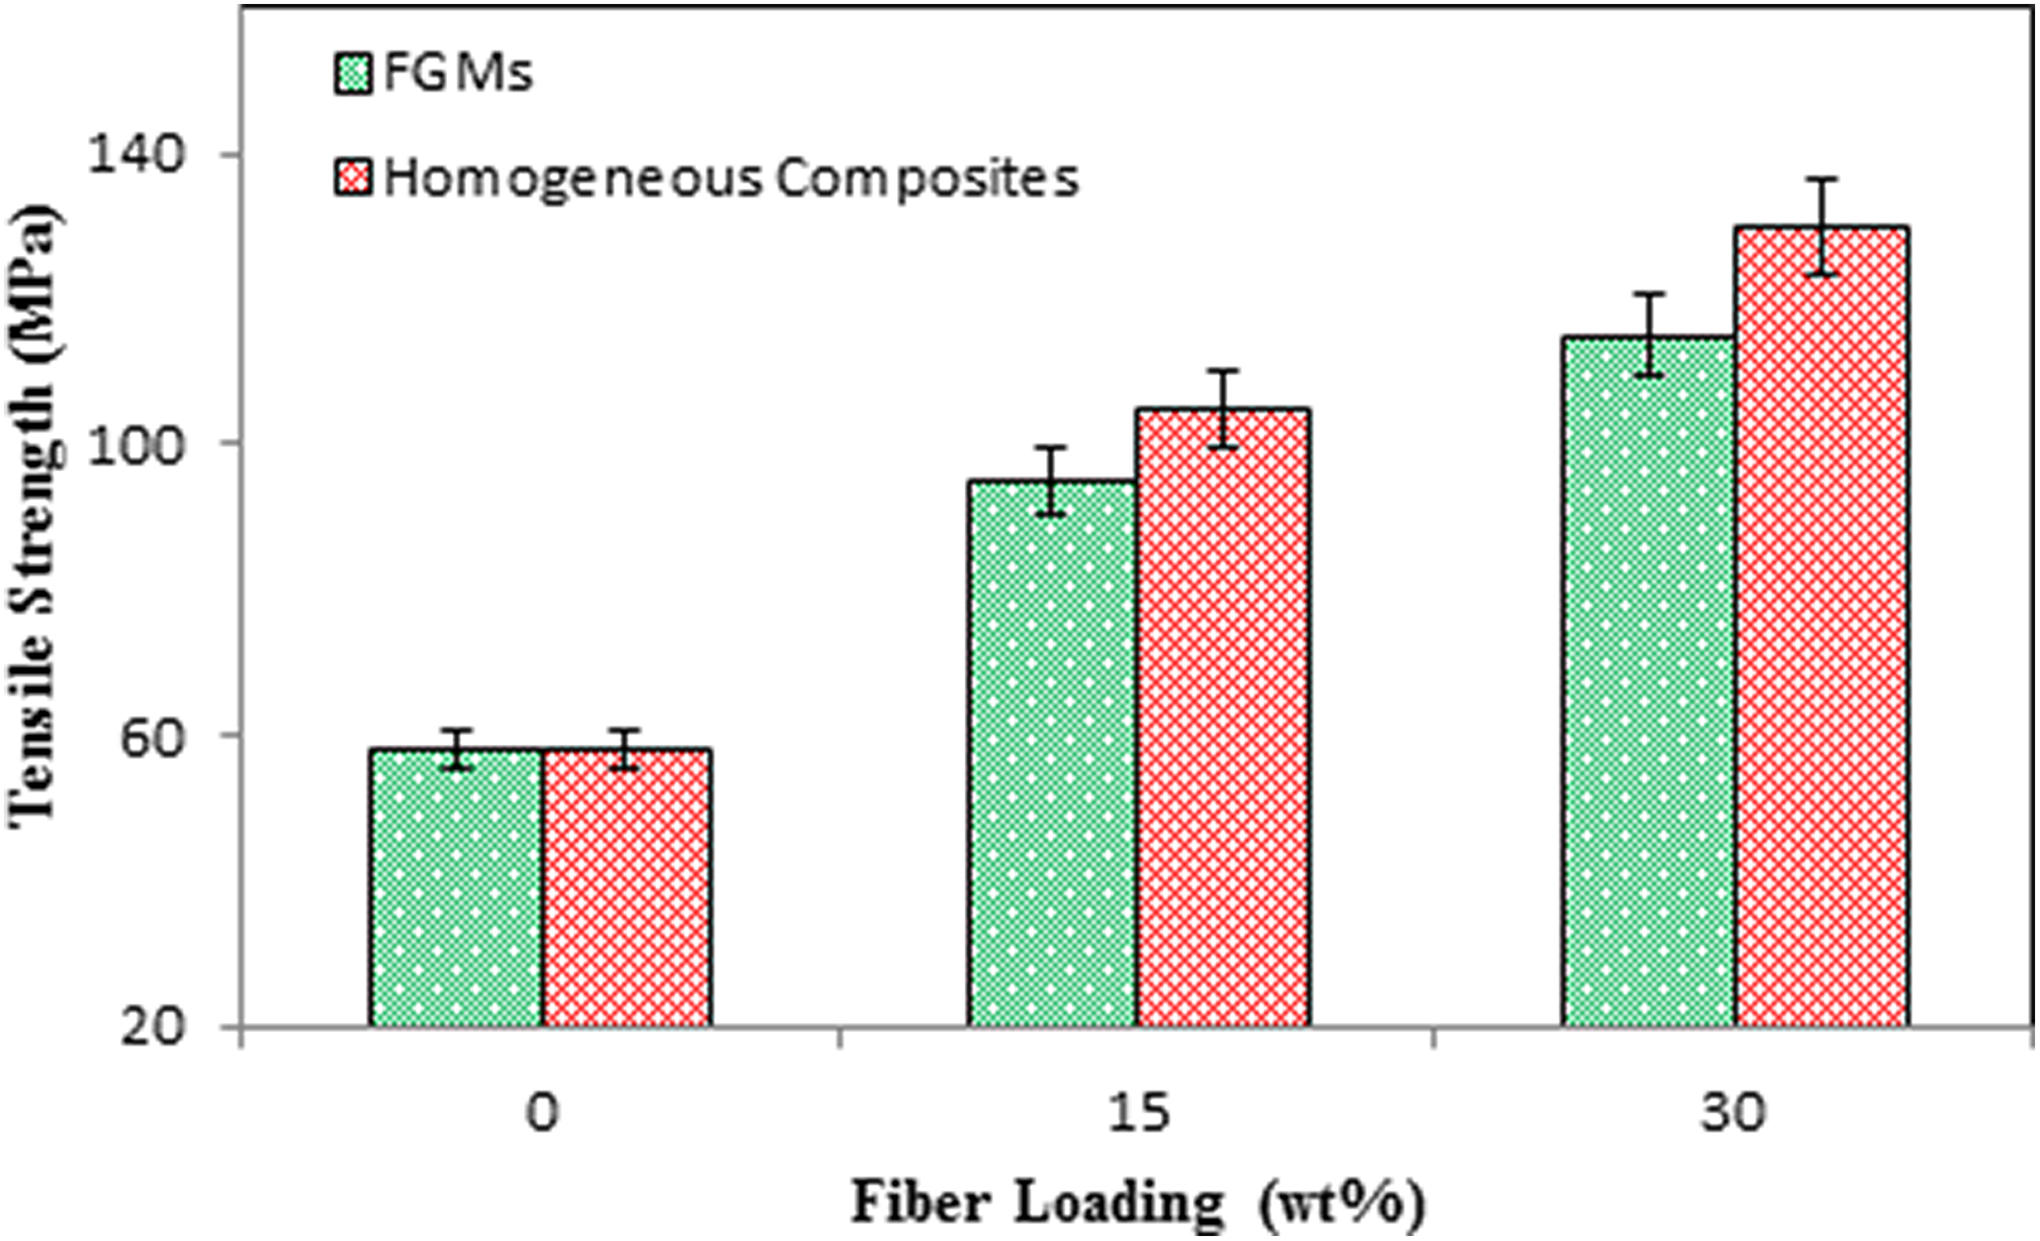
Tensile strength of FGMs and homogeneous composites.
The tensile modulus of FGMs and homogeneous composites is shown in Figure 13. The tensile modulus of FGMs increases for the reinforcement of 15 wt% of glass fiber and it further decreases for the 30 wt% of glass fiber reinforcement. The same phenomenon is also observed for homogeneous composites as shown in Figure 13. FGMs and homogeneous composites reinforced with 15 wt% of glass fiber have a lower tensile strain that results in high tensile modulus. The tensile modulus of FGMs and homogeneous composites reinforced with 15 wt% of glass fiber increases with 124% and 164%, respectively, while it decreases with 16% and 9% for the reinforcement of 30 wt% glass fiber. The tensile modulus of FGMs is less as compared to homogeneous composites because homogeneous composites have less percentage elongation as compared to their counterparts. It may happen due to the high void fraction of homogeneous composites as evident from Table 3.
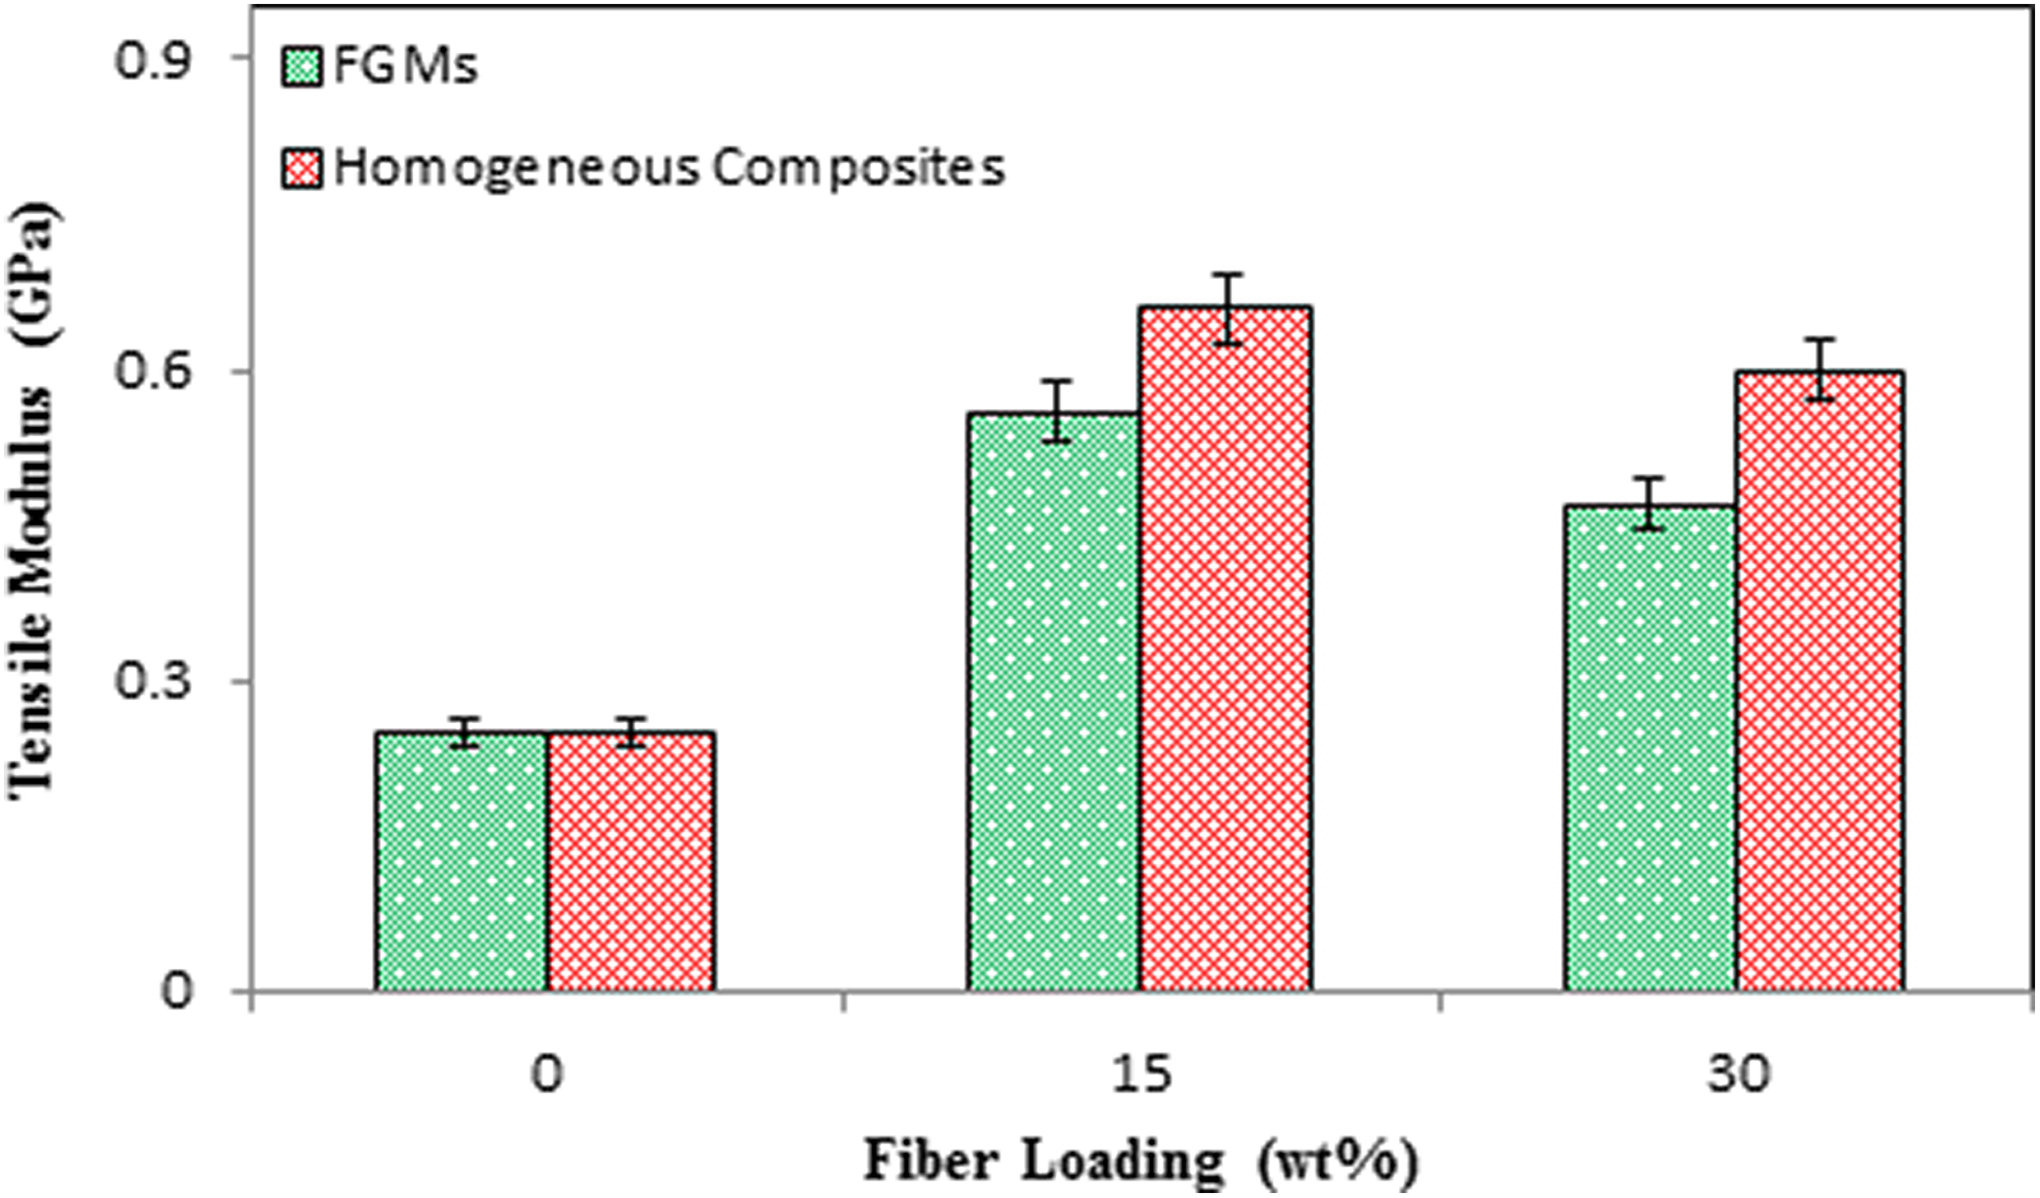
Tensile modulus of FGMs and homogeneous composites.
The flexural strength of FGMs and homogeneous composites is shown in Figure 14 as the function of glass fiber loading. A gradual increment in flexural strength is observed for FGMs and homogenous composites as evident from Figure 14. The fibers aid the load bearing ability of a composite in flexural strength condition, rather than acting as stress raiser as in the case of tensile loading. It happens because compressive stresses tend to close flaws and cracks that are perpendicular to the applied stress, opposing to the crack opening mechanism occurring under tensile loading condition. 43,44 The flexural strength of FGMs and homogeneous composites increases with 59% and 43%, respectively, for 15 wt% of glass fiber reinforcement and it further increases with 30% and 127% for 103 wt% of glass fiber reinforcement. FGMs have high flexural strength as compared to homogeneous composites for both (15 wt% and 30 wt% glass fiber) reinforcement.
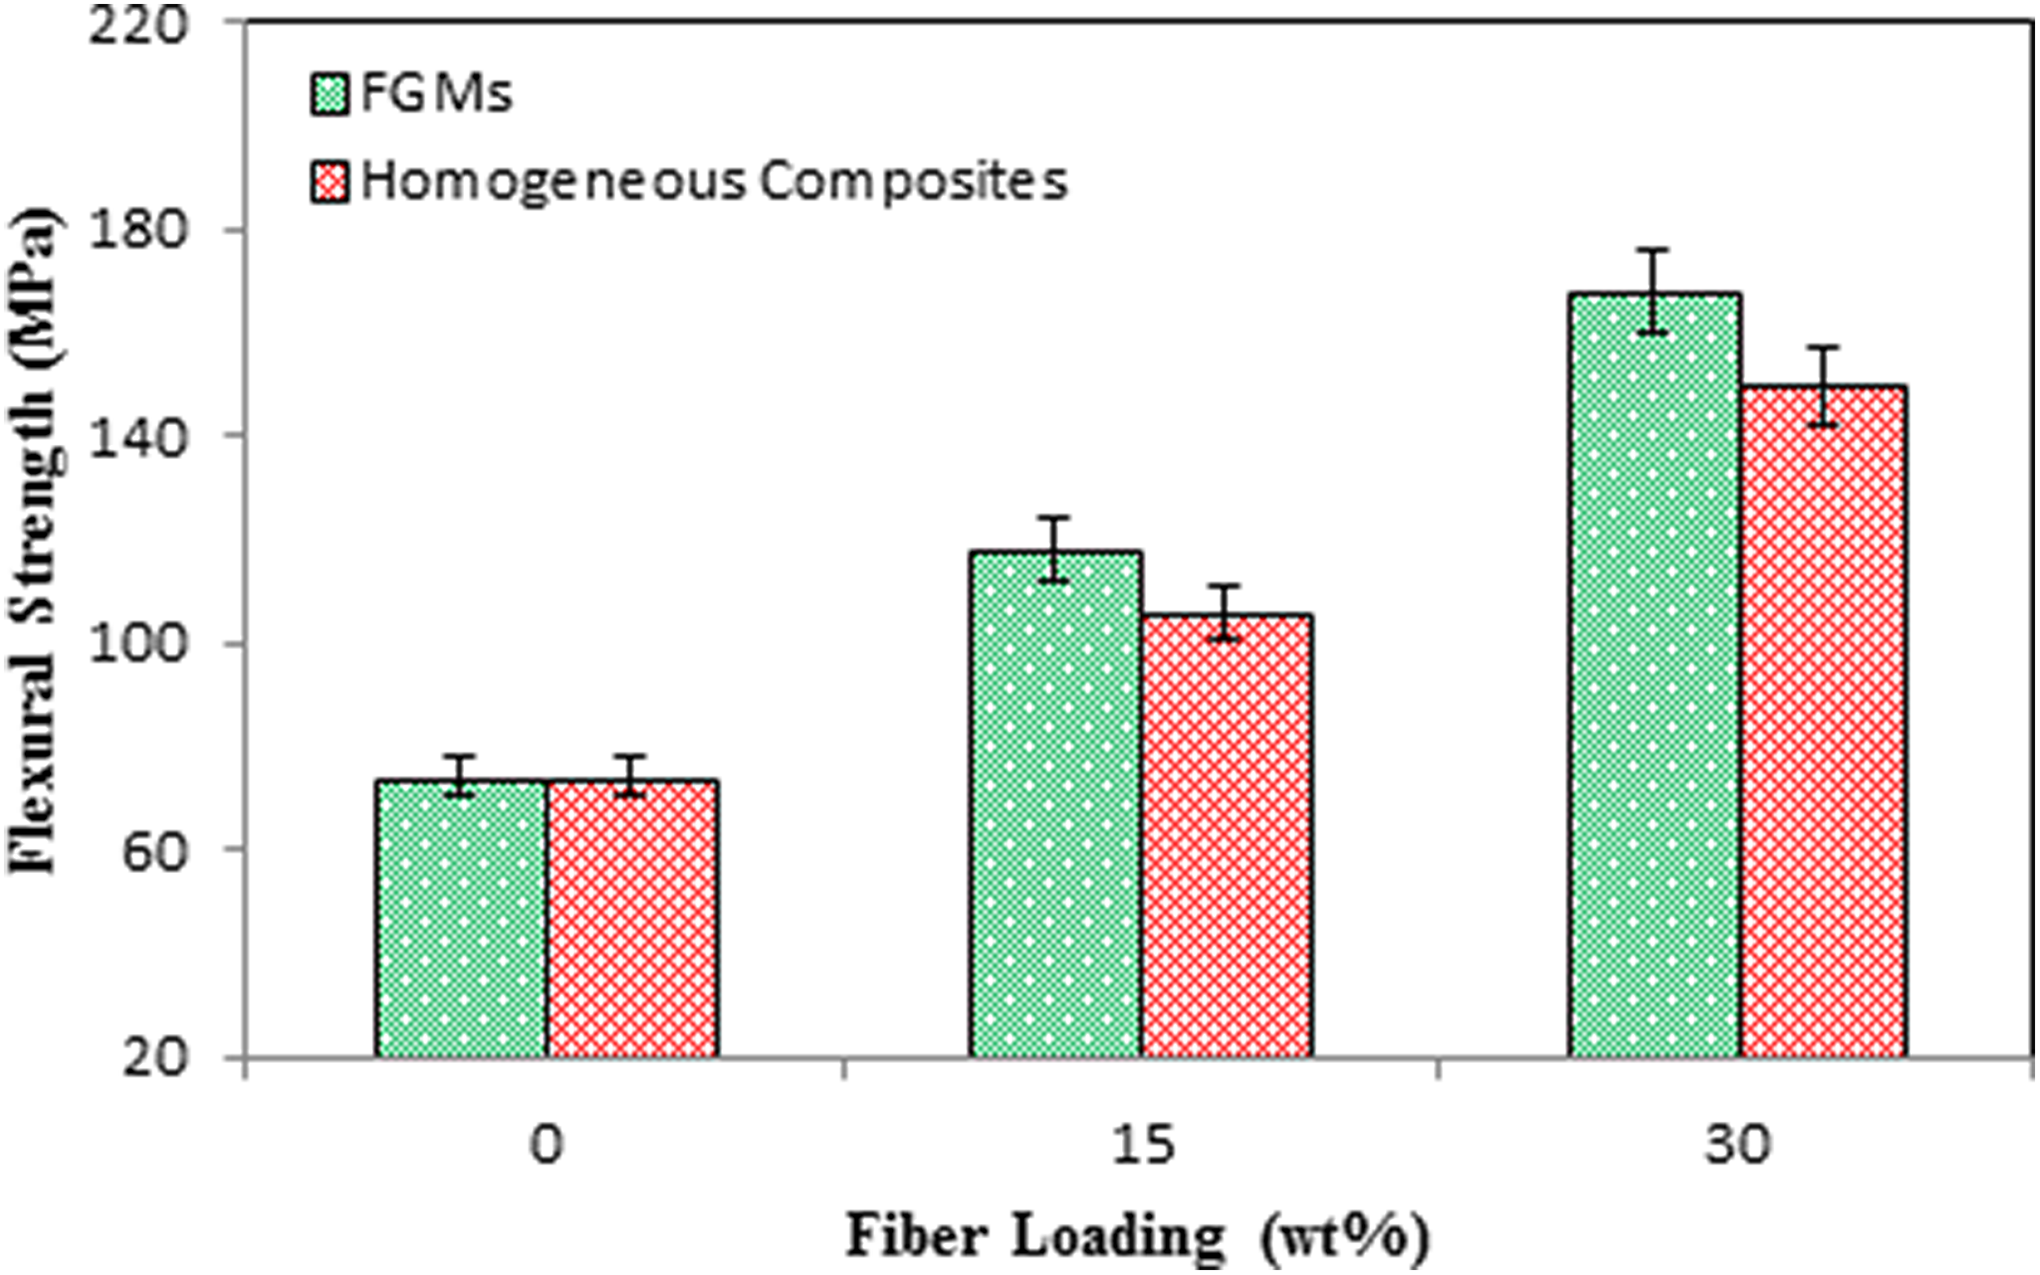
Flexural strength of FGMs and homogeneous composites.
Figure 15 represents the compressive strength of FGMs and homogeneous composites. Compressive strength increases considerably for FGMs and homogeneous composites with the incorporation of 15 wt% and 30 wt% of glass fiber. Compressive strength increases for FGMs with 82% and 70% and homogeneous composites with 140% and 120% at the reinforcement of 15 wt% and 30 wt% of glass fibers, respectively. Homogeneous composites have less compressive strength as compared to FGMs. The high void fraction may be the reason for the reduction in compressive strength of homogeneous composites. Glass fiber reinforcement and fabrication technique have an immense effect on the mechanical peculiarity of the fabricated composites. Neat PA66 has minimum mechanical properties among all the fabricated composites.
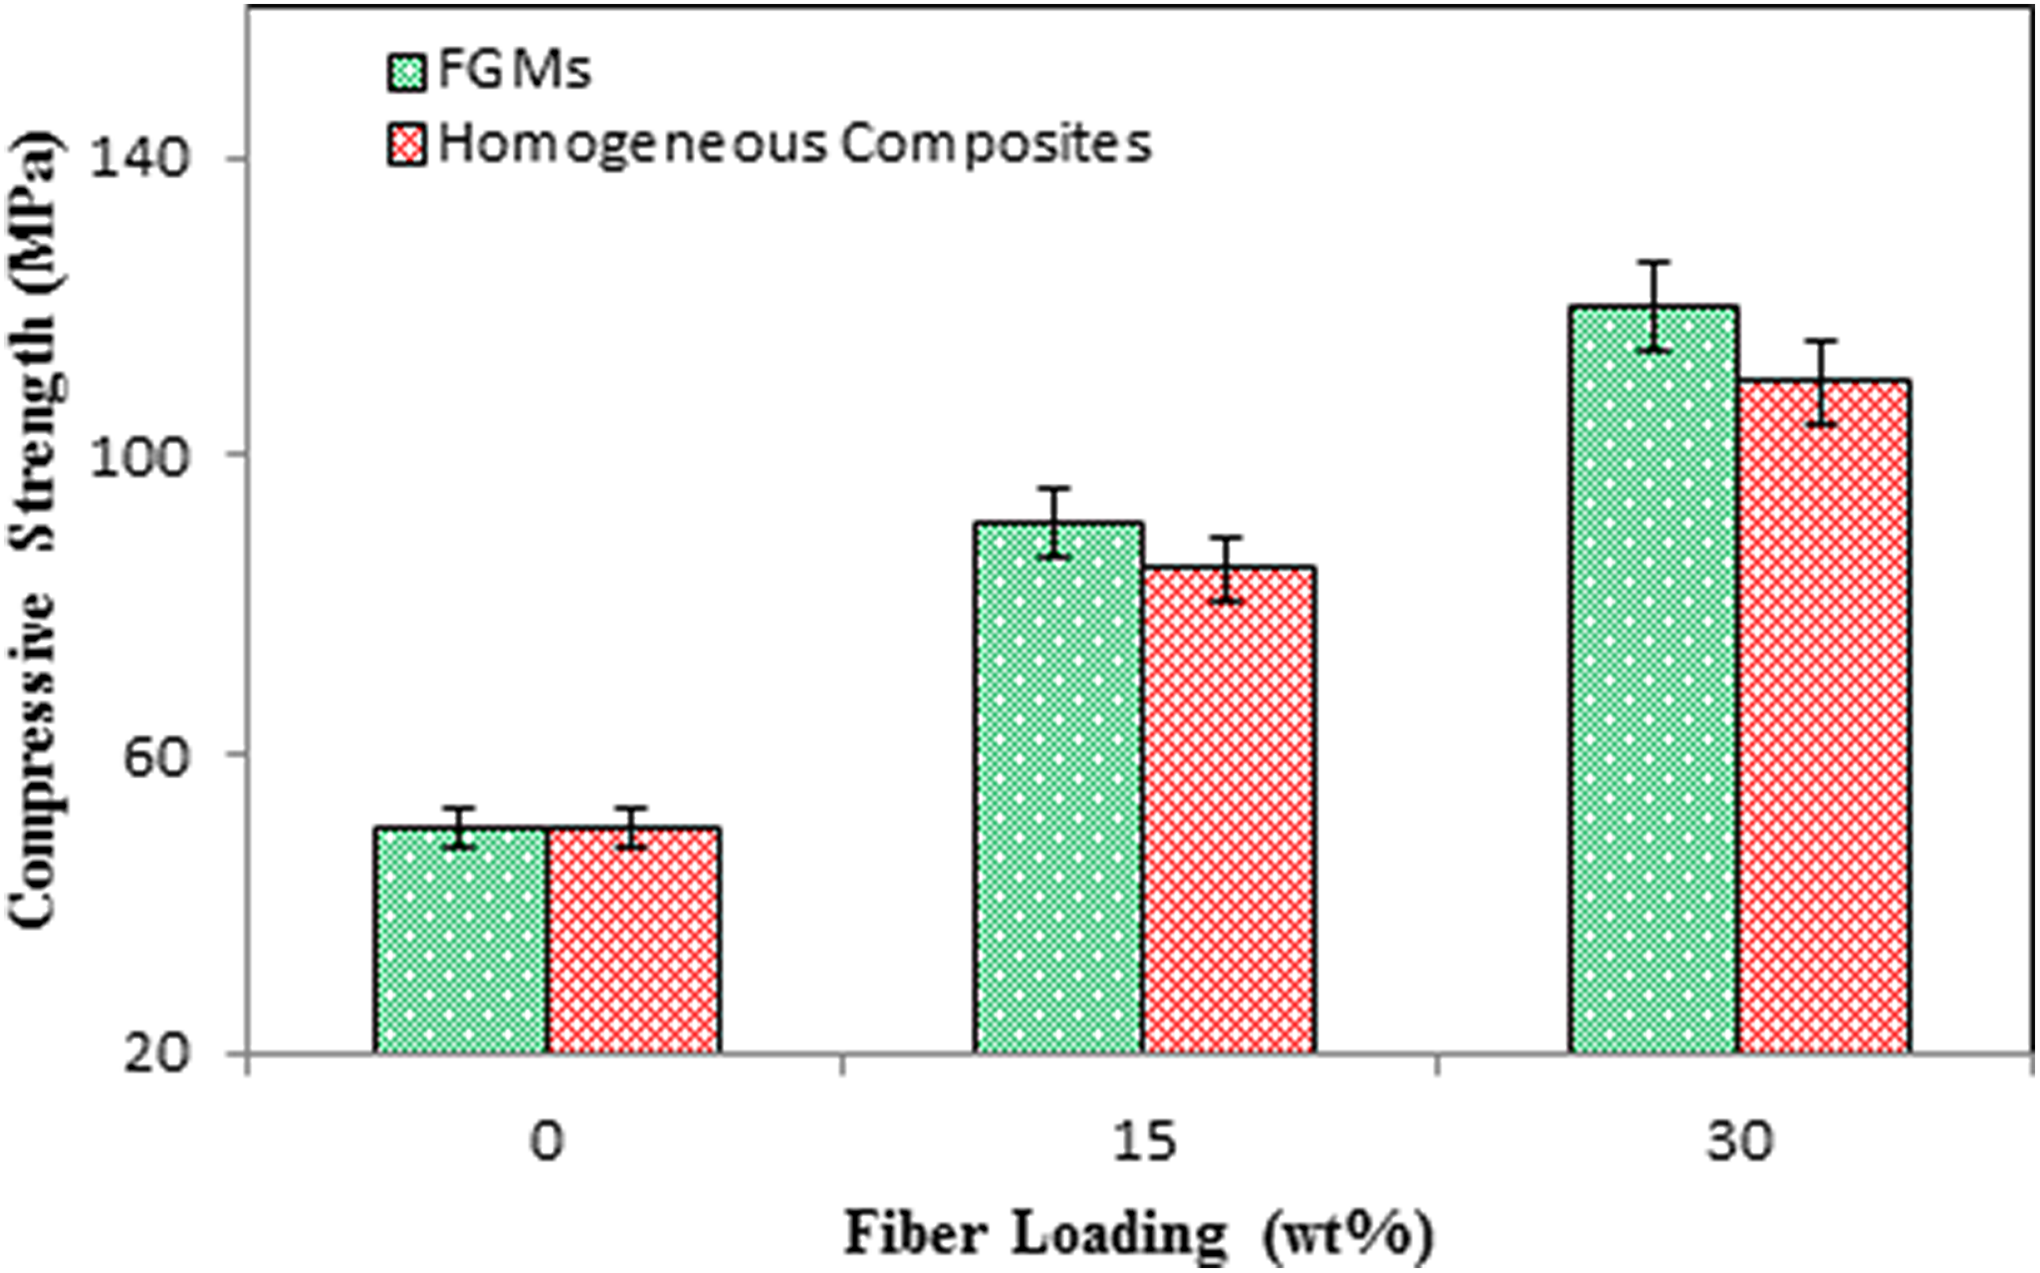
Compressive strength of FGMs and homogeneous composites.
Fracture toughness of FGMs and homogeneous composites
Various parameters like crack-tip opening angle, crack-tip opening displacement, J-integral, stress intensity factor, and the elastic energy release rate are used to measure the fracture toughness (KIC) of material. 45 In this study, linear elastic fracture mechanics test is used to estimate KIC for neat PA66, FGMs, and homogeneous composites using at the crack length of 1 mm, 2 mm, 3 mm, and 4 mm, respectively.
Figure 16 shows the variation of KIC with the crack length for neat PA66, FGMs, and homogeneous composites. Glass fiber–filled FGMs and homogeneous composites have increasing the function of fracture toughness as observed from the Figure 16. The reason behind it is the low modulus of matrix material as compared to the modulus of glass fiber. 46 The experimental value of KIC of FGMs and homogeneous composites increases with fiber loading which indicates the increasing capability of FGMs and homogeneous composites to resist fracture. The extrinsic toughening mechanism may be the reason behind this phenomenon which comes into action behind the crack tip after propagation of the crack. However, fibers act as a bridge between the two separating fractured surfaces when the crack is propagated through the matrix and results in resistance to further opening of crack. FGMs have a high value of KIC as compared to homogeneous composites as evident from Figure 16. It may happen due to the high crack arresting capability of FGMs as compared to homogeneous composites. Cracks can propagate quite easily in homogeneous composites because fibers are distributed uniformly throughout the homogeneous composites (Figure 7(a)) results in less opposition to the crack propagation. However, propagation of crack is quite difficult in FGMs because fibers accumulate at the verge of FGMs (Figure 7(b)) and they are not allowed propagating the crack easily. However, the fracture toughness of FGMs decreases at the crack length of 4 mm as observed from Figure 16. At 4-mm crack length, crack tip reaches into the matrix-rich region of the FGMs which results in reduced crack arresting ability of FGMs and causes low fracture toughness.
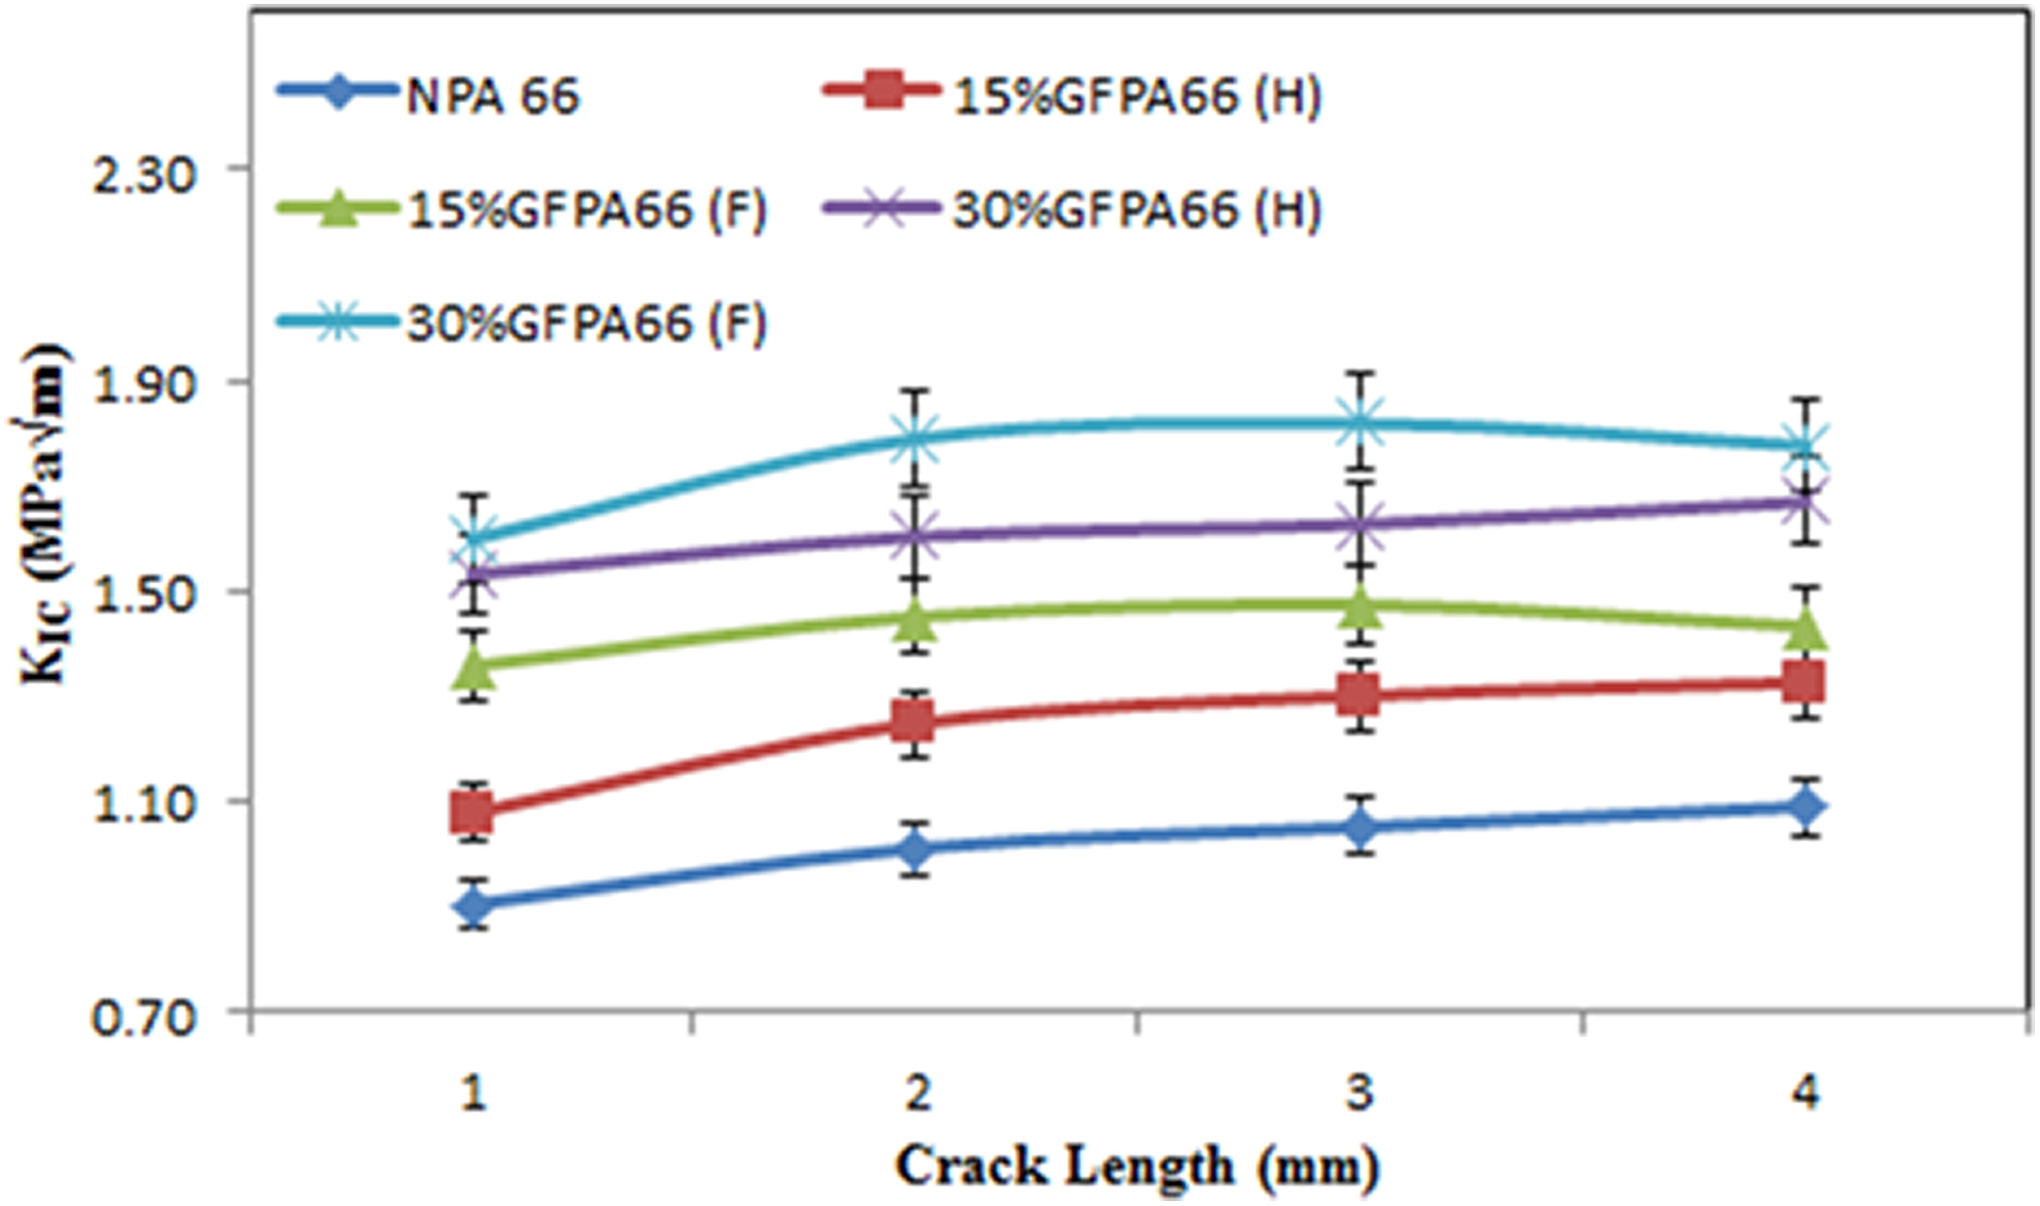
Fracture toughness of FGMs and homogeneous composites.
DMA of FGMs and homogeneous composites
The thermomechanical response of the neat PA66, FGMs, and homogenous composites is studied by DMA to examine the variation of storage modulus (E′), loss modulus (E″Ꞌ), and damping factor (tan δ) as a function of temperature. There are various factors such as the distribution of the reinforcing fibers into the matrix material, the nature of the interface of fibers with the matrix and of the interfacial regions at which the dynamic mechanical properties of polymer composites depends. A small change in the composition regarding fiber or matrix compositions may also result in significant changes in the overall dynamic mechanical properties of the composite. 47 Damping behavior of composites can be used to predict temperatures, stiffness, and impact properties. Figure 17(a) to (c) shows the storage modulus, loss modulus, and damping factor of neat PA66, glass fiber–filled PA66-based FGMs and homogeneous composites, respectively.
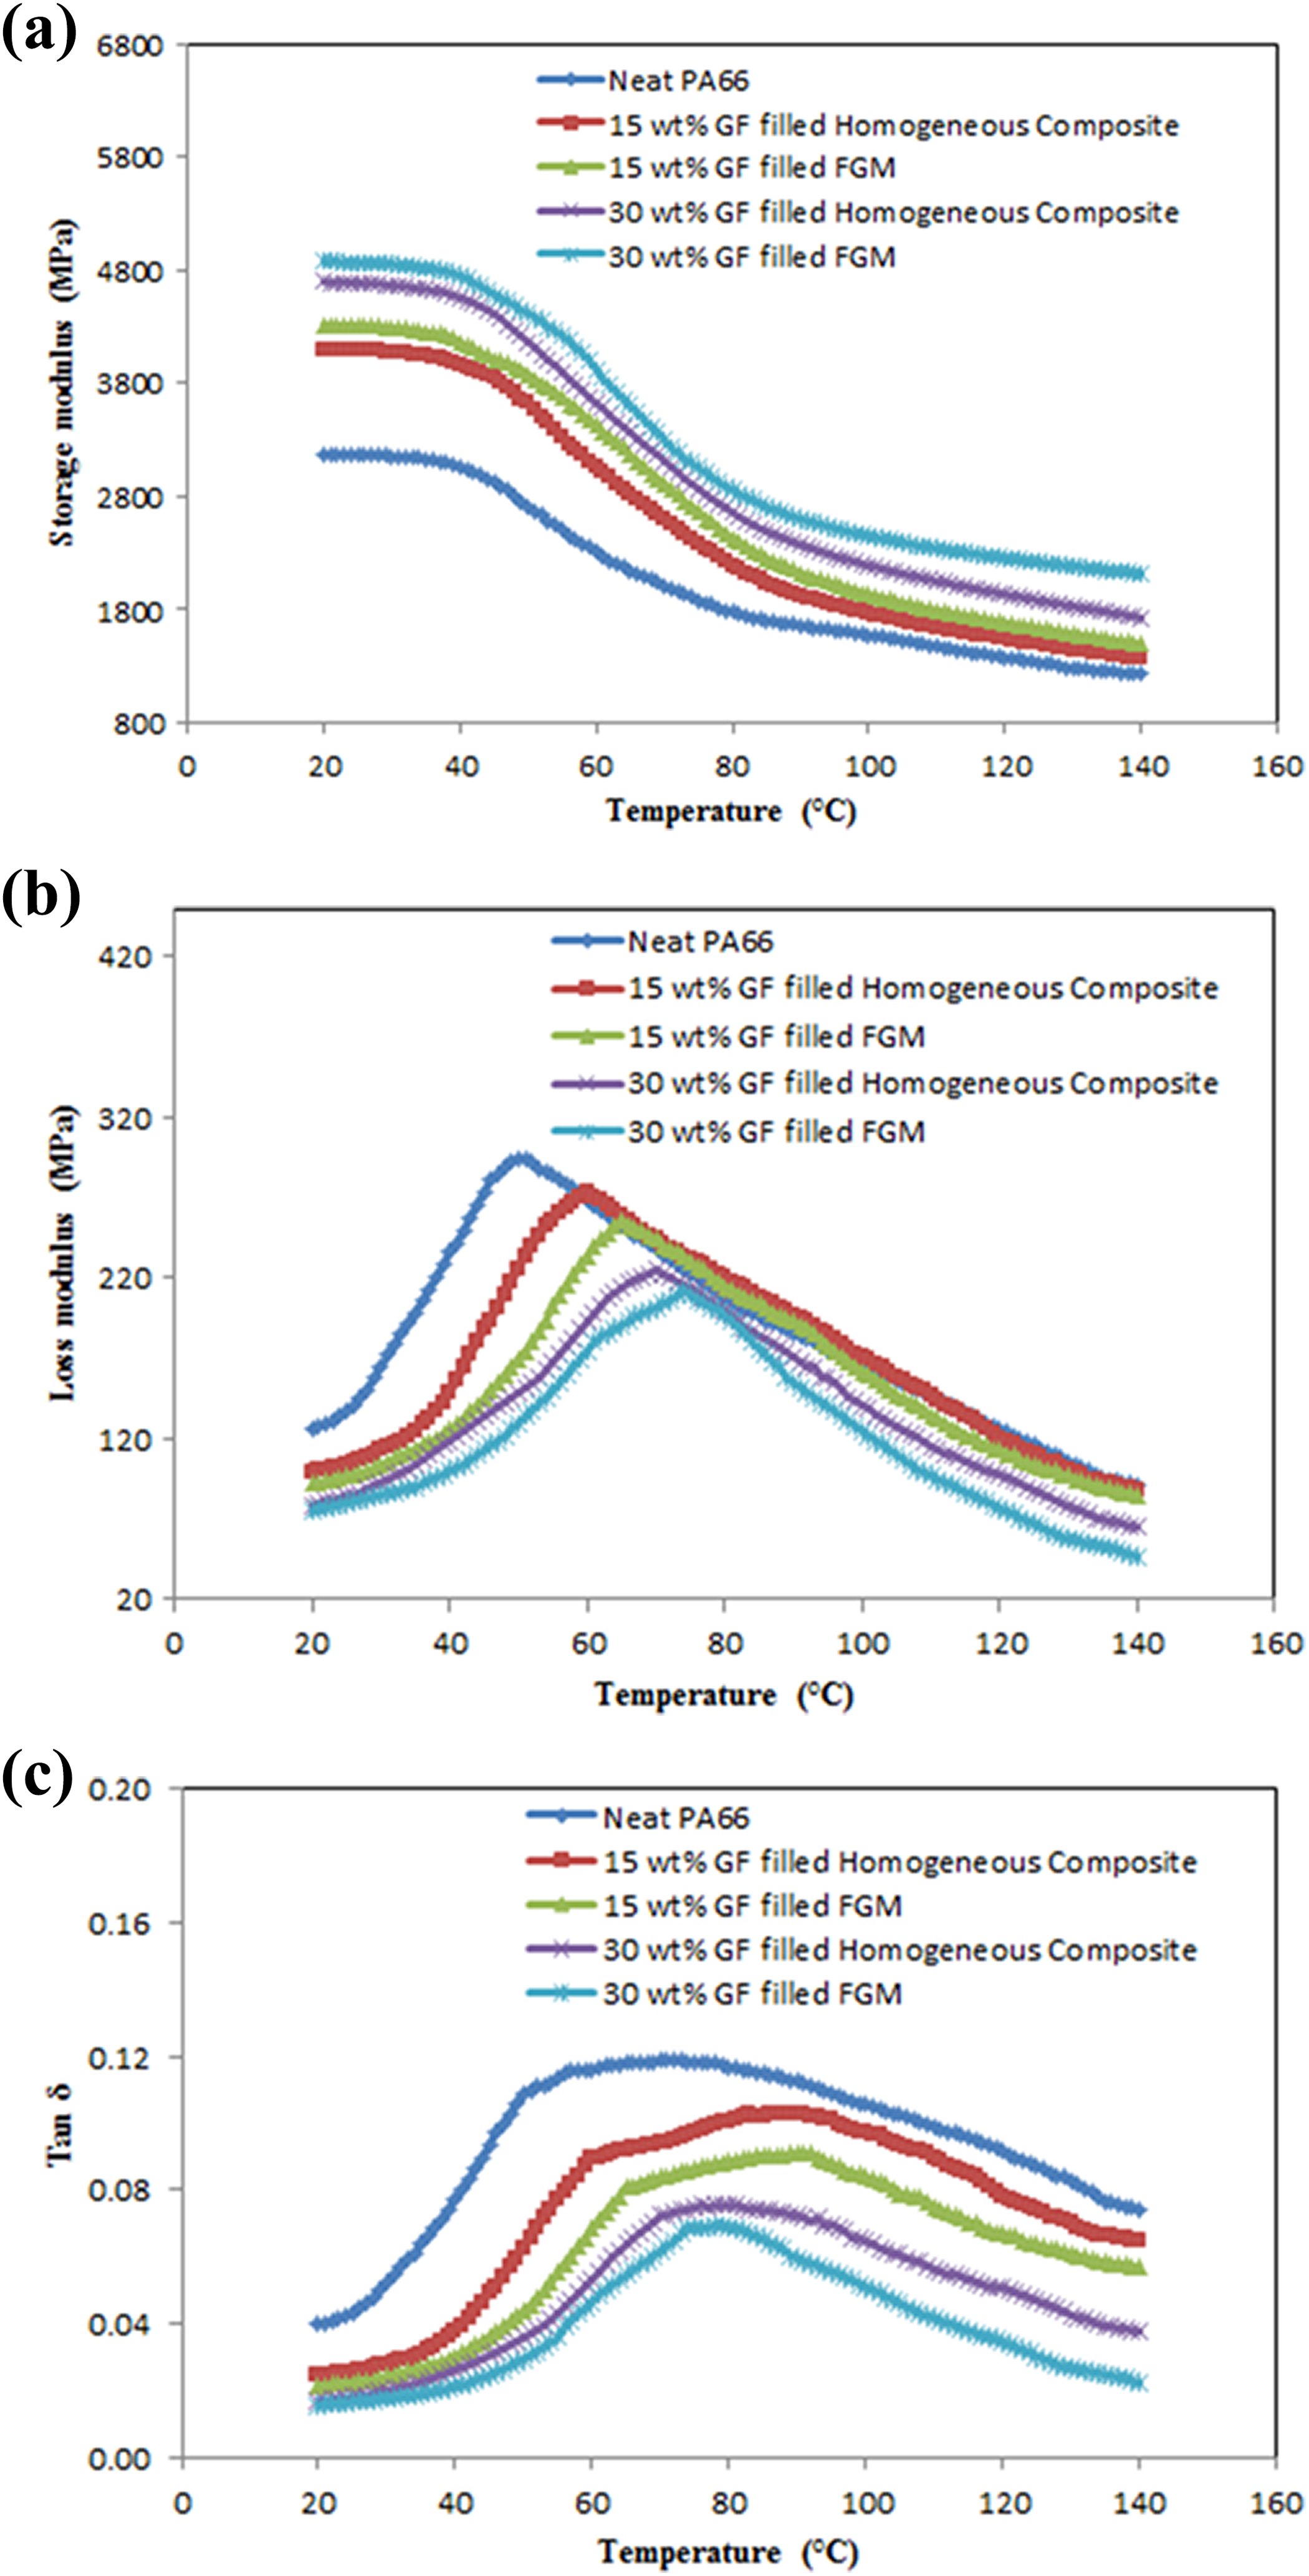
DMA of FGMs and homogeneous composites (a) storage modulus, (b) loss modulus, and (c) tan δ.
The stiffness of a viscoelastic material is represented through the storage modulus. The material shows stable mechanical behavior at less than 40°C temperature as the composites are in the glassy region and thus there is limited molecular mobility of the polymeric chains. The storage modulus of all composites steeply decreases with further increase in temperature for the range of 40–85°C as evident from Figure 17(a). The order of storage modulus (E″) in the temperature range of 40–85°C is: PA66F30 > PA66H30 > PA66F15 > PA66H15 > NPA 66 that indicates reinforcement effects divulged by the fiber allowing stress transfer ability across the interface.
The loss modulus (E″) is the measure of energy lost as heat per cycle of sinusoidal deformation. Loss modulus (E″) measures the viscous response of the material. It is observed from the Figure 17(b) that loss modulus (E″) have a reverse trend as that of storage modulus (E′) for the FGMs and homogenous composites. Loss modulus (E″) increases with a decrease in the fiber loading. FGMs filled with 30 wt% of glass fiber and neat PA66 has minimum and maximum loss modulus (E″), respectively. Neat PA66 has maximum loss modulus (E″) at 50°C while for 30 wt% glass fiber–filled FGMs, it is maximum at 70°C. FGMs have low loss modulus (E″) as compared to homogeneous composites for both (15 wt% and 30 wt% of glass fiber) reinforcement.
The damping factor (tan δ) indicates the recoverable energy in terms of mechanical damping or internal friction in a viscoelastic system. 48 The peak of the damping factor (tan δ) shows the glass transition temperature of the composites. Under the glass transition stage, composite material property changes from a glass state to rubber-elastic state when the sinusoidal load at the frequency of 1 Hz is applied with the increase in temperature. FGMs reinforced with 15 wt% and 30 wt% glass fibers have the glass transition temperature of 85°C and 77°C, respectively, while the homogenous composites have 85°C and 79°C. The glass transition temperature for neat PA66 is 70°C. Neat PA66 and FGM filled with 30 wt% glass fiber has maximum and minimum damping factor (tan δ), respectively.
Thermal conductivity of FGMs and homogeneous composites
Figure 18 shows the thermal conductivity of FGMs and homogeneous composites. FGMs and homogeneous composites reinforced with 15 wt% and 30 wt% of glass fiber have the increasing function of thermal conductivity. The thermal conductivity of FGMs is higher as compared to homogeneous composites. Glass fiber has high thermal conductivity as compared to the matrix material. Large amount of fiber accumulated at the periphery of FGMs helps to flow more heat within the sample. On the other hand, fibers are homogenously trapped within the matrix material in homogeneous composites that cause less heat flow within the sample. An effective chain of fibers is not formed in homogeneous composites to enhance the heat flow within the homogeneous composites as it is possible in the FGMs.
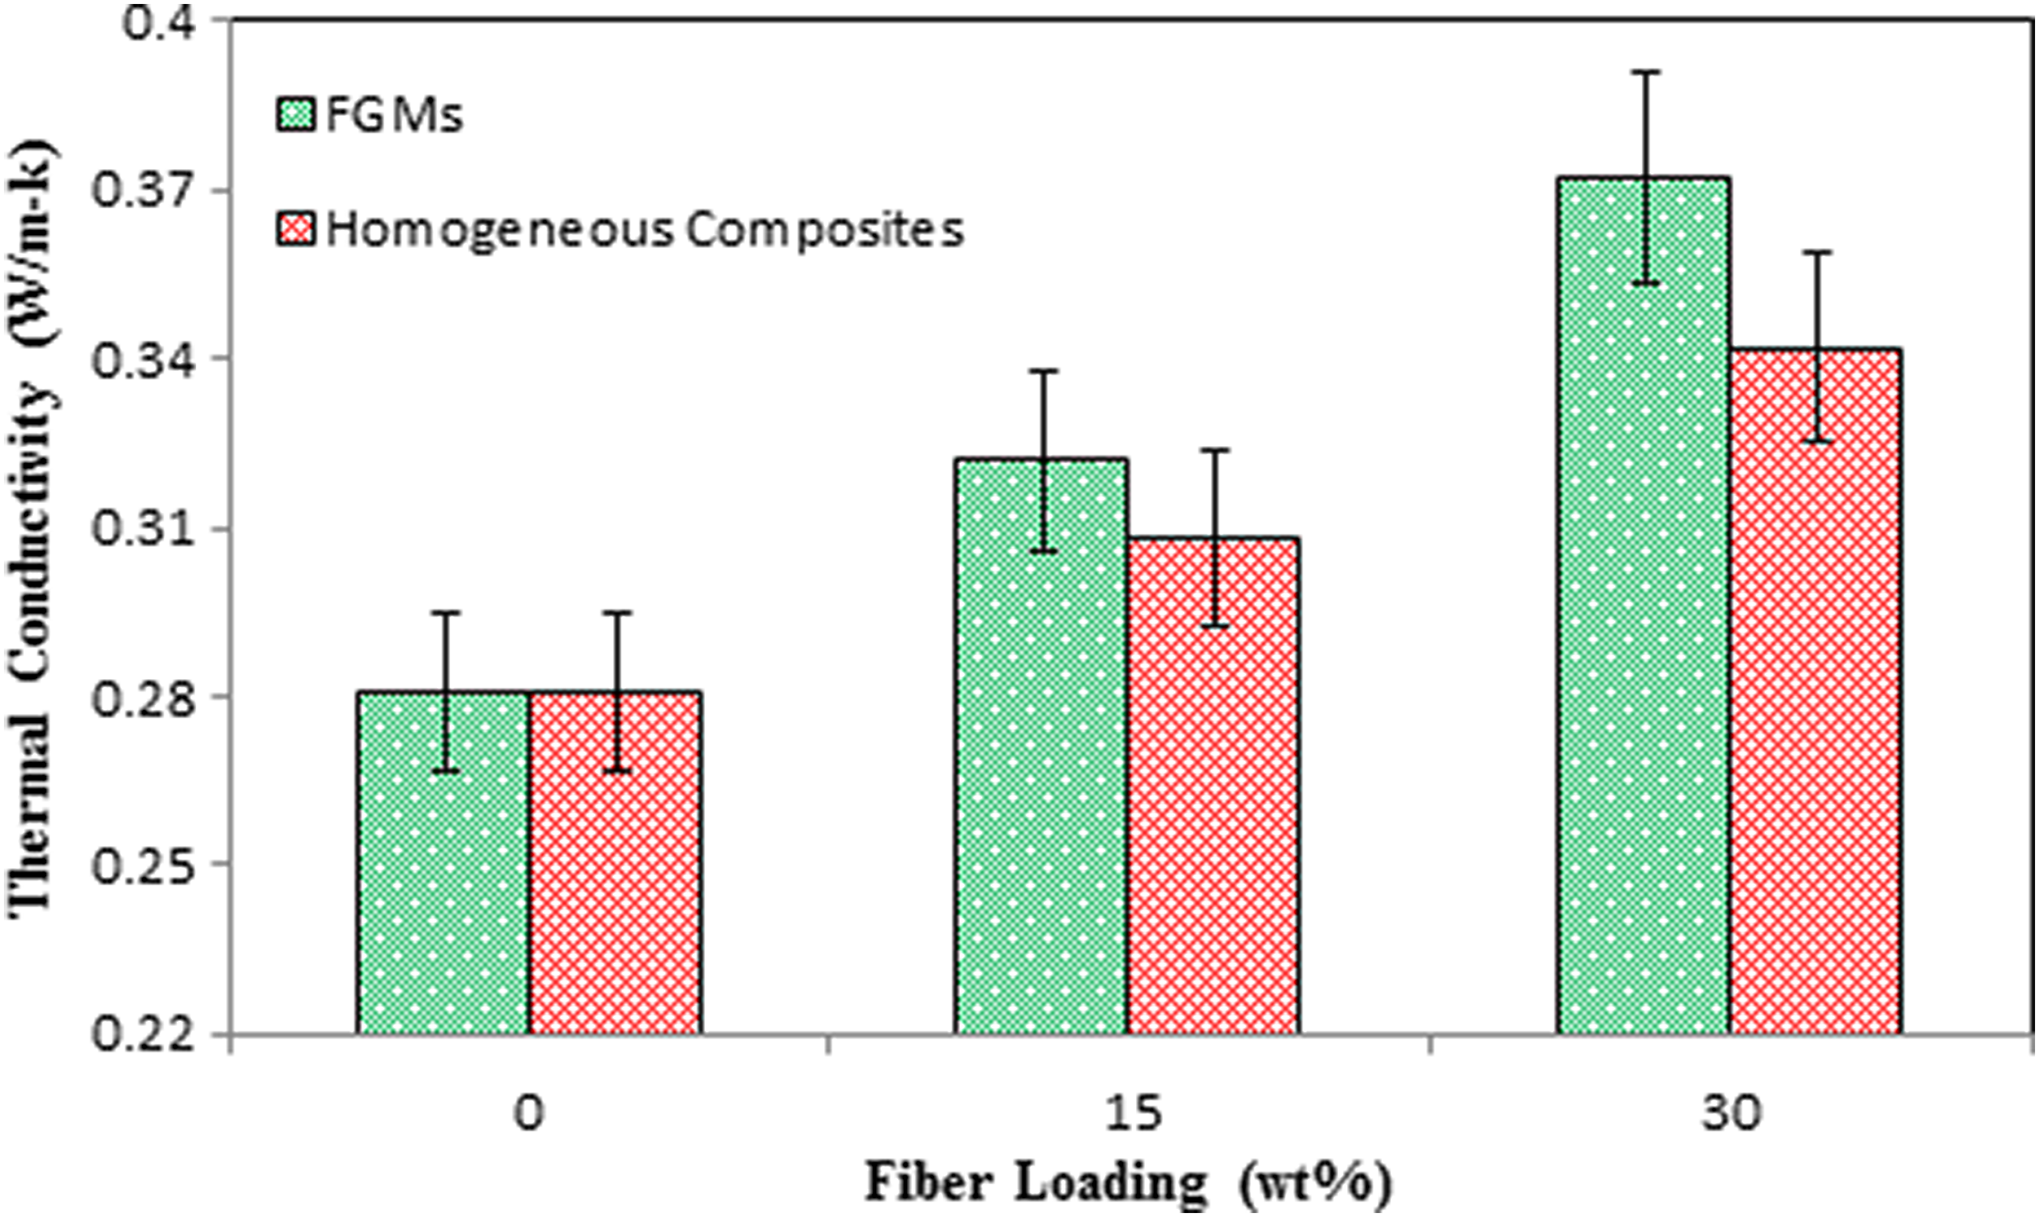
Thermal conductivity of FGMs and homogeneous composites.
Conclusion
The following conclusions can be drawn from this research work: Glass fiber–filled PA66-based FGMs are successfully fabricated by a novel root of manufacturing. Continuous gradation in FGMs and uniform distribution of fibers in homogeneousscomposites is observed by SEM analysis, hardness measurement, and ignition loss test method. Mechanical properties of FGMs are found better as compared to homogeneous composites except for tensile modulus. Fracture toughness of FGMs is higher than homogeneous composites. FGMs performed superior as compared to homogeneous composites under DMA. The thermal conductivity of FGMs is higher than homogeneous composites. Glass fiber–filled FGMs and homogeneous composites show better mechanical, fracture, and thermomechanical characterization as compared to neat PA66 composite.
Footnotes
Authors’ Note
Akant Kumar Singh is currently affiliated with Department of Mechanical Engineering, ITS Engineering College, Greater Noida, Uttar Pradesh, India.
Acknowledgement
The authors acknowledge the Material Research Centre, MNIT Jaipur (India), for their support to perform the dynamic mechanical analysis.
Funding
The author(s) disclosed receipt of following financial support for the research, authorship, and/or publication of this article: This work was supported Department of Science and Technology (DST), Government of India for this work vides their Grant No.: SERB/F/5361/2012-2013.