
Abstract
In this study, magnetic polyurethane rigid foam nanocomposites were synthesized by in situ polymerization of polyol and diisocyanate in the presence of ferroso-ferric oxide (Fe3O4)@silicon dioxide (SiO2)@urea magnetic core-shell nanoparticles (NPs). The structure of the Fe3O4@SiO2@urea NPs were confirmed by Fourier-transform infrared spectroscopy, scanning electron microscopy, transmission electron microscopy, thermogravimetric analysis, and energy-dispersive X-ray spectroscopy. The effect of the Fe3O4@SiO2@urea NPs on sound absorption characteristics, thermal stability, and mechanical property of the polyurethane (PU) foams was studied. The sound absorption coefficient was determined using the sound impedance tube method, and it was concluded that the coefficient of the composites was increased in comparison to the pure foam and previously reported magnesium hydroxide-3% and aluminum oxide-3% PU foams, over the entire frequency range.
Keywords
Introduction
Polyurethane (PU) is a polymer with the most versatile applications. It is capable of easily changing its properties by changing the chemical composition or adding filler reinforcement agents. PU foams can be achieved from the reaction of a polyol with a diisocyanate. Urethane linkages are formed by the reaction of the polyol with isocyanate groups, whereas the reaction of isocyanate with water produces an unsteady carbamic acid, which generates carbon dioxide, directly. Carbon dioxide is a blowing agent for PU foams. 1,2
PU foam is an outstanding material for many applications. It is widely used in applications such as seating, cushioning, packing, and insulation. Noise pollution has become one of the worst problems of environmental pollution in the world. Efficient sound absorption materials are used to reduce sound pollution. PU foams have excellent dampening ability and can be used as an acoustic absorption material. 3 Despite these extensive applications, polyurethane rigid (PUR) foams have some disadvantages, such as low thermal stability and low mechanical strengths. In recent years, a great deal of effort has been devoted to overcoming these drawbacks by developing novel nanocomposite generations. Fillers with appropriate size and specific surface area have been used to improve the properties of the PUR foam. Tiuc et al. have used textile wastes as fillers up to 30% in PUR foam matrix for improving sound absorbing properties. 4 Gayathri et al. have reported the effect of up to 2% of different fillers (nanosilica, nanoclay, and crumb rubber) on the sound absorption, thermal, and mechanical properties of PU flexible foam. 5 In 2011, improvement of the sound absorption ability of PU foams was observed by adding nanosilica. The results showed, by decreasing cell size of foam, and increasing the density of the PU nanocomposites, the sound absorption coefficient was improved. Again, the thermal and mechanical behaviors of the nanocomposite were enhanced. 1 Among various types of materials, which can be used as a filler in a polymer matrix, the role of inorganic materials such as calcium carbonate, aluminum hydroxide, and silica is irrefutable. On the other side, inorganic nanoparticles (NPs) commonly have very high thermal and mechanical properties. Their high surface energy arises from their nanoscale dimensions, which also allow efficient mixing with a polymer matrix at the molecular level. 6 Among inorganic NPs, magnetite nanoparticles (MNPs) have unique multifunctional properties and numerous applications. Recently, researchers confirmed that magnetic polymers are of most interest in the oil industry. 7 –9 By dispersion of magnetic NPs into PU matrix, the thermal and mechanical properties of polymers were improved and new magnetic materials with interesting properties such as being a carrier for immobilizing of microorganisms for wastewater treatment and magnetic wave absorption were developed. 10 Chen and Pan demonstrated novel magnetic PU foams for oil–water separation. This finding has other potential applications such as thermal and acoustic insulation. 8 Xu and Zheng presented a new magnetic PU film. This kind of composites has the potential to be used as hyperthermia treatment in the biomedical field such as coatings on cardiovascular stents. 11 Guo et al. reported the magnetic and electromagnetic wave behavior of a flexible iron NP reinforced PU nanocomposites up to 65 wt%, and coercivity was found to be larger in the nanocomposites with lower NP loading and was insignificant in the NP assembly. 12 In 2016, incorporated organic–inorganic PU flexible foam nanocomposites were reported for better understanding of cell signing and the effect of MNPs on cell responses. The results indicated that the electrical conductivity of magnetic PU nanocomposites was improved by addition of the MNPs. Moreover, the magnetic PU nanocomposites could be a potential choice for cell therapy. 13
Surface modification of pristine ferroso-ferric oxide (Fe3O4) MNPs is employed to enhance the performance of the NPs, increase the interaction between MNPs and the PU matrix, and to reduce the aggregation. In a previous work, superparamagnetic Fe3O4 NPs were modified with aminopropyltriethoxysilane and n-(2-aminoethyl)-3-aminopropyltrimethoxysilane (AEAP) and incorporated into PU foam via one-shot method. Modified magnetic core-shell NPs had fewer aggregation ability in comparison to pure Fe3O4 NPs. Experimental results showed an increase in thermal stability of PU foam nanocomposites. 14 –16
Here, we wish to report the preparation of novel magnetic Fe3O4@silicon dioxide (SiO2)@urea/PUR foam nanocomposites by in situ polymerization method of monomers in the presence of NPs. Modified magnetic core-shell NPs were used up to 3 wt% in the foam formulation and their effect on sound absorption in the low frequency range (200–1300 Hz) was studied by impedance tube method. Thermal, magnetic, and mechanical properties of the nanocomposites have also been investigated.
Experimental
Materials
Iron (II) chloride tetrahydrate (FeCl2·4H2O, 99.7%), iron (III) chloride hexahydrate (FeCl3·6H2O, 99.0%), ammonia solution (NH3·H2O, 25%), ethanol (C2H5OH, 99.7%), tetraethyl orthosilicate (98%), 3-chloropropyltrimethoxysilane (CPTS), potassium carbonate (K2CO3), potassium iodide (KI), aluminum oxide (Al2O3), magnesium hydroxide (Mg(OH)2), acetonitrile (anhydrous, 99.8%), and toluene (anhydrous, 99.8%) were purchased from Merck (Germany) or Fluka (Switzerland) and were used as received without further purification. The polyol (mixed of polyester and polyether) used was a Polymok®-327 from the Mokarrar Company in Iran as a colorless viscous liquid, having a viscosity of 2100–2500 cps at 25°C, a specific gravity of 1.12 g cm−3 at 25°C, and water content of 1.6%. The isocyanate moiety (4,4′-diphenylmethane diisocyanate) was Isomok®-370 from the Mokarrar Company in Iran (dark brown liquid, having a viscosity of 200–400 cps at 25°C and specific gravity of 1.23 g cm−3 at 25°C). Both Polymok® and Isomok® were chlorofluorocarbon free systems.
Instruments
Surface morphology, energy-dispersive X-ray (EDX) spectra, and particle size of the magnetite Fe3O4@SiO2@urea NPs and PUR nanocomposites were studied by a VEGA/TESCAN scanning electron microscope (Czech Republic) and Hitachi H9000-NAR microscope (Japan). Fourier-transform infrared (FTIR) spectra were recorded on a Shimadzu 8400S (Japan) and Shimadzu GladiATR 10 spectrophotometers (Japan). Simultaneous Thermal Analysis (STA) (thermogravimetric analysis (TGA) + Differential Thermal Analysis (DTA)) was performed with an STA 504® from TA Instruments (United States) under air atmosphere at a heating rate of 10°C min−1. The dynamic mechanical analysis (DMA) measurements were performed by a DMTA-Triton (Tritec 2000 DMA, England) over a temperature range of −100°C to 250°C at a frequency of 1 Hz with a heating rate of 10°C min−1 and in compression mode. The sound absorption coefficient was performed by impedance tube (B&K Company, Denmark). The magnetic properties of the samples were studied using a Vibrating Sample Magnetometer (VSM) (Kavir Magnetic Company, Iran).
Methods
General procedure for synthesis of urea-modified MNPs and PUR nanocomposites
The Fe3O4 and Fe3O4@SiO2 NPs were synthesized according to previous report. 17 For the synthesis of Fe3O4@SiO2@CPTS NPs, at first, 1 mL of CPTS was dissolved in dried toluene. This mixture was added to 1 g of Fe3O4@SiO2 and the solution was stirred at 60°C. The prepared NPs were washed with toluene, separated by a magnet and then dried. 18 The prepared NPs (1 g) and KI (1.66 g) were added to a solution of urea (0.6 g) and K2CO3 (1.38 g) in acetonitrile in a round-shaped bottom flask and the mixture was stirred under reflux condition for 8 h. The obtained magnetic NPs Fe3O4@SiO2@urea were collected and washed with water/ethanol and dried at 80°C. 19 Following that, modified MNPs were dispersed in the polyol matrix (1–3 wt%). The mixture was sonicated and then the sample was mixed with isocyanate in a mold at 10:12 polyol: isocyanate weight ratio. Finally, the samples were kept at room temperature for curing. The prepared nanocomposites were labeled as PUR n where n is referred to the Fe3O4@SiO2@urea NPs percentage in the foam formulation (PUR0, PUR1, PUR2, and PUR3 for 0, 1, 2, and 3% of MNPs, respectively). The formation of PU-rigid foam nanocomposite is shown in Figure 1. By incorporation of urea-modified magnetic NPs in the PU matrix, the reaction between isocyanate groups and amino groups led to the formation of substituted urea fragments.
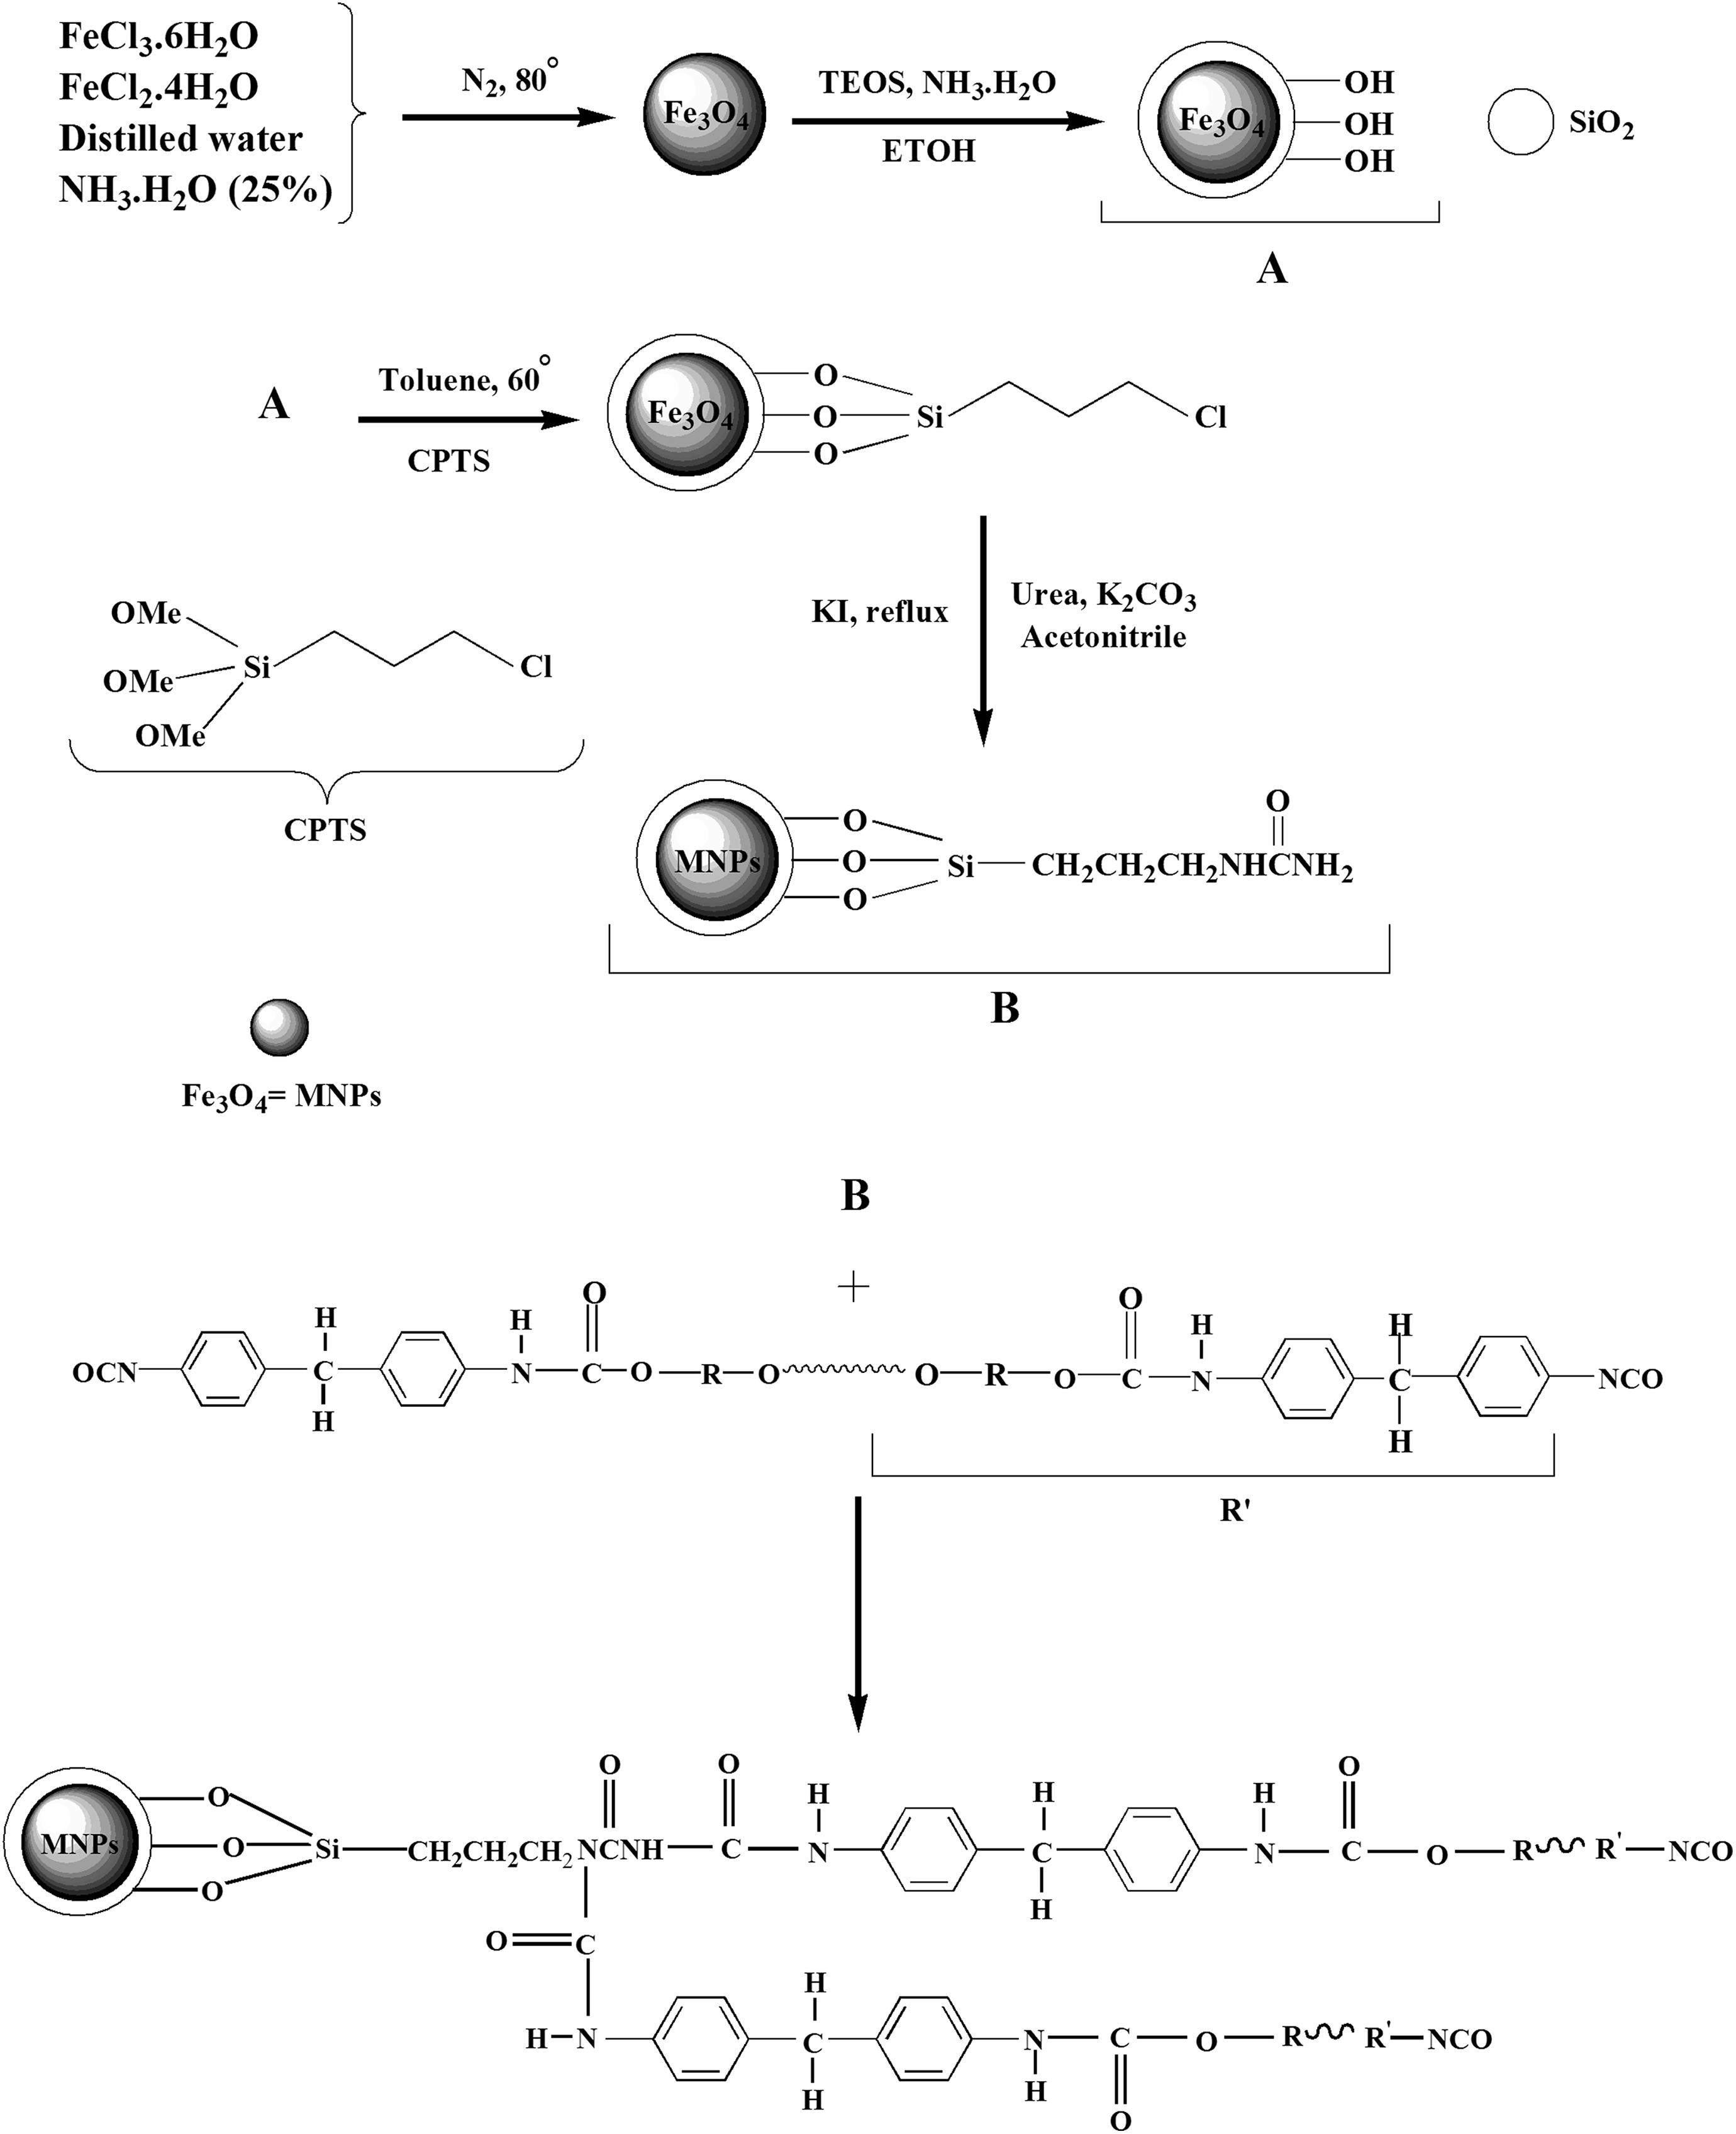
Reaction scheme for modified magnetic PU nanocomposite formation.
Results and discussion
Characterization of magnetite Fe3O4@SiO2@urea NPs
FTIR analysis
Surface modification of Fe3O4@SiO2@urea NPs was confirmed by FTIR spectroscopy (Figure 2). As shown, in the Fe3O4 spectrum (Figure 2(a)), the band at 584 cm−1 is attributed to Fe–O bending vibration mode. 14,15 In the FTIR spectrum of Fe3O4@SiO2@urea (Figure 2(b)), the absorption bands at 732 and 1060 cm−1 are due to the symmetrical and asymmetrical stretching vibrations of Si–O–Si. In addition, Si–O–Fe absorption appeared at 575 cm−1. 6 The presence of propyl groups of CPTS was confirmed by stretching vibrations at 2848 and 2918 cm−1 (C–H stretching vibrations) in the FTIR spectrum. 19 The peaks appeared at 1461 and 1608 cm−1 regions can be assigned to the C–N and N–H bending of urea, respectively. In addition, the absorption bands at 1153, 1702, and 3448 cm−1 are related to NH2 bending vibration, C=O stretching vibration, and N–H stretching vibration of urea, respectively (Figure 2(c)). 19
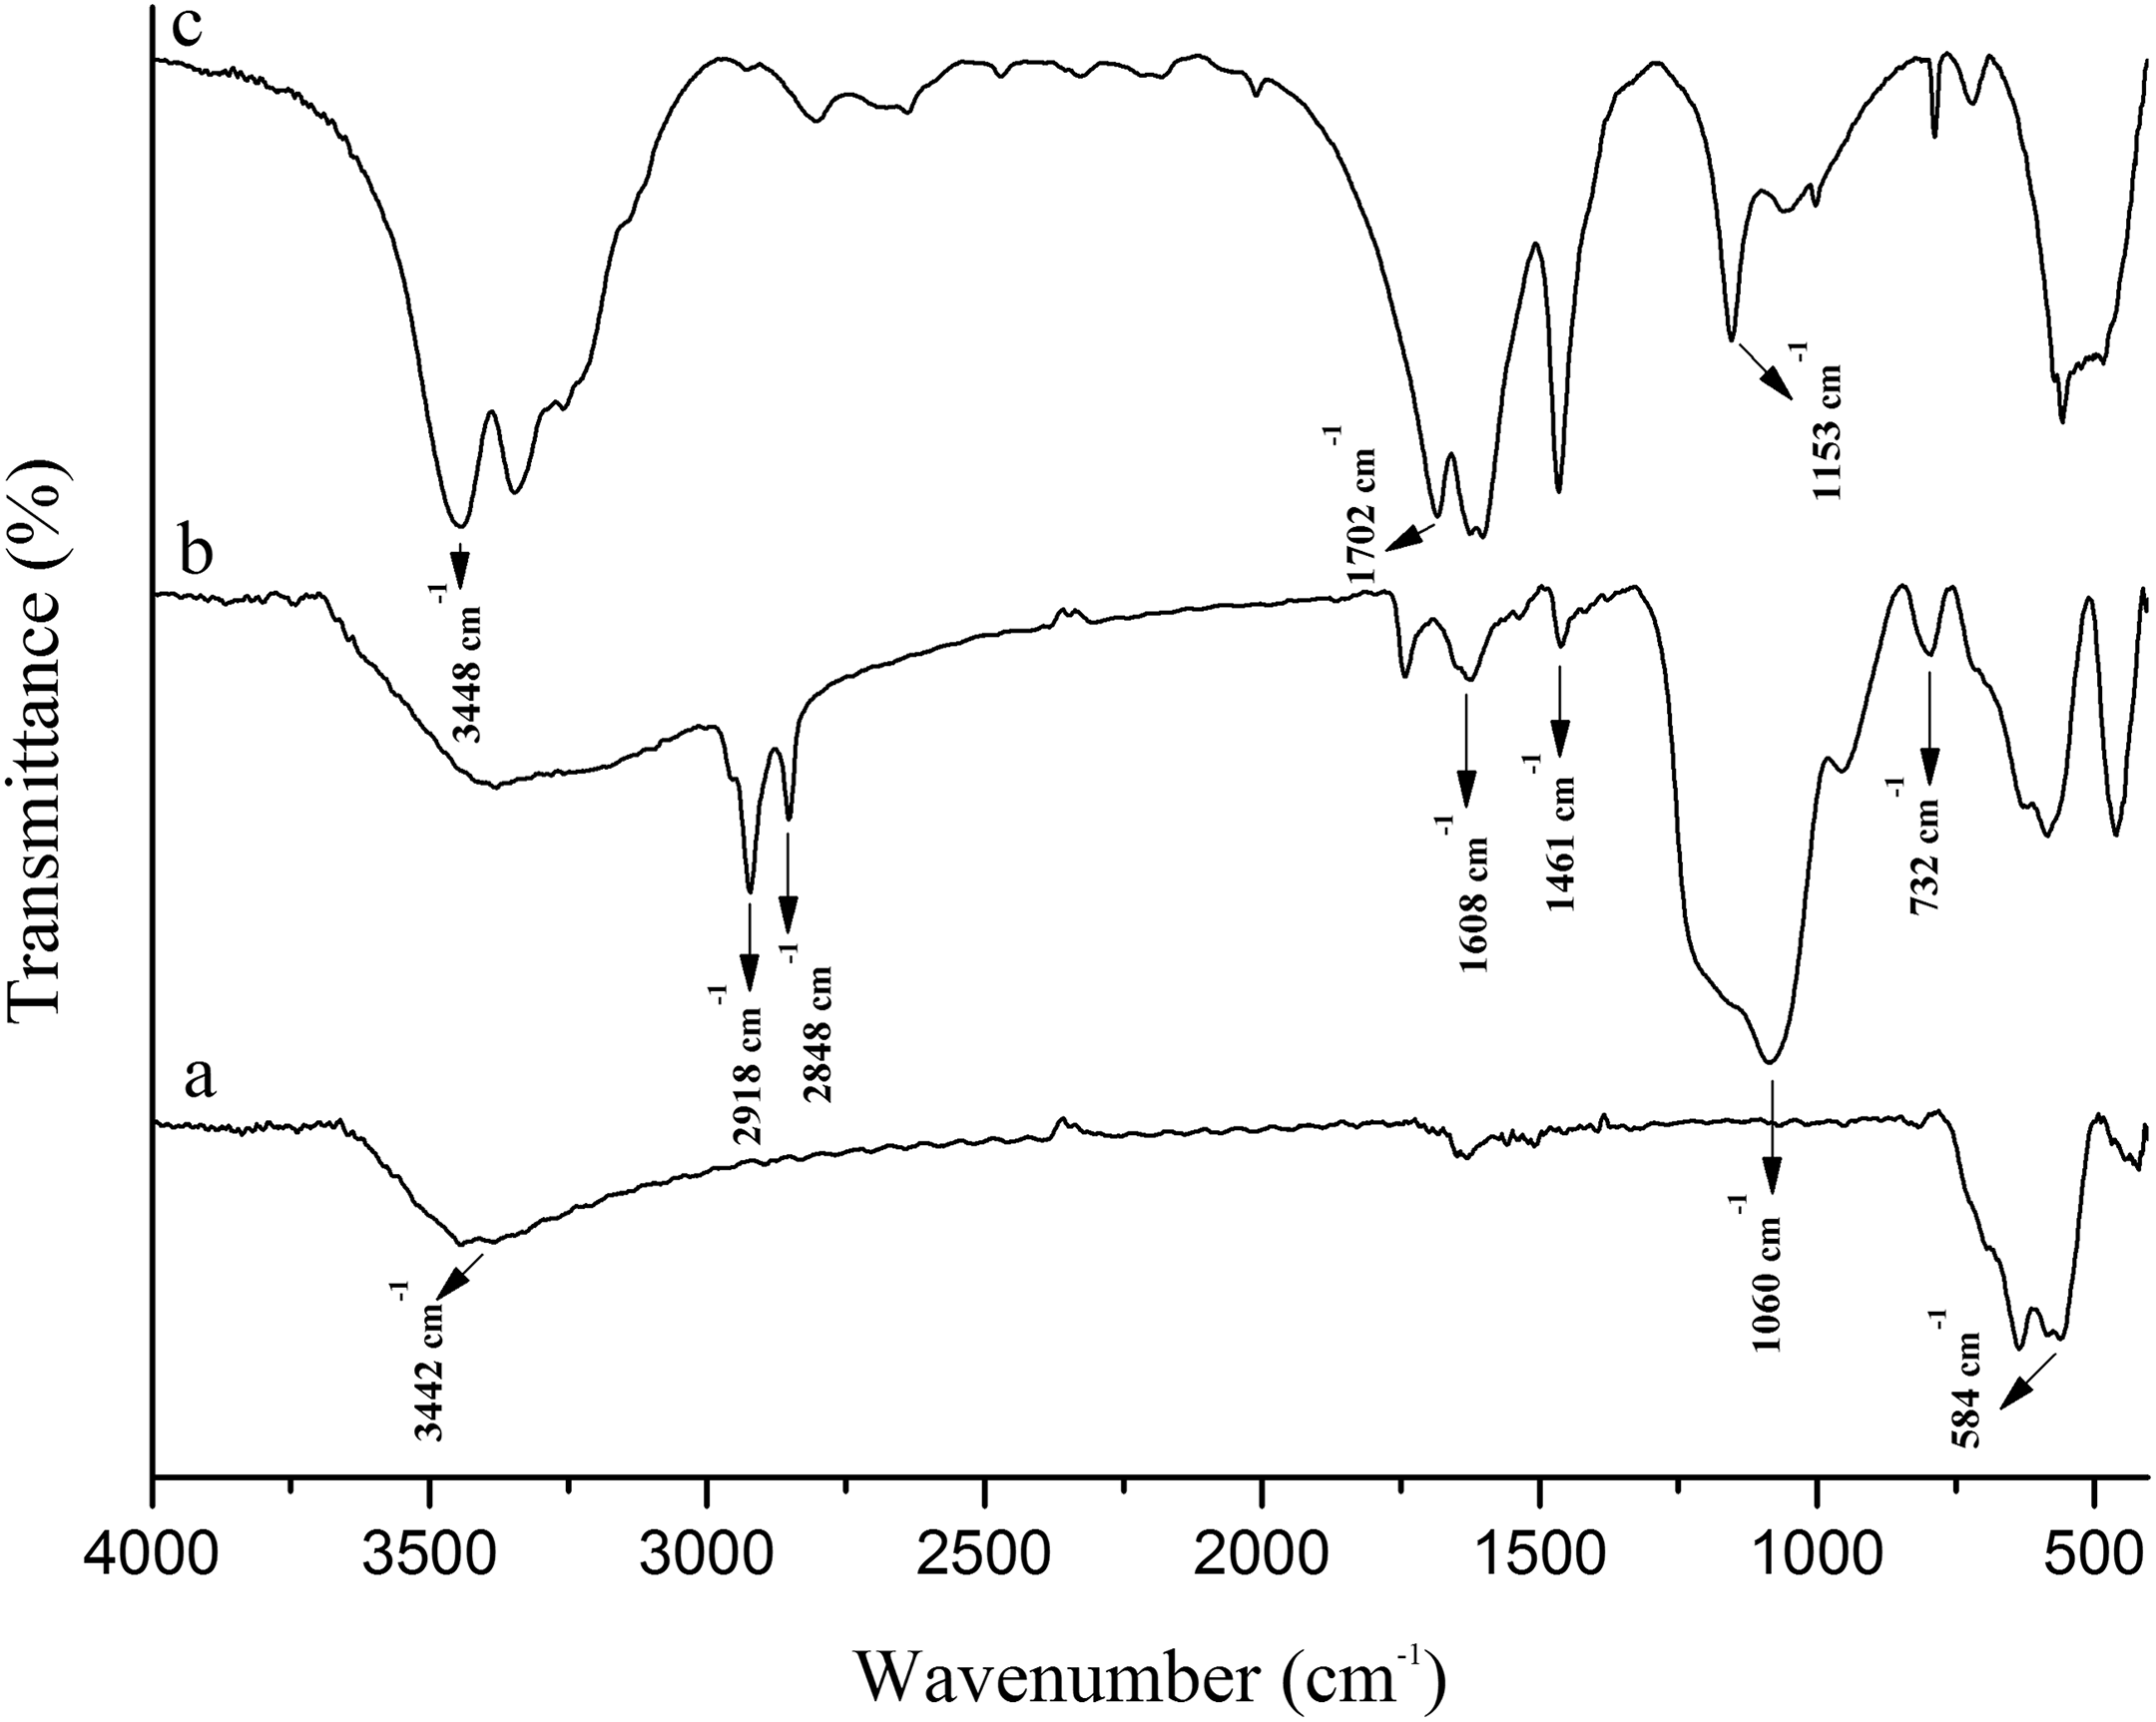
FTIR spectra of (a) Fe3O4, (b) Fe3O4@SiO2@urea nanoparticles, and (c) pure urea.
Morphology (scanning electron microscopy)
The scanning electron microscopy (SEM) and transmission electron microscopy (TEM) images of the synthesized Fe3O4@SiO2@urea NPs have been shown in Figure 3. As shown, by the modification of magnetic iron oxide NPs, we have less aggregation and the average size of Fe3O4@SiO2@CPTS NPs is below 100 nm.
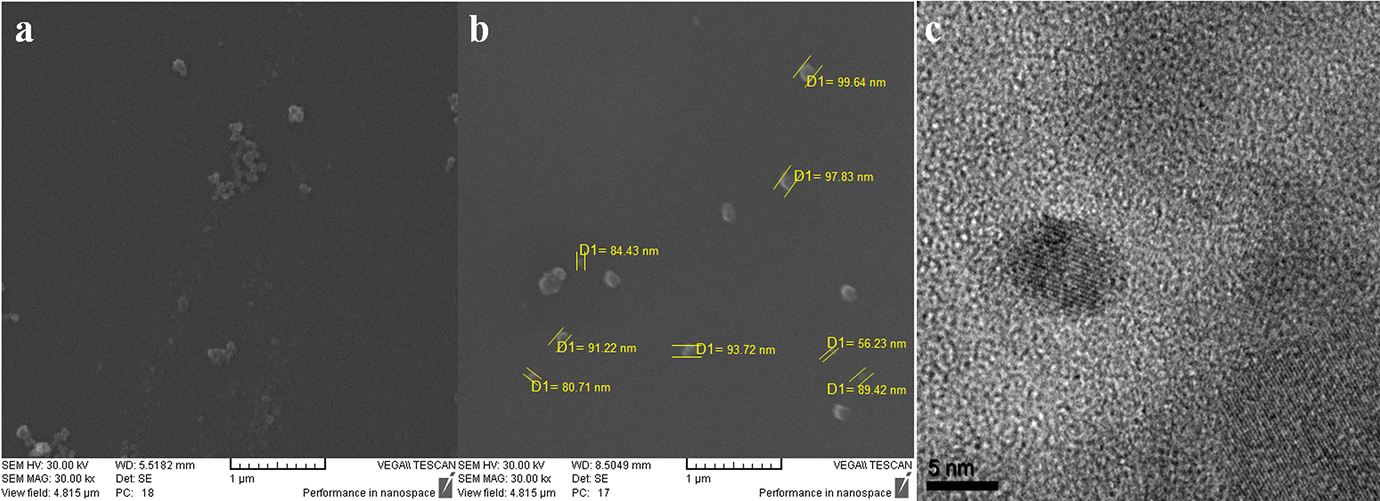
(a and b) SEM and (c) TEM images of modified Fe3O4@SiO2@urea nanoparticles.
Energy-dispersive X-ray spectroscopy
EDX spectroscopy was used to identify the elemental composition of Fe3O4@SiO2@urea NPs (Table 1). As shown in Figure 4, all the expected elements are present, which clearly approves the well-dispersion of MNPs. Chemical characterization of the typical sample showed that it was composed of iron, silicon, oxygen, carbon, and nitrogen elements, which correlates well with the suggested structure. Surface modification of magnetic NPs by SiO2@urea linker can help in better dispersion (due to the less aggregation of the NPs), as well as better interaction of the NPs with the foam matrix via hydrogen bonding. Therefore, it is important to have an idea about the amount of the linked urea. As the only source of nitrogen in the NPs is the urea group, its content can be calculated using the weight percent of N atoms obtained from the EDX analysis, and the stoichiometry between the molar mass of urea moiety and the mass of two nitrogen atoms. As shown, the nitrogen content is about 6.51%, which correlates to about 13.95% of urea.
Energy-dispersive X-ray spectroscopy analysis results of the Fe3O4@SiO2@urea nanoparticle.
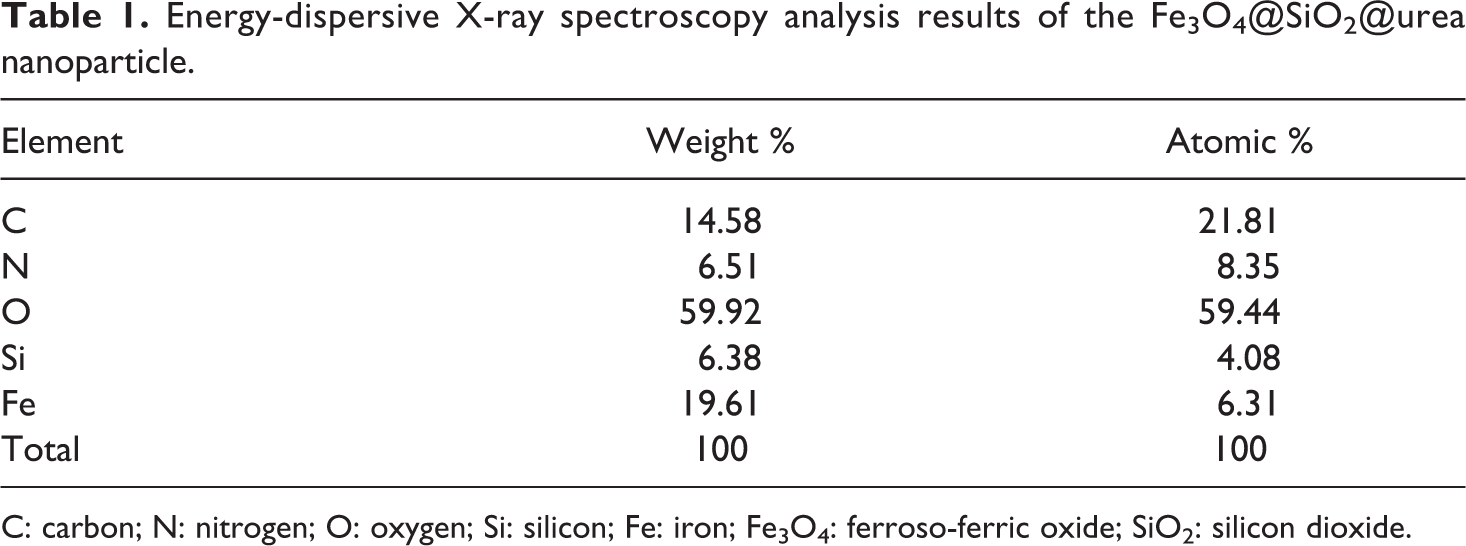
C: carbon; N: nitrogen; O: oxygen; Si: silicon; Fe: iron; Fe3O4: ferroso-ferric oxide; SiO2: silicon dioxide.
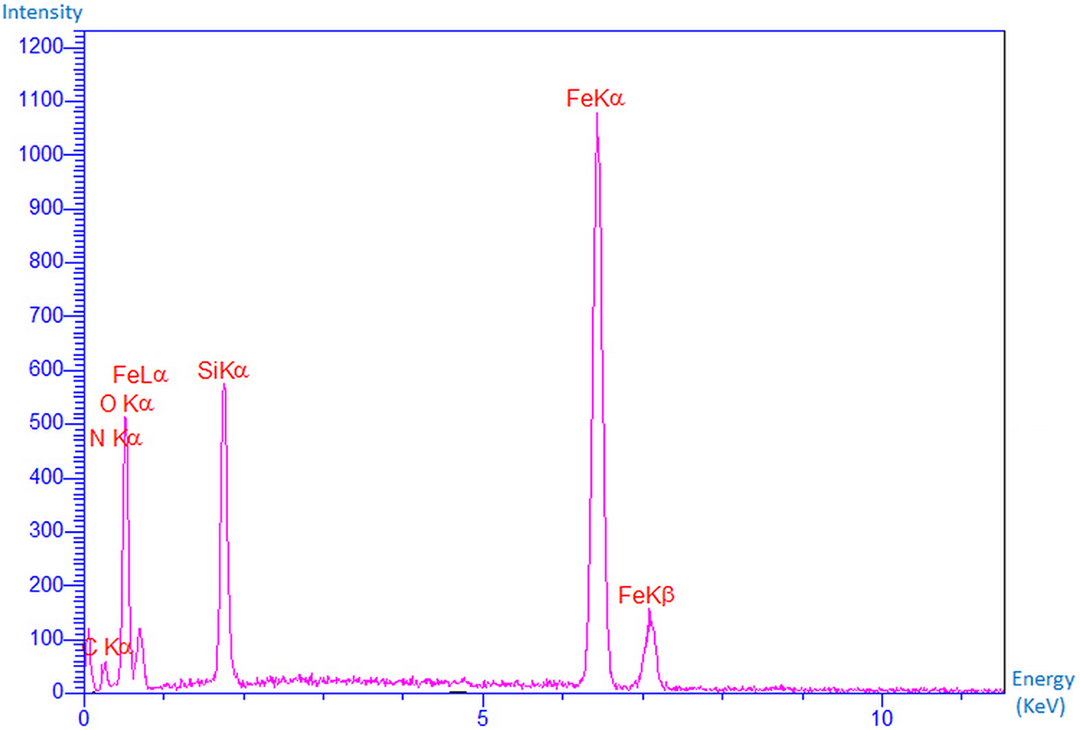
Energy-dispersive X-ray spectroscopy analysis pattern of the Fe3O4@SiO2-CPTS-urea.
Thermogravimetric analysis
TGA curves of Fe3O4 and Fe3O4@SiO2@urea NPs are shown in Figure 5(a) and (b). The thermal degradation of SiO2-urea modified Fe3O4 NPs occurs between the ranges of 300–700°C. This weight loss (about 14%) is mainly attributed to the degradation of propylurea layer on the surface of Fe3O4@SiO2 NPs.
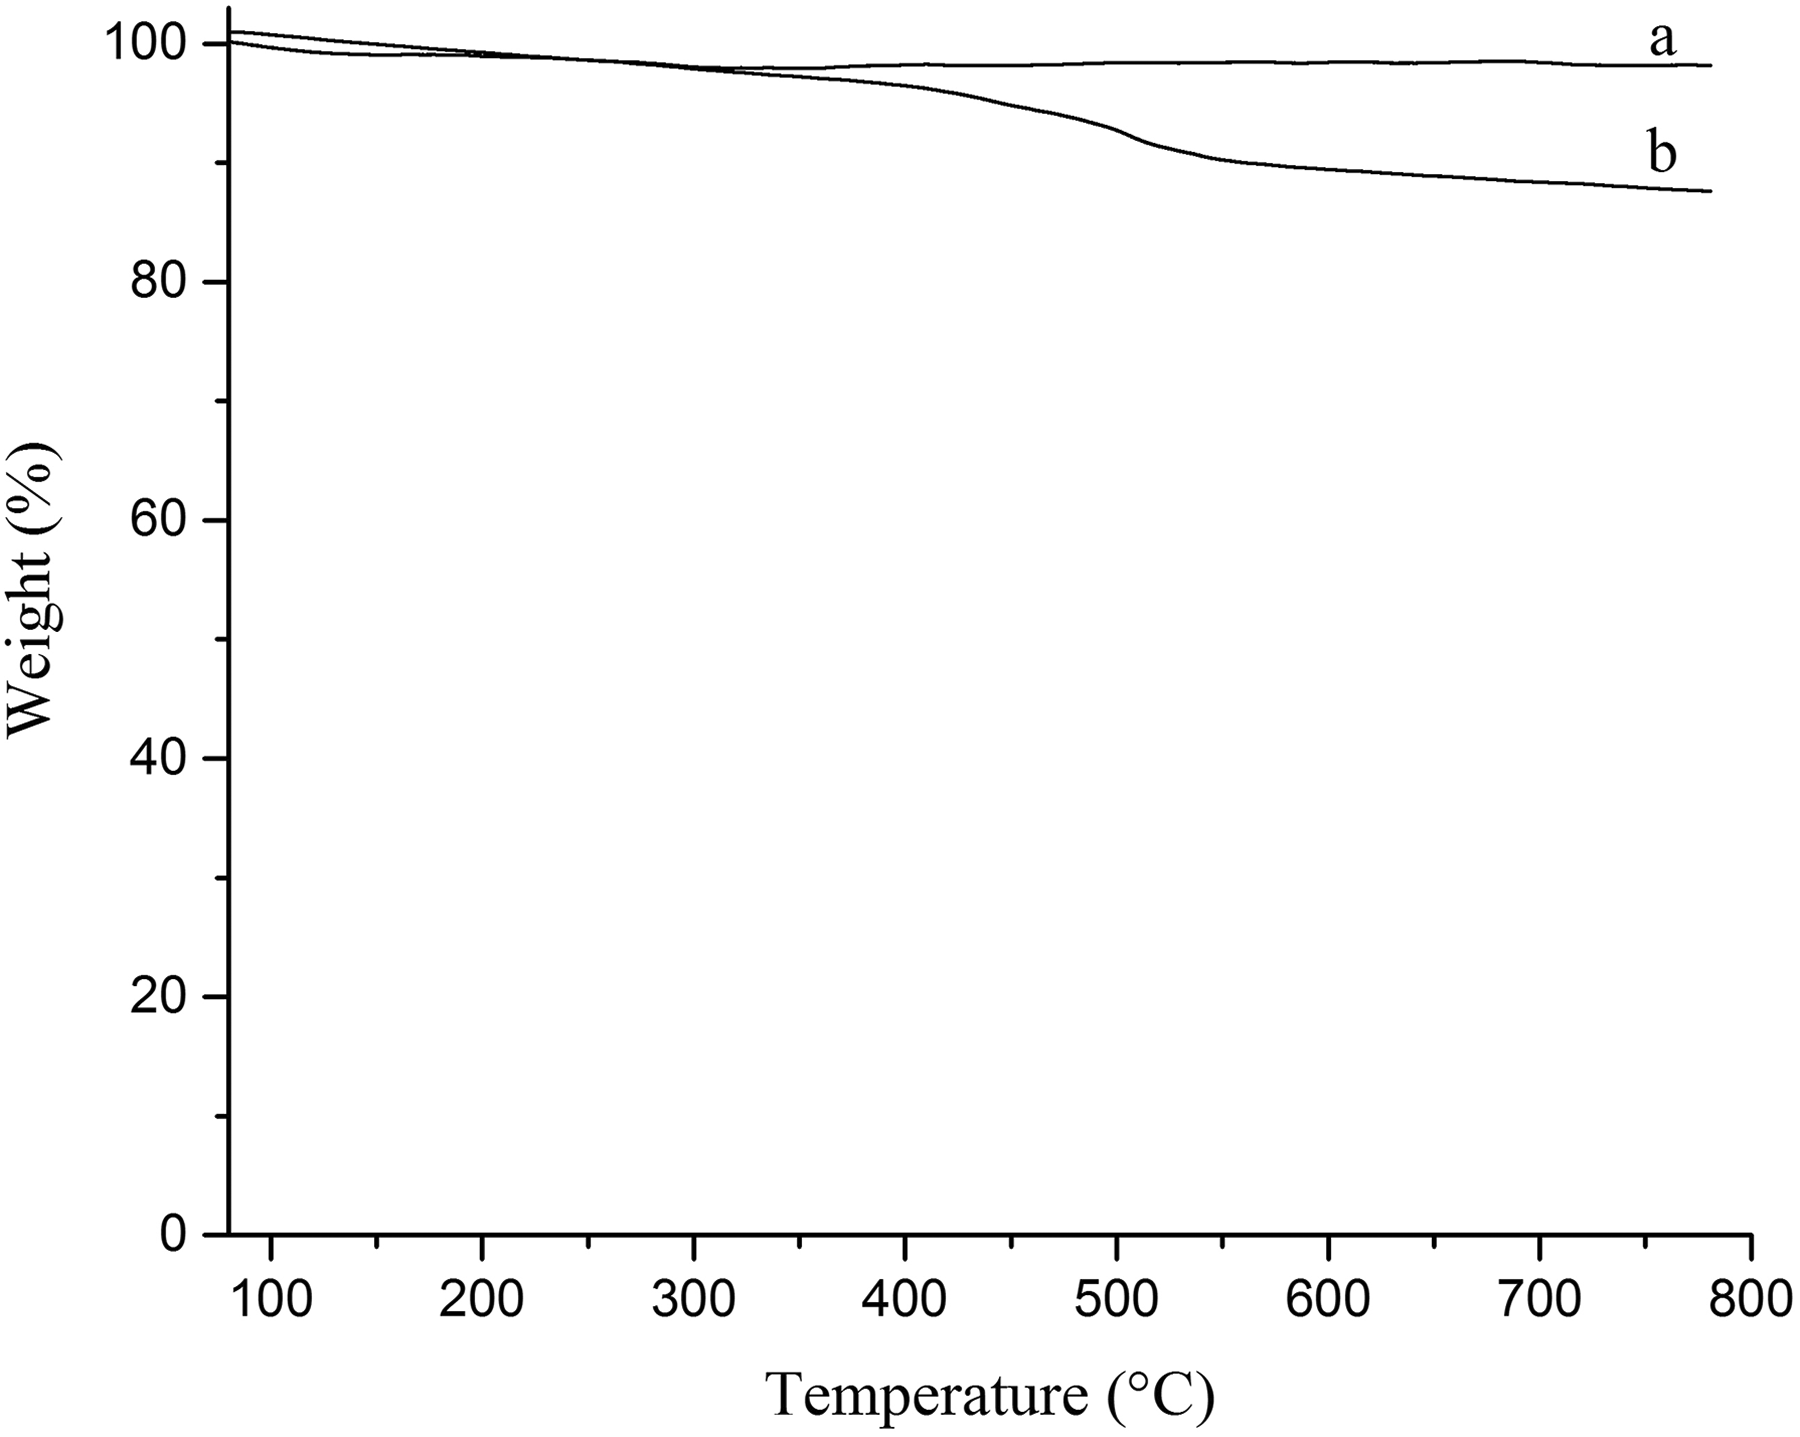
TGA curves for (a) Fe3O4 and (b) Fe3O4@SiO2@urea nanoparticles.
Characterization of magnetic nanocomposites
Attenuated total reflection (ATR) analysis
Figure 6 shows ATR results of pristine PUR foam and its magnetic nanocomposites with different amounts of Fe3O4@SiO2@urea NPs. As shown in the figure, the stretching vibration at 1068 cm−1 belongs to the C–O bond. 14 The absorption band at 1220 cm−1 is due to the urethane group vibration. 14 The absorption band at 1714 cm−1 is due to the C=O asymmetric stretching vibrations. 20 The absorption bands at 2899 and 2922 cm−1 are attributed to CH2 asymmetrical and symmetrical stretching vibrations, respectively. A broad band at 3200–3400 cm−1 belongs to the N–H stretching vibration. 21 As it is clear from the spectra, by formation of nanocomposites (b = 3 wt%), a shift to the lower wavelengths is seen, which is due to the bond formation between polymer matrix and modified magnetic NPs.
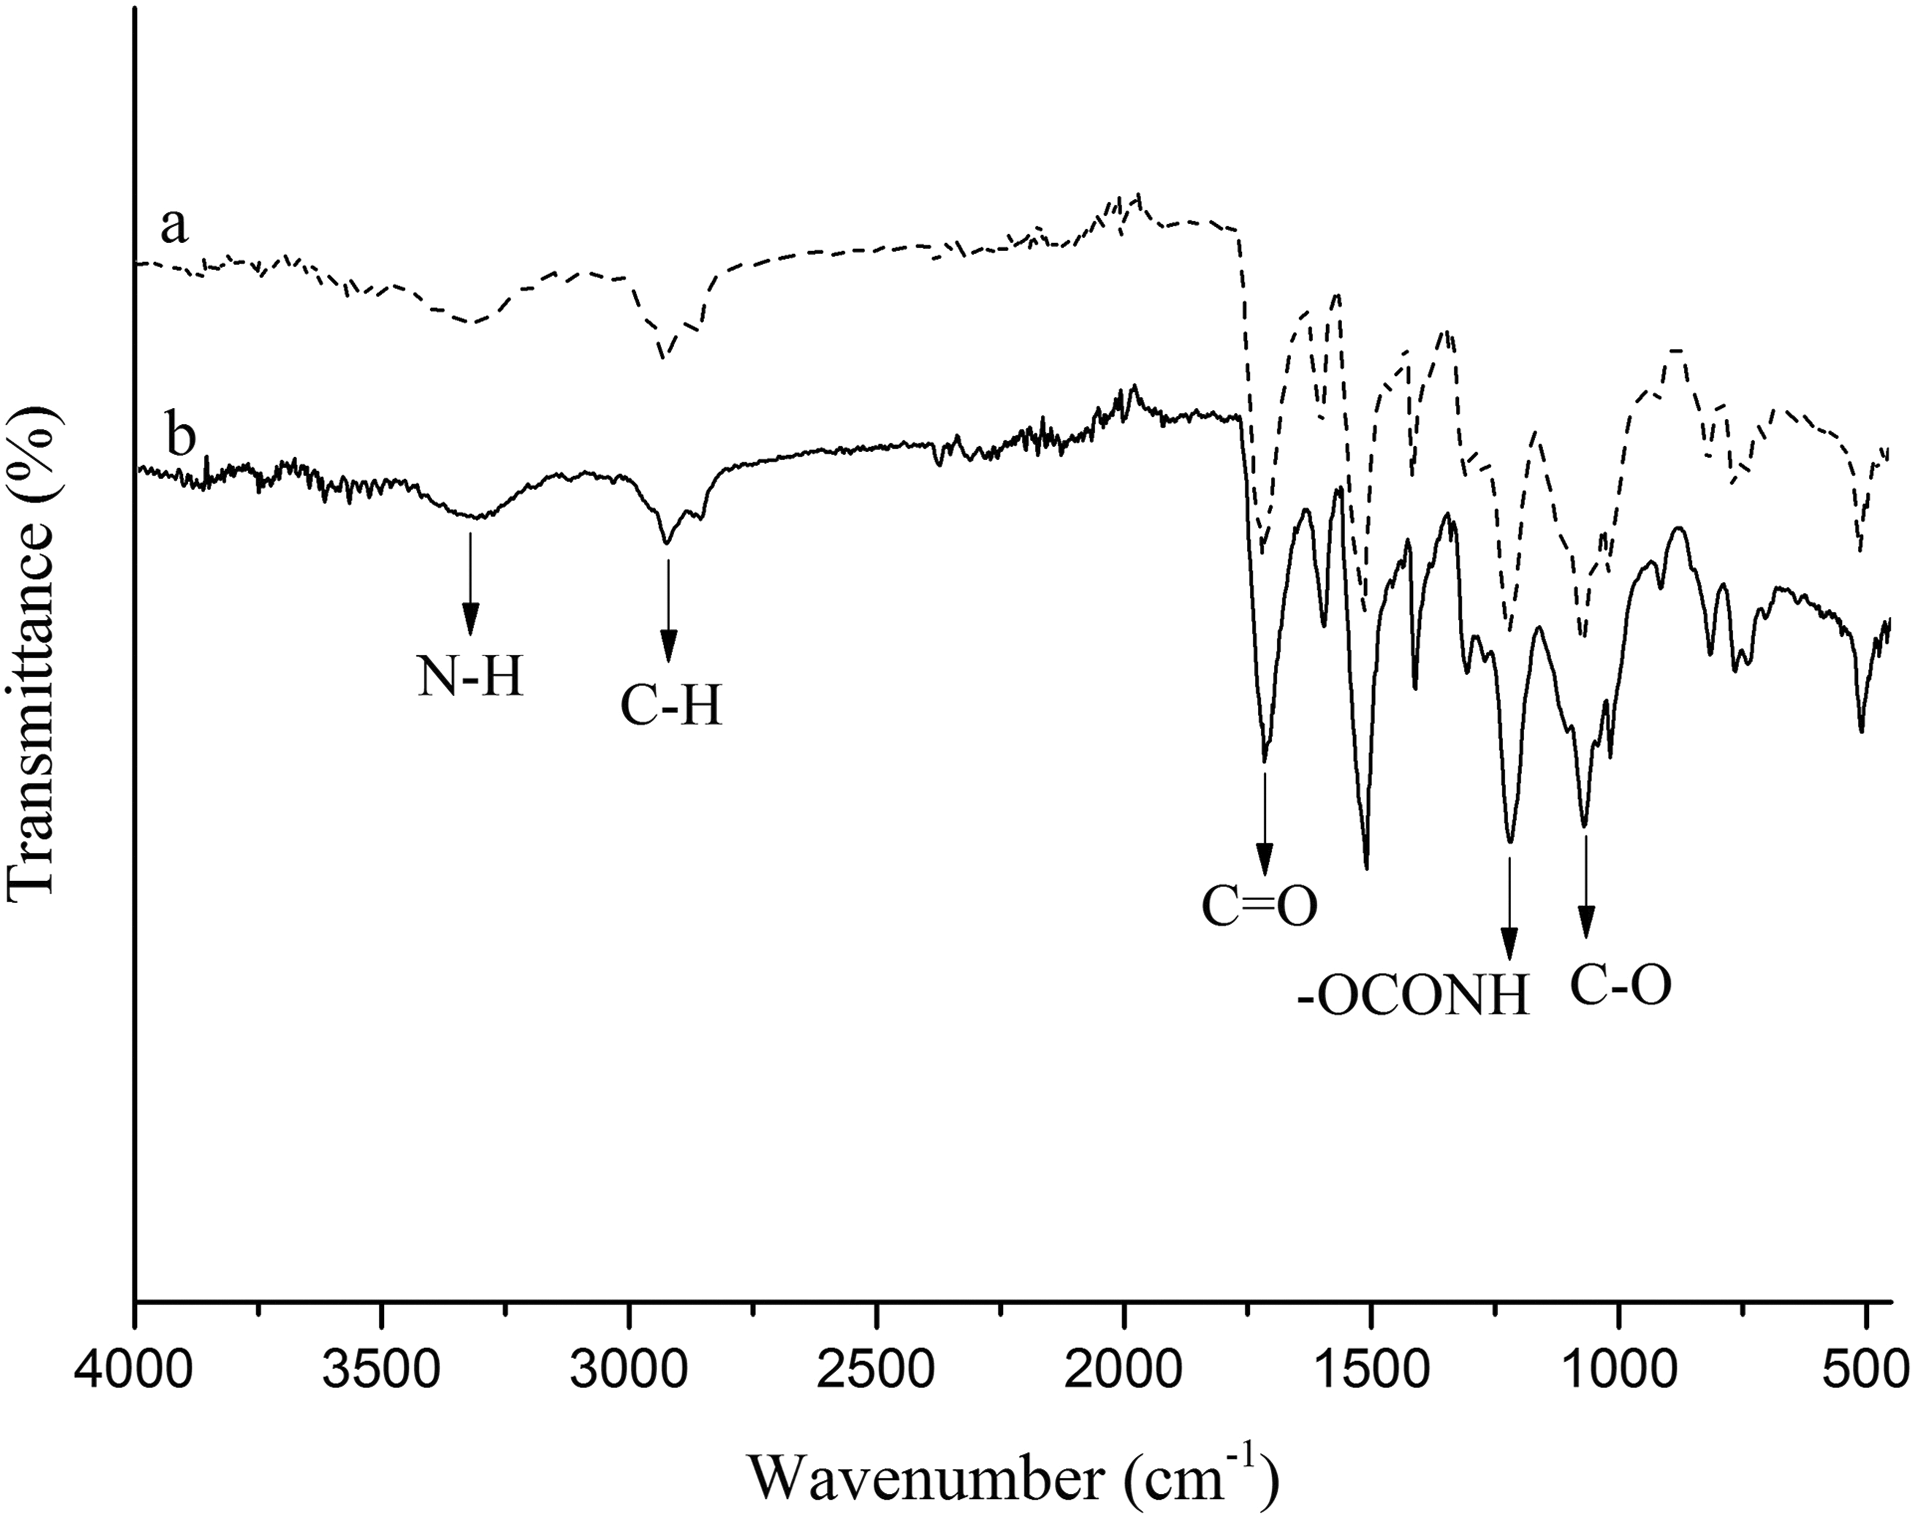
ATR spectra of pure PU (PUR0 (a)) and Fe3O4@SiO2@urea PUR foam nanocomposites (PUR3 (b); 3.0%).
TGA/DTG of PUR foam nanocomposites
To investigate the effect of magnetic NPs on the thermal stability of PUR foams, the TGA with different percentages of filler was considered (Figures 7 and 8). All samples have two notable degradation stages, which corresponded to the degradation of soft segments (polyol) and hard segments (isocyanate), respectively (Figure 8). 6 The thermal stability of the samples was evaluated in initial (T0), 5% (T5%), 10% (T10%), and 50% (T50%) temperatures (Table 2). As it is shown, by increasing the amount of Fe3O4@SiO2@urea NPs (up to 3%), higher thermal stability was reached. It seems that the surface modification of magnetic NPs by SiO2@urea linker can help in better dispersion of the NPs in the foam matrix, less aggregation of NPs, improving the polymerization networking process and delaying the PU thermal degradation process (e.g. T10% in the sample PUR1 has been improved around 39°C (290.9 vs. 252.0°C) compared to the pure PUR0. Interestingly, the T10% of the PUR1 shows a considerable improvement (290.9 vs. 265.8°C) in comparison to the previously reported similar composite using Fe3O4@AEAP NPs as filler. 16
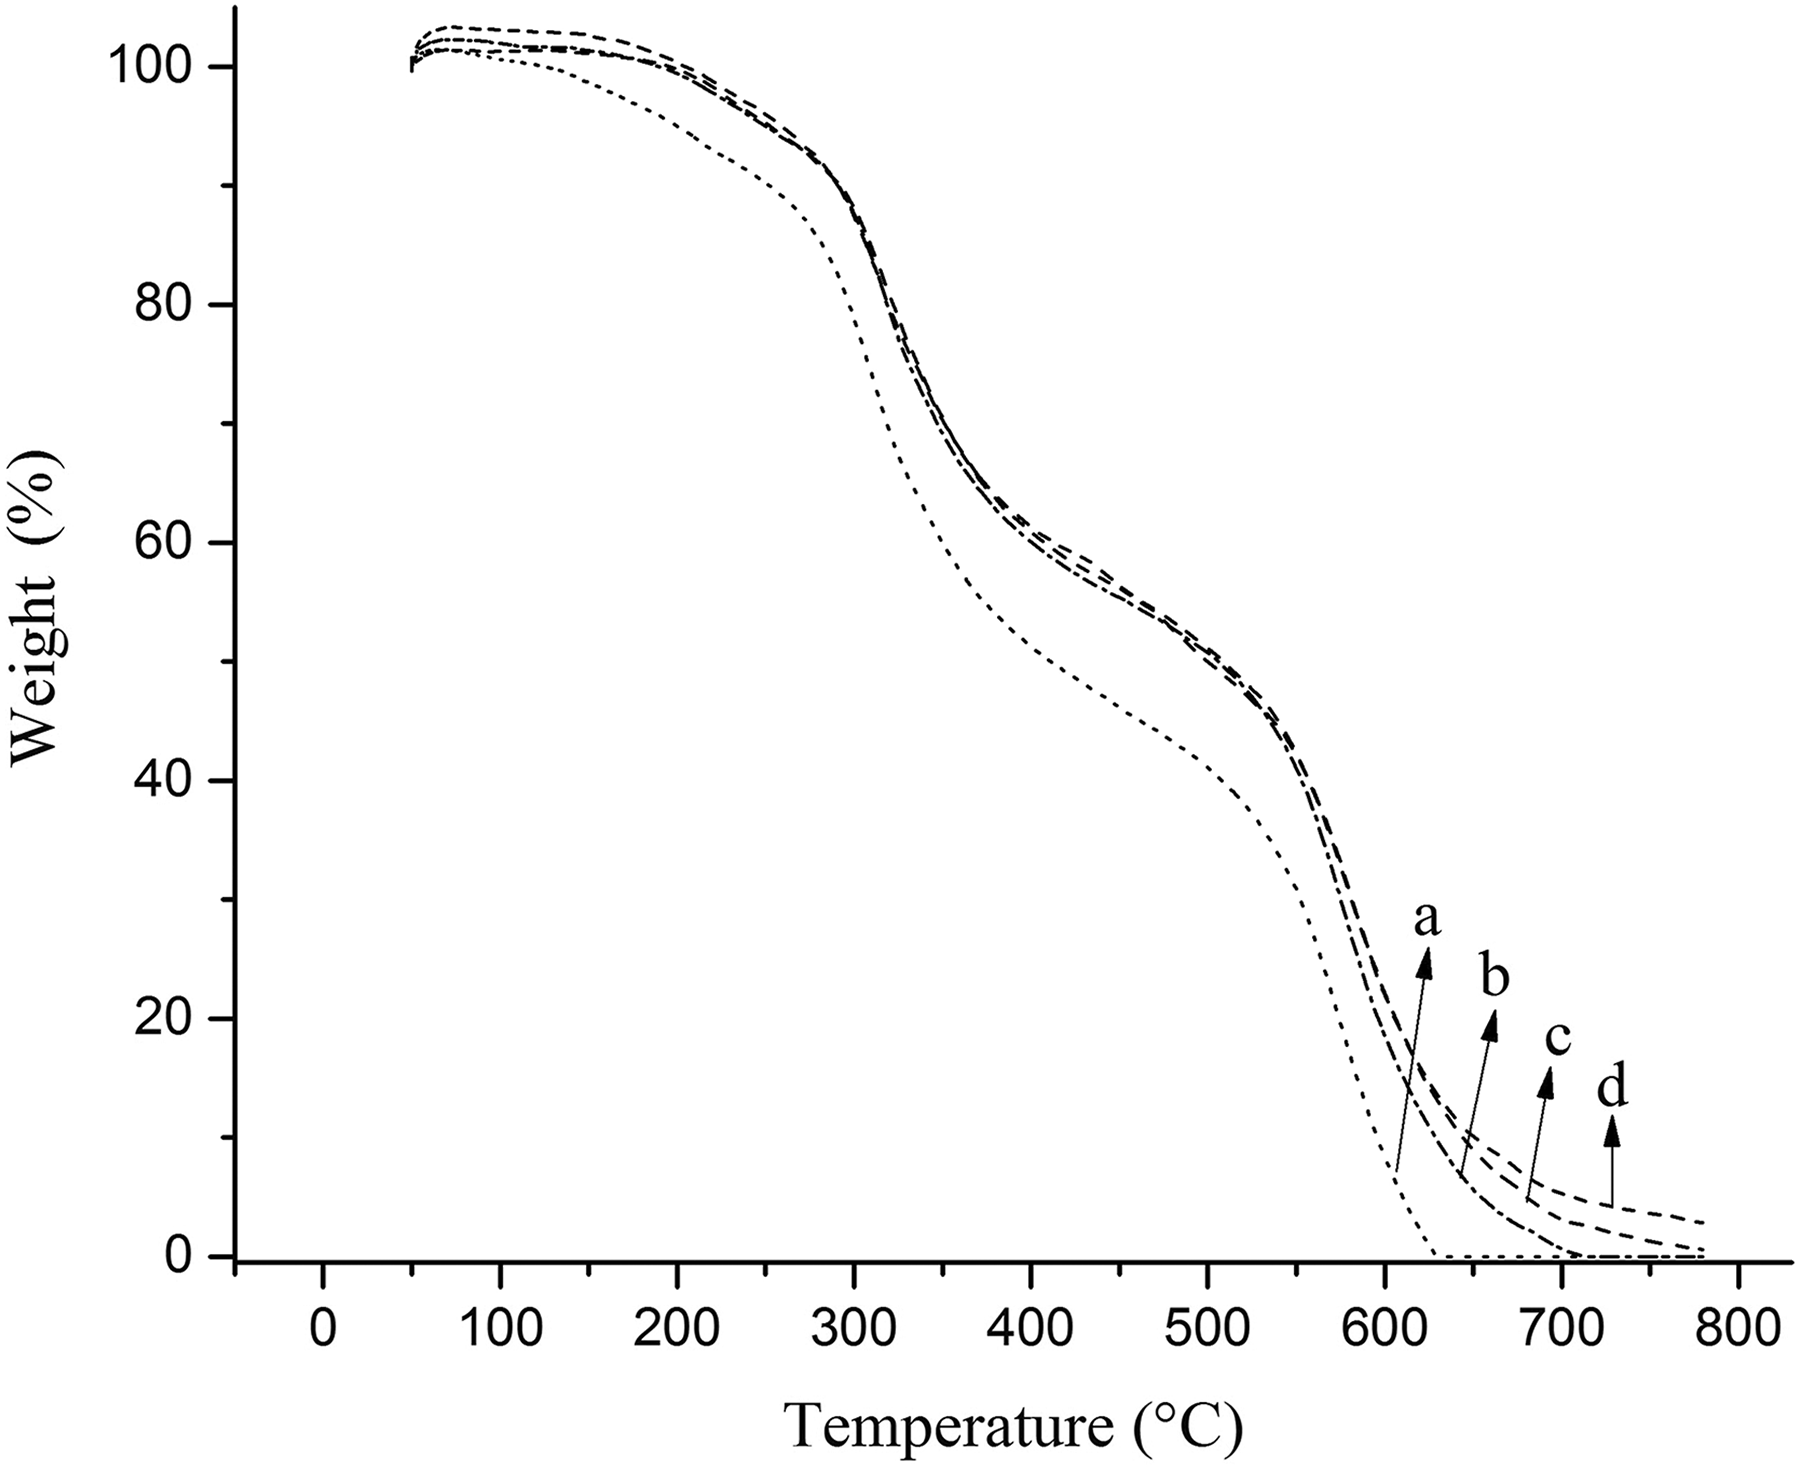
TGA curves of PUR foam nanocomposites with different contents of Fe3O4@SiO2@urea nanoparticles: (a) PUR0, (b) PUR1, (c) PUR2, and (d) PUR3%.
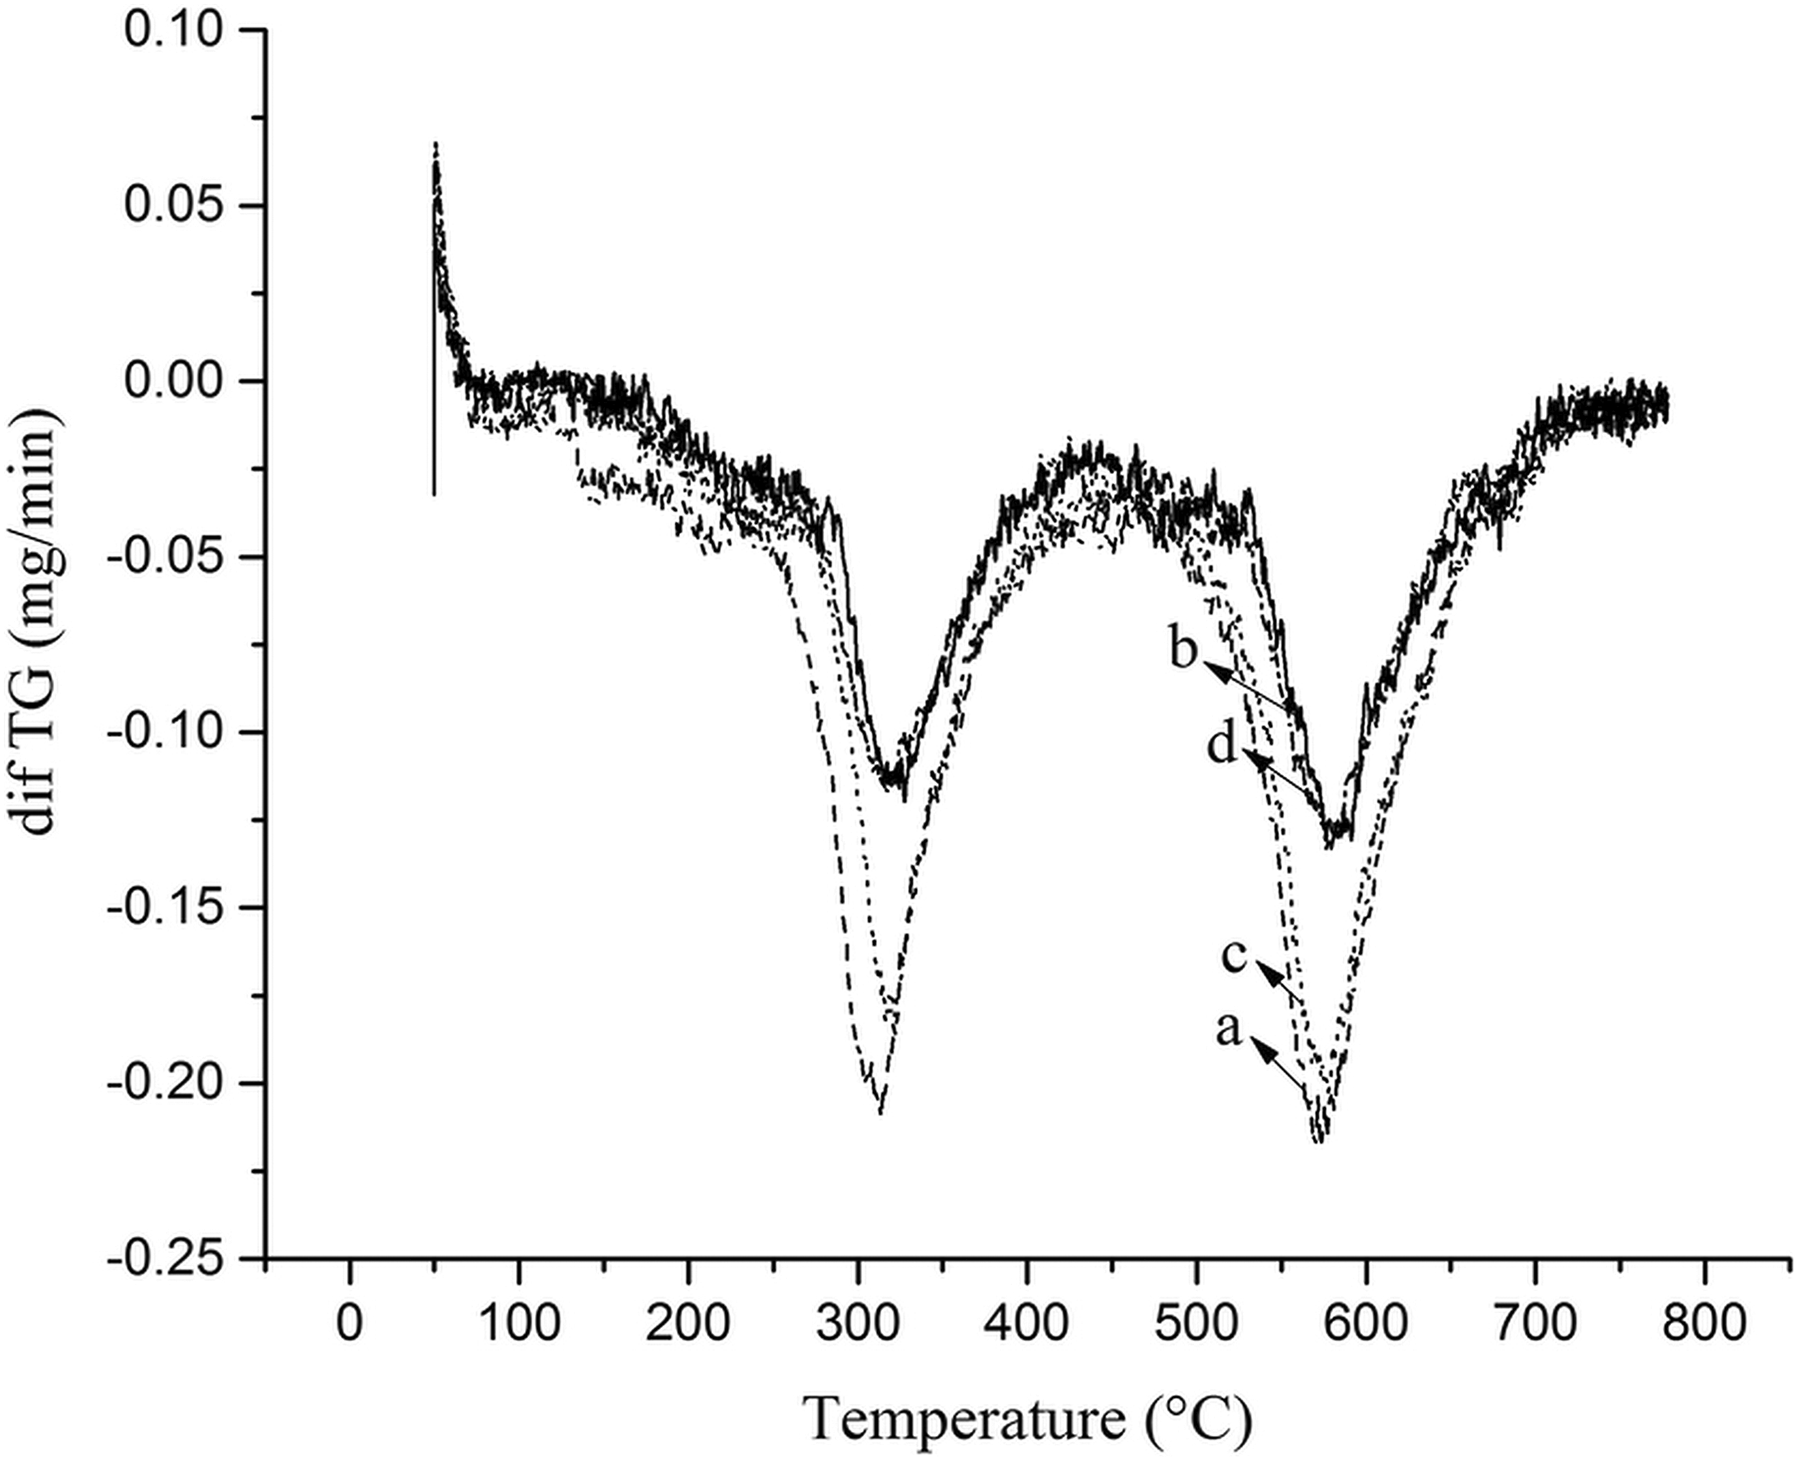
Differential Thermal Gravimetric (DTG) curves of PUR foam nanocomposites with different contents of Fe3O4@SiO2@urea nanoparticles: (a) PUR0, (b) PUR1, (c) PUR2, and (d) PUR3%.
(T0), (T5%), (T10%), (T50%), and char formation (%)
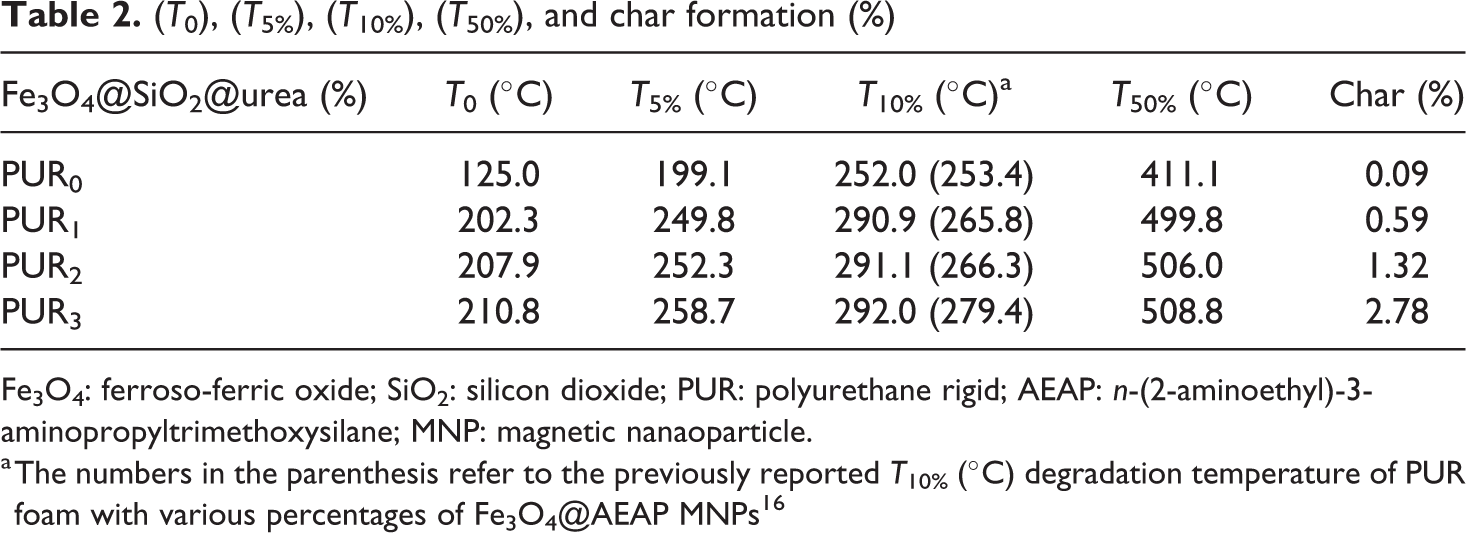
Fe3O4: ferroso-ferric oxide; SiO2: silicon dioxide; PUR: polyurethane rigid; AEAP: n-(2-aminoethyl)-3-aminopropyltrimethoxysilane; MNP: magnetic nanaoparticle.
a The numbers in the parenthesis refer to the previously reported T10% (°C) degradation temperature of PUR foam with various percentages of Fe3O4@AEAP MNPs 16
Morphology
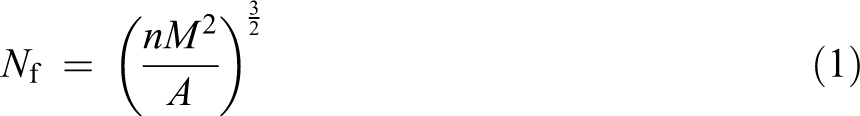
Surface morphological analysis of the nanocomposites was made by SEM and is shown in Figure 9. The cell density (Nf) is calculated using the following equation
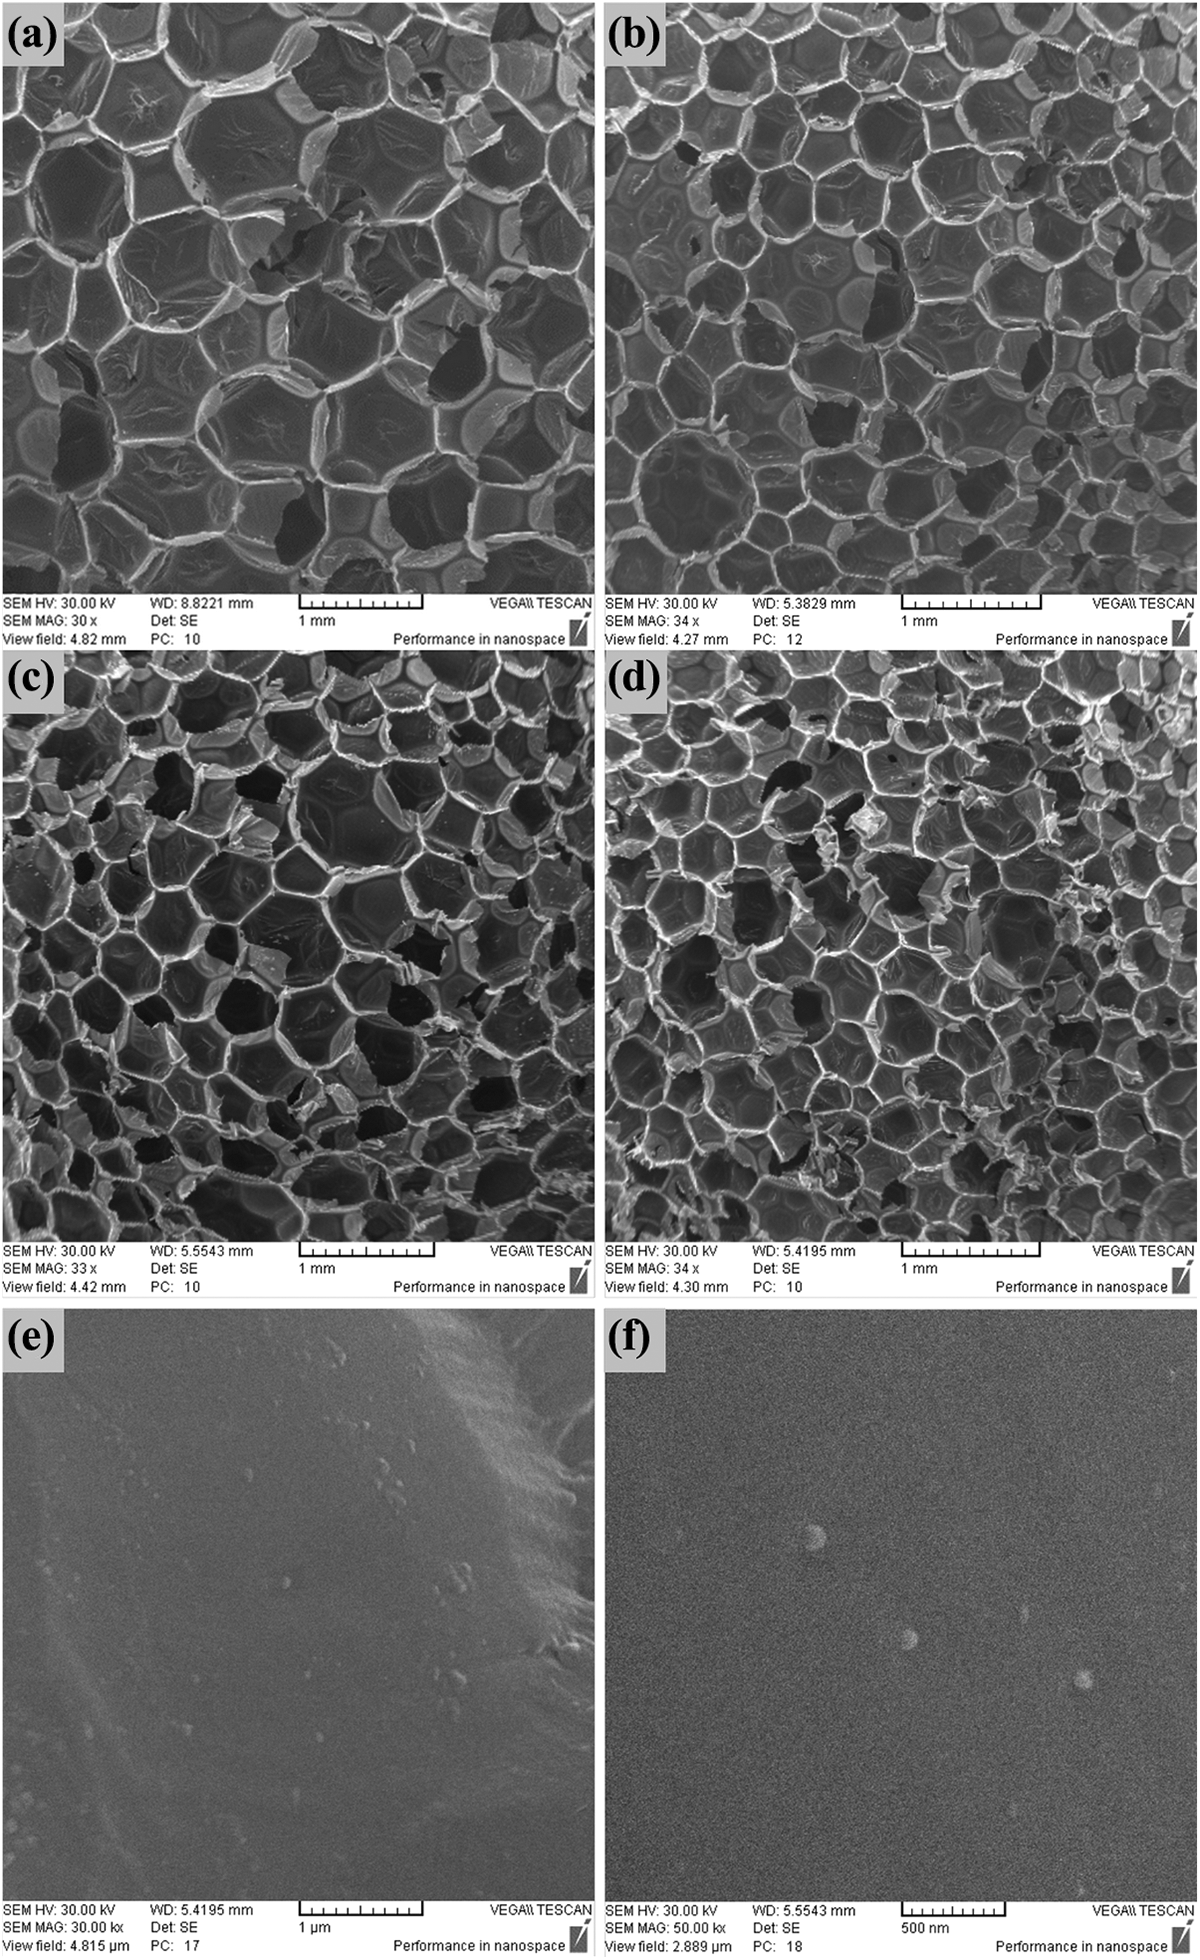
SEM image of magnetic PUR foams with different contents of nanoparticles: (a) PUR0 pure, (b) PUR1 1.0%, (c) PUR2 2.0%, and d) PUR3 3.0% in millimeter scale, (e) and (f) the 3% sample in micrometers and 500-nm scale.
In this formula, Nf is the cell density, n is the number of cells in a specific area of the SEM micrograph, M is the magnification factor of the SEM images, and A (cm2) is the area of the SEM micrograph. 22
As shown in the figure, by increasing the content of the modified MNPs in the polymer matrix from 1% to 3%, the cell density was increased from 1.07 to 3.74. This result indicates that the nature of the dispersion plays a fundamental role in controlling the cell size during foaming. In other words, cell density is controlled by the competitive procedure between the cell nucleation, its growth, and coagulation (Table 3). In addition, modified MNPs act as nucleation sites to aid the bubble nucleation procedure during cell formation and also, to help improve the polymerization networking process. Similar effect of macrostructures on the sound absorption coefficient and sound reduction index has been reported before, for example, in the closed-cell aluminum foams. 23
Cell density of PUR foam.
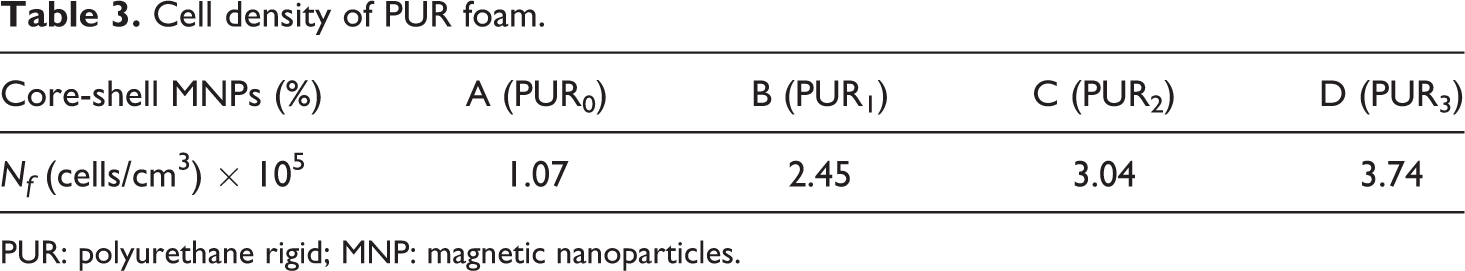
PUR: polyurethane rigid; MNP: magnetic nanoparticles.
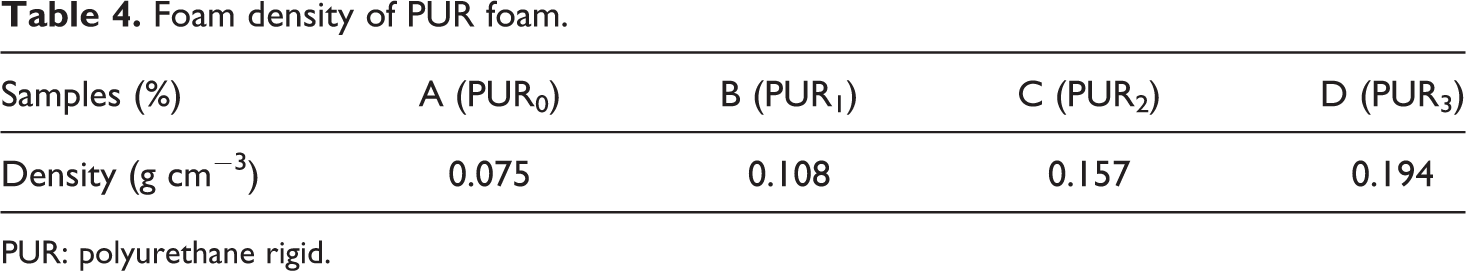
In addition, the foam density (D) is calculated using the following equation
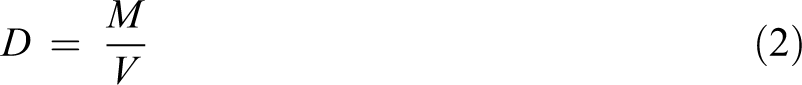
In this equation, M is the mass (g) and V is the volume (cm3) of the foam. As shown in Table 4, by increasing the modified magnetic NPs content, the foam density is increased.
Foam density of PUR foam.
PUR: polyurethane rigid.
Magnetic properties of the composites
The VSM curve of PUR nanocomposite with 3% nanofiller is shown in Figure 10. As shown, the saturation magnetization (Ms) value is 0.31 emu g−1. Additionally, the resultant nanocomposite has shown superparamagnetic behavior at room temperature, because no remanence magnetization is observed and coercivity in the absence of an external field is zero.
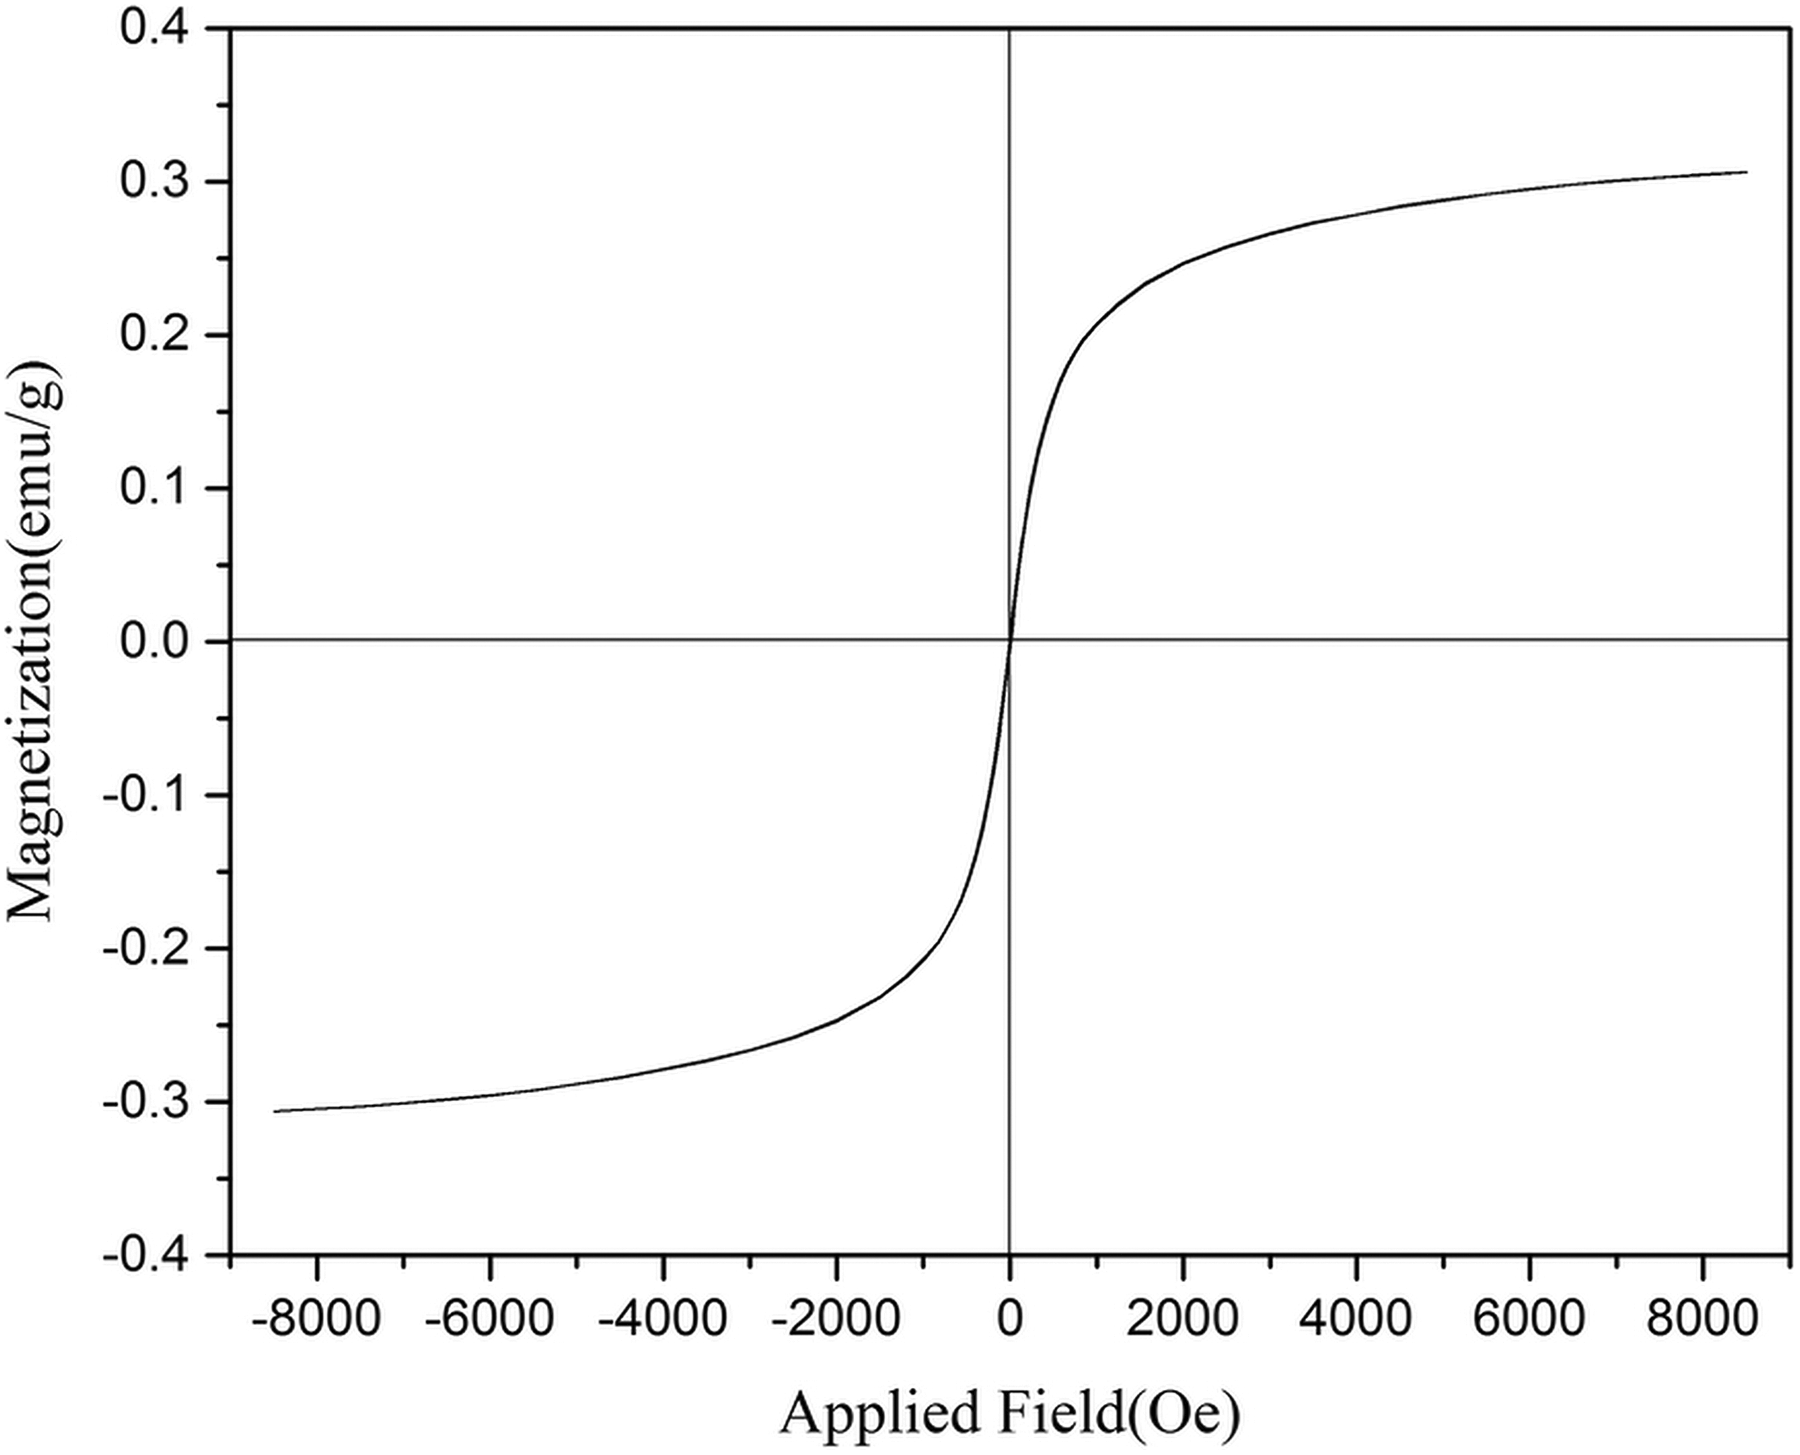
Magnetization hysteresis loop of Fe3O4@SiO2@urea PUR3 foam with 3.0% content of nanoparticle.
Dynamic mechanical analysis
The viscoelastic properties of prepared samples were studied by DMA. DMA is a useful technique to reveal some important parameters of polymer materials (e.g. the glass transition temperature (Tg), the stiffness, and the energy dissipation). 24,25 The measurement of the storage modulus (E′) and the tangent delta (tan δ) allow the determination of the Tg temperature or the softening temperature. Table 5 shows the data obtained from DMA, and Figures 11 and 12 present the curves of the storage modulus and tan δ of the pure PUR foam and modified magnetic nanocomposites (3%). All sample curves can be divided into three stages (glassy plateau, rubbery plateau, and densification (up to 200°C)) under compression mode. 26,27 As it is shown, both samples revealed one thermal transition in the DMA thermograms. This transition is related to Tg of hard segment of PUR foam. 28 It can be seen from the logarithm of storage modulus (log E′) and tan δ curves that the temperature of thermal transitions for modified magnetic nanocomposites is higher than pure PUR (Table 5).
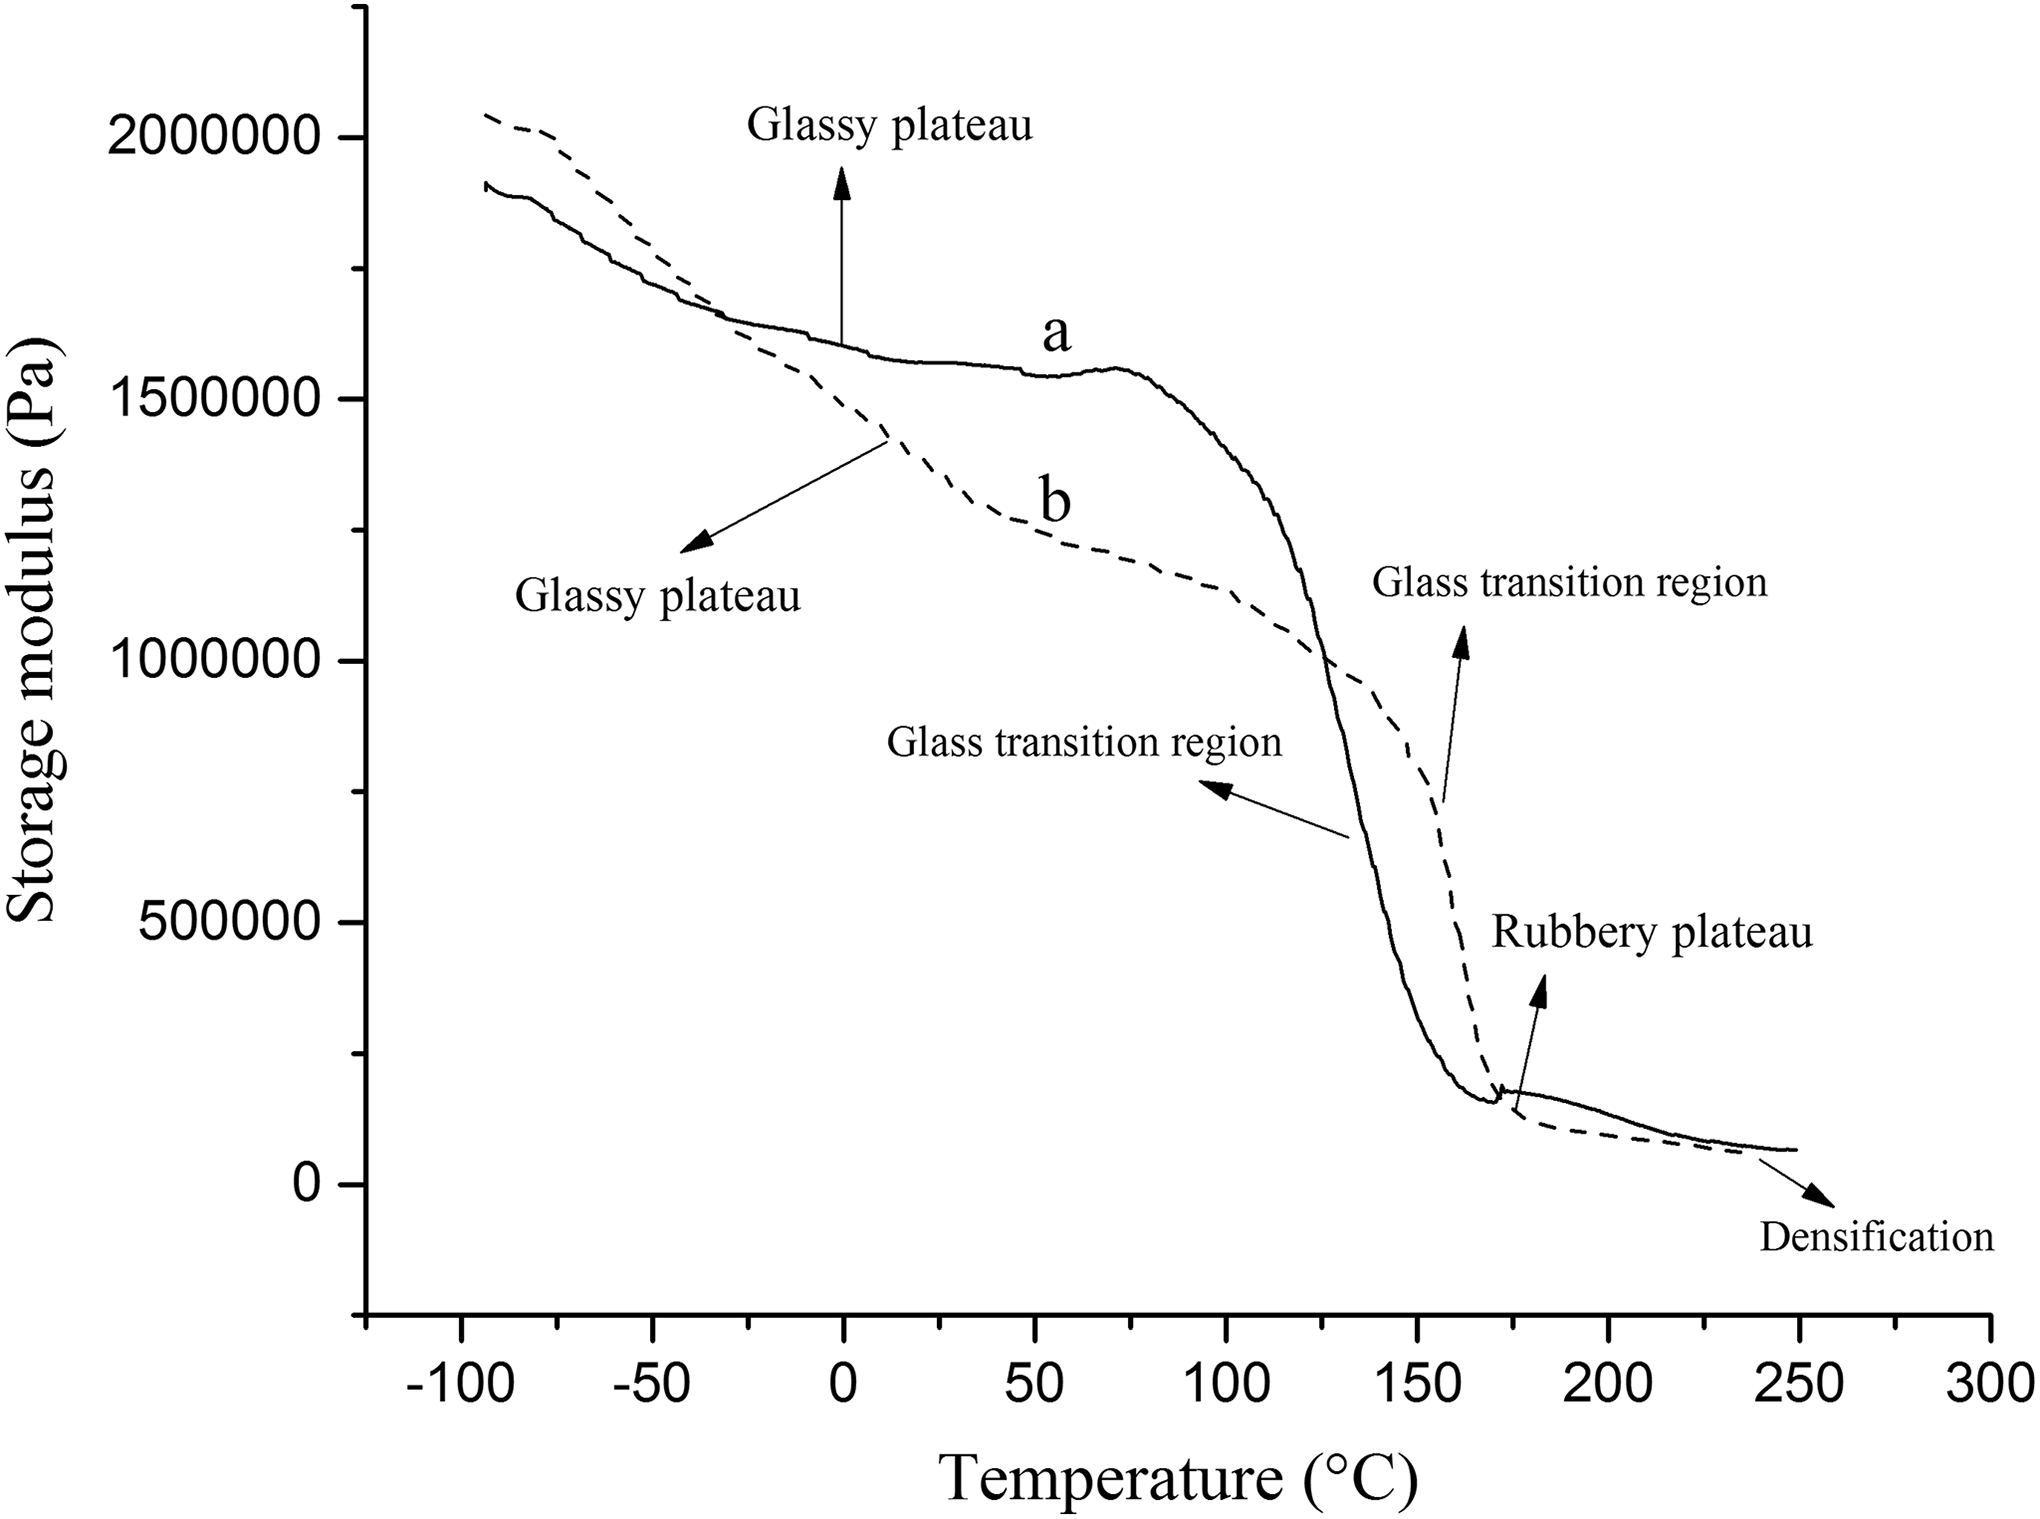
Storage modulus curves of (a) pure PUR foam (PUR0) and (b) 3% Fe3O4@SiO2@urea/PUR nanocomposite (PUR3).
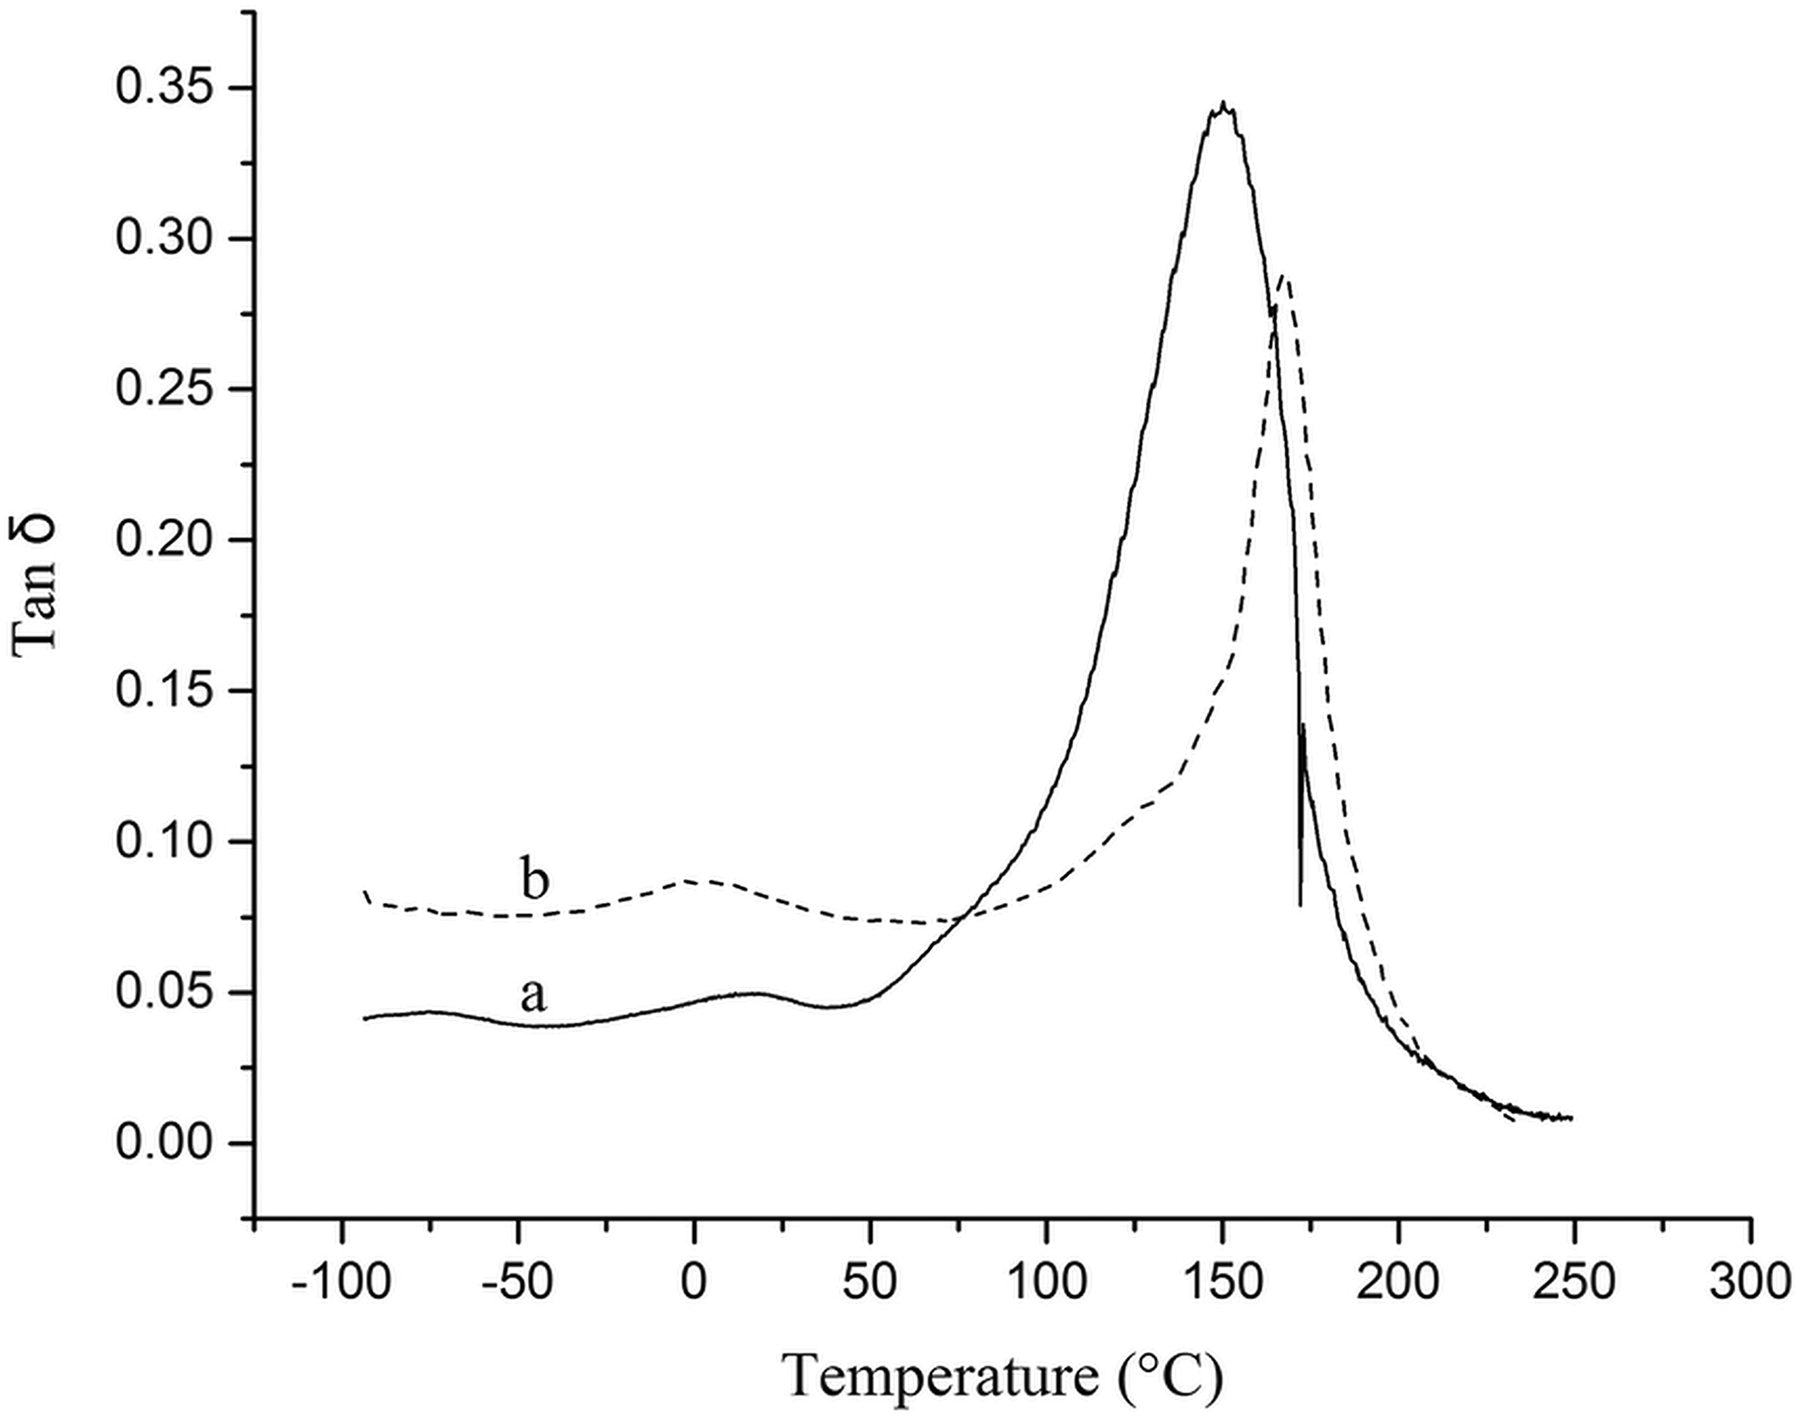
Tan δ curves of (a) pure PUR foam (PUR0) and (b) Fe3O4@SiO2-CPTS-urea/PUR nanocomposites (PUR3-3%).
Tg and storage modulus (E′) values of pure PU (PUR0) and 3% Fe3O4@SiO2@urea/PU nanocomposite (PUR3).
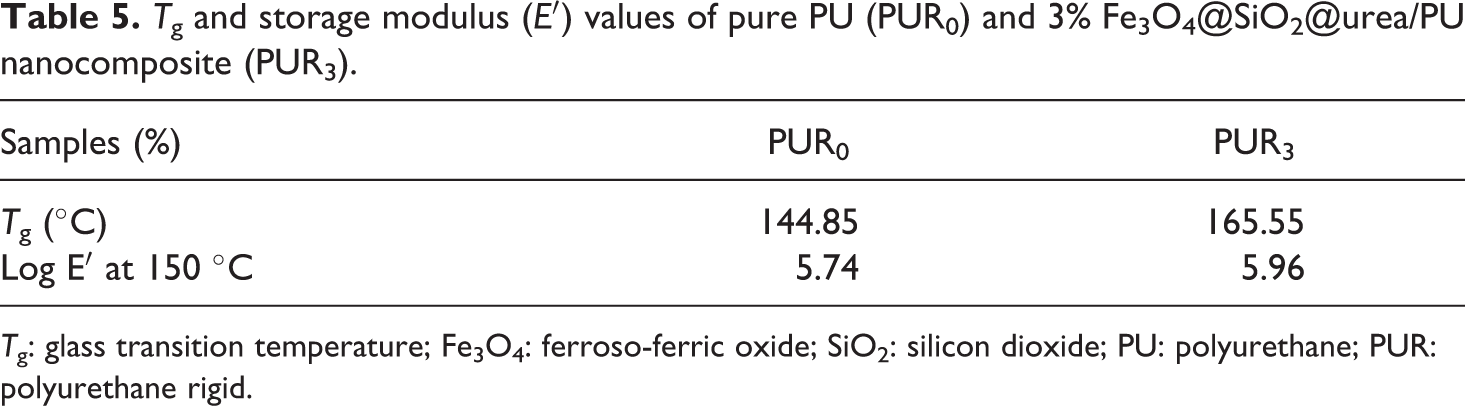
Tg: glass transition temperature; Fe3O4: ferroso-ferric oxide; SiO2: silicon dioxide; PU: polyurethane; PUR: polyurethane rigid.
This observation is due to the reduction of the chain mobility of PU by incorporation of magnetic NPs. Therefore, more temperature is required to increase the chain mobility. In the rubbery part (Figure 11), increasing of the MNPs amount in the PU matrix led to a modulus reduction shift to a higher temperature, which relates to better interaction between Fe3O4@SiO2@urea NP and hard segment of PU. The Tg value of the PUR foam can be defined as the maximum of the tan δ curve. 28,29 It can be seen that incorporation of NPs led to an increase of Tg. As a result, the foam with added modified MNPs (3%) had the higher Tg value.
Sound absorption analysis
Figure 13 shows the sound absorption coefficients of the pure and magnetic rigid foam nanocomposites (1–3%). Acoustic performance of sound absorbing material is valued by the sound absorption coefficient measured by an impedance tube. 30,31 Most of the sounds produced by humans are at low frequencies and a large portion of the structural-born noise occurs at low frequencies, too (around 1000 Hz). Therefore, the test was performed in the frequency range of 200–1300 Hz according to the standard ISO 10534-1.
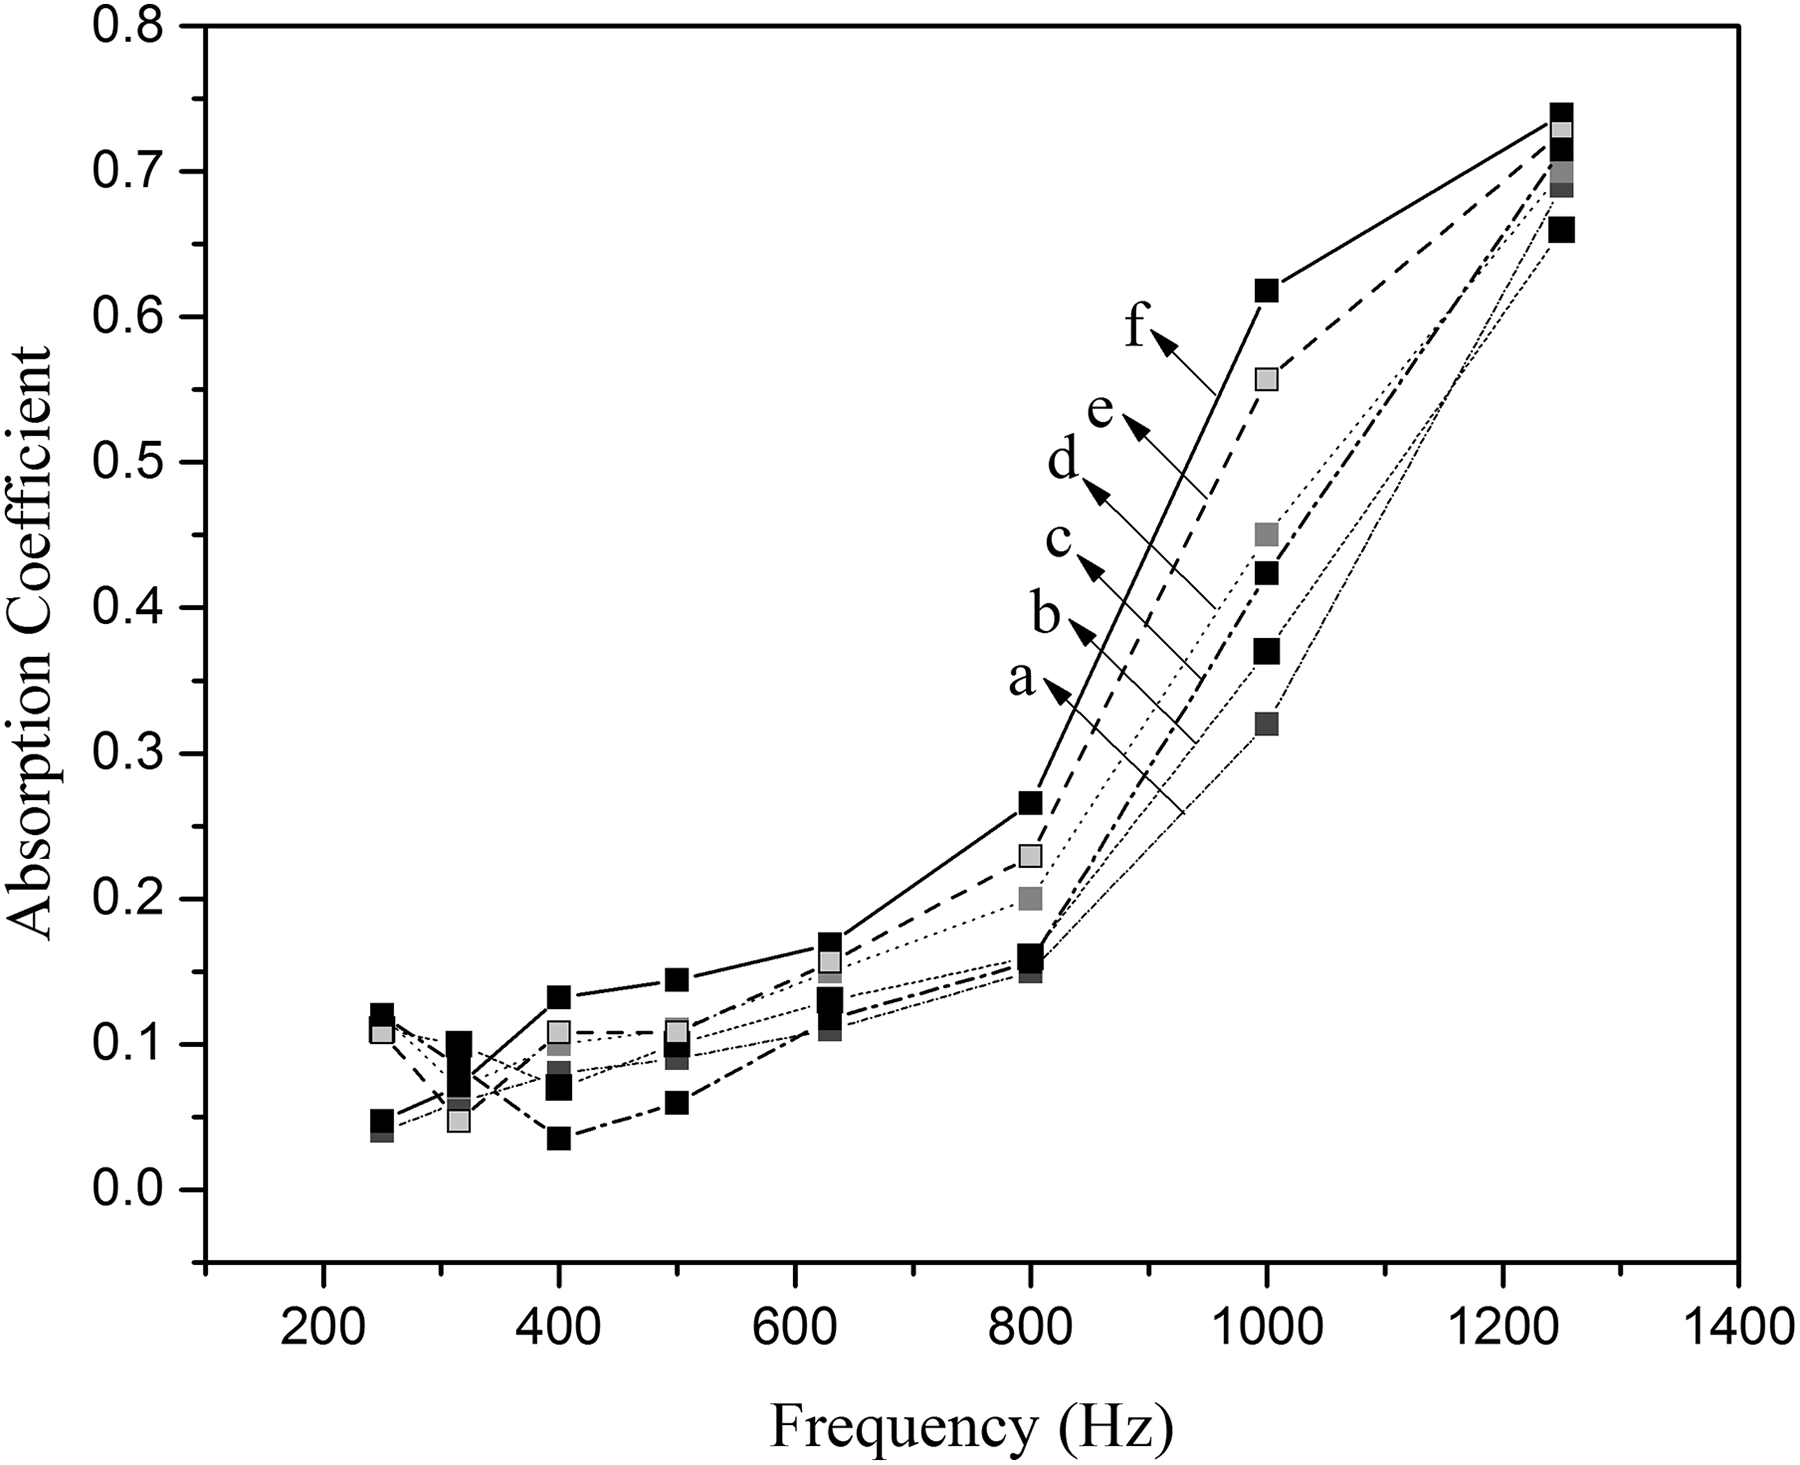
Sound absorption coefficient of pure (a), rigid foam nanocomposites containing 3% Mg(OH)2 NPs (b), 3% Al2O3 NPs (c) and magnetic rigid foam nanocomposites (d) (PUR1-1%), (e) (PUR2-2%), and (f) (PUR3-3.0%).
For better investigation of the effect of modified magnetic NPs on sound absorption, a comparison to two already used NPs in the PU matrix, namely Mg(OH)2-3% and Al2O3-3%, 32,33 has been made. As shown in Figure 13, the absorption coefficients of the magnetic nanocomposites (Figure 13(d) to (f); 1–3 wt%, respectively) show an acceptable improvement compared to those of the pure rigid foam (Figure 13(a)), Mg(OH)2-3 wt% (Figure 13(b)) and Al2O3-3 wt% (Figure 13(c)) composite samples. Surface modification of magnetic NPs by SiO2/urea can help in better interaction of NPs with the foam matrix compared to other NPs (Figure 13(b) and (c)) as fillers. Increasing the number of cells as well as decreasing in cell size are two influencing factors in the improvement of sound absorption behavior. The sound waves will be faced with more cells of smaller sizes on their way and each of them loses a part of its energy as heat. 34 The improvement is at its maximum around 1000 Hz.
Conclusion
Filled PUR foam nanocomposites with different loadings (PUR1-1.0%, PUR2-2.0%, and PUR3-3.0%) of Fe3O4@SiO2@urea NPs were prepared by in situ polymerization method. SEM, VSM, and DMA analyses indicated the significant effects of the MNPs@SiO2@urea on the thermal, mechanical, and morphological behaviors of the PUR nanocomposites. The sample PUR3-3% indicated the highest saturation magnetization (Ms) and Tg values.
Increase in NPs content (1.0–3.0%) affected the cellular structure of foam as studied from SEM images. Decrease of cell size and increase of cell density led to the increase of sound absorption coefficient, and an improvement of the acoustic damping of the PUR foam compared to already used other NPs ((Mg(OH)2-3% and Al2O3-3%).
Footnotes
Acknowledgements
The authors would like to thank the Iran University of Science and Technology (IUST) for the financial support.
Funding
The author(s) disclosed receipt of the following financial support for the research, authorship, and/or publication of this article: This work was financially supported by the Iran University of Science and Technology (IUST).