
Abstract
Pumice stone (P), which is as a cheap material, can be a good candidate for filling material for polymers because of its high thermal resistance. Its effect on properties of polypropylene (PP) has not been studied in detail up to now. The mechanical, viscoelastic, thermal, morphological, crystallographic, and thermomechanical behaviors of PP filled with P powder were studied. The composites were produced by adding different weight fractions of P powder (0–40 wt%) into PP using a high-speed thermo kinetic mixer and compression molding. The highest tensile and flexural strength values, 26.5 and 46.4 MPa, respectively, were obtained when 10 wt% of P powder was filled into PP. Besides, the storage and loss modulus of PP was increased with the addition of P powder. The onset decomposition temperature of PP increased by 39°C with P powder loading into PP. The addition of P powder into PP led to a significant increase on the crystallinity of PP. It is interesting to report that thermal conductivity of PP was increased with increasing weight fraction of P powder.
Keywords
Introduction
Pumice, which mainly consists of silicon dioxide (SiO2), is known as natural volcanic glassy rock. 1 Pumice forms by sudden cooling of the magma and the depressurization of gases inside. 2 Pumice has a porous structure and its porous structure is formed by dissolved gases precipitated during the cooling as the lava hurtles through air. 1 Pumice is utilized as a chemical additive; a dental polisher; and an abrasive in cosmetic, cement, and ceramic industries. 2 Since it has a porous structure, it has low density, large surface area, and high thermal insulation properties. 1,3,4 Pumice is typically used to make a lightweight insulating concrete or cinder block of low density. 5 Majority of its usage is a lightweight building material in construction industry. 2 Pumice powder is cheaper than most of traditional particle fillers. The use of pumice powders as a reinforcing material in composites has not been studied in detail in the literature. 1 Nowadays, there is an increasing trend on using of pumice powder as a filler material in composite applications. Sahin et al. studied the mechanical and the thermal properties of pumice powder–filled polyphenylene sulphide composites. 1,6 It was obtained that mechanical and thermal properties of composites were improved using pumice powder reinforcement. Besides, it was claimed that pumice powders can be utilized in place of traditional particle filler. Ramesan et al. investigated the thermal, electrical, and mechanical properties of poly(vinyl alcohol)/poly(vinyl pyrrolidone)/pumice composites. 7 Electrorheological properties of polyaniline/pumice composites were studied by Yavuz. 8 Polymer blend composite based on poly(vinyl alcohol)/cashew tree gum with various content of pumice particles was prepared and characterized by Ramesan et al. 9 The combination of multiaxial basalt fabric and pumice stone (P) was utilized as a reinforcement material for the production of the polypropylene (PP)-based composite structures. 10 Tensile properties such as tensile strength, tensile modulus, and elongation at break values of composites were investigated by Ovali Sabih. 10
PP is among the most used polymers, being employed in numerous applications. 11 Fillers are utilized along with different commodities as well as engineering polymers to make the properties better and decrease the cost of the material. Loading inorganic mineral fillers into polymer improves the physical properties of the materials such as mechanical strength, modulus, density, and so on. 12 To the best of our knowledge, there is no detailed research concerning the utilizing of pumice powder, as a cheap filler material, in PP matrix. Especially, a study does not exist addressing the question of how pumice powder affects thermal properties, such as coefficient of thermal expansion (CTE), thermal conductivity, and thermal stability, of PP. Moreover, it is known that P has a high-temperature resistance and chemical resistance. The reason of using P powder as a filler material for PP is mainly to improve the thermal resistance of PP. Besides, it is expected that the cost of the final product would be lower. A detailed investigation should be done to examine the effect of pumice powder on the properties of PP-based composite. In this study, the effect of P powder on mechanical, viscoelastic, thermal conductivity, morphological, crystallographic, and thermomechanical properties of PP was also investigated.
Material and methods
Materials
PP (PETOPLEN MH 418, Petkim-SOCAR–Turkey) with a melt flow index of 5 g/10 min (230°C, 2.16 kg) was used as a matrix material. P particles, which were originated from middle Anatolia of Turkey, were passed through a 100 mesh sieve and dried at 70°C for 48 h to remove moisture. Particle size distribution of P was made using Malvern Mastersizer Hydro. The values of d50 and d90 were obtained to be 111 and 617 µm, respectively. Chemical composition of P is as follows: SiO2: 74.10%, aluminium oxide: 13.45%, potassium oxide: 4.10%, and sodium oxide: 3.70%.
Manufacturing of composite materials
Laboratory-type high-speed thermo kinetic mixer was used to manufacture P-filled PP composites at different weight fractions of 10, 20, 30, and 40% P (PP-10P, PP-20P, PP-30P, and PP-40P, respectively). P and PP mixtures were processed in a high-speed thermo kinetic mixer at 2000 r min−1. Hydraulic hot and cold press was used to mold the composite plates at 170°C for 3.5 min between 40–120 bar. Then, composite plates were kept at 20°C for 2 min at 120 bar pressure in cold press.
FTIR analysis
Fourier transform infrared (FTIR) analysis of P-filled PP composites was recorded using a Perkin Elmer Spectrum BX FTIR system in the range of 4000–400 cm−1 with a resolution of 4 cm−1.
XRD analysis
X-ray diffraction (XRD) analysis was used to characterize the crystalline structure of PP and P-filled PP composites. XRD patterns were collected using a Panalytical Empyrean diffractometer (UK) with copper K α radiation (λ = 1.54 Å). The angular range (2θ) was scanned from 10° to 60° at a step size of 0.02°, at working voltage and current of 45 kV and 40 mA, respectively.
Thermogravimetric analysis
Thermogravimetric analysis (TGA) was used to investigate the thermal decomposition behavior of the composites with a simultaneous thermal analyzer (STA 8000, Perkin Elmer). TGA was performed at a heating rate of 10°C min−1 from 30°C to 600°C under nitrogen atmosphere with a flow rate of 20 mL min−1.
DSC analysis
Differential scanning calorimetry (DSC) analysis (DSC Q2000; TA Instruments Inc., USA) was performed to investigate the crystallization and the melting behaviors of PP and P-filled PP composites. Samples were heated from 20°C to 200°C at a rate of 10°C min−1 under nitrogen atmosphere and were kept at this temperature for 5 min to completely erase any thermal history during processing. After that, samples were cooled down to room temperature at a rate of 10°C min−1 under nitrogen atmosphere.
Dynamic mechanical analysis
Dynamic mechanical analyzer (DMA Q800; TA Instruments Inc.) was employed for the evaluation of storage and loss modulus values of PP and P-filled PP composites. The experiment was performed using a single cantilever clamp under multifrequency-strain mode. The specimen dimension was 35 × 10 × 3 mm and the testing temperature ranged from 30°C to 140°C in air environment at a heating rate of 3°C min−1.
Thermomechanical analysis
Thermomechanical analysis (TMA) of the samples was made using a thermomechanical analyzer (TMA 400; TA Instruments Inc.), with expansion mode. Specimens in dimension of 10 × 5 × 3 mm were heated from −50°C to 120°C at a heating rate of 5°C min−1 under a load of 0.05 N.
Thermal conductivity
Thermal conductivities of PP and P-filled PP composites (2 mm in thickness) were measured with C-Therm TCi thermal conductivity analyzer (Canada) operated at the room temperature under air atmosphere. The testing values were averaged for the given specimen.
Mechanical analysis
Tensile test
Tensile tests were carried out on a Shimadzu Autograph AG-IS Series (UK) universal testing machine with 5 kN load cell capacity at the room temperature. The conditions were defined by the ASTM D 638 standard. The test specimens were loaded in tension at a constant rate of 50 mm min−1.
Three-point bending test
The flexural properties were measured with a Shimadzu Autograph AG-IS Series (Japan) universal testing machine in accordance with ASTM D 790-86. For three-point bending tests, the length of support span was adjusted to 32 mm. The crosshead speed of 1 mm min−1 was used, and the average value of at least three specimens was recorded for each specimen.
SEM analysis
The surface morphologies of P-filled PP composites were investigated using scanning electron microscopy (SEM; Carl Zeiss 300 VP, Germany) at an accelerating voltage of 3 kV. Before SEM analysis, the samples were coated with a thin layer of gold using Quorum Q150 RES sputter coating system.
Results and discussions
FTIR analysis
Figure 1 shows the FTIR spectra of P, PP, and P-filled PP composites. As can be seen from spectrum of P powder, a broad band at about 3400 cm−1 was observed due to the OH stretching vibrations of the adsorbed water (moisture). It is known that the water adsorbed shows a deformation vibration peak around 1650 cm−1. 13 The strong peak at around 1000 cm−1 may be due to Si–O stretching vibration of P. These peaks are also seen in the spectra of P-filled PP composites, especially at high weight fraction of P powder. The peak at about 1020 cm−1 may be attributed to Si–O group of silica present in P powder. This peak is not clearly visible in the spectrum of PP-10P because of the low amount of P powder. However, along with increasing P powder within the composite, the peak at about 1020 cm−1 becomes more apparent. PP-40P has the largest intensity, which confirms the highest percentage of P powder in composites. Broad bands at about 3400 and 1600 cm−1 in the spectrum of PP-40P may be assigned to OH stretching vibrations of the adsorbed water present in the P powder. 13 –15
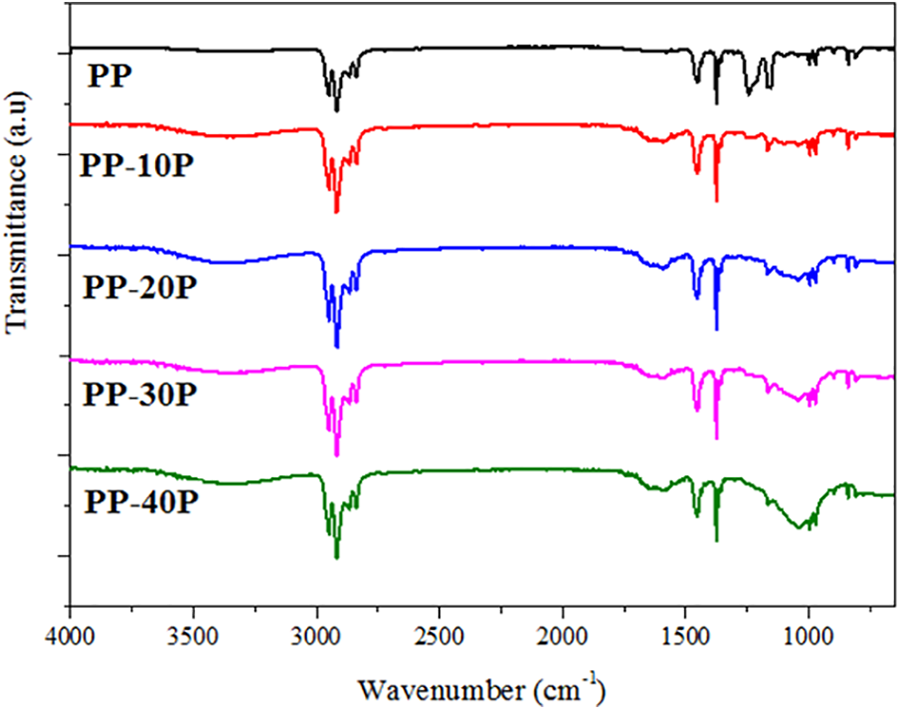
FTIR spectra of P, PP, and its composites. P: pumice stone; FTIR: Fourier transform infrared; PP: polypropylene.
XRD analysis
XRD measurements were carried out in order to find out whether P powder influences the exact crystal structure of PP. Figure 2 shows the XRD patterns of PP and its composites. From Figure 2, one can see that PP exhibits the characteristic diffraction peaks of α-phase at 2θ = 14.1, 16.8, 18.5, 21.1, and 21.8°, attributing to the reflections of (110), (040), (130), (111), and (131) crystal planes of PP, respectively. 16 Besides, the characteristic peaks at 2θ = 16.1 and 21.8° correspond to the planes (300) and (301) of β-phase, respectively. According to Figure 2, the intense diffraction peaks of the PP belong to the typical monoclinic α form. It is well known that the α-phase is a dominant crystalline structure for PP. 17,18 β-phase is usually formed when specific nucleating agents are added or through special processes. As can be seen from Figure 2, the addition of P influences the intensity of the characteristic peaks of β-phase of PP. It can be observed that the intensity of the (300) plane (β-phase) was increased with the addition of 10 wt% of P into PP. Therefore, P powder particles may act as β-PP inducing nucleating agents. However, the lower β-phase values were obtained in PP-20P, PP-30P, and PP-40P composites. This may be probably related to the decreased nucleating agent effects of P as weight fraction of P is increased or modified crystallization kinetics of PP. 17 On the other hand, the peaks corresponding to the α-phase remained constant in P-filled PP composites. When 40 wt% of P was loaded into PP, some XRD peaks of PP cannot be seen because of the large amounts of P. This result is compatible with FTIR spectrum of PP-40P in which the presence of P is apparent within the composite.
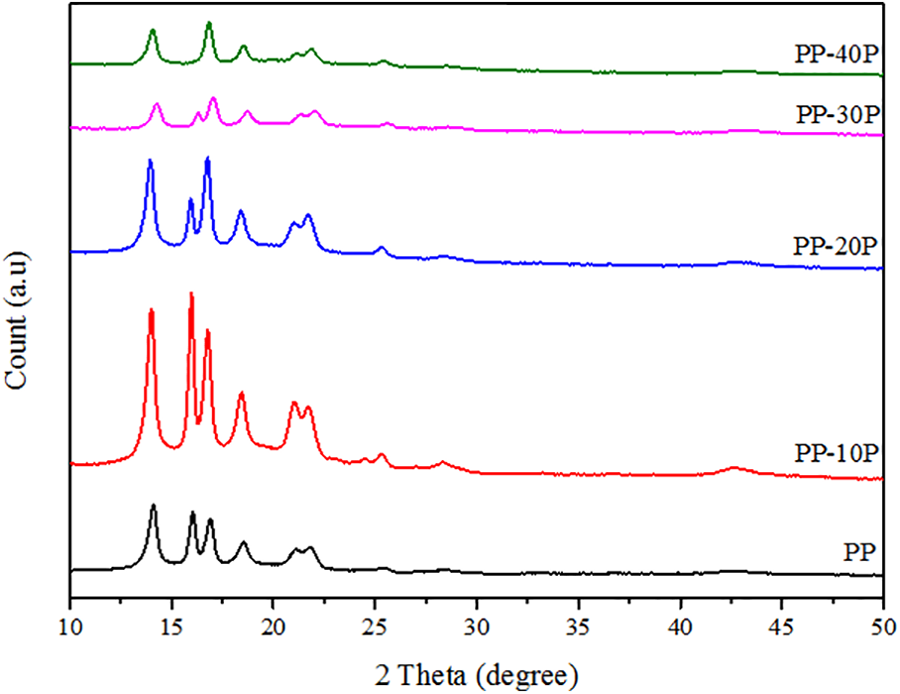
XRD patterns of PP and its composites. XRD: X-ray diffraction; PP: polypropylene.
Thermogravimetric analysis
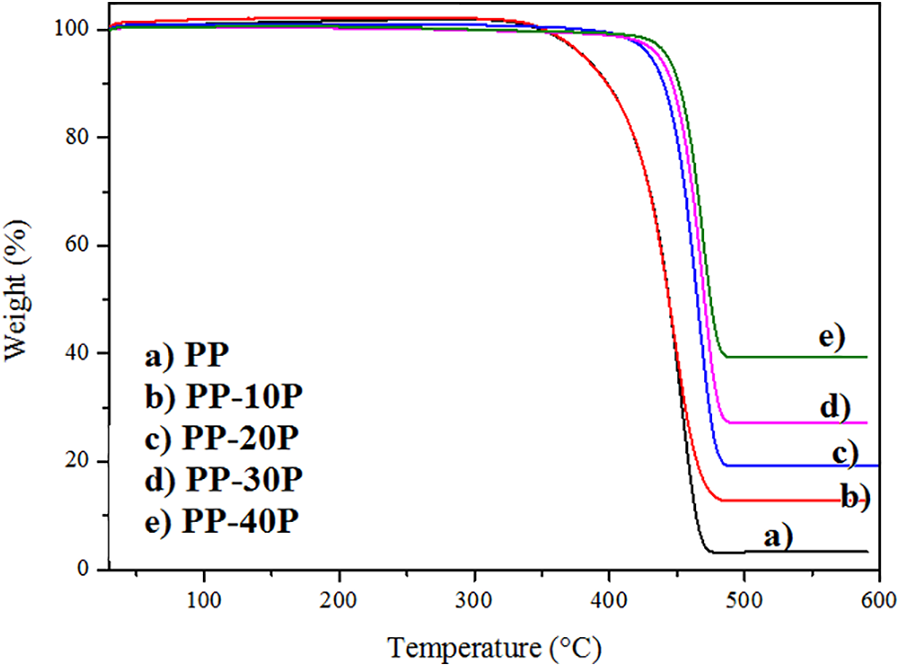
TGA was performed on P-filled PP composites as well as PP samples. Figure 3 shows the TGA curves of the PP and its composites. Onset decomposition temperature, maximum decomposition temperature, and degraded weight of PP and its composites are also presented in Table 1. PP and its composites exhibited only one-step decomposition process. As can be seen, onset decompositions of PP, PP-10P, PP-20P, PP-30P, and PP-40P are obtained to be 412°C, 413°C, 444°C, 450°C, and 451°C, respectively. It was shown that the onset decomposition temperature of PP increased considerably by adding P into PP. With the addition of 40 wt% of P into PP, onset decomposition temperature of PP increased by about 40°C. Addition of P into PP also increased the maximum decomposition temperature of PP. As shown in Table 1, composites have higher thermal stability than PP. When 40 wt% of P was added into PP, maximum thermal stability was achieved with a maximum decomposition temperature of 470°C.
TGA curves of PP and its composites. TGA: thermogravimetric analysis; PP: polypropylene.
TGA data of PP and P-filled PP composites.
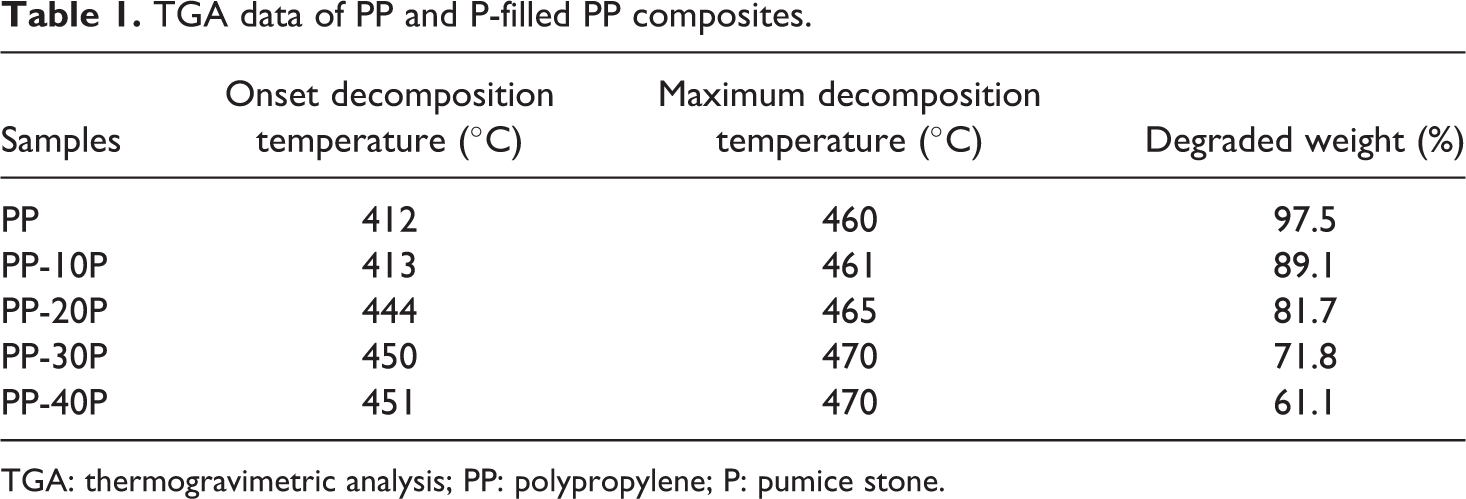
TGA: thermogravimetric analysis; PP: polypropylene; P: pumice stone.
The degraded weight values were obtained to be 97.5, 89.1, 81.7, 71.8, and 61.1% for PP, PP-10P, PP-20P, PP-30P, and PP-40P, respectively. It can be seen that degraded weight values of PP decreased with the increasing weight fraction of P.
DSC analysis
DSC curves of PP and P-filled PP composites are shown in Figure 4. From the DSC analysis, several crucial parameters could be estimated, such as crystallization temperature (T
c), melting temperature (T
m), melting enthalpy (
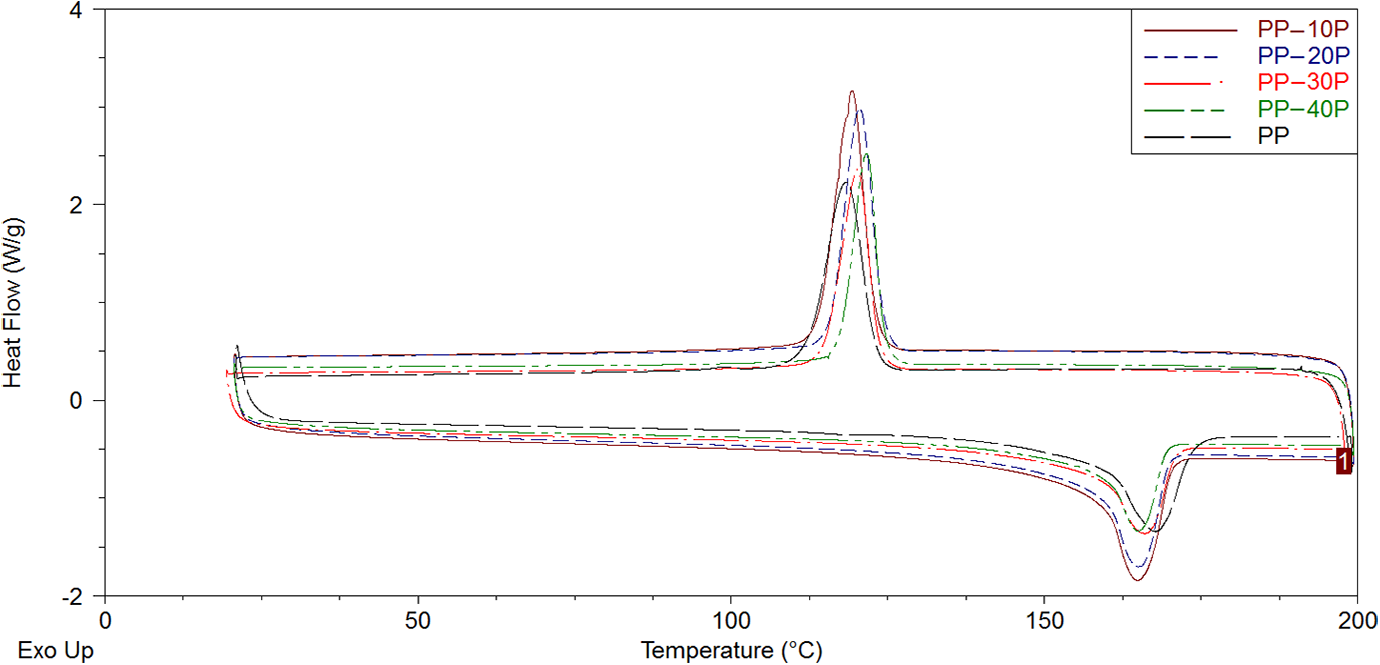
DSC curves of PP and its composites. DSC: differential scanning calorimetry; PP: polypropylene.
DSC data of PP and P-filled PP composites.
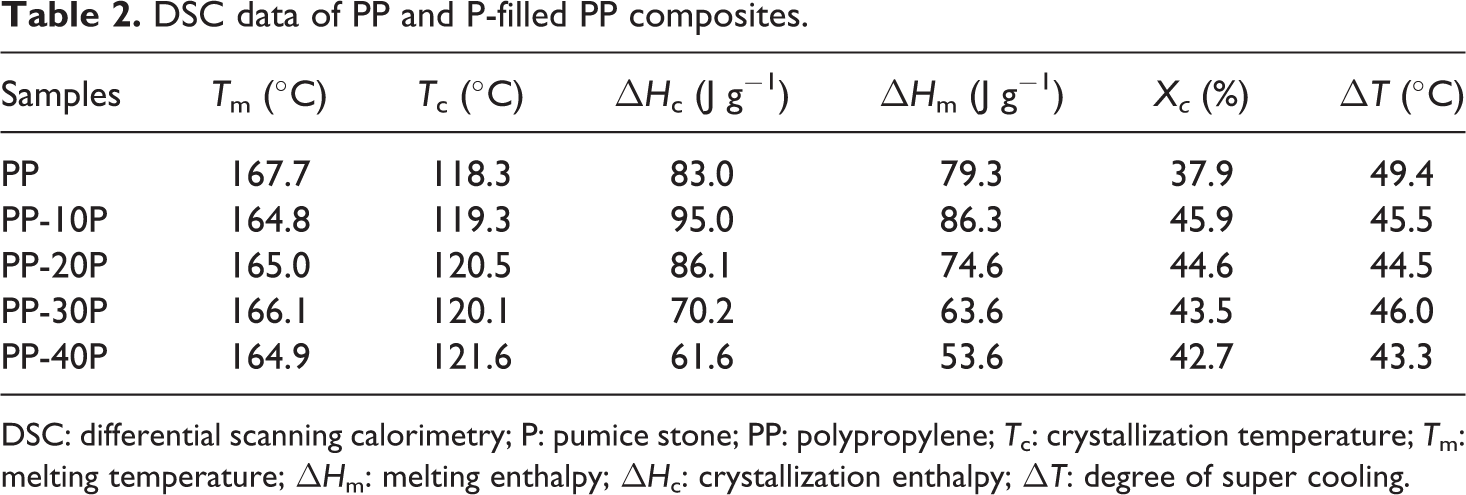
DSC: differential scanning calorimetry; P: pumice stone; PP: polypropylene; T
c: crystallization temperature; T
m: melting temperature;
T
c values of the P-filled PP composites are higher than that of PP. T
c of PP is 118.3°C, and the addition of 40 wt% of P into PP increased T
c to 121.6°C. As can be seen from Table 1, T
m decreased with the incorporation of P into PP. From Table 2, it can be seen that 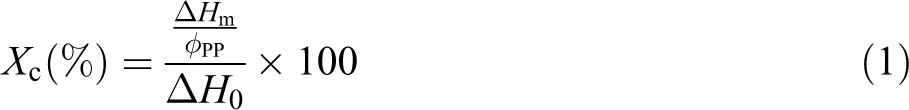
where ϕPP is weight fractions of PP in the composites and ▵H 0 is the melting enthalpy of 100% crystalline PP (209 J g−1). 19 The observed crystallization behavior shows that the addition of P into PP causes a significant increase on the crystallinity of PP. It can be attributed to the nucleating effect of P by increasing the rate of nucleation and mobility of the PP chains.
DMA analysis
Figure 5(a) shows the variation of storage modulus values of PP and its composites. It can be clearly observed that the storage modulus of PP is increased with the loading of P. As shown in Figure 5(a), the values of storage modulus of PP-10P, PP-20P, PP-30P, and PP-40P are larger than those of PP and gradually increase with increasing P content at the whole temperature range.
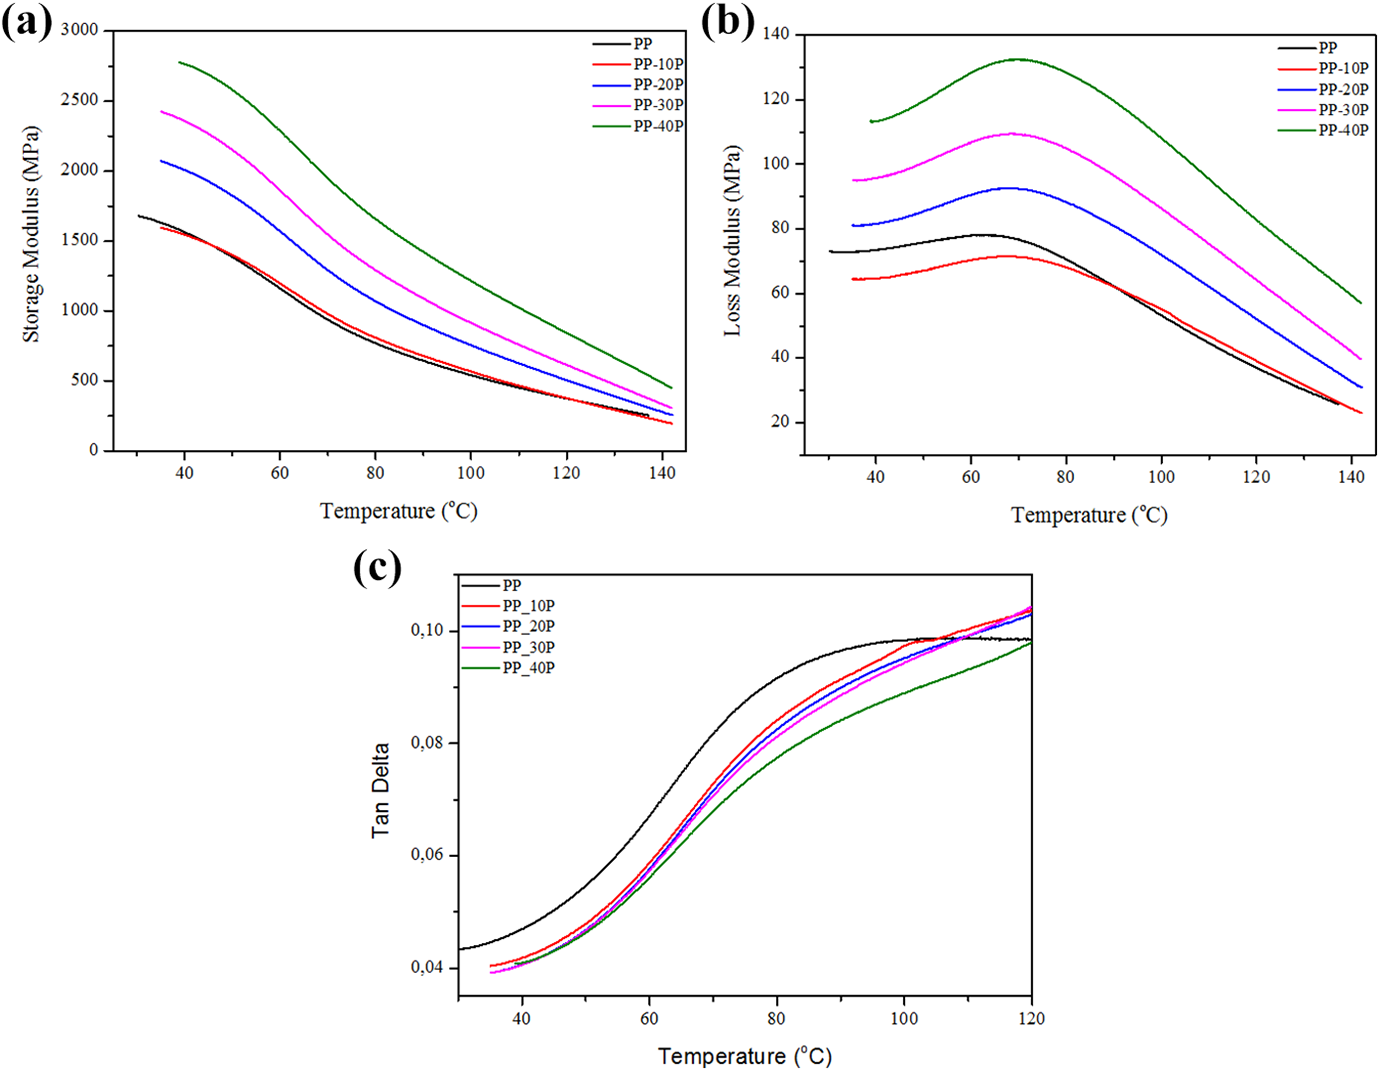
(a) Storage modulus, (b) loss modulus, and (c) tan δ values of PP and its composites. PP: polypropylene.
This is due to the fact that fillers at the high concentrations reduce the mobility and deformability of the polymer matrix. Therefore, stiffness of PP increases owing to the mechanical restrictions on molecular motions in the matrix imposed by the P particles. From Figure 5(a), a decreasing trend is seen in the storage modulus for PP and its composites with increasing temperature. This may be ascribed to that as the temperature increases, the mobility of the side chains of polymer becomes easier. 20 The variation of loss modulus values of PP and its composites as a function of temperature is shown in Figure 5(b). Increases in loss modulus values of P-filled PP composites were observed, when compared to that of PP at the whole temperature range. A broadening in the loss modulus curve was observed when the P content is increased to 40 wt%.
The damping factor, tan δ, which is the ratio of loss modulus to storage modulus, can be related to impact resistance of a polymeric material. Tan δ term can be used to define interfacial properties between filler and polymer matrix. When stress is applied to particle-filled polymeric material, energy dissipation takes place in the polymeric matrix and filler–matrix interface. 21 Relatively stronger interface can be characterized by less energy dissipation and corresponding lower intensity of tan δ peak. In other words, lower the damping at the interfaces, the greater the interfacial adhesion. 22 The effect of temperature on the tan δ value of the composites at different P loadings is presented in Figure 5(c). Tan δ peak value decreases with increase in filler loading. Incorporation of P reduces the tan δ peak height by restricting the movement of polymer molecules.
Thermomechanical analysis
One of the main disadvantages of thermoplastic matrix is high CTE. 23 Therefore, to improve CTE value of thermoplastics is an important issue for many applications. CTE of PP and its composites, which was calculated in the temperature range from −40°C to 20°C, is presented in Figure 6. The CTE of PP decreased from 93.2 µm/m°C to 66.8, 64.6, 62.1, and 52.8 µm/m°C with the addition of P into PP at weight fractions of 10, 20, 30, and 40%, respectively. These CTE values indicate 28, 30, 33, and 43% decrements for PP-10P, PP-20P, PP-30P, PP-40P, respectively, when compared to CTE value of PP.
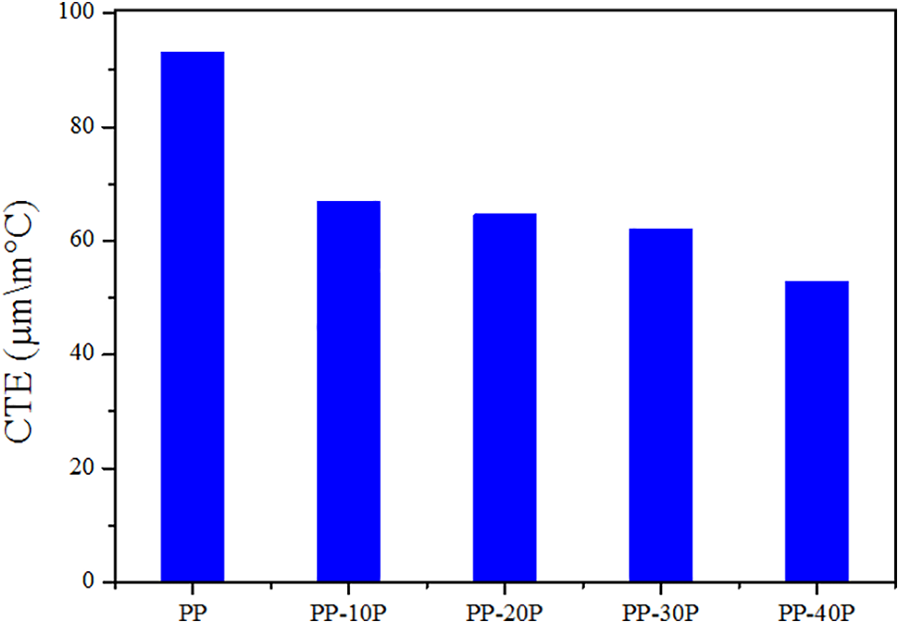
CTEs of PP and its composites. CTE: coefficient of thermal expansion; PP: polypropylene.
Thermal conductivity
Figure 7 shows the thermal conductivity values of PP and its composites depending on the weight fraction of P in PP matrix. The thermal conductivity value of the PP is 0.2 W mK−1. With the loading of P at weight fractions of 10, 20, 30, and 40%, thermal conductivity of PP increased to 0.27, 0.28, 0.30, and 0.35 W mK−1, respectively. These values correspond to 35, 40, 50, and 75% increase. It can be probably said that this increment may result from the relatively high thermal conductivity of P.
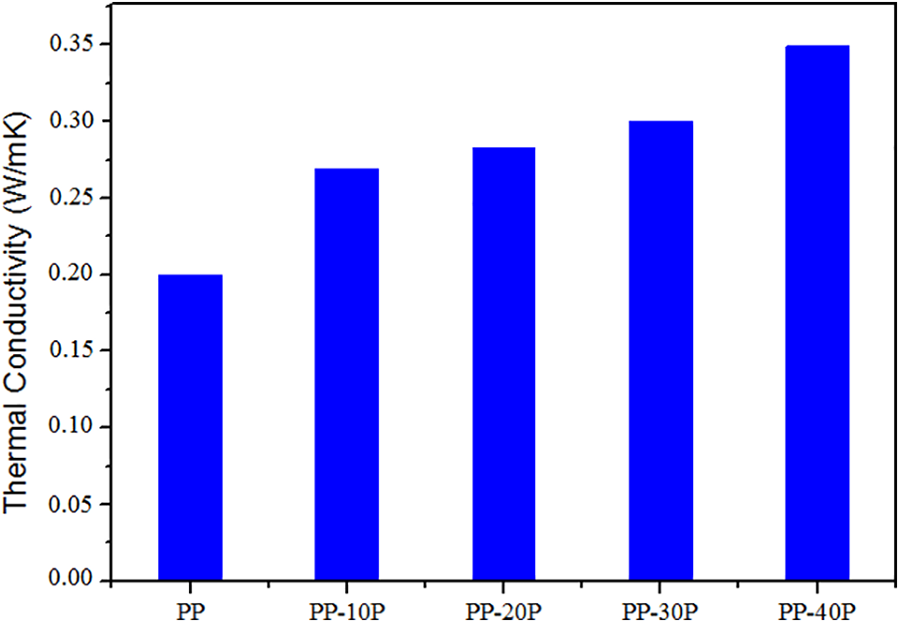
Thermal conductivity values of PP and its composites. PP: polypropylene.
Mechanical analysis
Figure 8(a) and (b) shows the tensile and flexural strength values of PP and its composites. As shown in Figure 8(a) and (b), tensile and flexural strength values of PP were obtained to be 26.5 and 46.4 MPa, respectively.
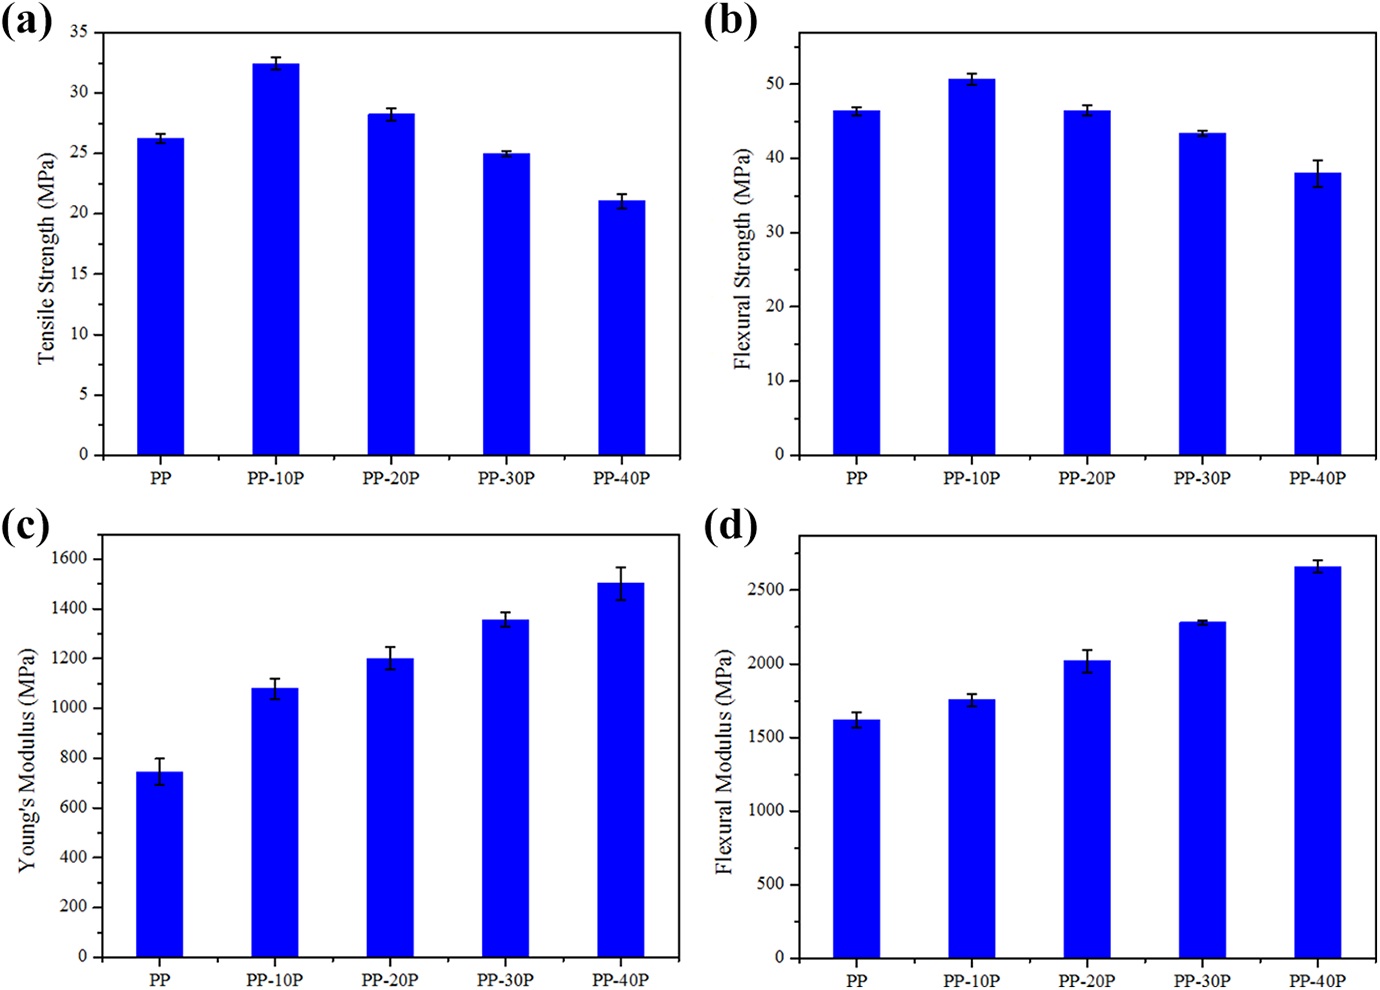
Mechanical properties of PP and its composites. PP: polypropylene.
The tensile strength of PP was increased with the addition of 10 wt% of P. The tensile and flexural strengths of PP-10P composite were obtained to be 32.4 and 50.7 MPa, which indicate 22 and 9%, respectively. The main reason for increased tensile and flexural strengths may be the good dispersion of P in PP matrix. However, the tensile and flexural strength values of PP decreased with the increasing P content in the range of 20–40 wt%. Tensile strength and flexural strength of PP-40P were obtained to be 21.1 and 38.0, which indicate about 26 and 18%, respectively. Weak interface interaction between filler and matrix becomes more pronounced and leads to deterioration in tensile and flexural strength at higher filler loadings. 24,25 As stated in XRD, the crystallinity values of PP, PP-10P, PP-20P, PP-30P, and PP-40P were obtained to be 37.9, 45.9, 44.6, 43.5, and 42.7%, respectively. Tensile strengths of PP, PP-10P, PP-20P, PP-30P, and PP-40P are 26.5, 32.4, 28.2, 25.0, and 21.1 MPa, respectively. It is seen that the variation trend of tensile strength values of samples is compatible with that of crystallinity degrees.
Figure 8(c) and (d) shows the tensile and flexural moduli of P-filled PP composites. A significant improvement in Young’s and flexural moduli of PP can be observed with filler loading. Moreover, the highest Young’s and flexural moduli values, 1501 and 2661 MPa, respectively, were obtained when 40 wt% of P was filled into PP. The increase in Young’s and flexural moduli of PP can be explained by the substitution of PP by the largely more rigid mineral filler and the mineral filler restricting the mobility of the matrix. 24
SEM analysis
The morphology of the fractured surfaces of P and P-filled PP composites was investigated by SEM analysis. P particles can be seen very clearly as shown in Figure 9(a) to (d). Moreover, porous structure of P powder can be seen in Figure 9(e). Based on morphological study, it was observed that P particles (10%) exhibit more homogenous size distribution and dispersion in PP matrix as compared to those of 20, 30, and 40% of P weight fractions. Moreover, from Figure 9(b) to (d), it is observed that P particles greater than approximately 50 µm are detected within PP matrix. From Figure 9(a) to (d), there are many small holes observed on the fractured surface of composites. This case indicates poor interfacial interactions between the P particles and PP matrix. Due to poor interfacial interactions, as was also seen in Figure 9(c) and (d), loading higher amounts of P powder into PP, such as 30 and 40 wt%, led to presence of larger particles and thus decreased the tensile strength of composite.
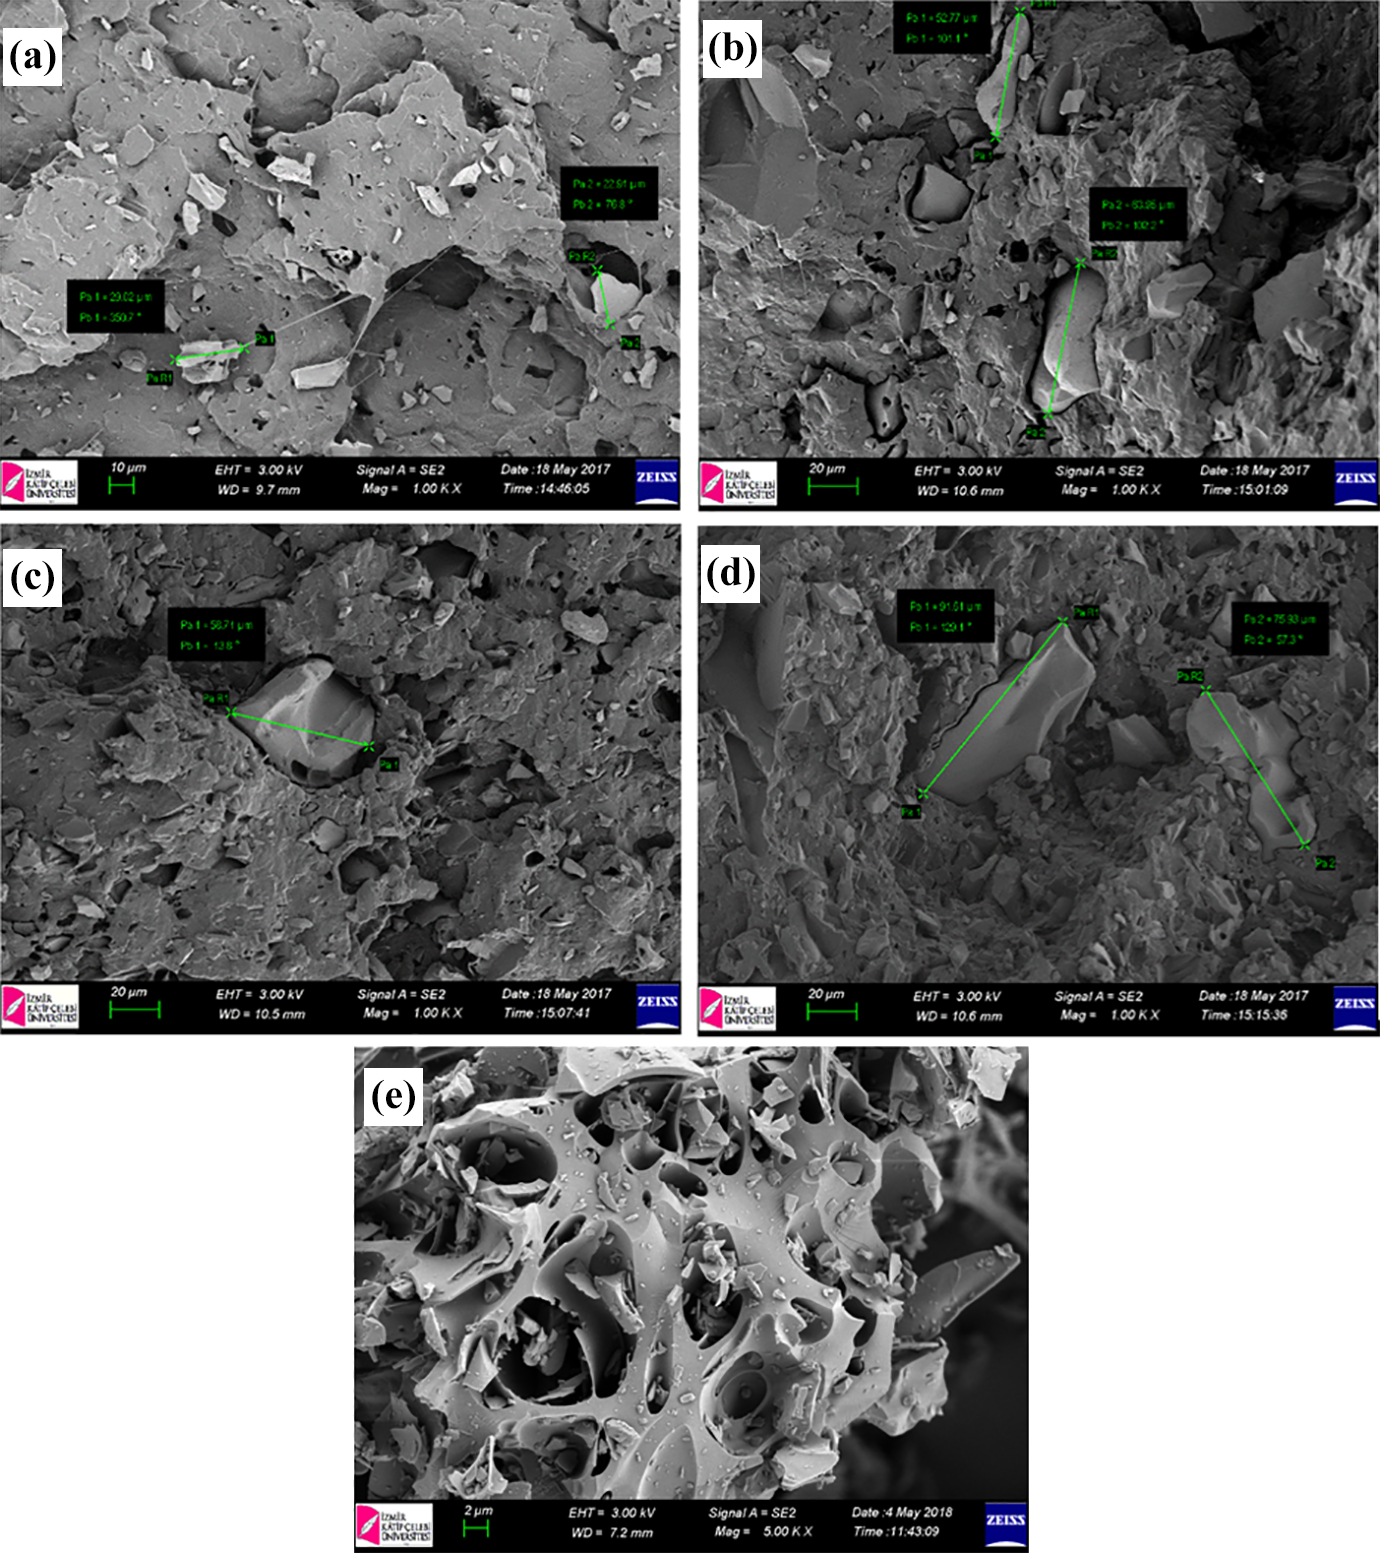
Surface morphologies of pumice stone powder and pumice stone–filled PP composites. (a) PP-10P, (b) PP-20P, (c) PP-30P, (d) PP-40P, and (e) P powder. P: pumice stone; PP: polypropylene.
Conclusion
In this study, the effect of P powder loading into PP was investigated in terms of thermal, mechanical, crystallographic, chemical, viscoelastic, and morphological views. One can note an interesting result that P powder loading into PP at various weight fractions (10, 20, 30, and 40%) increased the thermal conductivity of PP by 35, 40, 50, and 75%, respectively. The CTE of PP decreased from 93.2 µm/m°C to 52.8 µm/m°C upon loading of 40wt% of P powder. From XRD analysis, it was observed that the peak intensity of β-phase of PP increased with the loading of 10 wt%. P powder particles act as β-PP inducing nucleating agents and increase the crystallinity rate of PP. P powder loading into PP enhanced the maximum decomposition temperature of PP. With the loading of 40 wt%, onset decomposition temperature of PP increased by about 40°C. The tensile and flexural strengths of PP-10P composite were determined to be 32.4 and 50.7 MPa, which indicate 22 and 9% increases, respectively. From this study, it can be concluded that P powders can be used as an efficient filler material to improve thermal stability and mechanical properties.
Footnotes
Declaration of Conflicting Interests
The author(s) declared no potential conflicts of interest with respect to the research, authorship, and/or publication of this article.
Funding
The author(s) received no financial support for the research, authorship, and/or publication of this article.