
Abstract
The joining of thermoplastics through welding offers numerous advantages over mechanical joining. Most importantly, it eliminates the use of costly fasteners and has only a limited effect on the strength of the parts being joined. Since it does not require the introduction of holes, loading pins, and the associated stress concentrations, a specific form of welding, friction stir welding (FSW), was investigated for the creation of butt joints of unreinforced polyphenylene sulfide (PPS) and short carbon fiber (CF)-reinforced polyetheretherketone (PEEK) plates. Unlike metals, analytical models and experimental results show that the heat generated by the FSW tool is insufficient to produce the heat required to weld thermoplastic materials. Therefore, a second heat source is required for preheating these thermoplastics. In this research, a resistance type surface heater was placed at the bottom of two identical weld pieces to produce good quality welds. Two types of shoulder design such as rotating shoulder and stationary shoulder were developed in this study. Taguchi’s design of experiment method was utilized to develop the welding process, where heating duration, material temperature, tool rotational speed, and tool traverse speed were used as the welding parameters. One of the process parameters, tool traverse speed, had significant influence on the tensile strength of PPS samples. While PPS sample showed relatively lower tensile strength with higher traverse speed, short CF-reinforced PEEK samples had higher tensile strength with a higher traverse speed. In addition to tensile tests, fracture toughness tests were performed for both PPS and PEEK samples to observe the influence of unwelded segments in the welded parts. In this study, joint efficiency of PEEK samples was found to be higher than that of PPS samples. Micrographs of PEEK samples showed uniform homogenous mixture of part materials.
Introduction
Significant advances in thermoplastic composite materials make them effective for numerous industrial applications, specifically in the aerospace industry. The recent trend is geared toward the usage of fiber-reinforced composites. Indeed, recent airplanes such as Boeing 787 and Airbus A350 are mostly made using fiber-reinforced plastics. Over 50% by weight of their structural components are made with composites. 1
Composites are highly sought after for their high specific strength and stiffness as well as durability in corrosive and fatiguing environments. Thermoplastic composites are playing a vital role in the structural development, just as the thermoplastic materials enable three-dimensional (3-D) printing of unreinforced plastics. They offer unlimited shelf life, high toughness, short process cycle times, and reformability, which allows a level of integrated manufacture that is unachievable with thermoset-based composites.
The engineering thermoplastics came on the market in the 1980s. The most promising thermoplastics in aerospace applications, such as polyphenylene sulfide (PPS), polyetherimide (PEI), and polyetheretherketone (PEEK), require relatively high processing temperatures. Therefore, these materials require special attention during the design and development of thermoplastic aircraft structures. The production of parts and assemblies of thermoplastic composites differ significantly from their thermoset counterparts. Joining methods for similar and dissimilar thermoplastics are the key for efficient manufacturing. 2
In industrial applications, proper assembly of composite parts is a key point for the well-being of primary and secondary structural assemblies. In many cases, methods of mechanical fastening may lead to the risk of damaging the matrix as well as the fibers in the composite material. Drilling and fastening are slow, failure sensitive, and expensive. 3 Joining of thermoplastic composites can be done based on fusion bonding techniques instead of drilling and fastening. Currently available techniques are ultrasonic welding, induction welding, resistance welding, rotational welding, and autoclave-based integral consolidation. All fusion bonding techniques involve melting and reconsolidation of the material. A new alternative bonding technique is friction stir welding (FSW). 4,5 It was initially developed by The Welding Institute in 1991 for joining metals. Although successfully applied for unreinforced polymers, 6 –8 the application for continuous fiber-reinforced thermoplastics is far from trivial. Stirring of continuous fiber causes destruction of fiber alignment and degrades mechanical properties. The development of FSW process for specific polymers and reinforcement architectures is the topic of this article.
Advantages of FSW lie in the fact that it takes place below the melting point of the material and has the ability to join thermoplastics that are difficult to fusion weld with existing technology. In addition, this process is highly adaptable for automation and robotic use. 9,10 Some other advantages of FSW include low energy consumption, little joint preparation, no fumes during process operation, absence of filler material, and pollution associated with most fusion welding techniques. 5
Recently, researchers showed interest in FSW of unreinforced thermoplastics. 11 The influence of different process parameters on the joint strength has been analyzed for friction stir spot welding of unreinforced polycarbonate sheets 12 and high-density polypropylene. 13 Many researchers worked on the microstructure and mechanical properties of friction stirred welded materials. 14,15 Strand et al. 16 analyzed the mechanical and microstructure properties of friction stir welded polypropylene sheets using a hot shoe method and determined process parameters to achieve minimal disruption of the polymer’s microstructure. They hypothesized that the welds should be made at a low translational speed, high shoe temperature, long pressure time, and large pin diameter. Panneerselvam and Lenin 8 joined Nylon 6 plate by FSW with threaded pin profile. Pirizadeh et al. 17 developed a “self-reacting tool” to eliminate the root defect of the welded thermoplastics parts, and hence enhanced the tensile strength of the workpiece. Saeedy and Givi 18 investigated the effects of various critical parameters of FSW on polyethylene. Arici and Sinmaz 19 claimed elimination of root defect by introducing double passes of the welding tool during FSW of polyethylene. But in many cases, researchers concluded that achievement of a good joint is a challenging task. 12,20 The friction in FSW generates thermal energy and stirring creates relocation of materials. In case of short fiber-reinforced composites, the stirring enforces migration of short fibers into the matrix of the thermoplastic parts being joined. FSW of composites is therefore a complex process including friction, cohesion, adhesion, deformation, recrystallization, consolidation, blending, and migration of multiphase/material blends. 21,22 In this article, a continuous friction stir welded butt joining process is described for unreinforced PPS. The technology is not suitable to perform continuous FSW of continuous fiber-reinforced composites. This study also analyzes the weldability of short fiber-reinforced composite such as PEEK. It is anticipated that the process requires subtle control over process parameters.
Heat generation during FSW process
Figure 1 shows a diagram with the basics of the FSW process. For semicrystalline materials such as PPS and PEEK, the FSW process works in the glass phase of the thermoplastics. One of the aims of this process is to generate thermal energy by friction to heat up the material within the operating temperature range. This range starts from the glass transition temperature (Tg) and ends below the melting point (Tm) of the thermoplastics.
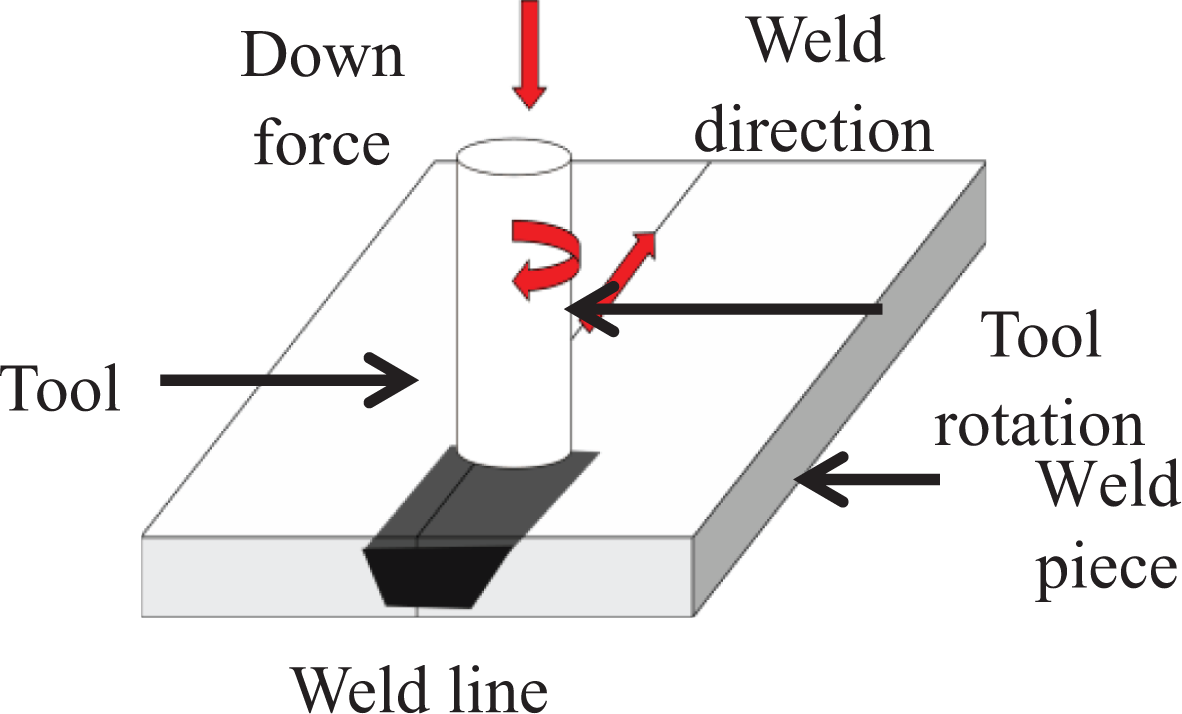
Basic process of FSW. FSW: friction stir welding.
The process of thermal energy generation takes place when mechanical energy is transformed into heat. 23 In FSW, this transformation is a complex process which involves friction, wear, adhesion, deformation, and recrystallization of material. 21 Depending upon the heat generation process, FSW of thermoplastic can be divided into five phases: (i) plunging, (ii) initial dwelling, (iii) welding, (iv) final dwelling, and (v) pulling out 22 (Figure 2).
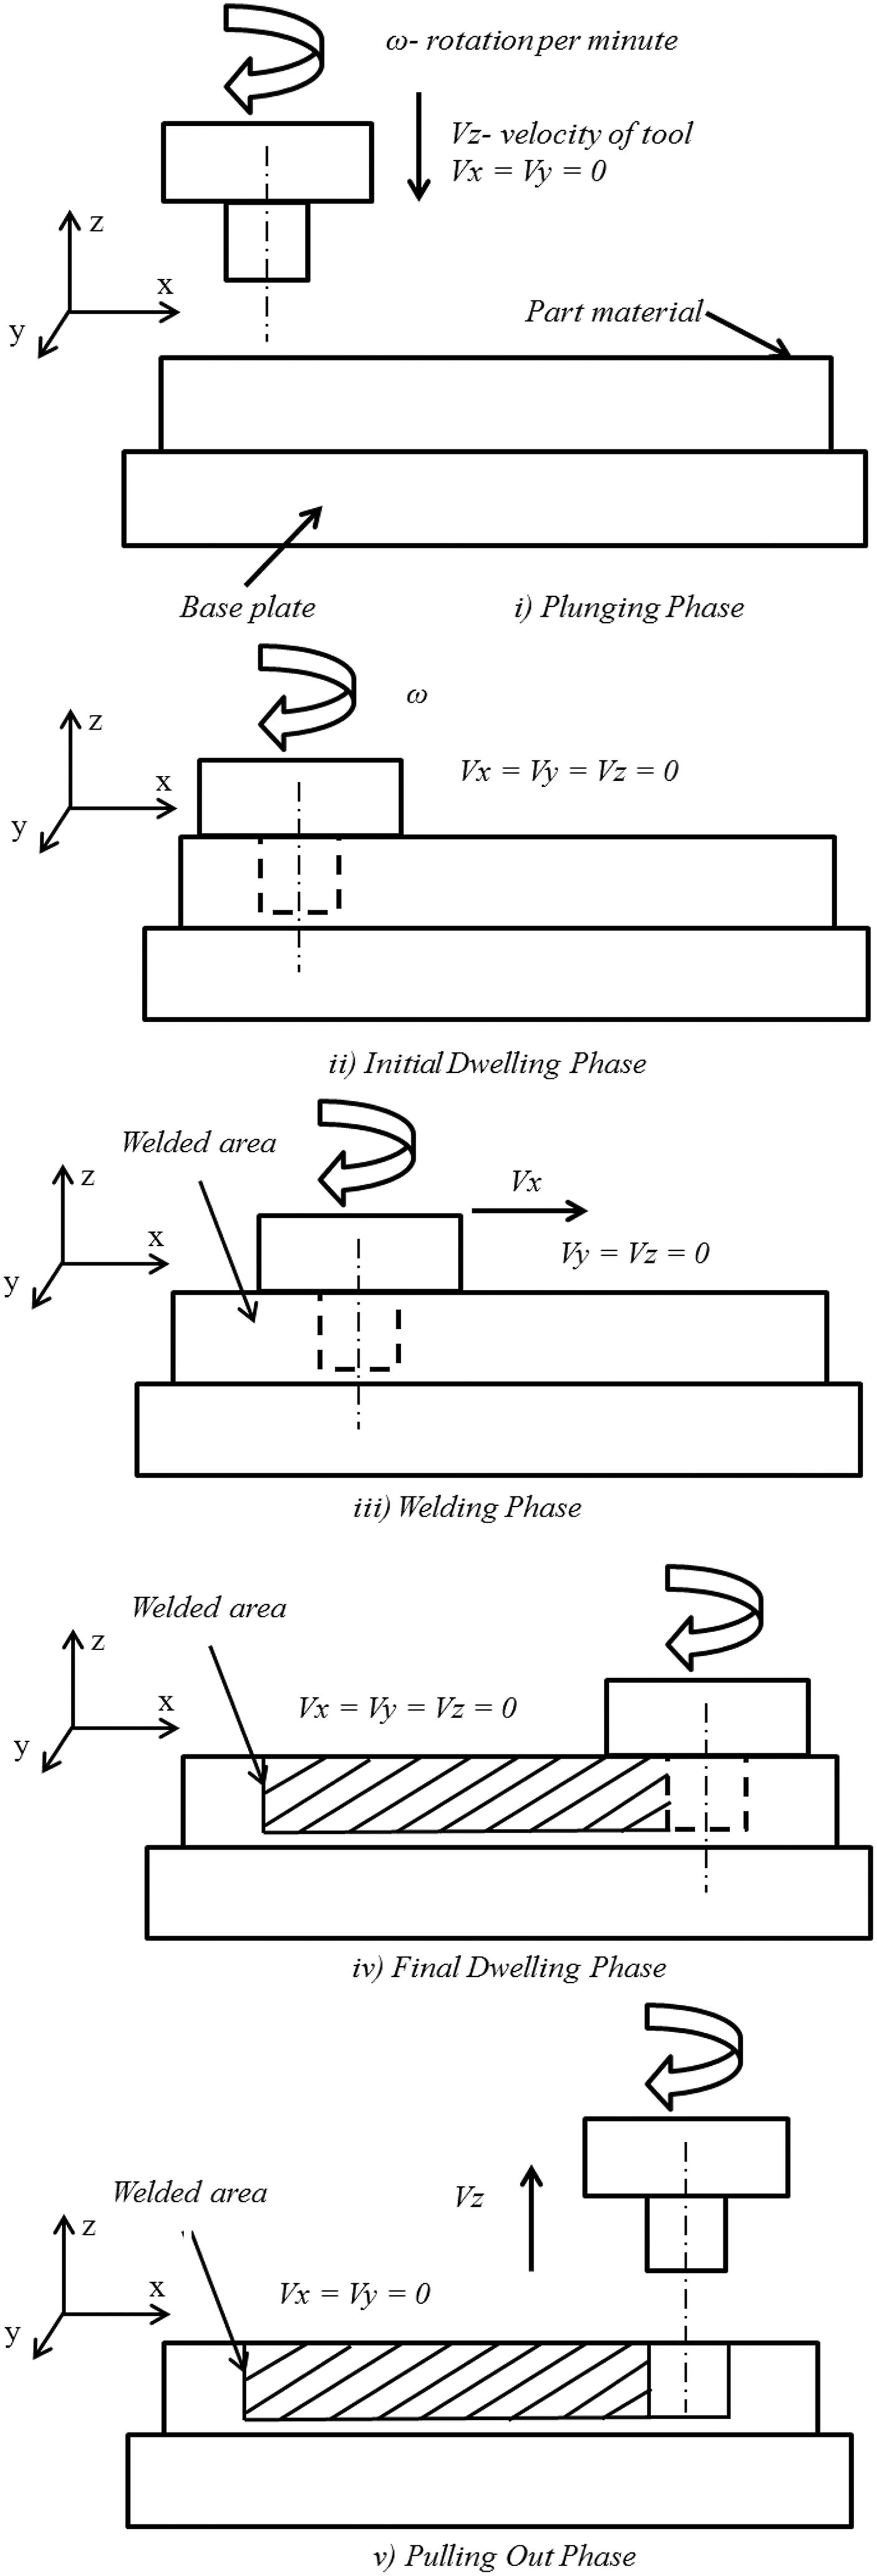
Different phases of FSW. FSW: friction stir welding.
All these phases generate heat utilizing the friction between the contact surfaces of the tool and the specimen. However, the heat generated during the pulling out phase does not contribute to the joining but is required to complete the welding process. This leaves a hole on the workpiece, which is unavoidable, unless the welding process continues to and beyond the edge of the workpiece. The contact surfaces of different parts of the welding tool and workpiece vary from phase to phase. The number of contact surfaces and welding process parameters, such as tool rotational speed, translational speed, axial and transverse force, determine the total heat generation during the process. 21,24 –26 Figure 3 shows the basic geometry of a welding tool, which consists of a cylindrical shoulder and a cylindrical pin (smaller diameter than shoulder). The shoulder and the pin may have relative movement between them. Different tool designs allow stationary or corotation of the shoulder with the tool pin. 27 Additionally, the tool pin’s outer surface is normally threaded which is used actively to generate sufficient friction and stir the material. 28
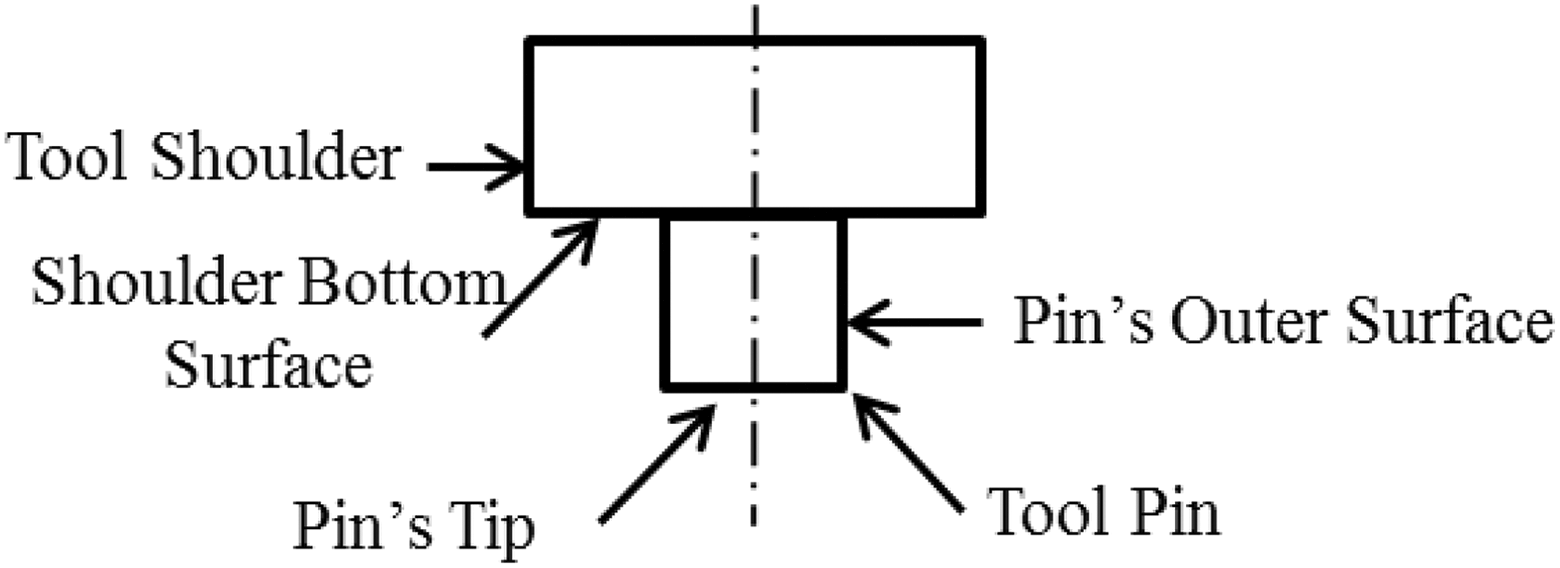
Basic tool geometry.
During the plunging phase, the pin’s bottom surface makes contact with the weld piece and generates heat. As the pin goes down, the side surface of the pin, which has more surface area, makes contact with the weld piece and a significant amount of heat is generated. In this phase, the depth of contact increases from 0 to the height of the pin. At the end of the plunging phase, the dwelling phase starts when the shoulder’s bottom edge is in contact with the top surface of the weld piece. In the welding phase, all the mentioned surfaces remain in contact with the weld piece while the tool pin’s side surface creates normal and shear stress in the weld piece as it moves along the joint line. During the final dwelling phase, the tool pin’s side surface, its tip surface, and the tool shoulder’s bottom surface remain in contact with the weld piece.
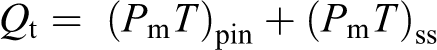
Heat generation during the FSW process creates two types of region in the welded material: a FSW joint region, which is affected by heat only named as heat-affected zone, and the joint region, which is affected by both heat and deformation named as thermo-mechanically affected zone. 5 In FSW, the mechanical power, Pm, is the input source of energy which transforms into heat. If η represents heat transformation efficiency, the total amount of heat, Qt, generated in a particular time interval, T, during FSW can be expressed as
For simplification, if all of the mechanical power is transformed into heat (assuming η = 1), the total heat generated by pin and rotating shoulder becomes
As mechanical power is the product of angular velocity (ω) and torque on the welding tool (M), we can write
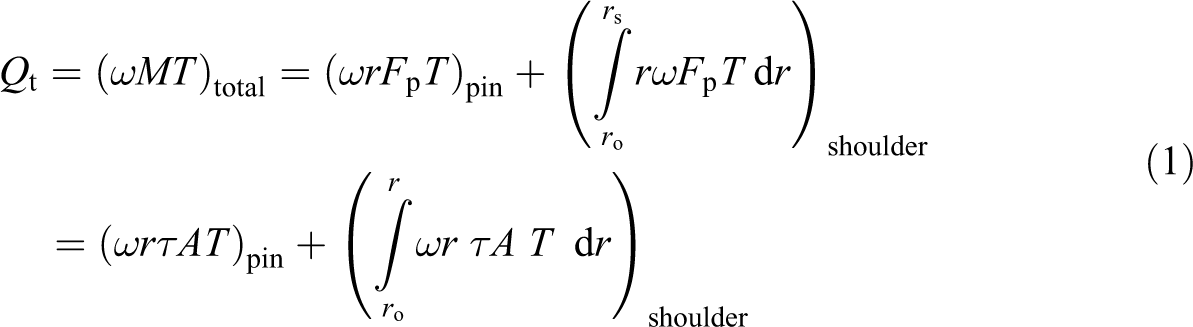
where Fp = tangential force at the perimeter, r = radial distance of perimeter force, ro = pin radius, rs = shoulder radius, τ = contact shear stress, and A = contact surface.
Since heat is generated at or near the active contact surfaces due to the rotational movement, the total amount of heat is the addition of heat generated at all the contact surfaces. Thus


where Qpt = the amount of heat produced at pin tip, Qpo = the amount of heat produced at pin outer surface, and Qss = the amount of heat produced at shoulder bottom surface.
In addition to frictional heat, deformational heat is also produced during the welding phase. Deformational heat is produced by one of the basic tribological processes known as pure sticking.
21
Pure sticking assumes shearing in the layer of the material of the weld pieces very close to the contact surface and uniformity of the shear stress, τ. In this situation, the surface of the weld piece will stick to the rotating tool’s surface only if friction shear stress exceeds the yield shear stress of the weld piece.
21
Thus, the total heat generated during FSW is a function of pure friction, pure deformation, and a combination of friction and deformation. We define δ as a dimensionless contact state variable such that δ = 0 for pure frictional heat; δ = 1 for pure deformational heat; and 0 < δ < 1 for combination of frictional and deformational heat.
Then, heat components generated by the different active contact surfaces are


Considering frictional and deformational heat production, contact shear stress in equation (1) can be expressed as
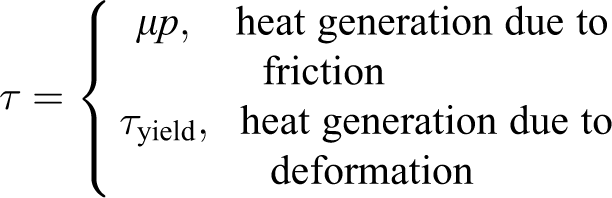
where μ = friction coefficient, p = contact pressure, and τyield = shear yield strength.
To quantify the total heat generation analytically during FSW of PPS and PEEK, the friction coefficient between weld piece and welding tool, 29 contact pressure of the tool to the weld piece, and the shear yield strength of the material have to be determined. The von Mises yield criterion in uniaxial tension and pure shear condition can be used to approximate the boundary value of tangential shear yield stress. The shear yield strength of the polymer is a function of temperature and strain rate. This requires the full temperature and strain history of the workpieces in a wide zone around the welding tool. 21,30 By looking into the active contact surfaces in the different welding phases and the analytical model of heat generation, it is evident that the maximum heat is generated during the welding phase. Unlike metals, thermoplastic polymers have low coefficients of friction (for PPS: 0.2, for PEEK: 0.11, and for aluminum: 0.3–0.4) and low thermal conductivity (for PPS: 0.19 W/m·K, for PEEK: 0.240 W/m·K, and for aluminum 2024: 121–193 W/m·K). For these reasons, only limited amount of heat is generated as a result of friction and deformation, and the propagation of this heat is very slow through the weld pieces. Though the low thermal conductivity helps to keep the heat generated in the process zone, sufficient temperature is not produced due to friction and deformation to soften the thermoplastic suitable for FSW.
Therefore, additional external heating is applied to elevate the temperature of the weld pieces required for the welding process. This heat is added in addition to the heat generated by the frictional and deformational heating process. To have a good control over the heating process, let us consider this external heating system as a primary heat source, Qp, while frictional and deformational heat are the secondary heat source, Qs. Therefore, the total amount of heat, QT, will be the addition of both heat sources. Thus

where
The role of the primary heat source is to preheat the weld pieces before the plunge phase starts. This preheating keeps the weld pieces heated below the process temperature. The secondary heat, generated by the friction and deformation caused by the FSW tool and the weld pieces, is used to reach the temperature required for the welding environment.
External heat can be added to the weld pieces from bottom and top surfaces (Figure 4). Combination of primary and secondary heating softens the material and makes it susceptible to stirring and mechanical joining. If the external heat sources remain in contact with the weld pieces, diffusion of heat from the external heaters occurs. The heat diffusion equation is described as
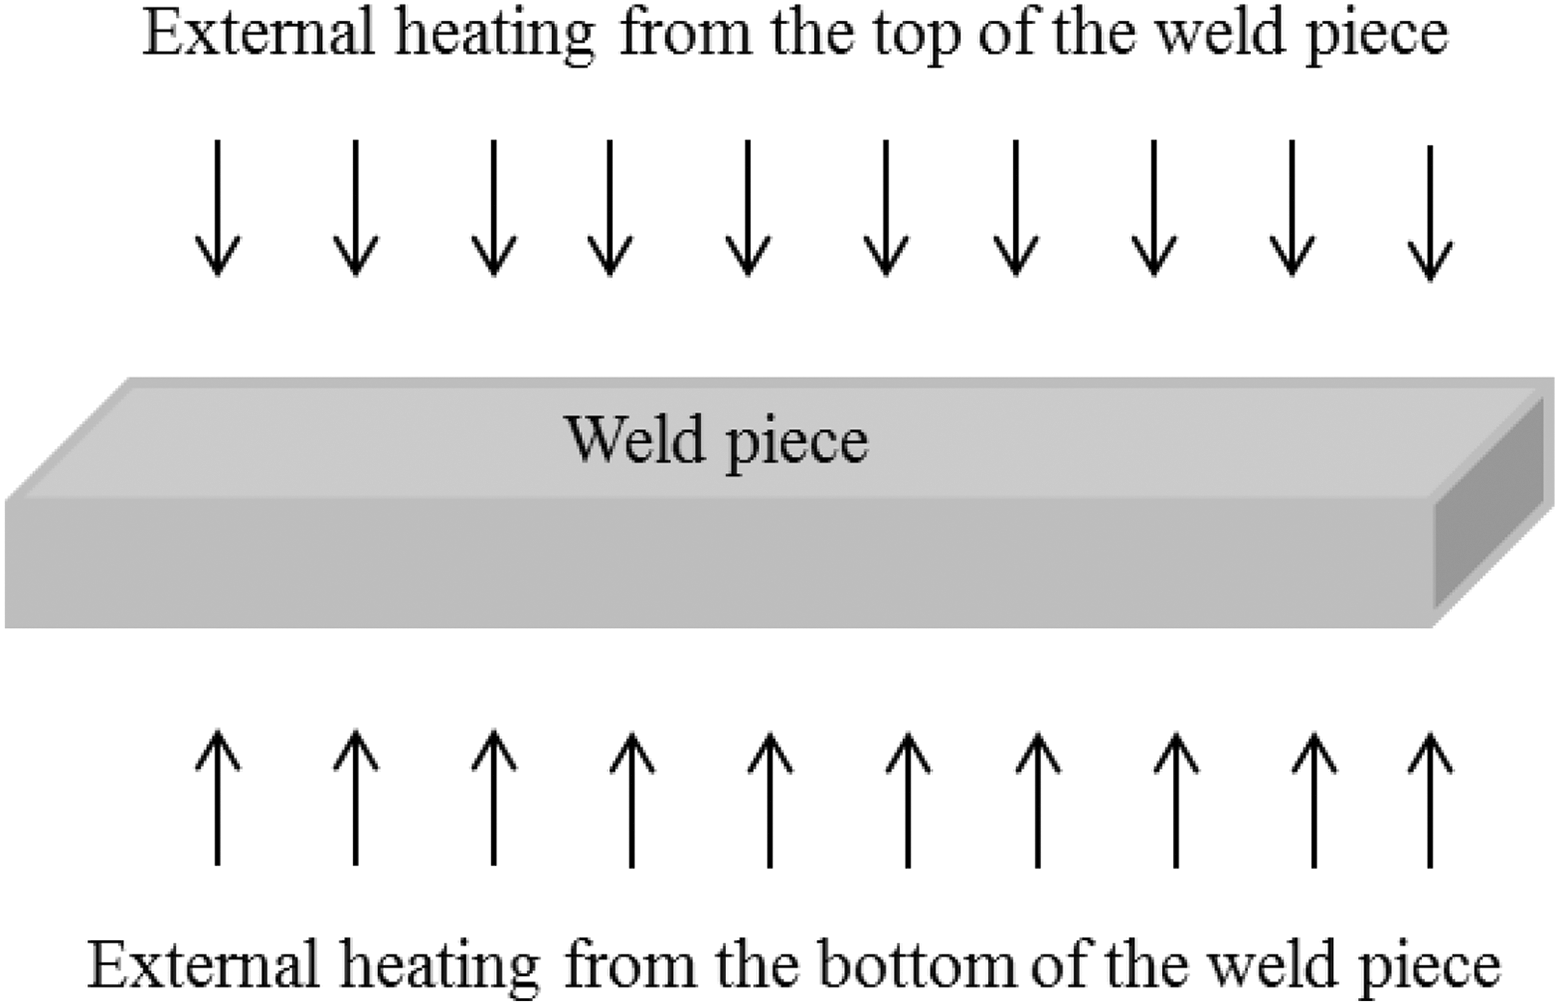
Concept of external heating from bottom and top of the weld piece.
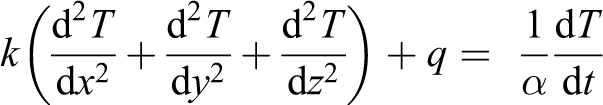
where T = temperature, q = heat flux, k = conductivity, (x, y, z) = spatial coordinates, t = time, and α = positive constant.
In this study, resistance type surface heaters are utilized as the primary heat source. Therefore, heat propagating in z-direction only is the effective heat energy to heat up weld pieces. Moreover, microgaps between the heaters and the weld pieces reduce total heat transfer. When externally controlled heat is used either from the top or bottom of the weld pieces, there remains a temperature gradient along the thickness of these pieces due to the low thermal conductivity of the polymer. In this study, a relatively large thickness of the weld pieces was used and this temperature gradient was observed.
Experimental setup and methods with PPS
Two types of experimental setups were used in this research. Figure 5(a) shows a 3-D representation of experimental setup 1, which consists of top and bottom heater along with rotating shoulder. In this study, only a bottom heater was utilized. Figure 5(b) shows the second type of experimental setup, which consists of bottom heater along with stationary shoulder. A conventional three-axis milling machine was used in both of these experimental setups for tool rotation and transverse motion. Vertical height of the tool is adjusted according to the depth required by the tool pin. Major parts of this experimental setup are as follows:
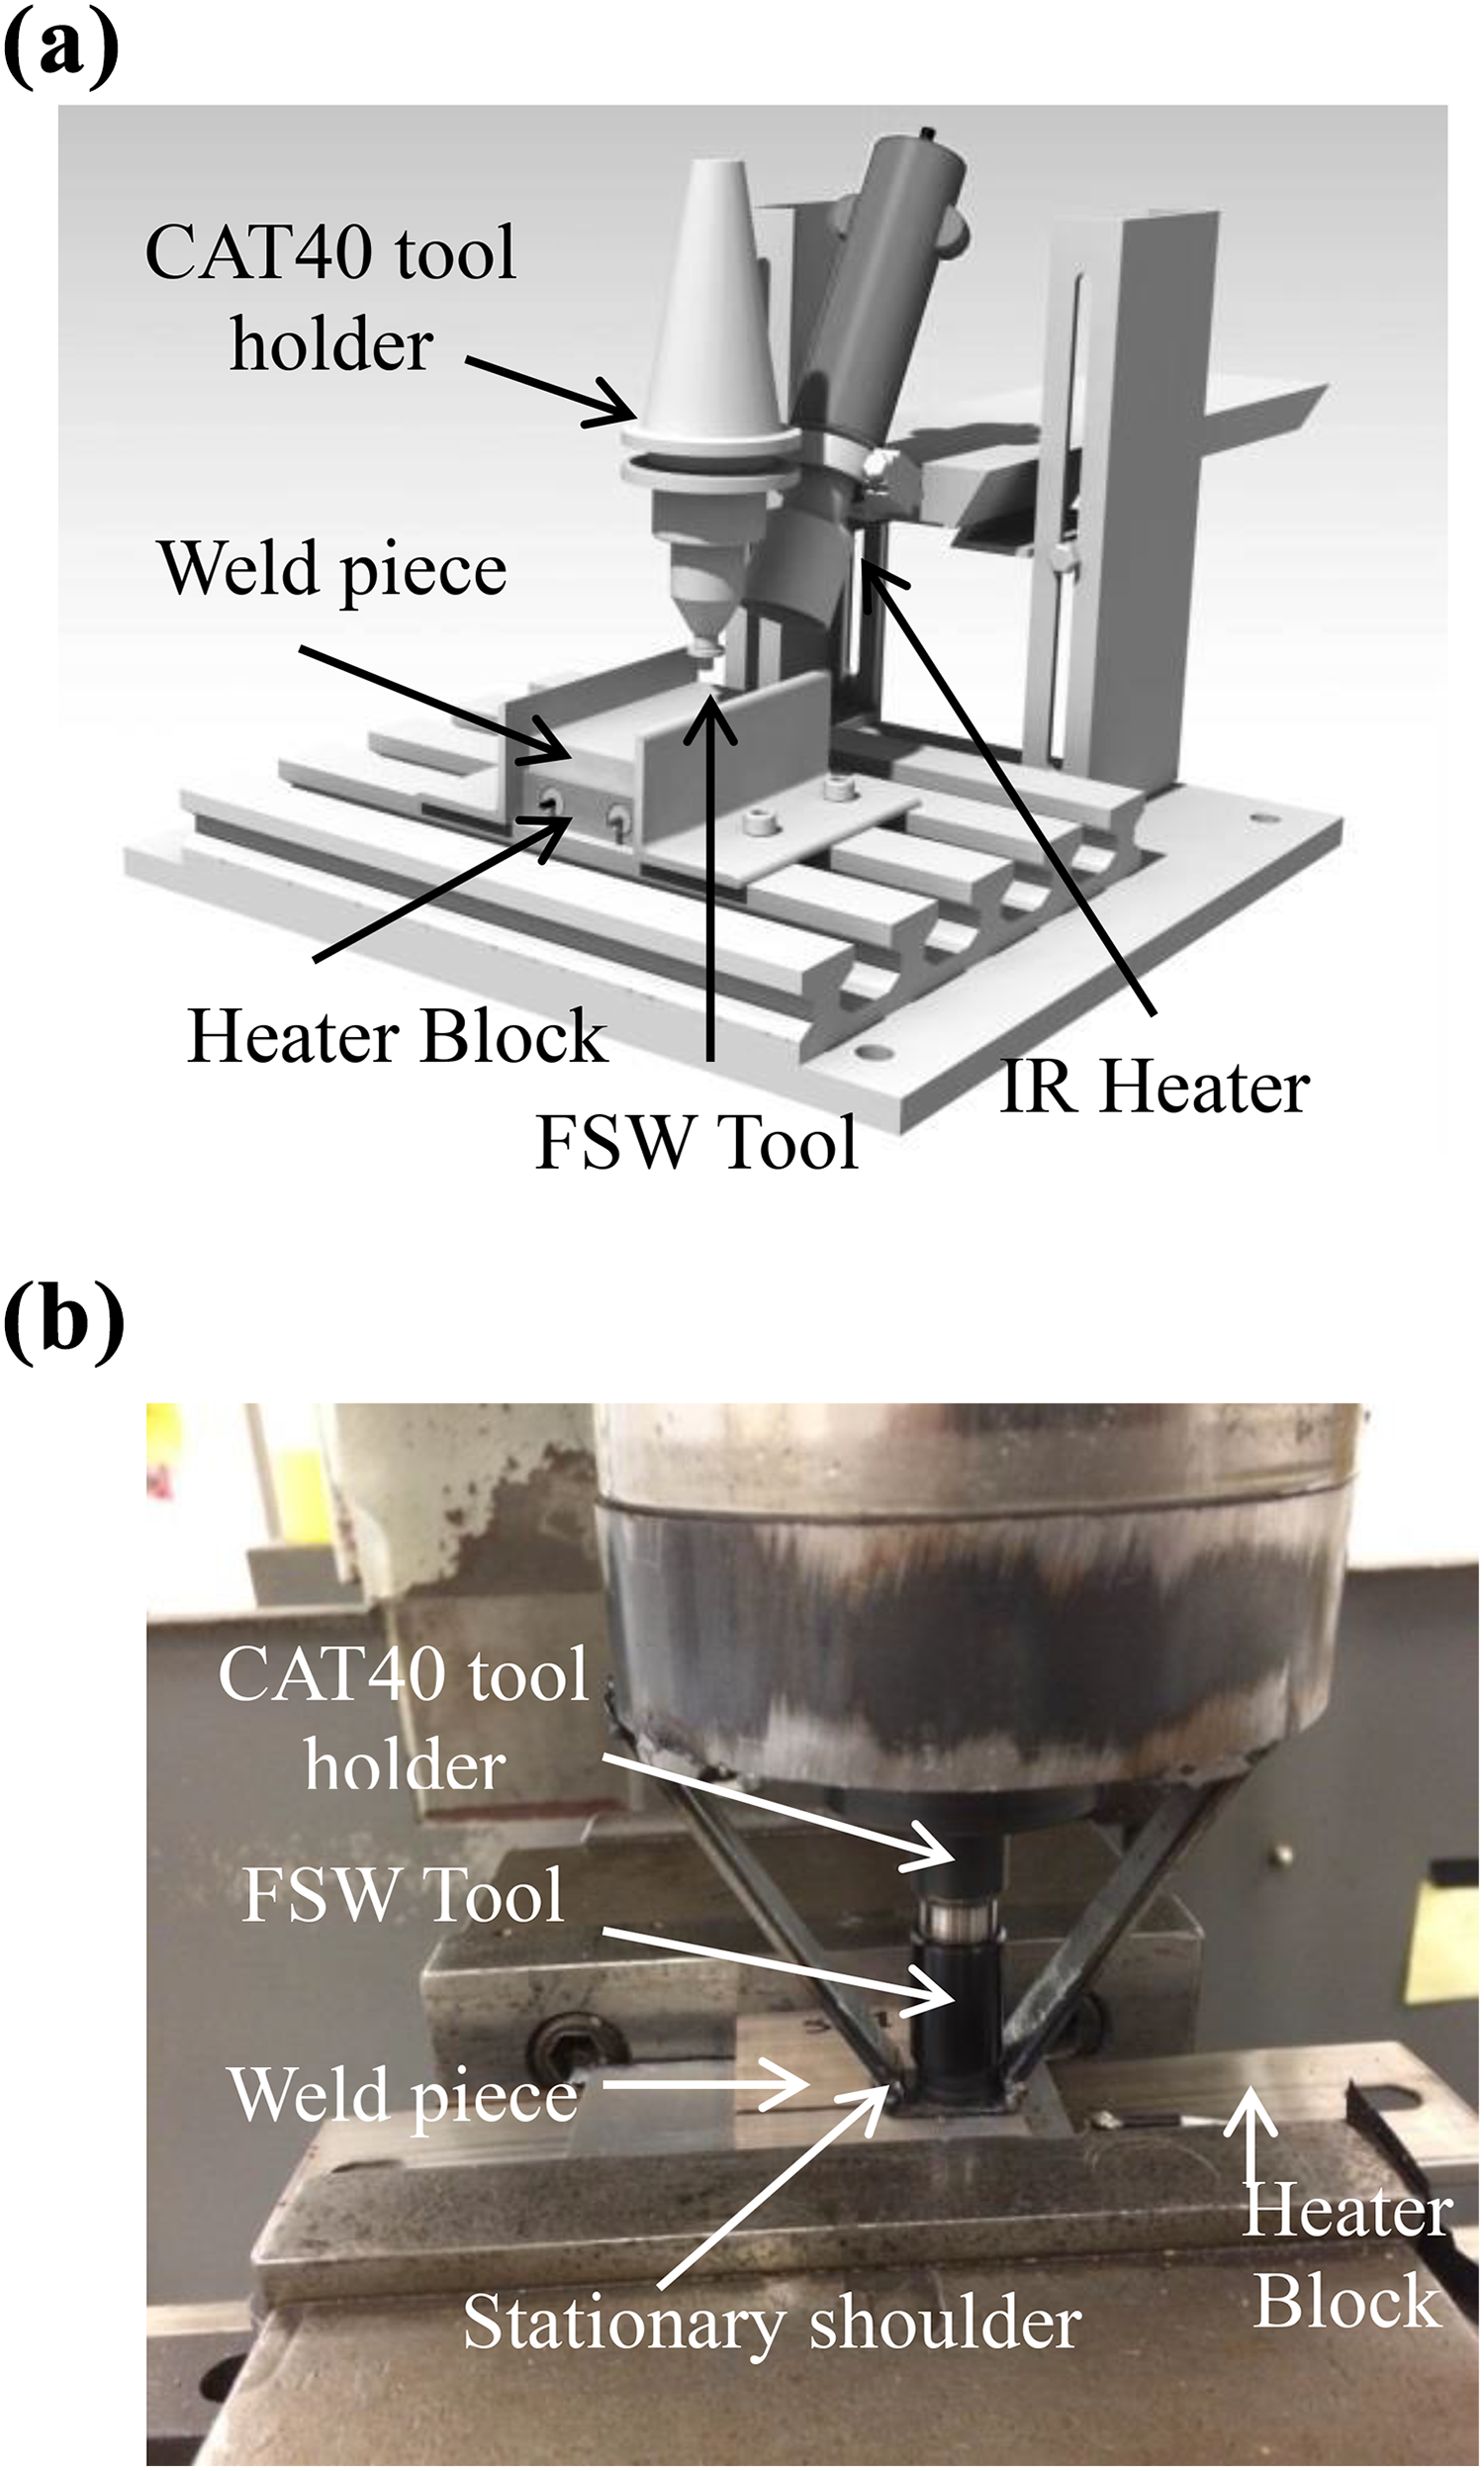
(a) Setup 1—a 3-D representation of experimental setup consisting of top and bottom heater along with rotating shoulder. (b) Setup 2—experimental setup consisting of bottom heater along with stationary shoulder. 3-D: three-dimensional.
Tool holder (quantity 01): A standard holder (CAT40) is used to hold the FSW tool. Surface heater (quantity 01): A channel strip heater (203 × 38 × 7.5 mm3) is used as the heating element. Total power of this heater is 250 W and watt density is 13 watt/in
2
. Maximum temperature that can be produced by the heater is 650°C. A closed-loop control system was developed using temperature controller, relay, and a thermocouple located at the bottom of the weld pieces. This system was configured in such a way that the temperature of the heating elements can be controlled by a voltage regulator. Clamp (quantity 02): Two clamps made of two-inch angle bar are used to hold the weld piece along with the heater block. These clamps keep the fixture in place during the welding process. Tool: In these experimental setups, threaded bolts (Zinc-coated mild steel bolts) are used as the tool pin. This bolt has a diameter of 5 mm and contains 20 threads/inch throughout its nominal length. Washers with an inner diameter slightly larger than the bolt’s outer diameter are utilized as the rotating shoulder in the experimental setup 1 (Figure 5(a)). This shoulder is free to rotate with the rotational movement of the bolt. The bolt is inserted into the tool holder up to its shoulder as described in Figure 6(b). The rotational speed of the shoulder (i.e. washers) during the welding phase is not the same as the rotational speed of the bolt due to the friction between the workpiece and the washers. Stationary shoulder: A stationary shoulder does not rotate with the tool in contrast to a rotating shoulder. Figure 5(b) shows a stationary shoulder arrangement.
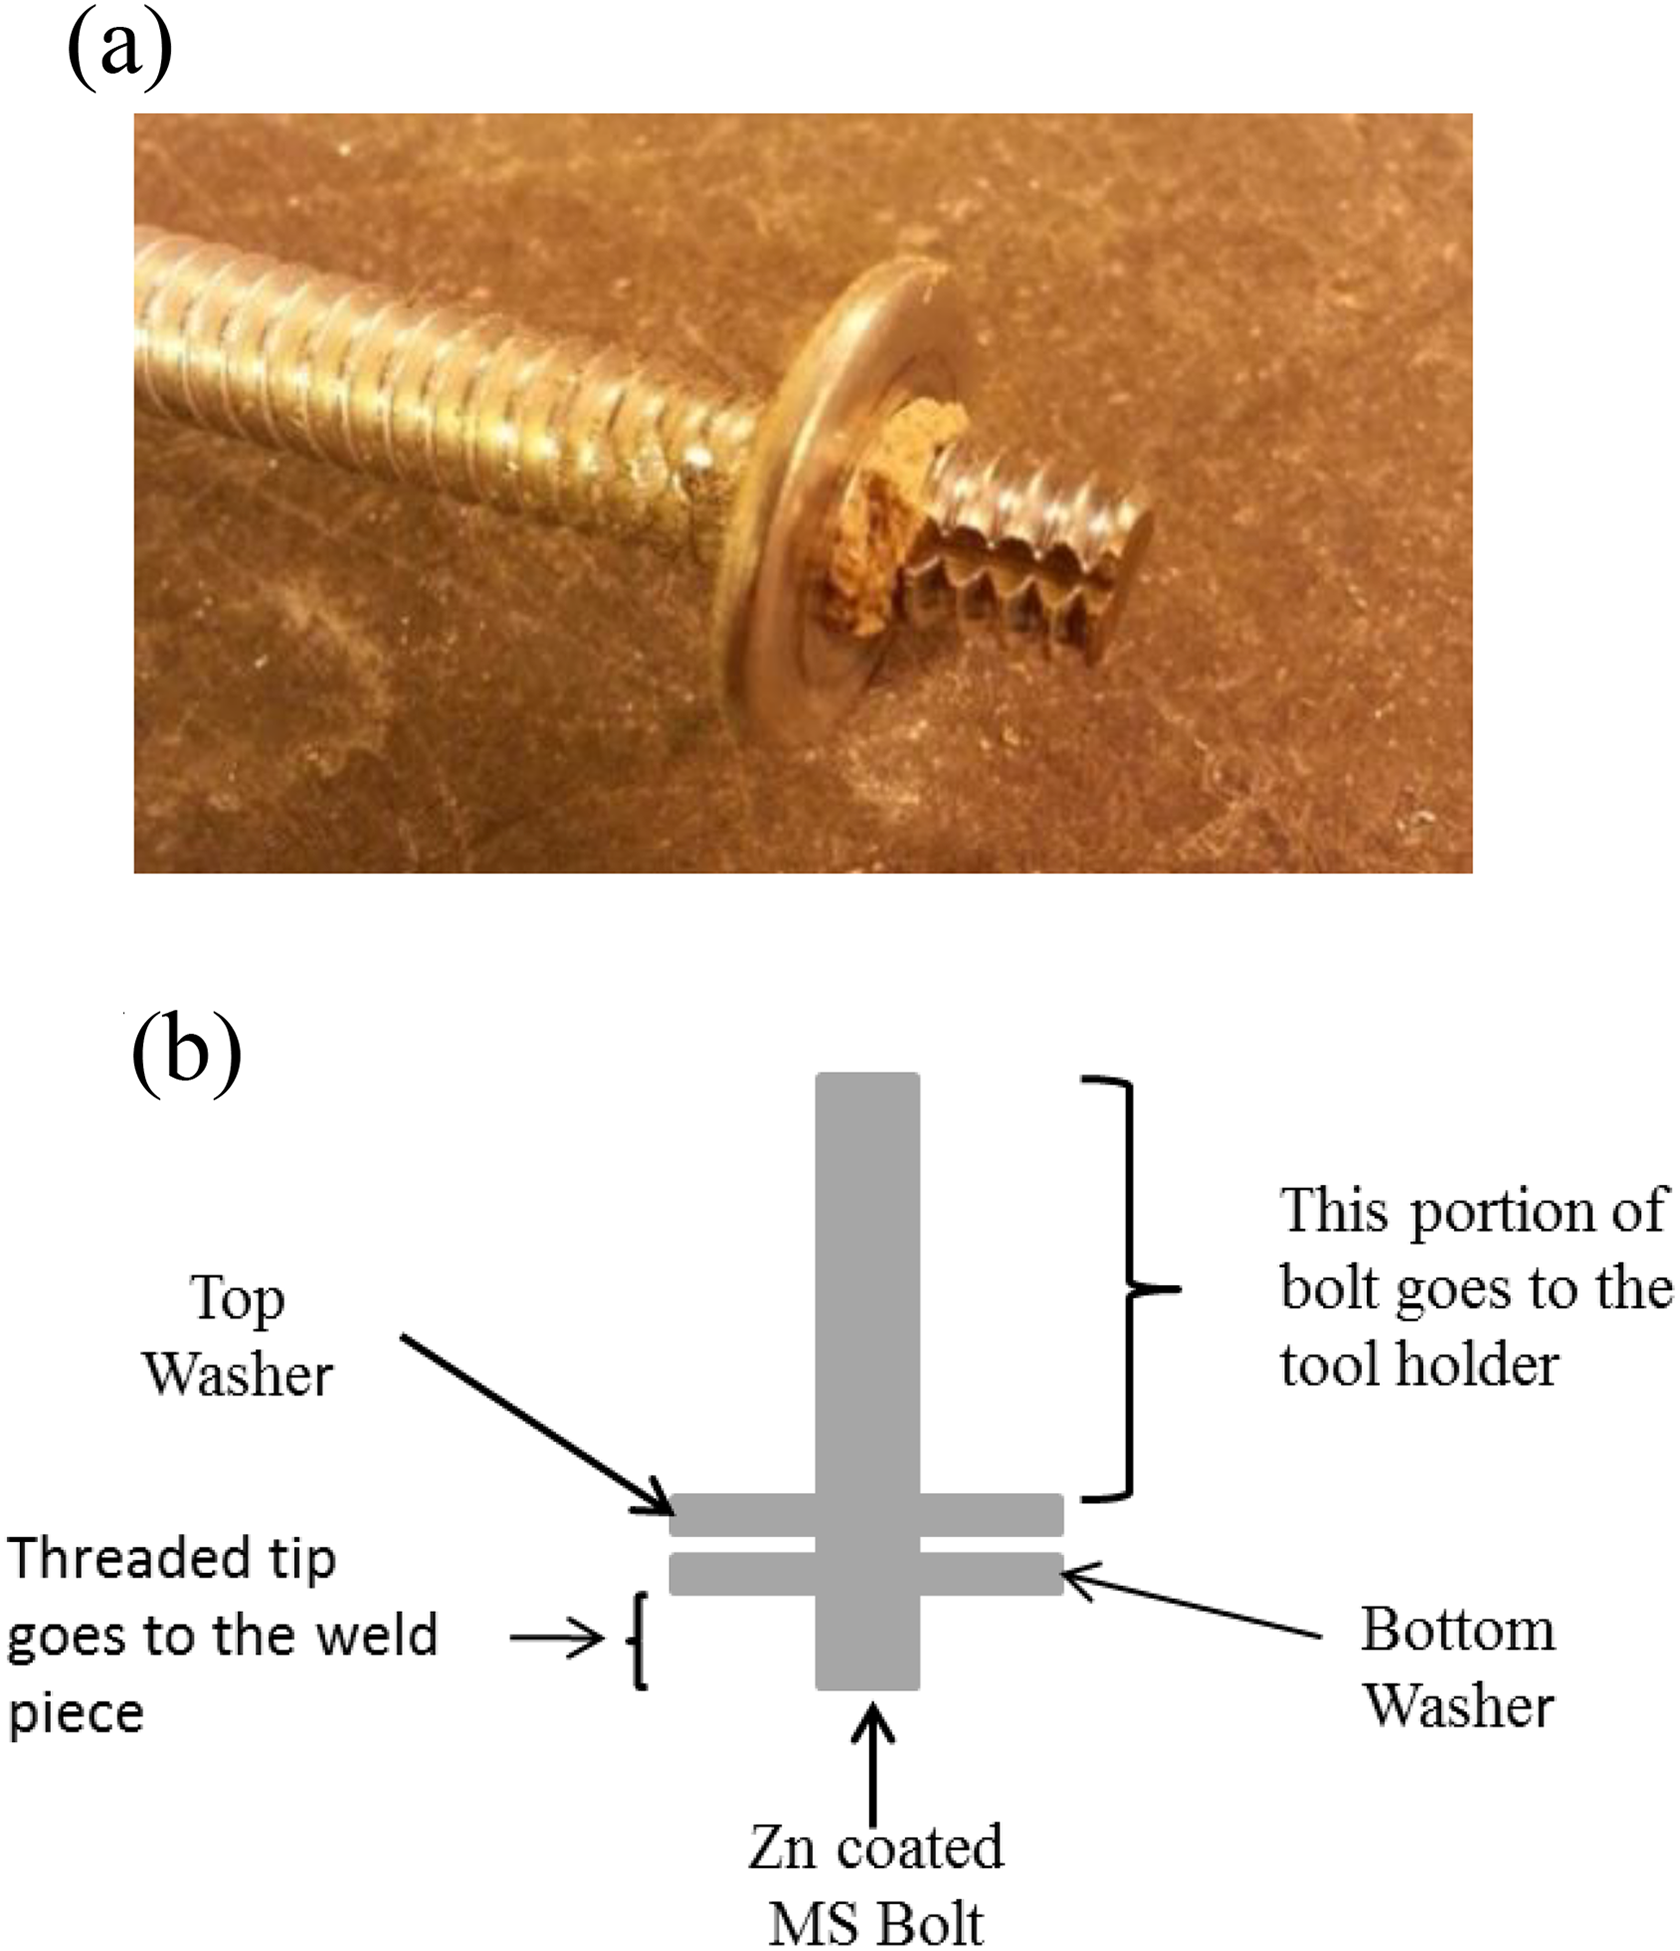
(a) FSW tool with one washer as a shoulder. (b) Drawing of tool with two washers as shoulder. FSW: friction stir welding.
Experimental method
In this study, PPS sheets with a thickness ranging from 3 mm to 5 mm were used for butt joints. The glass transition temperature (Tg) and the melting point (Tm) of PPS are 88°C and 280°C, respectively.
Figure 7 shows a two-piece butt-joint specimen used to investigate the weld strength of friction stir welds under tensile loading conditions. A properly designed clamping fixture with a closed-loop control heating assembly was used to hold the specimen in place. The butt joint tensile strength was obtained by averaging the strengths of three individual specimens, which were welded with identical welding parameters.
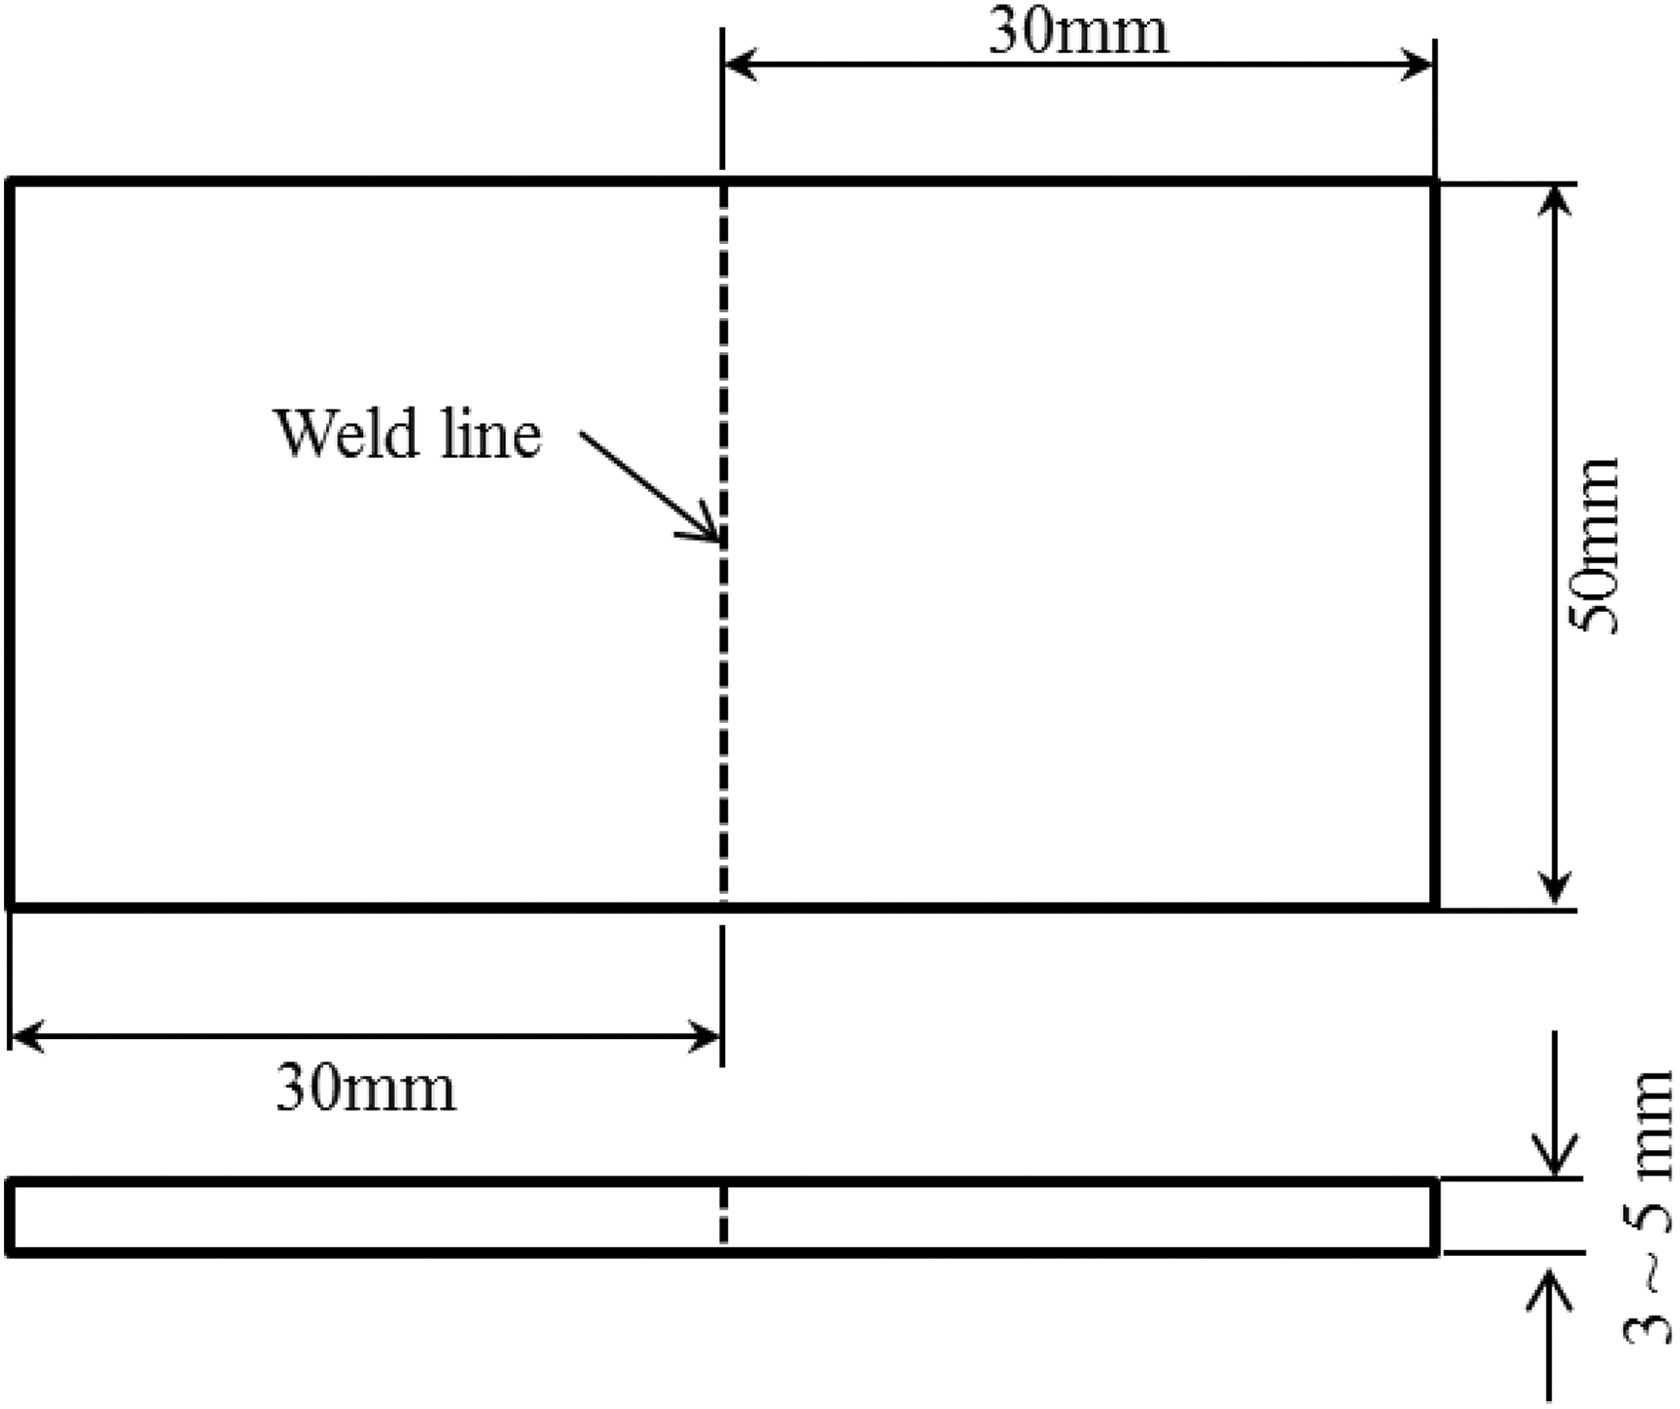
Two-piece butt-joint test specimen.
Experiment design
An initial experimental investigation was performed to identify the number of welding parameters and their range of values. Based on the theoretical analysis performed in earlier section, the requirement of additional heat source was analyzed experimentally. Without adding any external heat source, trials were performed to determine the temperature of the PPS with varying rotational speeds from 500 r/min to 900 r/min. It was found that at 900 r/min, the surface temperature of the PPS sample was approximately 60°C which was even less than its Tg, and the rise of this temperature did not produce any visible weld. Beyond 900 r/min, material chips ran off from the specimen’s top surface. Using following equation, the heat flux generated during this process was roughly estimated as approximately 7.3 W. An additional, approximately 4 W, heat flux is required to increase the temperature at the weld line of the specimen beyond the Tg to get minimum welding temperature
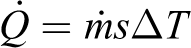
where,
s = specific heat capacity of PPS (approximately 770 J/Kg·K)
ΔT = temperature rise (approximately 60°C).
Therefore, an external heat source was added to the experimental setup and its power was adjusted in such a way that the temperature of the PPS remains below its Tg before the tool starts rotating. The combination of external heat source and the tool rotational speed produced enough heat to increase the temperature beyond the Tg and visible weld was observed.
In this study, Taguchi’s design of experiment method was used to determine the relationship between the influential variables and the output characteristics. 31 Four influential variables or welding parameters were identified from initial investigations. These were (a) heating duration, (b) material temperature before welding, (c) tool rotational speed, and (d) tool traverse speed.
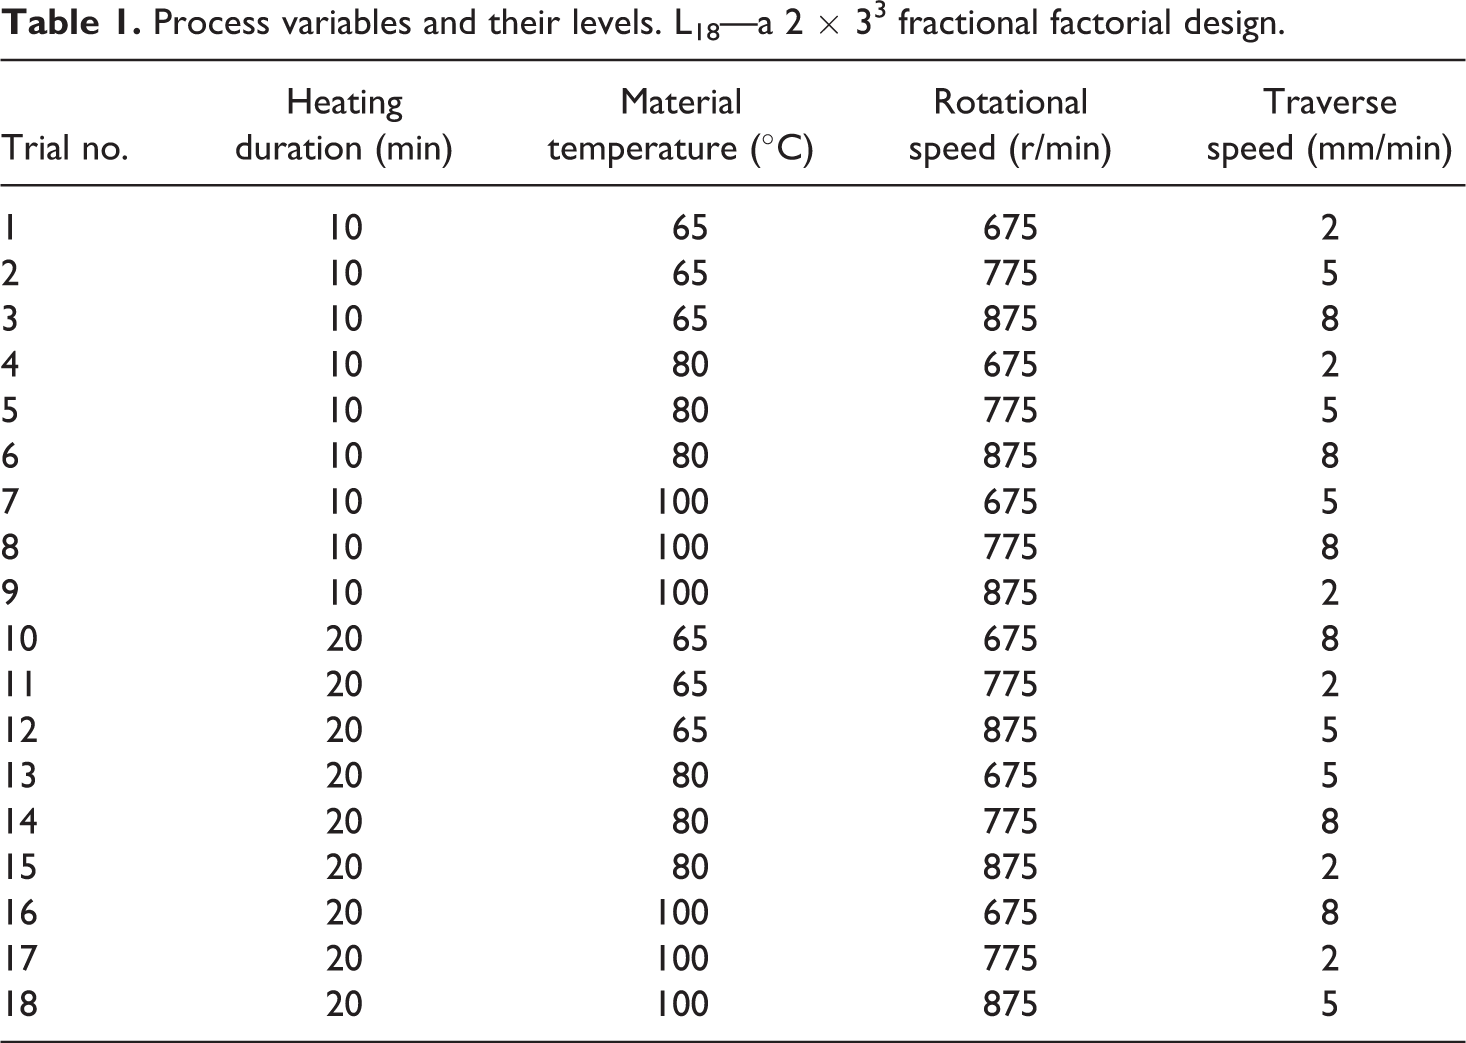
Three different material temperatures (preheating) were taken into account. These were 65°C, 85°C, and 100°C. During initial experiments, good weld was not observed below 65°C or beyond 100°C of preheat temperature. When the material temperature reached a preselected value (65°C or 85°C or 100°C), the duration of heating counted from this point. In this study, heating duration had two levels of variation, which were 10 and 20 min. Both the tool rotational speed and tool traverse speed had three levels of variations. During initial investigation, it was found that a rotational speed lower than 675 r/min was not appropriate to generate sufficient secondary heat to produce quality weld. On the other hand, the rotational speed greater than 875 r/min created as much heat to soften the PPS specimen for which material particle came out of the rotating shoulder. The speed 775 r/min was selected as an average value of the maximum and minimum values. Selection of traverse speeds was based on the visual inspection of the welded specimen. A traverse speed greater than 8 mm/min or smaller than 2 mm/min did not produce any quality weld, but rather produced either a trench or lumpy accumulation of material at the weld line. As usual the traverse speed 5 mm/min was chosen as the average of two extreme values. All the values of these four variables were arranged in an orthogonal array. From this array, it was found that 18 trials had to be performed, which are presented in Table 1.
Process variables and their levels. L18—a 2 × 33 fractional factorial design.
In each welding cycle, two identical pieces of materials were welded. Specimen thickness ranged from 3 mm to 5 mm. A bottom heater preheated these pieces, while welding was performed from the top (Figure 8(a)). Tool penetration was not all the way to the bottom surface. Therefore, an unwelded portion or notch was present in each of the sample (Figure 8(b) and (c)).
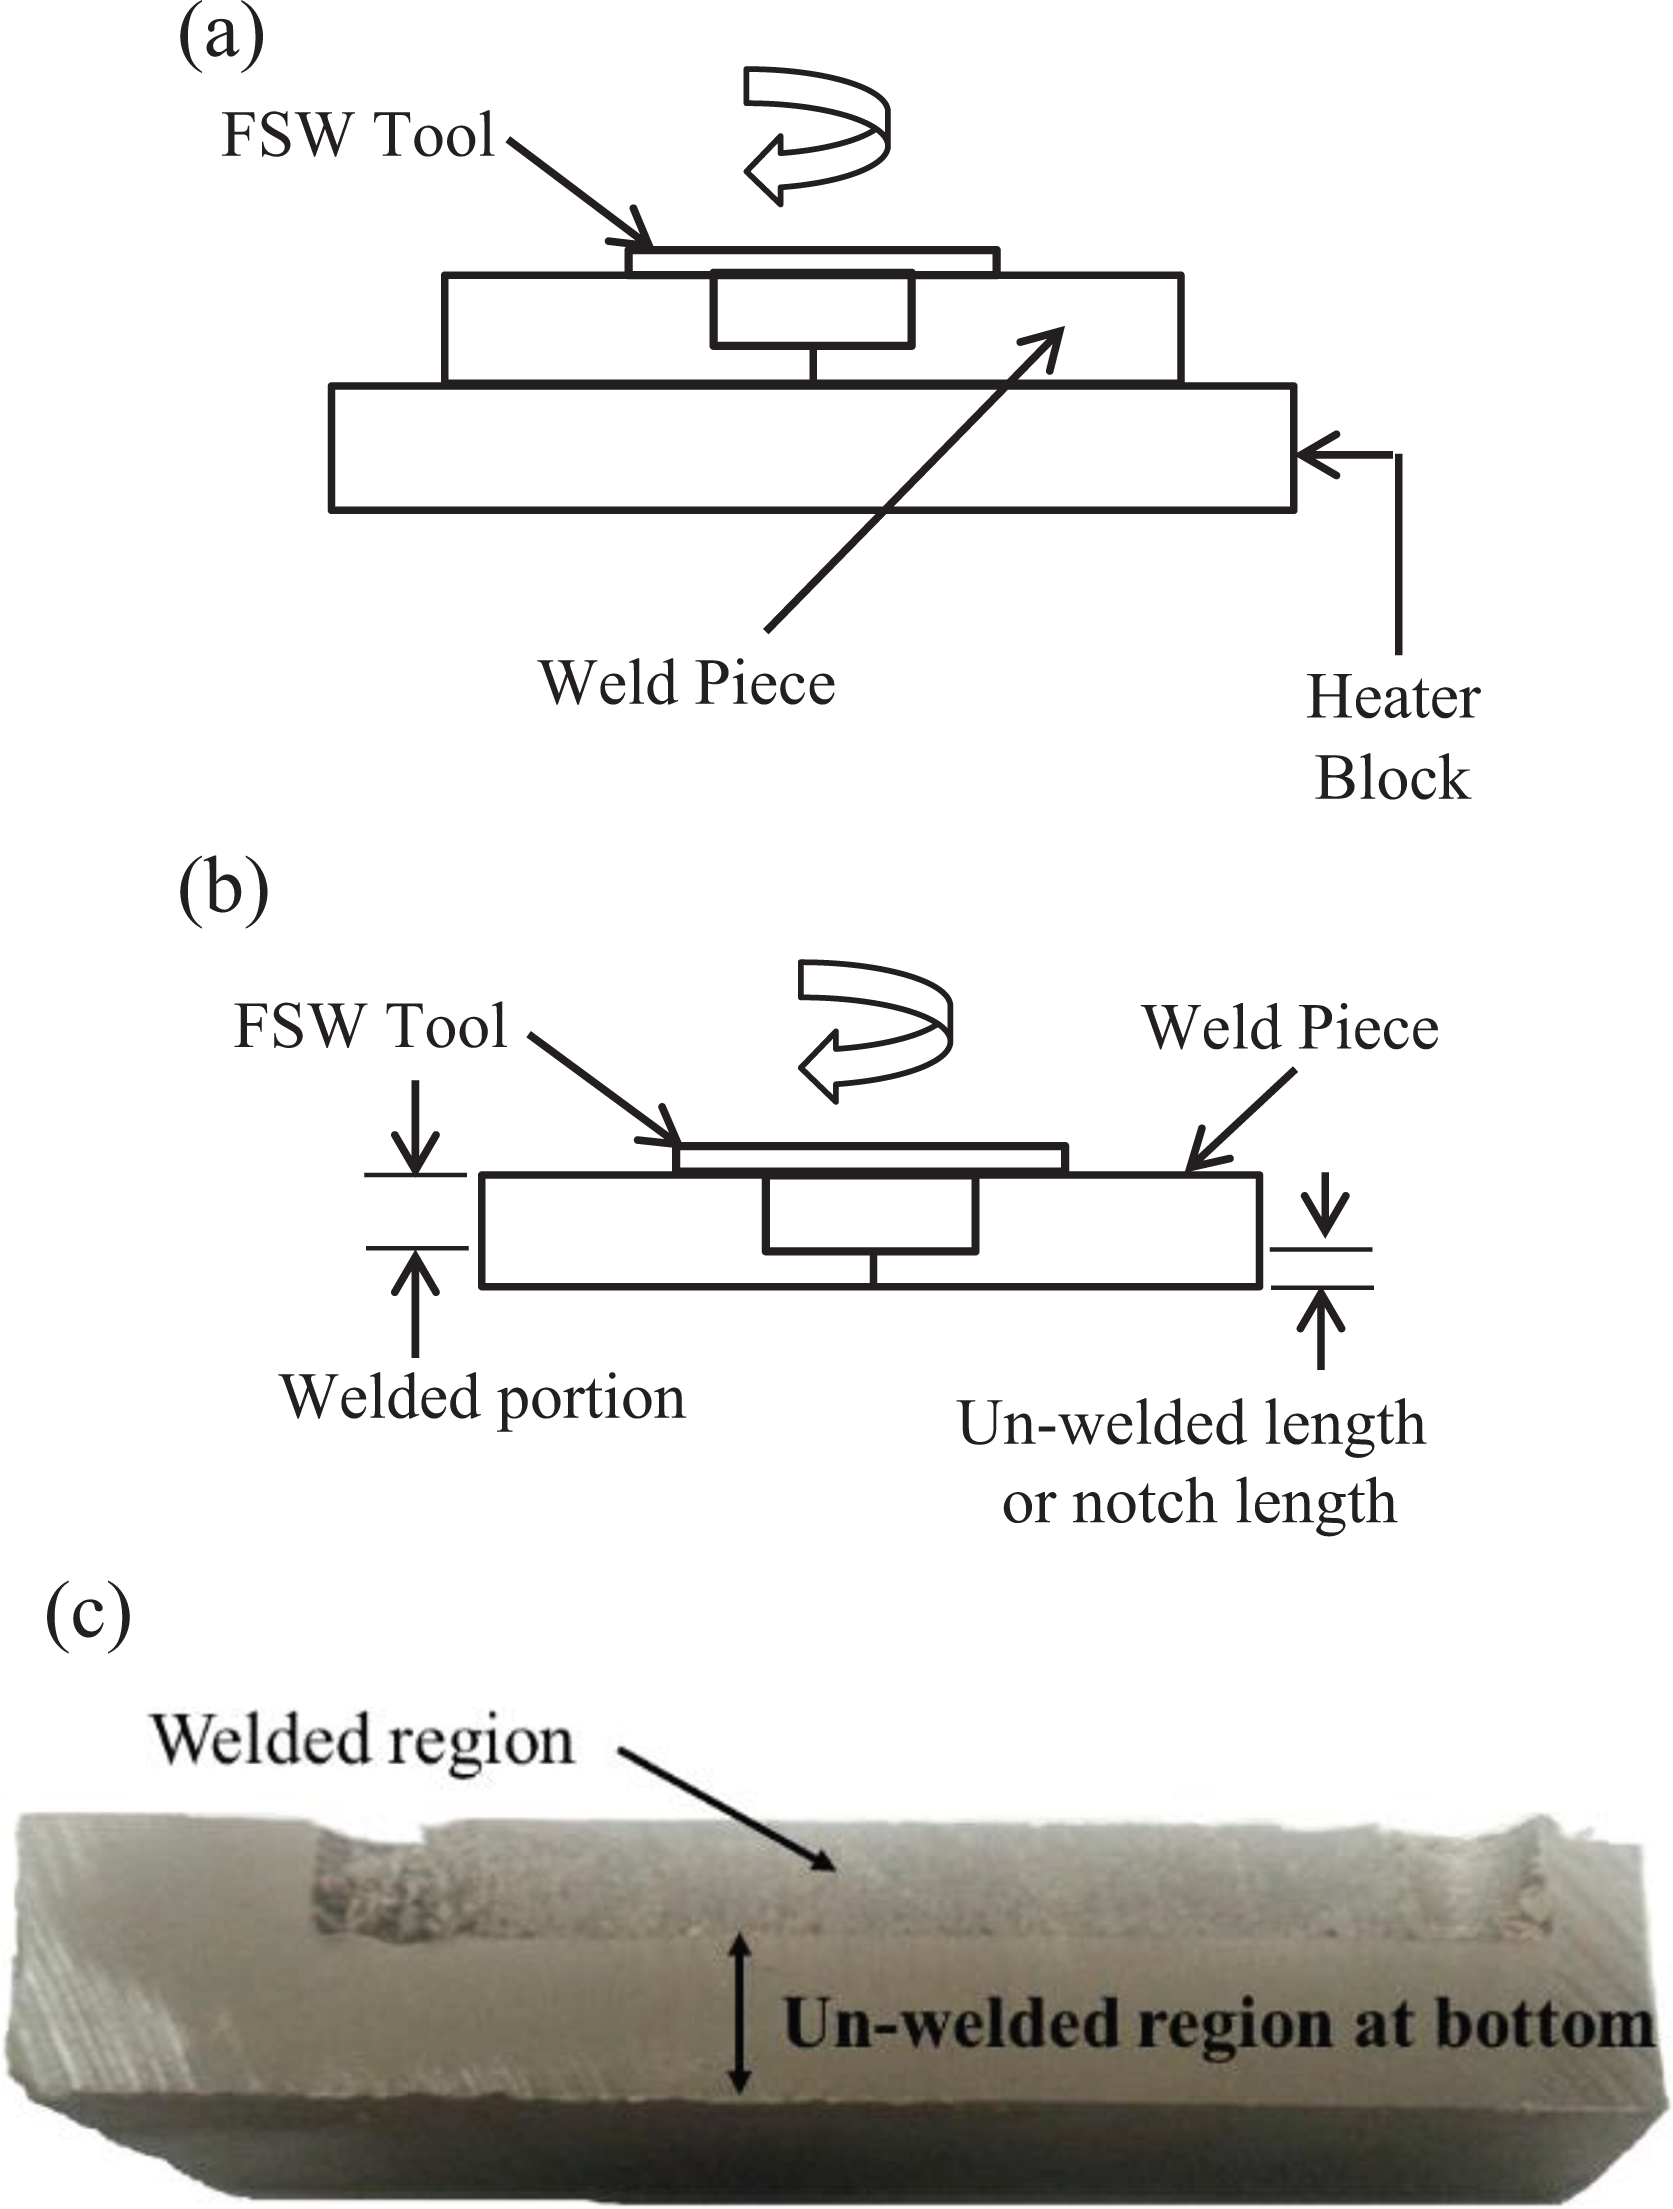
(a) Weld pieces preheated by a bottom heater. (b) Unwelded portion close to the bottom of the weld piece. (c) A specimen cut through the weld line to show the presence of unwelded region.
Results and discussion with PPS
Signal-to-noise ratio
The tensile strengths of welded PPS samples are shown in Table 2 considering the notch length or crack length. These strengths were measured using an MTS machine (MTS Systems Corporations, USA, Model 318.25), where the speed of test was 5 mm/min. The Taguchi method uses the signal-to-noise (S/N) ratio. 31 The last column of Table 2 shows the calculated S/N ratio of the experiments. The term “signal” represents the desirable value (mean) for the output characteristic, and the term “noise” represents the undesirable value for the output characteristic. Therefore, the S/N ratio is the ratio of the mean to the square deviation. Taguchi uses the S/N ratio to measure the quality characteristics deviating from the desired value. The S/N ratio, η, is defined as 32 :
Experimental results for weld strength with different welding parameters considering the unwelded length and calculated S/N ratios.
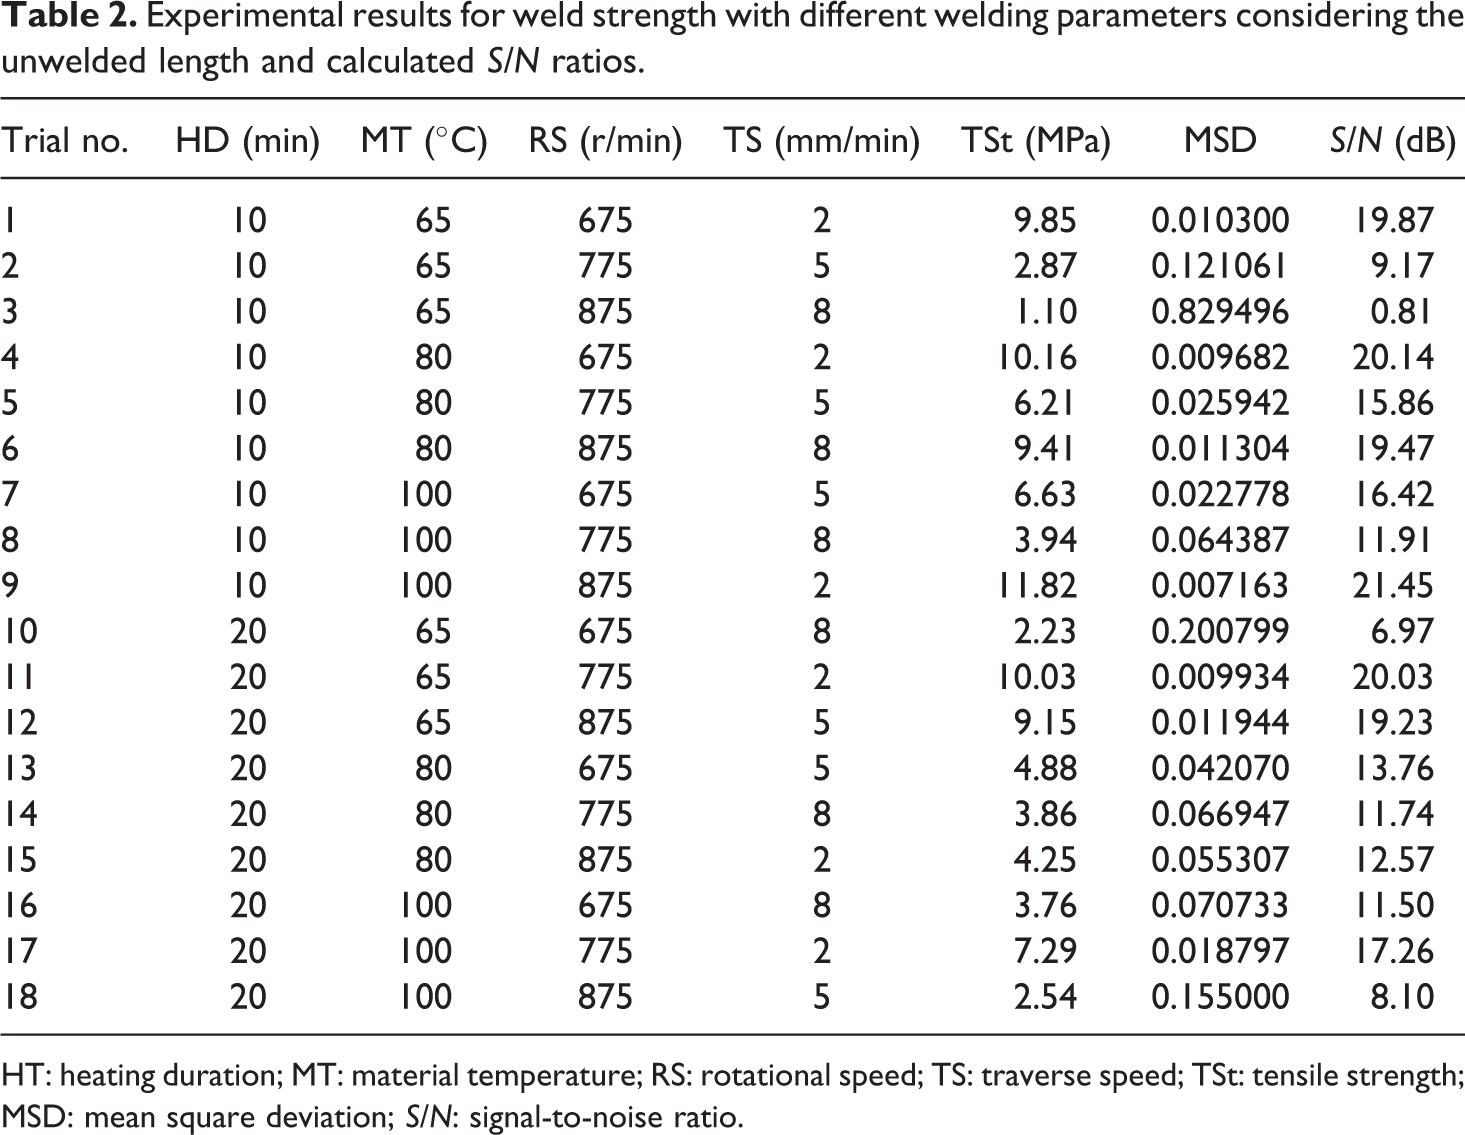
HT: heating duration; MT: material temperature; RS: rotational speed; TS: traverse speed; TSt: tensile strength; MSD: mean square deviation; S/N: signal-to-noise ratio.
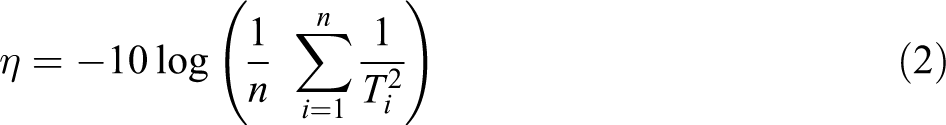
The term inside the logarithm parenthesis is the mean square deviation for the output characteristics. In the study of structural strength, the higher-the-better quality characteristics are considered. 33 In equation (2), n is the number of tests and Ti is the value of weld strength of the ith test. Table 2 shows the experimental results for the weld strength and the corresponding S/N ratios which were calculated using equation (2).
In these tests, 18 different welding parameter combinations were used. Therefore, the effect of each welding parameter on the weld strength cannot be clearly understood from the results in Table 2. The Statistical Package for the Social Sciences software (IBM SPSS Statistics 24) was used to explain the welding parameter effect.
Since the experimental design is orthogonal, it is then possible to identify the effect of each welding parameter at different levels. For example, the mean S/N ratio for material temperature at levels 1, 2, and 3 can be determined by averaging S/N ratios for the experiments set 1 (trial no. 1, 2, 3, 10, 11, 12), set 2 (trial no. 4, 5, 6, 13, 14, 15), and set 3 (trial no. 7, 8, 9, 16, 17, 18), respectively. These results are shown in Table 3. Table 3 also shows the mean S/N ratio for each level of the welding parameters. It can be noted from Table 3 that the largest change of S/N ratio (max–min) was occurred by traverse speed, which was 8.15dB. The total mean S/N ratio of the 18 experiments was calculated as 14.24 dB.
S/N response table.
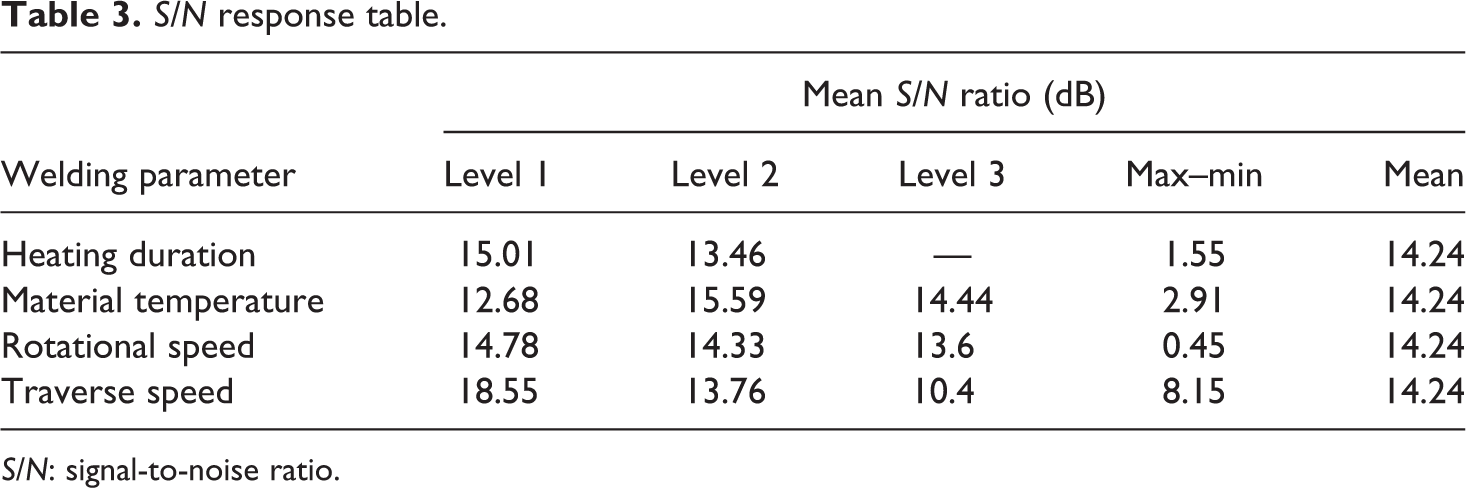
S/N: signal-to-noise ratio.
Analysis of variance
The relative effect of the different welding parameters on the notched tensile strength was acquired by the disintegration of variance, which is known as analysis of variance (ANOVA). The purpose of ANOVA is to understand which variable highly affect the output quality feature statistically.
In Figure 9, the effect of individual welding parameters on the notched weld strength had been identified and the S/N response graph was plotted using the results shown in Table 3. Each graph in Figure 9 shows the level effects of each welding parameter. The dashed line shows the total mean S/N ratio (14.24 dB) of the experiments, and the firm lines are the mean S/N ratio for the corresponding welding parameters. Using the definition of S/N ratio explained above, it can be deduced that the higher the S/N ratio, the higher the strength of the welded joint. For example, the mean S/N ratio decreases from 15.01 dB to 13.46 dB as the heating duration changes from 10 min to 20 min. Therefore, the notched weld strength decreases with an increase of the heating duration. The same trend was found for rotational speed and the traverse speed. However, the spread of these variations was larger for traverse speed compared to other three welding parameters. From Figure 9(d), the difference between maximum and minimum values of the S/N ratio for traverse speed was found to be about 8.15 dB which is the largest for all other level variations.
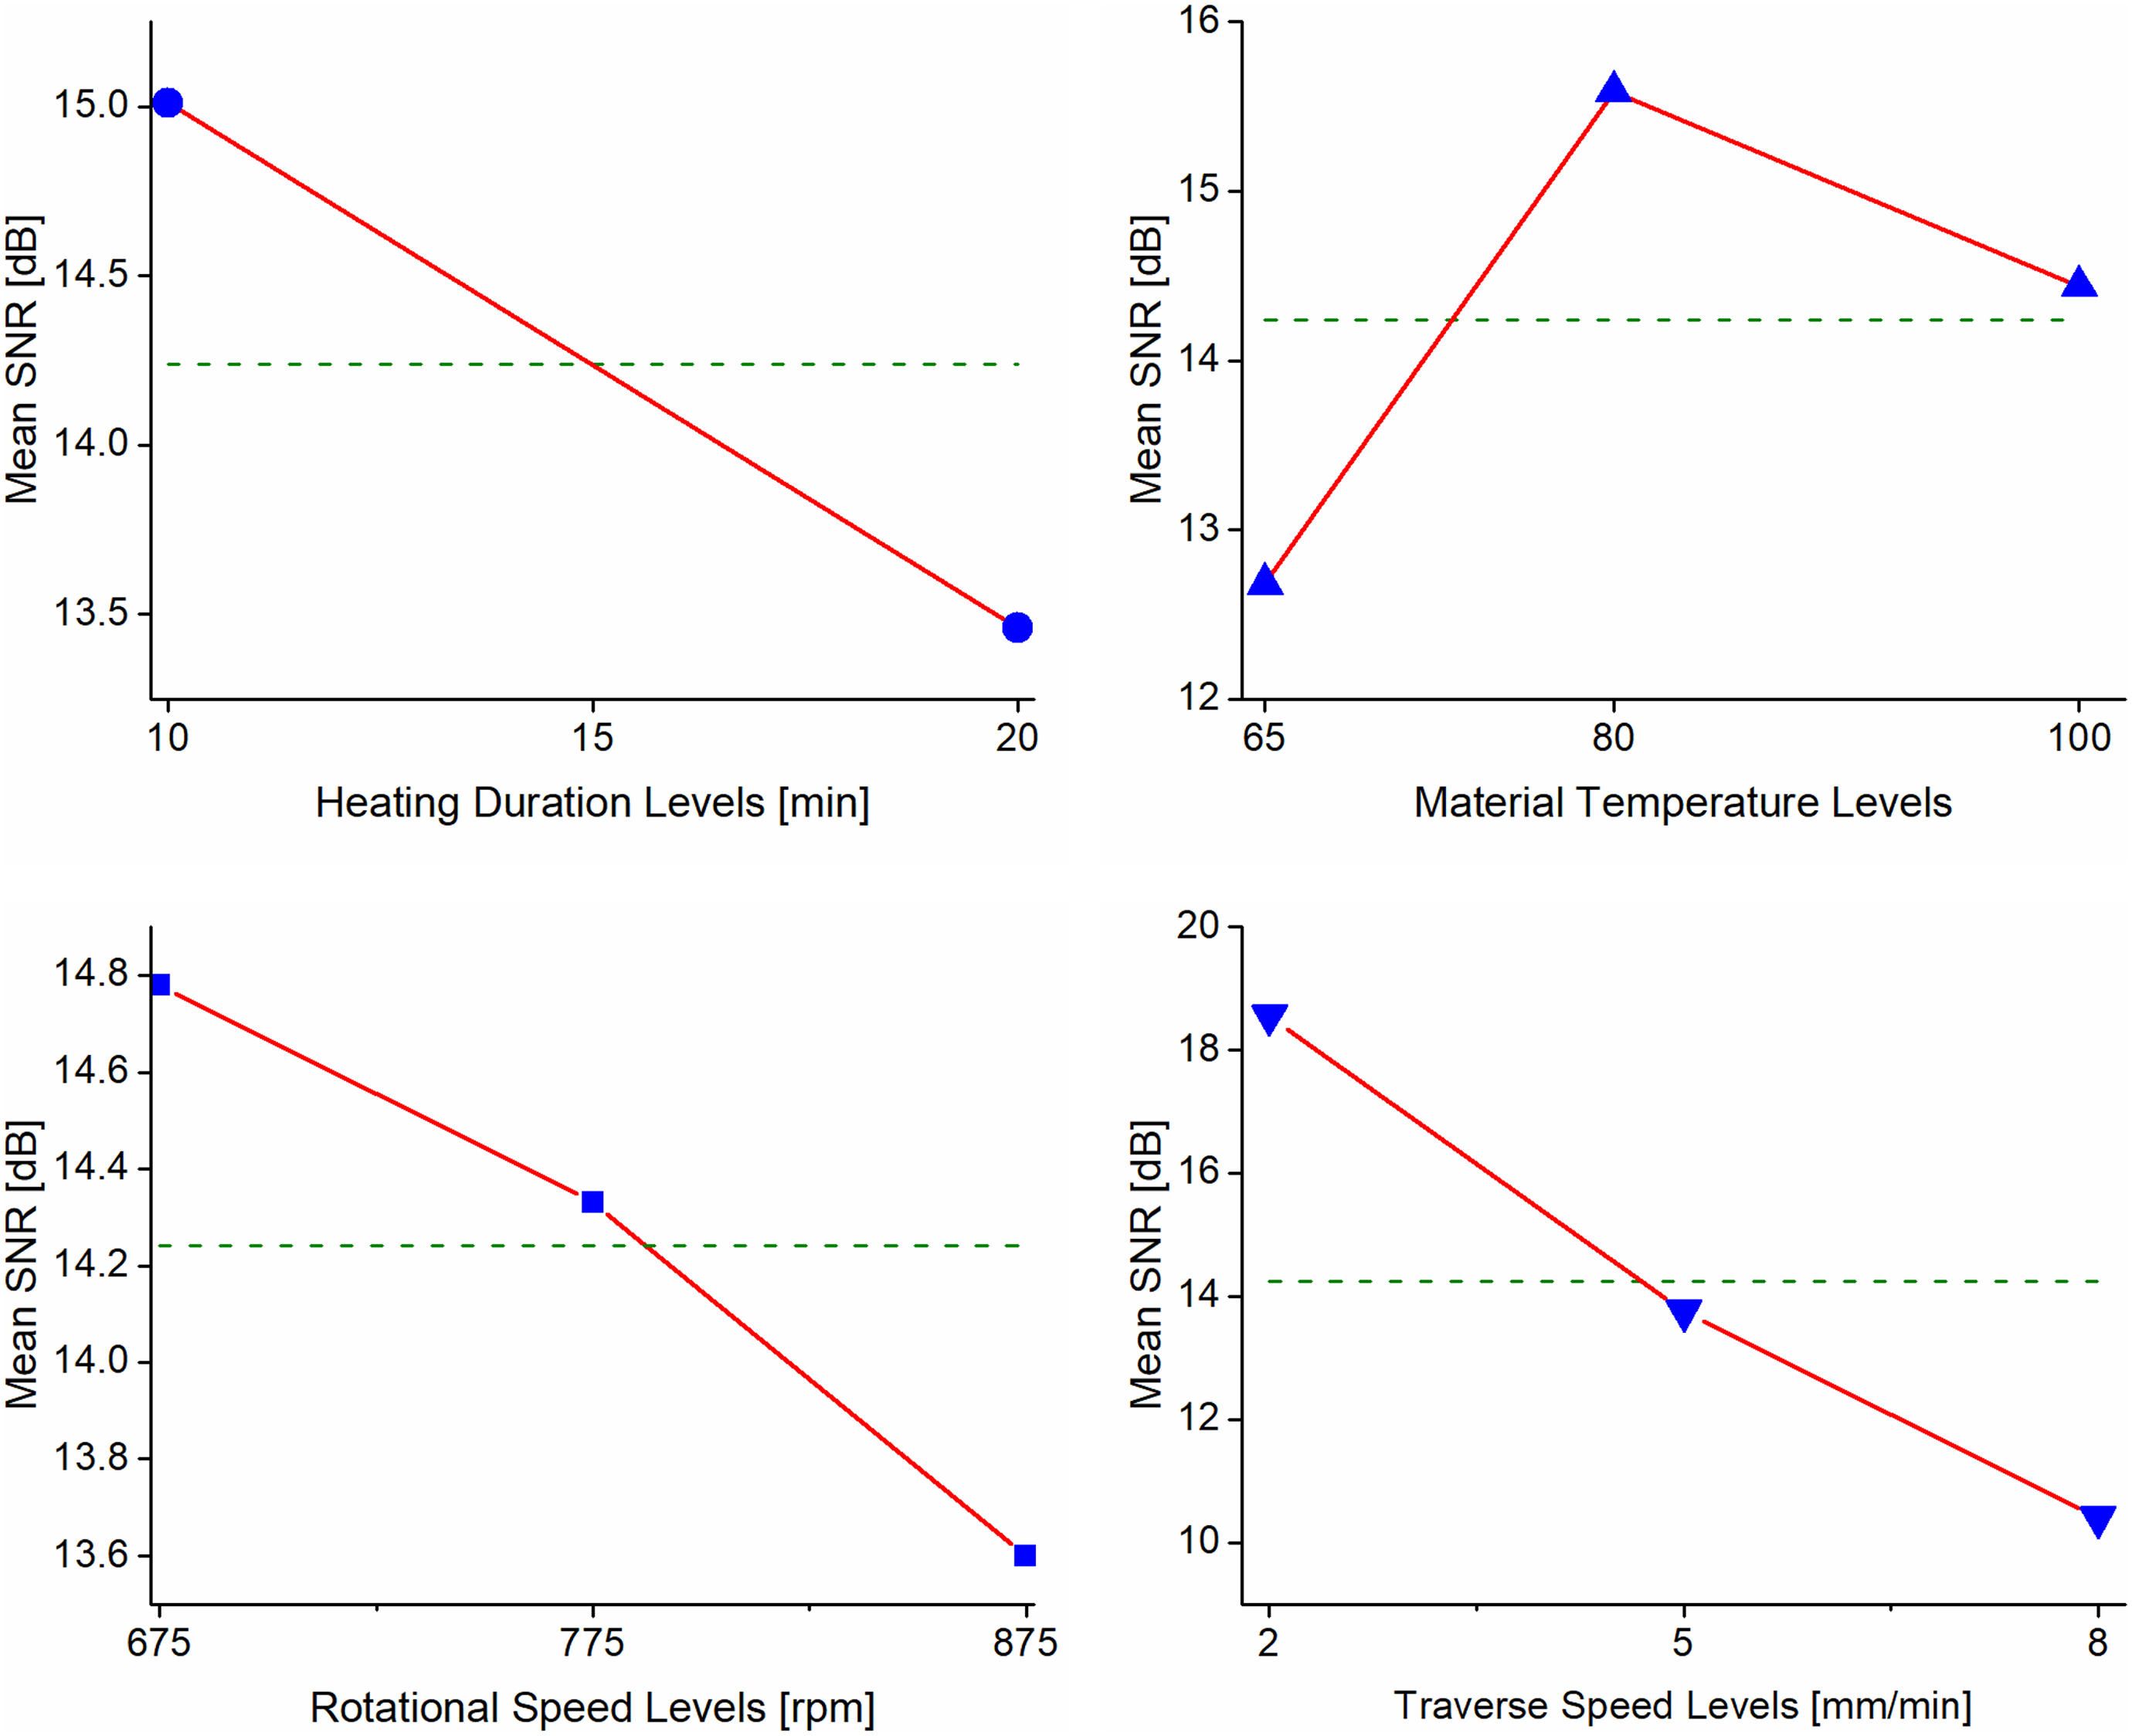
The mean S/N response graph for notched weld strength. S/N: signal-to-noise ratio.
The results of ANOVA for mean notched tensile strength were calculated, and it is shown in Table 4.
ANOVA table.
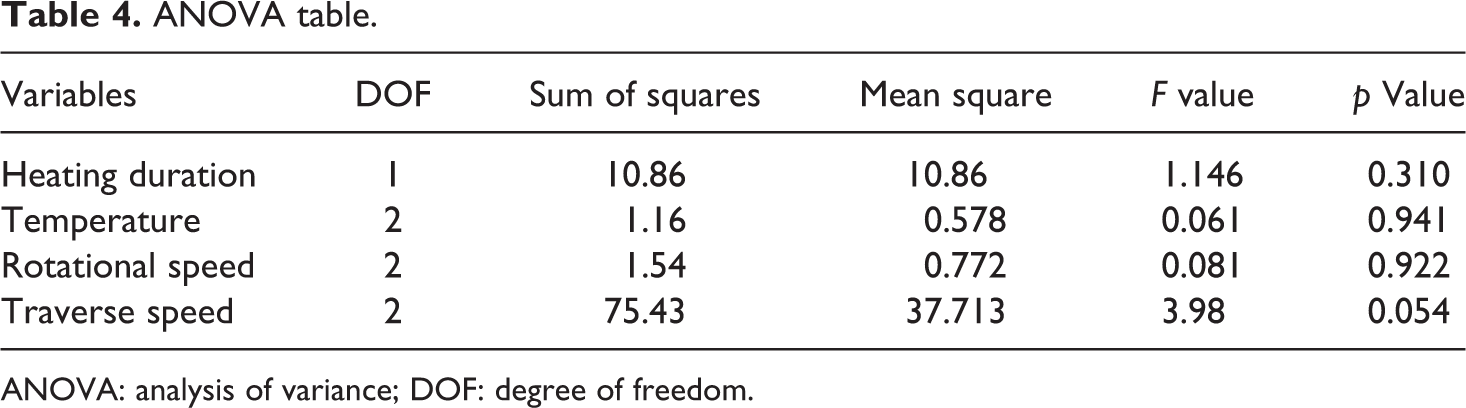
ANOVA: analysis of variance; DOF: degree of freedom.
Statistically, the F value and p value were calculated to study the importance of the welding parameters. Larger F value exhibits that the variations of the welding parameters produce a significant change in the notched strength. On the other hand, a p value less than 0.05 or 5% is used to make an experiment process statistically significant. In this experiment, the F value 3.98 indicates that the transverse speed has significant effect on the notched tensile strength of PPS butt joints for this range of inputs. The p value of 0.054 for transverse speed indicates that 5.4 failures out of 100 trials are expected to occur due to a chance.
Influence of unwelded segment
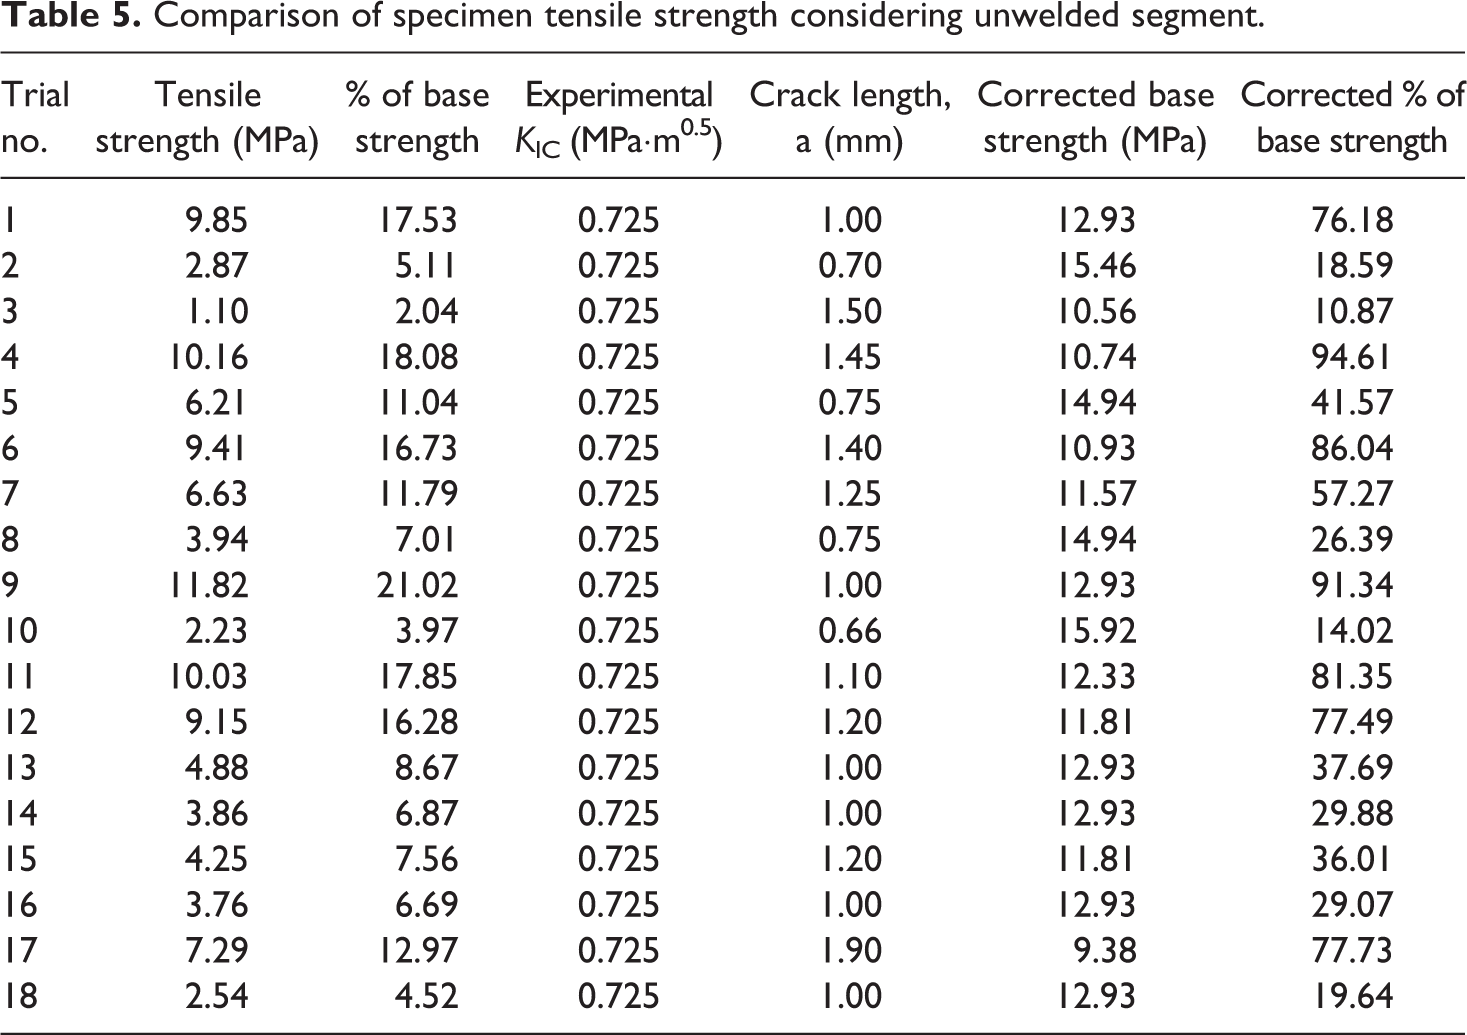
In this study, the ultimate tensile strength of welded samples was compared to the ultimate tensile strength of the base material. Using ASTM D638 standard, the tensile strength of PPS samples was found as 56.22 MPa. As shown in Table 5, the tensile test results exhibited that the friction stir welded PPS sheets obtained a maximum tensile strength of 21% of base material. However, it is important to analyze the effect of unwelded part on the tensile test procedure. This unwelded portion acts as an edge crack or notch during the tensile test as shown in Figure 10.
Comparison of specimen tensile strength considering unwelded segment.
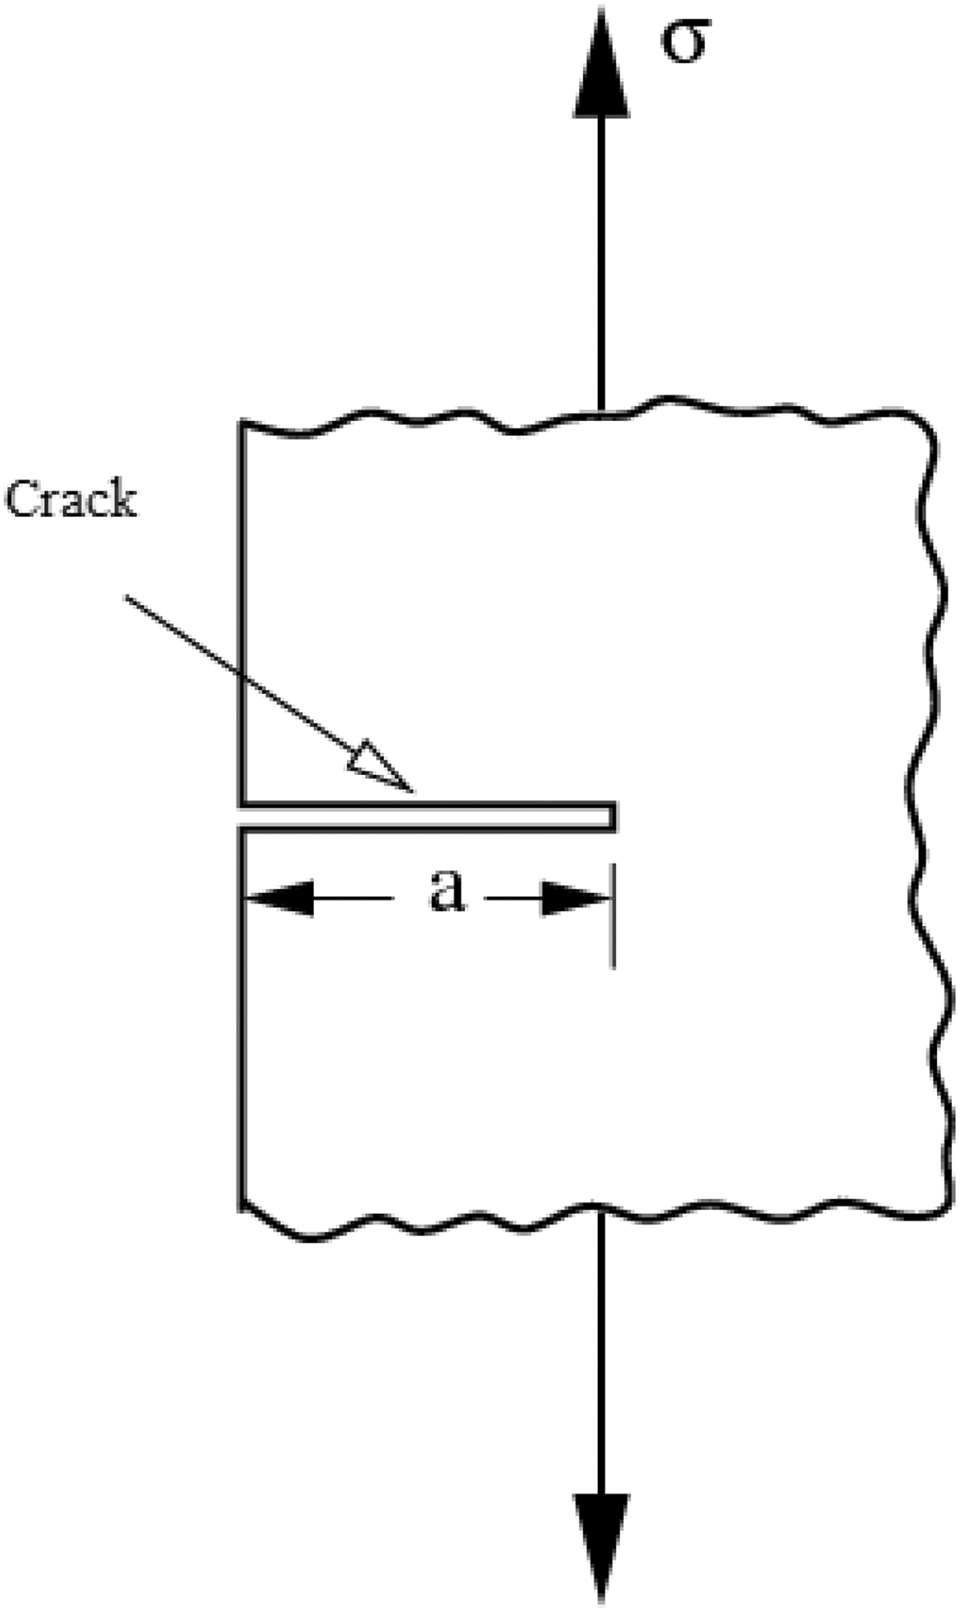
Influence of crack or unwelded section during tensile test.
Considering plain stress condition, tensile strength and critical fracture toughness can be described as 34

where, KIC = critical fracture toughness; σ = tensile strength; and a = crack length.
Using ASTM E399 standard, three identical compact test specimens were prepared according to the specified dimensions. Figure 11 shows one of these specimens.
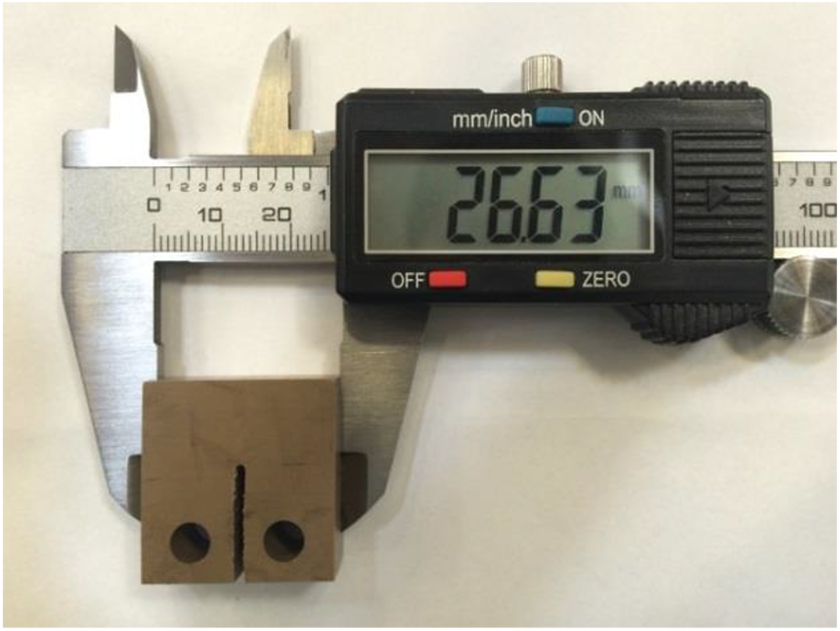
Compact test specimen.
After averaging three values of fracture toughness of PPS, the final value was found as 0.725 MPa·m0.5. At this point, all the welded samples were inspected using a digital optical microscope, and the notch lengths or unwelded lengths were determined. Using the fracture toughness and the crack length values, notched tensile strength of the unnotched PPS samples was calculated according to equation (3). These strengths are named as “Corrected Base Strength.” Then the notched tensile strength of the welded samples determined experimentally was compared with the calculated notched tensile strength. Table 5 shows the final output.
It is notable that trial no. 4 and 9 yielded more than 90% strength of base material. Although the crack length plays a vital role in determining the tensile strength, careful measurements of crack length could minimize the error involved in this process.
Effect of stationary shoulder arrangement
A stationary shoulder arrangement as described in experimental setup 2 was used to weld PPS sample. When compared to the rotating shoulder, friction between the stationary shoulder and the specimen was reduced. According to the theoretical analysis performed in the second section, an initial material temperature higher than the rotating shoulder was determined to compensate for the stationary shoulder effect. In total, two specimens were welded and tested under tensile loading condition. The welding parameters in this case were as follows: Material temperature: 80°C Heating duration: 10 min Rotational speed: 675 r/min Traverse speed: 2 mm/min
It was found from this experiment that the top surface finishing of the joints was smooth, and the tensile strength increment of the joints was significant. Figure 12 shows one of the specimens welded with the stationary shoulder. Table 6 shows the notched tensile strengths of these specimens.
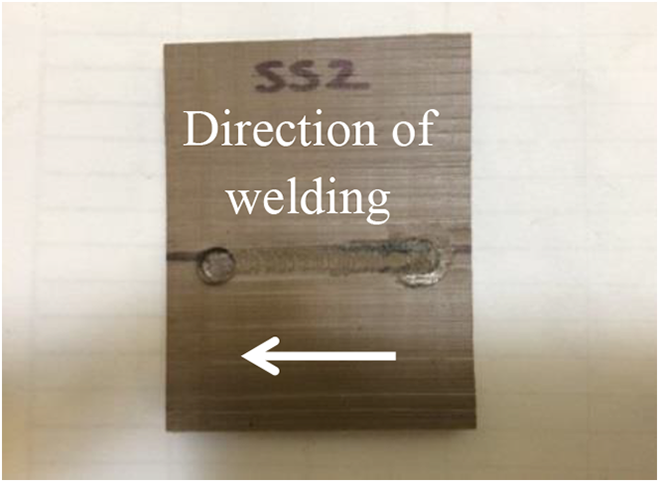
Specimen made using stationary shoulder.
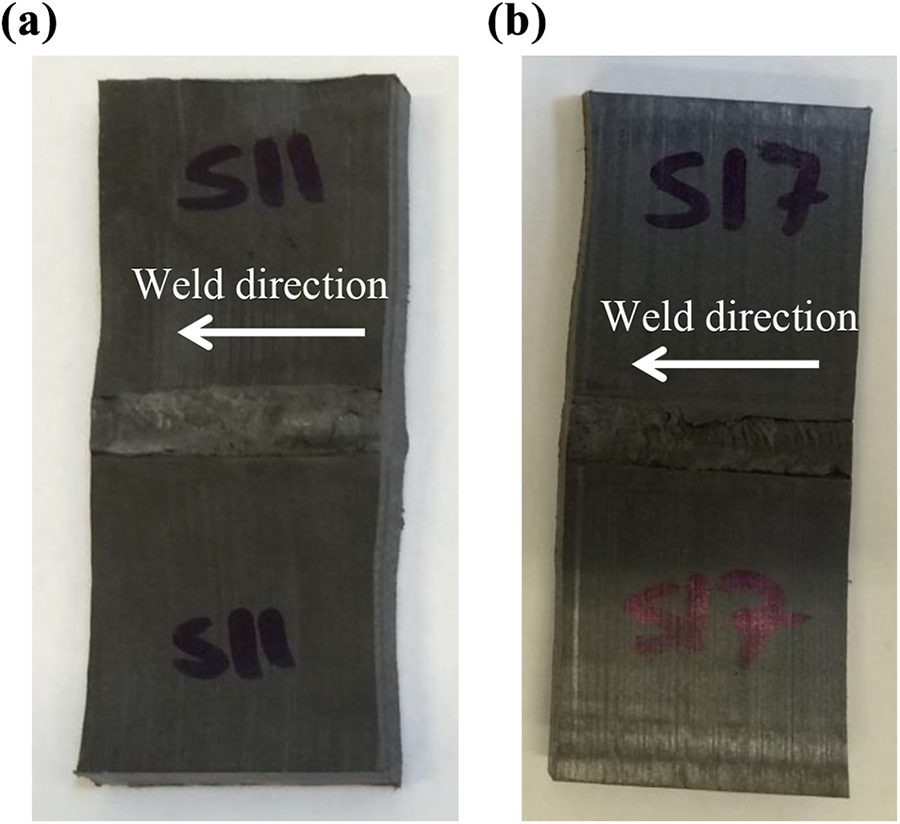
Snapshot of welded PEEK samples with welding parameters: (a) 900 r/min and 50 mm/min, (b) 1000 r/min and 75 mm/min. PEEK: polyetheretherketone.
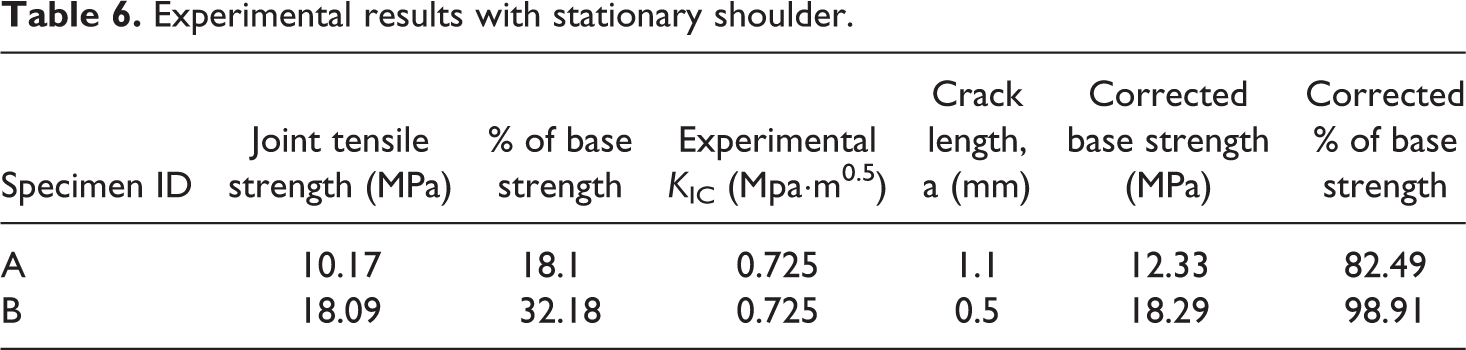
Experimental results with stationary shoulder.
Results and discussion with PEEK
Experimental method
In this study, randomly oriented short carbon fiber (CF)-reinforced PEEK (Advanced PEEK Composite [APC]) sheets were used for butt joining. The glass transition temperature (Tg) and the melting point (Tm) of PEEK are 146°C and 350°C, respectively. In these experiments, material temperature, tool rotational speed, and tool traverse speed were regarded as influential variables. Instead of a rotating shoulder, a stationary tool shoulder was utilized during the welding phase. Before starting the actual welding, all the specimens were preheated from their bottom surface. Dimensions of the test specimen were the same as the PPS test specimen as shown in Figure 7.
Experimental design
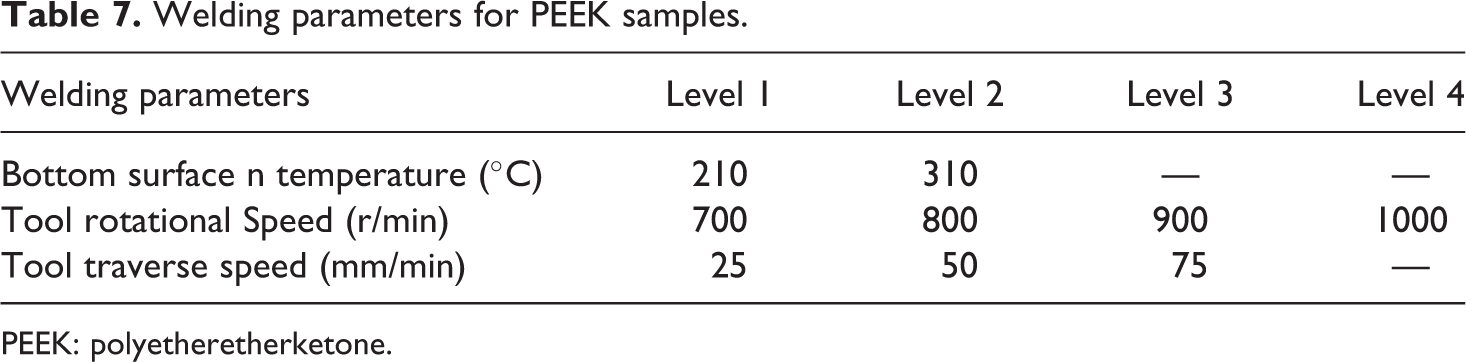
Material bottom surface temperature was fixed at 310°C. Beyond this temperature, melting of PEEK resin was observed. Quality of welded joint below 200°C was poor. Specimen thickness ranged from 3.8 mm to 5.1 mm. In all trials, heating duration was maintained around 10 min after stabilization of bottom surface temperature. Depending on the thickness, material top surface temperature was ranged from 195°C to 225°C. Parameters such as tool rotational speed and tool traverse speed were also varied in such a way that produced smooth weld surfaces as shown in Figure 13. Table 7 provides all the welding parameters with their variations.
Welding parameters for PEEK samples.
PEEK: polyetheretherketone.
Discussion
Surface morphology
Microstructures of PEEK samples
In case of CF-reinforced PEEK, microstructures of the welded samples and the base material were compared using digital optical microscope and scanning acoustic microscope (SAM). The optical microscope was adjusted to get a 1000× magnification. Welding parameters of the test specimen for which the micrographs were prepared were as follows: Material bottom surface temperature: 210°C Tool rotational speed: 800 r/min Tool traverse speed: 25 mm/min
Figure 14(a) and (b) shows a welded specimen and a base material using the optical microscope. In these two images, CFs are seen randomly oriented in PEEK resin. Figure 14(c) and (d) shows the images using SAM. In these two images, black spots are voids, which do not reflect sound waves. Solid bright lines are the mixture of CFs and PEEK resin that reflects sound waves that are orthogonal to the upper surface of the samples.
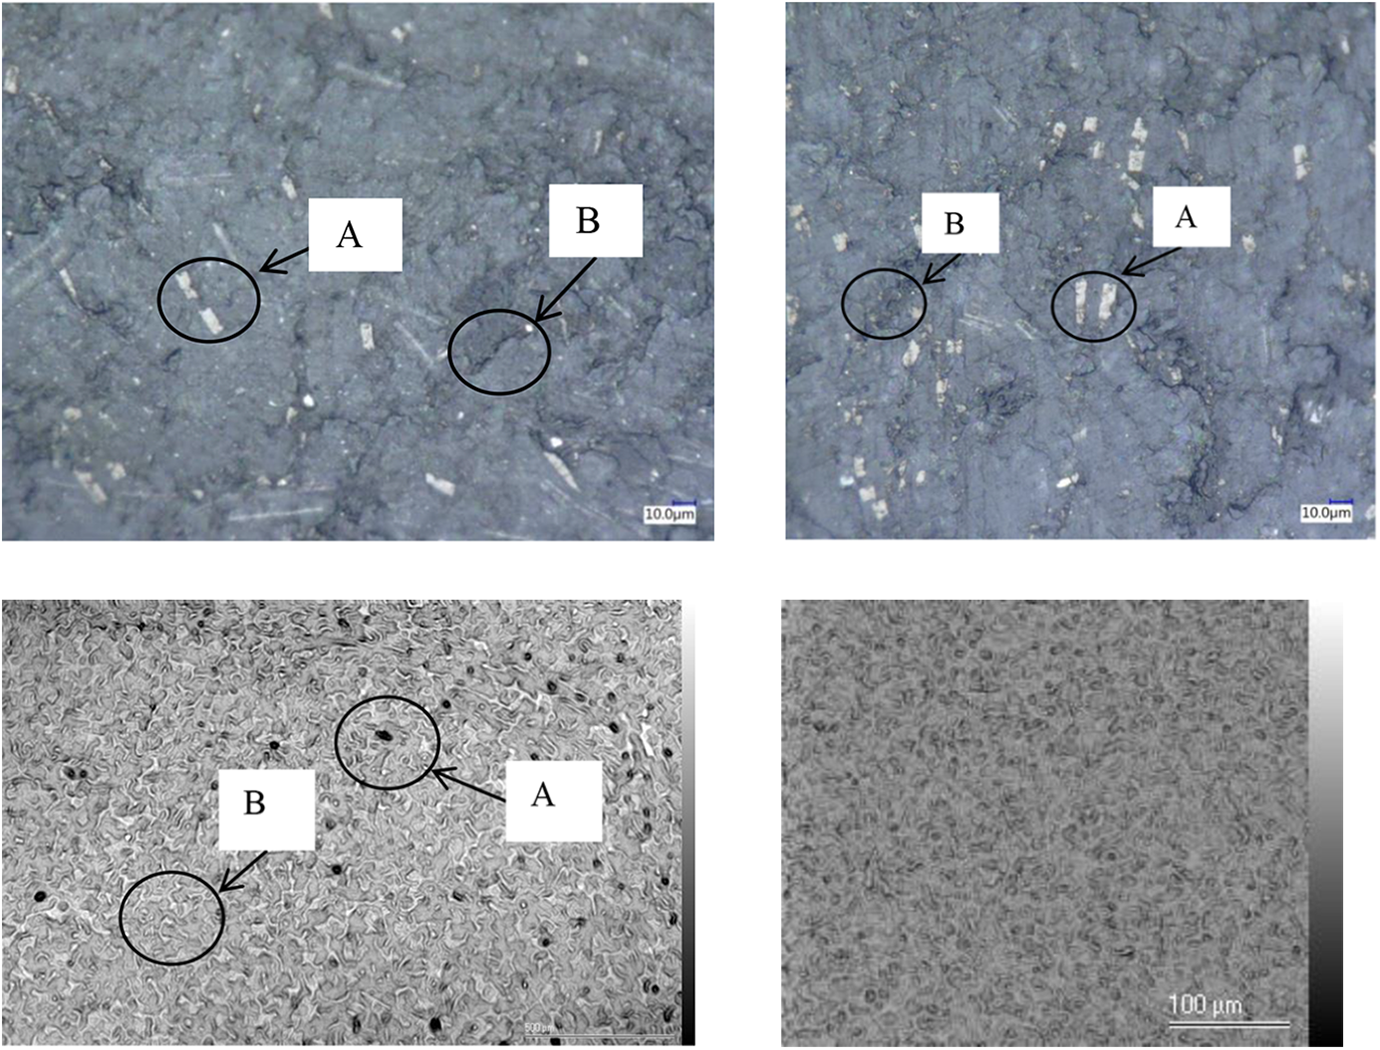
(a) Zoom 1000×. Location—base material away from weld zone. CFs seem white (A) embedded in PEEK matrix. They are randomly oriented. Cracks (B) are also visible. (b) Zoom 1000×. Location—at the weld zone. CFs seem white (A) embedded in PEEK matrix. They are randomly oriented. More cracks (B) are visible. (c) Location—at the weld line. Black spots, (A) are voids on the surface PEEK resin. Uniformly distributed harder parts (B) are seen clearly. (d) Location—CF PEEK base material away from the weld line. It has uniform texture and less voids. CF: carbon fiber; PEEK: polyetheretherketone.
It is seen from the micrograph that the welded section of the specimen has uniform distribution of PEEK resin and CFs with some voids and microcracks. These microcracks resulted in lower tensile strength than the base material.
Tensile test
Tensile test results are shown in Table 8. Using ASTM 638D standard, the unnotched tensile strength of unwelded PEEK specimen was found to be 116 MPa. It is notable from Table 8 that the traverse speeds were much higher than that of PPS samples as PEEK samples are more ductile in nature.
Notched tensile test results with varying welding parameters.
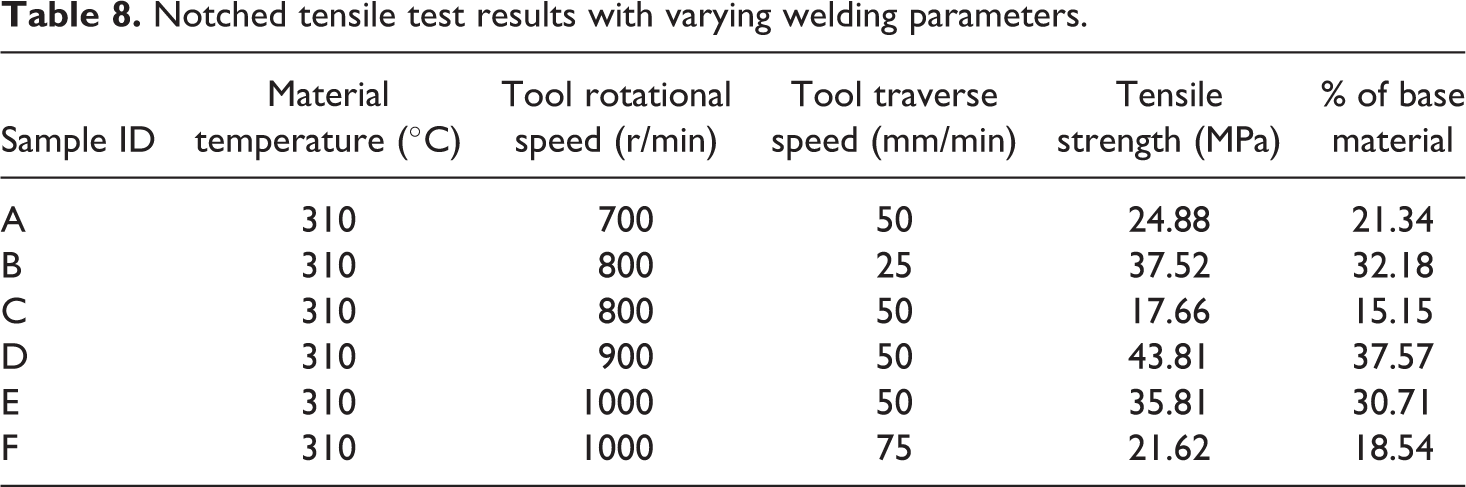
In these experiments, the length of unwelded section was kept as minimum as possible by adjusting the tool length equal to test specimen thickness. However, significant void lines appeared in specimens C and F. During tensile test procedure, it was found that these void lines resulted into crack initiation, and failure occurred along these lines. Figure 15 shows the void line along where specimen C failed. In general, microcracks which were determined from micrographs resulted in lower tensile strength of the welded samples than the base material.
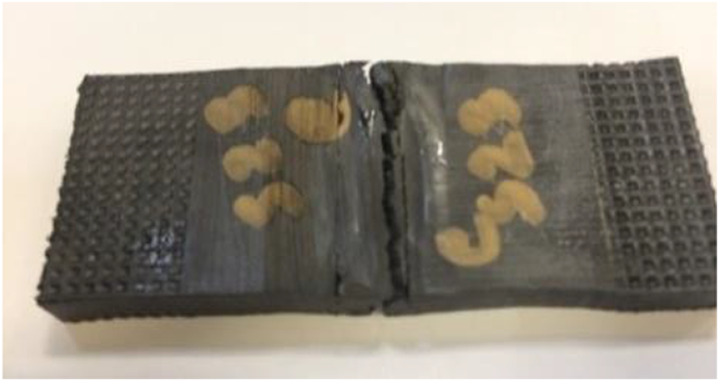
Generation of void lines and crack initiation.
Effect of unwelded segment
As shown in Figure 11, three identical test specimens of CF PEEK were prepared. As per ASTM E399 standard, KIC of CF PEEK was determined as 1.17 MPa·m0.5. Using optical microscope, lengths of the unwelded segment of each welded specimen were determined. At this point, using equation (3), base tensile strength corresponding to each test sample was calculated. Final results are shown in Table 9.
Influence of unwelded length or notch length on the tensile strength.
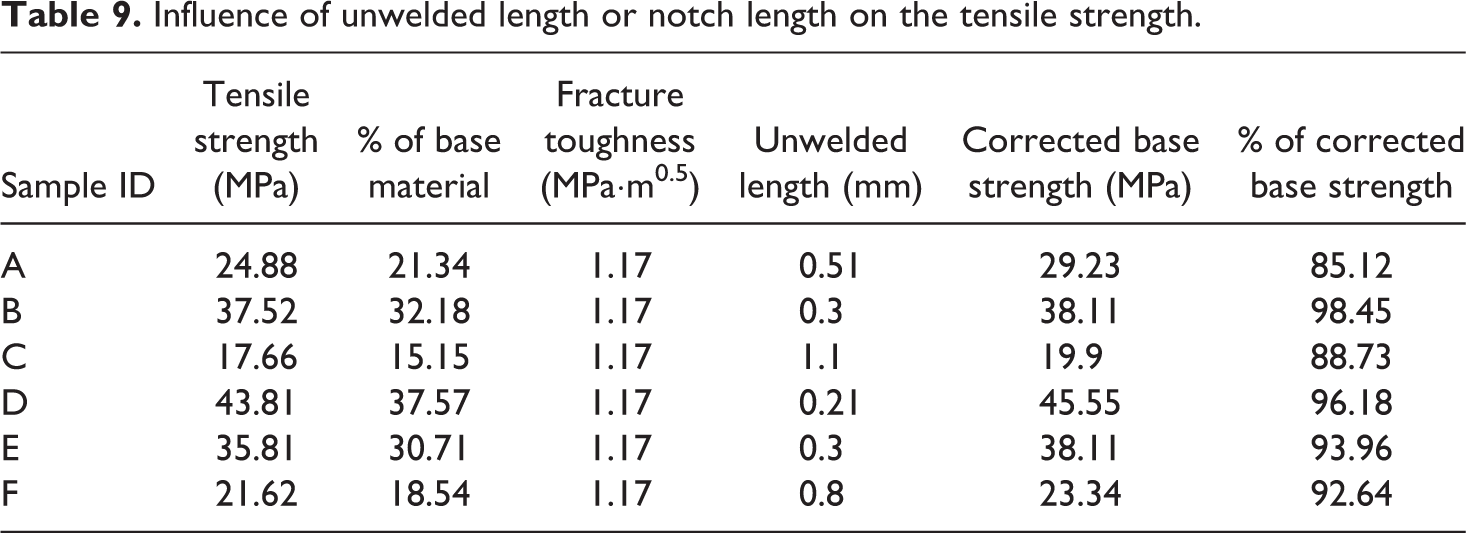
It can be seen from Table 9 that the corrected base strength largely depends on the unwelded length. While sample D has the largest corrected base strength, the ratio of the actual tensile strength of sample D to its corrected base strength is the second largest. On the other hand, sample B has the second largest actual tensile strength while the ratio of the actual tensile strength of sample B to its corrected base strength is the largest of all other samples. Therefore, careful measurement of unwelded segments is an important aspect of this process.
Conclusion
Preliminary FSW process development work has been done for two thermoplastic materials—unreinforced PPS and short CF-reinforced PEEK. Based on the analytical models for the heat generation in FSW process and experimental results, it was found that only tool rotational speed was not sufficient to produce enough heat to weld these two thermoplastic materials. This led to the addition of external heat sources in the welding process. Thus, the theoretical equations discussed in this article pointed out the qualitative requirement of external heat source. It has been established quantitatively that the welding temperature cannot be achieved without adding this external heat source. Therefore, a strip heater was placed at the bottom of two identical weld pieces. During the course of experiments, heating intensity was varied. Other process parameters such as tool rotational speed and tool transverse speed were also varied in addition to material temperature. Using Taguchi’s design of experiment method, output characteristic of FSW process such as tensile strength was evaluated for PPS. It was found that increasing tool traverse speed lowers the notched tensile strength of PPS joint.
Short CF-reinforced PEEK samples were welded with a higher traverse speed compared to the PPS sample. In this study, a joint strength of 43.8 MPa was achieved with a traverse speed of 50 mm/min. Additionally, the fracture toughness tests were performed for both PPS and PEEK samples to observe the influence of unwelded segments in the welded parts. It was found that the presence of unwelded lengths significantly influence its unnotched tensile strength.
Next steps
Further research on FSW of unreinforced PPS and reinforced PEEK should focus on (1) determination of friction coefficients and contact pressure, (2) optimization of process parameters to maximize the weld strength on the basis of contact pressure, and (3) application of optimized process parameters to get other types of joint such as corner joint and ‘T’ joint. A large extent of work can be emphasized on the heat generation process. In addition to resistance type surface heater, feasibility of using induction heating and infrared heating can be studied.
Footnotes
Acknowledgements
The authors are grateful to Dr Sourav Banerjee, Department of Mechanical Engineering, for letting them to use his lab resources and Mr Akhtar Hossain, Department of Biostatistics, University of South Carolina, for his guidance to statistical analysis.
Funding
The author(s) received no financial support for the research, authorship, and/or publication of this article.